T.L.L. Temple Foundation’s

SOUTHEAST
UPDATE MAY 2024
TEXAS ECONOMIC AND LABOR MARKET
SOUTHEAST TEXAS ECONOMIC AND LABOR MARKET UPDATE II
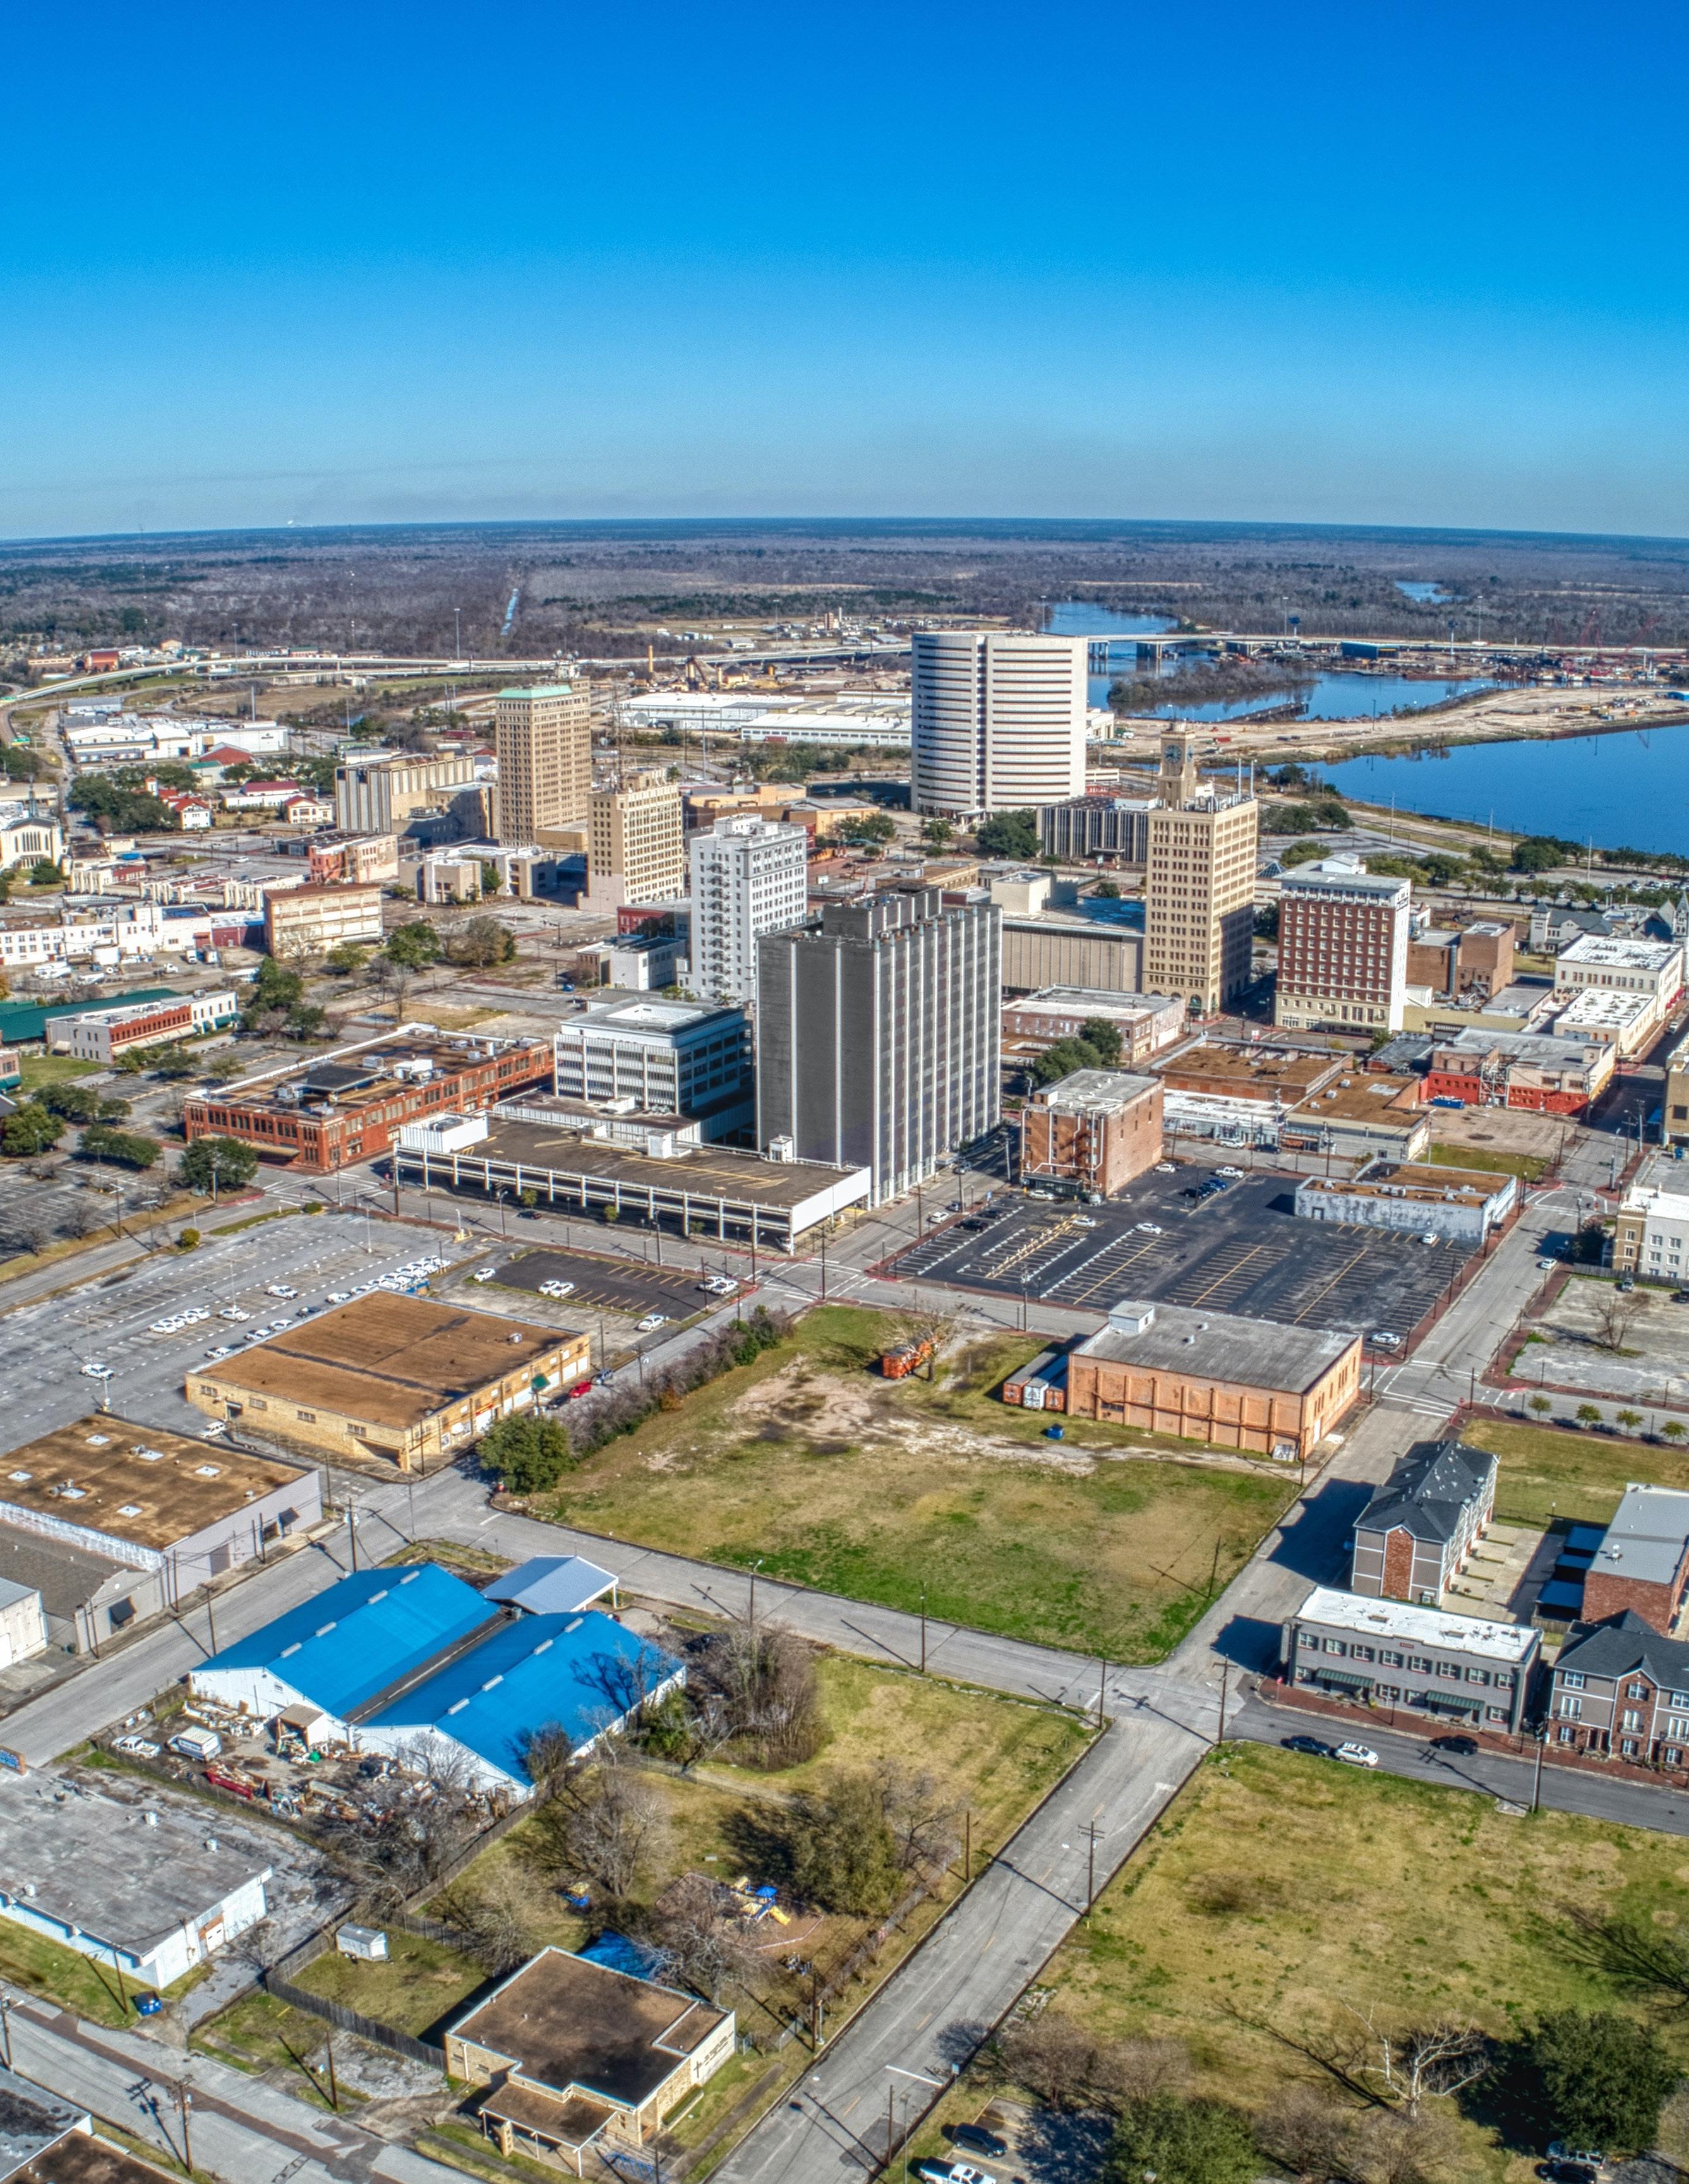
Image via Adobe Stock.

SUMMARY OF FINDINGS
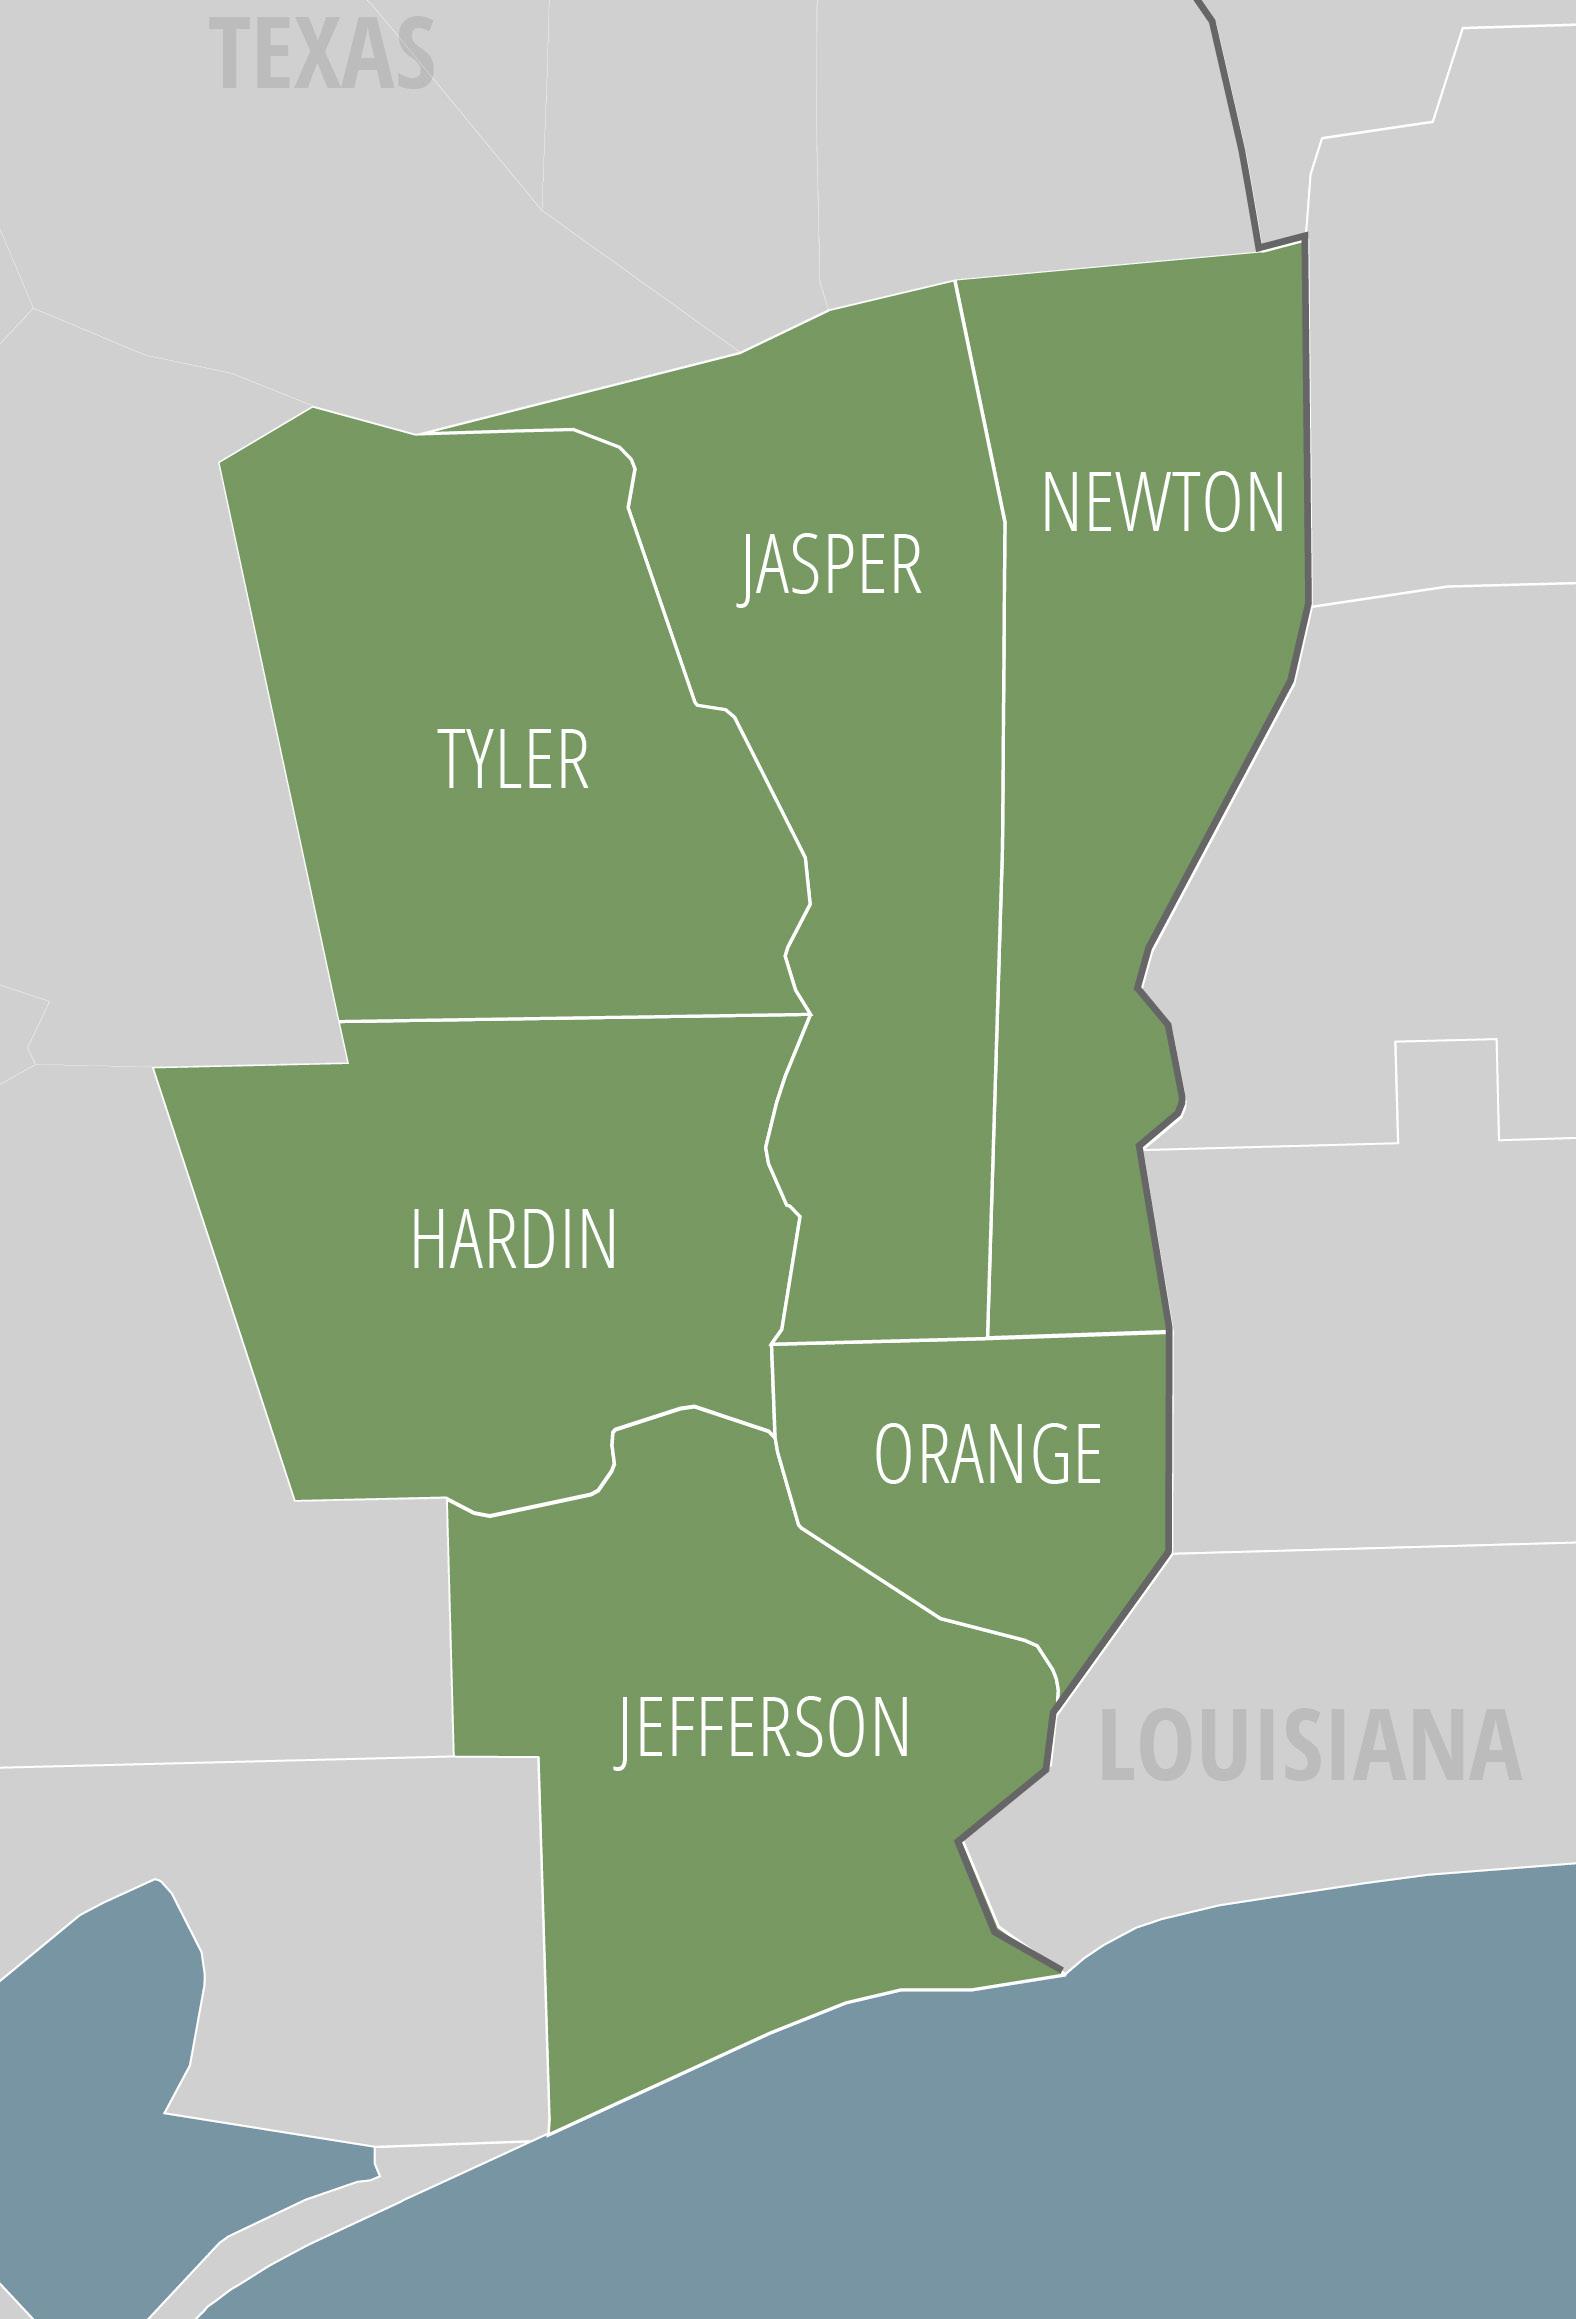
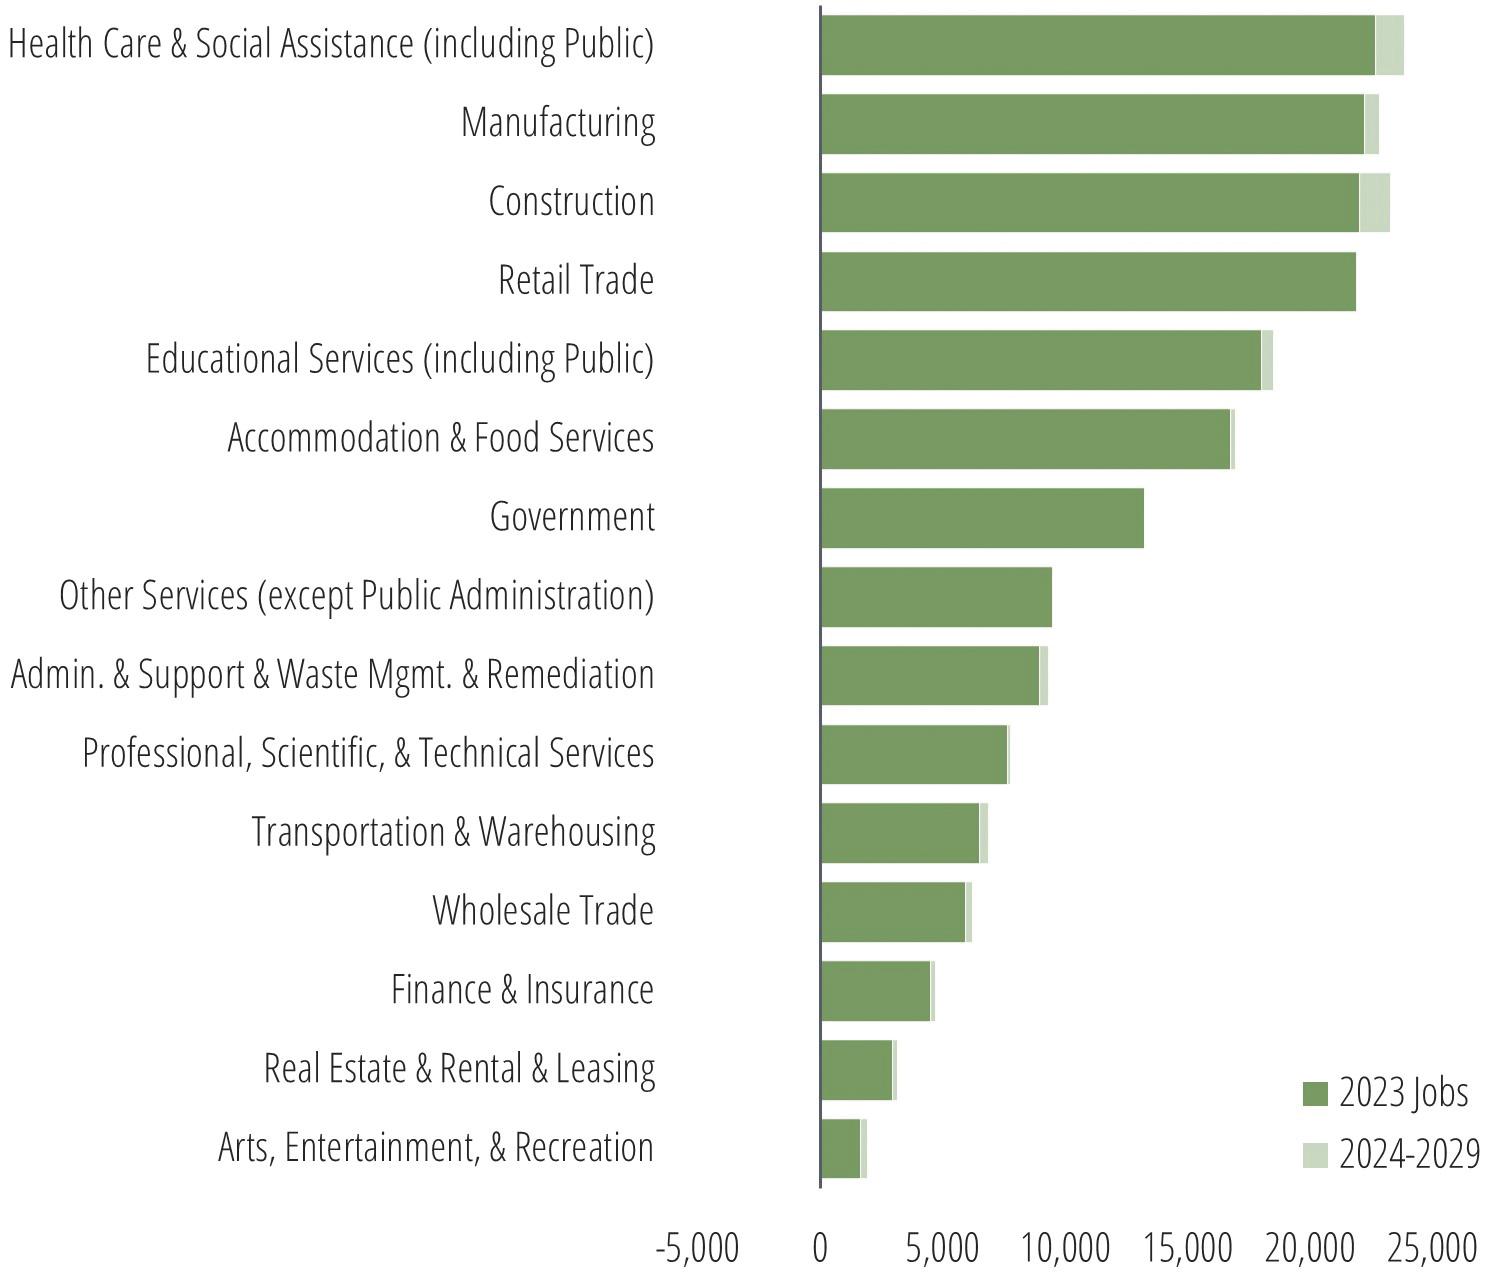
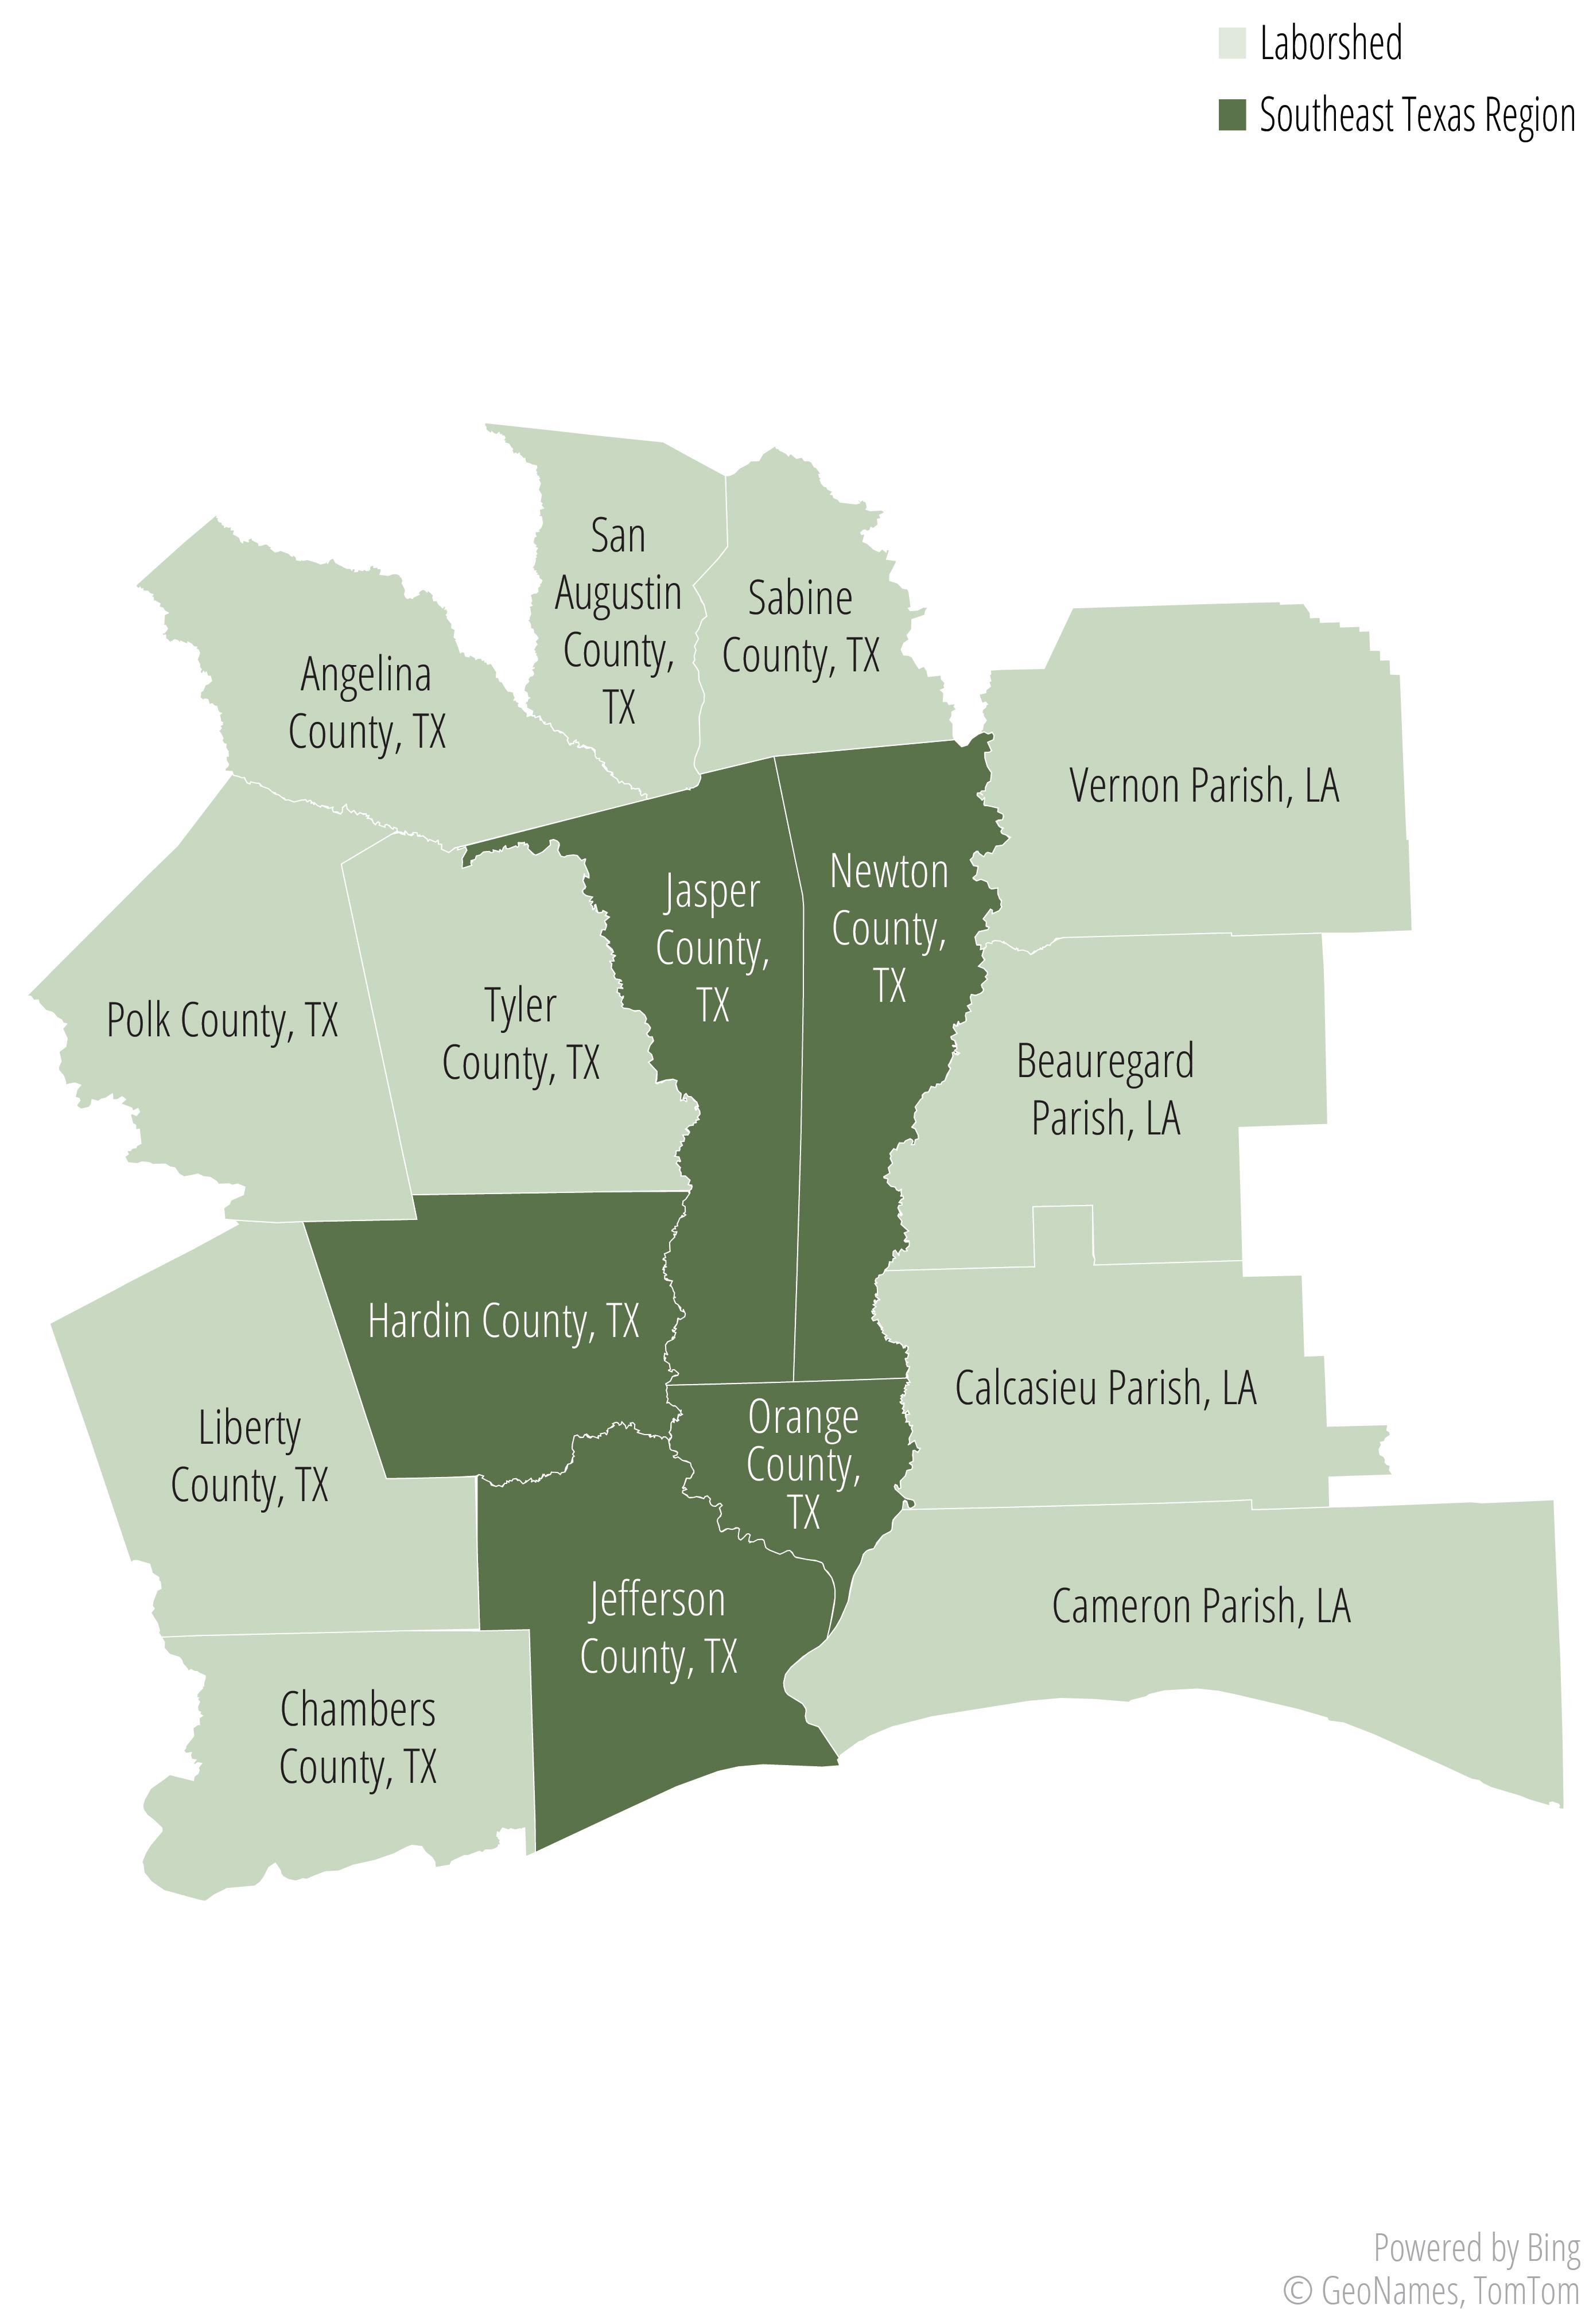
Economy. The Southeast Texas region, which includes Jefferson, Orange, Hardin, Tyler, Jasper, and Newton counties, has an employment base of approximately 190,000 jobs and is expected to have more than 100,000 job openings between 2024 and 2029. The industry sectors that employ the largest number of workers are health care, manufacturing, and construction. Over the next five years, these same three sectors are expected to be the largest sources of job growth. The high-demand, high-wage occupations with the greatest number of openings include a range of jobs in health care, education, business and operations, and transportation.
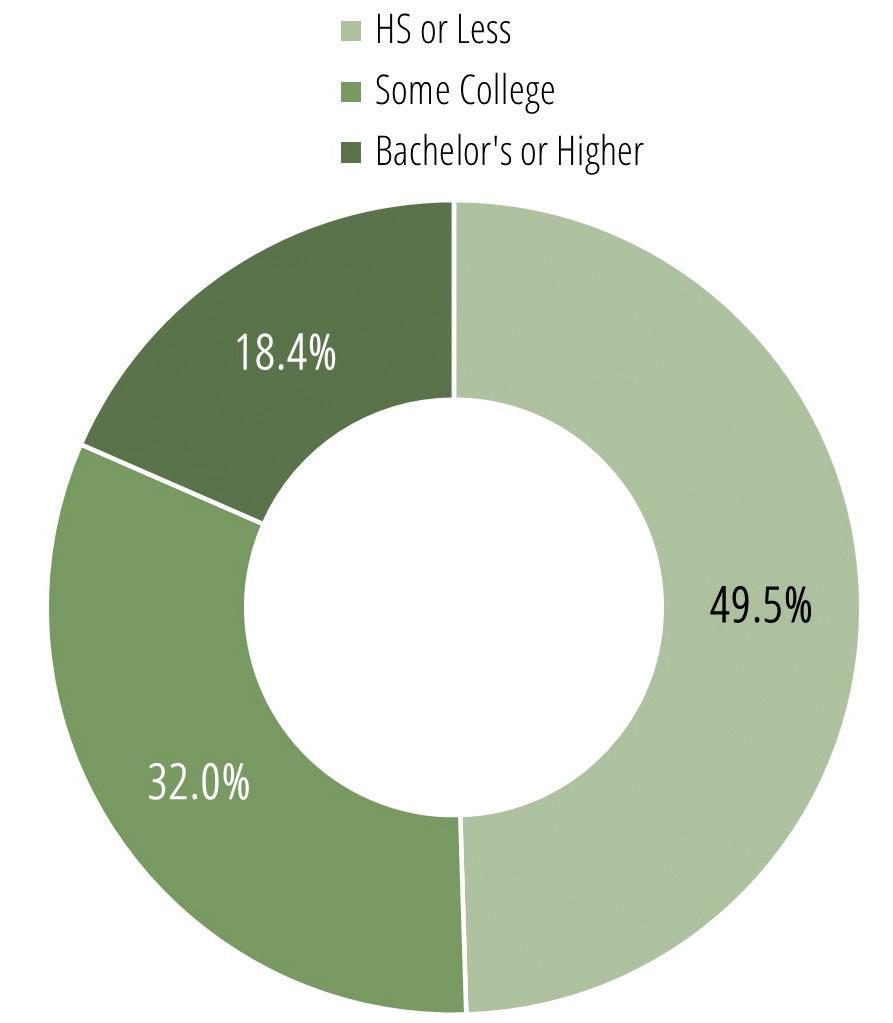
Labor shed. The Southeast Texas region pulls labor in from a wide area. Within a 45-minute drive is a labor force of over 400,000. About half of the population 25 years and older in the labor shed area has attained at least some degree of postsecondary education.
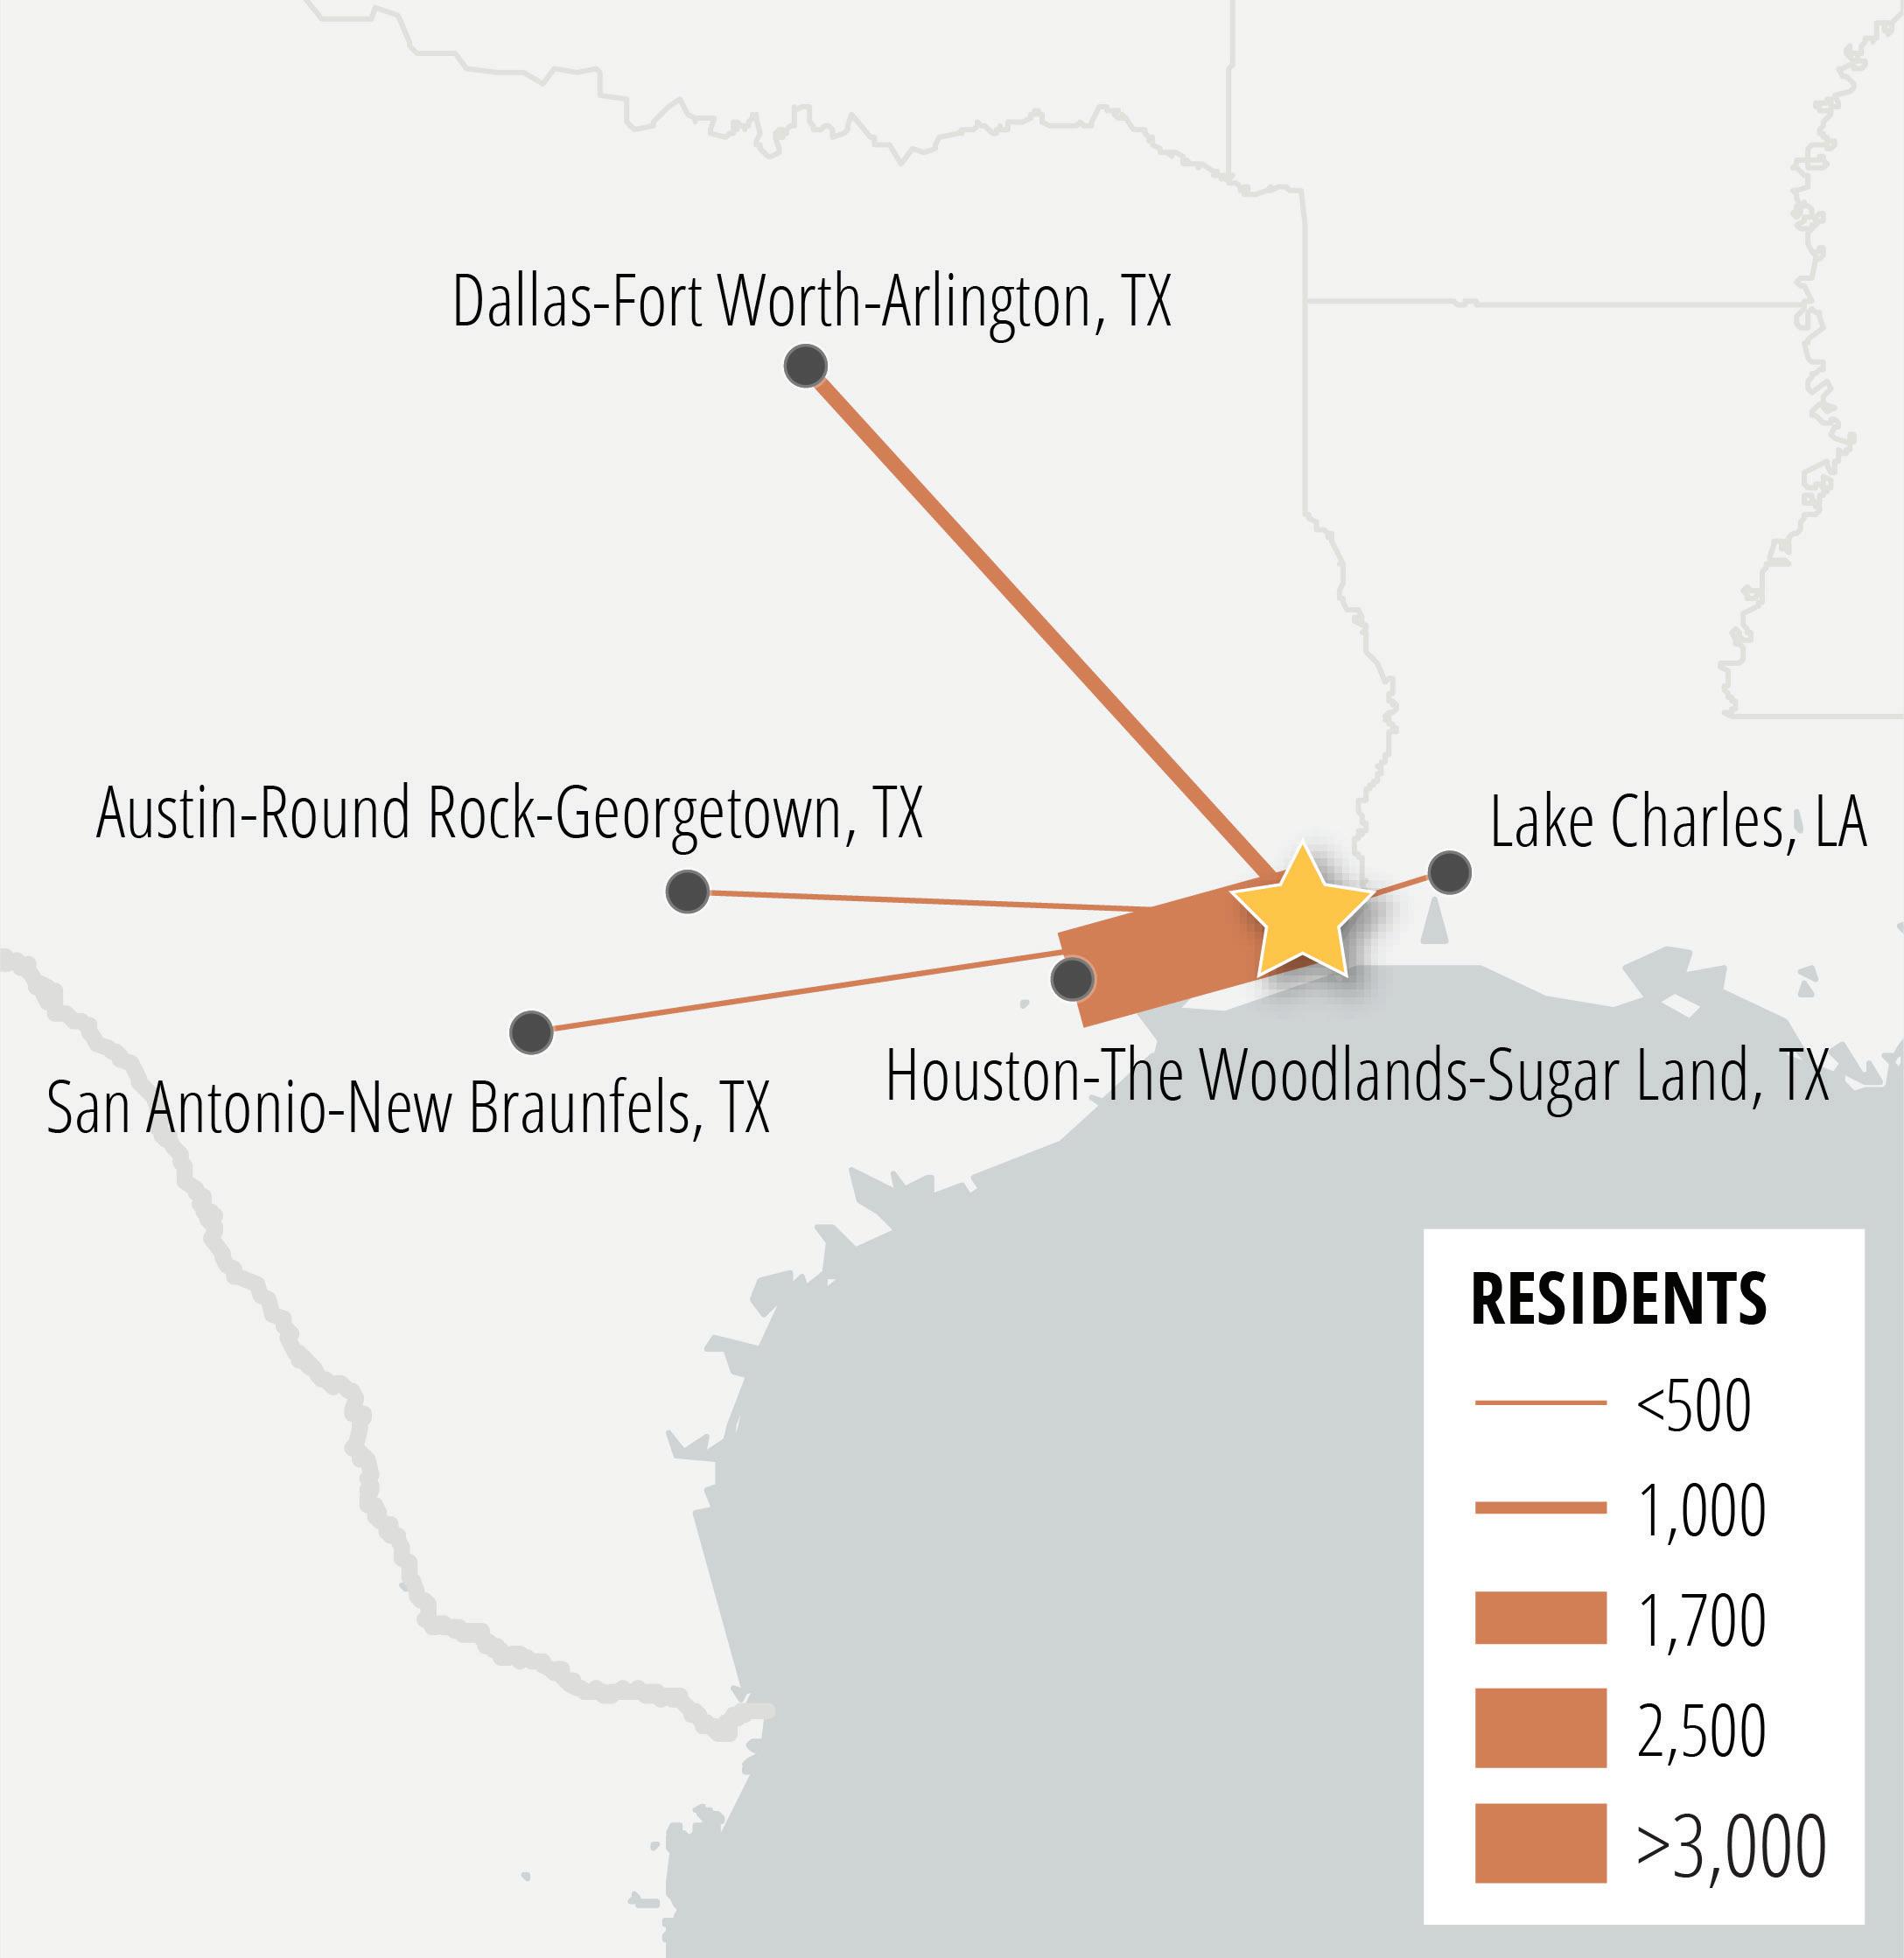
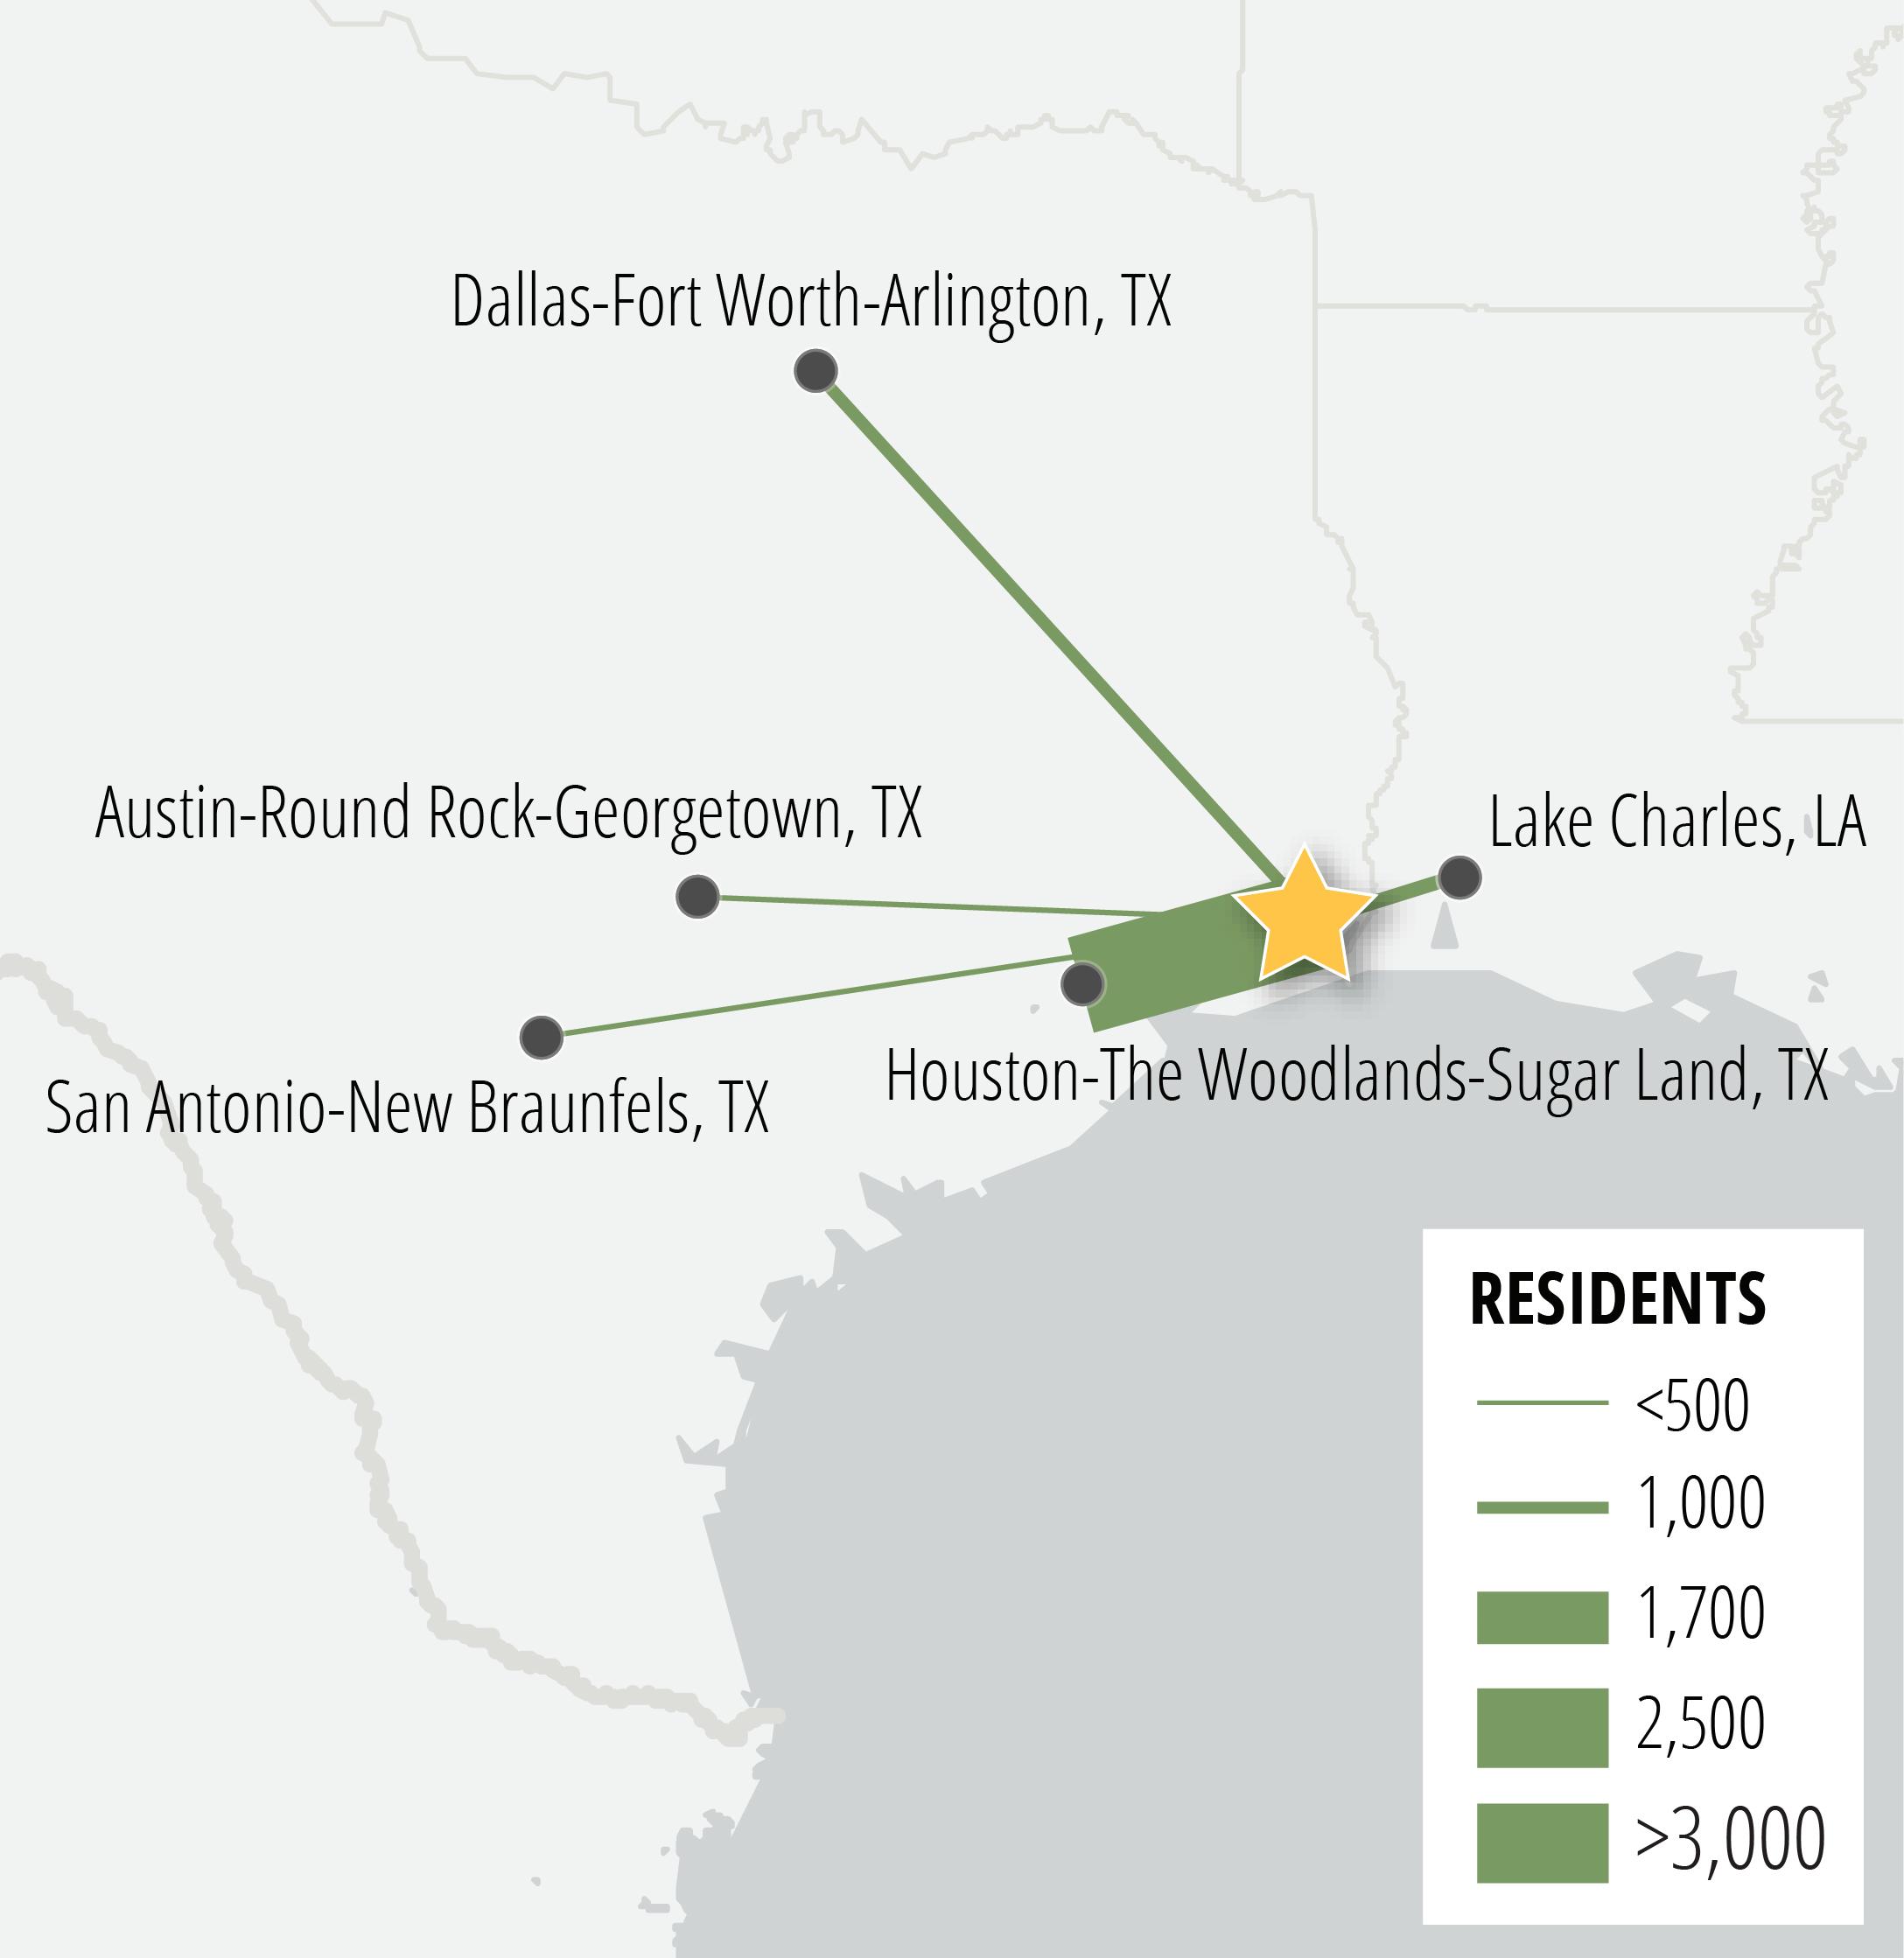
Resident linkages. The region has very strong connections with the Houston metropolitan area, which is both the largest source of residents moving to the Southeast Texas region and the largest destination for residents moving away from the region. Lake Charles, Dallas, Austin, and San Antonio are also major sources and destinations for residents moving into and out of the region.
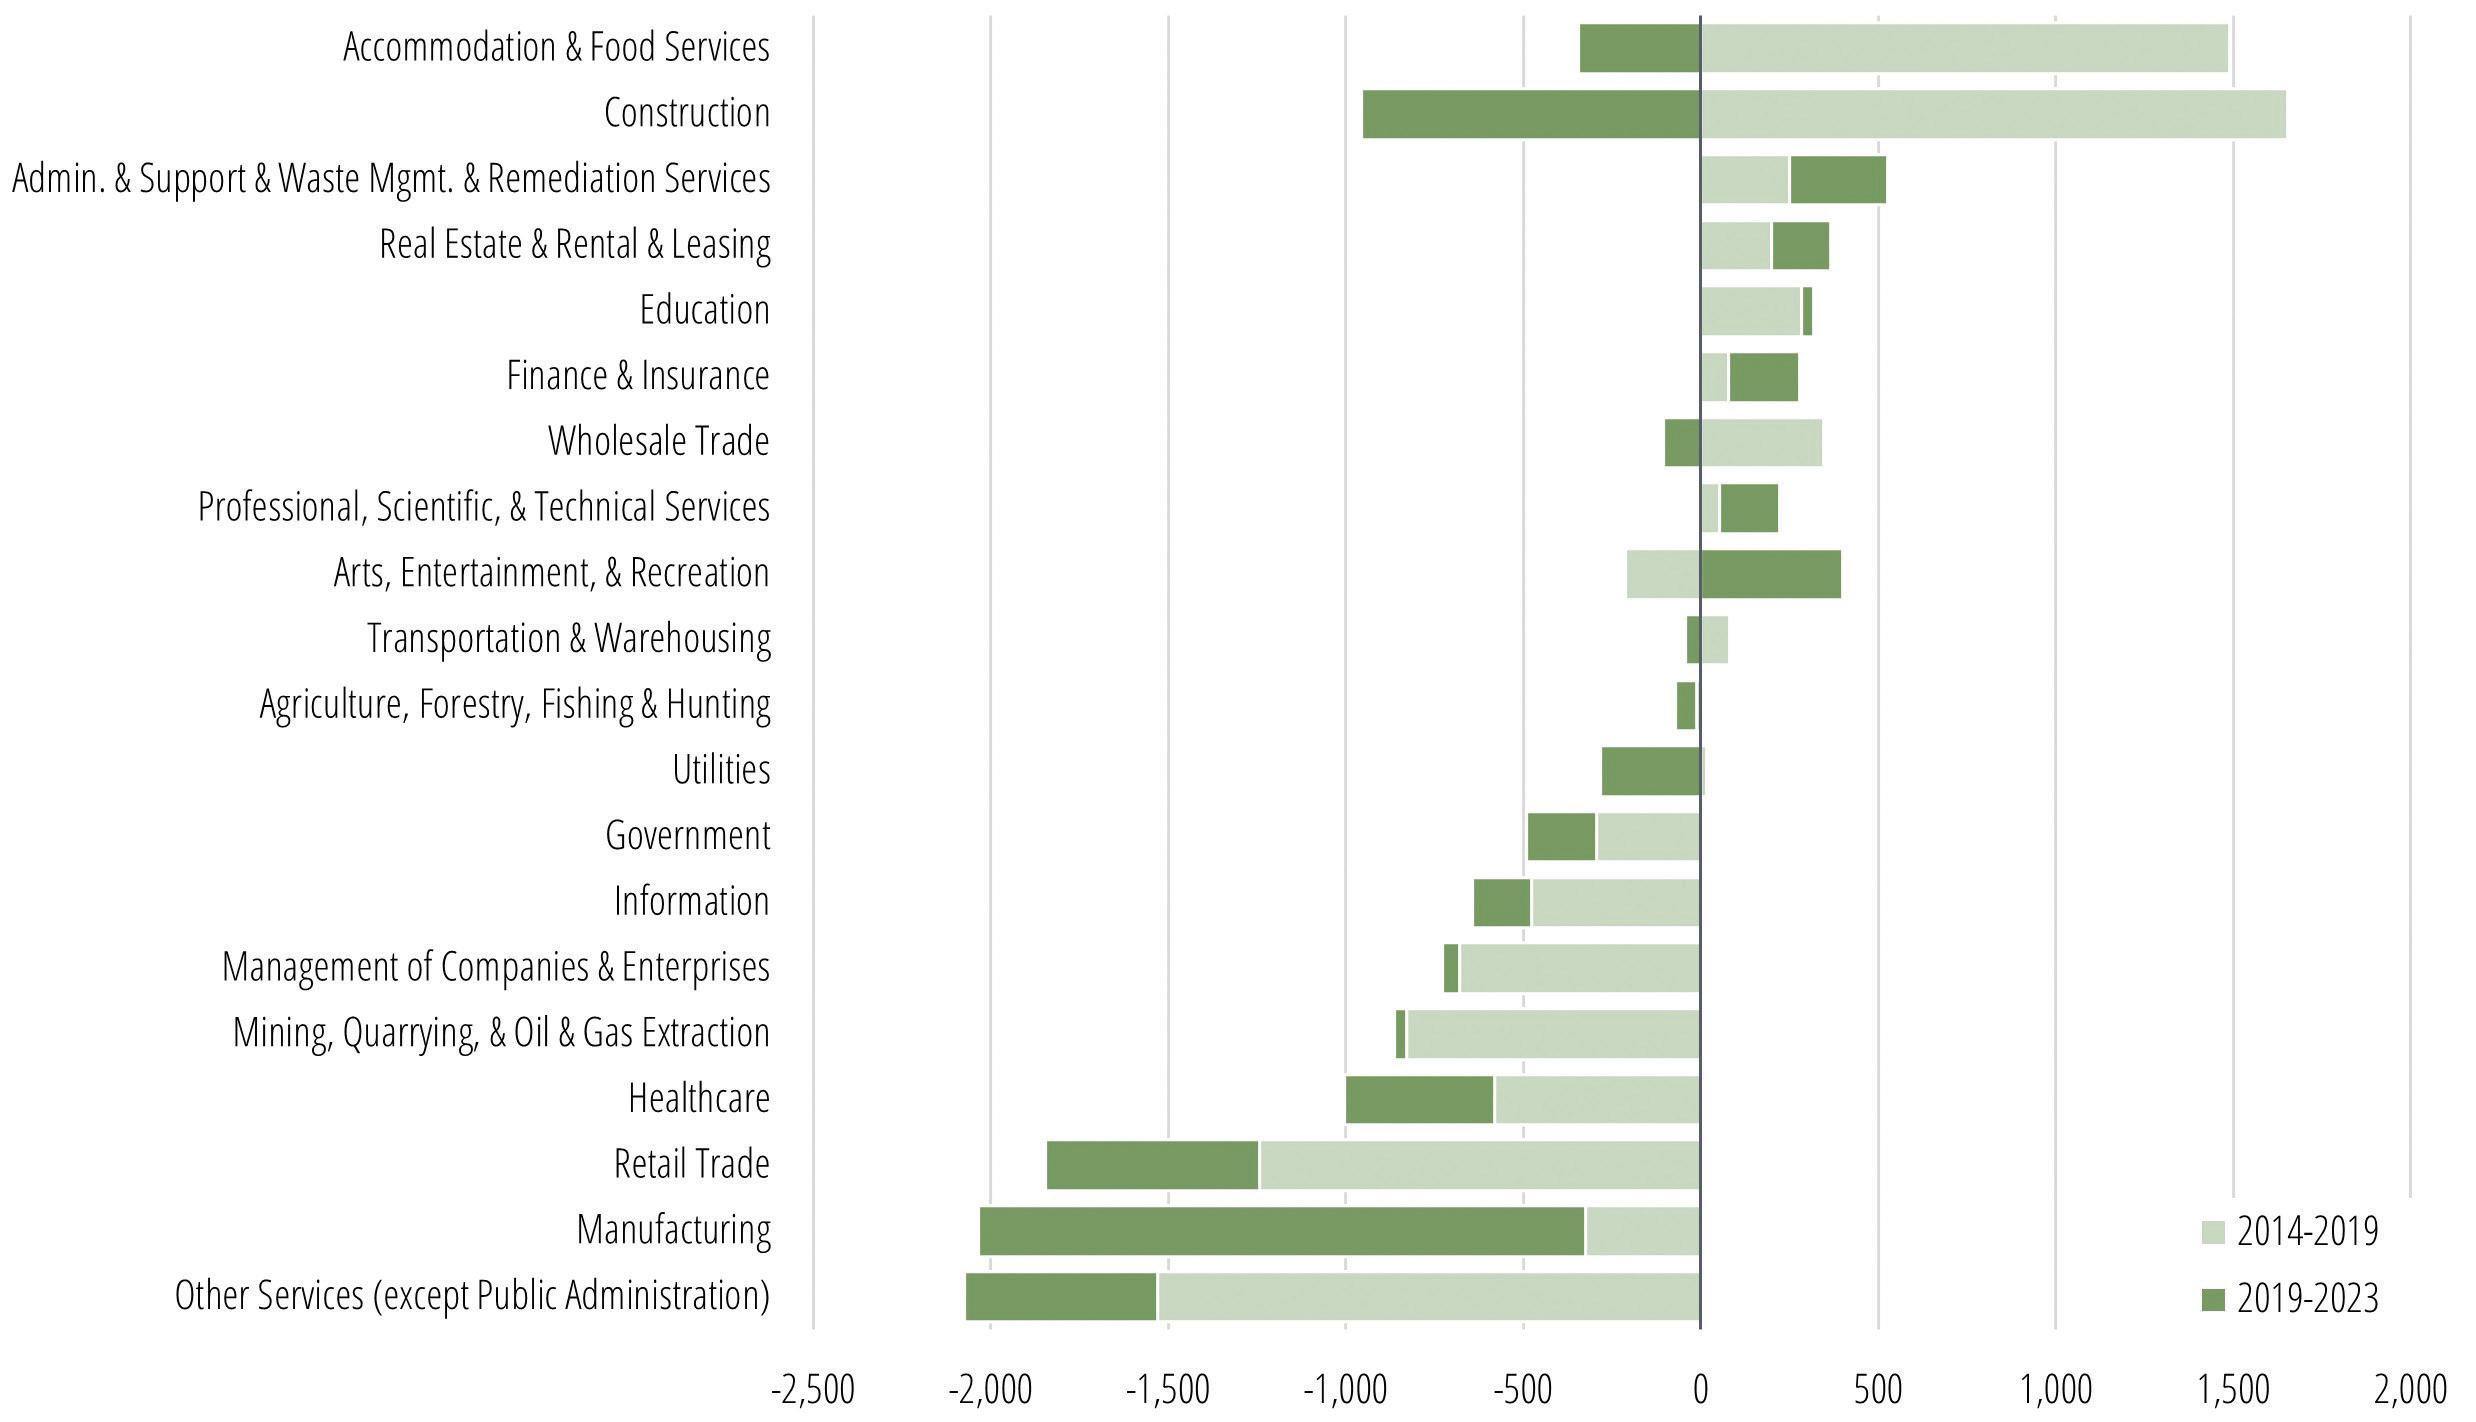
Employment situation. The Southeast Texas region has recovered some of its jobs after it was hard-hit by the pandemic-related downturn. However, it remains three percent below its 2019 level of employment. Between 2019 and 2023, the manufacturing and construction sectors were the hardest hit sectors. In fact, 14 out of the 20 major industry sectors lost jobs during this same period.
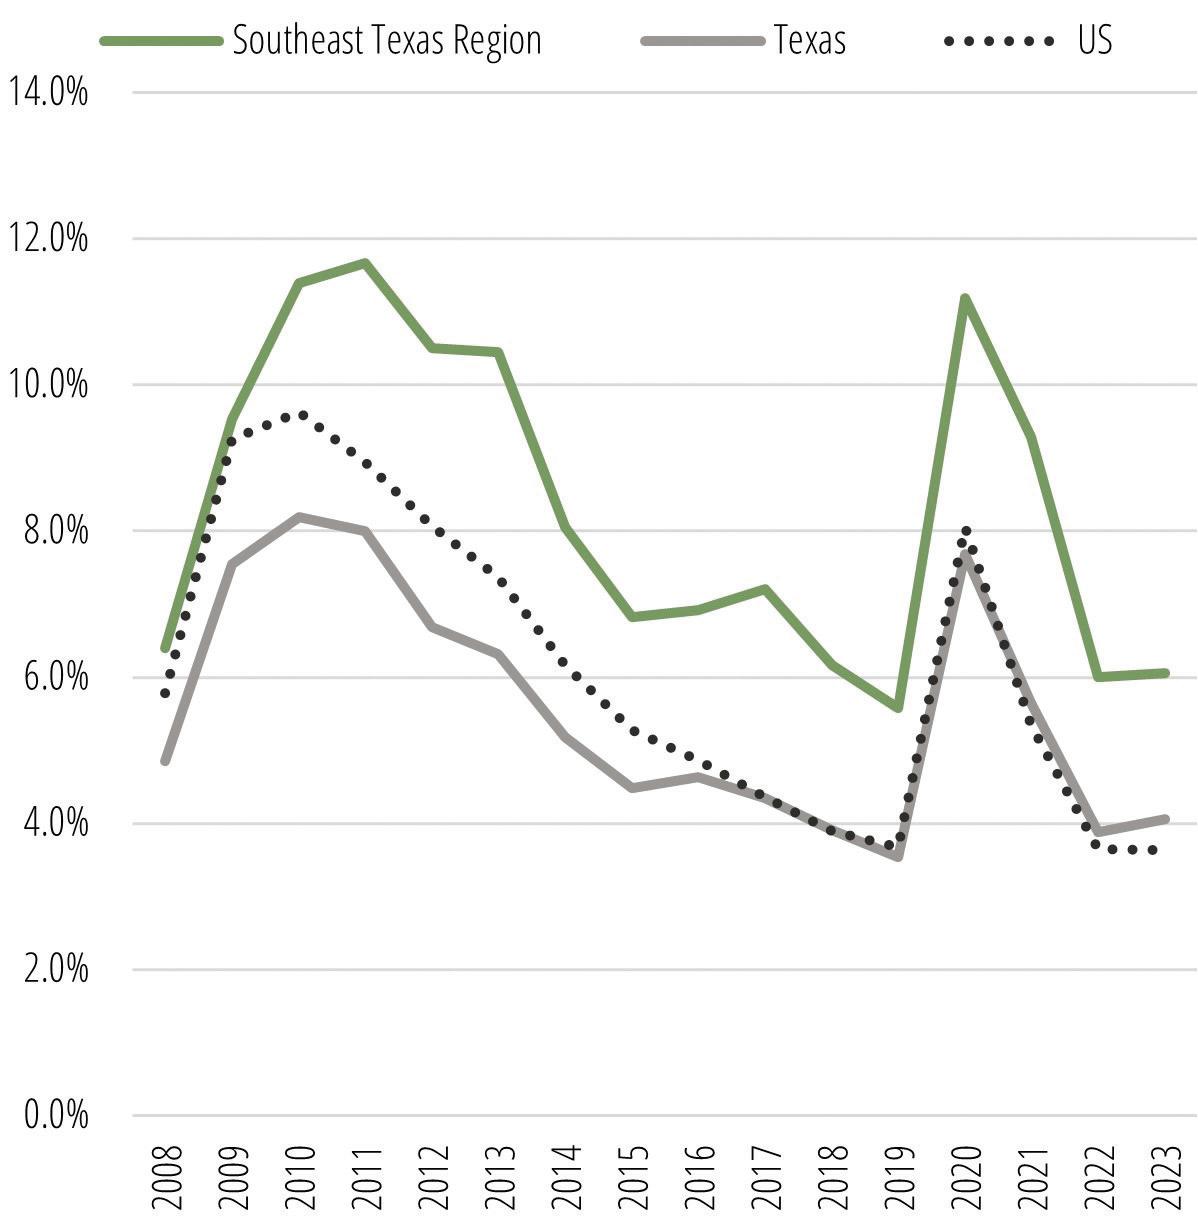
Labor market performance. The regional labor force has also not recovered to its 2019 level. In 2023, there were one percent fewer workers in the region than in 2019. The unemployment rate in the region is 6.1 percent, which is higher than it was in 2019 and the highest among the three sub-regions.
High-demand, high-wage occupations. Very few of the top 25 highest-demand occupations require postsecondary training or earn a living wage. Beyond the top 25, however, there are a variety of high-demand occupations that earn more than the regional living wage of $19.17. The occupational clusters that have the largest number of occupations that are highdemand and earn living wages are construction, production/manufacturing, and education.
SOUTHEAST TEXAS ECONOMIC AND LABOR MARKET UPDATE 1
Figure 1. COuNTieS
460,594
189,388
113,794
Figure 2. eMPLOYMeNT BY iNDuSTrY + NeXT 5-YeAr CHANge
SOUTHEAST TEXAS ECONOMIC AND LABOR MARKET UPDATE 2 T.L.L. TEMPLE FOUNDATION
SUMMARY STATISTICS
Figure 3. KeY STATiSTiCS
Population (2023) -0.3% Population Change (2020-2023)
Jobs (2023)
Openings (2024-2029)
TOP HigH-DeMAND, HigH-WAge JOBS* OCCUPATION OPENINGS (2024-2029) 1. General & Operations Managers 2,349 2. Heavy & Tractor-Trailer Truck Drivers 1,710 3. Bookkeeping, Accounting, & Auditing Clerks 1,096 4. Registered Nurses 836 5. Elementary School Teachers, Except Special Education 771 6. Licensed Practical & Licensed Vocational Nurses 585 7. Secondary School Teachers, Except Special & Career/Technical Education 567 8. Postsecondary Teachers 552 9. Project Management Specialists 477 10. Accountants & Auditors 475 11. Construction Managers 473 12. Managers, All Other 430 13. Middle School Teachers, Except Special & Career/Technical Education 387 14. Human Resources Specialists 338 15. Business Operations Specialists, All Other 312 * Includes only occupations that pay at least a living wage of $19.17 and require postsecondary education. Sources: US Census Bureau, and Lightcast 2024.1 – QCEW Employees, Non-QCEW Employees, and Self-Employed.
Figure 4.
LABORSHED STATISTICS
Figure 5. KeY LABOrSHeD STATiSTiCS
215,984
Labor Force (2023) +1.1%
Change in Labor Force (2019-2023) 4.7%
Unemployment Rate (2023 average)
Figure 7. eDuCATiONAL ATTAiNMeNT OF LABOrSHeD
6. LABOrSHeD DeFiNiTiON (45-MiNuTe LABOrSHeD)
Source: US Bureau of Labor Statistics, US Census Bureau; 2022 ACS 5-year Estimates; and ARC Research.
SOUTHEAST TEXAS ECONOMIC AND LABOR MARKET UPDATE 3 T.L.L. TEMPLE FOUNDATION
Figure
RESIDENT INFLOWS/OUTFLOWS
Figure 8. MAP OF TOP SOurCeS AND DeSTiNATiONS FOr reSiDeNTS MOViNg TO/FrOM SOuTHeAST TeXAS, 2021 Top Sources Top Destinations
SOUTHEAST TEXAS ECONOMIC AND LABOR MARKET UPDATE 4 T.L.L. TEMPLE FOUNDATION
FOr reSiDeNTS MOViNg TO/FrOM SOuTHeAST TeXAS, 2021 METROPOLITAN AREA INBOUND OUTBOUND NET FLOW Total Inflows/Outflows 5,815 5,004 812 TOP FIVE SOURCES OF RESIDENTS FROM SOUTHEAST TEXAS 1. Houston-The Woodlands-Sugar Land, TX 3,456 4,407 -950 2. Lake Charles, LA 743 311 432 3. Dallas-Fort Worth-Arlington, TX 681 761 -80 4. Austin-Round Rock-Georgetown, TX 345 401 -57 5. San Antonio-New Braunfels, TX 261 402 -141 TOP FIVE DESTINATIONS FOR RESIDENTS TO SOUTHEAST TEXAS 1. Houston-The Woodlands-Sugar Land, TX 3,456 4,407 -950 2. Dallas-Fort Worth-Arlington, TX 681 761 -80 3. San Antonio-New Braunfels, TX 261 402 -141 4. Austin-Round Rock-Georgetown, TX 345 401 -57 5. Lake Charles, LA 743 311 432
Figure
9. TOP SOurCeS AND DeSTiNATiONS
Sources: IRS Migration Data via Lightcast.
EMPLOYMENT SITUATION
10. TOTAL eMPLOYMeNT (2008-2023)
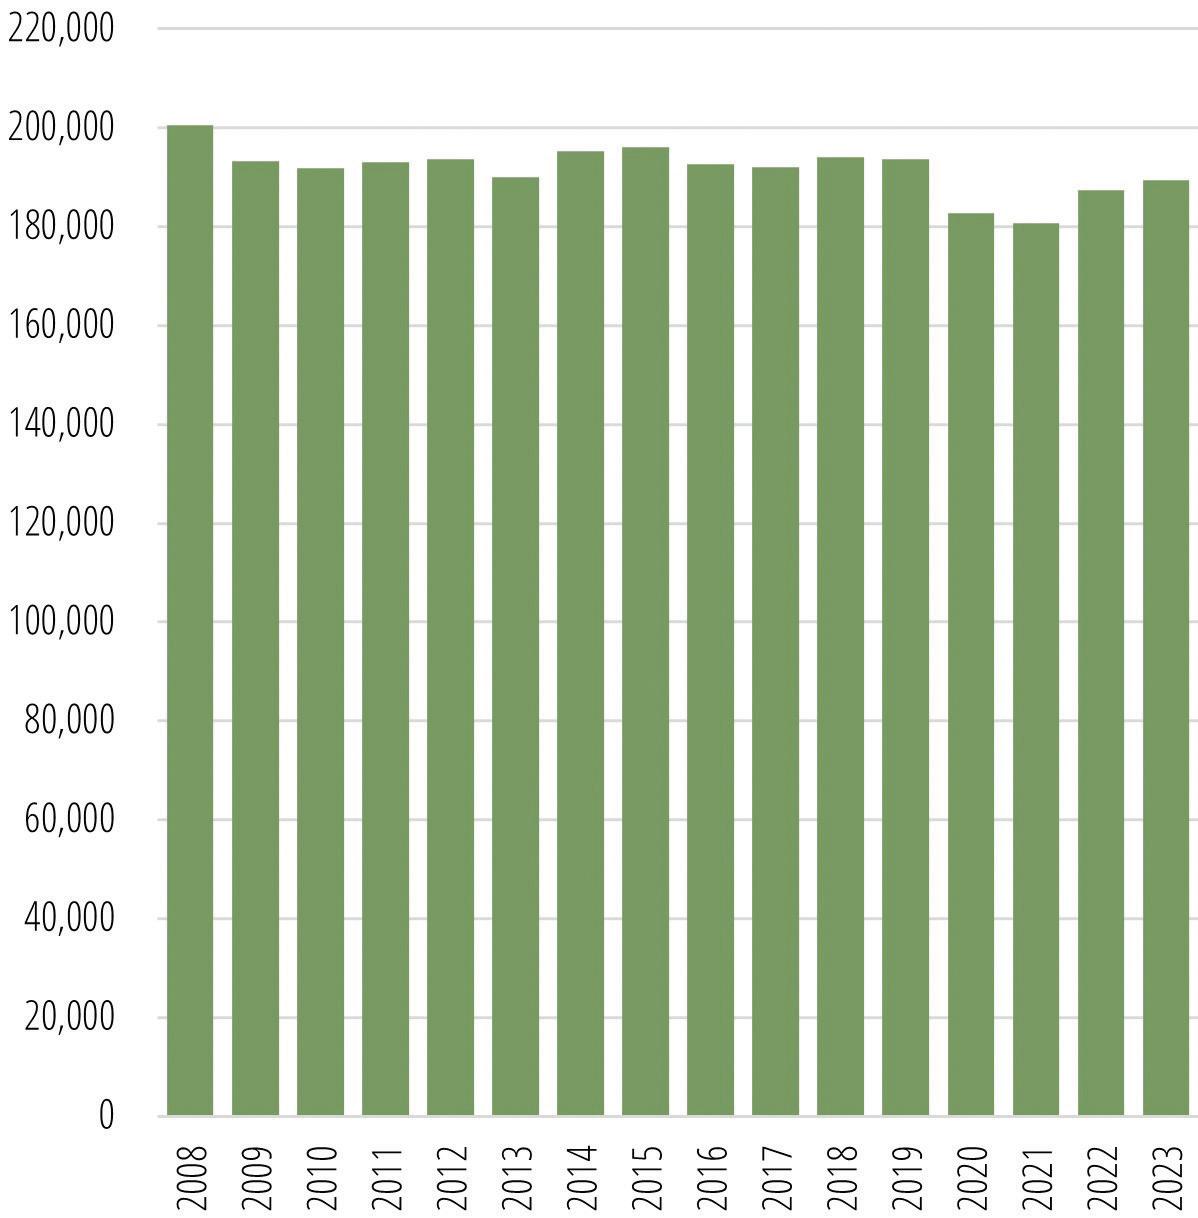
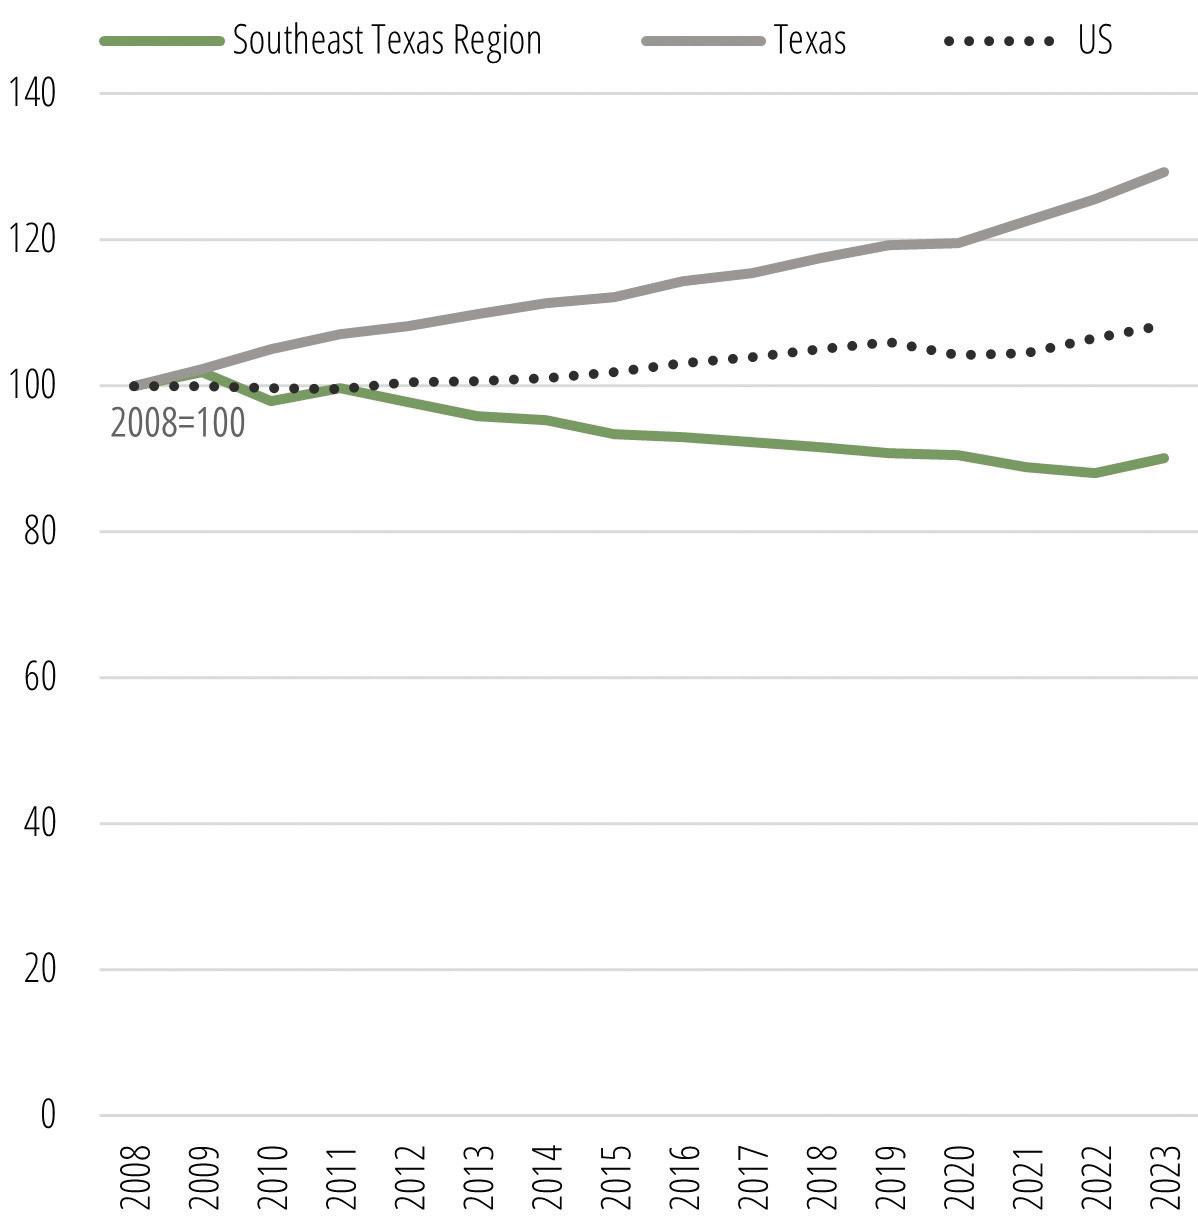
Figure 11. COMPArATiVe eMPLOYMeNT grOWTH (2008-2023)
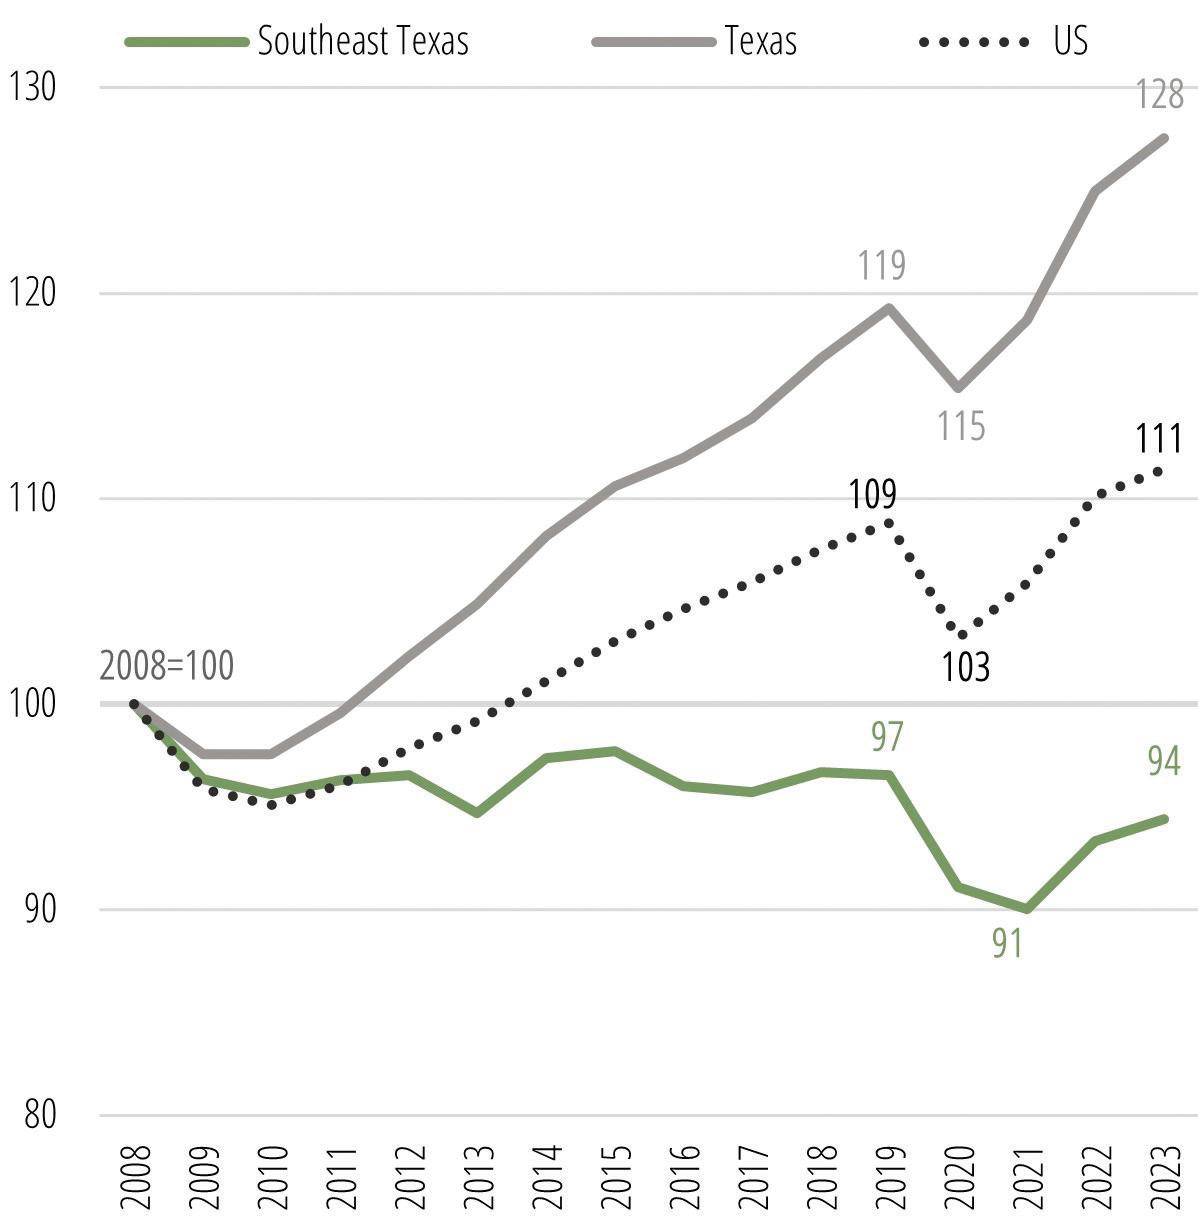
Figure 12. eMPLOYMeNT CHANge BY iNDuSTrY, 2014-2019, 2019-2023
Sources: Lightcast 2024.1 – QCEW Employees, Non-QCEW Employees, and Self-Employed.
SOUTHEAST TEXAS ECONOMIC AND LABOR MARKET UPDATE 5 T.L.L. TEMPLE FOUNDATION
Figure
LABOR MARKET PERFORMANCE

Source: US Bureau of Labor Statistics.
SOUTHEAST TEXAS ECONOMIC AND LABOR MARKET UPDATE 6 T.L.L. TEMPLE FOUNDATION
Figure 13. CiViLiAN LABOr FOrCe, 2008-2023
Figure 14. COMPArATiVe LABOr FOrCe grOWTH (2008-2023)
Figure 15. COMPArATiVe uNeMPLOYMeNT rATeS (2008-2020)
HIGH DEMAND OCCUPATIONS
Figure 16. TOP OCCuPATiON BY OPeNiNgS (2024-2029)
Occupations that pay more than the regional living wage of $19.17 are highlighted as follows: █ LOW-SKILL
Requires a high school diploma or less █ MIDDLE-SKILL
Requires more than a diploma, less than a bachelor’s █
bachelor’s degree or higher
SOUTHEAST TEXAS ECONOMIC AND LABOR MARKET UPDATE 7 T.L.L. TEMPLE FOUNDATION
HIGH-SKILL Requires a
SOC DESCRIPTION 2023 JOBS OPENINGS (2024-2029) REGIONAL MEDIAN HOURLY EARNINGS COMPARISON TO TEXAS MEDIAN HOURLY EARNINGS 35-3023 Fast Food & Counter Workers 4,580 5,209 $10.35 -5.0% 41-2011 Cashiers 4,544 4,341 $11.87 -4.1% 31-1128 Home Health & Personal Care Aides 4,601 3,937 $9.83 -6.8% 41-2031 Retail Salespersons 4,431 3,257 $13.35 -2.2% 35-3031 Waiters & Waitresses 2,798 2,966 $9.88 -4.9% 53-7065 Stockers & Order Fillers 3,147 2,718 $14.84 -10.2% 11-1021 General & Operations Managers 5,295 2,349 $38.14 -4.4% 37-2011 Janitors & Cleaners, Except Maids & Housekeeping Cleaners 2,907 2,263 $13.08 -3.1% 43-9061 Office Clerks, General 2,943 1,790 $16.43 -1.3% 53-3032 Heavy & Tractor-Trailer Truck Drivers 2,833 1,710 $22.33 -0.9% 35-2021 Food Preparation Workers 1,926 1,708 $12.36 -5.9% 53-7062 Laborers & Freight, Stock, & Material Movers, Hand 2,324 1,646 $15.36 -7.0% 47-2061 Construction Laborers 2,800 1,598 $16.43 -4.2% 35-2014 Cooks, Restaurant 1,652 1,506 $13.56 -5.5% 43-4051 Customer Service Representatives 2,131 1,489 $16.61 -5.8% 43-6014 Secretaries & Admin. Assistants, Except Legal, Medical, & Executive 2,358 1,296 $17.96 -3.0% 35-1012 First-Line Supervisors of Food Preparation & Serving Workers 1,568 1,188 $15.35 -5.8% 43-4171 Receptionists & Information Clerks 1,674 1,179 $14.72 +0.9% 43-3031 Bookkeeping, Accounting, & Auditing Clerks 1,849 1,096 $19.78 -7.3% 41-1011 First-Line Supervisors of Retail Sales Workers 2,187 1,089 $18.13 -5.0% 25-9045 Teaching Assistants, Except Postsecondary 1,766 1,085 $12.49 -7.4% 47-1011 First-Line Supervisors of Construction Trades & Extraction Workers 2,188 1,054 $33.19 +9.2% 51-4121 Welders, Cutters, Solderers, & Brazers 1,843 1,053 $28.32 +23.0% 31-1131 Nursing Assistants 1,289 1,016 $13.59 -8.4% 37-3011 Landscaping & Groundskeeping Workers 1,462 976 $13.79 -11.4%
Source: Lightcast 2024.1 – QCEW Employees, Non-QCEW Employees, and Self-Employed.
HIGH DEMAND OCCUPATIONS (CONTINUED)
Figure 16. TOP OCCuPATiON BY OPeNiNgS (2024-2029) (CONTiNueD)
Occupations that pay more than the regional living wage of $19.17 are highlighted as follows: █ LOW-SKILL
Requires a high school diploma or less █ MIDDLE-SKILL
Requires more than a diploma, less than a bachelor’s █
a bachelor’s degree or higher
SOUTHEAST TEXAS ECONOMIC AND LABOR MARKET UPDATE 8 T.L.L. TEMPLE FOUNDATION
HIGH-SKILL Requires
SOC DESCRIPTION 2023 JOBS OPENINGS (2024-2029) REGIONAL MEDIAN HOURLY EARNINGS COMPARISON TO TEXAS MEDIAN HOURLY EARNINGS 49-9071 Maintenance & Repair Workers, General 1,830 914 $18.35 +1.2% 43-1011 First-Line Supervisors of Office & Administrative Support Workers 1,870 896 $24.81 -13.3% 39-9011 Childcare Workers 1,086 874 $10.65 -4.2% 37-2012 Maids & Housekeeping Cleaners 1,149 845 $11.17 -13.1% 29-1141 Registered Nurses 2,877 836 $36.49 -4.9% 51-1011 First-Line Supervisors of Production & Operating Workers 1,574 781 $37.48 +25.0% 47-2031 Carpenters 1,786 779 $24.48 +15.1% 25-2021 Elementary School Teachers, Except Special Education 2,137 771 $26.37 -10.6% 33-3012 Correctional Officers & Jailers 1,744 736 $20.69 -1.1% 33-9032 Security Guards 1,121 736 $11.94 -15.3% 31-9092 Medical Assistants 908 695 $17.05 -3.7% 47-2111 Electricians 1,533 693 $27.79 +6.5% 35-9031 Hosts & Hostesses, Restaurant, Lounge, & Coffee Shop 520 681 $11.08 -1.2% 53-3033 Light Truck Drivers 1,075 679 $18.38 -3.6% 25-3031 Substitute Teachers, Short-Term 1,006 647 $11.70 -13.4% 41-4012 Sales Reps., Wholesale & Mfg, Except Technical & Scientific Products 1,205 632 $28.58 -1.4% 47-2073 Operating Engineers & Other Construction Equipment Operators 1,027 620 $23.26 +4.4% 39-5012 Hairdressers, Hairstylists, & Cosmetologists 874 608 $14.31 +1.9% 49-1011 First-Line Supervisors of Mechanics, Installers, & Repairers 1,301 596 $35.33 +10.5% 47-2152 Plumbers, Pipefitters, & Steamfitters 1,176 589 $29.75 +12.9% 29-2061 Licensed Practical & Licensed Vocational Nurses 1,327 585 $22.53 -8.0% 25-2031 Secondary School Teachers, Except Special & Career/Tech. Education 1,672 567 $27.30 -7.8% 35-3011 Bartenders 639 565 $10.85 -11.4% 25-1099 Postsecondary Teachers 1,123 552 $32.23 -20.6% 35-2012 Cooks, Institution & Cafeteria 679 545 $12.98 -6.0% Source: Lightcast 2024.1 – QCEW Employees, Non-QCEW Employees, and Self-Employed.
HIGH DEMAND OCCUPATIONS (CONTINUED)
Figure 16. TOP OCCuPATiON BY OPeNiNgS (2024-2029) (CONTiNueD)
Occupations that pay more than the regional living wage of $19.17 are highlighted as follows: █ LOW-SKILL
Requires a high school diploma or less █ MIDDLE-SKILL
Requires more than a diploma, less than a bachelor’s █
a bachelor’s degree or higher
SOUTHEAST TEXAS ECONOMIC AND LABOR MARKET UPDATE 9 T.L.L. TEMPLE FOUNDATION
HIGH-SKILL Requires
SOC DESCRIPTION 2023 JOBS OPENINGS (2024-2029) REGIONAL MEDIAN HOURLY EARNINGS COMPARISON TO TEXAS MEDIAN HOURLY EARNINGS 51-2098 Miscellaneous Assemblers & Fabricators 940 540 $16.83 -0.7% 49-9041 Industrial Machinery Mechanics 1,016 533 $28.58 +2.1% 35-9011 Dining Room & Cafeteria Attendants & Bartender Helpers 522 522 $10.42 -6.1% 51-9061 Inspectors, Testers, Sorters, Samplers, & Weighers 864 521 $23.05 +19.4% 51-9198 Helpers--Production Workers 661 515 $15.87 +0.7% 51-8093 Petroleum Pump System Operators, Refinery Operators, & Gaugers 1,025 478 $42.27 +9.1% 13-1082 Project Management Specialists 1,186 477 $45.02 +10.6% 13-2011 Accountants & Auditors 1,097 475 $33.89 -9.6% 11-9021 Construction Managers 1,039 473 $39.06 +1.9% 49-3023 Automotive Service Technicians & Mechanics 1,074 453 $18.79 -8.3% 11-9199 Managers, All Other 968 430 $38.47 -15.8% 41-3091 Sales Representatives of Services, Except Advertising, Insurance, Financial Services, & Travel 848 430 $27.94 -0.8% 33-3051 Police & Sheriff's Patrol Officers 993 422 $32.71 +5.7% 43-5071 Shipping, Receiving, & Inventory Clerks 814 415 $17.59 +0.7% 51-9011 Chemical Equipment Operators & Tenders 928 408 $35.52 +29.0% 53-7061 Cleaners of Vehicles & Equipment 568 402 $14.05 +5.4% 53-1047 First-Line Supervisors of Transportation & Material Moving Workers, Except Aircraft Cargo Handling Supervisors 722 399 $26.50 -0.8% 25-2022 Middle School Teachers, Except Special & Career/Technical Education 1,072 387 $26.00 -11.9% 41-3021 Insurance Sales Agents 742 386 $16.17 -24.4% 35-9021 Dishwashers 426 383 $11.32 -12.1% 51-4041 Machinists 612 370 $26.52 +13.9% 43-6013 Medical Secretaries & Administrative Assistants 608 360 $15.54 -12.5% 53-3051 Bus Drivers, School 449 344 $18.49 -3.3% 53-3031 Driver/Sales Workers 600 339 $14.24 -3.9% 13-1071 Human Resources Specialists 746 338 $25.72 -12.8% Source: Lightcast 2024.1 – QCEW Employees, Non-QCEW Employees, and Self-Employed.
HIGH DEMAND CAREER CLUSTERS
Figure 17. HigH DeMAND CAreer CLuSTerS
Occupations
ARCHITECTURE & CONSTRUCTION
• First-Line Supervisor
• Electrician
• Operating Engineers & Other Construction Equipment Operators
• Plumbers
Education Typically Required for Entry
Relevant Programs of Study
Most-Requested Credential*
• Nondegree Award or HS Diploma & On-the-Job Training
PRODUCTION/ MANUFACTURING
• Welders, Cutters, Solderers, & Brazers
• Inspectors, Testers, Sorters, Samplers, & Weighers
• Petroleum Pump System Operators, Refinery Operators, & Gaugers
• Chemical Equipment Operators & Tenders
• Machinist
• Nondegree Award or HS Diploma & On-the-Job Training
EDUCATION & TRAINING
• Elementary School Teachers
• Middle School Teachers
• Secondary School Teachers
Top Employers Posting
• Electrical
• Maintenance/Operations
• Plumbing & Pipefitting
• NCCER Certification
• Journeyman Electrician
• Commercial Driver’s License
Zachry Group
Kinder Morgan
Allegiant Industrial
ISC Constructors
Kent International
*Most-requested certificate or credential is based on job postings in 2023.
Source: Texas Education Agency, Lightcast Job Posting Analytics.
• Welding
• Manufacturing Technology
• Refining & Chemical Processes
• TWIC Card
• Certified Welding Inspector
Aerotek
Zachry Group
Flowerve
USA Debusk 5. Express Employment Professionals
• Bachelor's Degree or Higher & Certification from an Approved Educator Preparation Program
• Teaching & Training
• Teaching Certificate
1. Third Future Schools
2. Beaumont ISD
3. Bob Hope School
4. West Orange Cove CISD
5. Port Neches-Groves ISD
SOUTHEAST TEXAS ECONOMIC AND LABOR MARKET UPDATE 10 T.L.L. TEMPLE FOUNDATION
1.
2.
3.
4.
5.
1.
2.
3.
4.
PUBLIC SCHOOL ENROLLMENT AND EMPLOYMENT OUTCOMES
Figure 18. eNrOLLMeNT AND eMPLOYMeNT OuTCOMeS, regiONAL HigH SCHOOL grADuATeS, 2019–2020
19. TOP TeXAS PuBLiC COLLegeS AND uNiVerSiTieS By Fall College Enrollment of District High School Graduates
COLLEGE/UNIVERSITY
Lamar University
Lamar Institute of Technology
Lamar State College - Orange
Lamar State College - Port Arthur
Texas A & M
Figure 20. iNDuSTrieS WHere eMPLOYeD
*Not Located - High school graduates not found either as college enrolled (in a Texas public college or university in the fall semester following graduation) or employed (not found in the 4th quarter of Texas employment data as reported by the Texas Workforce Commission).
Source: Texas Public Education Information Resource (TPEIR).
SOUTHEAST TEXAS ECONOMIC AND LABOR MARKET UPDATE 11 T.L.L. TEMPLE FOUNDATION
SCHOOL DISTRICT TOTAL ENROLLED IN COLLEGE ONLY EMPLOYED ONLY EMPLOYED & ENROLLED ALL ENROLLED IN COLLEGE ALL EMPLOYED NOT LOCATED* Beaumont 1,054 165 330 229 394 559 330 Port Arthur 399 56 122 68 124 190 153 Port Neches-Groves 368 91 91 93 184 184 93 Nederland 331 82 89 84 166 173 76 Vidor 296 30 115 54 84 169 97 Lumberton 262 60 72 71 131 143 59 Little Cypress-Mauriceville 231 45 61 55 100 116 70 Silsbee 174 24 59 40 64 99 51 Hardin-Jefferson 168 44 49 44 88 93 31 Bridge City 161 48 41 36 84 77 36 Jasper 151 31 42 22 53 64 56 Hamshire-Fannett 132 38 34 37 75 71 23 Orangefield 118 34 27 32 66 59 25 West Orange-Cove 110 16 37 16 32 53 41 Buna 105 26 24 23 49 47 32 Woodville 89 20 26 17 37 43 26 Kirbyville 81 19 25 7 26 32 30 Newton 79 12 25 11 23 36 31 Warren 69 8 33 8 16 41 20 Kountze 60 9 27 14 23 41 10 West Hardin County 43 7 21 2 9 23 13 Deweyville 37 8 9 14 22 23 6 Colmesneil 33 6 13 2 8 15 12 Evadale 32 9 6 12 21 18 5 Sabine Pass 31 13 3 13 26 16 2 Brookeland 25 15 6 6 21 4
Figure
University
Percent of all
INDUSTRY % OF TOTAL Retail Trade 39% Accommodations & Food Services 29% Administrative & Support Services 5% Construction 4% Health Care & Social Assistance 3%
Employed
ABOUT THIS WORK
This profile is part of the Rural East Texas Economic Opportunity Analysis series commissioned by the T.L.L. Temple Foundation. The goals of this work are to strengthen the alignment of and linkages between the talent pipeline and key industry clusters in rural East Texas.
The original series of reports, released in January 2022, defined three economic subregions: Northeast Texas centered on Texarkana, Deep East Texas centered on Lufkin and Nacogdoches, and Southeast Texas centered on Beaumont and Port Arthur. The economic and labor market structure of each sub-region was profiled, detailing the key industry sectors, current and projected employment opportunities, and high-demand skills and credentials.
The current profile provides updated data to supplement the original report. Economic and labor market research was provided by Alexander Research and Consulting. Graphic design was completed by Safflor Design.
All profiles are available for download from the T.L.L. Temple Foundation’s website at www.tlltemple.foundation.
ABOUT THE PROJECT TEAM
SPONSORS
The T.L.L. Temple Foundation works alongside rural communities to build a thriving East Texas and to alleviate poverty, creating access and opportunities for all.
Jerry Kenney Program Officer, Regional Capacity Building and Community Development jerrykenney@tlltemple.foundation
CONSULTING TEAM

Alexander Research & Consulting provides insights and support to help organizations amplify their impact. I offer a wide range of services —research, analytics, program evaluation, strategic planning, and implementation support—with a specialization in community, economic, and workforce development.
Caroline Alexander Principal caroline@alexanderrc.com
DESIGN
Non-credited images used in this report were licensed from Adobe Stock. Cover image and other Boggy Slough Nature Preserve images used with permission from Jay Brittain. All other images sourced as attributed.
For over 10 years, Safflor Design has been elevating their clients’ work through elegant design.
Meredith Eberle Proprietor safflor@gmail.com
SOUTHEAST TEXAS ECONOMIC AND LABOR MARKET UPDATE 12 T.L.L. TEMPLE FOUNDATION

SOUTHEAST TEXAS ECONOMIC AND LABOR MARKET UPDATE 13
Shangri La Botanical Center in Orange by Rmckee8 via Wikimedia Commons (CC BY-SA 4.0)
PREPARED BY