Foundation’s NORTHEAST
ECONOMIC AND LABOR MARKET UPDATE MAY 2024
T.L.L. Temple
TEXAS

NORTHEAST TEXAS ECONOMIC AND LABOR MARKET UPDATE II
Image via Adobe Stock

SUMMARY OF FINDINGS
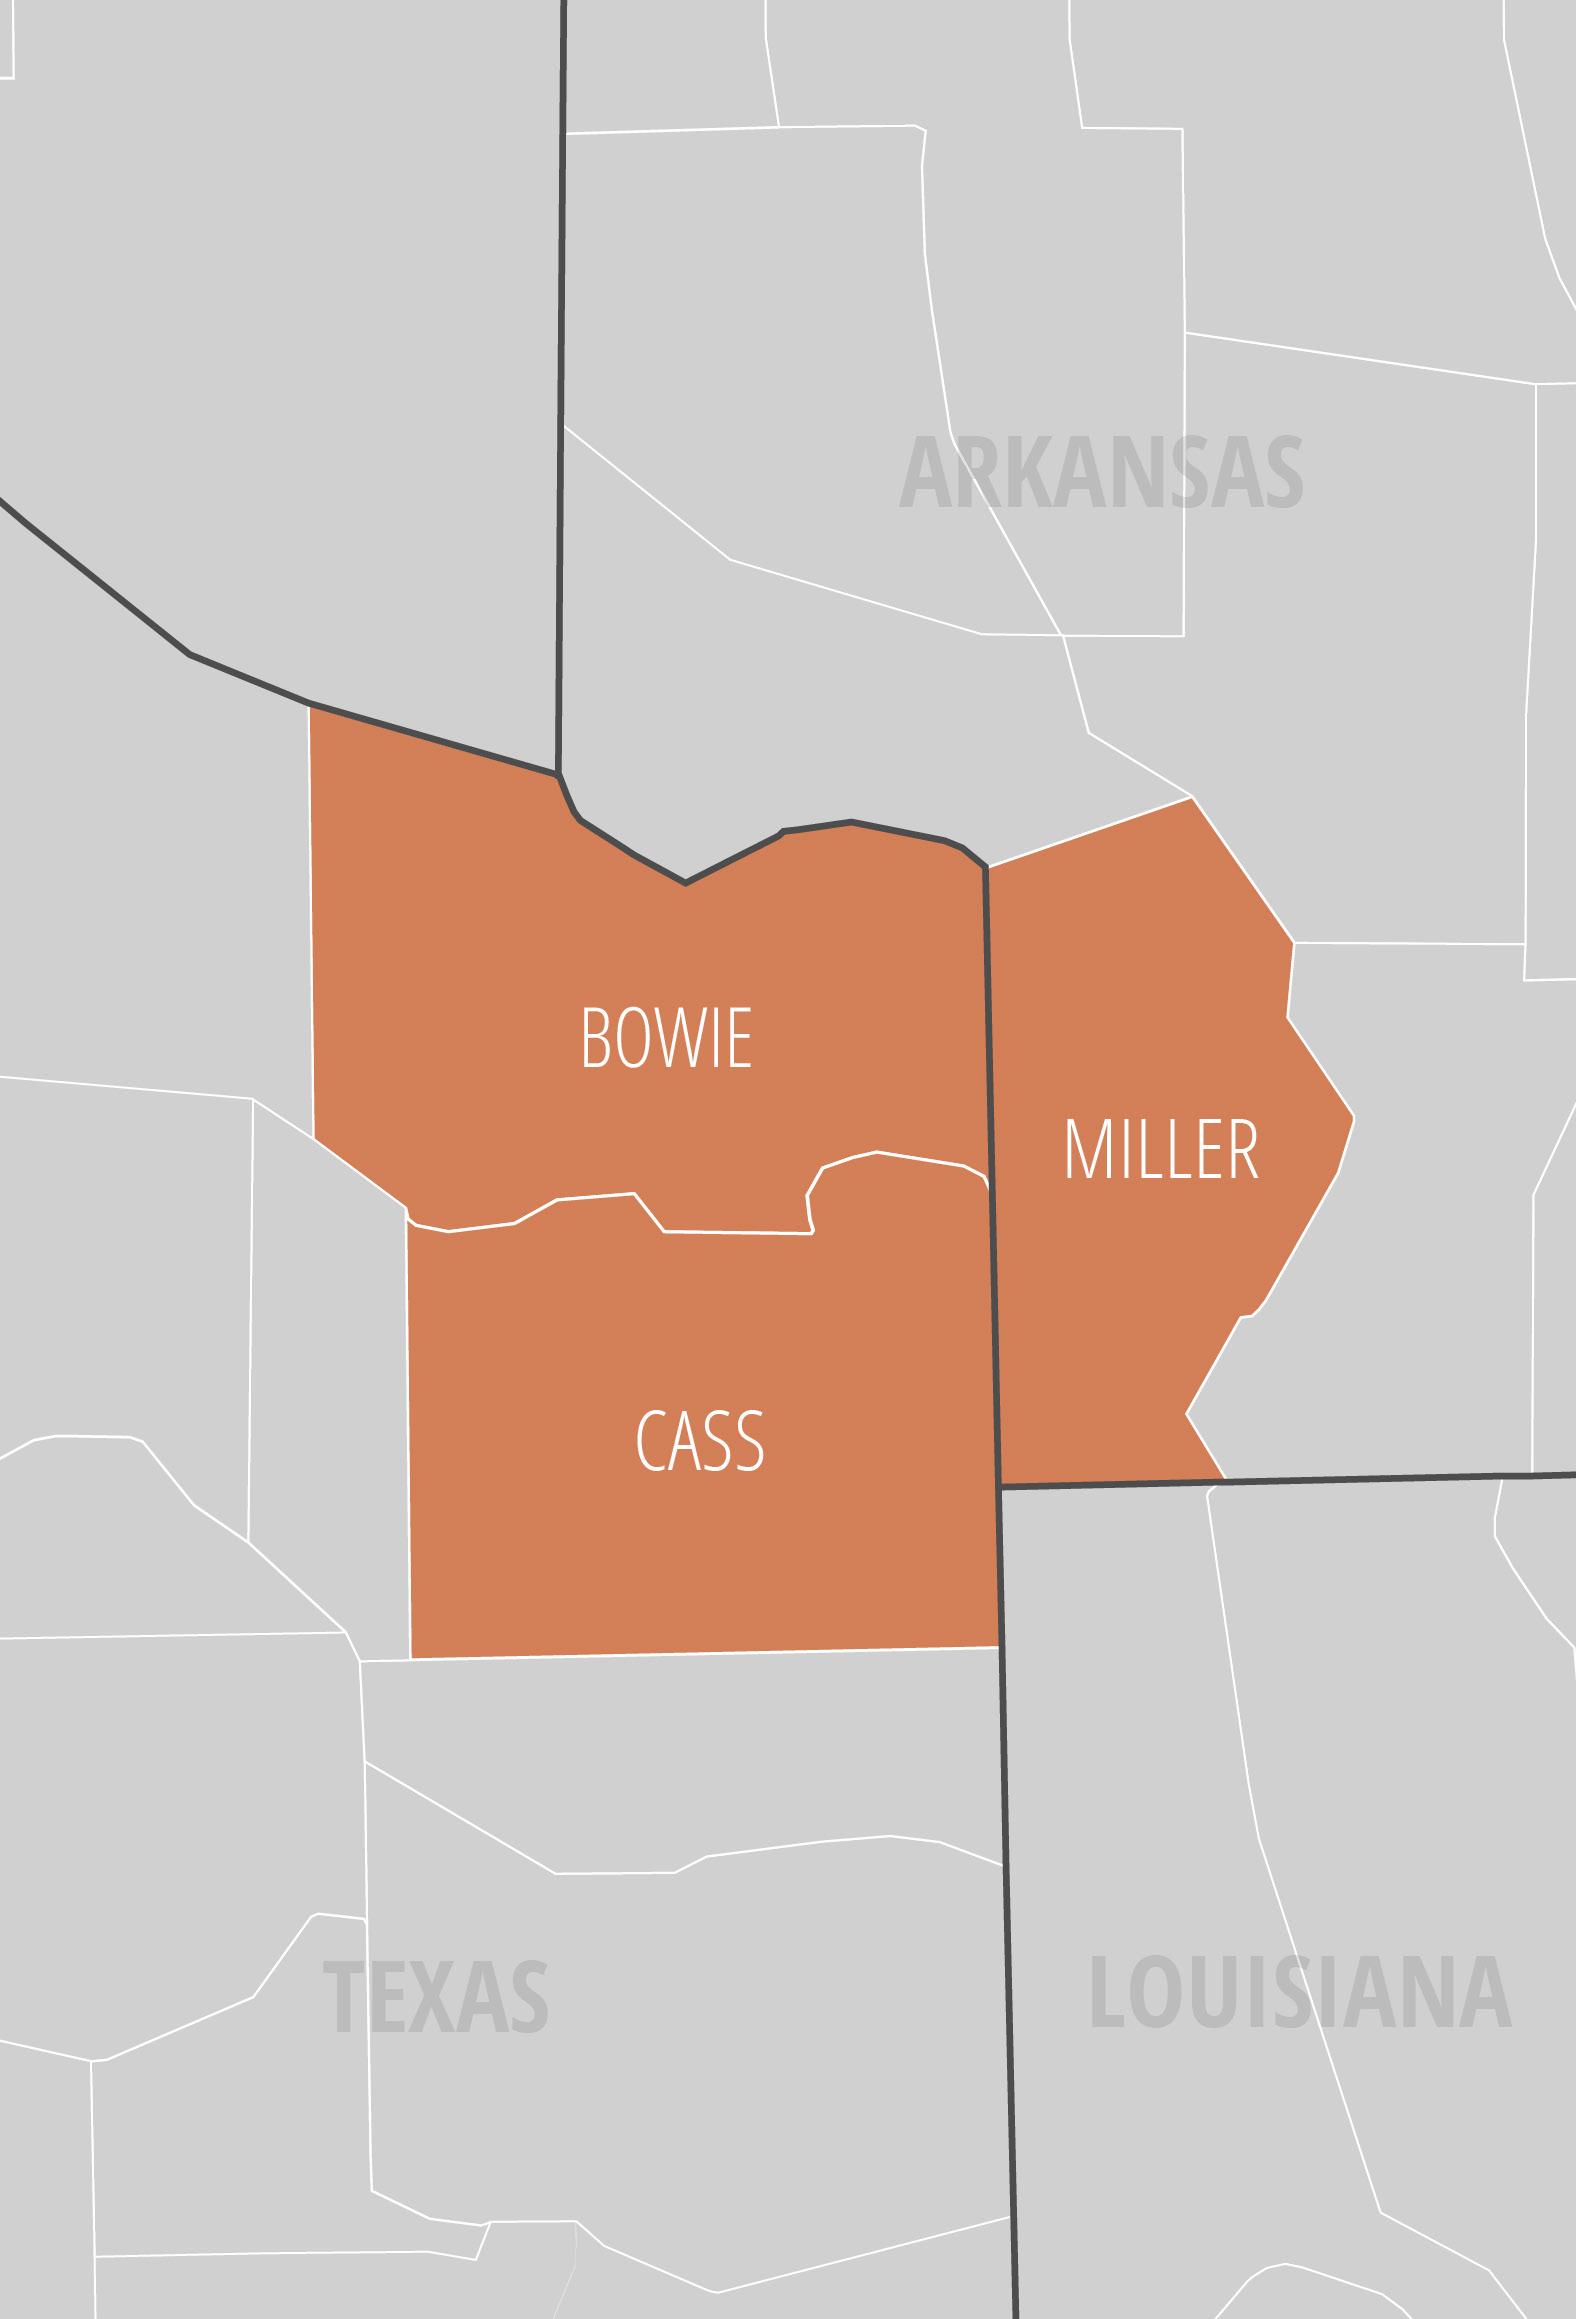
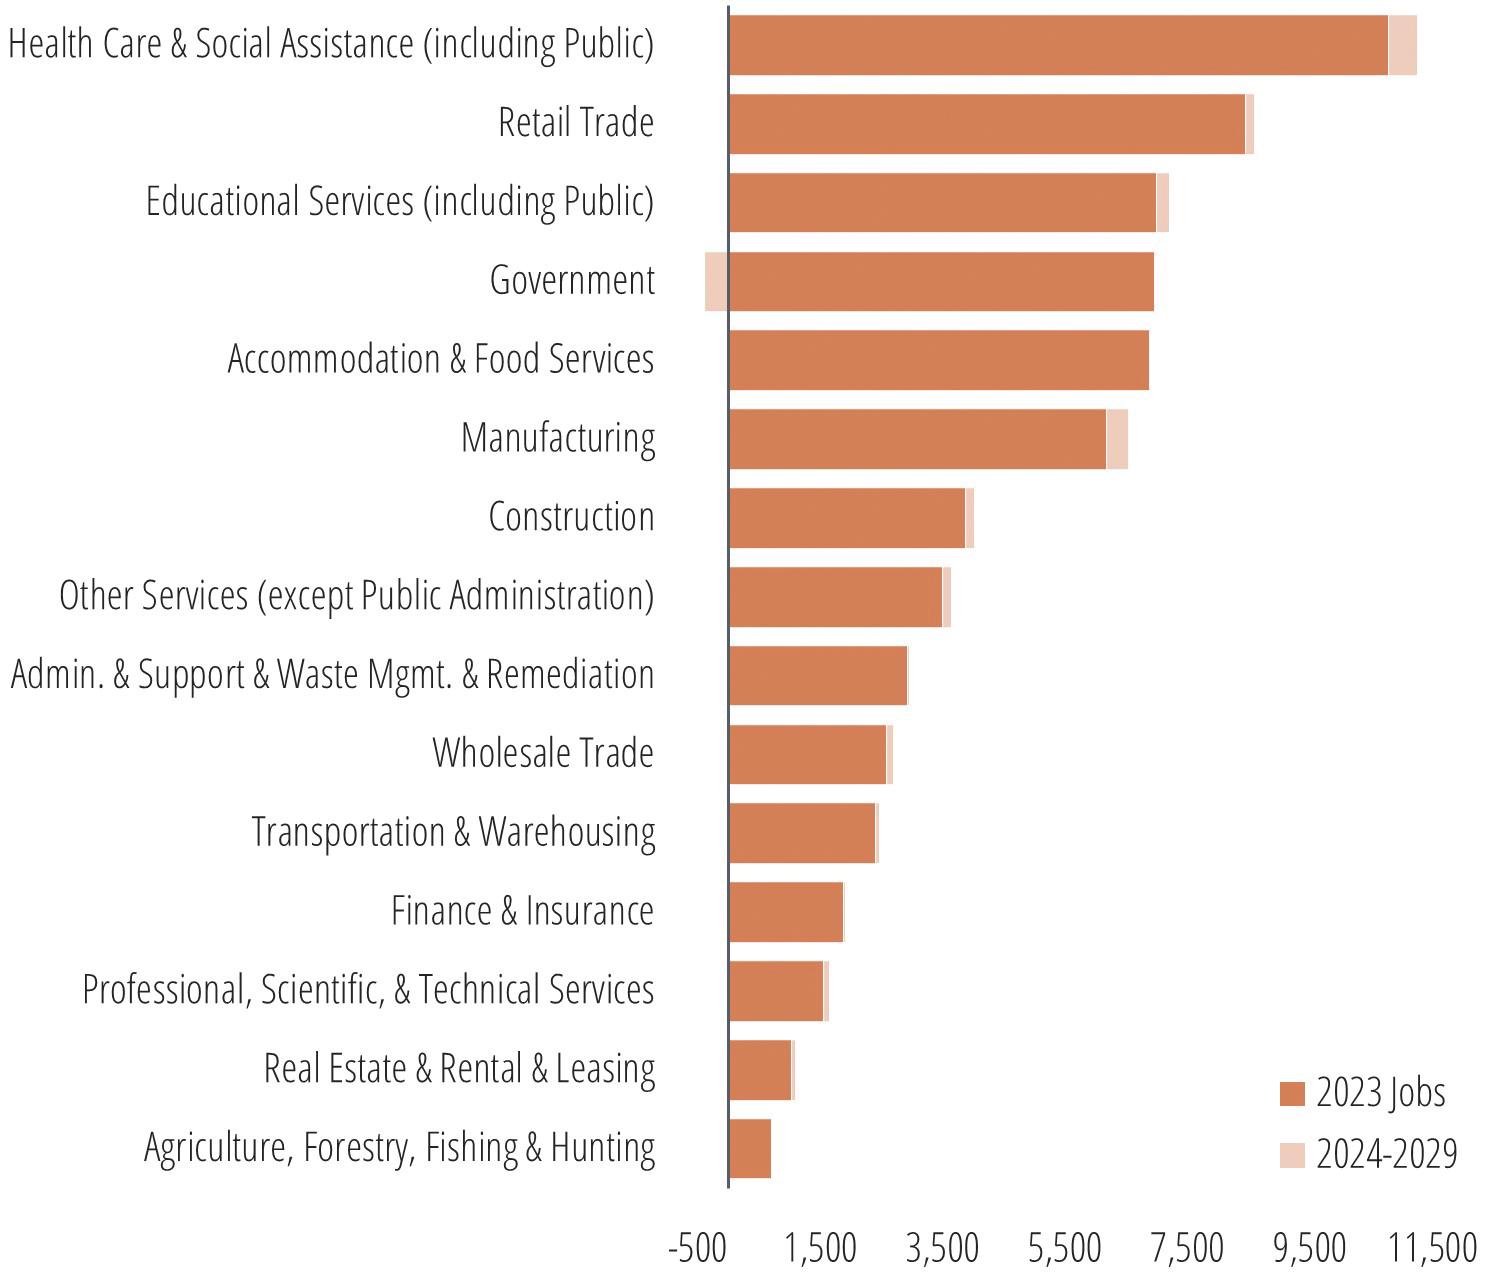
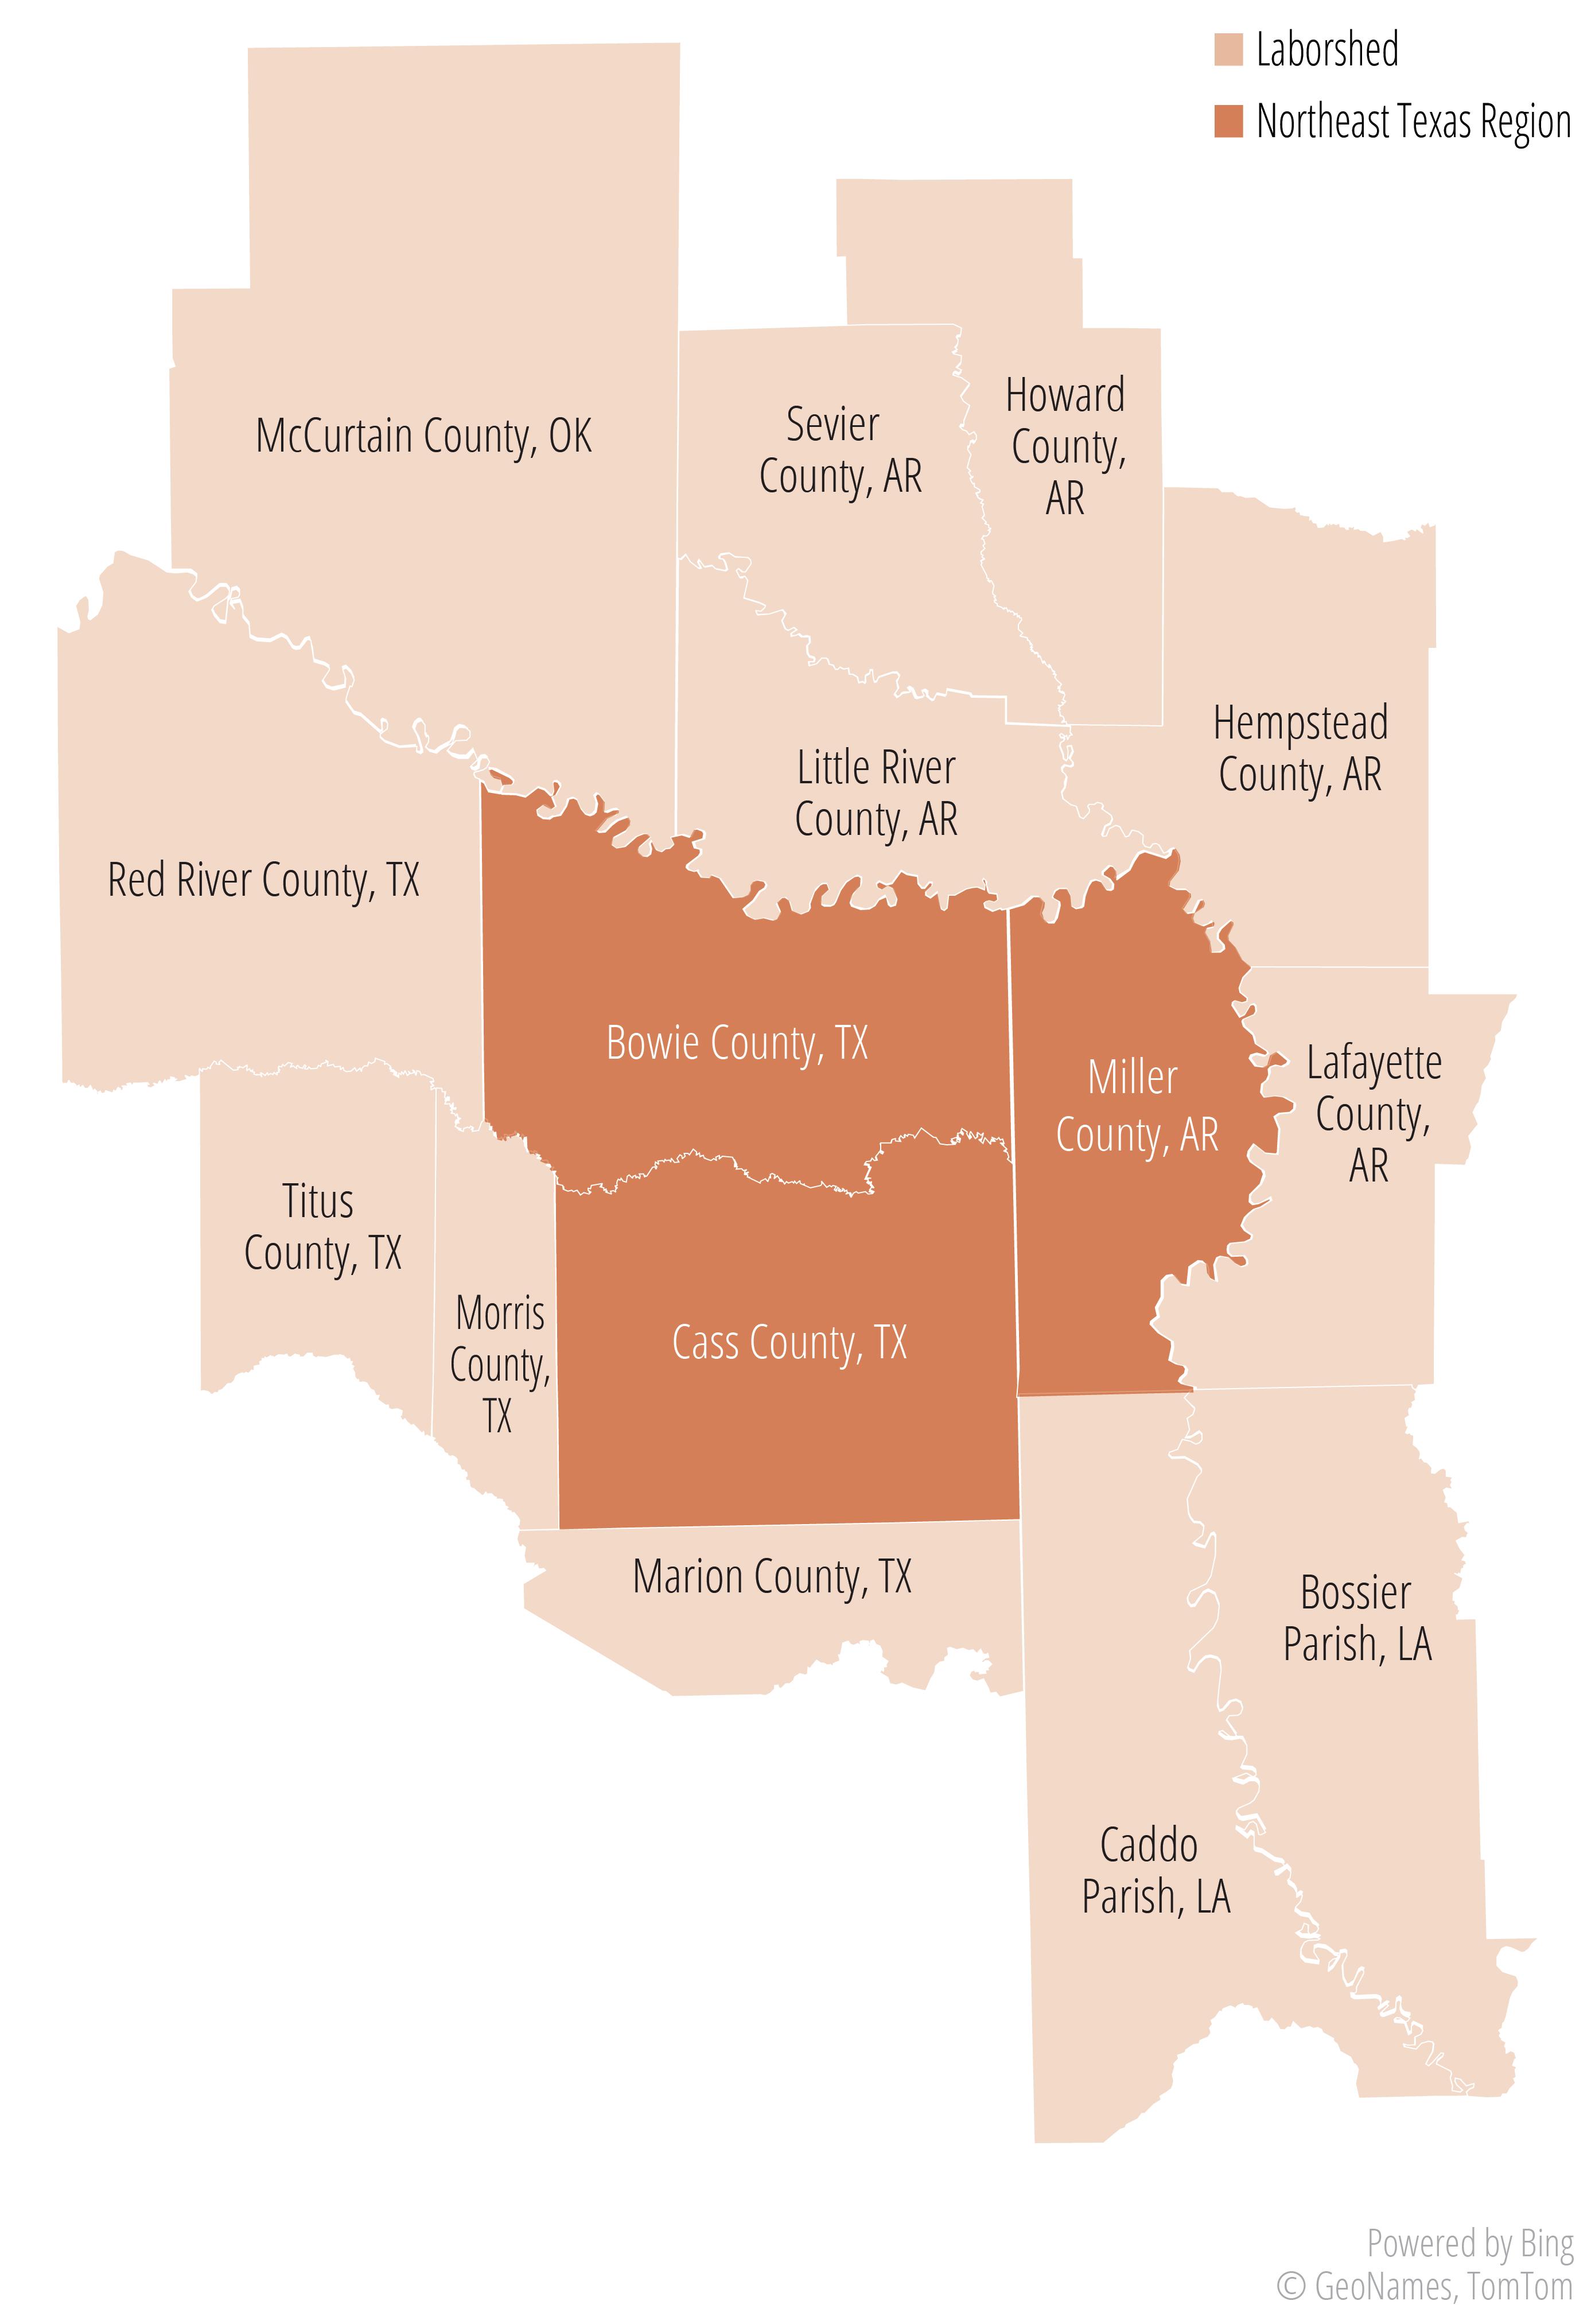
Economy. The Northeast Texas region, which includes Texarkana and Bowie, Cass, and Miller counties, has an employment base of approximately 68,000 jobs and is expected to have more than 42,000 job openings between 2024 and 2029. The industry sectors that employ the largest number of workers are health care, retail trade, and education. Over the next five years, health care and manufacturing are expected to be key sources of growth while the government sector is expected to contract. The high-demand, high-wage occupations with the greatest number of openings include a range of jobs in health care, education, business and operations, and transportation.
Labor shed. The Northeast Texas region attracts labor from a wide area. Within a 45-minute drive is a labor force of over 300,000. Approximately half of the population 25 years and older in the labor shed area has attained at least some degree of postsecondary education.
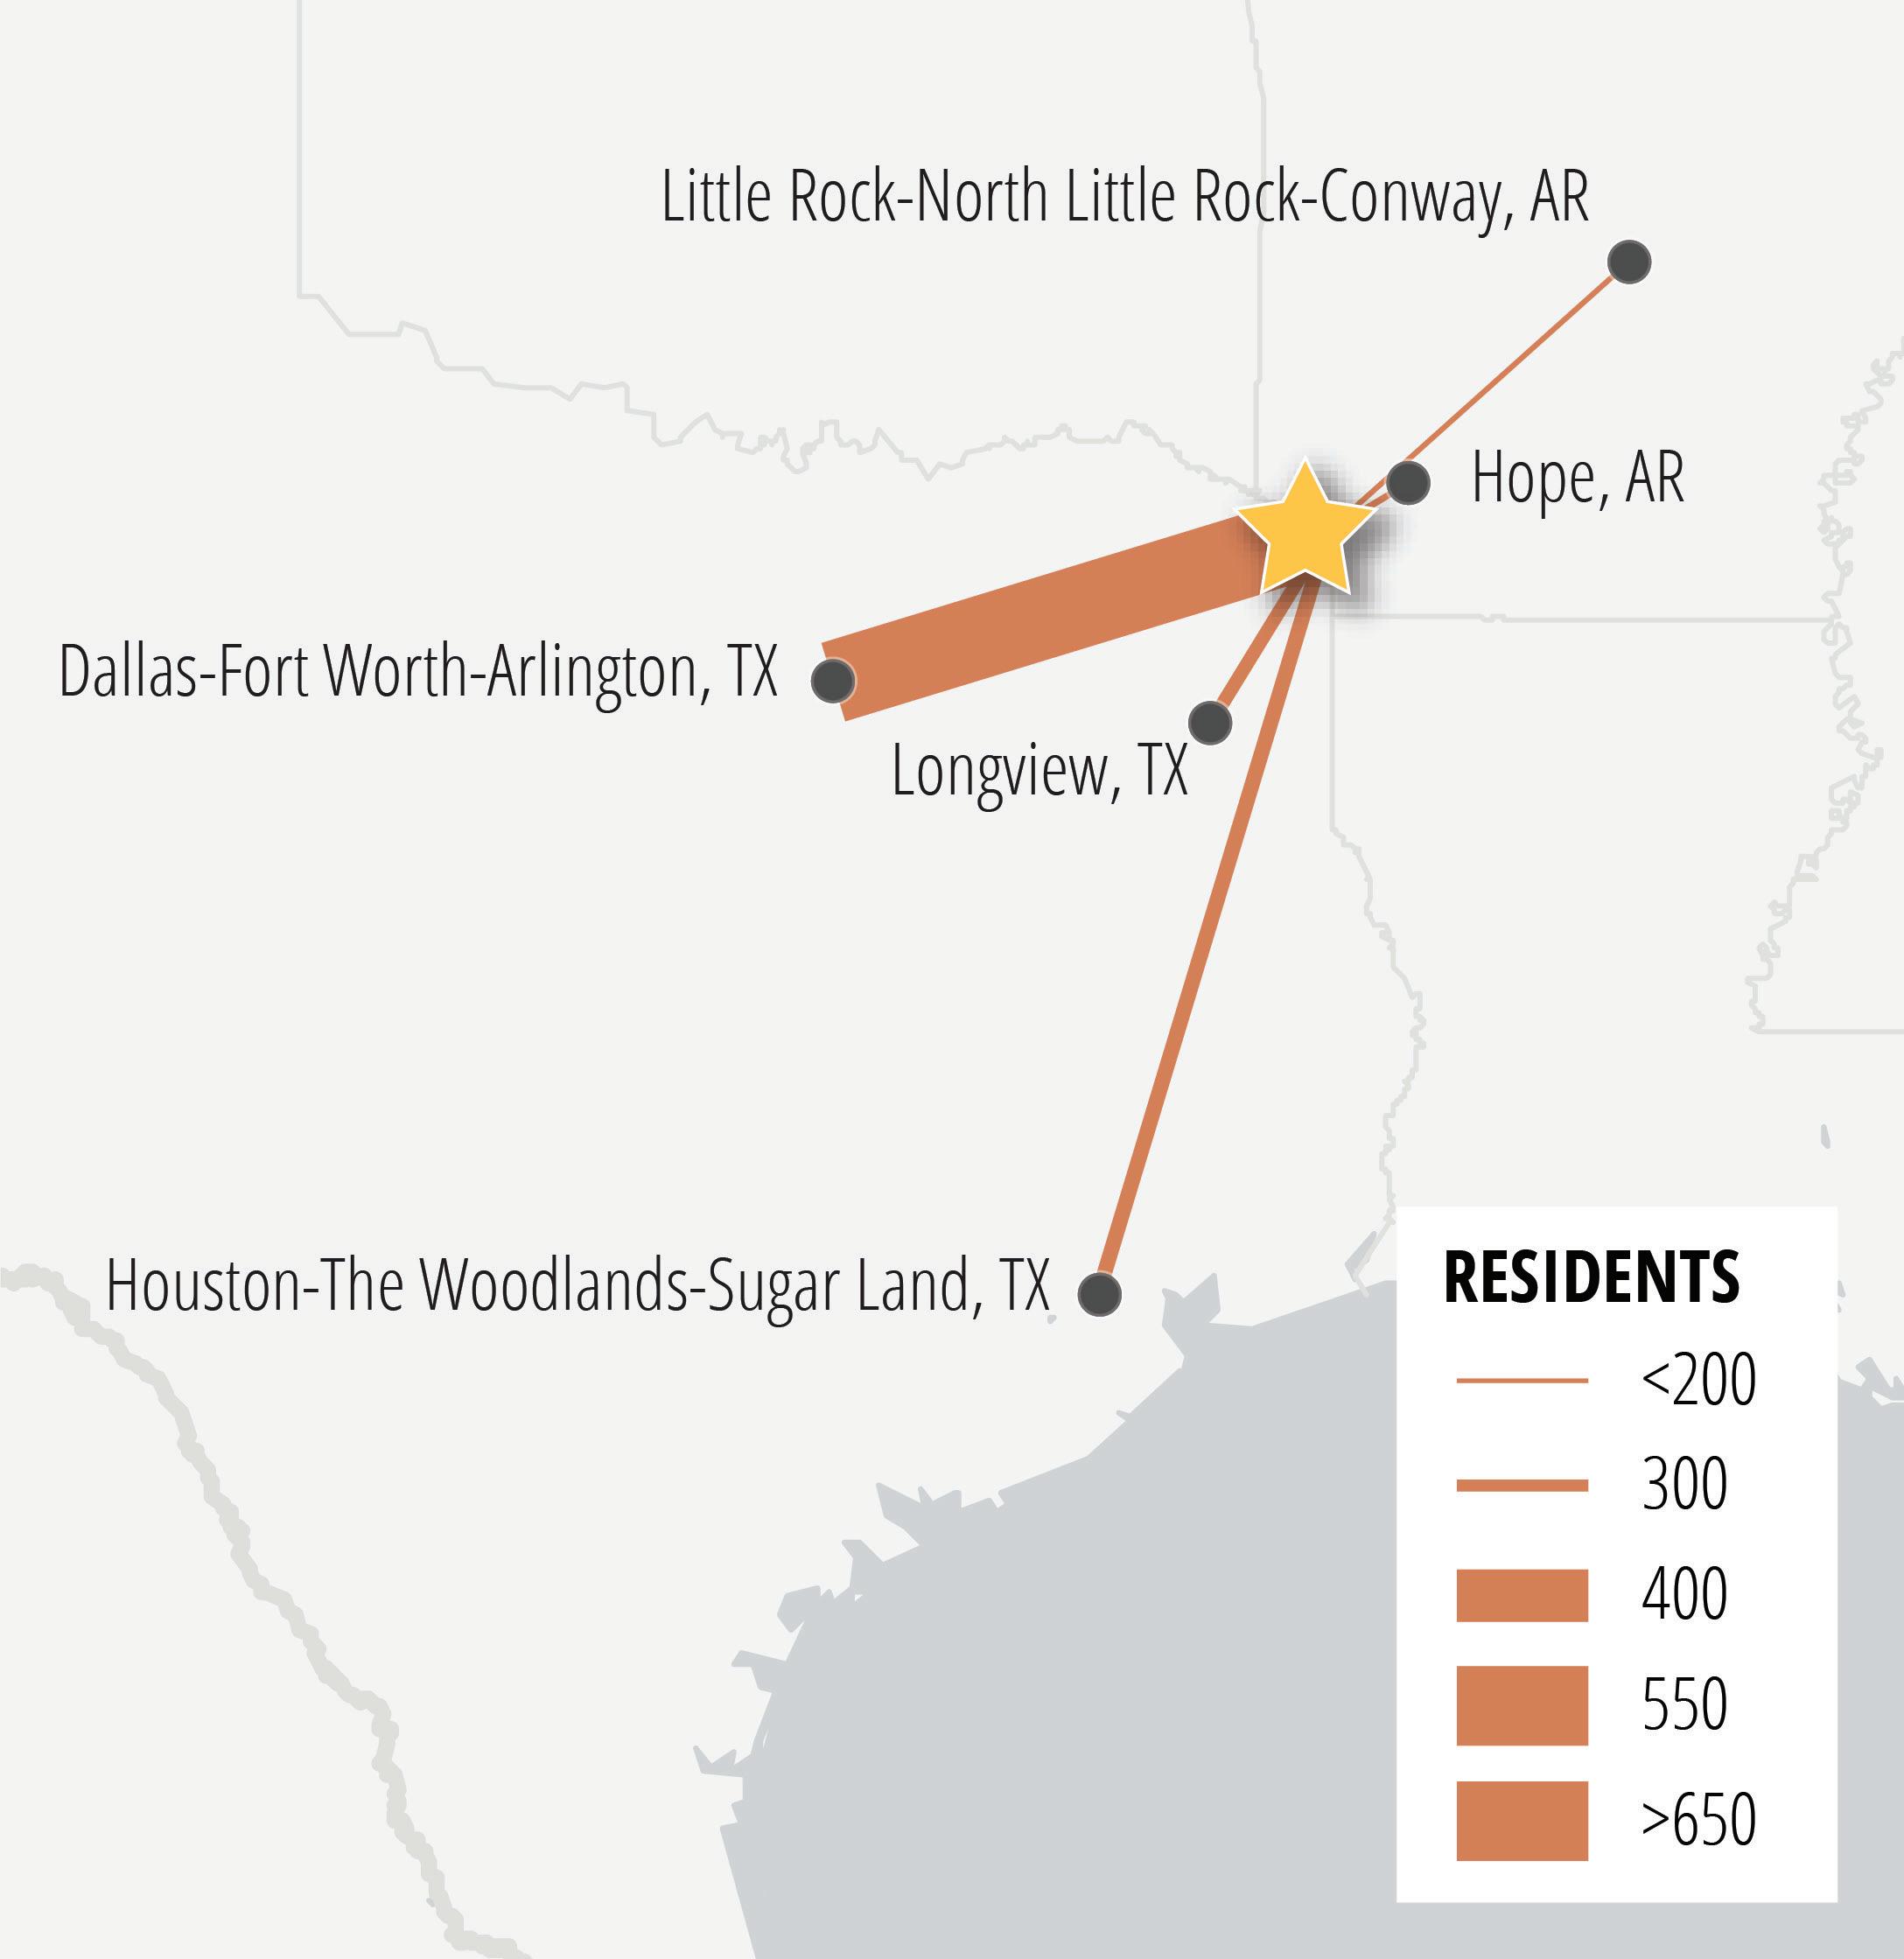
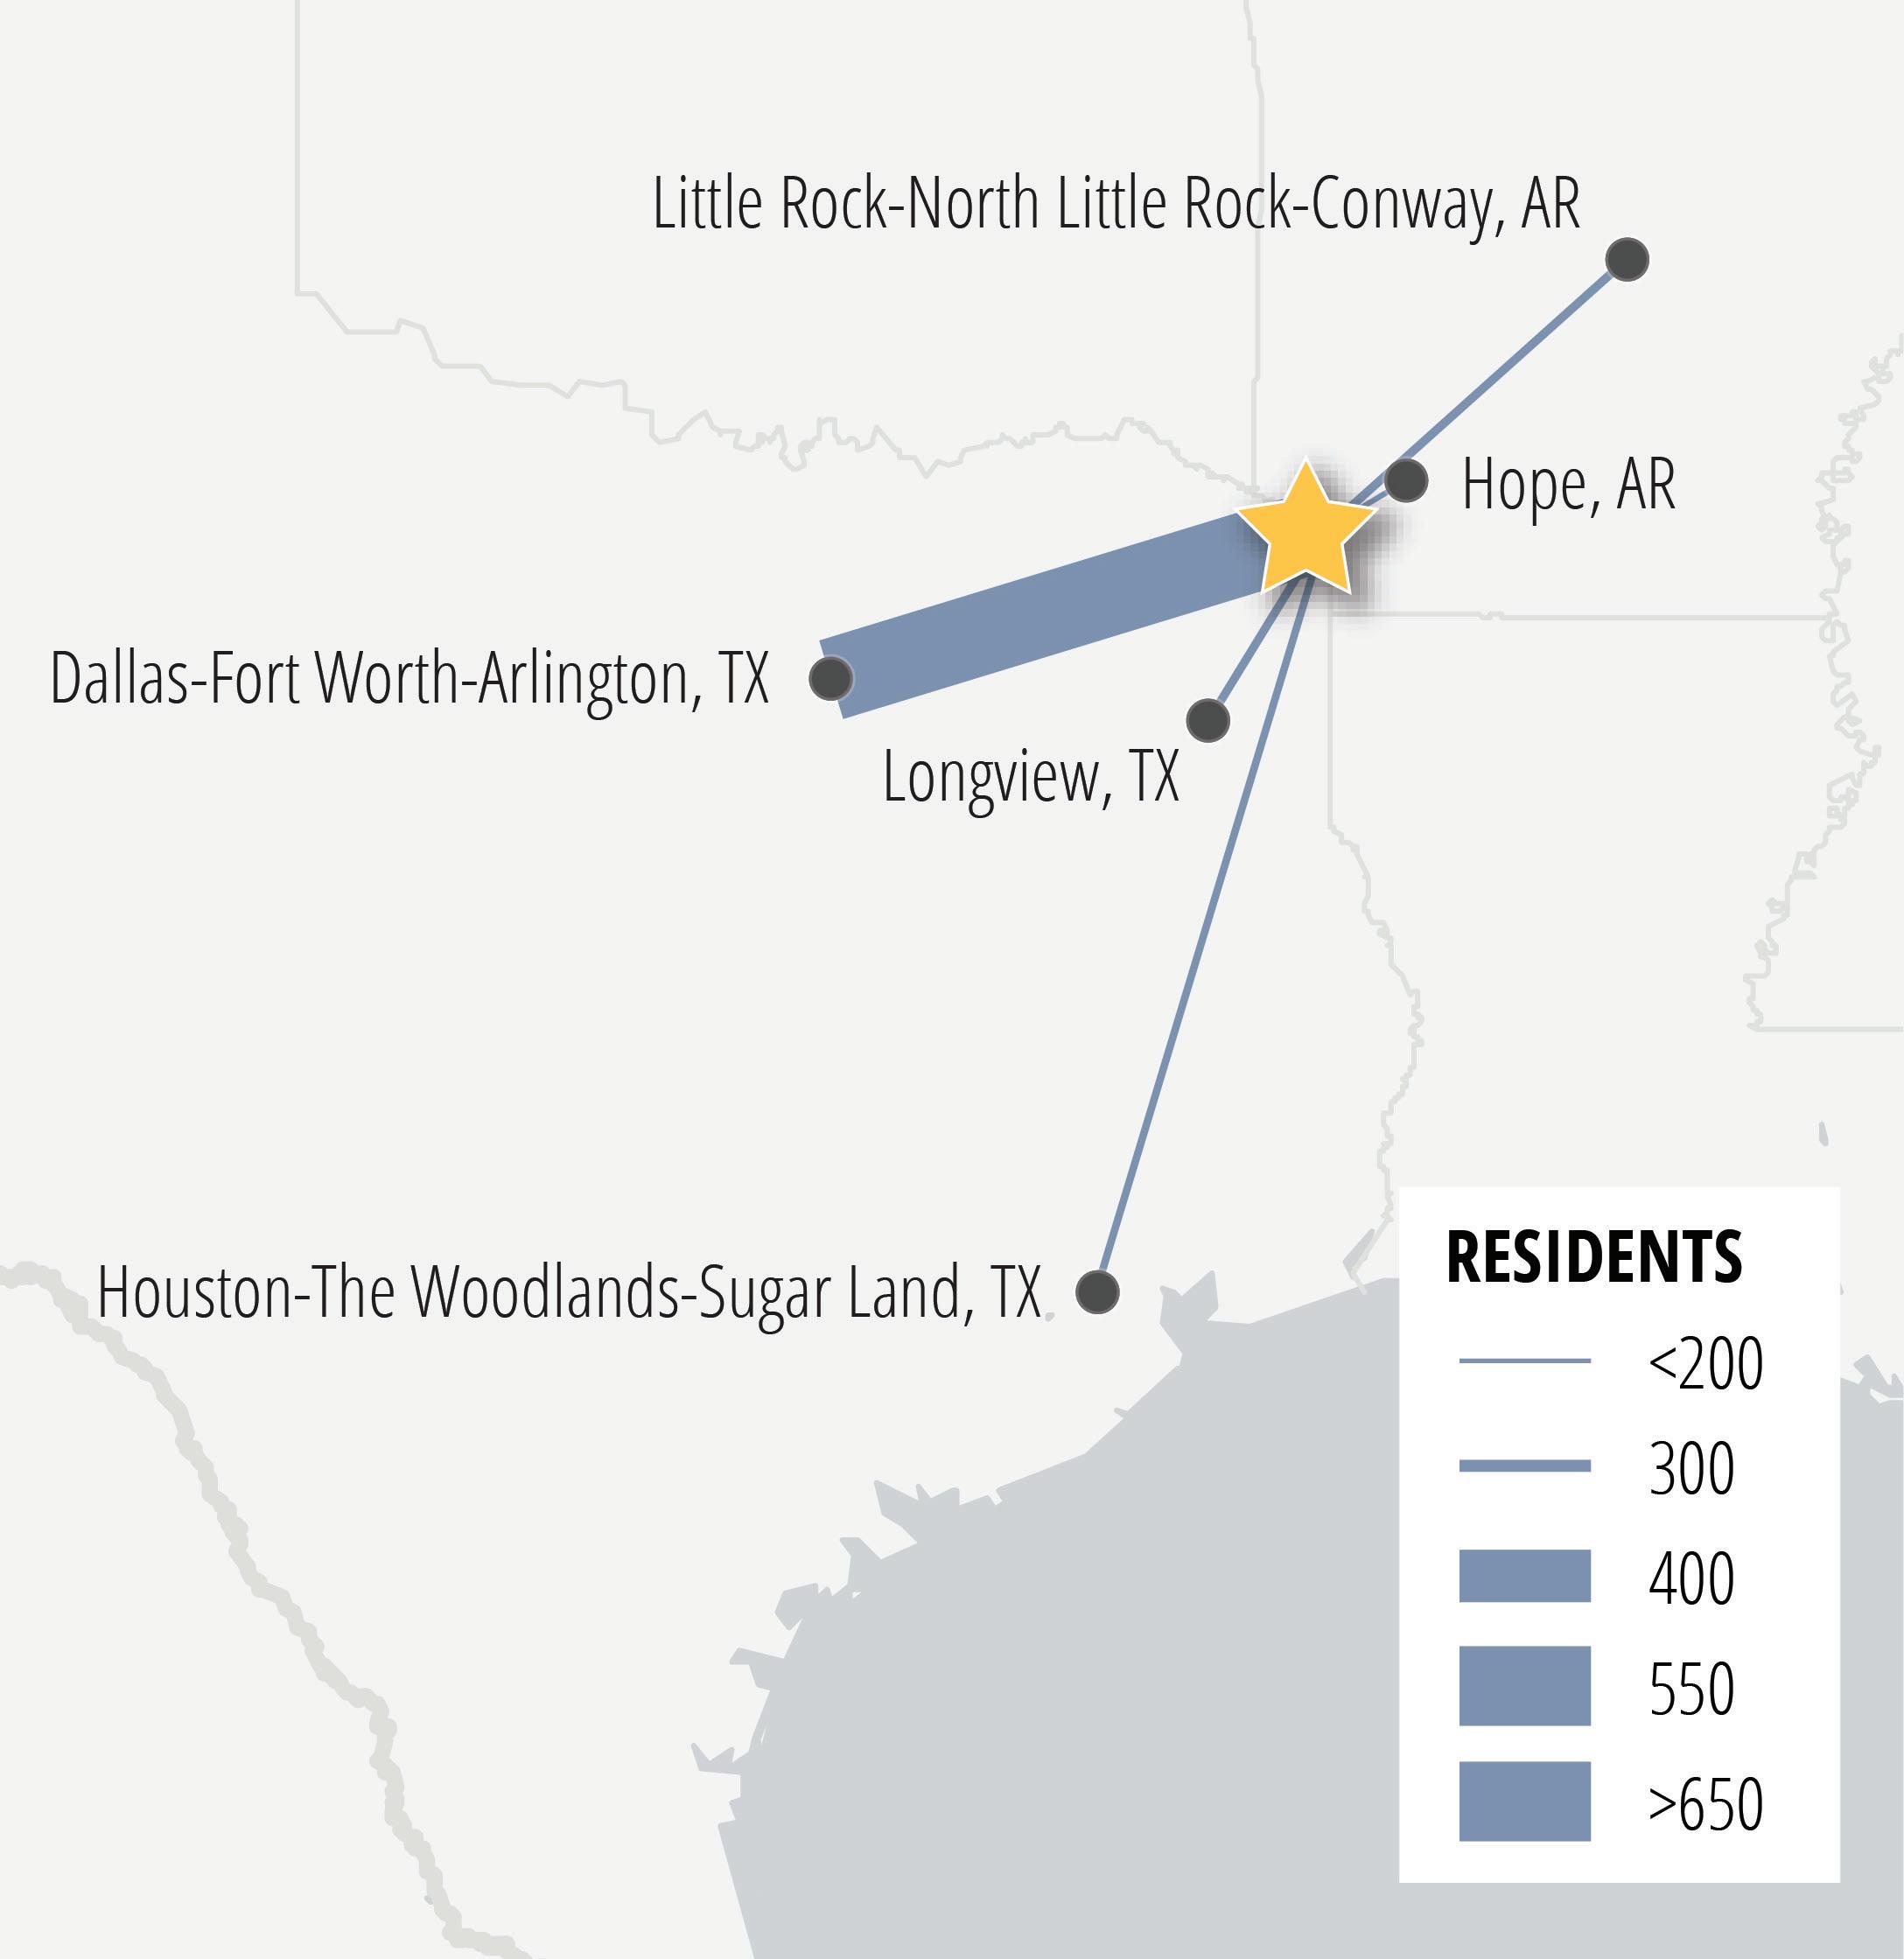
Resident linkages. The region has very strong connections with the Dallas-Fort Worth-Arlington metropolitan area, which is both the largest source of residents moving to the Northeast Texas region and the largest destination for residents moving away from the region. Houston, Little Rock, Longview, and Hope are also major sources and destinations for residents moving into and out of the region.
Employment situation. Although it did not lose as many jobs as the US during the pandemicrelated economic downturn in 2020, the region remains 2 percent below its 2019 level of employment. While the region gained many jobs in manufacturing and construction between 2019 and 2023, it lost more jobs in the transportation and warehousing and government sectors.
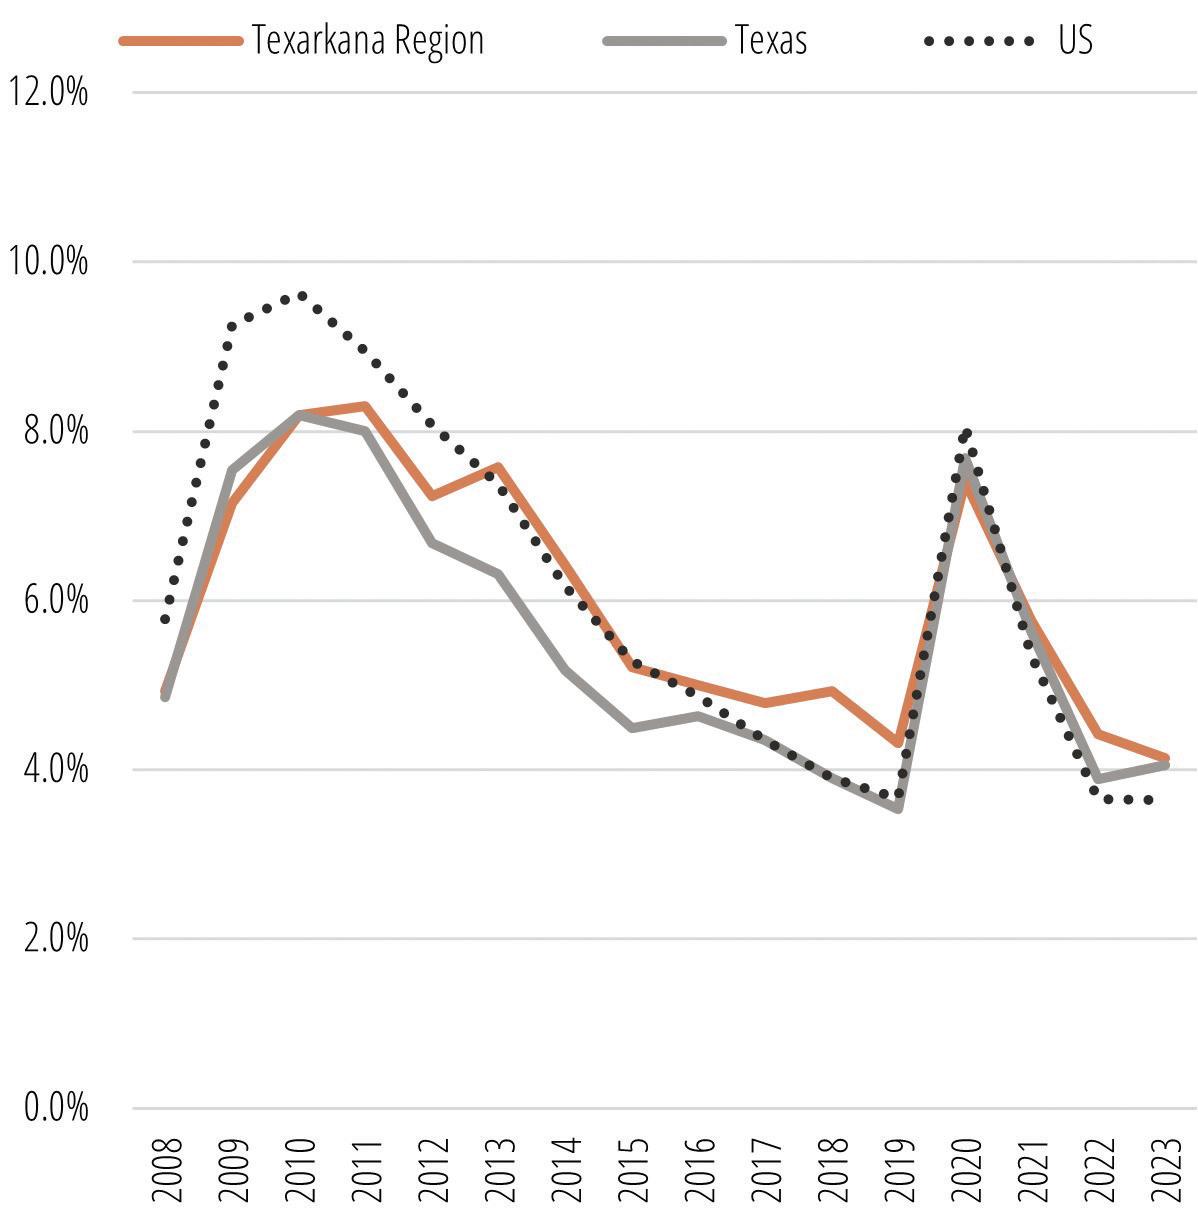
Labor market performance. The regional labor force has also not recovered to its 2019 level. In 2023, there were 2 percent fewer workers in the region than in 2019. At the same time, the unemployment rate in the region is 4.1 percent, which is lower than it was before the pandemic.
High-demand, high-wage occupations. Very few of the top 25 highest-demand occupations require postsecondary training or earn a living wage. Beyond the top 25, however, there are a variety of high-demand occupations that earn more than the regional living wage of $18.57. The occupational clusters that have the largest number of occupations that are high-demand and earn living wages are education; installation, maintenance, and repair; and production.
NORTHEAST TEXAS ECONOMIC AND LABOR MARKET UPDATE 1
Figure 1. COuNTieS
162,761
68,783
42,148
Figure 2. eMPLOYMeNT BY iNDuSTrY + NeXT 5-YeAr CHANge
NORTHEAST TEXAS ECONOMIC AND LABOR MARKET UPDATE 2 T.L.L. TEMPLE FOUNDATION
SUMMARY STATISTICS
Figure 3. KeY STATiSTiCS
Population (2023) -0.7% Population Change (2020-2023)
Jobs (2023)
Openings
TOP
JOBS* OCCUPATION OPENINGS (2024-2029) 1. General & Operations Managers 876 2. Heavy & Tractor-Trailer Truck Drivers 759 3. Registered Nurses 410 4. Elementary School Teachers, Except Special Education 312 5. Licensed Practical & Licensed Vocational Nurses 271 6. Secondary School Teachers, Except Special & Career/Technical Education 235 7. Automotive Service Technicians & Mechanics 221 8. Business Operations Specialists, All Other 207 9. Postsecondary Teachers 194 10. Middle School Teachers, Except Special & Career/Technical Education 193 11. Accountants & Auditors 170 12. Medical & Health Services Managers 132 13. Managers, All Other 130 14. Clergy 116 15. Human Resources Specialists 112 * Includes only occupations that pay at least a living wage of $18.57 and require postsecondary education. Sources: US Census Bureau, and Lightcast 2024.1 – QCEW Employees, Non-QCEW Employees, and Self-Employed.
(2024-2029) Figure 4.
HigH-DeMAND, HigH-WAge
LABORSHED STATISTICS
Figure 5. KeY LABOrSHeD STATiSTiCS
301,758
Labor Force (2023) -0.3%
Change in Labor Force (2019-2023) 3.9%
Unemployment Rate (2023 average)
Figure 7. eDuCATiONAL ATTAiNMeNT OF LABOrSHeD
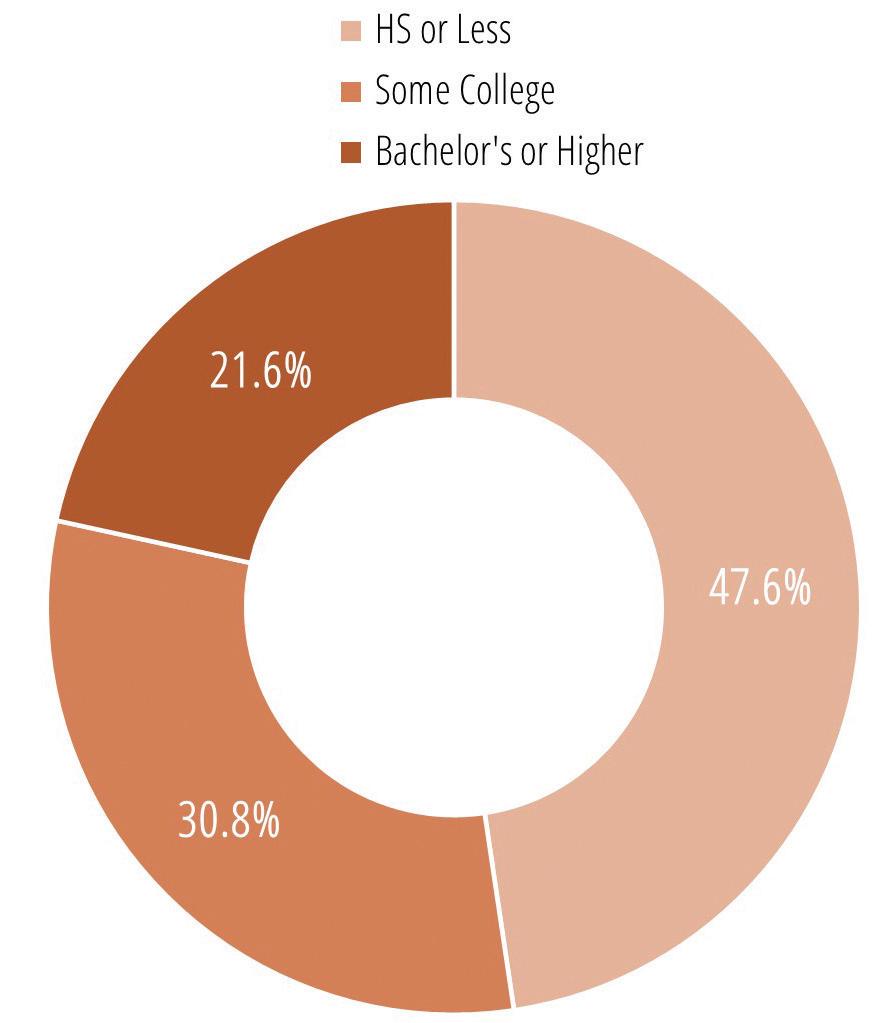
Figure 6. LABOrSHeD DeFiNiTiON (45-MiNuTe LABOrSHeD)
Source: US Bureau of Labor Statistics, US Census Bureau; 2022 ACS 5-year Estimates; and VisionFirst Advisors for AR-TX REDI
NORTHEAST TEXAS ECONOMIC AND LABOR MARKET UPDATE 3 T.L.L. TEMPLE FOUNDATION
RESIDENT INFLOWS/OUTFLOWS
Figure 8. MAP OF TOP SOurCeS AND DeSTiNATiONS FOr reSiDeNTS
Sources Top Destinations
Sources: IRS Migration Data via Lightcast.
NORTHEAST TEXAS ECONOMIC AND LABOR MARKET UPDATE 4 T.L.L. TEMPLE FOUNDATION
TO/FrOM
MOViNg
NOrTHeAST TeXAS, 2021 Top
FOr reSiDeNTS MOViNg TO/FrOM NOrTHeAST TeXAS, 2021 METROPOLITAN AREA INBOUND OUTBOUND NET FLOW Total Inflows/Outflows 5,815 5,004 812 TOP FIVE SOURCES OF RESIDENTS FROM NORTHEAST TEXAS 1. Dallas-Fort Worth-Arlington, TX 678 767 -89 2. Houston-The Woodlands-Sugar Land, TX 257 212 45 3. Longview, TX 247 217 30 4. Hope, AR 207 135 72 5. Little Rock-North Little Rock-Conway, AR 168 218 -50 TOP FIVE DESTINATIONS FOR RESIDENTS TO NORTHEAST TEXAS 1. Dallas-Fort Worth-Arlington, TX 678 767 -89 2. Little Rock-North Little Rock-Conway, AR 168 218 -50 3. Longview, TX 247 217 30 4. Houston-The Woodlands-Sugar Land, TX 257 212 45 5. Hope, AR 207 135 72
Figure
9. TOP SOurCeS AND DeSTiNATiONS
EMPLOYMENT SITUATION
Figure 10. TOTAL eMPLOYMeNT (2008-2023)
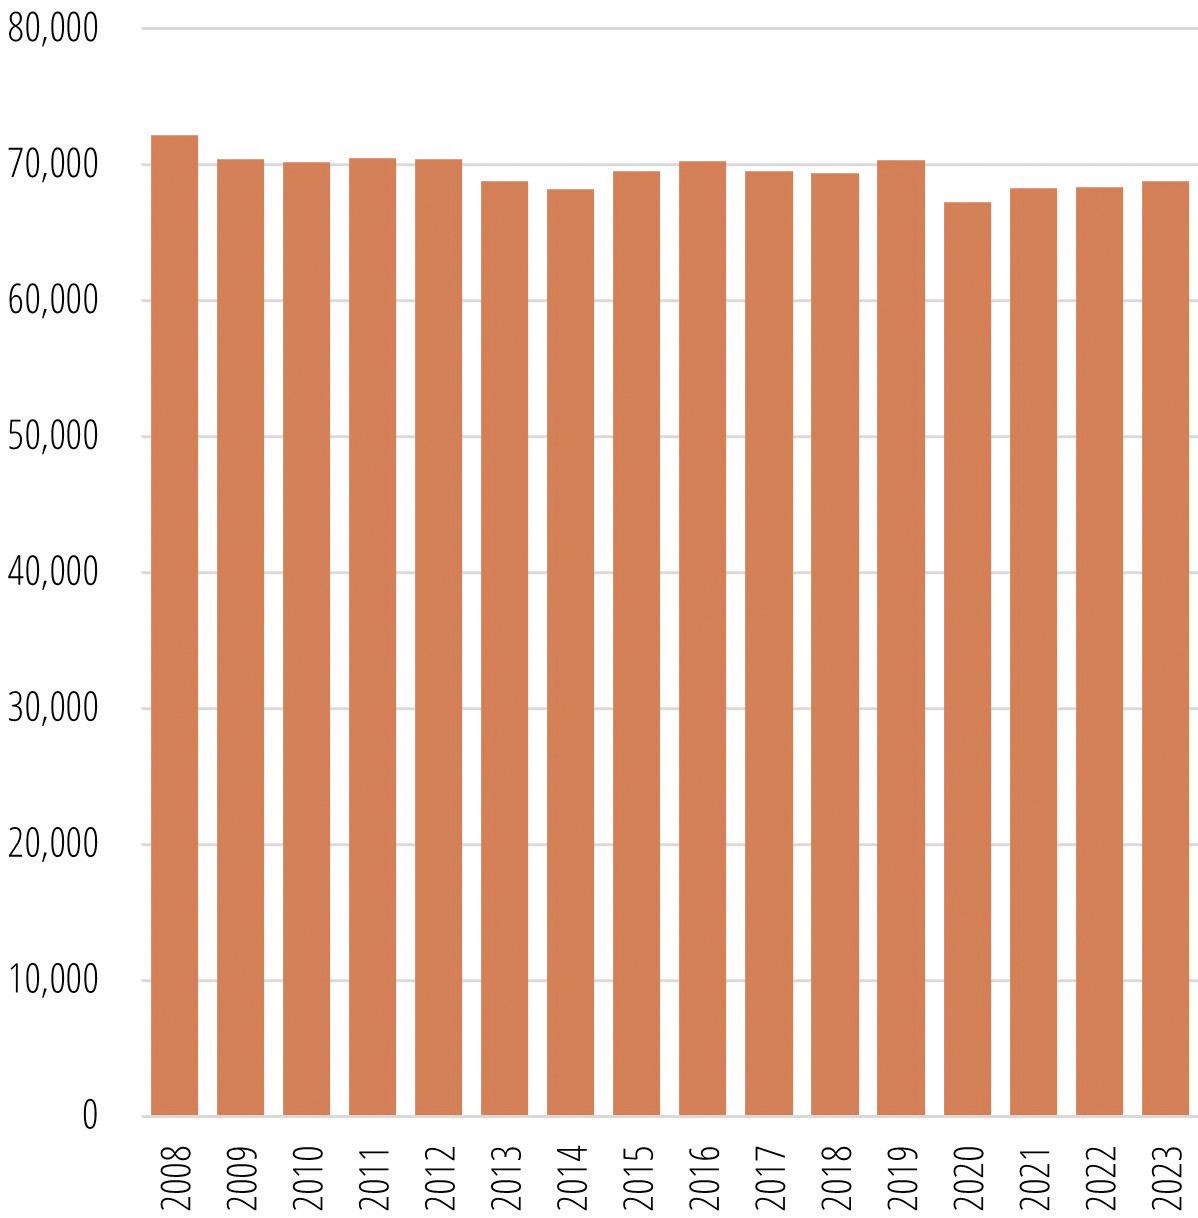
Figure 11. COMPArATiVe eMPLOYMeNT grOWTH (2008-2023)
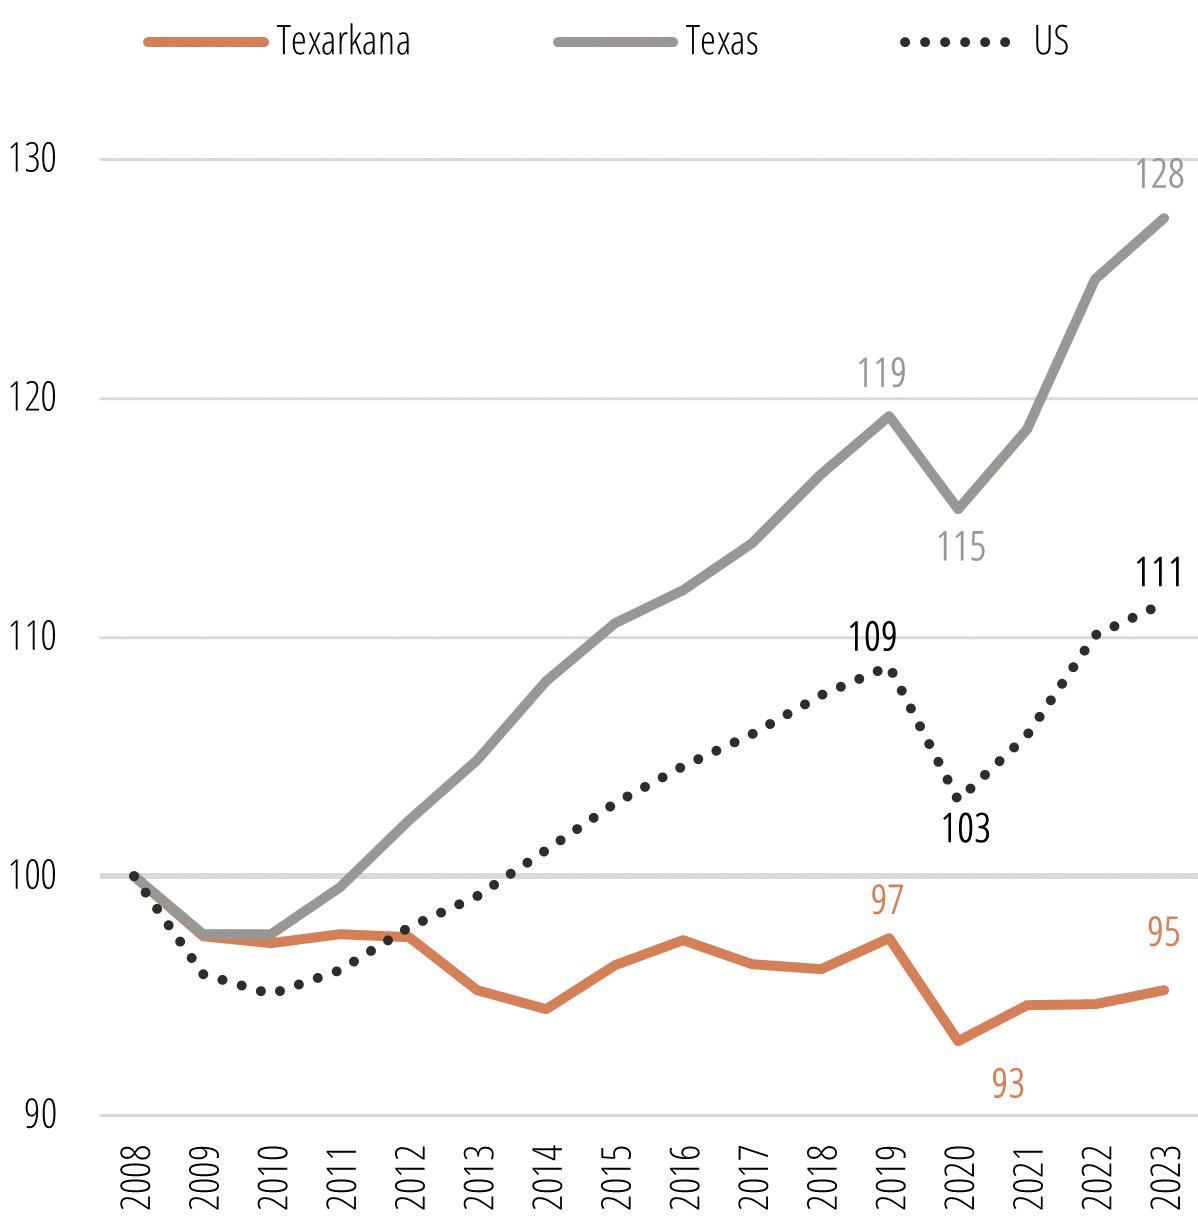
Figure 12. eMPLOYMeNT CHANge BY iNDuSTrY, 2014-2019, 2019-2023
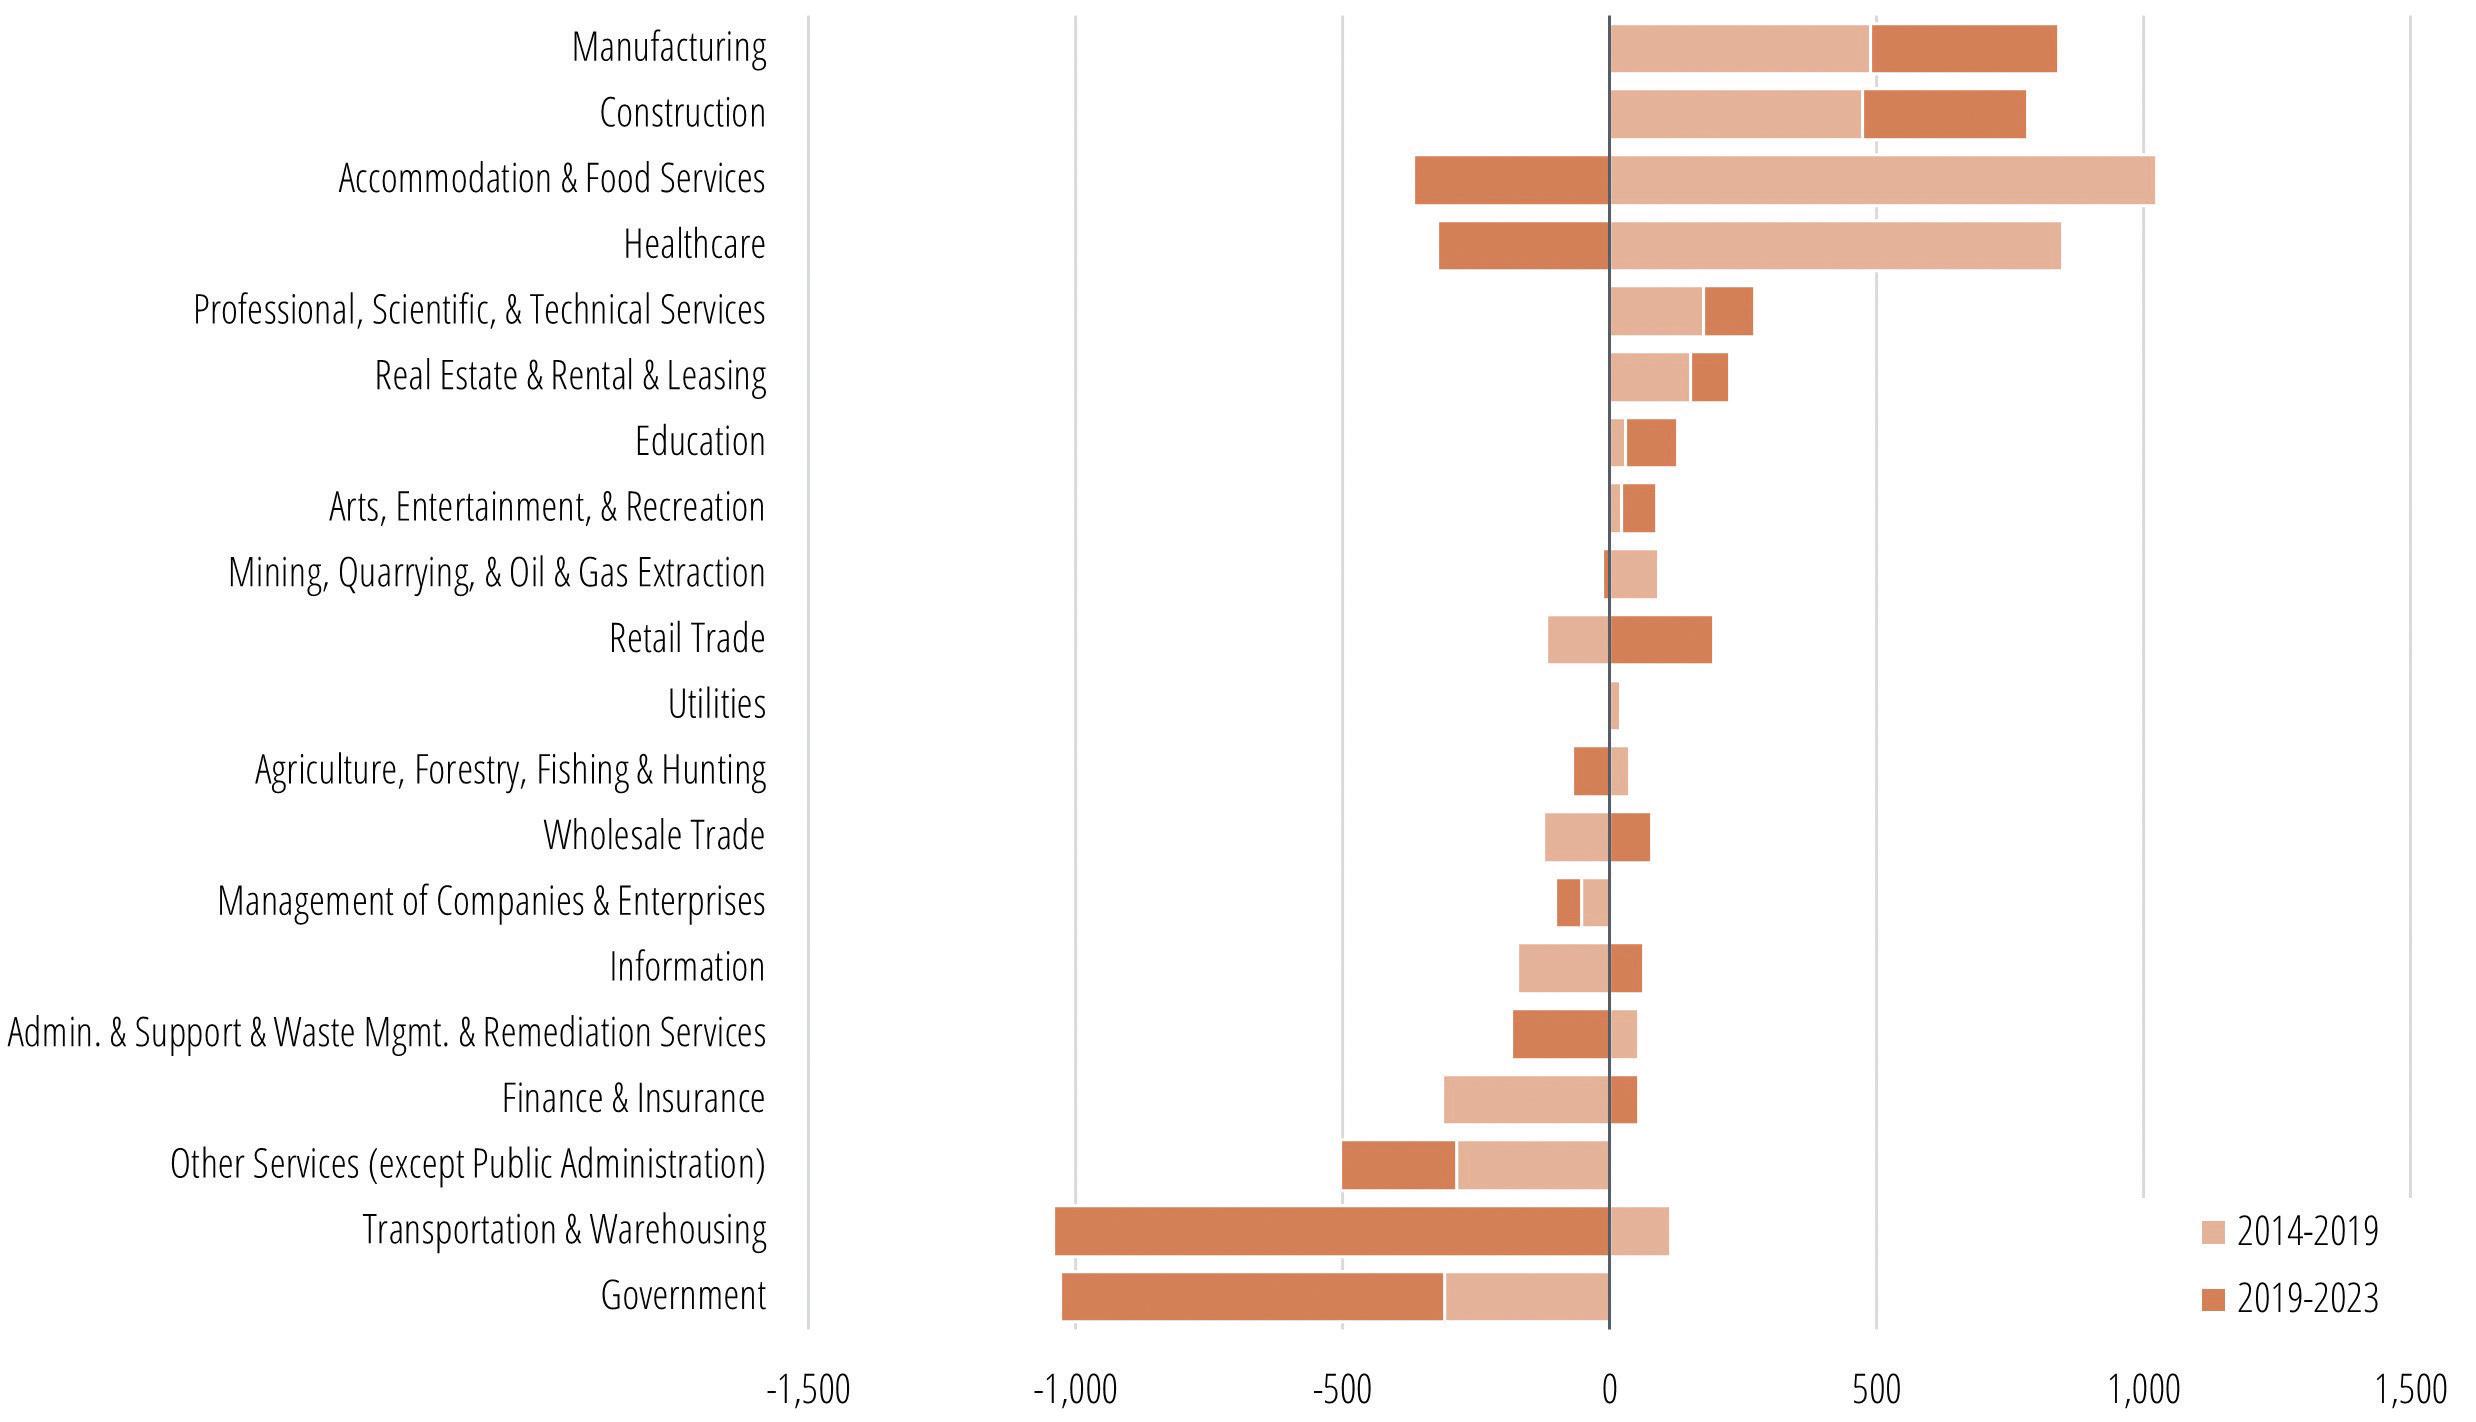
Sources: Lightcast 2024.1 – QCEW Employees, Non-QCEW Employees, and Self-Employed.
NORTHEAST TEXAS ECONOMIC AND LABOR MARKET UPDATE 5 T.L.L. TEMPLE FOUNDATION
LABOR MARKET PERFORMANCE
13. CiViLiAN LABOr FOrCe, 2008-2023
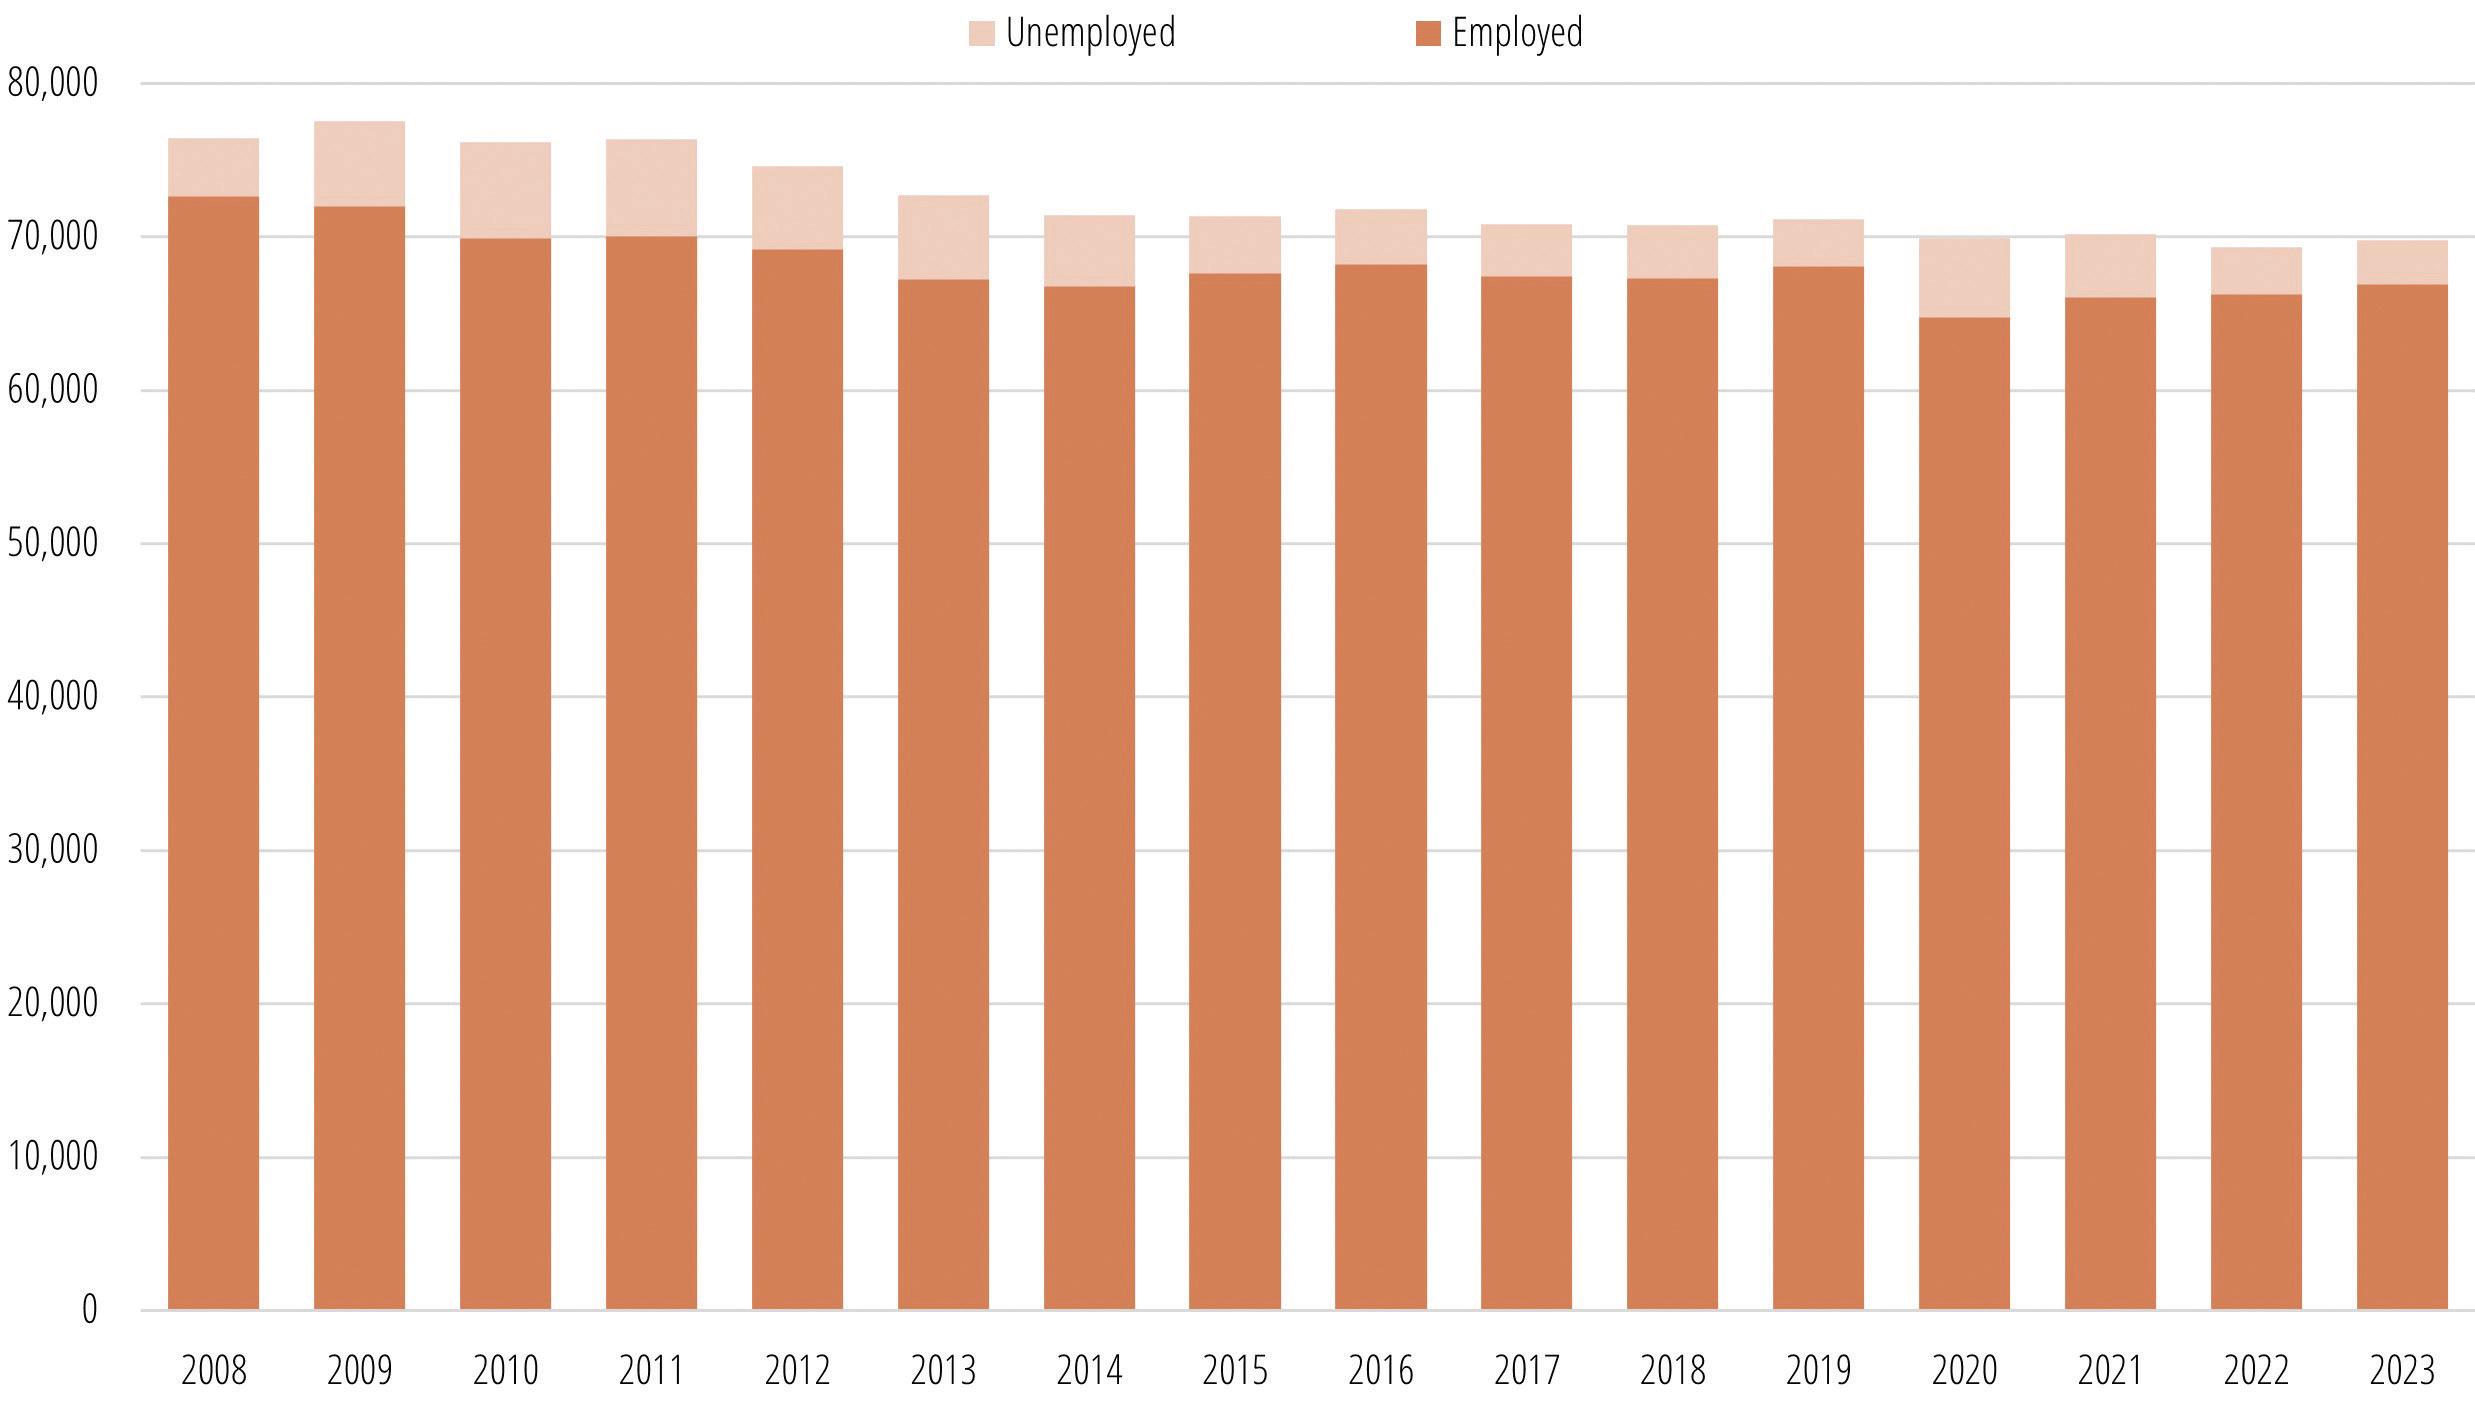
Source: US Bureau of Labor Statistics.
NORTHEAST TEXAS ECONOMIC AND LABOR MARKET UPDATE 6 T.L.L. TEMPLE FOUNDATION
Figure
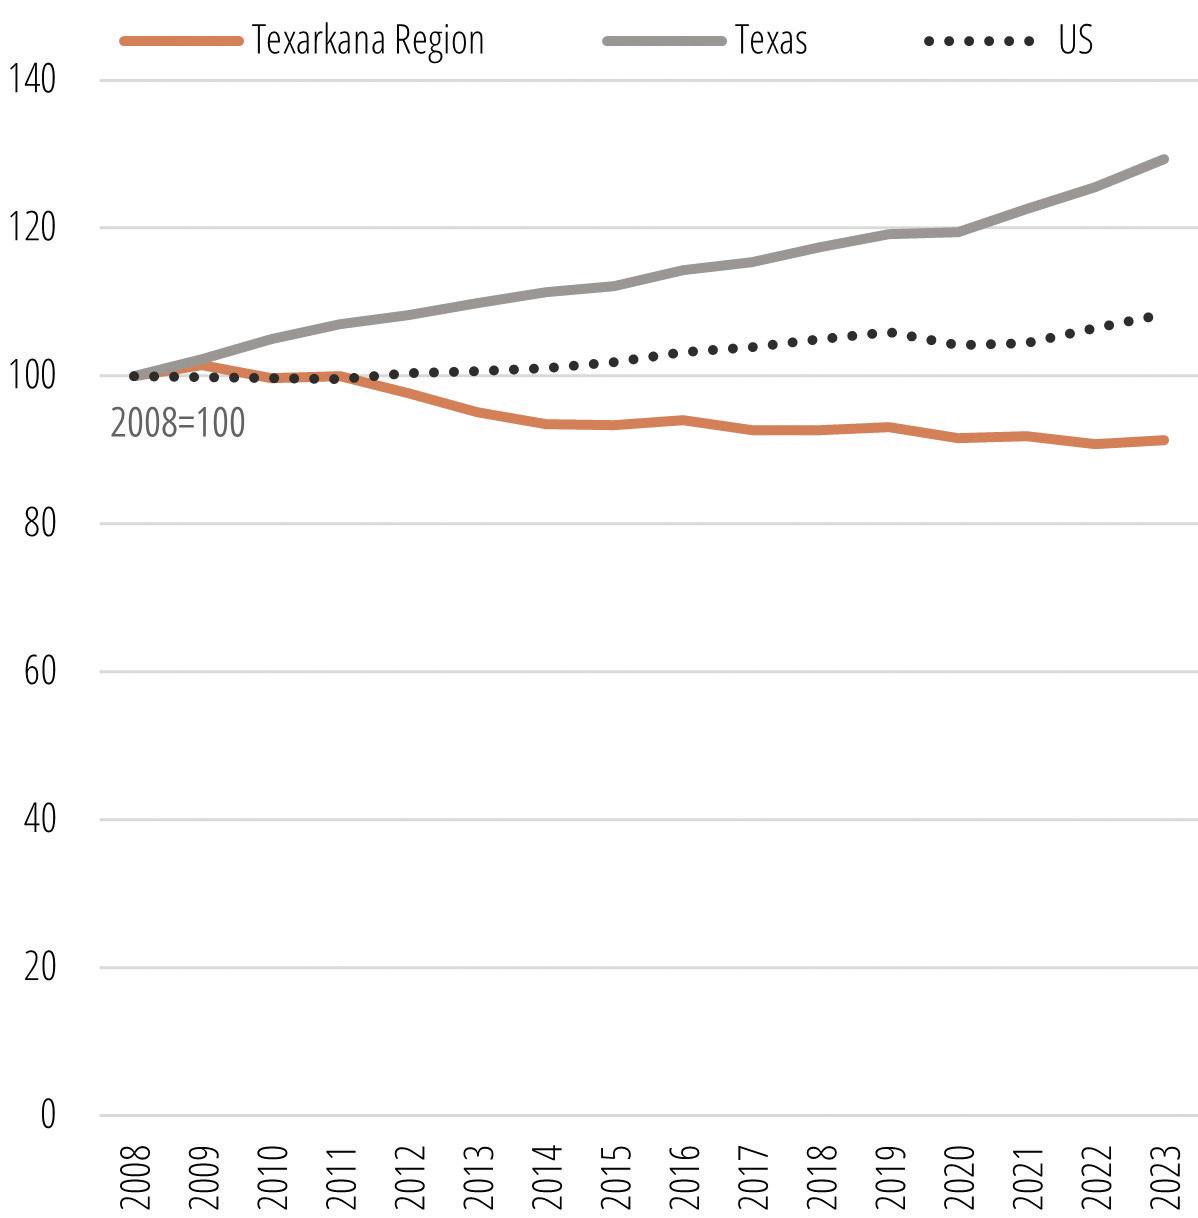
Figure 14. COMPArATiVe LABOr FOrCe grOWTH (2008-2023)
Figure 15. COMPArATiVe uNeMPLOYMeNT rATeS (2008-2020)
HIGH DEMAND OCCUPATIONS
Figure 16. TOP OCCuPATiON BY OPeNiNgS (2024-2029)
Occupations that pay more than the regional living wage of $18.57 are highlighted as follows: █ LOW-SKILL
Requires a high school diploma or less █ MIDDLE-SKILL
Requires more than a diploma, less than a bachelor’s █
NORTHEAST TEXAS ECONOMIC AND LABOR MARKET UPDATE 7 T.L.L. TEMPLE FOUNDATION
HIGH-SKILL Requires a
SOC DESCRIPTION 2023 JOBS OPENINGS (2024-2029) REGIONAL MEDIAN HOURLY EARNINGS COMPARISON TO TEXAS MEDIAN HOURLY EARNINGS 35-3023 Fast Food & Counter Workers 1,858 2,113 $11.51 +5.6% 41-2011 Cashiers 1,841 1,763 $12.01 -3.0% 31-1128 Home Health & Personal Care Aides 1,879 1,491 $11.79 +11.8% 41-2031 Retail Salespersons 1,674 1,307 $13.14 -3.7% 35-3031 Waiters & Waitresses 1,065 1,128 $11.53 +11.1% 53-7065 Stockers & Order Fillers 1,111 969 $15.52 -6.1% 11-1021 General & Operations Managers 2,009 876 $30.66 -23.2% 37-2011 Janitors & Cleaners, Except Maids & Housekeeping Cleaners 1,074 792 $12.60 -6.7% 53-3032 Heavy & Tractor-Trailer Truck Drivers 1,345 759 $24.66 +9.5% 43-4051 Customer Service Representatives 1,078 741 $14.57 -17.3% 53-7062 Laborers & Freight, Stock, & Material Movers, Hand 1,015 732 $16.96 +2.7% 35-2021 Food Preparation Workers 746 652 $12.14 -7.5% 43-9061 Office Clerks, General 999 624 $13.90 -16.5% 35-2014 Cooks, Restaurant 657 597 $14.14 -1.5% 31-1131 Nursing Assistants 781 572 $14.21 -4.2% 35-1012 First-Line Supervisors of Food Preparation & Serving Workers 624 475 $15.15 -7.1% 25-9045 Teaching Assistants, Except Postsecondary 715 460 $12.07 -10.5% 43-6014 Secretaries & Administrative Assistants, Except Legal, Medical, & Executive 804 451 $17.03 -8.0% 37-3011 Landscaping & Groundskeeping Workers 587 434 $12.58 -19.1% 43-4171 Receptionists & Information Clerks 588 416 $13.37 -8.4% 29-1141 Registered Nurses 1,478 410 $33.02 -13.9% 49-9071 Maintenance & Repair Workers, General 808 404 $15.05 -16.9% 41-1011 First-Line Supervisors of Retail Sales Workers 770 399 $18.66 -2.2% 37-2012 Maids & Housekeeping Cleaners 573 388 $11.26 -12.4% 39-9011 Childcare Workers 480 388 $11.00 -1.0%
2024.1 – QCEW Employees, Non-QCEW Employees, and Self-Employed
bachelor’s degree or higher
Source: Lightcast
HIGH DEMAND OCCUPATIONS (CONTINUED)
Figure 16. TOP OCCuPATiON BY OPeNiNgS (2024-2029) (CONTiNueD)
Occupations that pay more than the regional living wage of $18.57 are highlighted as follows: █ LOW-SKILL
Requires a high school diploma or less █ MIDDLE-SKILL
Requires more than a diploma, less than a bachelor’s █
a bachelor’s degree or higher
NORTHEAST TEXAS ECONOMIC AND LABOR MARKET UPDATE 8 T.L.L. TEMPLE FOUNDATION
HIGH-SKILL Requires
SOC DESCRIPTION 2023 JOBS OPENINGS (2024-2029) REGIONAL MEDIAN HOURLY EARNINGS COMPARISON TO TEXAS MEDIAN HOURLY EARNINGS 43-3031 Bookkeeping, Accounting, & Auditing Clerks 647 384 $18.47 -13.4% 43-1011 First-Line Supervisors of Office & Administrative Support Workers 752 360 $22.97 -19.7% 51-4121 Welders, Cutters, Solderers, & Brazers 650 353 $19.87 -13.7% 53-3033 Light Truck Drivers 478 325 $17.52 -8.1% 25-2021 Elementary School Teachers, Except Special Education 819 312 $25.02 -15.2% 47-2061 Construction Laborers 626 306 $16.65 -2.9% 35-9031 Hosts & Hostesses, Restaurant, Lounge, & Coffee Shop 208 274 $10.82 -3.6% 29-2061 Licensed Practical & Licensed Vocational Nurses 702 271 $20.75 -15.2% 51-2098 Miscellaneous Assemblers & Fabricators 423 270 $16.63 -1.9% 33-3012 Correctional Officers & Jailers 683 269 $20.88 -0.2% 35-2012 Cooks, Institution & Cafeteria 334 263 $12.69 -8.1% 51-1011 First-Line Supervisors of Production & Operating Workers 463 245 $28.72 -4.2% 25-2031 Secondary School Teachers, Except Special & Career/Technical Edu. 672 235 $26.21 -11.5% 35-9011 Dining Room & Cafeteria Attendants & Bartender Helpers 224 223 $10.32 -6.9% 31-9092 Medical Assistants 269 223 $15.43 -12.9% 49-3023 Automotive Service Technicians & Mechanics 476 221 $19.41 -5.3% 39-5012 Hairdressers, Hairstylists, & Cosmetologists 315 218 $13.07 -6.9% 53-3051 Bus Drivers, School 257 213 $13.94 -27.1% 41-4012 Sales Reps., Wholesale & Mfg, Except Technical & Scientific Products 382 211 $28.74 -0.8% 53-7051 Industrial Truck & Tractor Operators 401 209 $16.86 -8.9% 53-7061 Cleaners of Vehicles & Equipment 280 208 $12.32 -7.5% 13-1199 Business Operations Specialists, All Other 383 207 $33.57 -6.8% 49-1011 First-Line Supervisors of Mechanics, Installers, & Repairers 469 199 $31.51 -1.4% 35-2011 Cooks, Fast Food 267 195 $10.92 -0.2% 25-1099 Postsecondary Teachers 430 194 $36.36 -10.5% Source: Lightcast 2024.1 – QCEW Employees, Non-QCEW Employees, and Self-Employed
HIGH DEMAND OCCUPATIONS (CONTINUED)
Figure 16. TOP OCCuPATiON BY OPeNiNgS (2024-2029) (CONTiNueD)
Occupations that pay more than the regional living wage of $18.57 are highlighted as follows: █ LOW-SKILL
Requires a high school diploma or less █ MIDDLE-SKILL
Requires more than a diploma, less than a bachelor’s █
a bachelor’s degree or higher
NORTHEAST TEXAS ECONOMIC AND LABOR MARKET UPDATE 9 T.L.L. TEMPLE FOUNDATION
HIGH-SKILL Requires
SOC DESCRIPTION 2023 JOBS OPENINGS (2024-2029) REGIONAL MEDIAN HOURLY EARNINGS COMPARISON TO TEXAS MEDIAN HOURLY EARNINGS 25-2022 Middle School Teachers, Except Special & Career/Technical Education 516 193 $26.66 -9.6% 51-9061 Inspectors, Testers, Sorters, Samplers, & Weighers 315 190 $22.37 +15.9% 43-5071 Shipping, Receiving, & Inventory Clerks 350 183 $17.20 -1.5% 47-2111 Electricians 348 182 $26.47 +1.4% 49-9041 Industrial Machinery Mechanics 374 174 $31.96 +14.2% 13-2011 Accountants & Auditors 377 170 $32.70 -12.8% 41-3091 Sales Reps. of Svcs., Except Advertising, Insurance, Financial Svcs., & Travel 292 169 $24.27 -13.9% 35-3011 Bartenders 177 166 $11.91 -2.8% 25-3031 Substitute Teachers, Short-Term 240 165 $10.82 -19.9% 39-3091 Amusement & Recreation Attendants 114 164 $10.78 -2.1% 35-9021 Dishwashers 182 161 $10.95 -14.9% 49-3042 Mobile Heavy Equipment Mechanics, Except Engines 400 161 $28.42 +2.7% 47-1011 First-Line Supervisors of Construction Trades & Extraction Workers 345 159 $24.79 -18.4% 43-6013 Medical Secretaries & Administrative Assistants 253 157 $16.46 -7.3% 33-3051 Police & Sheriff's Patrol Officers 382 154 $24.08 -22.2% 33-9032 Security Guards 234 154 $13.61 -3.5% 45-2092 Farmworkers & Laborers, Crop, Nursery, & Greenhouse 188 147 $11.97 -7.6% 53-1047 First-Line Supervisors of Transportation & Material Moving Workers, Except Aircraft Cargo Handling Supervisors 263 144 $24.39 -8.7% 25-2011 Preschool Teachers, Except Special Education 204 137 $16.29 +0.3% 53-3031 Driver/Sales Workers 228 134 $12.16 -17.9% 11-9111 Medical & Health Services Managers 296 132 $42.65 -13.4% 11-9199 Managers, All Other 312 130 $29.30 -35.8% 45-4022 Logging Equipment Operators 149 123 $18.52 -15.5% 47-2031 Carpenters 277 123 $18.27 -14.1% 21-2011 Clergy 212 116 $21.09 -11.0% Source: Lightcast 2024.1 – QCEW Employees, Non-QCEW Employees, and Self-Employed
HIGH DEMAND CAREER CLUSTERS
Figure 17. HigH DeMAND CAreer CLuSTerS
EDUCATION & TRAINING
Occupations
• Elementary School Teacher
• Middle School Teacher
• Secondary School Teacher
INSTALLATION, MAINTENANCE, & REPAIR
• Automotive Service Technicians & Mechanics
• Industrial Machinery Mechanics
• Mobile Heavy Equipment Mechanics, Except Engines
PRODUCTION/ MANUFACTURING
• Welders, Cutters, Solderers, & Brazers
• Inspectors, Testers, Sorters, Samplers, & Weighers
Education Typically Required for Entry
Relevant Programs of Study
• Bachelor’s Degree or Higher & Certification from an Approved Educator Preparation Program
• Teaching & Training
Most-Requested Credential*
• Teaching Certificate
Top Employers Posting 1. Texarkana ISD 2. Region 8 ESC 3. Hughes Springs ISD
Queen City ISD
Fairview ABC Preschool
*Most-requested certificate or credential is based on job postings in 2023.
Source: Texas Education Agency, Lightcast Job Posting Analytics.
• Nondegree Award or HS Diploma & On-the-Job Training
• Automotive
• Diesel & Heavy Equipment
• Advanced Manufacturing & Machinery Mechanics
• Commercial Driver’s License (CDL)
• Automotive Service Excellence (ASE) Certification
Goodyear
Amentum
United States Government
Windstream
Valvoline
• HS Diploma
• On-the-Job Training
• Manufacturing Technology
• Welding
• 10-Hour OSHA General Industry Card
• Forklift Certification
1. Transco Railway Company
2. Centene
3. Xylem
4. Greif
5. Aerotek
NORTHEAST TEXAS ECONOMIC AND LABOR MARKET UPDATE 10 T.L.L. TEMPLE FOUNDATION
5.
1.
2.
3.
4.
5.
4.
PUBLIC SCHOOL ENROLLMENT AND EMPLOYMENT OUTCOMES
Figure 18. eNrOLLMeNT AND eMPLOYMeNT OuTCOMeS, regiONAL HigH SCHOOL grADuATeS, 2019–2020
Figure 19. TOP TeXAS PuBLiC COLLegeS AND uNiVerSiTieS By Fall College Enrollment of District High School Graduates
COLLEGE


Texarkana College
Texas A&M-Texarkana
Northeast Texas Community College
Tyler Junior College
TSTC-Marshall
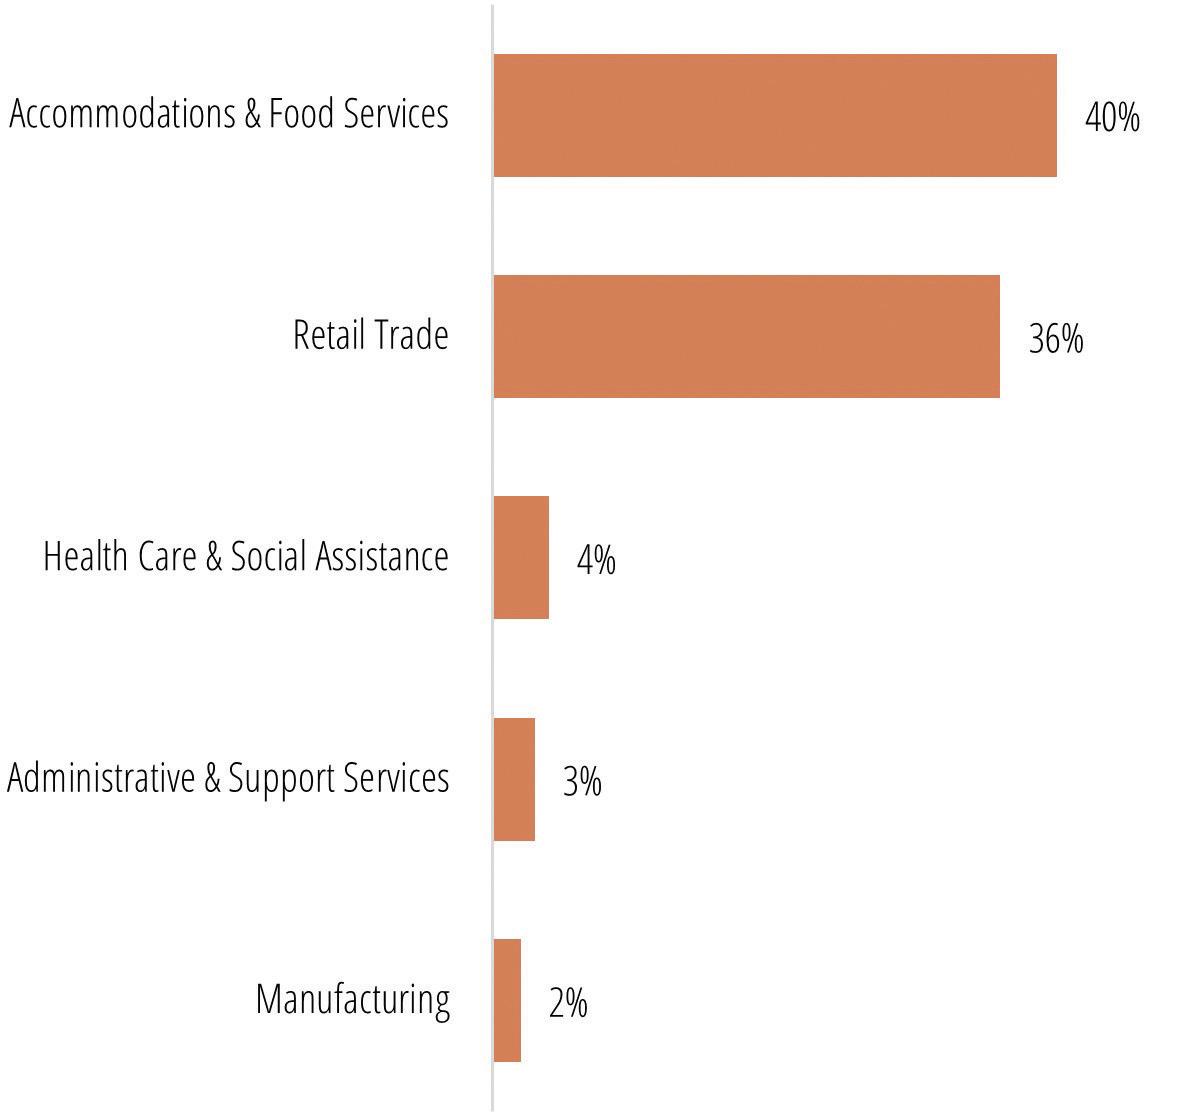
Figure 20. iNDuSTrieS WHere eMPLOYeD
*Not Located - High school graduates not found either as college enrolled (in a Texas public college or university in the fall semester following graduation) or employed (not found in the 4th quarter of Texas employment data as reported by the Texas Workforce Commission).
Source: Texas Public Education Information Resource (TPEIR).
NORTHEAST TEXAS ECONOMIC AND LABOR MARKET UPDATE 11 T.L.L. TEMPLE FOUNDATION
SCHOOL DISTRICT TOTAL ENROLLED IN COLLEGE ONLY EMPLOYED ONLY EMPLOYED & ENROLLED ALL ENROLLED IN COLLEGE ALL EMPLOYED NOT LOCATED* Texarkana 448 68 138 78 146 216 164 Pleasant Grove 158 21 40 34 55 74 63 Liberty-Eylau 143 23 52 16 39 68 52 Atlanta 121 18 35 21 39 56 47 New Boston 106 22 33 18 40 51 33 Redwater 82 13 22 13 26 35 34 Hooks 77 6 26 13 19 39 32 Hughes Springs 71 9 20 25 34 45 17 Dekalb 61 10 15 17 27 32 19 Pewitt 57 14 20 7 21 27 16 Linden-Kildare 57 9 18 14 23 32 16 Simms 36 6 9 5 11 14 16 Maud 31 9 6 5 14 11 11 McLeod 25 2 1 5 7 6 17
Percent of all
Employed
ABOUT THIS WORK
This profile is part of the Rural East Texas Economic Opportunity Analysis series commissioned by the T.L.L. Temple Foundation. The goals of this work are to strengthen the alignment of and linkages between the talent pipeline and key industry clusters in rural East Texas.
The original series of reports, released in January 2022, defined three economic subregions: Northeast Texas centered on Texarkana, Deep East Texas centered on Lufkin and Nacogdoches, and Southeast Texas centered on Beaumont and Port Arthur. The economic and labor market structure of each sub-region was profiled, detailing the key industry sectors, current and projected employment opportunities, and high-demand skills and credentials.
The current profile provides updated data to supplement the original report. Economic and labor market research was provided by Alexander Research and Consulting. Graphic design was completed by Safflor Design.
All profiles are available for download from the T.L.L. Temple Foundation’s website at www.tlltemple.foundation.
ABOUT THE PROJECT TEAM
SPONSORS
The T.L.L. Temple Foundation works alongside rural communities to build a thriving East Texas and to alleviate poverty, creating access and opportunities for all.
Jerry Kenney Program Officer, Regional Capacity Building and Community Development jerrykenney@tlltemple.foundation
CONSULTING TEAM

Alexander Research & Consulting provides insights and support to help organizations amplify their impact. I offer a wide range of services —research, analytics, program evaluation, strategic planning, and implementation support—with a specialization in community, economic, and workforce development.
Caroline Alexander Principal caroline@alexanderrc.com
DESIGN
Non-credited images used in this report were licensed from Adobe Stock. Cover image and other Boggy Slough Nature Preserve images used with permission from Jay Brittain. All other images sourced as attributed.
For over 10 years, Safflor Design has been elevating their clients’ work through elegant design.
Meredith Eberle Proprietor safflor@gmail.com
NORTHEAST TEXAS ECONOMIC AND LABOR MARKET UPDATE 12 T.L.L. TEMPLE FOUNDATION

NORTHEAST TEXAS ECONOMIC AND LABOR MARKET UPDATE 13
PREPARED BY