11 minute read
Economic Structure & Performance


ACKNOWLEDGMENTS
This Economic Opportunity Analysis Summary Profile is the first in a series commissioned by the T.L.L. Temple Foundation, which includes the following reports: 1. Rural East Texas Economic Opportunity
Analysis Summary Profile, 2. Beaumont-Port Arthur Region Economic and Labor Market Profile, 3. Lufkin-Nacogdoches Region Economic and Labor Market Profile, and 4. Texarkana Region Economic and Labor Market Profile. The four profiles have also been collected into a comprehensive edition, titled “Rural East Texas Economic Opportunity Analysis.”
The goals of this work are to strengthen the alignment of and linkages between the talent pipeline and key industry clusters in rural East Texas. Economic and labor market research was provided by Alexander Research and Consulting. Graphic design was completed by Safflor Design.
All profiles are available for download from the T.L.L. Temple Foundation’s website at www.tlltemple.foundation.
ABOUT THE PROJECT SPONSORS AND CONSULTING TEAM
The T.L.L. Temple Foundation works alongside rural communities to build a thriving East Texas and to alleviate poverty, creating access and opportunities for all.
Sylvia Leal
Senior Program Officer, Education and Economic Development sylvialeal@tlltemple.foundation
Jerry Kenney
Program Officer, Education and Economic Opportunity jerrykenney@tlltemple.foundation

Alexander Research & Consulting provides insights and support to help organizations amplify their impact. I offer a wide range services - research, analytics, program evaluation, strategic planning, and implementation support – with a specialization in community, economic, and workforce development.
Caroline Alexander
Principal caroline@alexanderrc.com
Non-credited images used in this report were licensed from Adobe Stock. Icons were licensed from the Noun Project. Cover image and other Boggy Slough Nature Preserve images used with permission from Jay Brittain. All other images sourced as attributed.
CONTENTS
INTRODUCTION . . . . . . . . . . . . . . . . . . . . . . . . . . . . . . . . . . . . . . . . . . . . . . . . . . . . . . . . . . . . . . . . . . . . . . . . . 1 ABOUT THE REGION . . . . . . . . . . . . . . . . . . . . . . . . . . . . . . . . . . . . . . . . . . . . . . . . . . . . . . . . . . . . . . . . . . . . 2 THE REGIONAL ECONOMIES . . . . . . . . . . . . . . . . . . . . . . . . . . . . . . . . . . . . . . . . . . . . . . . . . . . . . . . . . . . . . 3 Economic Structure & Performance ............................................................. 3 Occupational Structure & Demand ............................................................. 7 Alignment of Talent Pipelines ................................................................. 9 ABOUT THIS WORK . . . . . . . . . . . . . . . . . . . . . . . . . . . . . . . . . . . . . . . . . . . . . . . . . . . . . . . . . . . . . . . . . . . . 10 KEY CONCEPTS . . . . . . . . . . . . . . . . . . . . . . . . . . . . . . . . . . . . . . . . . . . . . . . . . . . . . . . . . . . . . . . . . . . . . . . 11
INTRODUCTION
The T.L.L Temple Foundation (the Foundation) has developed a targeted strategy aimed at strengthening the alignment of and linkages between the talent pipeline and key industry clusters in rural East Texas. The goal of this strategy is to advance local economic development and create more and better economic opportunities for residents in the region. A key component of the strategy is increasing the number of students in the region that attain a high-skill, highdemand credential. To this end, the Foundation wishes to better understand the region and its distinct sub-regions, their economies, their labor markets, and their educational infrastructure. To support this work, the Foundation hired Alexander Research and Consulting to provide economic and labor market research. The economic and labor market profiles provide an in-depth, data-driven view of each of the aforementioned topic areas. This body of work can help inform the work of public officials, economic and workforce development organizations, workforce development entities, community-based organizations, and educational institutions in the region to ultimately create a workforce system that is more dynamic and responsive to the needs of regional employers and an economy that offers more pathways to economic self-sufficiency and familysustaining careers for workers in rural East Texas.
Figure 1. COUNTIES OF EAST TEXAS
BEAUMONT- PORT ARTHUR
LUFKIN- NACOGDOCHES
TEX- ARKANA
OTHER COUNTY NAME
Hardin, TX Jasper, TX Jefferson, TX Newton, TX
POPULATION (2014) POPULATION (2019)
55,510 57,602
35,424
35,529 252,897 251,565 14,292 13,595
Orange, TX Tyler, TX Angelina, TX
83,244 21,468 87,567 Nacogdoches, TX 65,240 Sabine, TX 10,428
San Augustine, TX Shelby, TX Bowie, TX Cass, TX Miller, AR Anderson, TX Cherokee, TX
8,481 25,607 93,268 30,123 43,458 57,829 51,189
Houston, TX Liberty, TX Panola, TX Polk, TX Rusk, TX 22,809 78,045 23,750 45,813 53,212
San Jacinto, TX Trinity, TX 27,049 14,298 83,396 21,672 86,715 65,204 10,542 8,237 25,274 93,245 30,026 43,257 57,735 52,646 22,968 88,219 23,194 51,353 54,406 28,859 14,651
Source: US Census Bureau, ARC Research.
POP. CHANGE (2014-2019)
METROPOLITAN/ MICROPOLITAN AREA
4% Beaumont-Port Arthur
WORKFORCE BOARD
Workforce Solutions Southeast Texas
0% n/a -1% Beaumont-Port Arthur Deep East Texas Workforce Solutions Southeast Texas
-5% n/a 0% Beaumont-Port Arthur Deep East Texas Workforce Solutions Southeast Texas
1% n/a -1% Lufkin 0% Nacogdoches 1% n/a -3% n/a -1% n/a 0% Texarkana 0% n/a 0% Texarkana 0% Palestine Deep East Texas Deep East Texas Deep East Texas Deep East Texas Deep East Texas Deep East Texas Workforce Solutions Northeast Texas Workforce Solutions Northeast Texas Southwest Arkansas East Texas
3% Jacksonville East Texas
1% n/a
Deep East Texas 13% Houston-The Woodlands-Sugar Land Workforce Solutions Gulf Coast -2% n/a East Texas
12% n/a 2% Longview 7% n/a 2% n/a Deep East Texas East Texas Deep East Texas Deep East Texas
ABOUT THE REGION
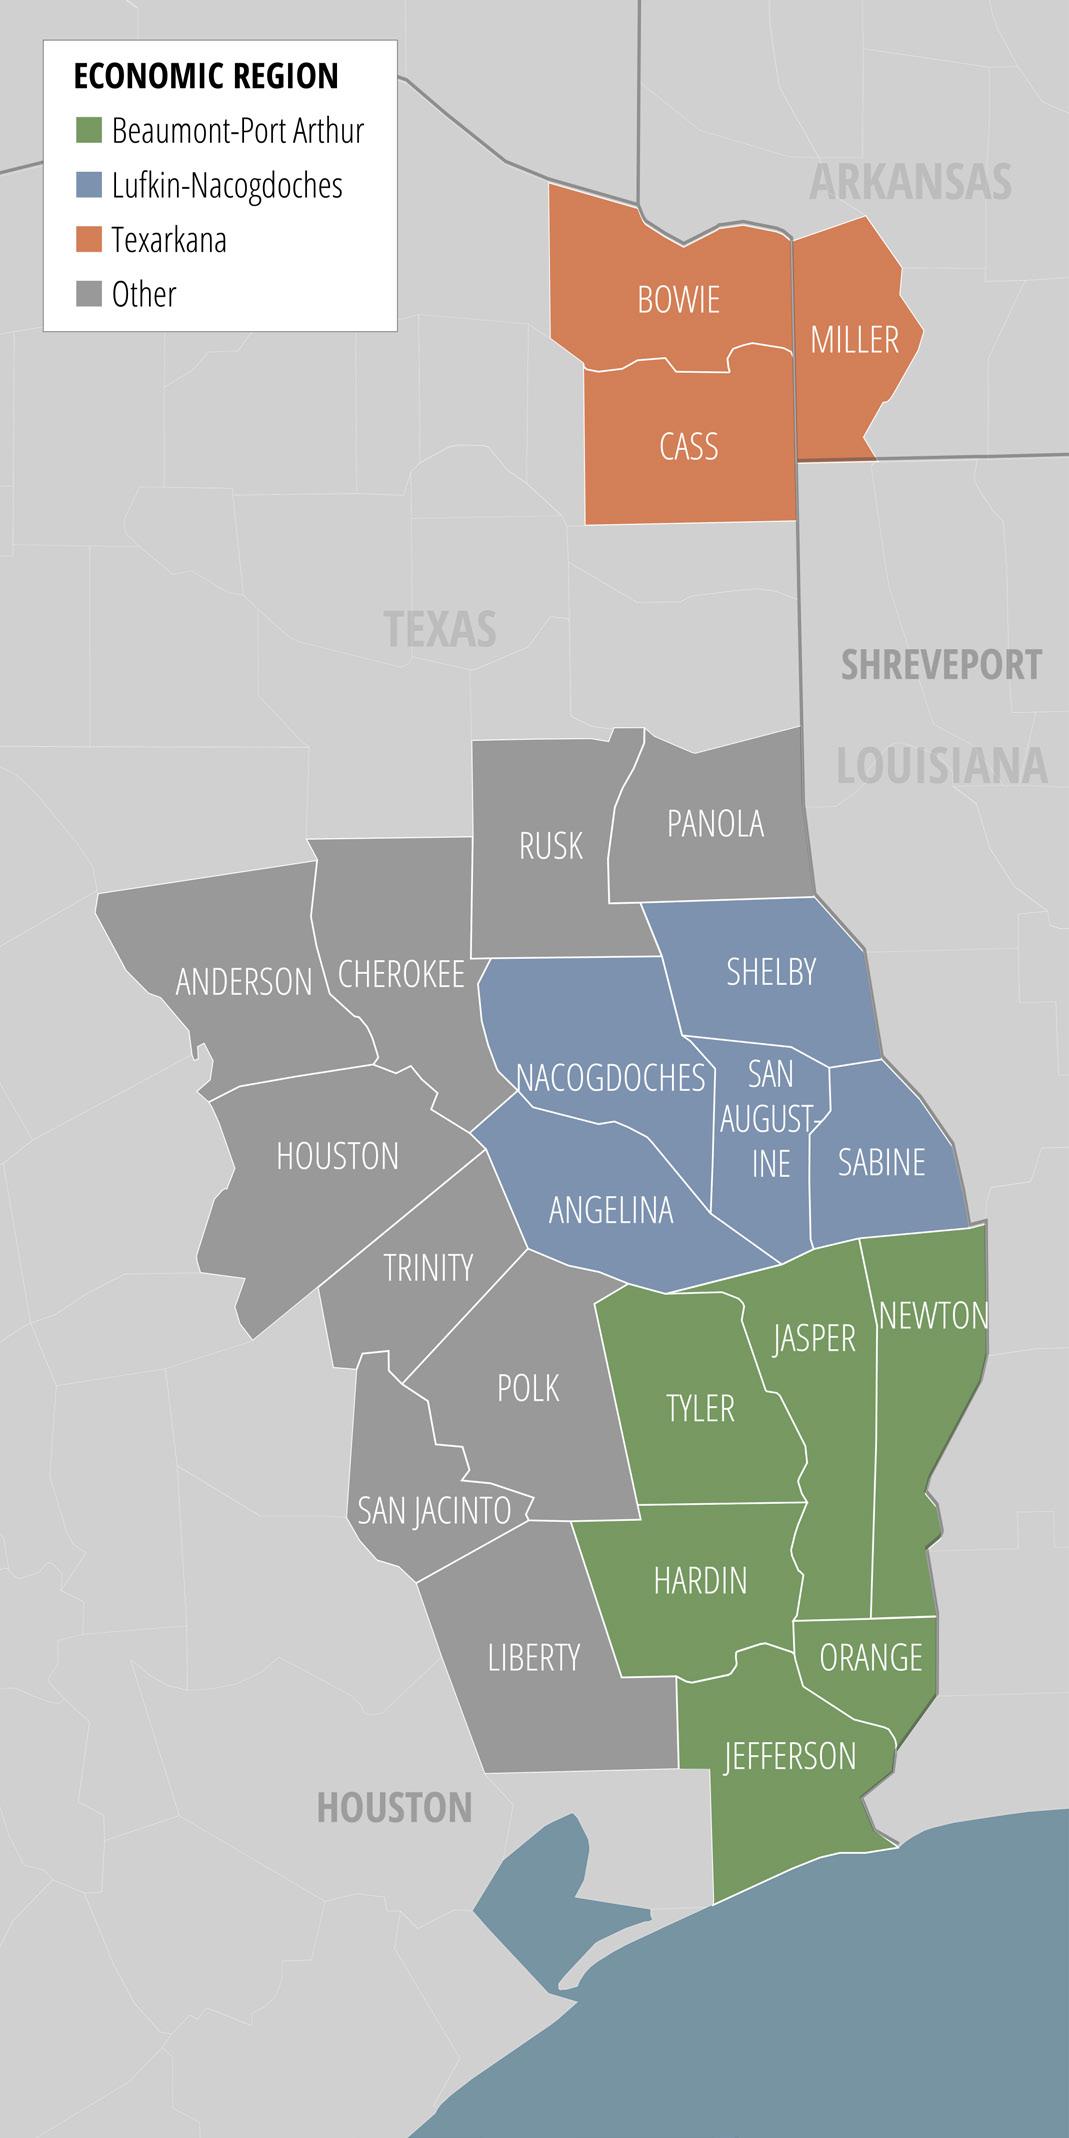
The Foundation’s service area consists of 22 counties in East Texas and one Arkansas county: Anderson, Angelina, Bowie, Cass, Cherokee, Hardin, Houston, Jasper, Jefferson, Liberty, Nacogdoches, Newton, Orange, Panola, Polk, Rusk, Sabine, San Augustine, San Jacinto, Shelby, Trinity, Tyler, and Miller County in Arkansas.
Within this area, there are three distinct economic regions. The economic regions are defined by commuting patterns of workers in the region. An analysis of where employed residents work reveals clear economic ties between counties. Each county was assigned to the region that was the principal destination for workers in that county. For example, the Beaumont-Port Arthur Metropolitan Statistical Area consists of Hardin, Jefferson, and Orange Counties. In Jasper County, more than 26 percent of workers commute to the BeaumontPort Arthur Metro Area for work, while about 4 percent of workers commute to the Lufkin area for work. Thus, Jasper County was assigned to the Beaumont-Port Arthur economic region. In Rusk County, almost 23 percent of workers commute to Longview and more than 8 percent to Tyler. Less than 5 percent of workers commute to Lufkin and Nacogdoches combined. Thus, Rusk County was not assigned to one of the three economic regions in East Texas because it has closer ties to metro areas outside of the Foundation’s service area.
In Figure 2, the map of the region delineates the three sub-regions. Figure 1 provides a list of the counties by sub-region and shows population, population change, metropolitan or micropolitan area, and workforce board service area. Of note is that the populations of each of the economic regions were stable between 2014 and 2019. However, beneath the regional totals, the individual counties experienced varied growth rates. Six of the counties had negative growth rates – these were Angelina, Jefferson, Newton, Panola, San Augustine, and Shelby. This population loss was balanced by population gains in other parts of the regions – Liberty, Polk, San Jacinto, Hardin, Cherokee, Trinity, Rusk, Sabine, Tyler, and Houston all gained population. The counties with the highest population growth were the counties with spillover from the Houston metro area – Liberty, Polk, and San Jacinto.
Figure 2. ECONOMIC REGIONS OF EAST TEXAS
THE REGIONAL ECONOMIES
ECONOMIC STRUCTURE & PERFORMANCE
Each economic region is profiled in detail in a separate document. In this section, comparisons between the regions highlight some of the commonalities and some of the key differences in the regional economies.
The size of the employment base in each of the regions varies widely with Beaumont-Port Arthur the largest and Texarkana the smallest (See Figure 3). In all three economies, healthcare is the largest sector, and the retail sector is one of the top three sectors. The sector that rounds out the top three sectors in each economy is distinct. In Beaumont-Port Arthur, it is manufacturing; in Lufkin-Nacogdoches, it is education; and in Texarkana, it is government. Location quotients (LQs) measure the share of local industry employment relative to the nation (See Figure 4). A high location quotient can be an indicator of a potential competitive advantage or regional specialization. Location quotients above 1 indicate that the industry accounts for a larger share of regional employment than the industry does of national employment. LQs above 1.25 are considered to be significantly higher and are highlighted in Figure 4.
Figure 3. EMPLOYMENT BY INDUSTRY, 2020
BEAUMONT-PORT ARTHUR LUFKIN-NACOGDOCHES
TOTAL JOBS Healthcare Manufacturing Retail Trade Construction Education Accommodation and Food Services 22,614 22,502 22,162 21,092 17,698 15,429
Government
13,434 Other Services (except Public Administration) 9,851 Administrative and Support Services 8,146 Professional, Scientific, and Technical Services 7,929 Transportation and Warehousing Wholesale Trade Finance and Insurance 6,370 5,832 4,744
Real Estate and Rental and Leasing Arts, Entertainment, and Recreation
2,698 1,170 Agriculture, Forestry, Fishing and Hunting 1,089 Information 982 186,229
12% 12,237 12% 8,342 12% 9,177 11% 4,424 10% 10,368 8% 6,548 7% 5,424 5% 4,024 4% 3,687 4% 1,801 3% 2,004 3% 2,123 3% 2,650 1% 731 1% 493 1% 2,018 1% 563 78,545
16% 10,891 11% 5,581 12% 8,228 6% 3,620 13% 6,746 8% 6,626 7% 7,558 5% 3,615 5% 2,974 2% 1,478 3% 2,940 3% 2,474 3% 1,808 1% 896 1% 528 3% 759 1% 314
Mining, Quarrying, and Oil & Gas Extraction 910 Management of Companies and Enterprises 828 Utilities 747 0% 1,028 0% 480 0% 420 1% 301 1% 427 1% 317
Source: Emsi 2021.2 – QCEW Employees, Non-QCEW Employees, and Self-Employed. TEXARKANA 68,083
Figure 4. INDUSTRY LOCATION QUOTIENTS, 2020
Construction Manufacturing Mining, Quarrying, and Oil and Gas Extraction Retail Trade Utilities Accommodation and Food Services Education Other Services (except Public Administration) Government Healthcare Wholesale Trade Transportation and Warehousing Real Estate and Rental and Leasing Administrative and Support Services Professional, Scientific, and Technical Services Finance and Insurance Agriculture, Forestry, Fishing and Hunting Arts, Entertainment, and Recreation Management of Companies and Enterprises Information BEAUMONT-PORT ARTHUR LUFKIN-NACOGDOCHES 1.97 1.55 1.32 1.22 0.98 1.36 3.53 1.20
1.16 1.10 1.04 1.01 0.90 0.89 0.86 0.86 0.84 0.72 0.63 0.61 0.48 0.42 0.30 0.29 1.55 1.10 1.45 0.98 0.86 1.14 0.74 0.64 0.54 0.78 0.34 0.80 2.10 0.42 0.42 0.39
Source: Emsi 2021.2 – QCEW Employees, Non-QCEW Employees, and Self-Employed. TEXARKANA
0.92 1.05 1.19 1.24 1.35 1.29 1.09 1.02 1.39 1.17 1.00 1.08 0.77 0.72 0.32 0.63 0.91 0.51 0.43 0.25
Image by Donald Giannatti via Unsplash
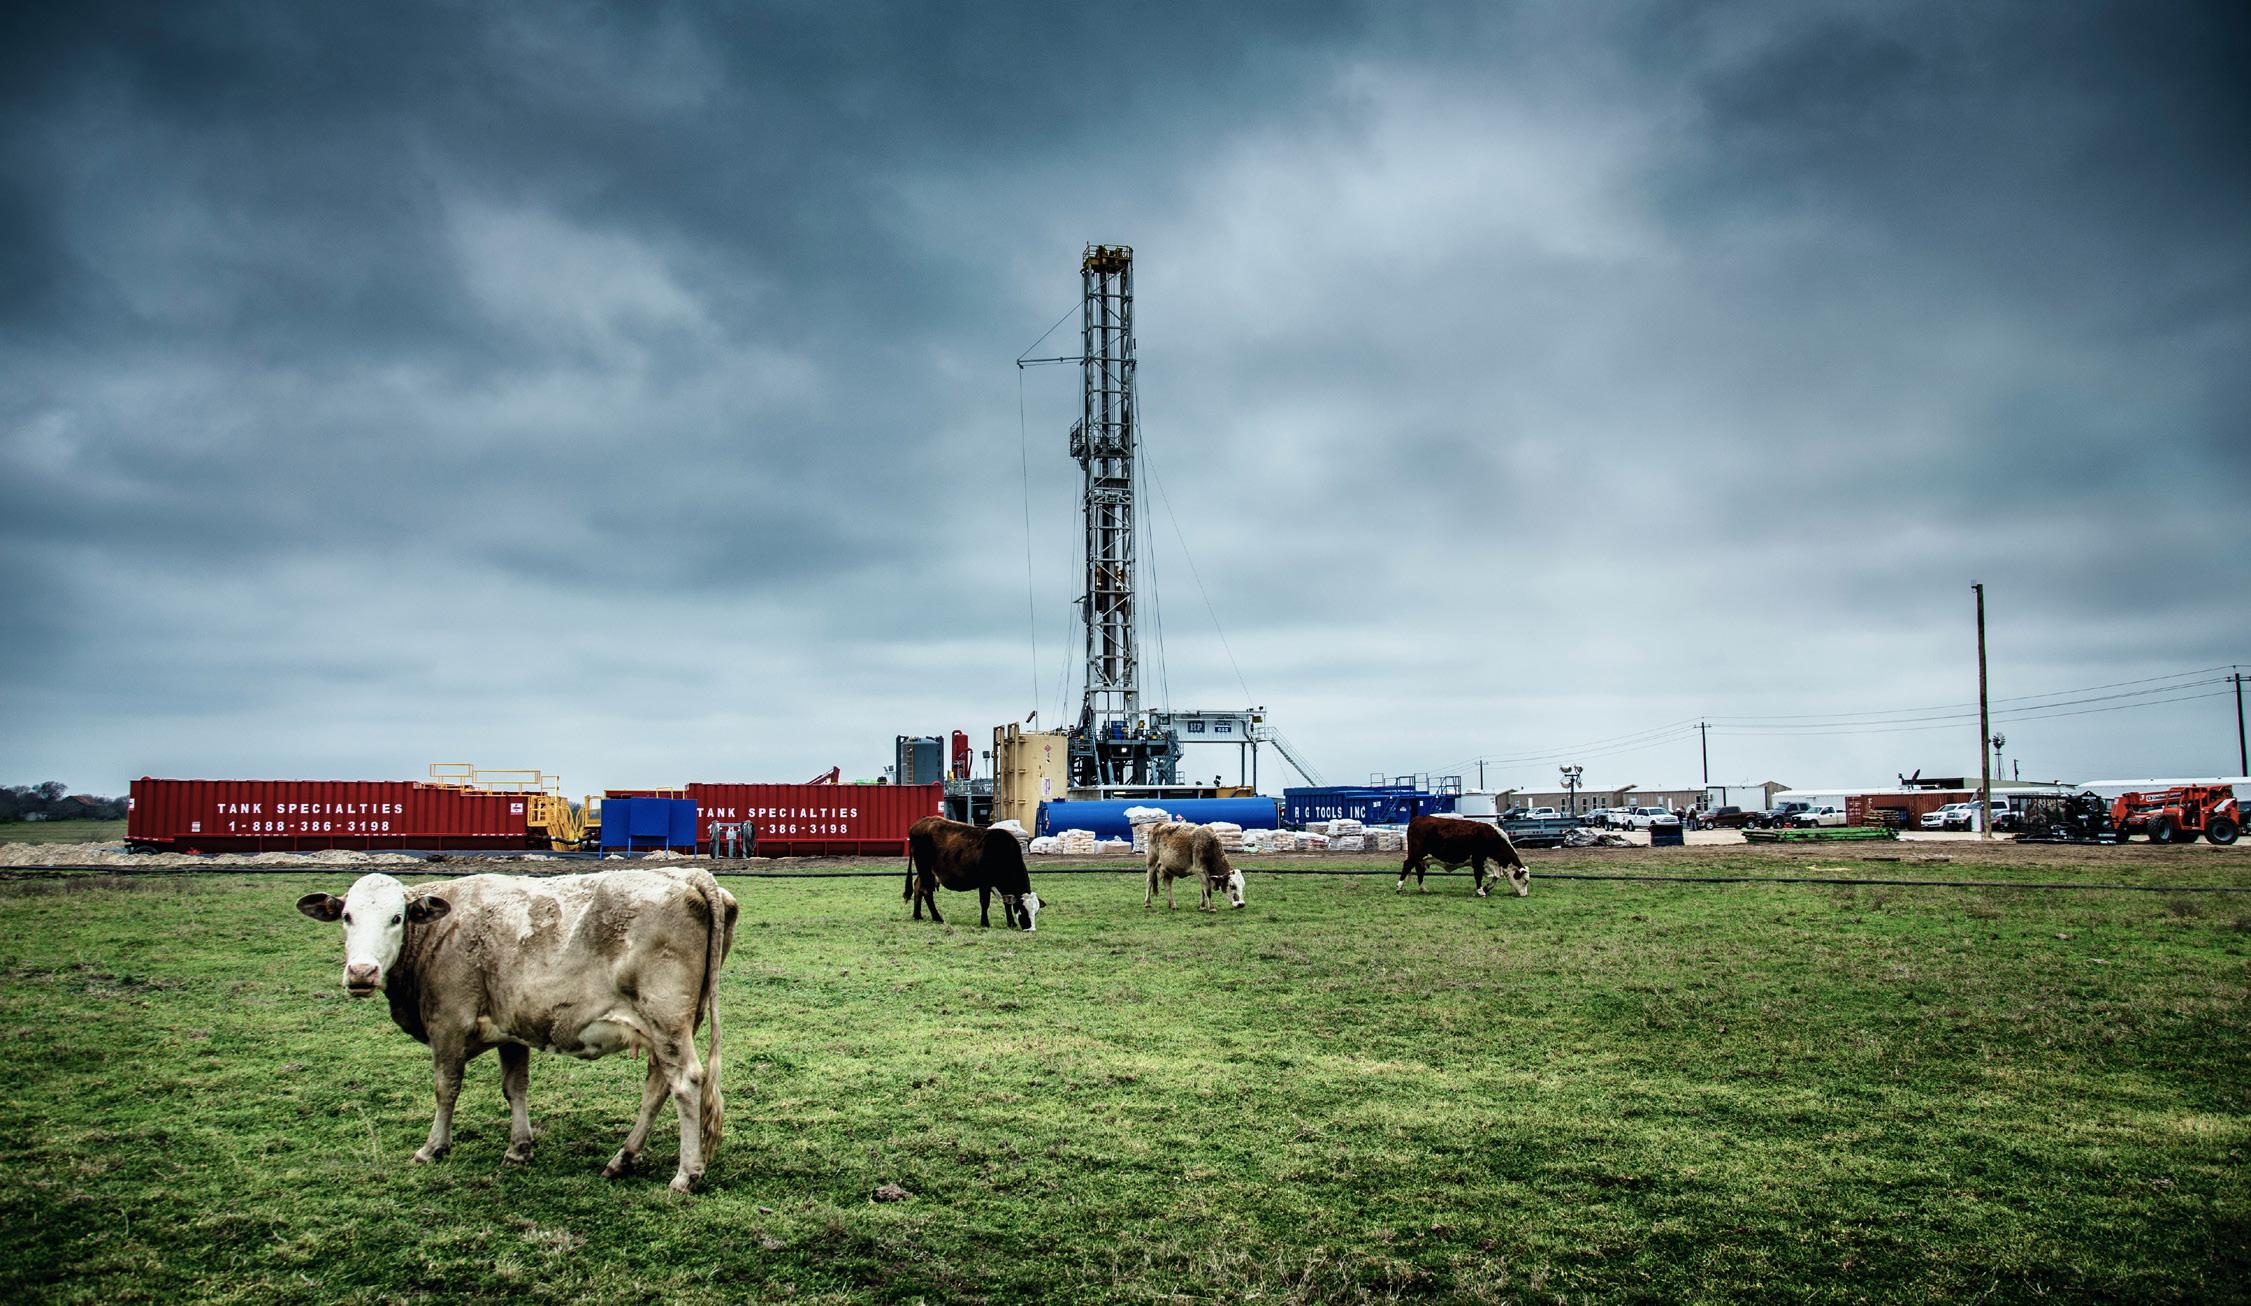
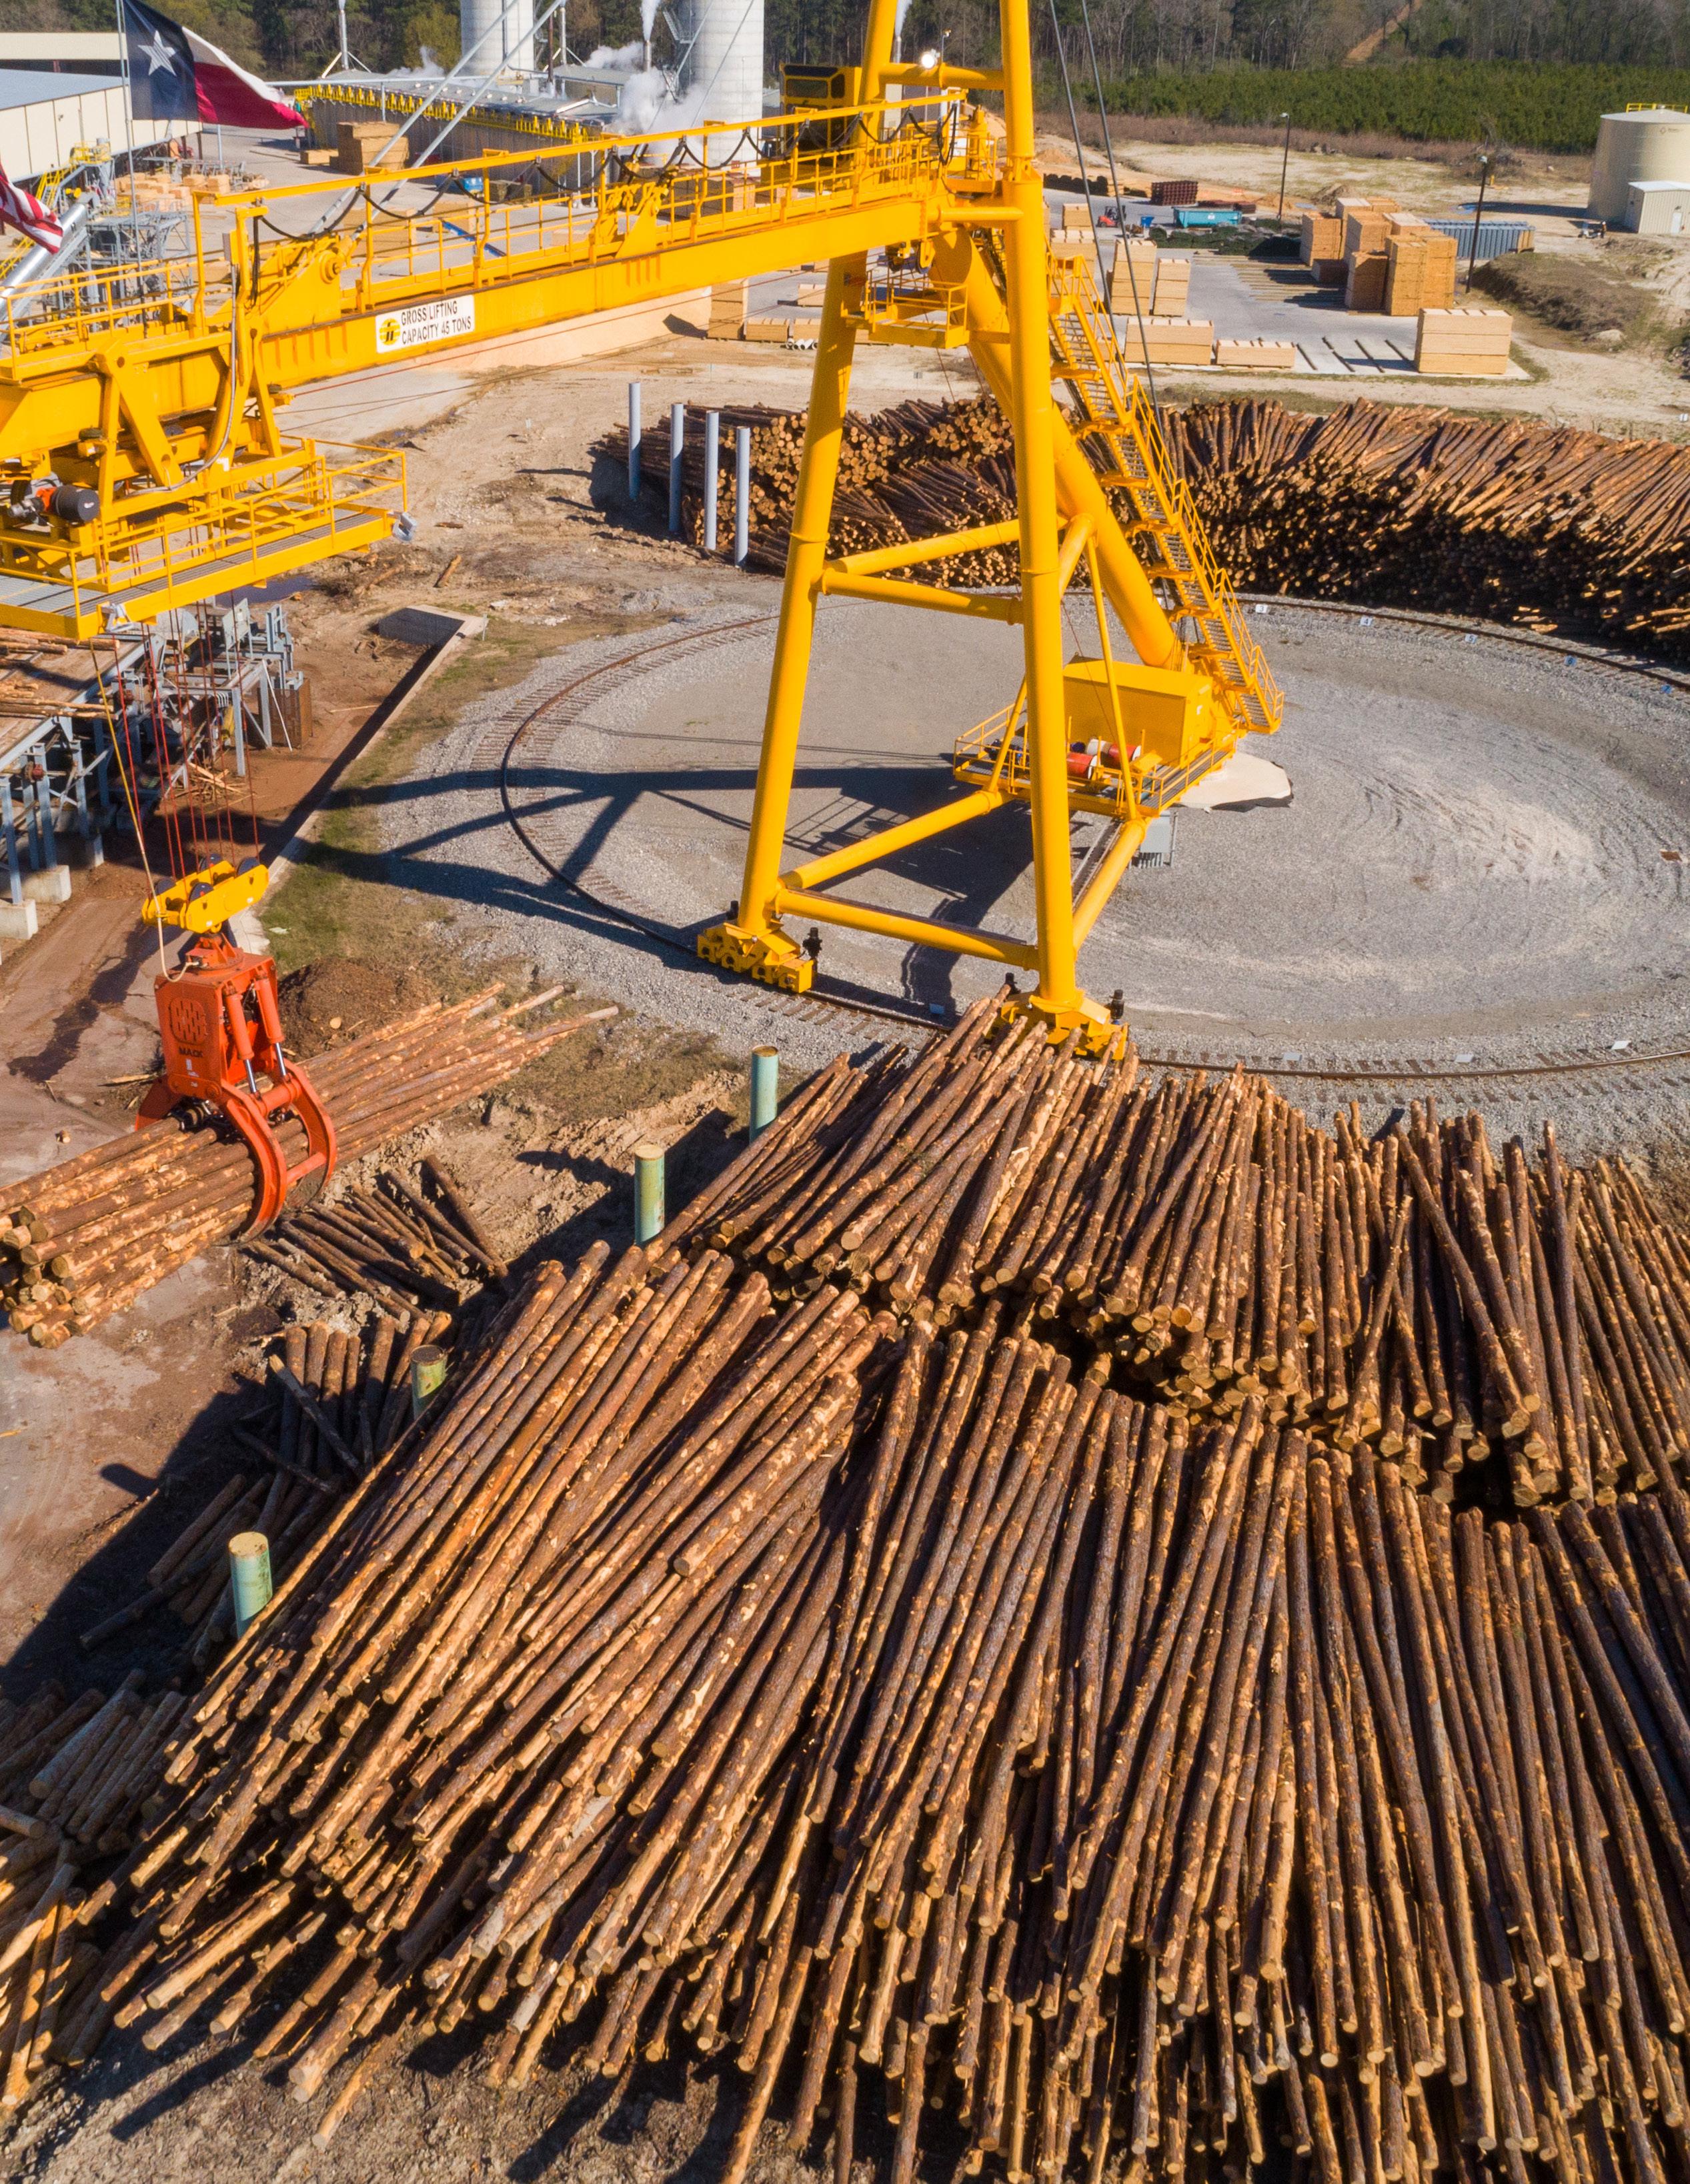
In Beaumont-Port Arthur, construction; manufacturing; and mining, quarrying, and oil and gas extraction have the highest location quotients. These all relate to the region’s vibrant petrochemical cluster. In the Lufkin-Nacogdoches region, the industries that have LQs significantly above average are mining, quarrying, and oil and gas extraction; agriculture, forestry, fishing, and hunting; utilities; education; and manufacturing. Some of these relate to the region’s most distinguishable clusters – forestry and forest products; livestock production and processing; and higher education. In Texarkana, the industries with the highest LQs are government; utilities; and accommodations and food services. The high LQ in government is related to the presence of state and federal correctional facilities. Comparing changes in employment in the region since the Great Recession shows a worrisome trend (See Figure 5). Though the state of Texas and the US experienced a historically long period of expansion after the Great Recession ended, all three East Texas economies struggled to recover to their 2008 peaks. The LufkinNacogdoches region slightly outperformed the other two regions. Pandemic-induced job losses happened across all five of the geographies.
A comparison of unemployment rates in Figure 6 shows that the Beaumont-Port Arthur region has had a consistently elevated employment rate; the other two regions were more in line with rates in the state and the nation.
Figure 5. COMPARATIVE EMPLOYMENT GROWTH, 2008=100
120 Beaumont-Port Arthur Lufkin-Nacogdoches Texarkana Texas US
115
110
105
100
95
90
2008 2009 2010 2011 2012 2013 2014 2015 2016 2017 2018 2019 2020
Source: Emsi 2021.2 – QCEW Employees, Non-QCEW Employees, and Self-Employed.