Health and wellness are essential dimensions of human development, influencing both individual lives and the collective well-being of communities and cities. Health refers to the physical, mental, and social condition of a person, while wellness expands this idea into a holistic pursuit of balance, prevention, and quality of life. Together, they are not just the absence of disease but the presence of conditions that allow people to thrive. In today’s societies, these concepts are deeply connected to social, economic, and environmental factors, showing how access, equity, and urban conditions directly shape the way health is experienced and sustained. Looking at health and wellness across different scales—from national frameworks to the reality of a city and the dynamics of a specific site—makes it possible to understand how systems, policies, and the built environment influence everyday experiences of care, vulnerability, and resilience.
HEALTH AND WELLNESS
“Planetary health embodies the understanding that human health and wellness are intricately tied to the health of our global systems—political, economic, social, and environmental—and that nurturing all of these interconnected dimensions is essential for the flourishing of both people and the planet.”
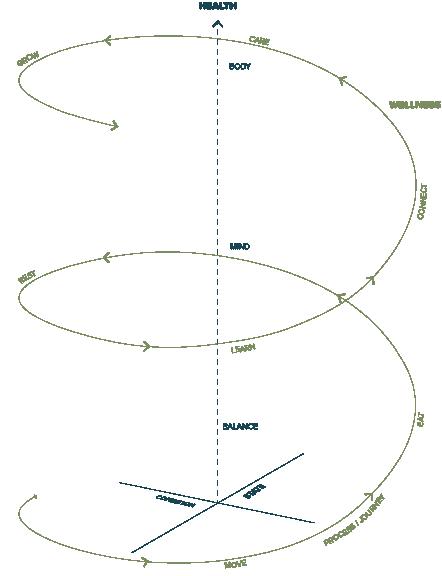
Beyond Health and Wellness
Health and wellness are about more than the absence of illness. they reflect a continuous journey of balance, growth, and fulfillment—where the mind, body, and spirit are interconnected. together, they shape how we live, how we connect with others, and how we find purpose in everyday life.
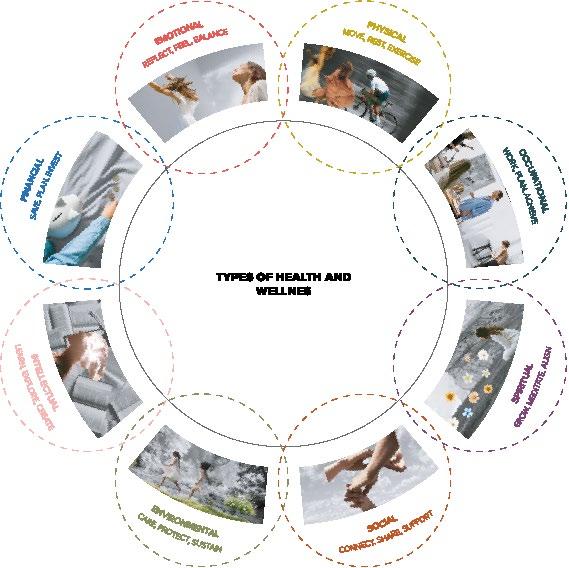
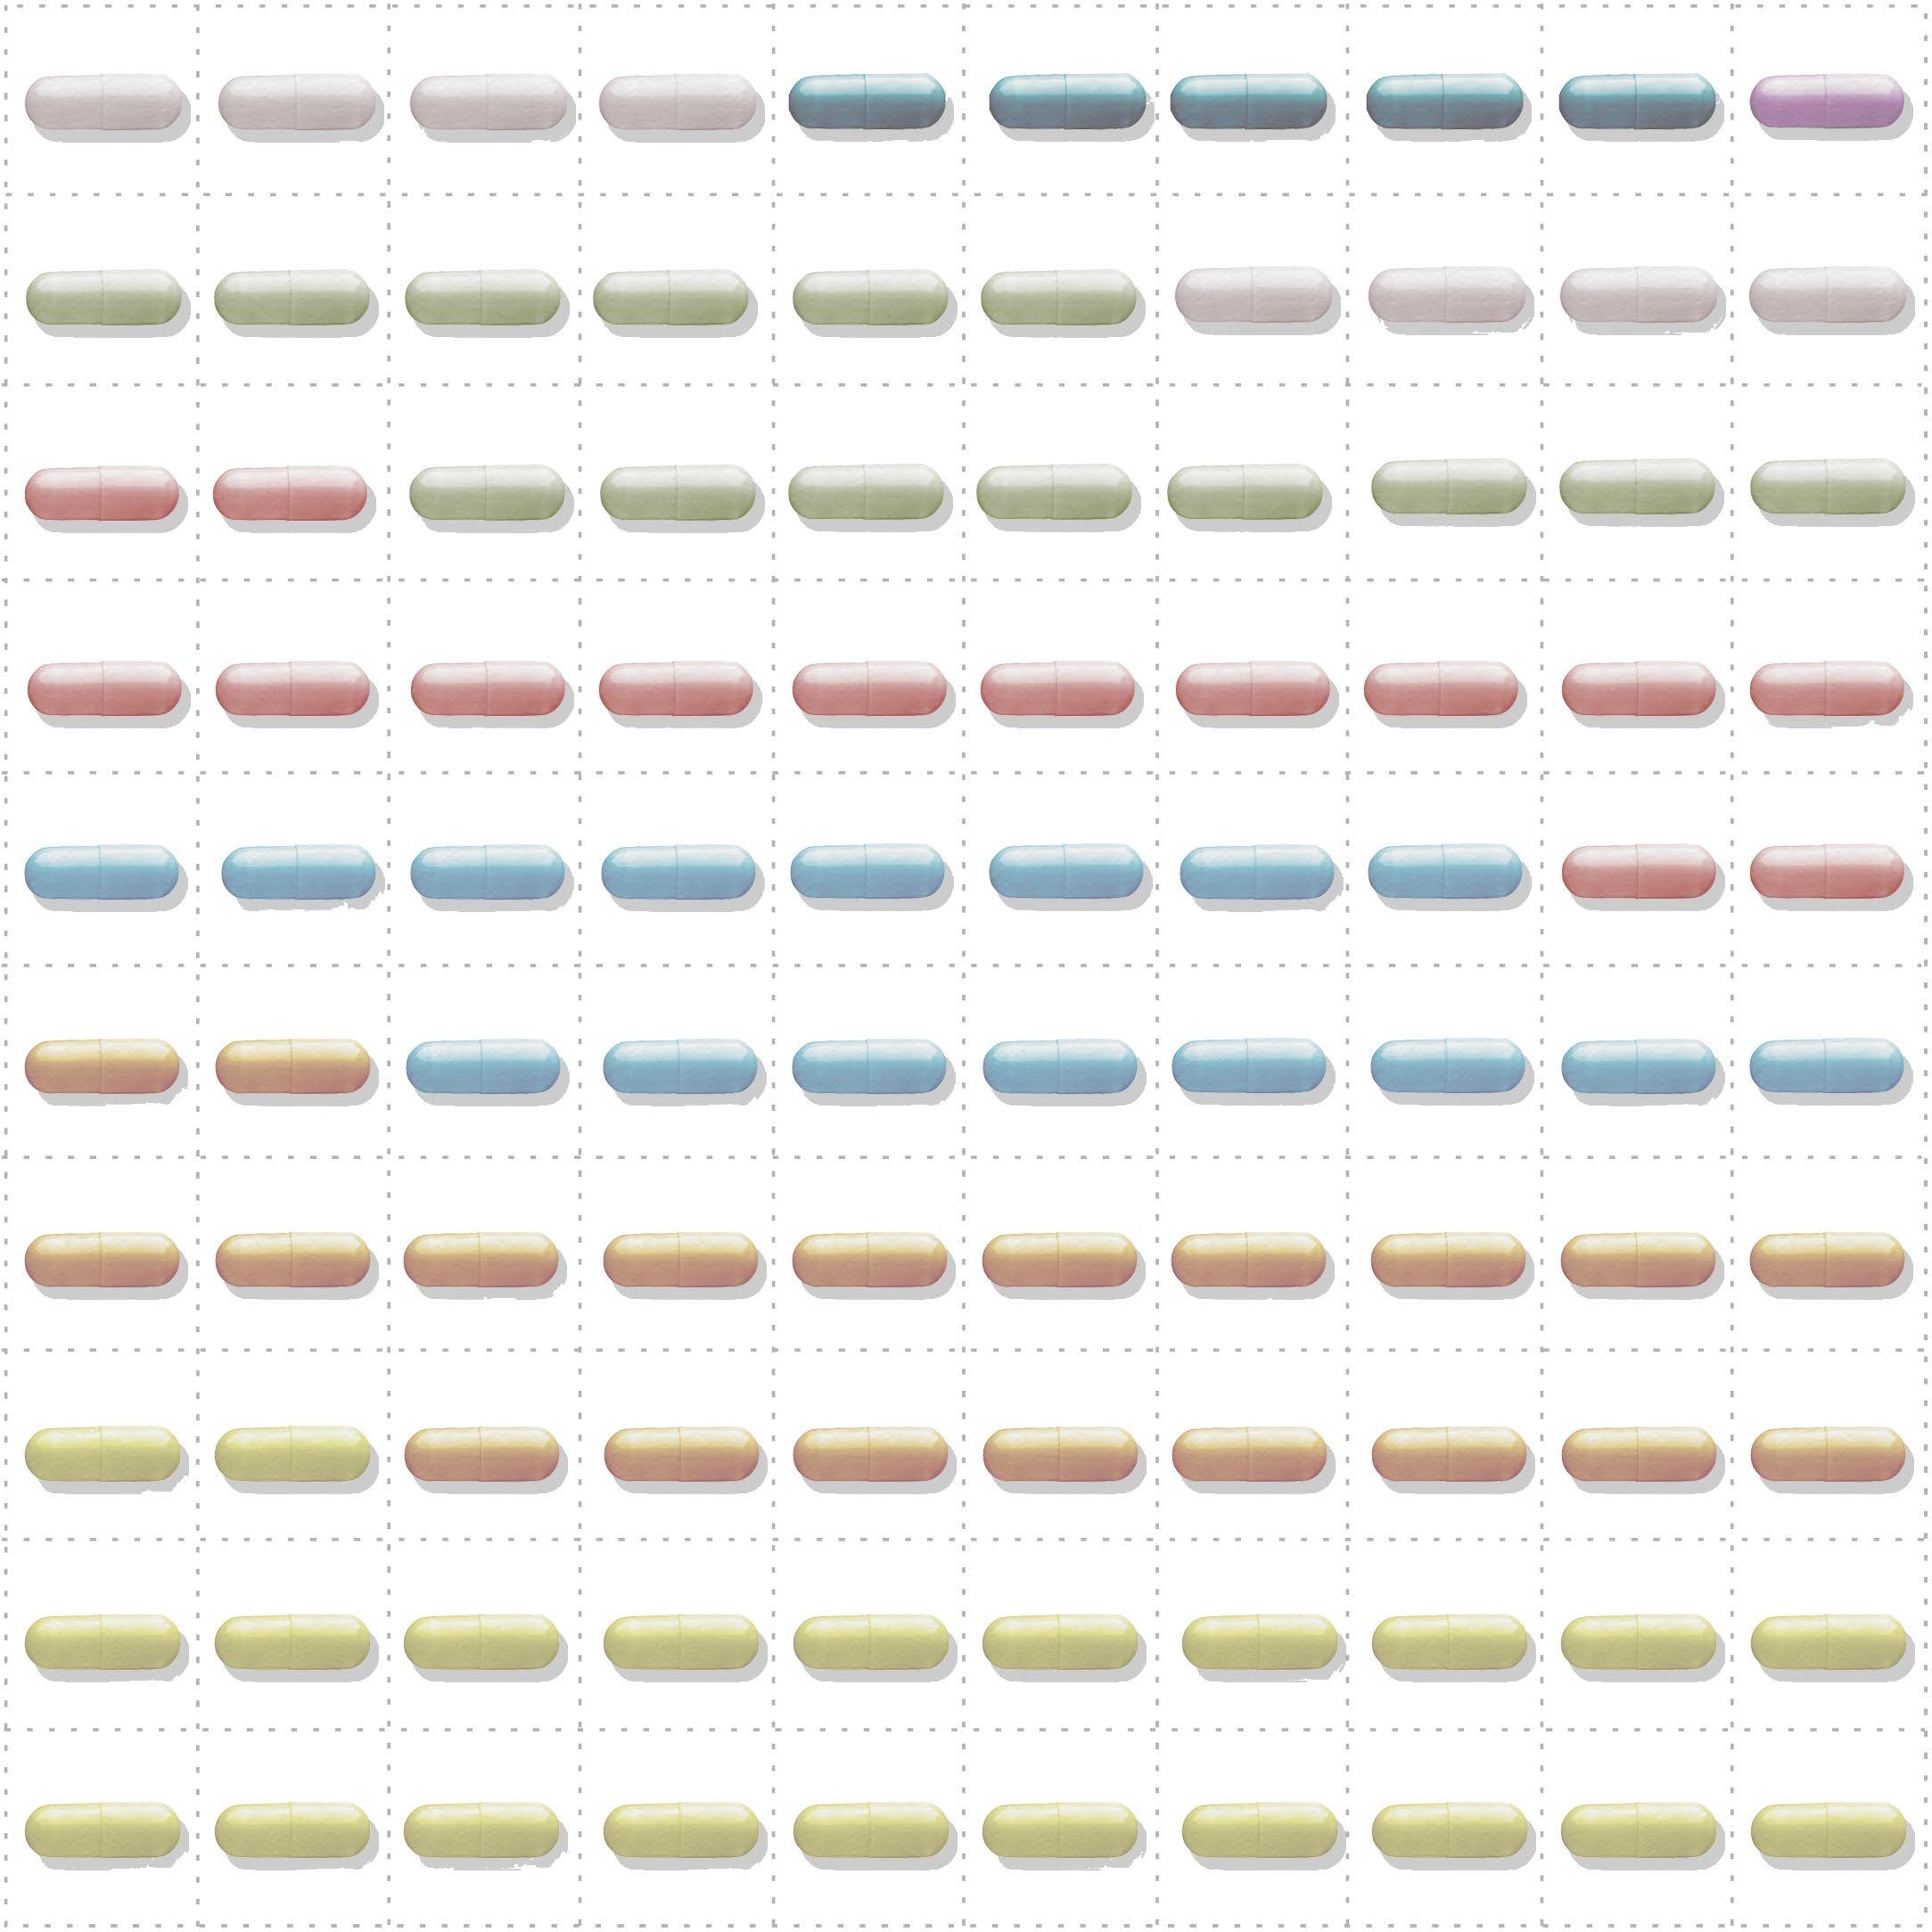
TYPES OF HEALTH AND WELLNESS
8 Dimensions of Health and Wellness
Health and wellness are about creating balance and fulfillment in life. they emerge from caring for the body, mind, and relationships, while also finding purpose, stability, and connection to the world around us. each element supports the others, reminding us that wellness is not a single goal, but a continuous journey of living well.”
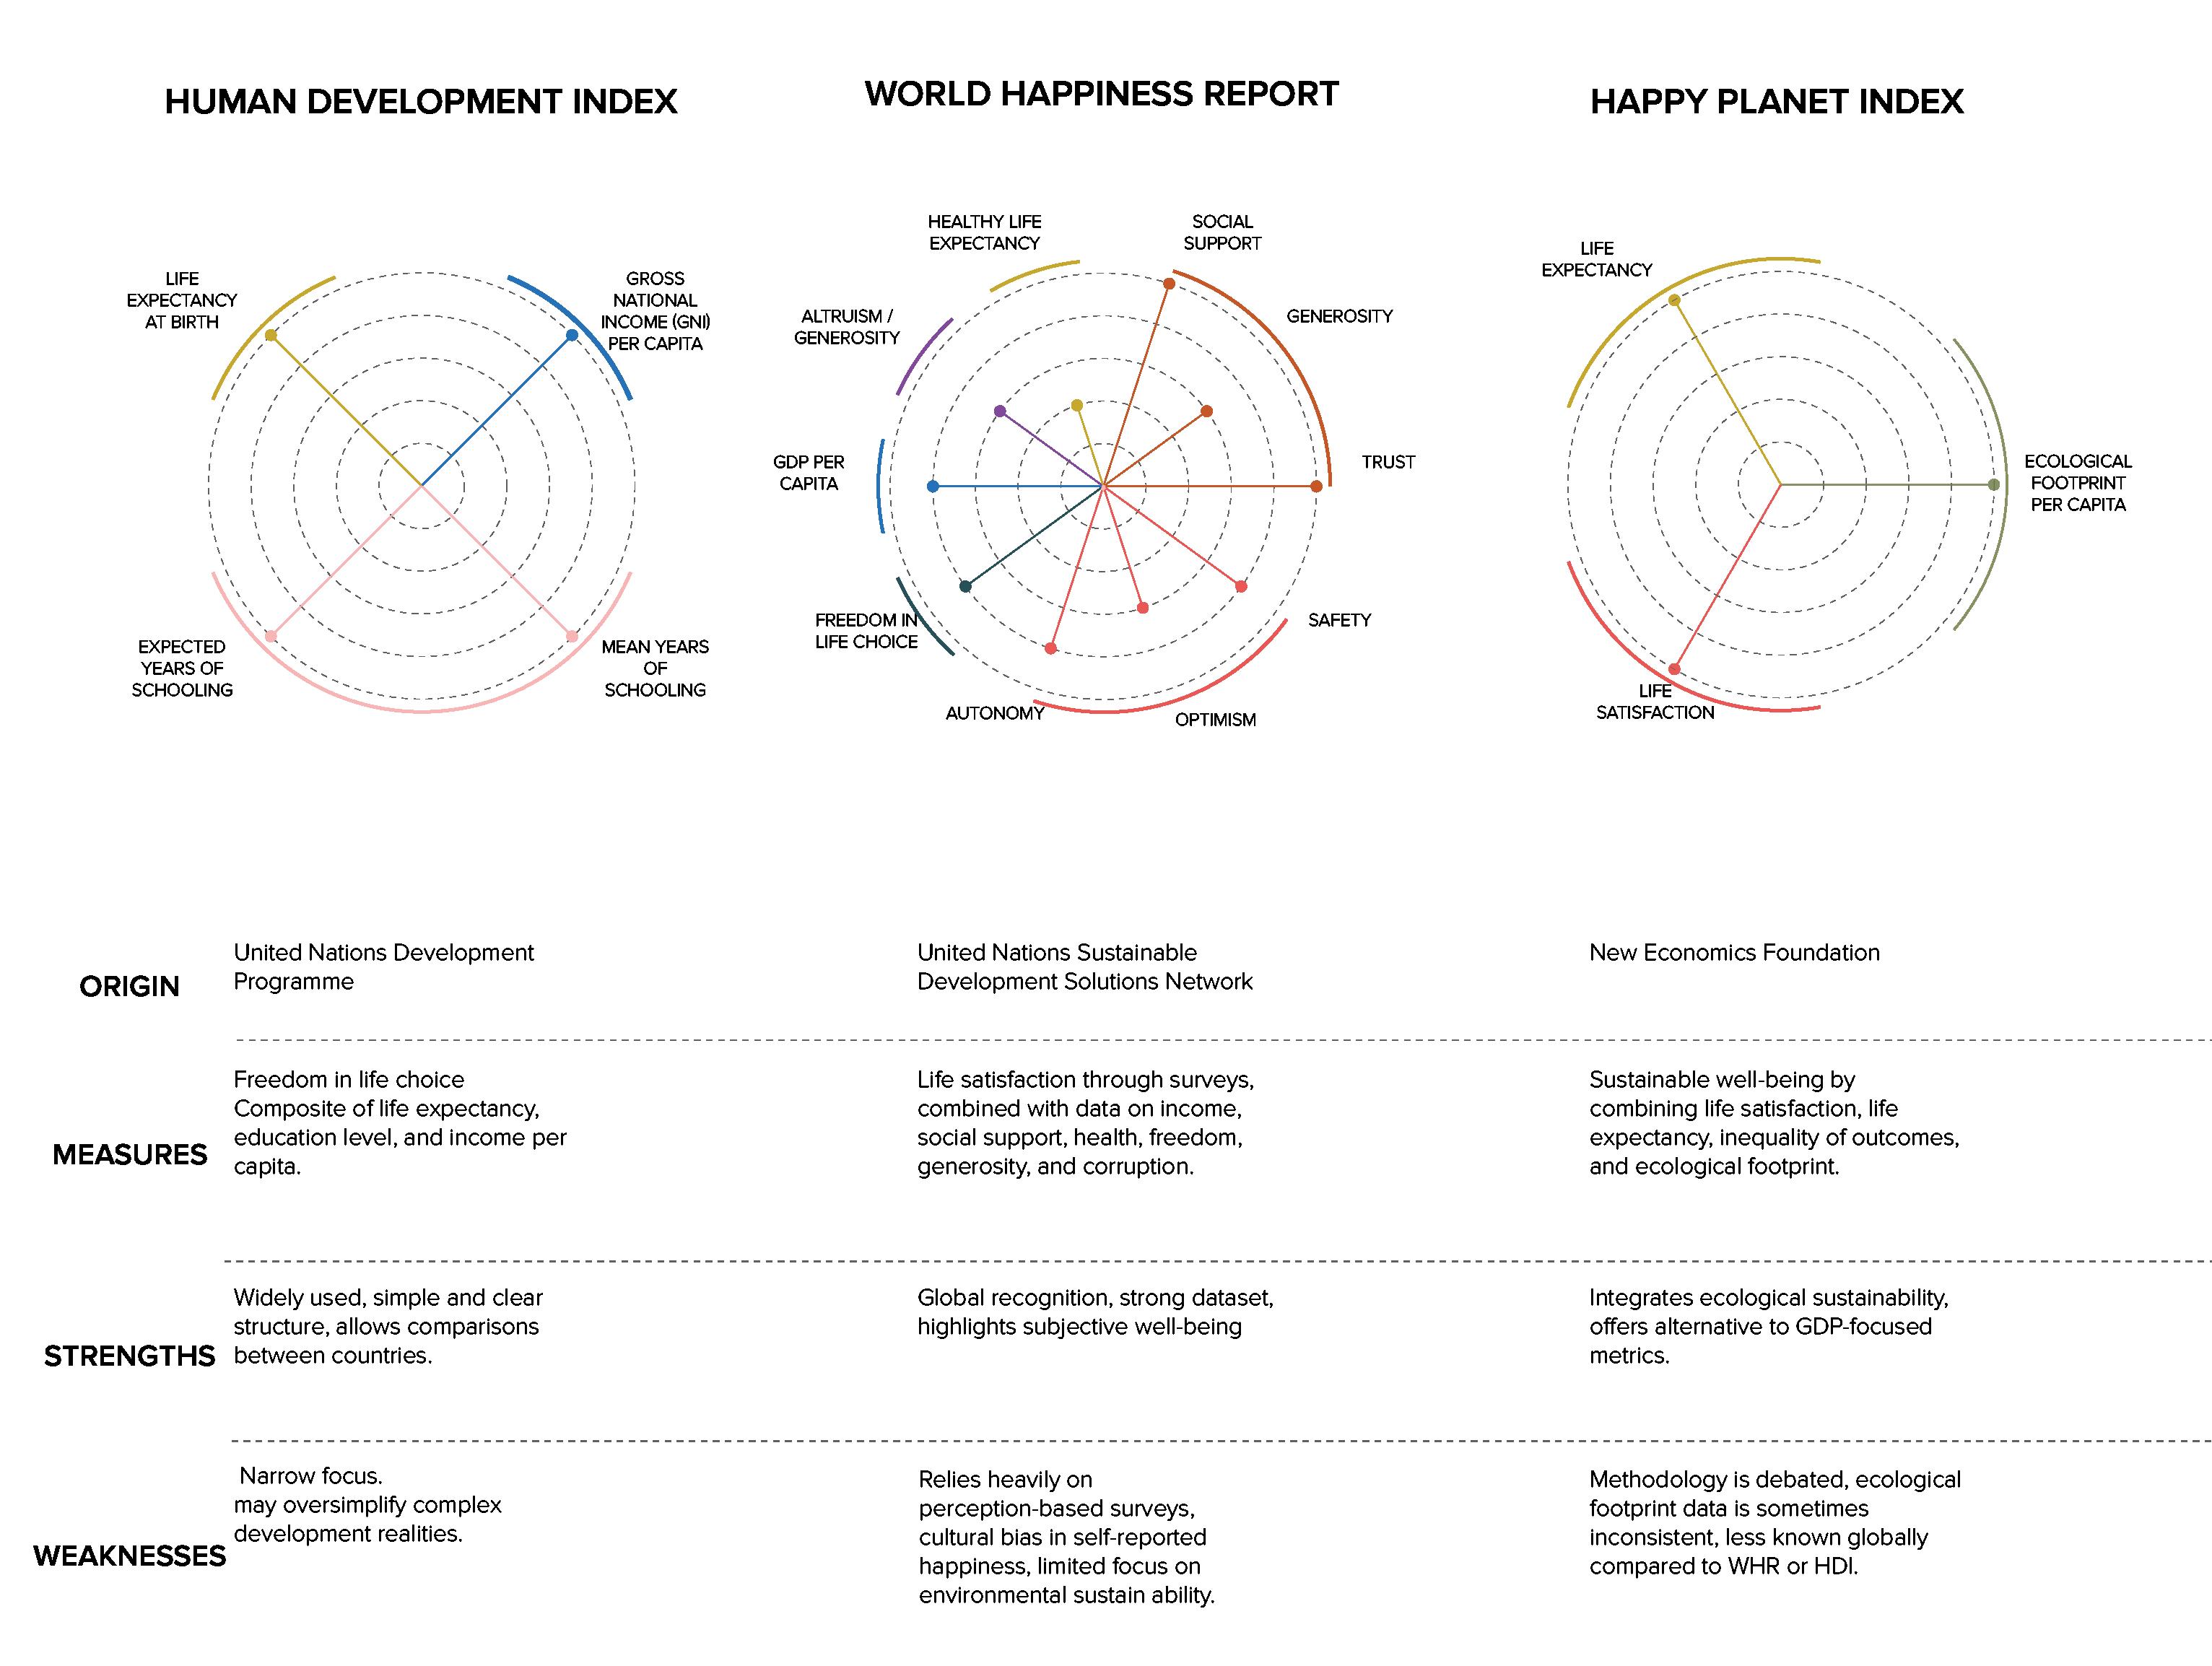
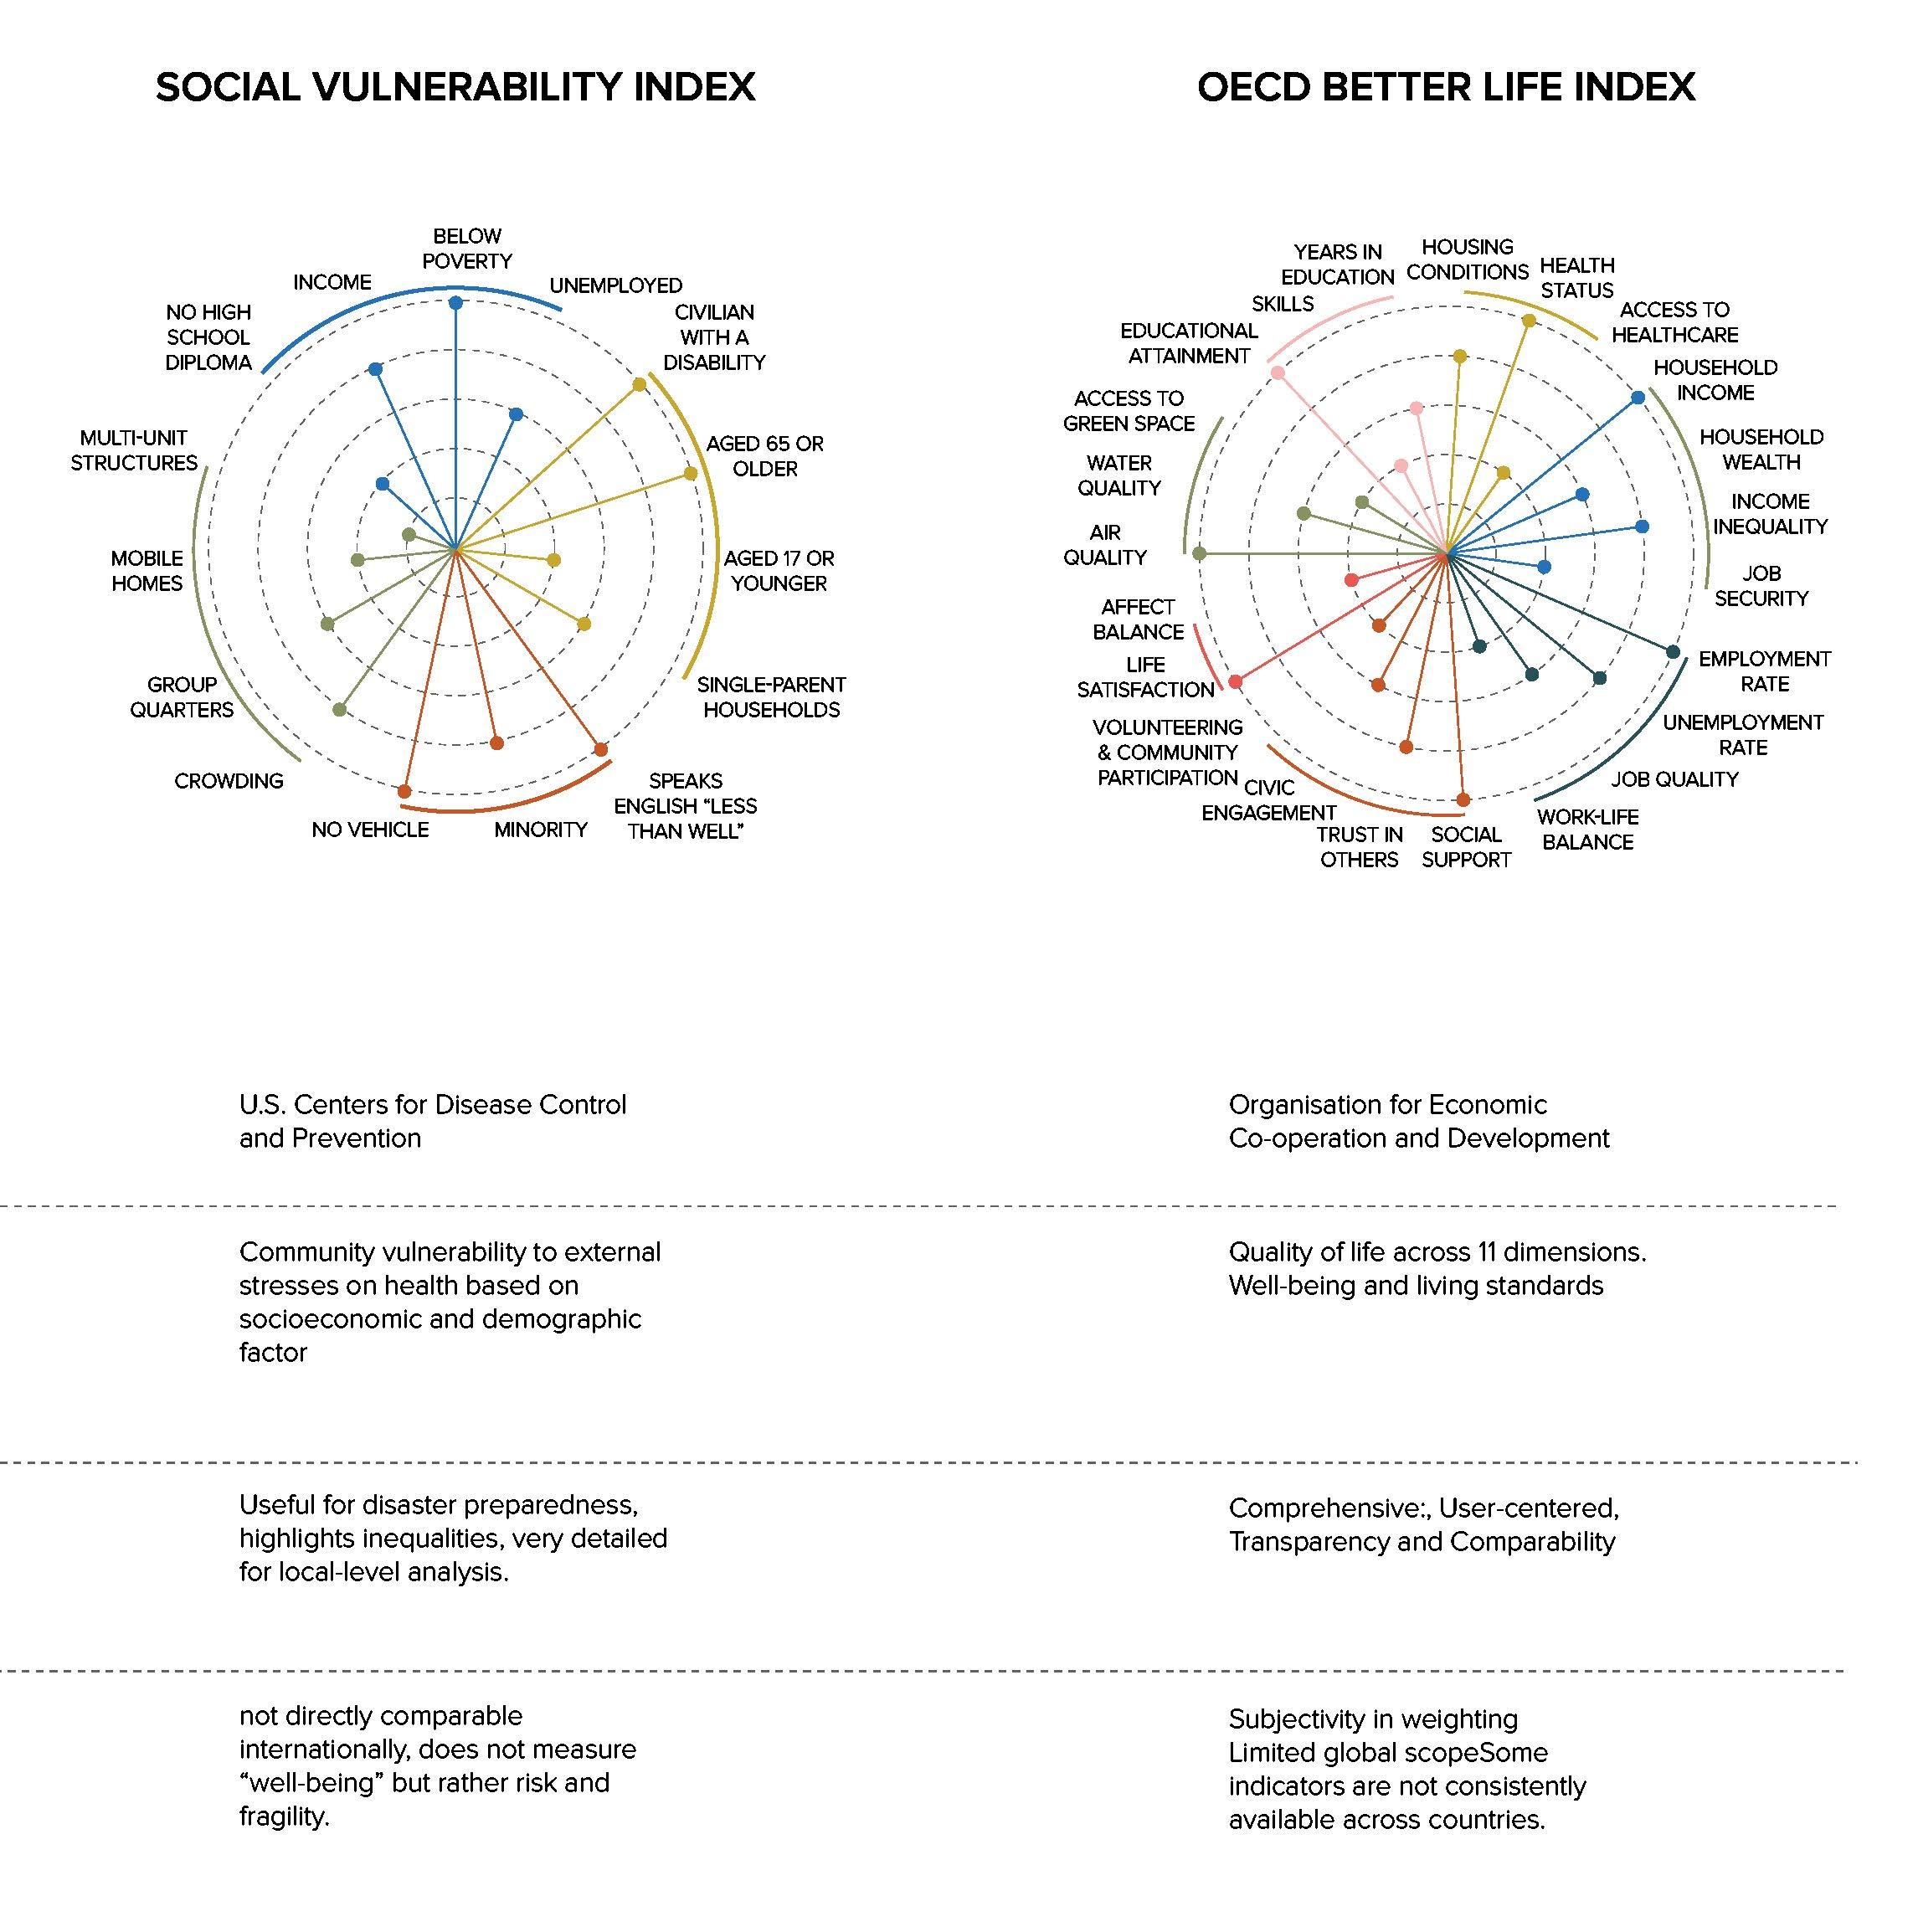
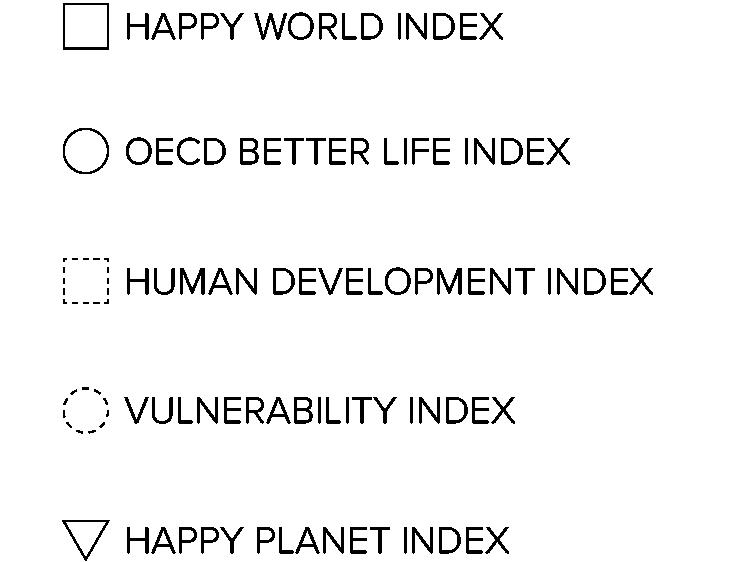
Comparing Global Health Indexes
Each index emphasizes different aspects of wellbeing and uses distinct parameters, reflecting the perspective and priorities of its respective authors. Because of these variations, each index alone provides only a limited understanding of overall health. Considering them together allows for a deeper appreciation of how health and wellbeing can be defined differently depending on the methodology, focus, and values of the creators of each index.
Own elaboration based on Helliwell, Layard & Sachs (2025), Abdallah, Thompson, Michaelson, Marks & Steuer (2006), UNDP (2025), OECD (2025) & CDC (2011)
EMOTIONAL
SOCIAL
PHYSICAL
ENVIRONMENTAL
OCCUPATIONAL
FINANCIAL
SPIRITUAL
INTELLECTUAL
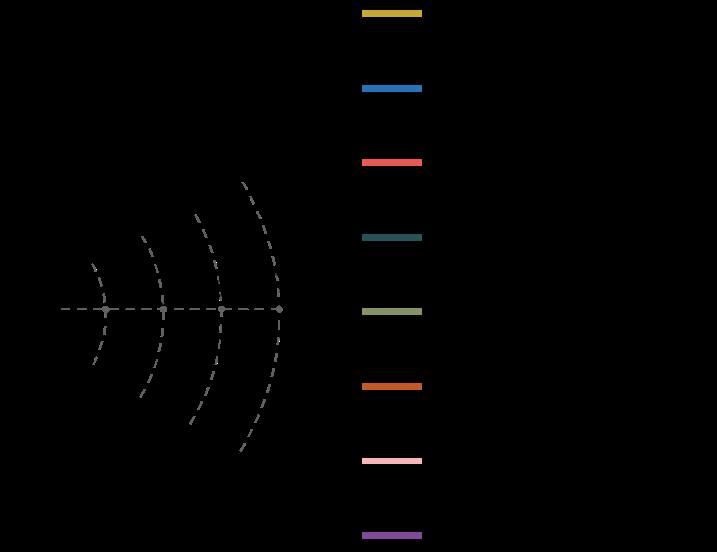
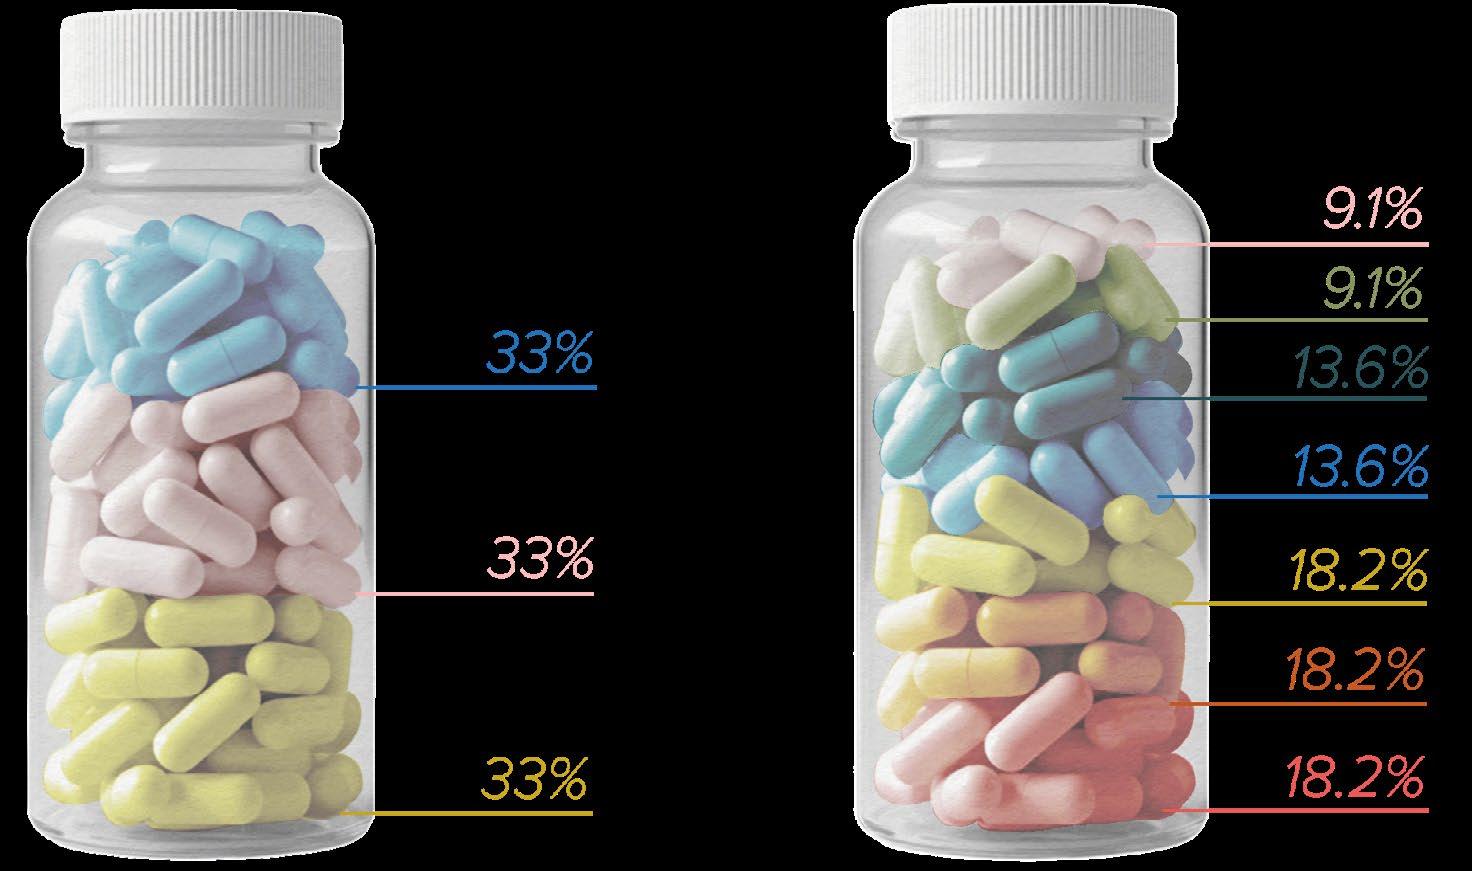
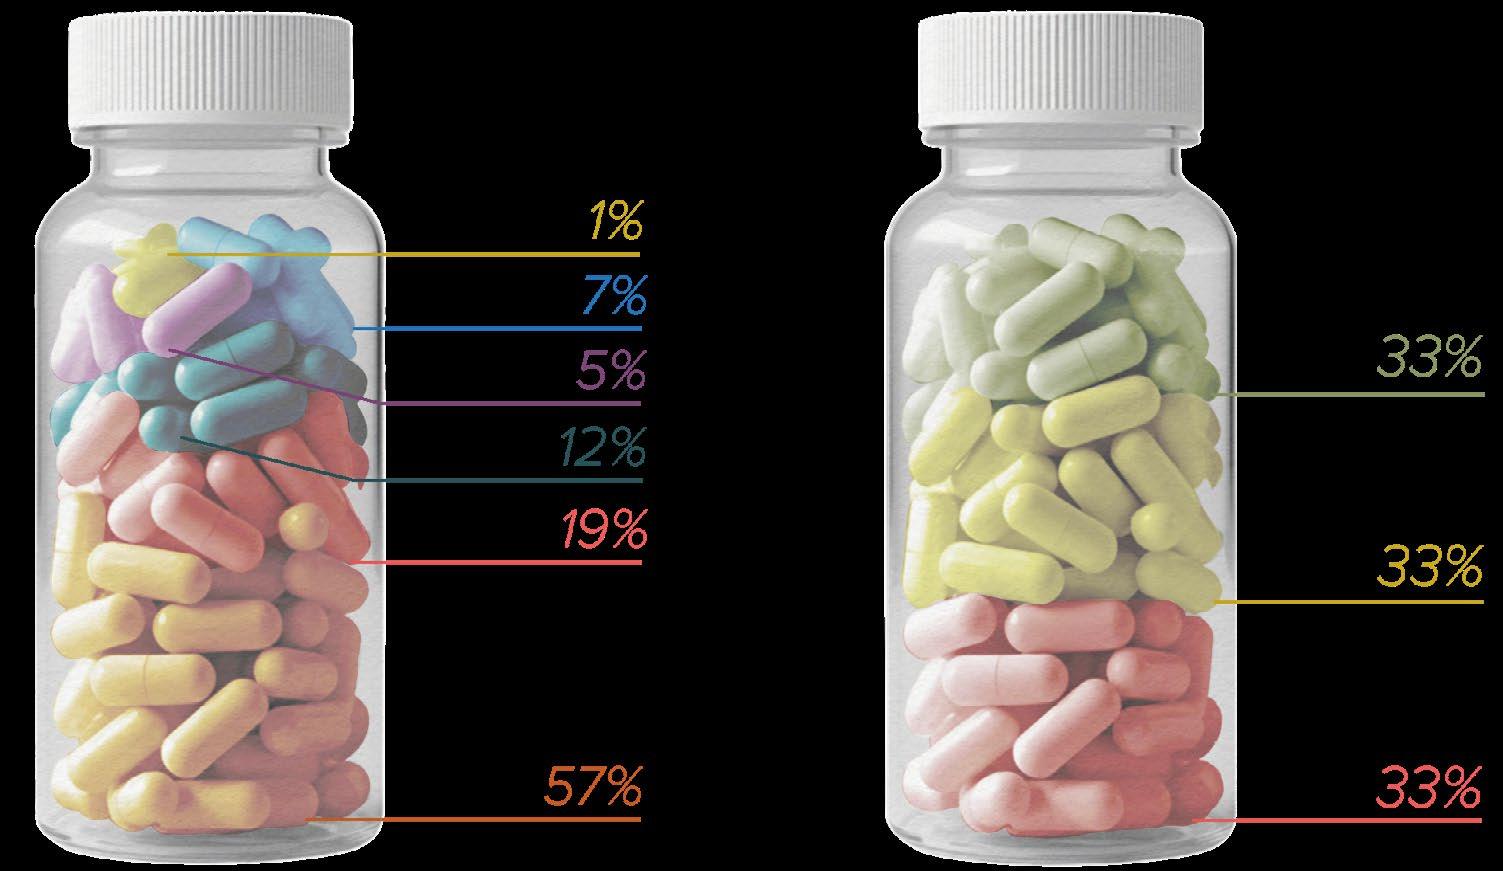
Frequency of Health Types in Individual Indexes
The following graphs illustrate the frequency with which each topic was incorporated into the measurement systems of the selected international indexes By mapping the number of times each topic appears across these frameworks, the graphs highlight which dimensions of wellbeing and sustainability are prioritized most consistently, and which receive comparatively less attention.
The World Happiness Report
Happy Planet Index
Social Vulnerability Index
Human Development Index
OECD
Better Life Index
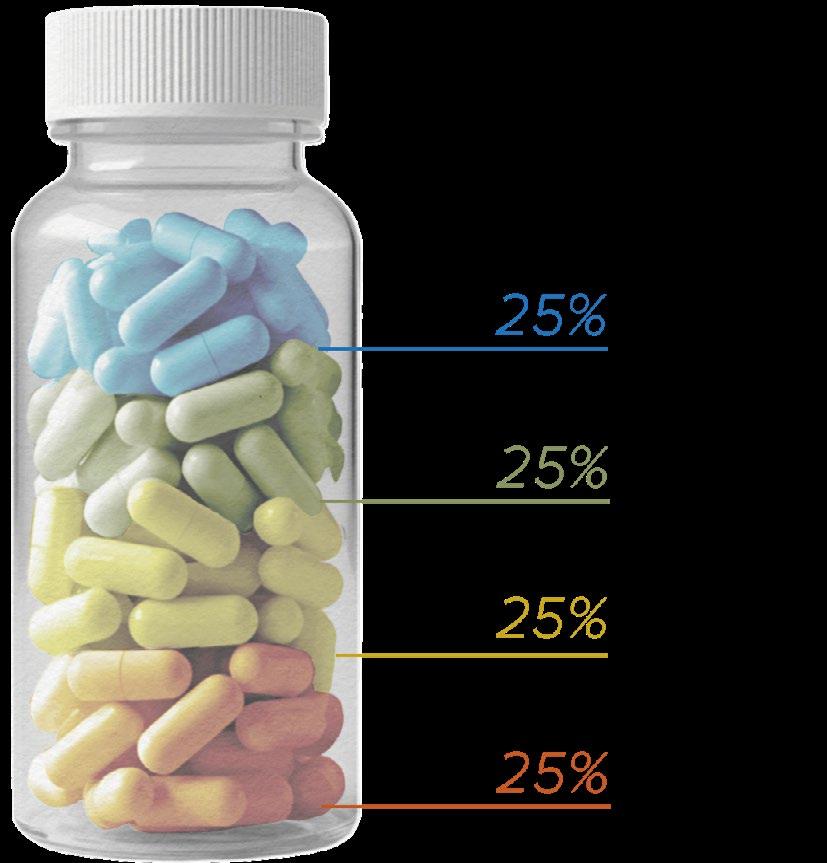
The graph presents the final percentage distribution of how often each theme was considered across the five indexes analyzed. This visualization summarizes the relative weight given to each theme,offering insight into the dimensions of wellbeing and sustainability most emphasized within these international measurement systems.
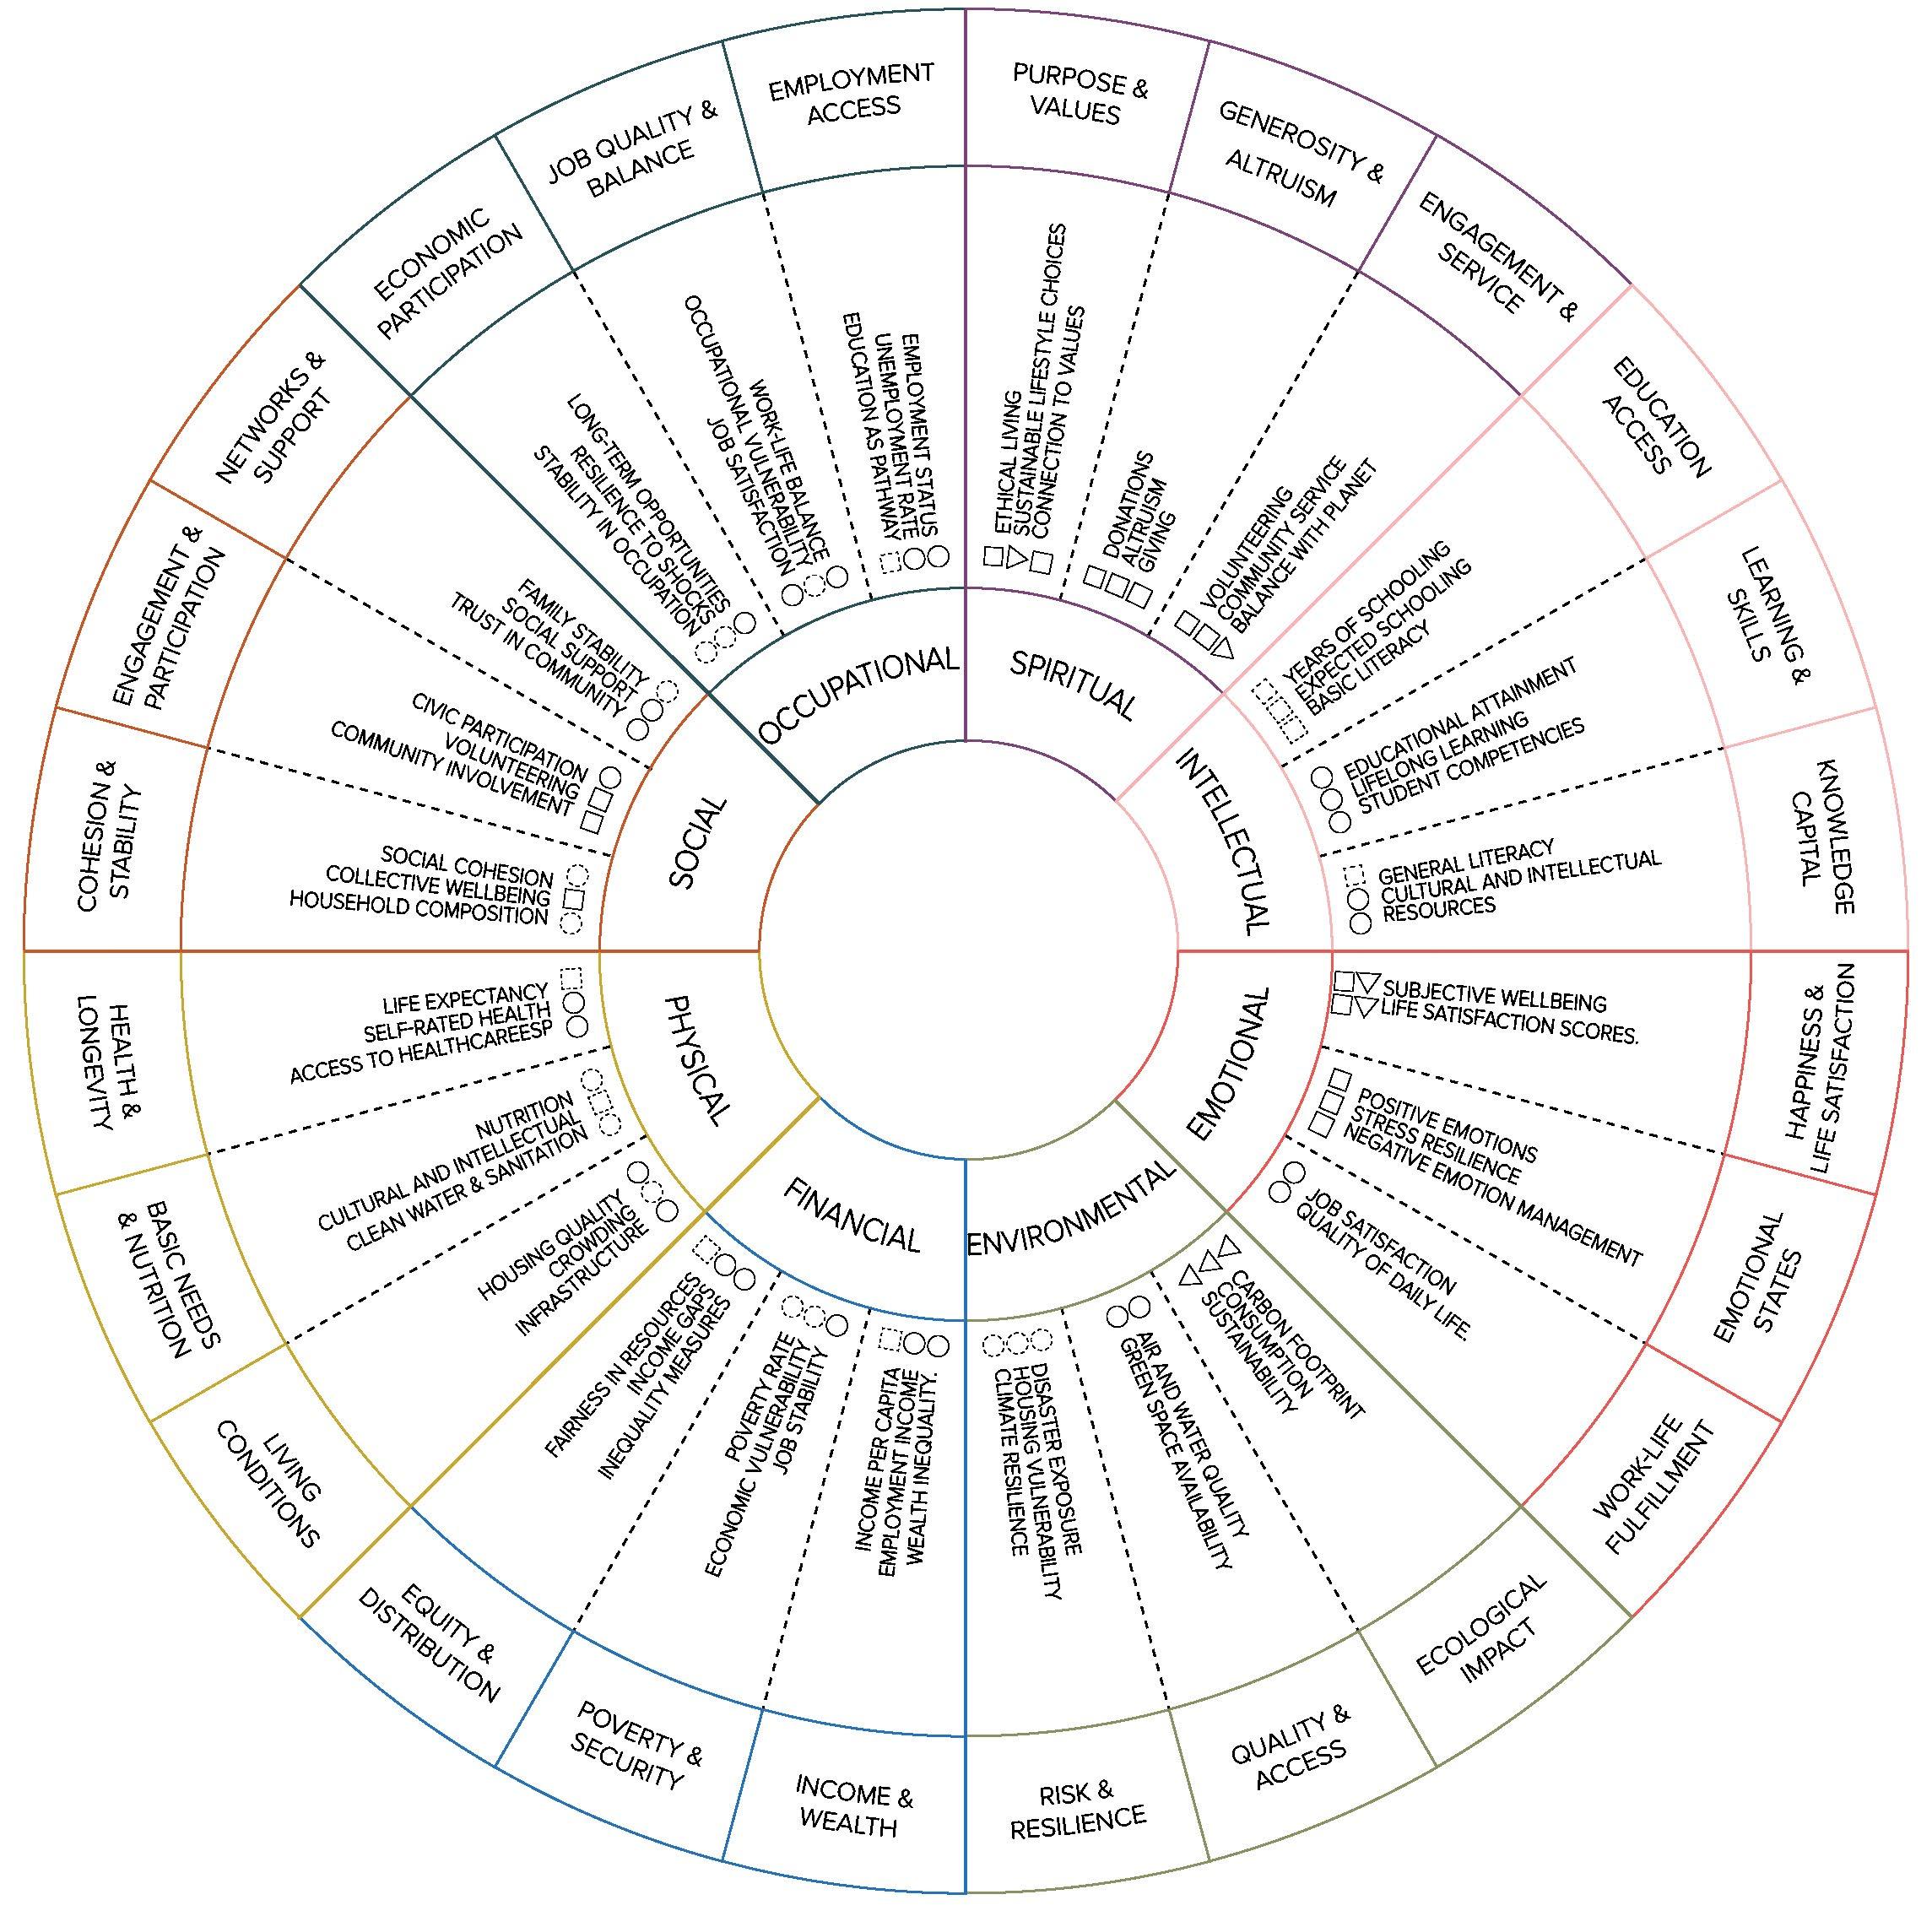
Cross-Index Health Dimension Coverage
Each index emphasizes different aspects of wellbeing and uses distinct parameters, reflecting unique perspectives on what constitutes a healthy and thriving population. Viewed in isolation, these indices provide only a partial understanding of overall health. By combining their coverage, the chart highlights both overlaps and gaps, enabling the identification of generalized parameters that capture a more comprehensive and holistic picture of health and wellbeing.
Own elaboration based on Helliwell, Layard & Sachs (2025), Abdallah, Thompson, Michaelson, Marks & Steuer (2006), UNDP (2025), OECD (2025) & CDC (2011)
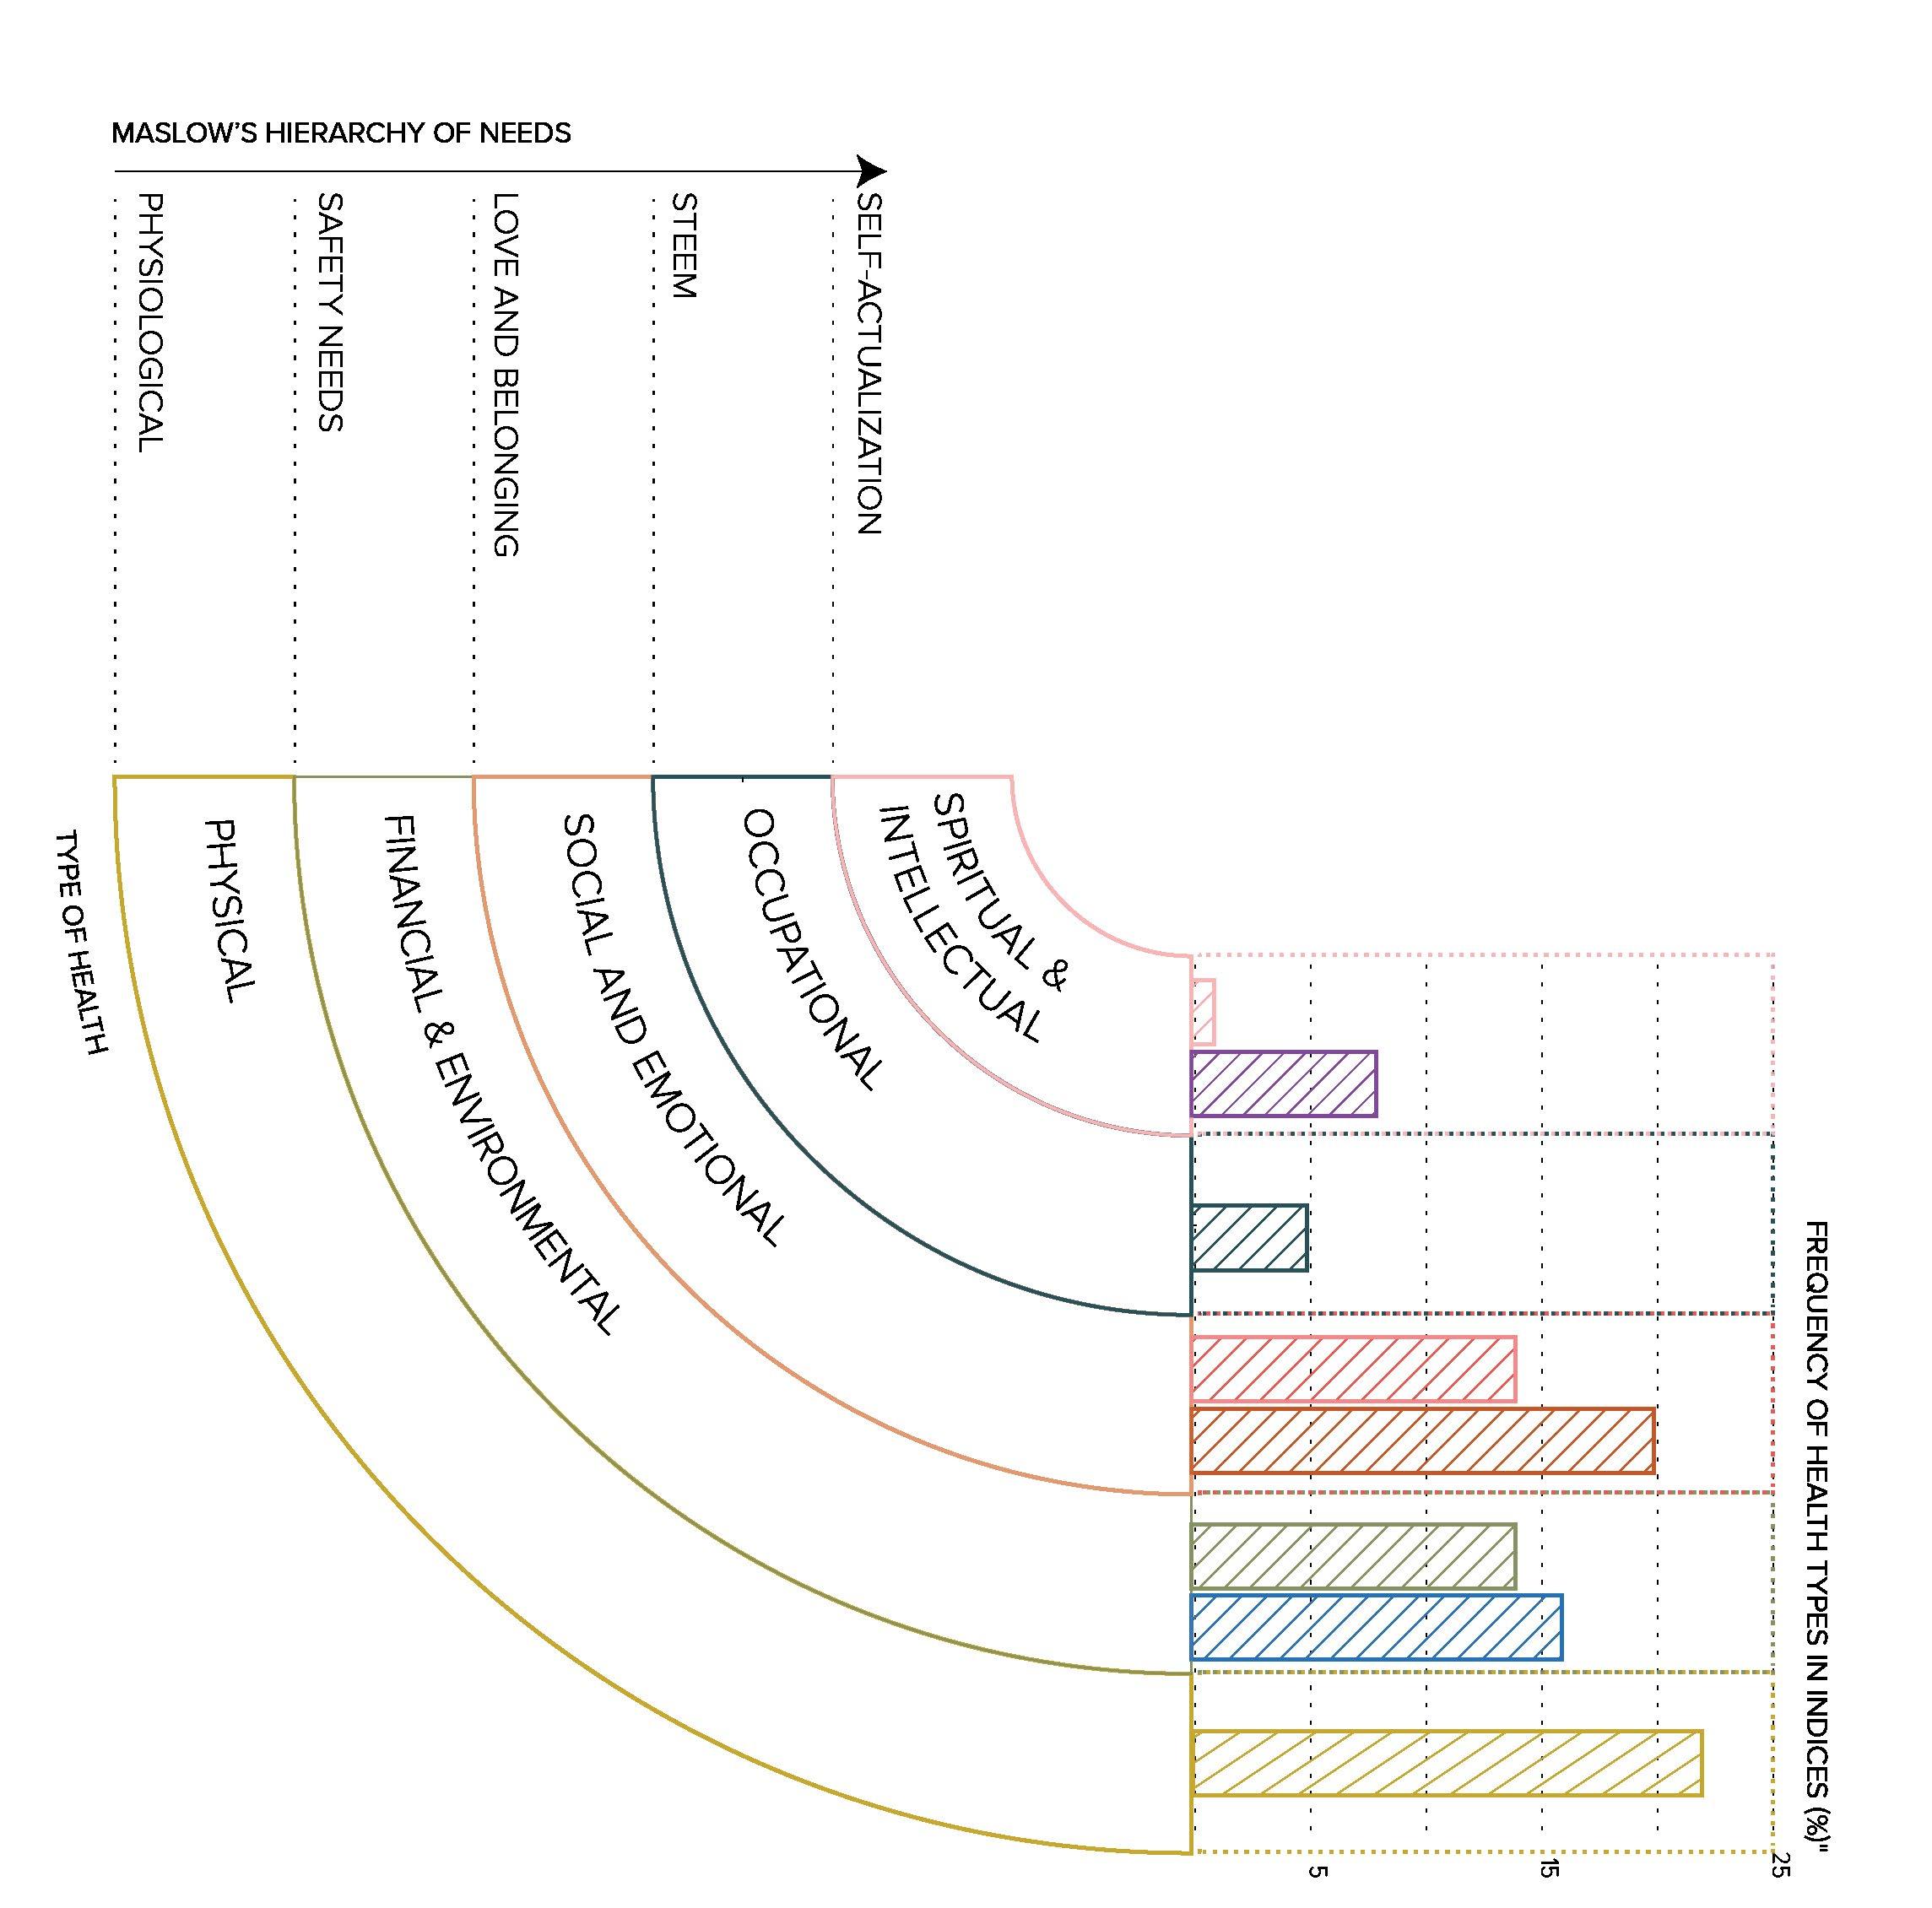
How to
measure a Holistic Wellness
This framework draws on Maslow’s hierarchy of needs as a conceptual foundation, integrating diferent dimensions of health into a unified structure. By aligning all the aspects of well-being with Maslow’s model, it aims to establish a holistic analytical tool capable of addressing gaps often overlooked, and helping understading the the behaviour of the types of health.
Own elaboration based on Helliwell, Layard & Sachs (2025), Abdallah, Thompson, Michaelson, Marks & Steuer (2006), UNDP (2025), OECD (2025) & CDC (2011)
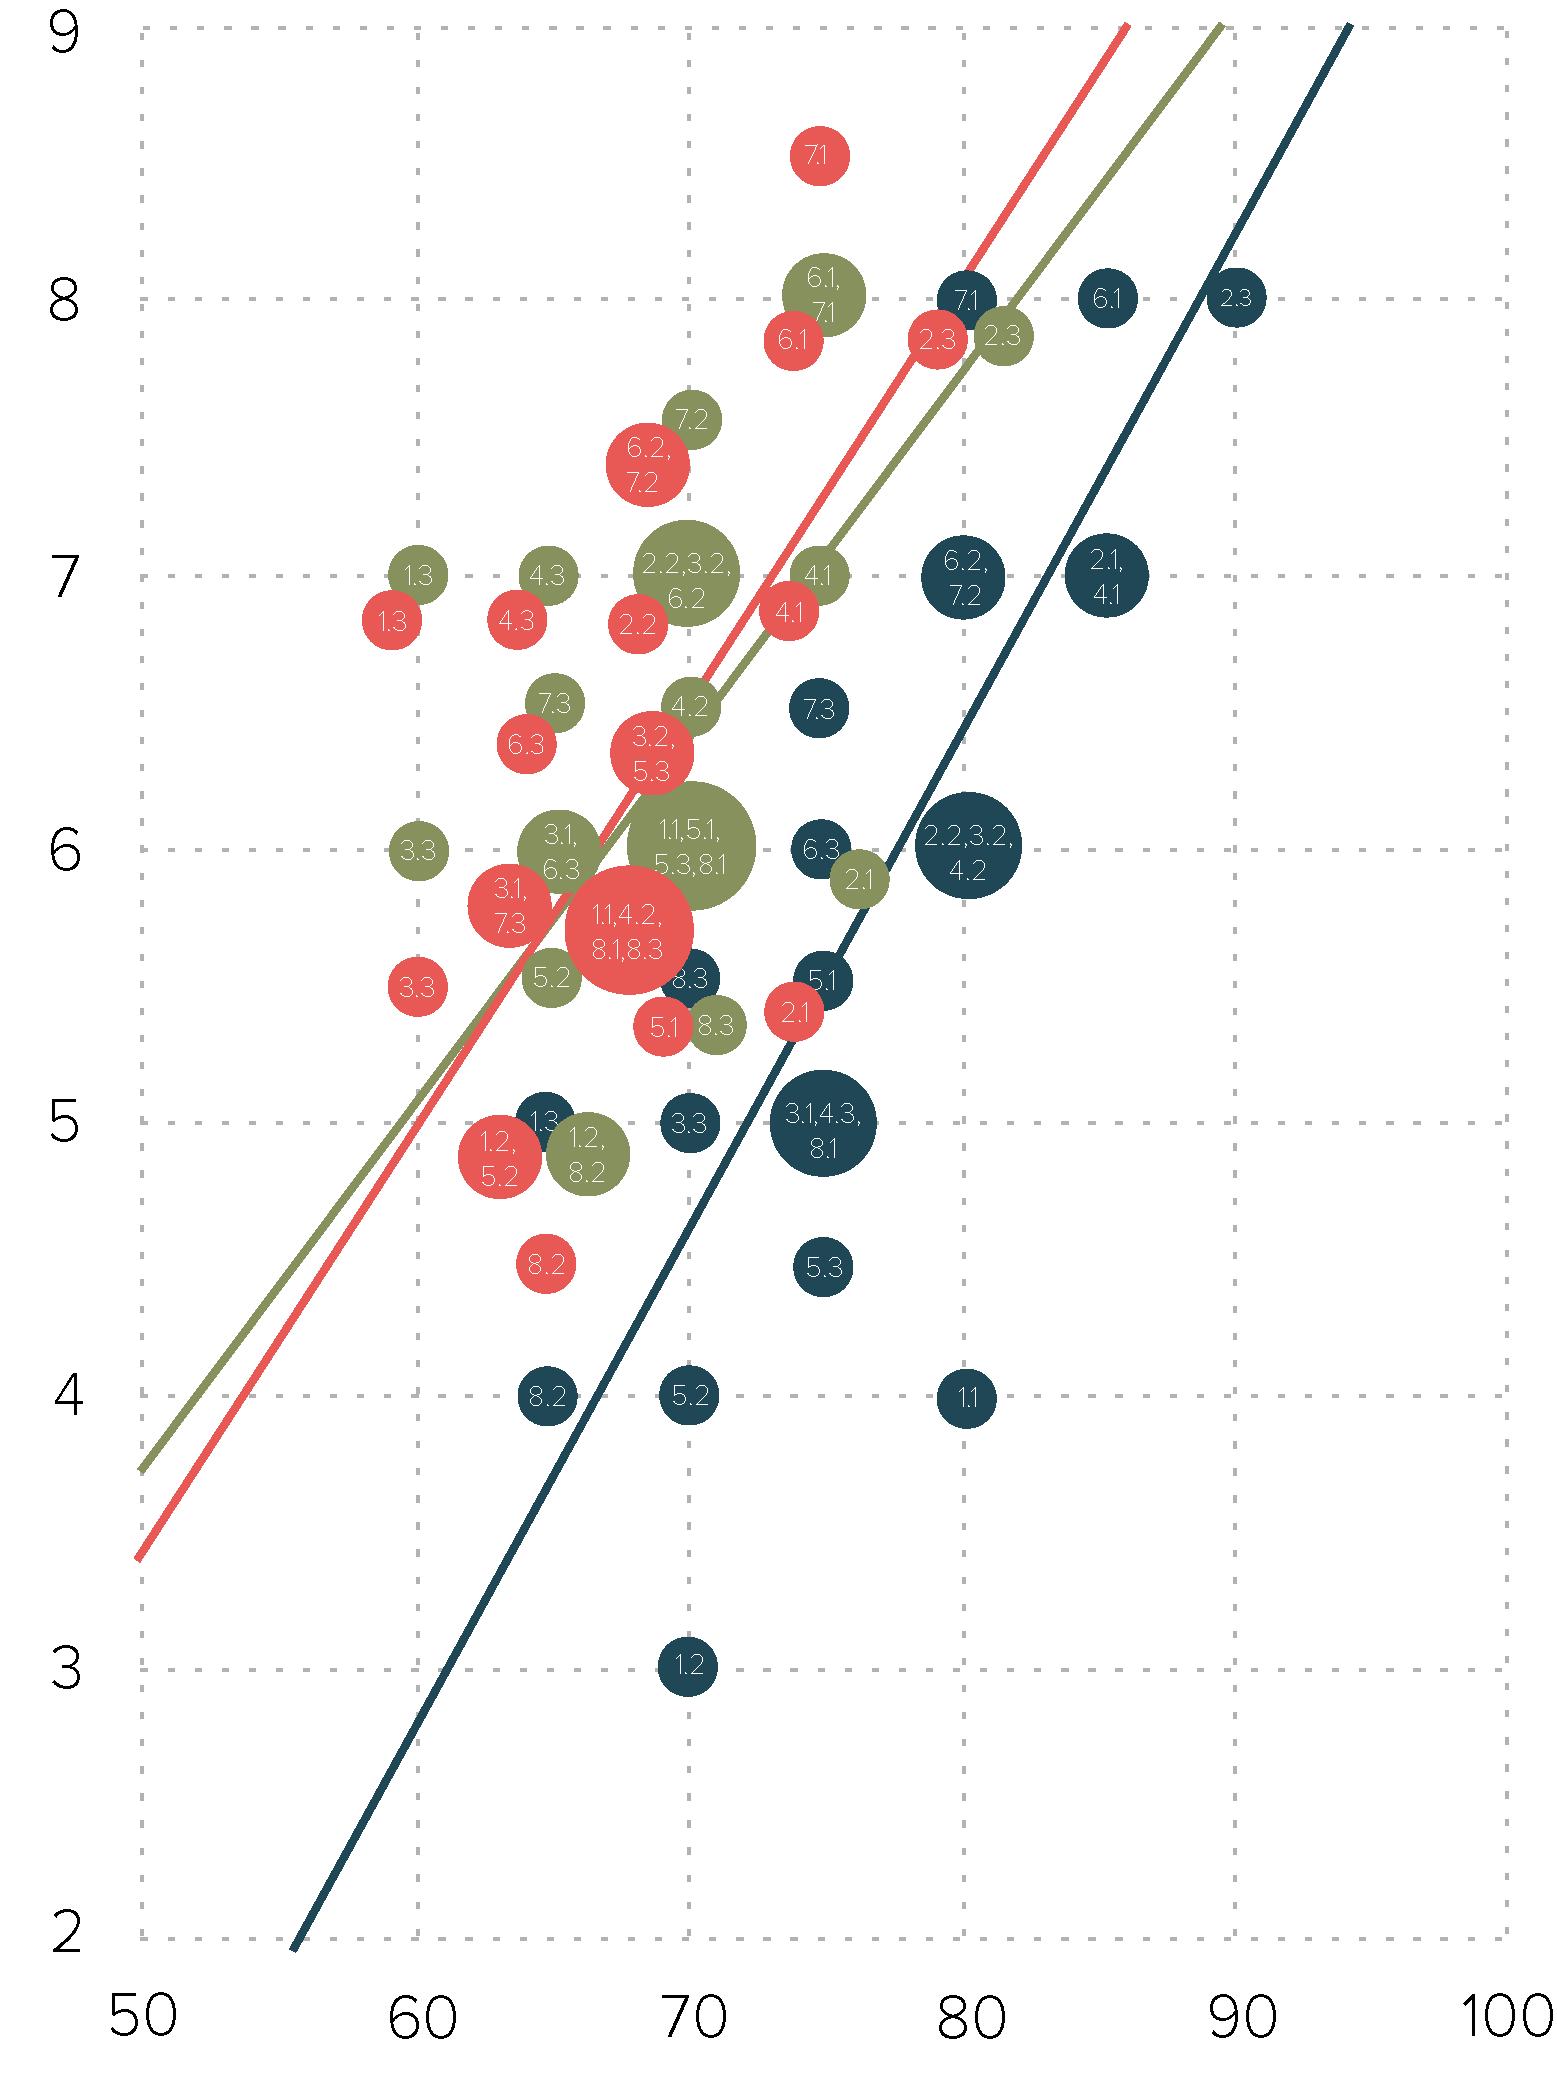
Comparative Vulnerability: National and Global Scales
In the USA, vulnerabilities show high impact but lower probability, mainly in poverty and security, job quality, and environmental access. Mexico and the World show the reverse: higher-probability vulnerabilities with lower impact. For Mexico, these center on poverty and security, job quality, and emotional states; for the World, on health, environmental access, purpose, and generosity.
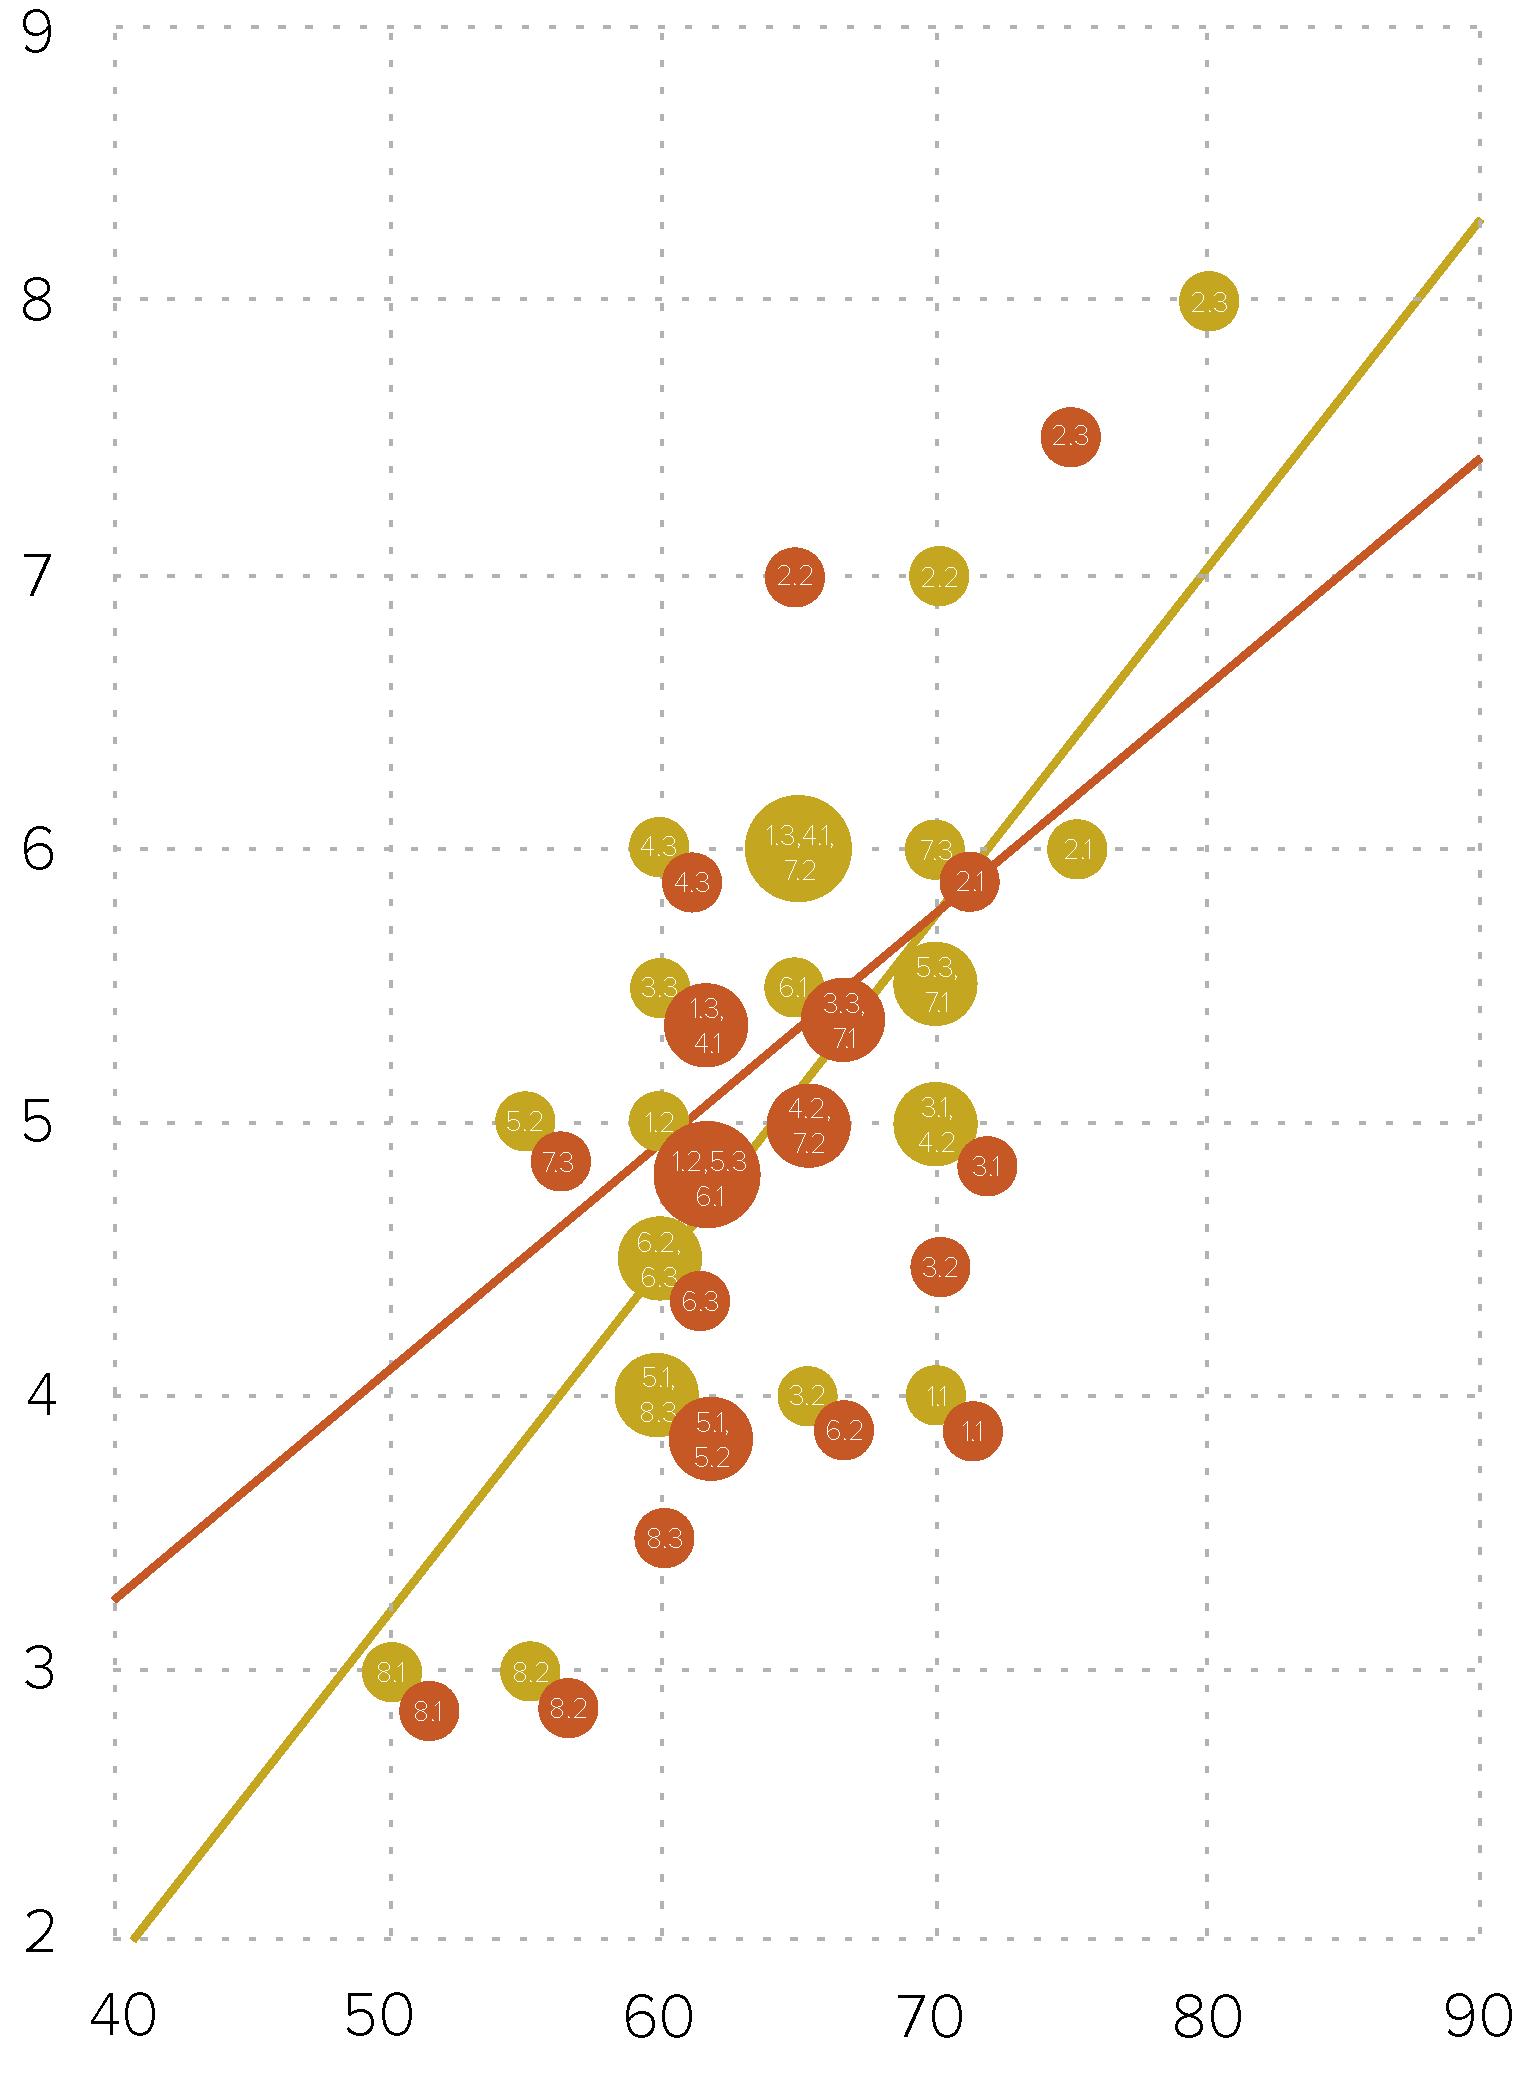
Comparative Vulnerability: Urban Scale
The analysis shows that Chicago’s vulnerabilities have higher probability but not the highest impact, concentrated in living conditions, ecological impact, and learning and skills. Querétaro, in contrast, shows higher-impact vulnerabilities with moderate probability, including health and longevity, employment access, job quality and balance, economic participation, and educational access.
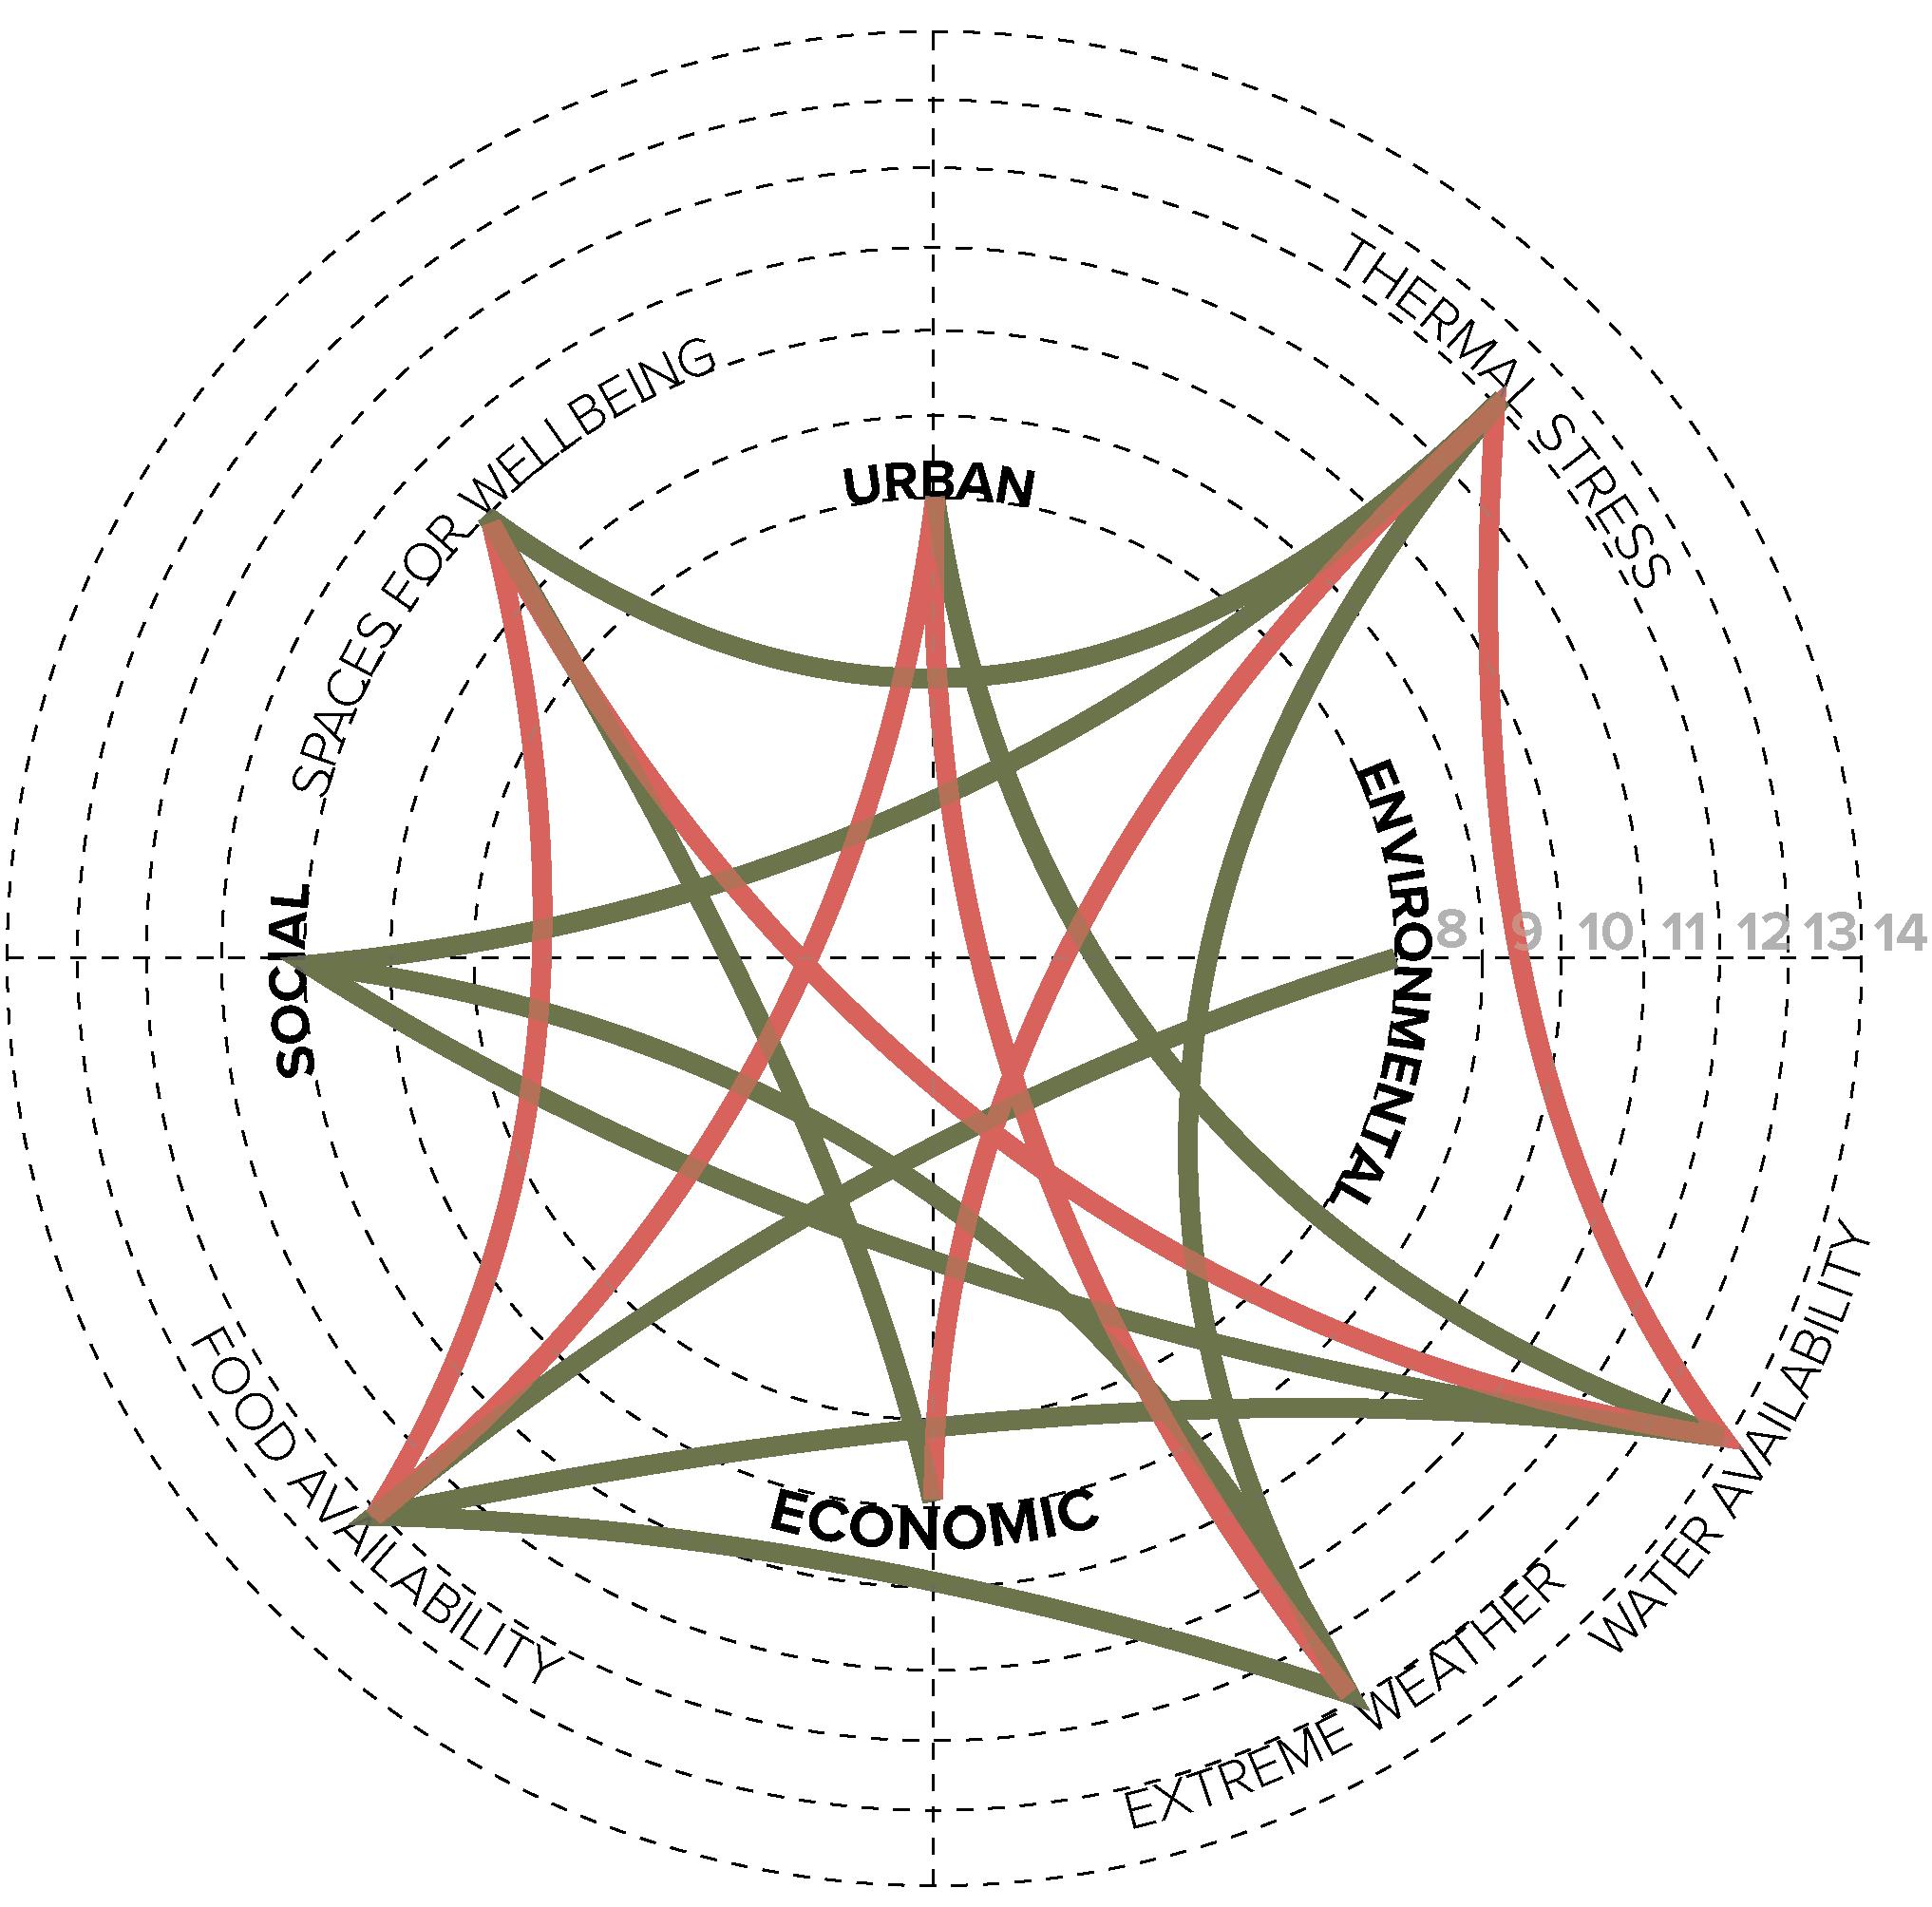
Conceptual Framework of Initial Interrelated Research Themes
The diagram illustrates the interconnectedness of the main themes explored in this research. Connecting the four critical challenges with the five lines of research and strategies. Each line represents a relationship between concepts emphasizing that none of these dimensions can be fully understood in isolation. This framework provides the foundation for the paper’s structure, while highlighting the systemic nature of the challenges addressed.
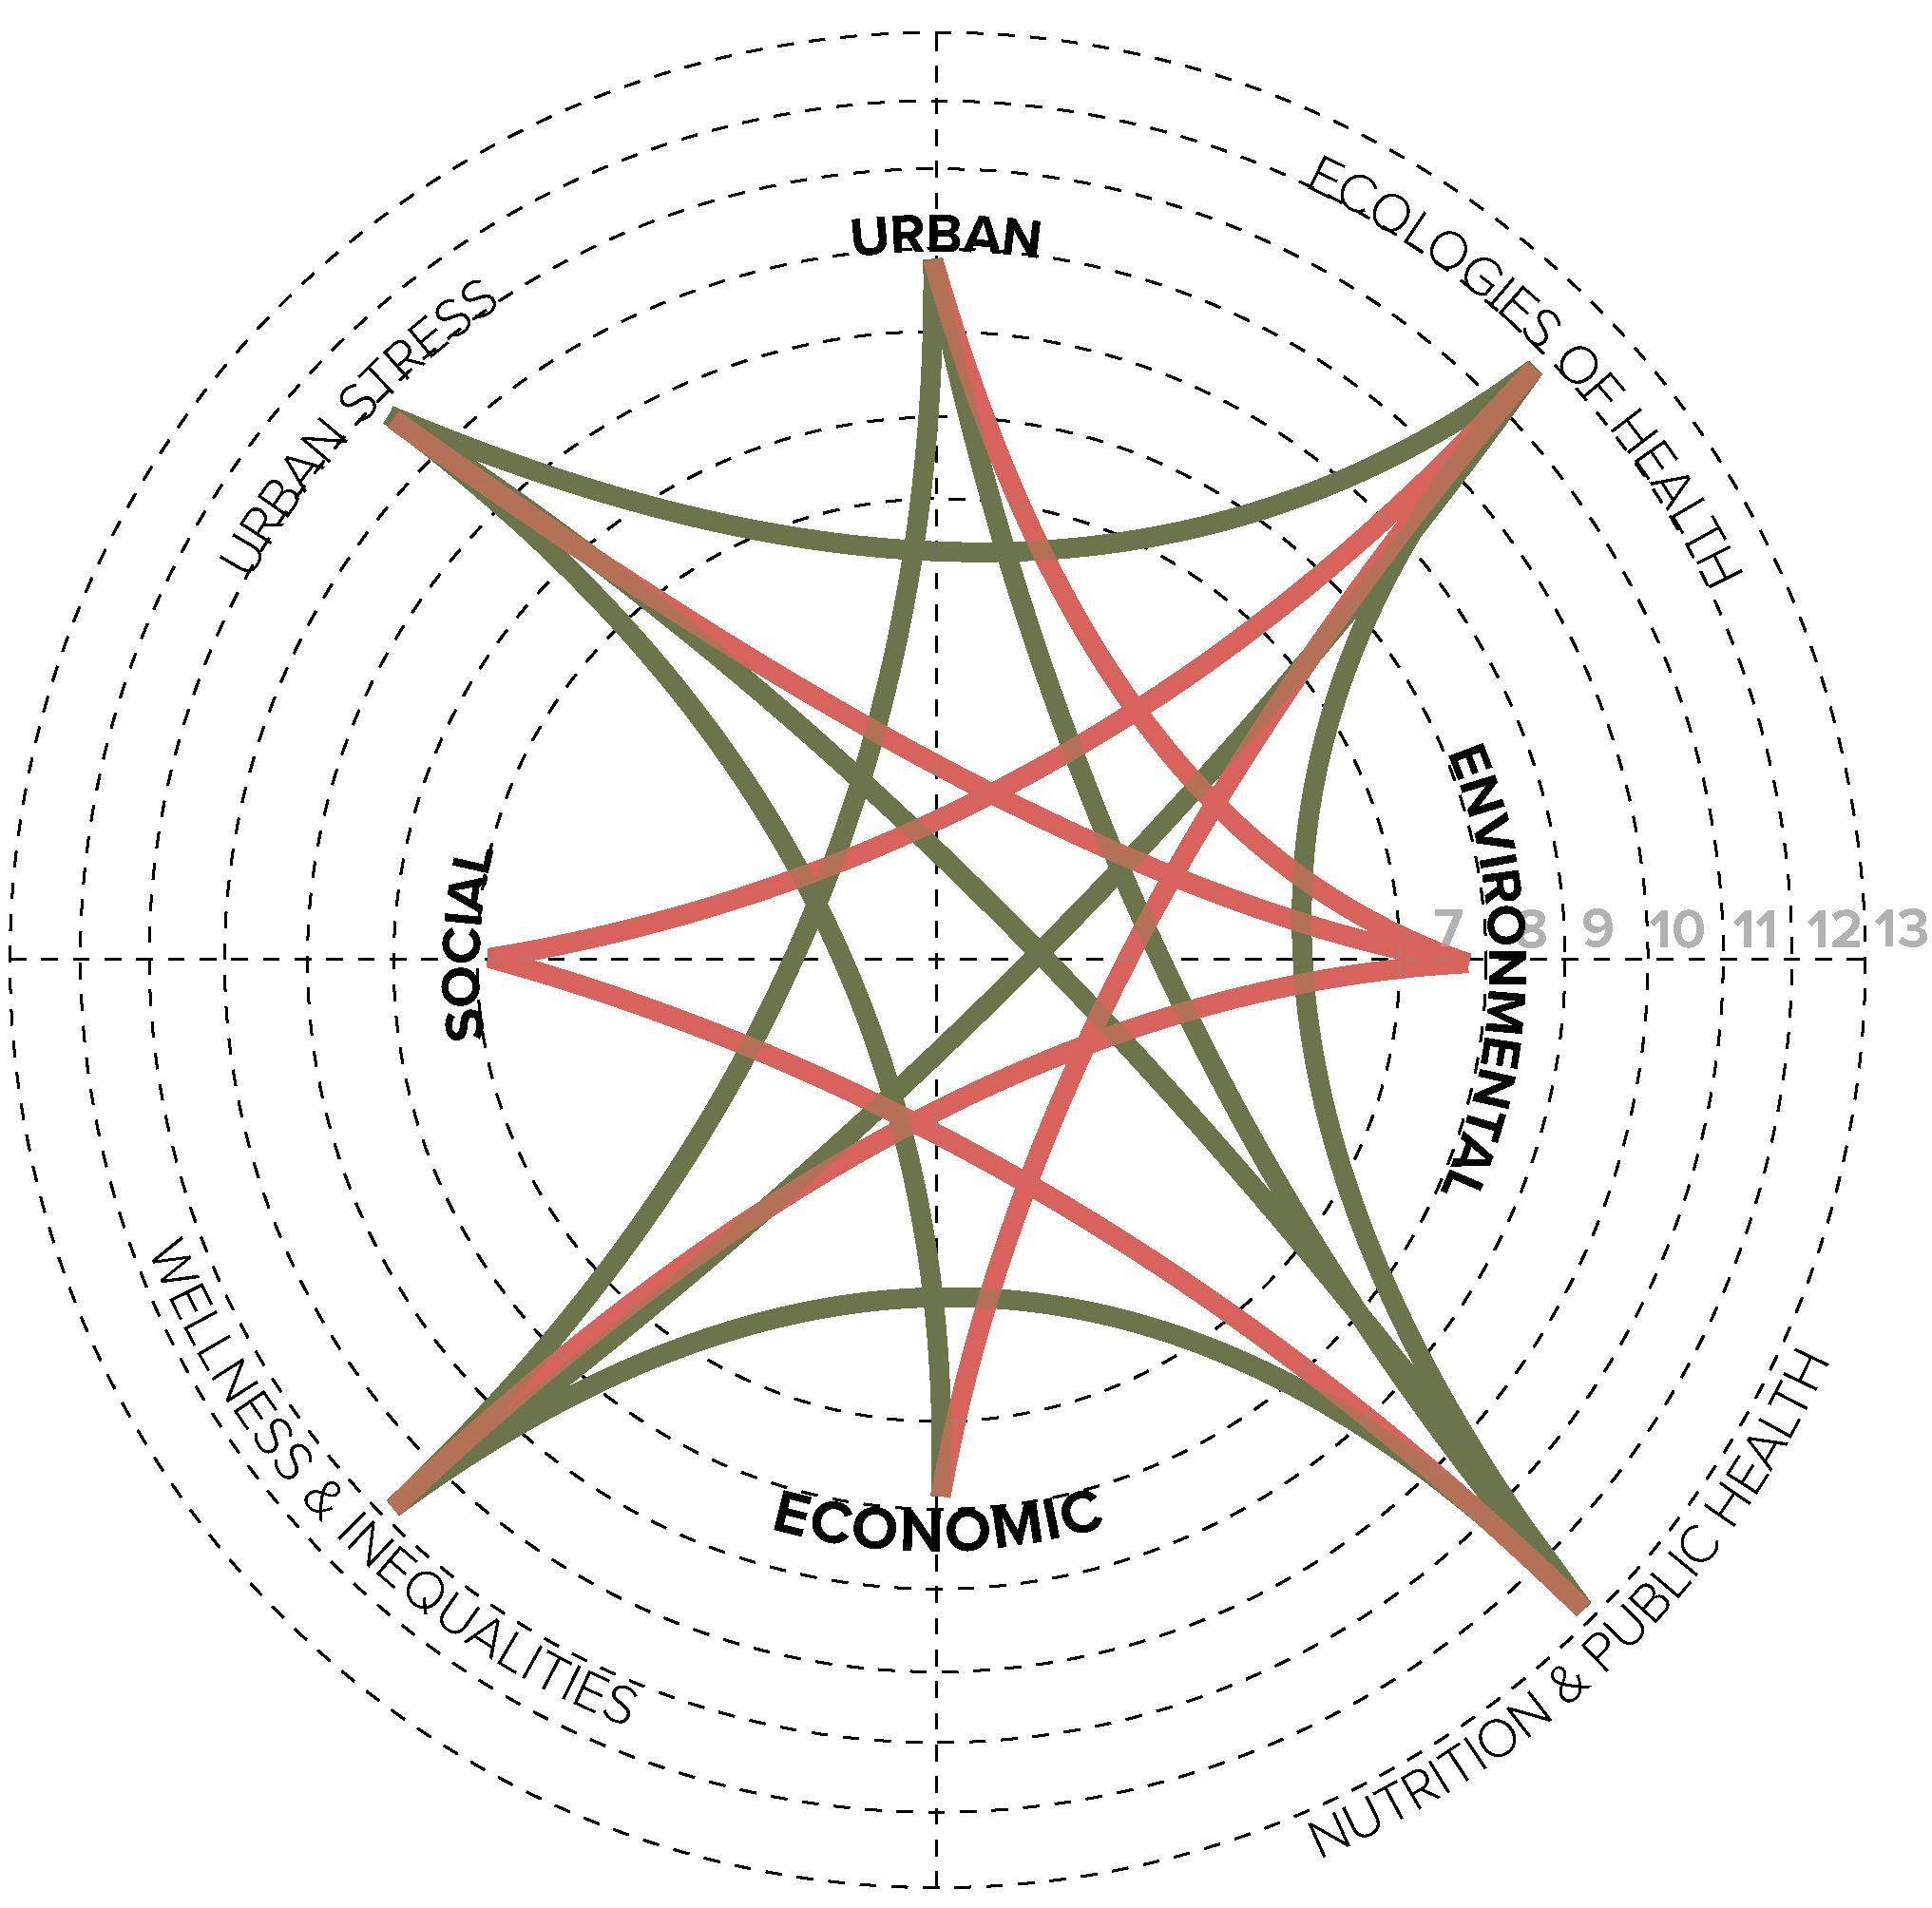
Conceptual Framework of Interrelated Challenges and Chapters
The graph illustrates how the four main critical challenges and chapters created are interconnected and serve as guiding threads throughout the research paper. The further outward a theme is positioned, the more connections it holds, reflecting its broader influence across the system. This framework guides the development of the chapters and its contents.
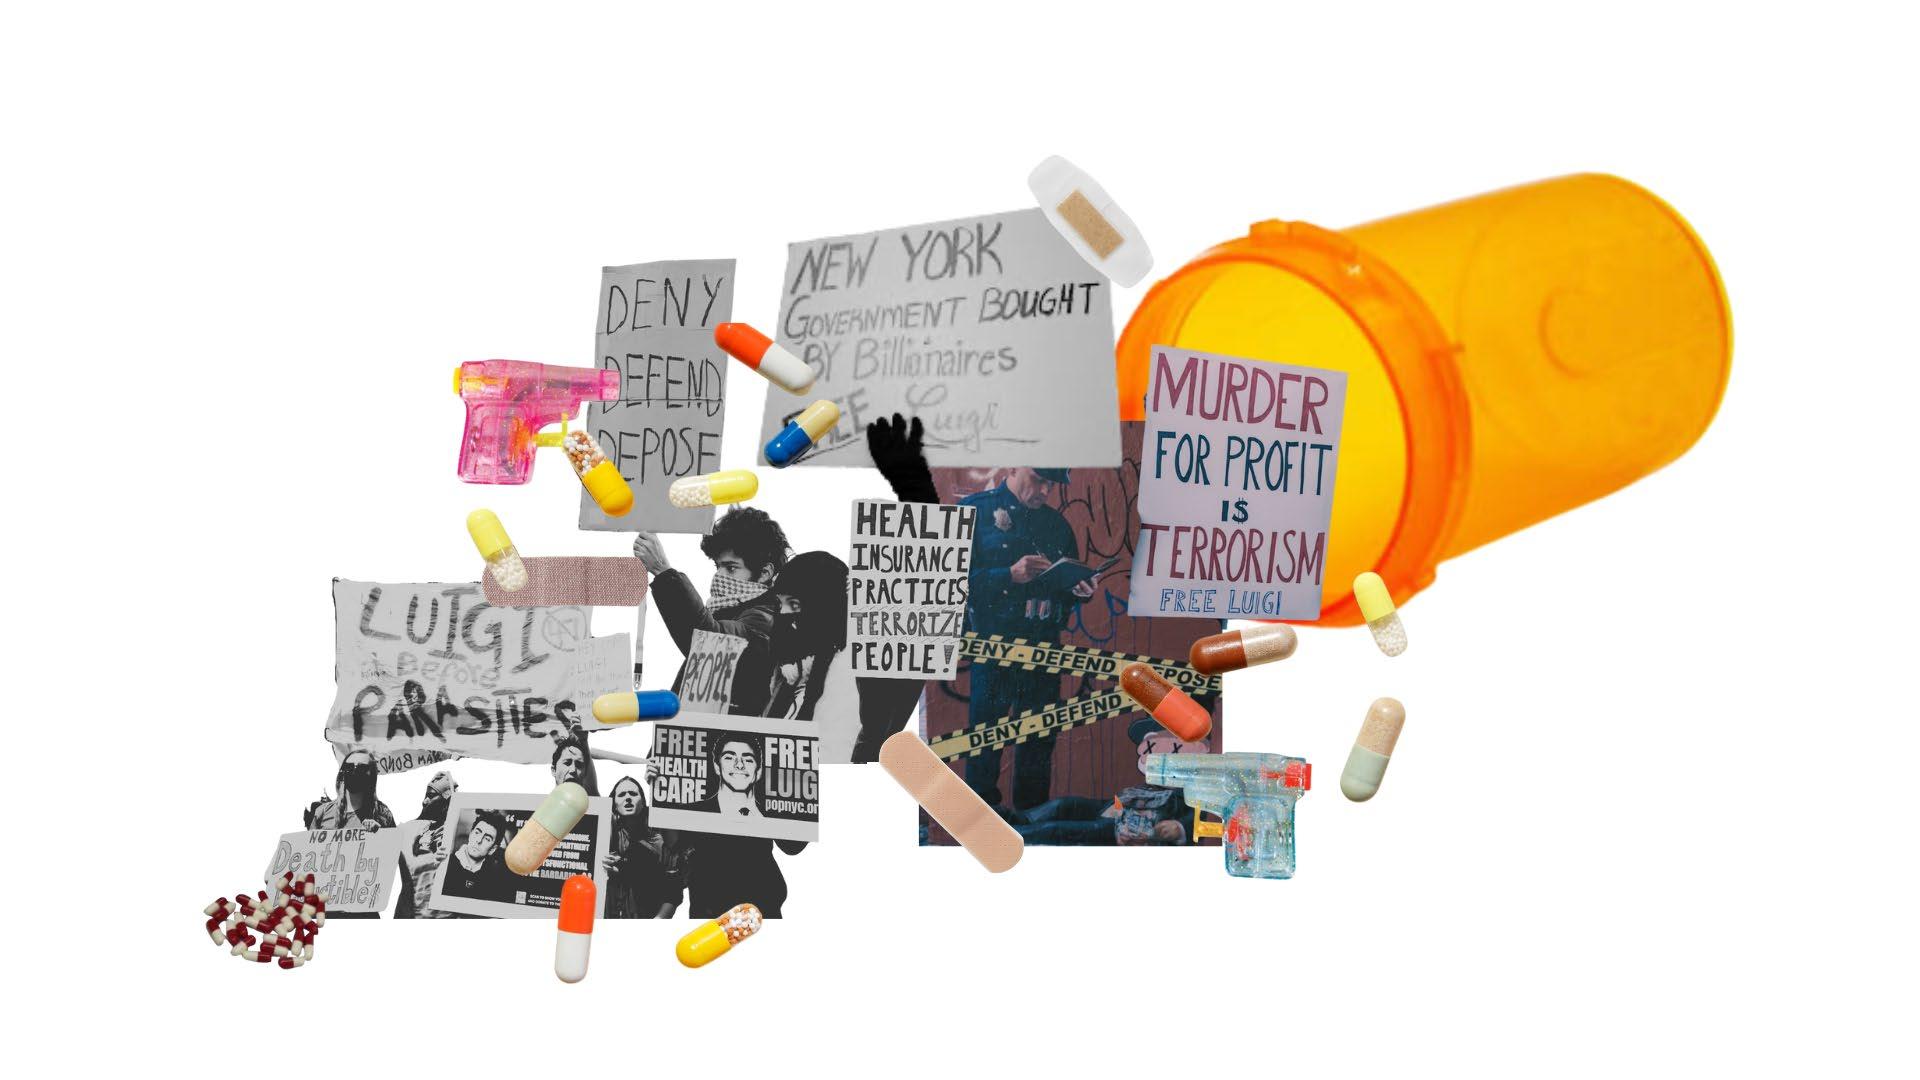
The U.S. health system is shaped by politics as much as by medicine. Instead of universal coverage, it combines public safety nets like Medicare and Medicaid with a dominant private insurance market, leaving millions uninsured. This fragmented model makes healthcare the most expensive in the world, yet access and outcomes remain deeply unequal. At the core lies a political struggle: Democrats generally push to expand public programs, while Republicans resist federal intervention and favor privatization. In this context, healthcare functions less as a right than as a commodity, where age, income, geography, and ideology determine who receives care and who is excluded.
“If we had set out to design the worst system that we could imagine, we couldn’t have imagined one as bad as we have.”
Angell, M. (2000, November). Are we in a health care crisis? Interview with PBS. https://www.pbs.org/healthcarecrisis/ Exprts_intrvw/m_angell.htm
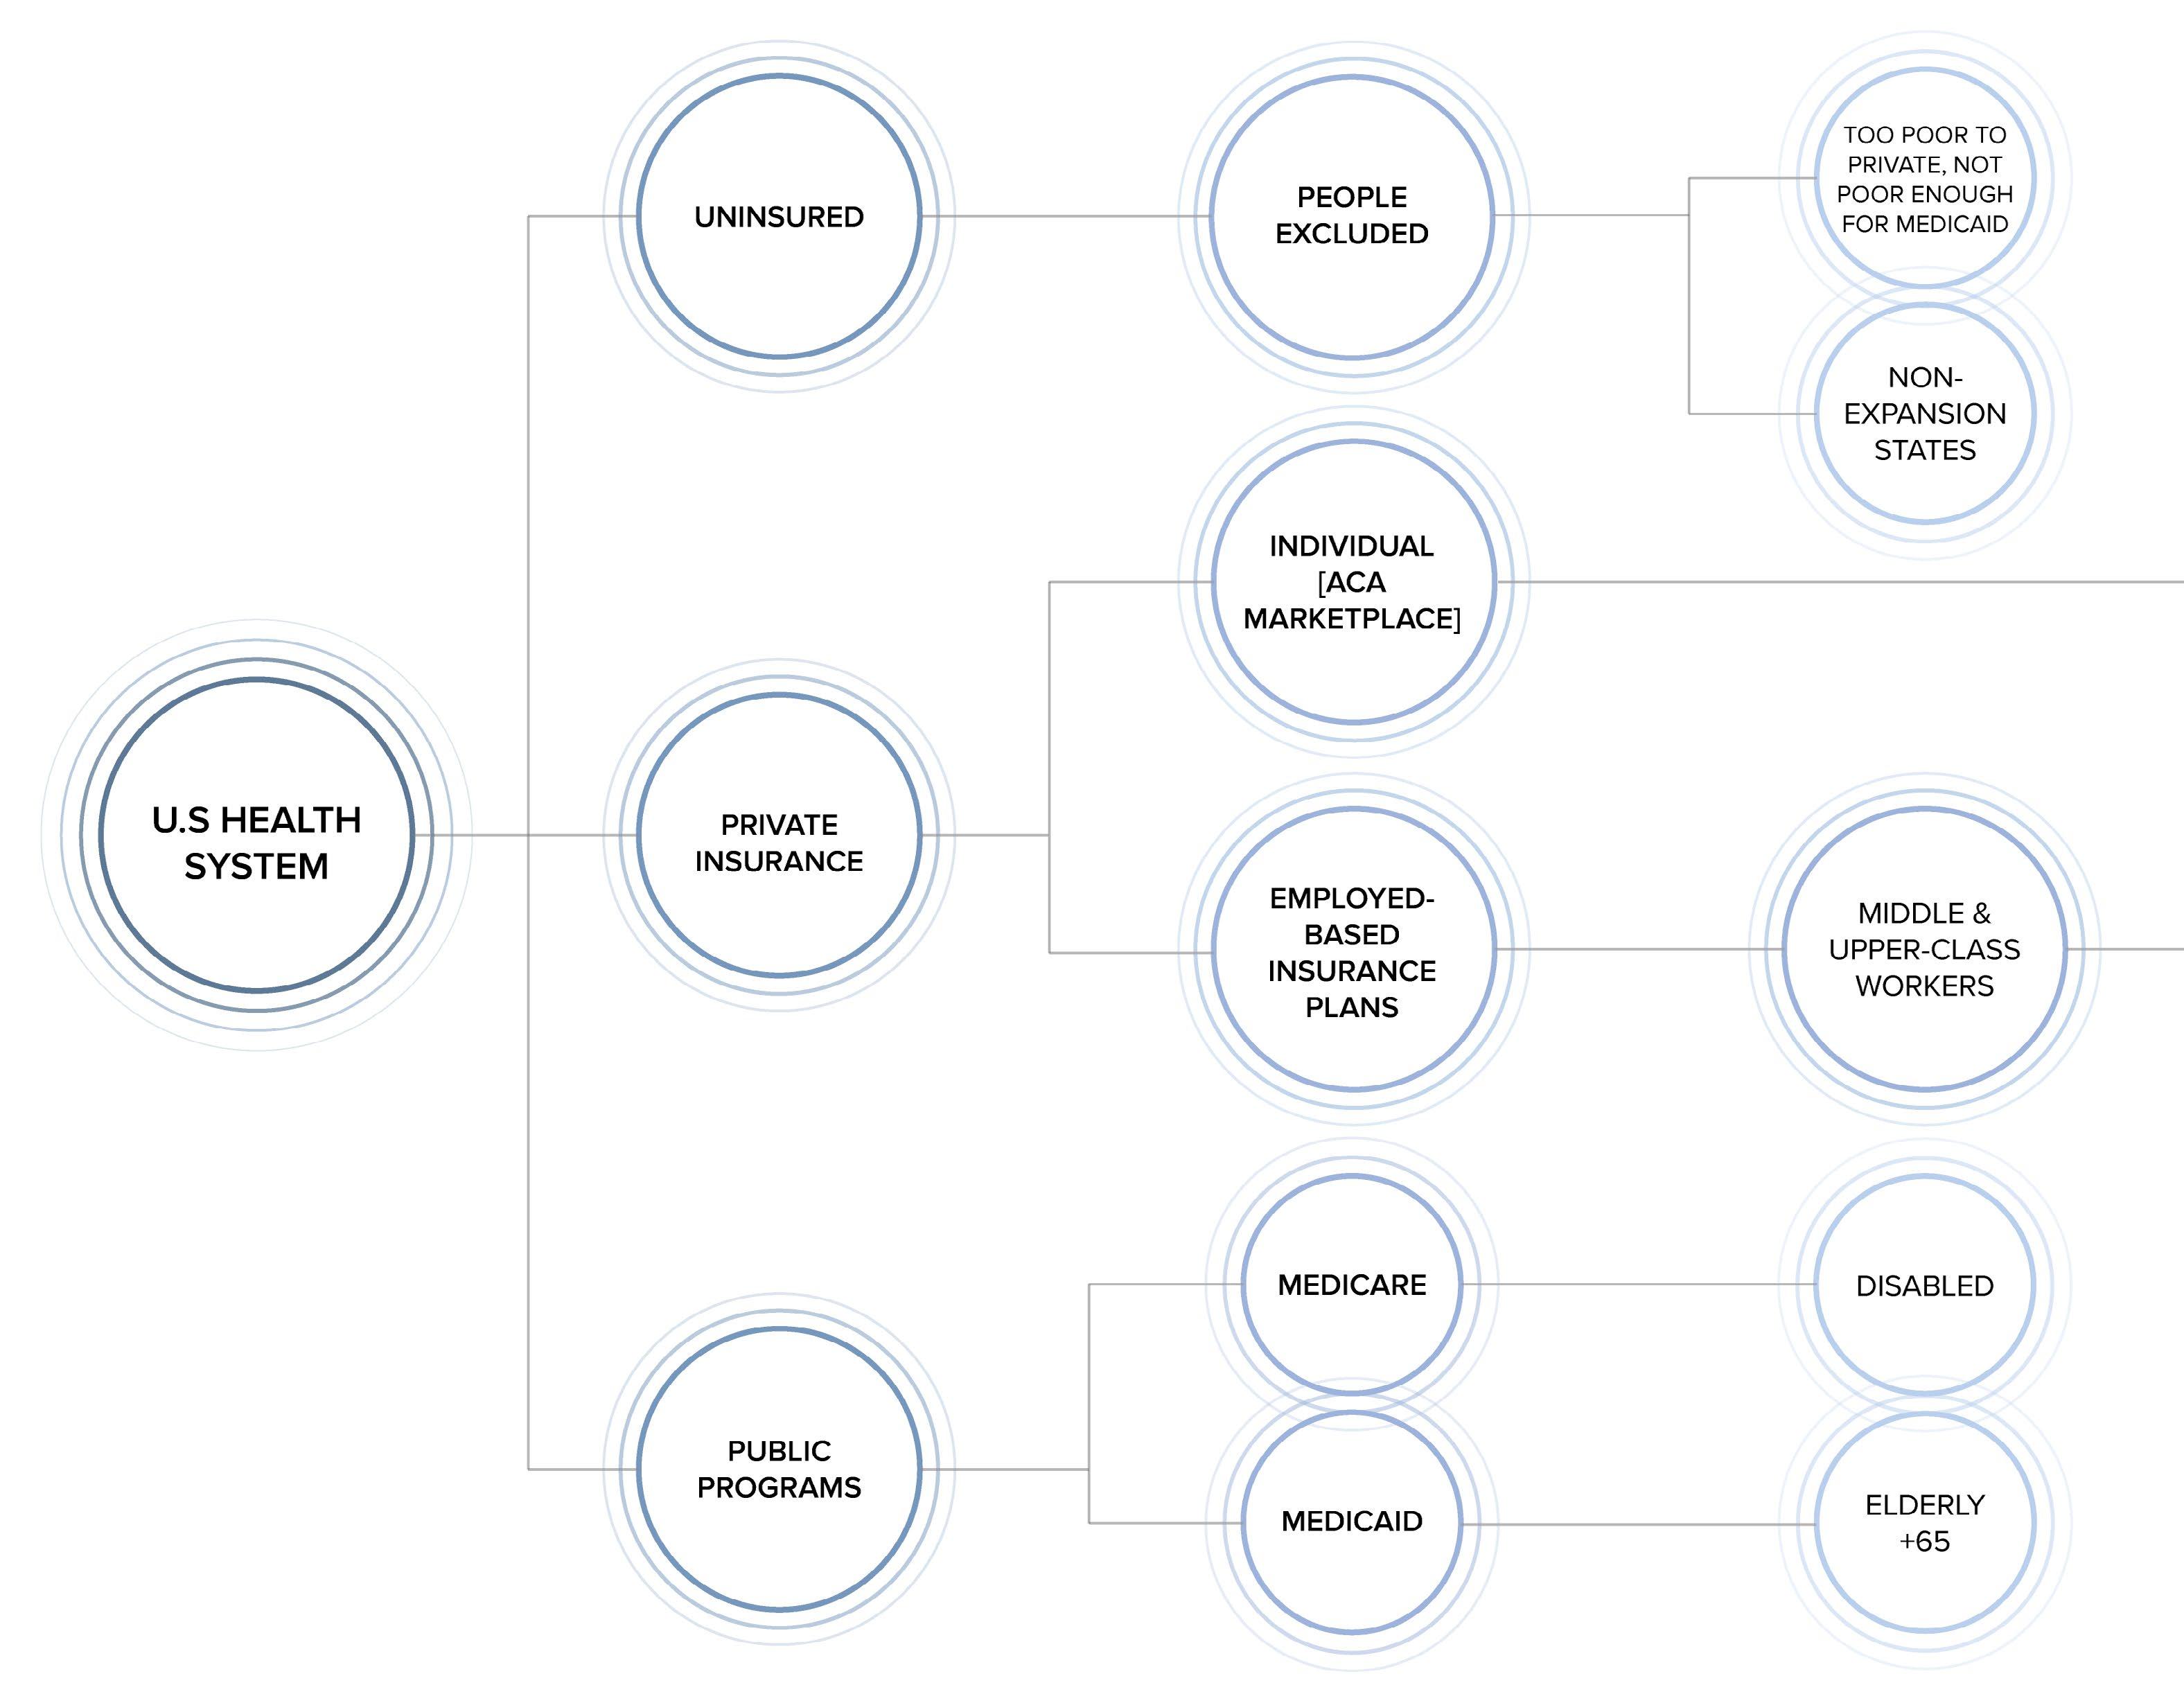
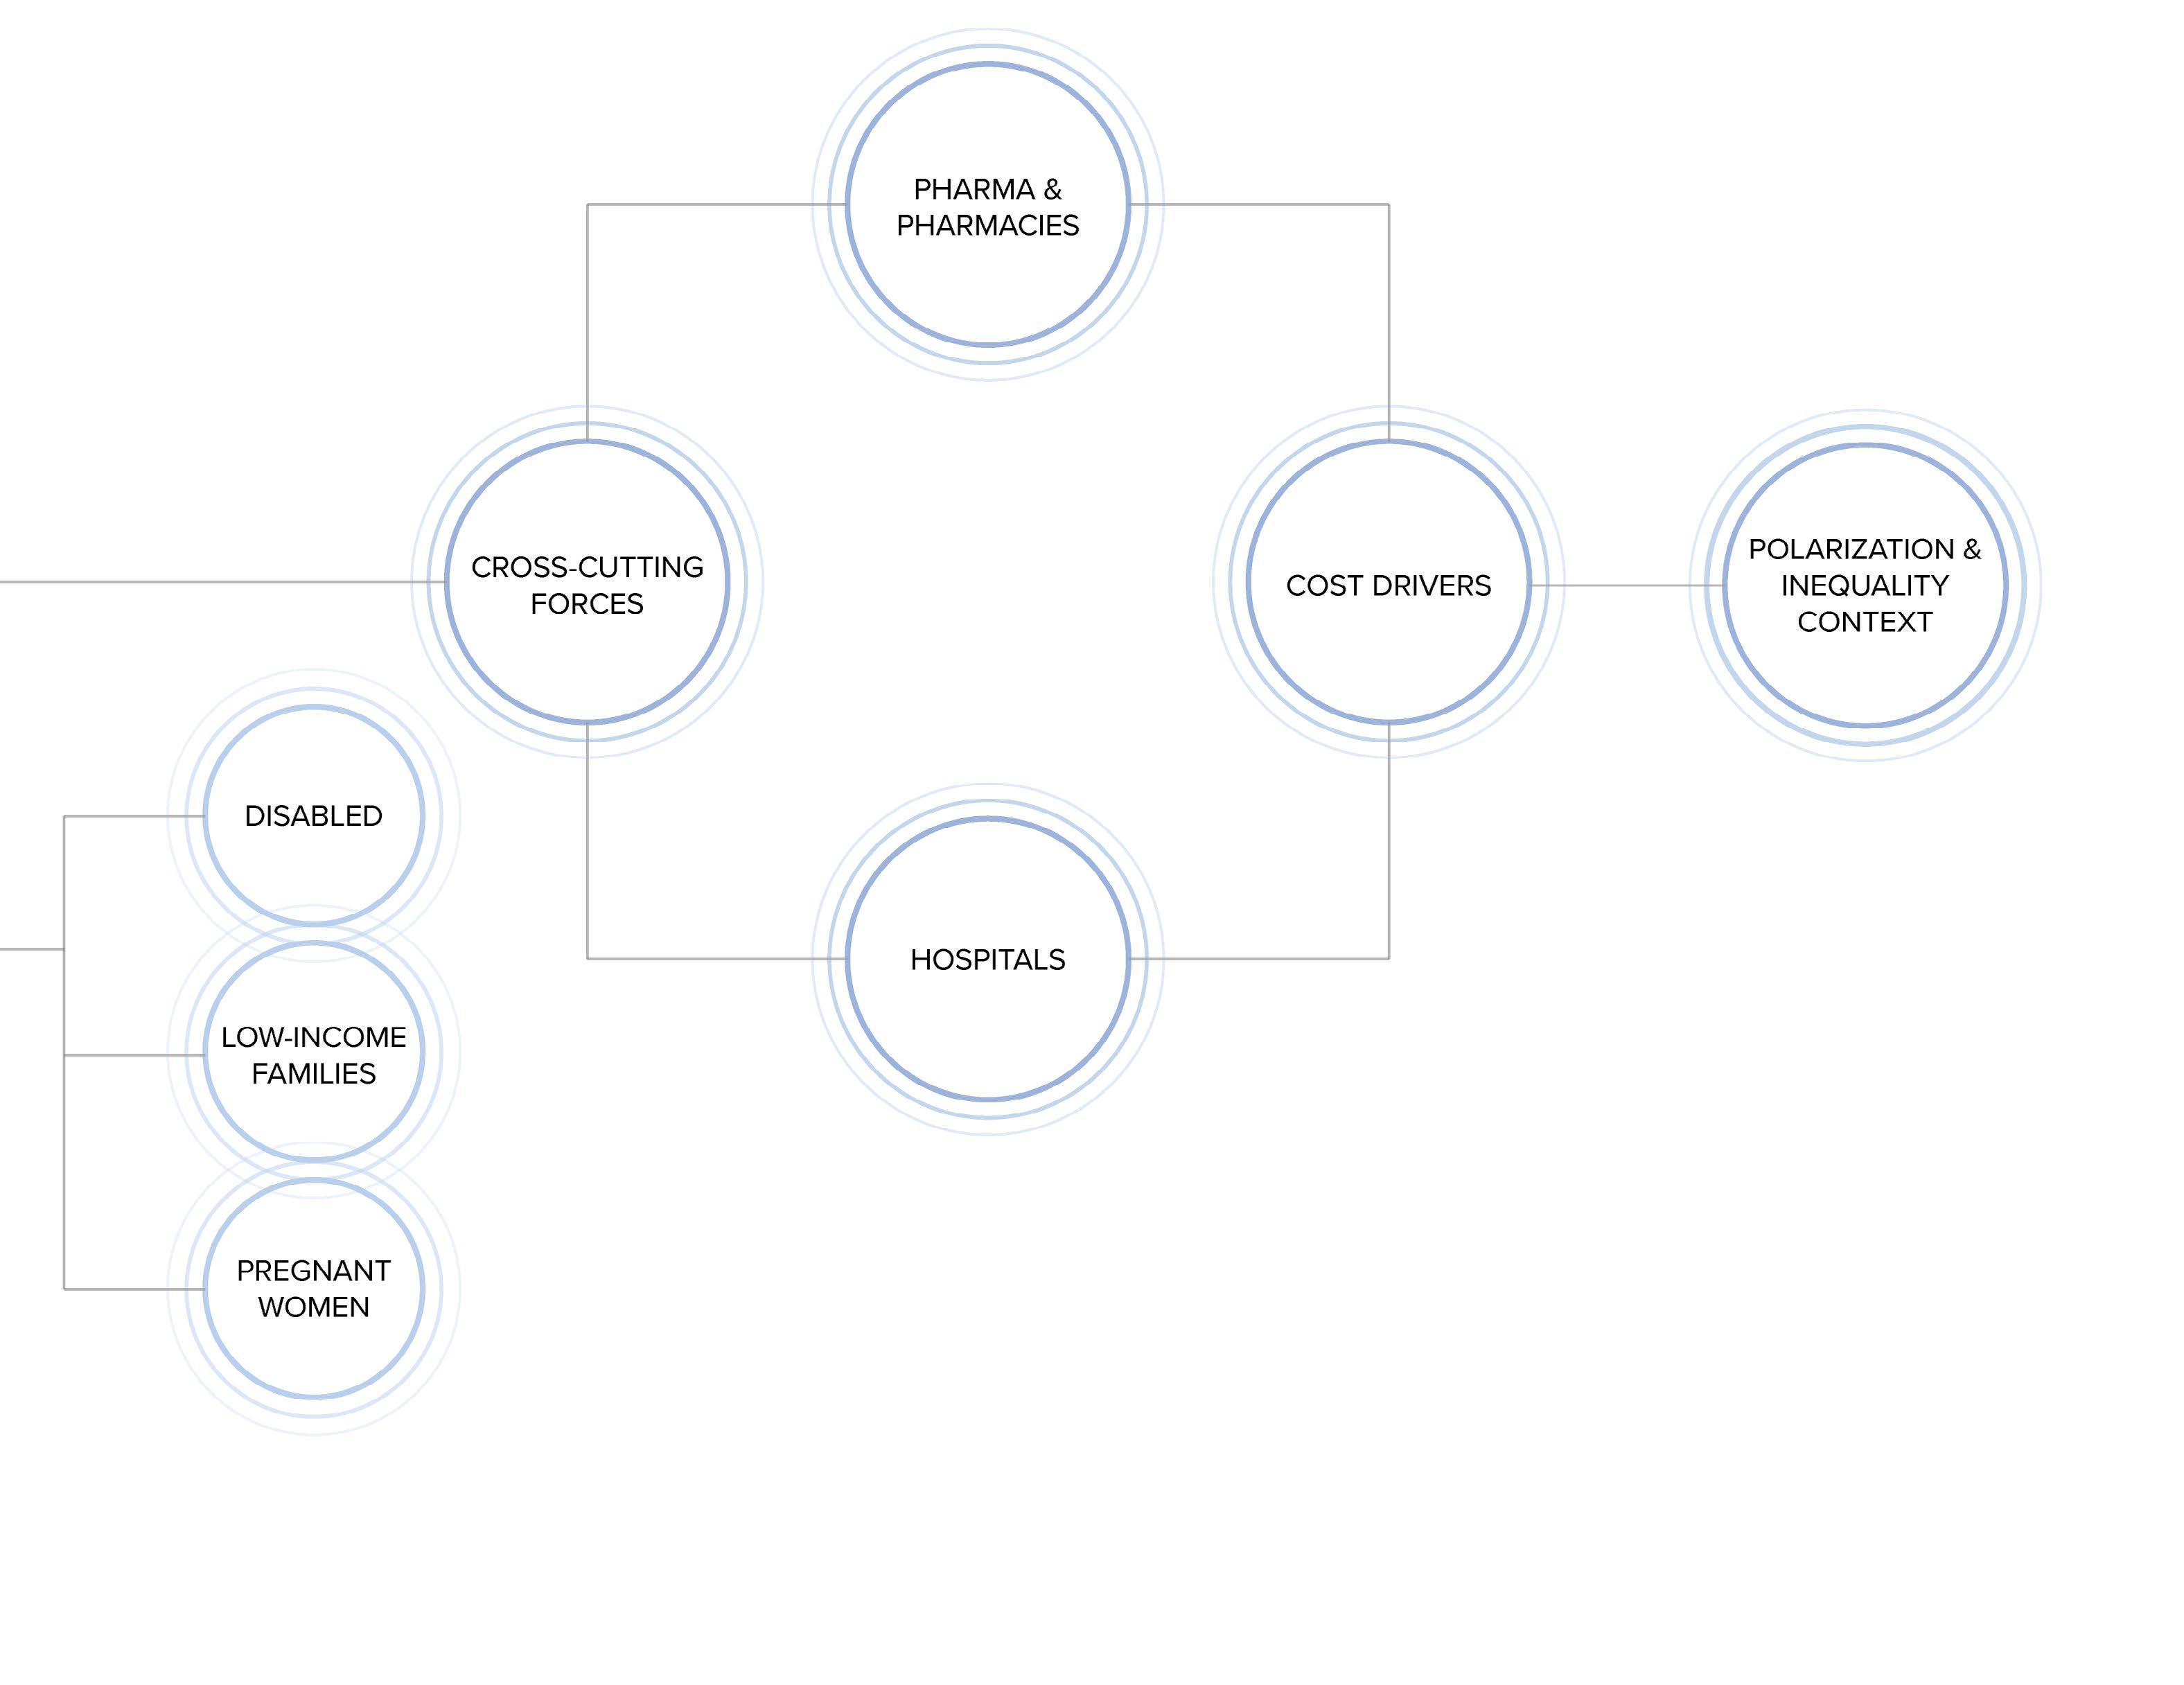
The U.S. health system is fragmented into three main paths: public programs, private insurance, and those left uninsured. Medicare covers the elderly and disabled, while Medicaid supports low-income families, but both have strict limits and uneven access. Most people depend on employerbased insurance, which is costly and unstable, and millions remain excluded altogether.
Hospitals, insurers, and pharmaceutical companies operate on a profit-driven model, making healthcare the most expensive in the world while outcomes lag behind. Political polarization deepens these inequalities, with constant battles over expansion versus privatization. In the end, access to care depends less on need than on income, employment, and geography.
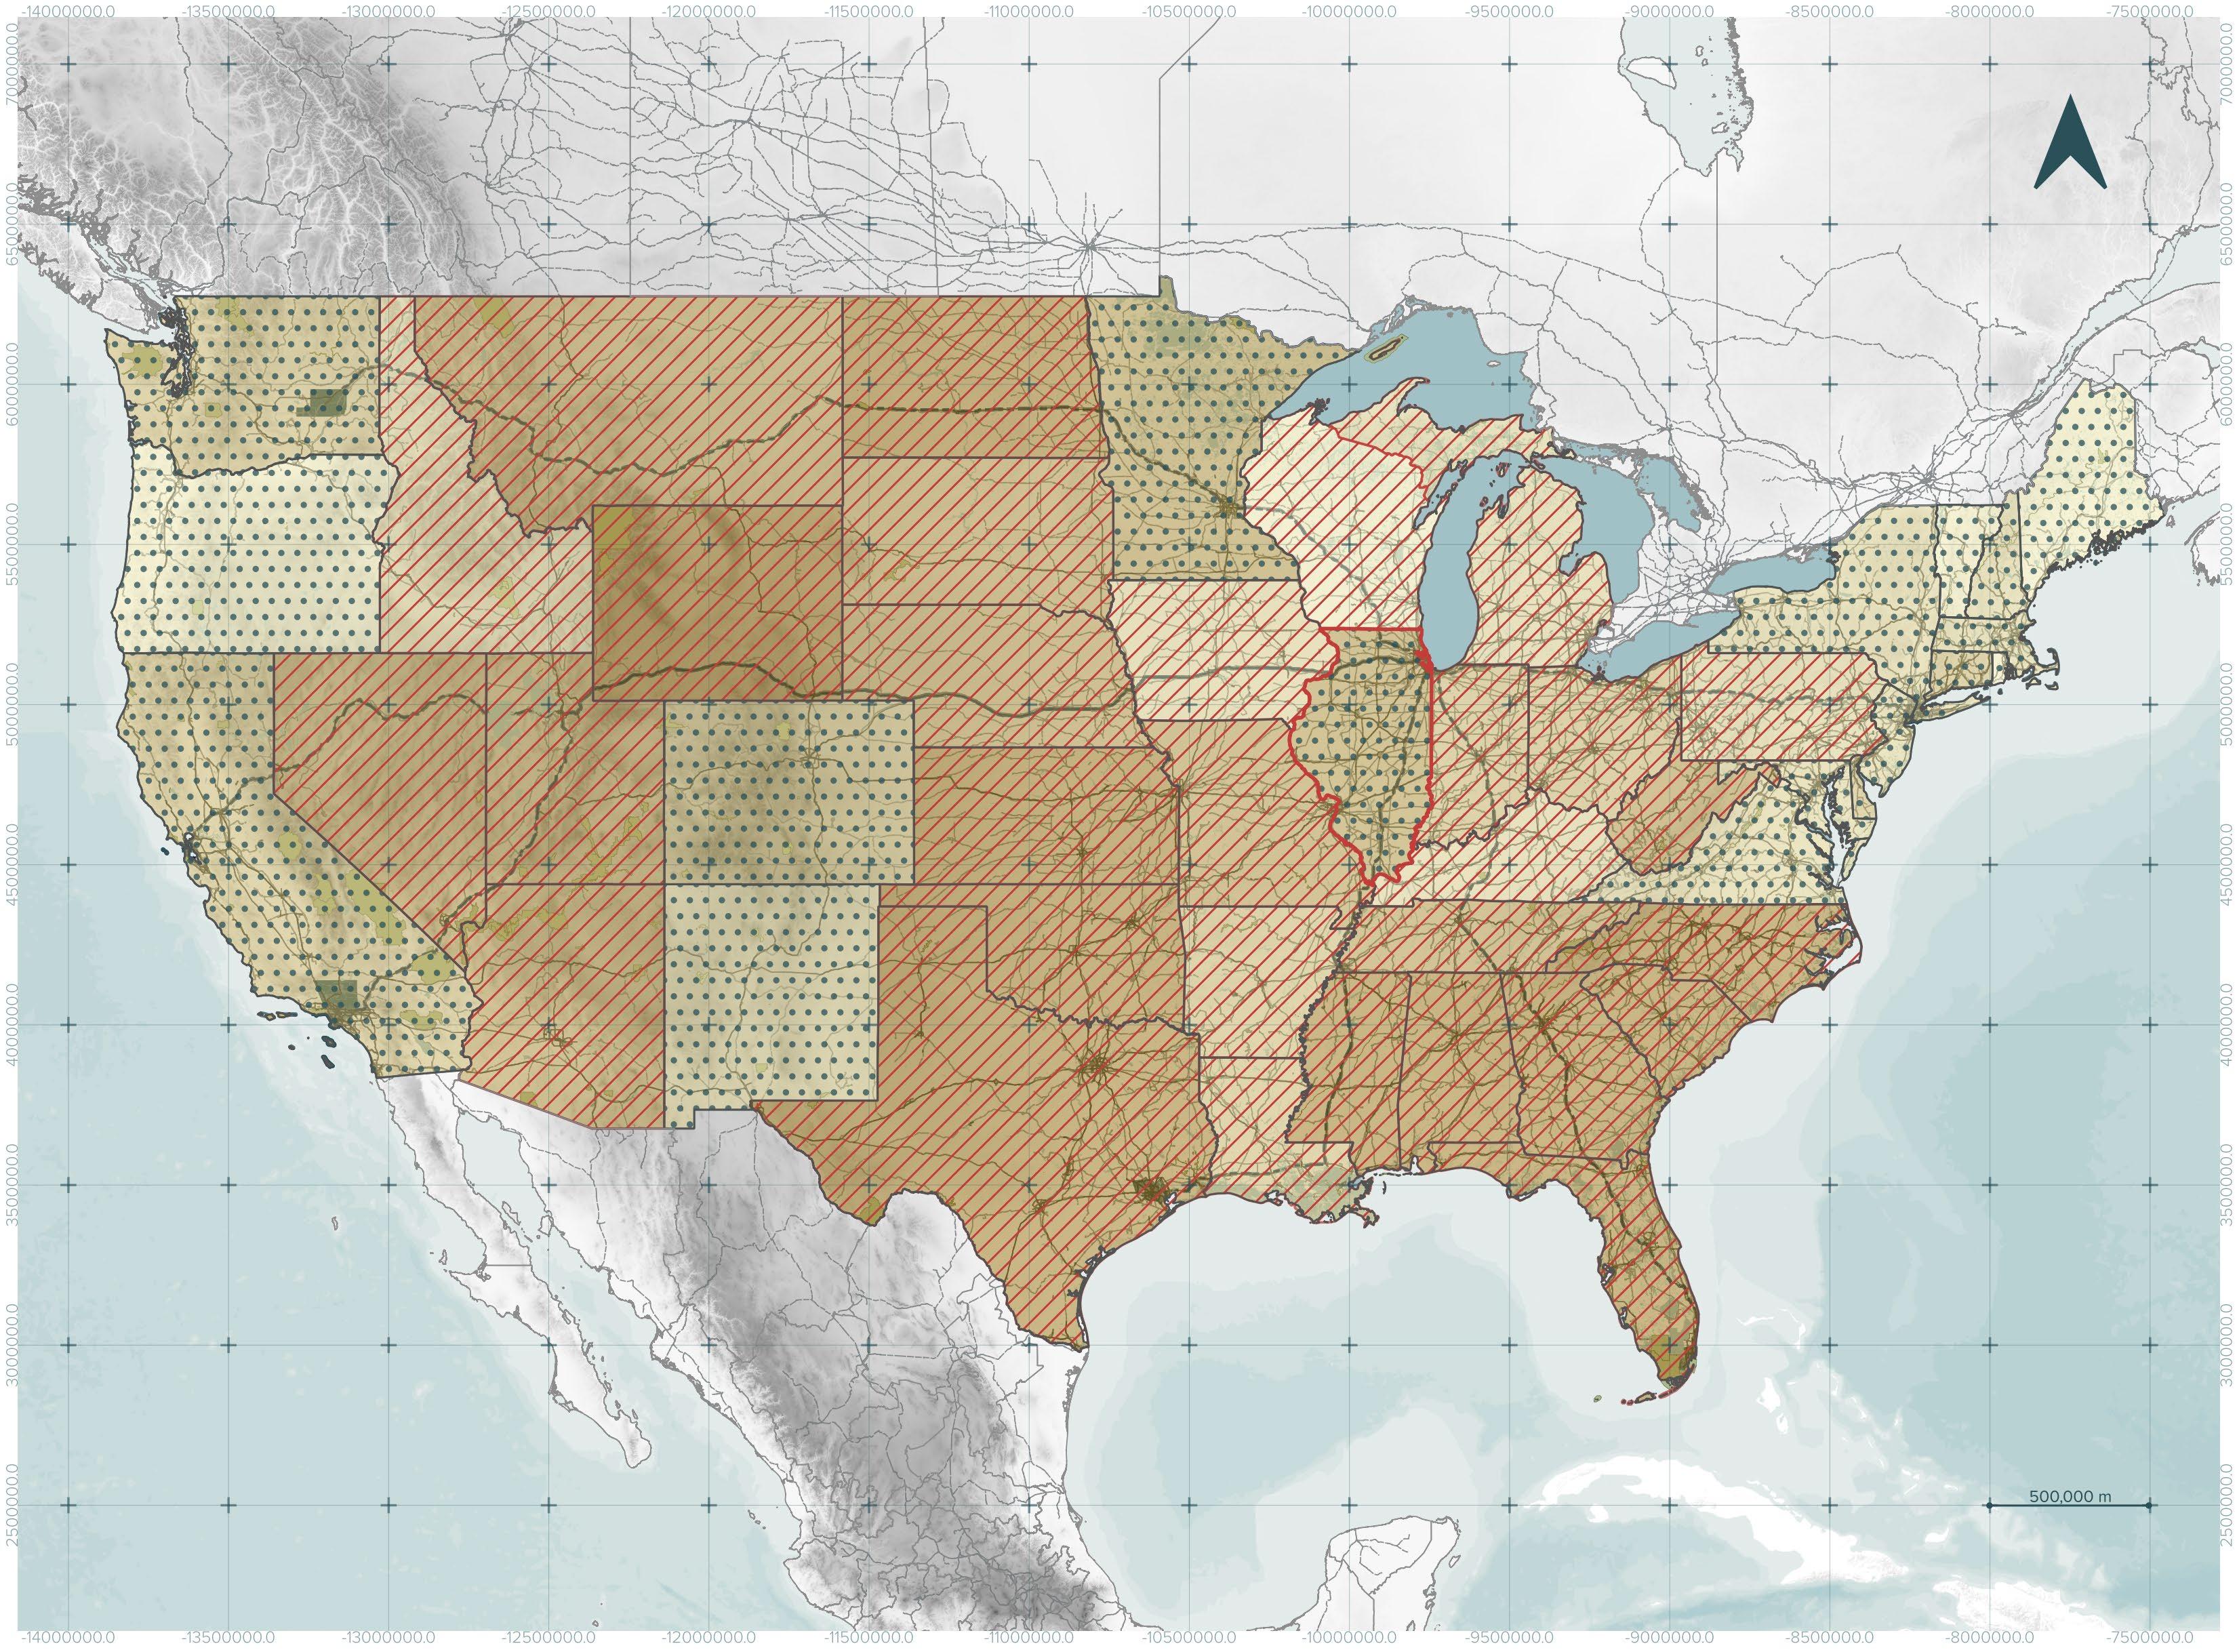
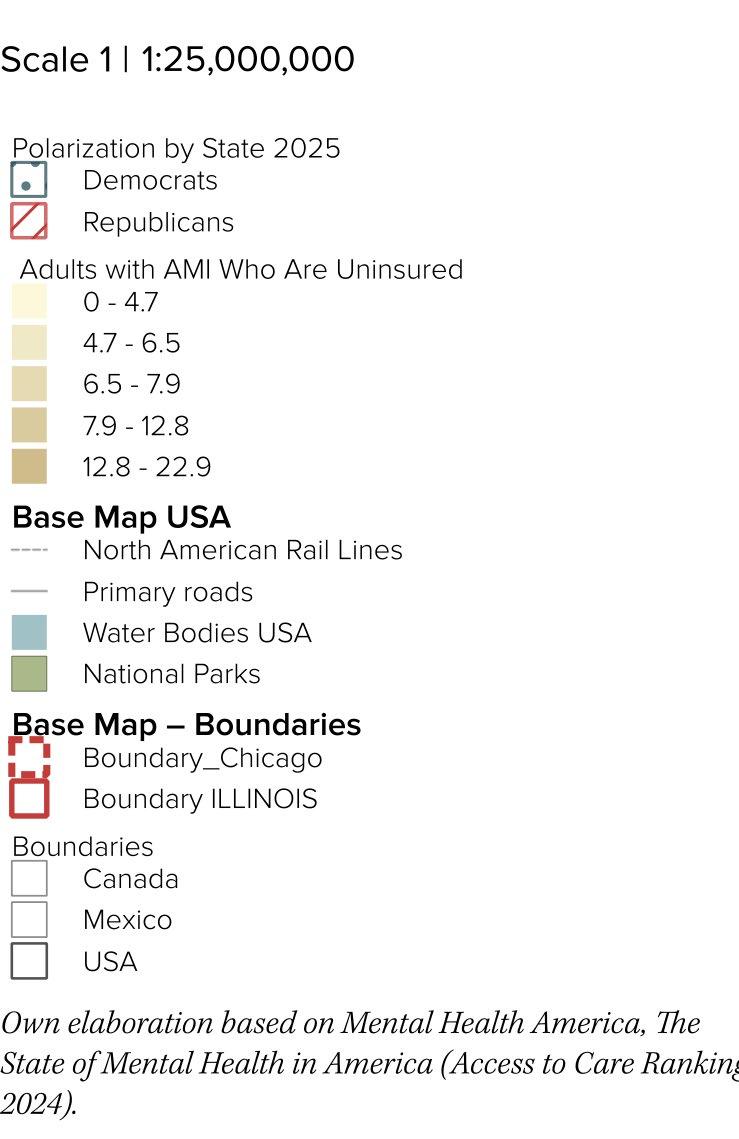
Uninsured AMI across Party States
By merging the maps of Adults with AMI Who Are Uninsured and political affiliation, it is seen that the five states with the highest percentage of uninsured adults with mental illness are Texas, Mississippi, Wyoming, Georgia, and Oklahoma, all Republican majority states.
These states appear in the darkest beige tones (12.8–22.9), overlaid with pink for Republican affiliation.
This pattern reflects that many Republican states did not expand Medicaid, depend more on employer-based private insurance, and have higher poverty rates, leaving many, including those with mental illness, without health coverage.
ECOLOGIES OF HEALTH WELLNES AND INEQUALITIES NUTRITION AND
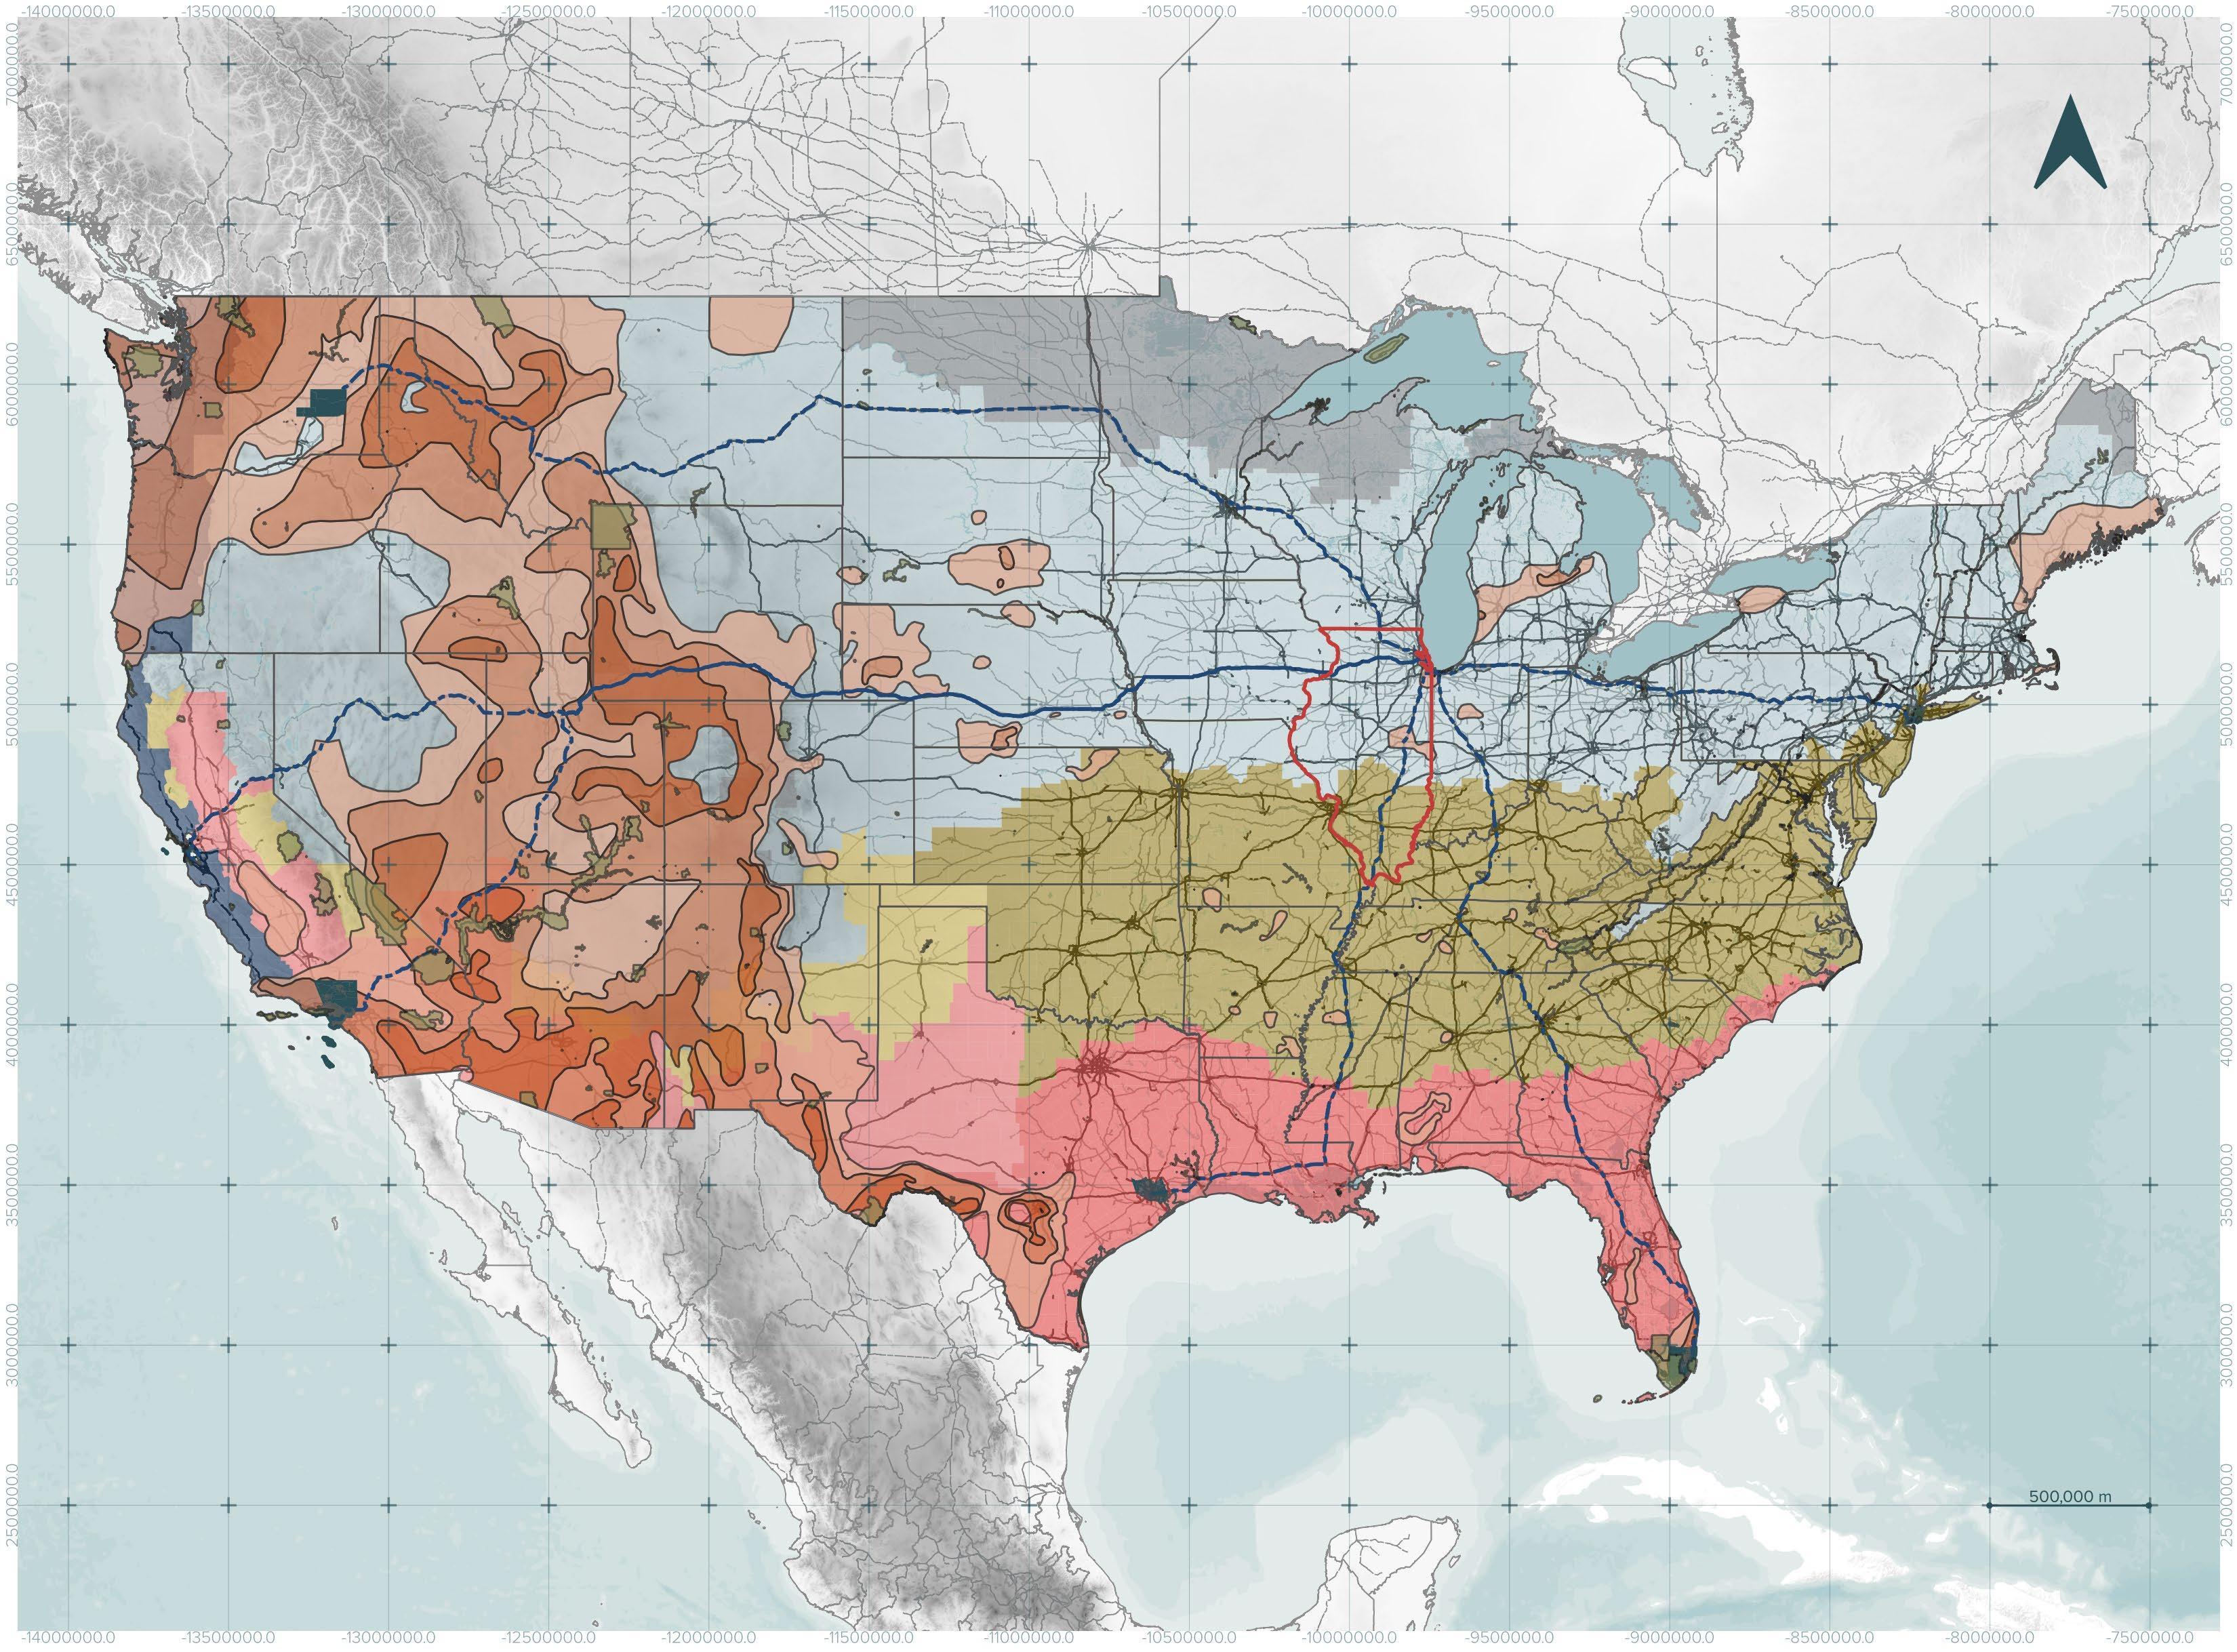
The concept of ecologies of health examines how environmental, social, and economic systems interact to shape human well-being. In the United States, health is influenced not only by access to medical care but also by the broader ecological context, including urban design, air and water quality, food systems, and social networks. Understanding these interconnections highlights the complex ways in which place, policy, and community impact population health, emphasizing that individual well-being is inseparable from the environments in which people live, work, and play.
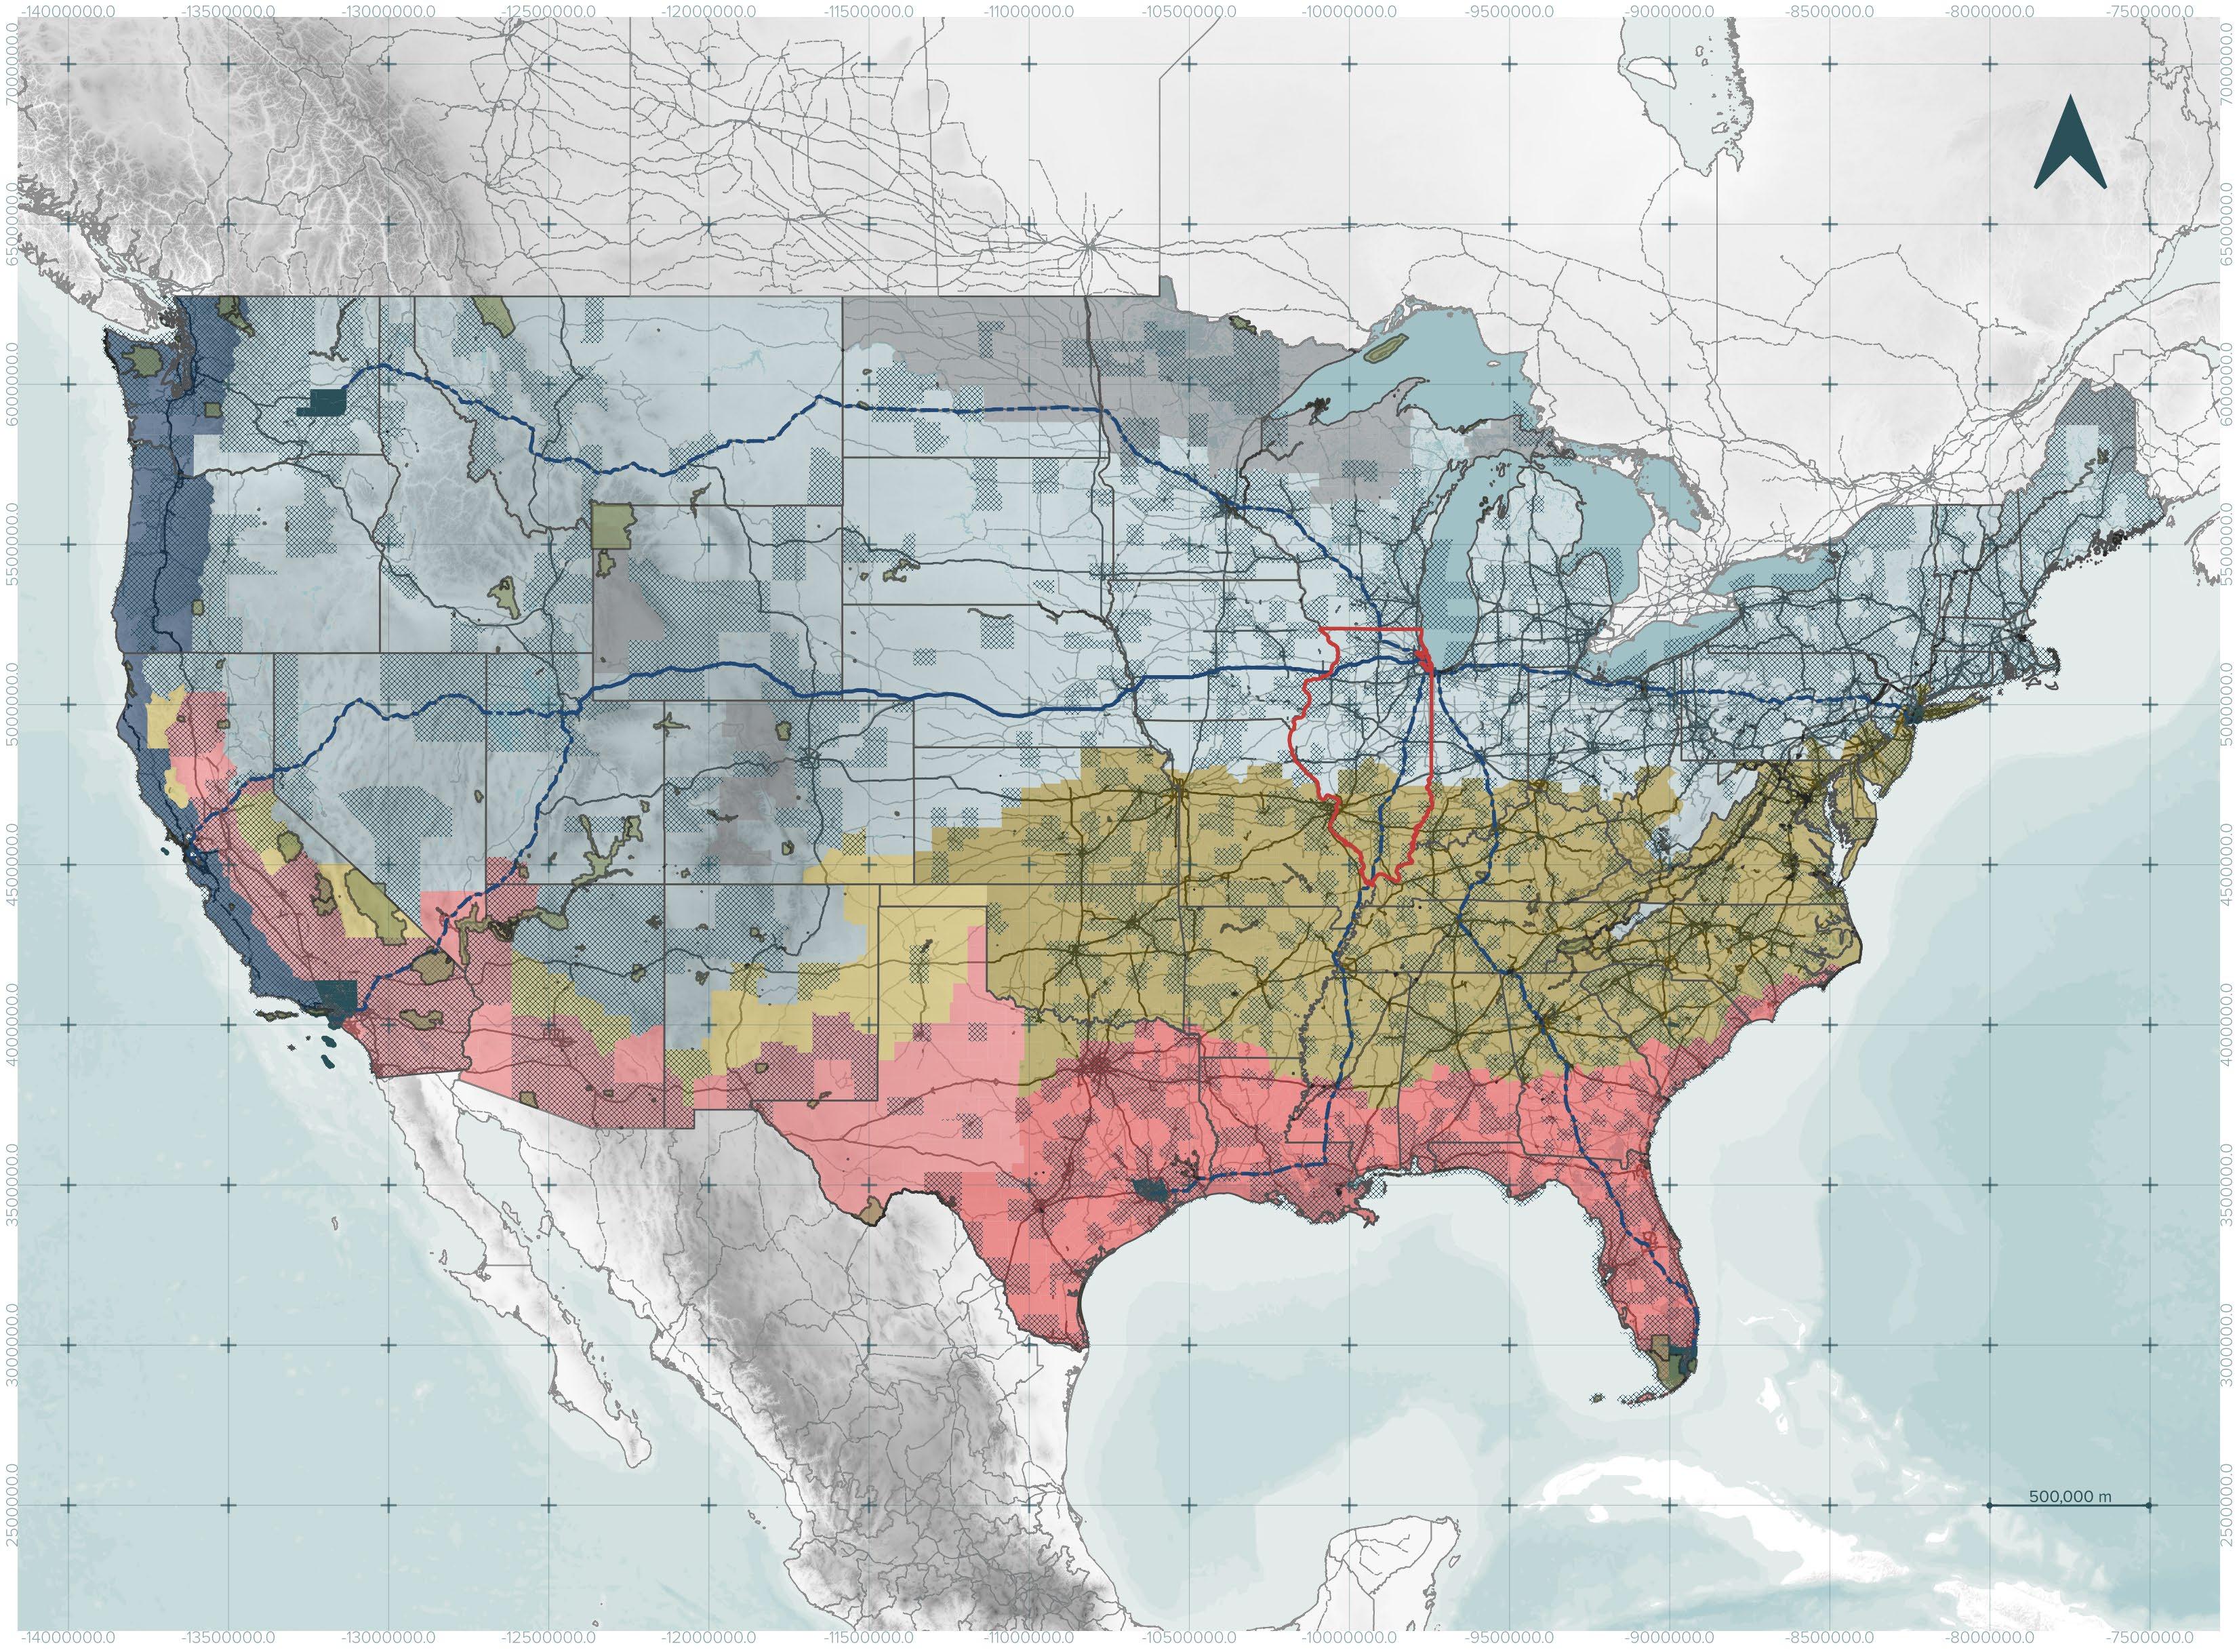
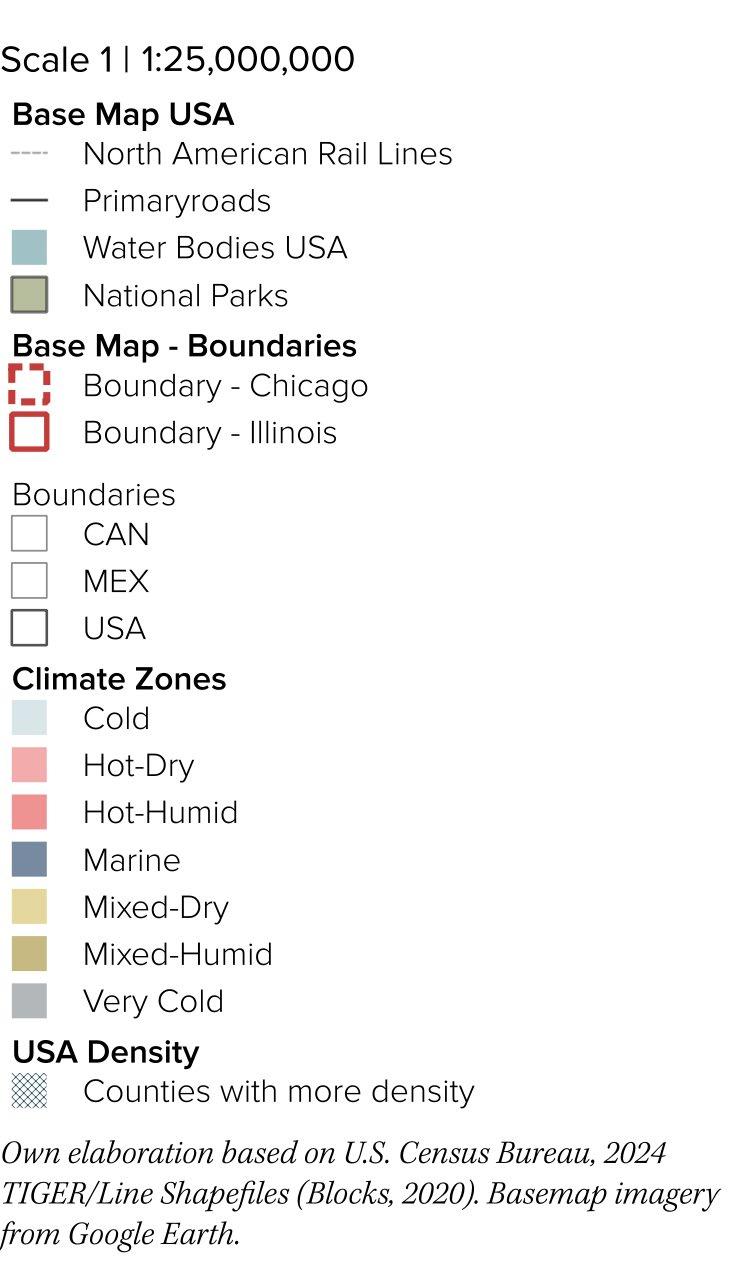
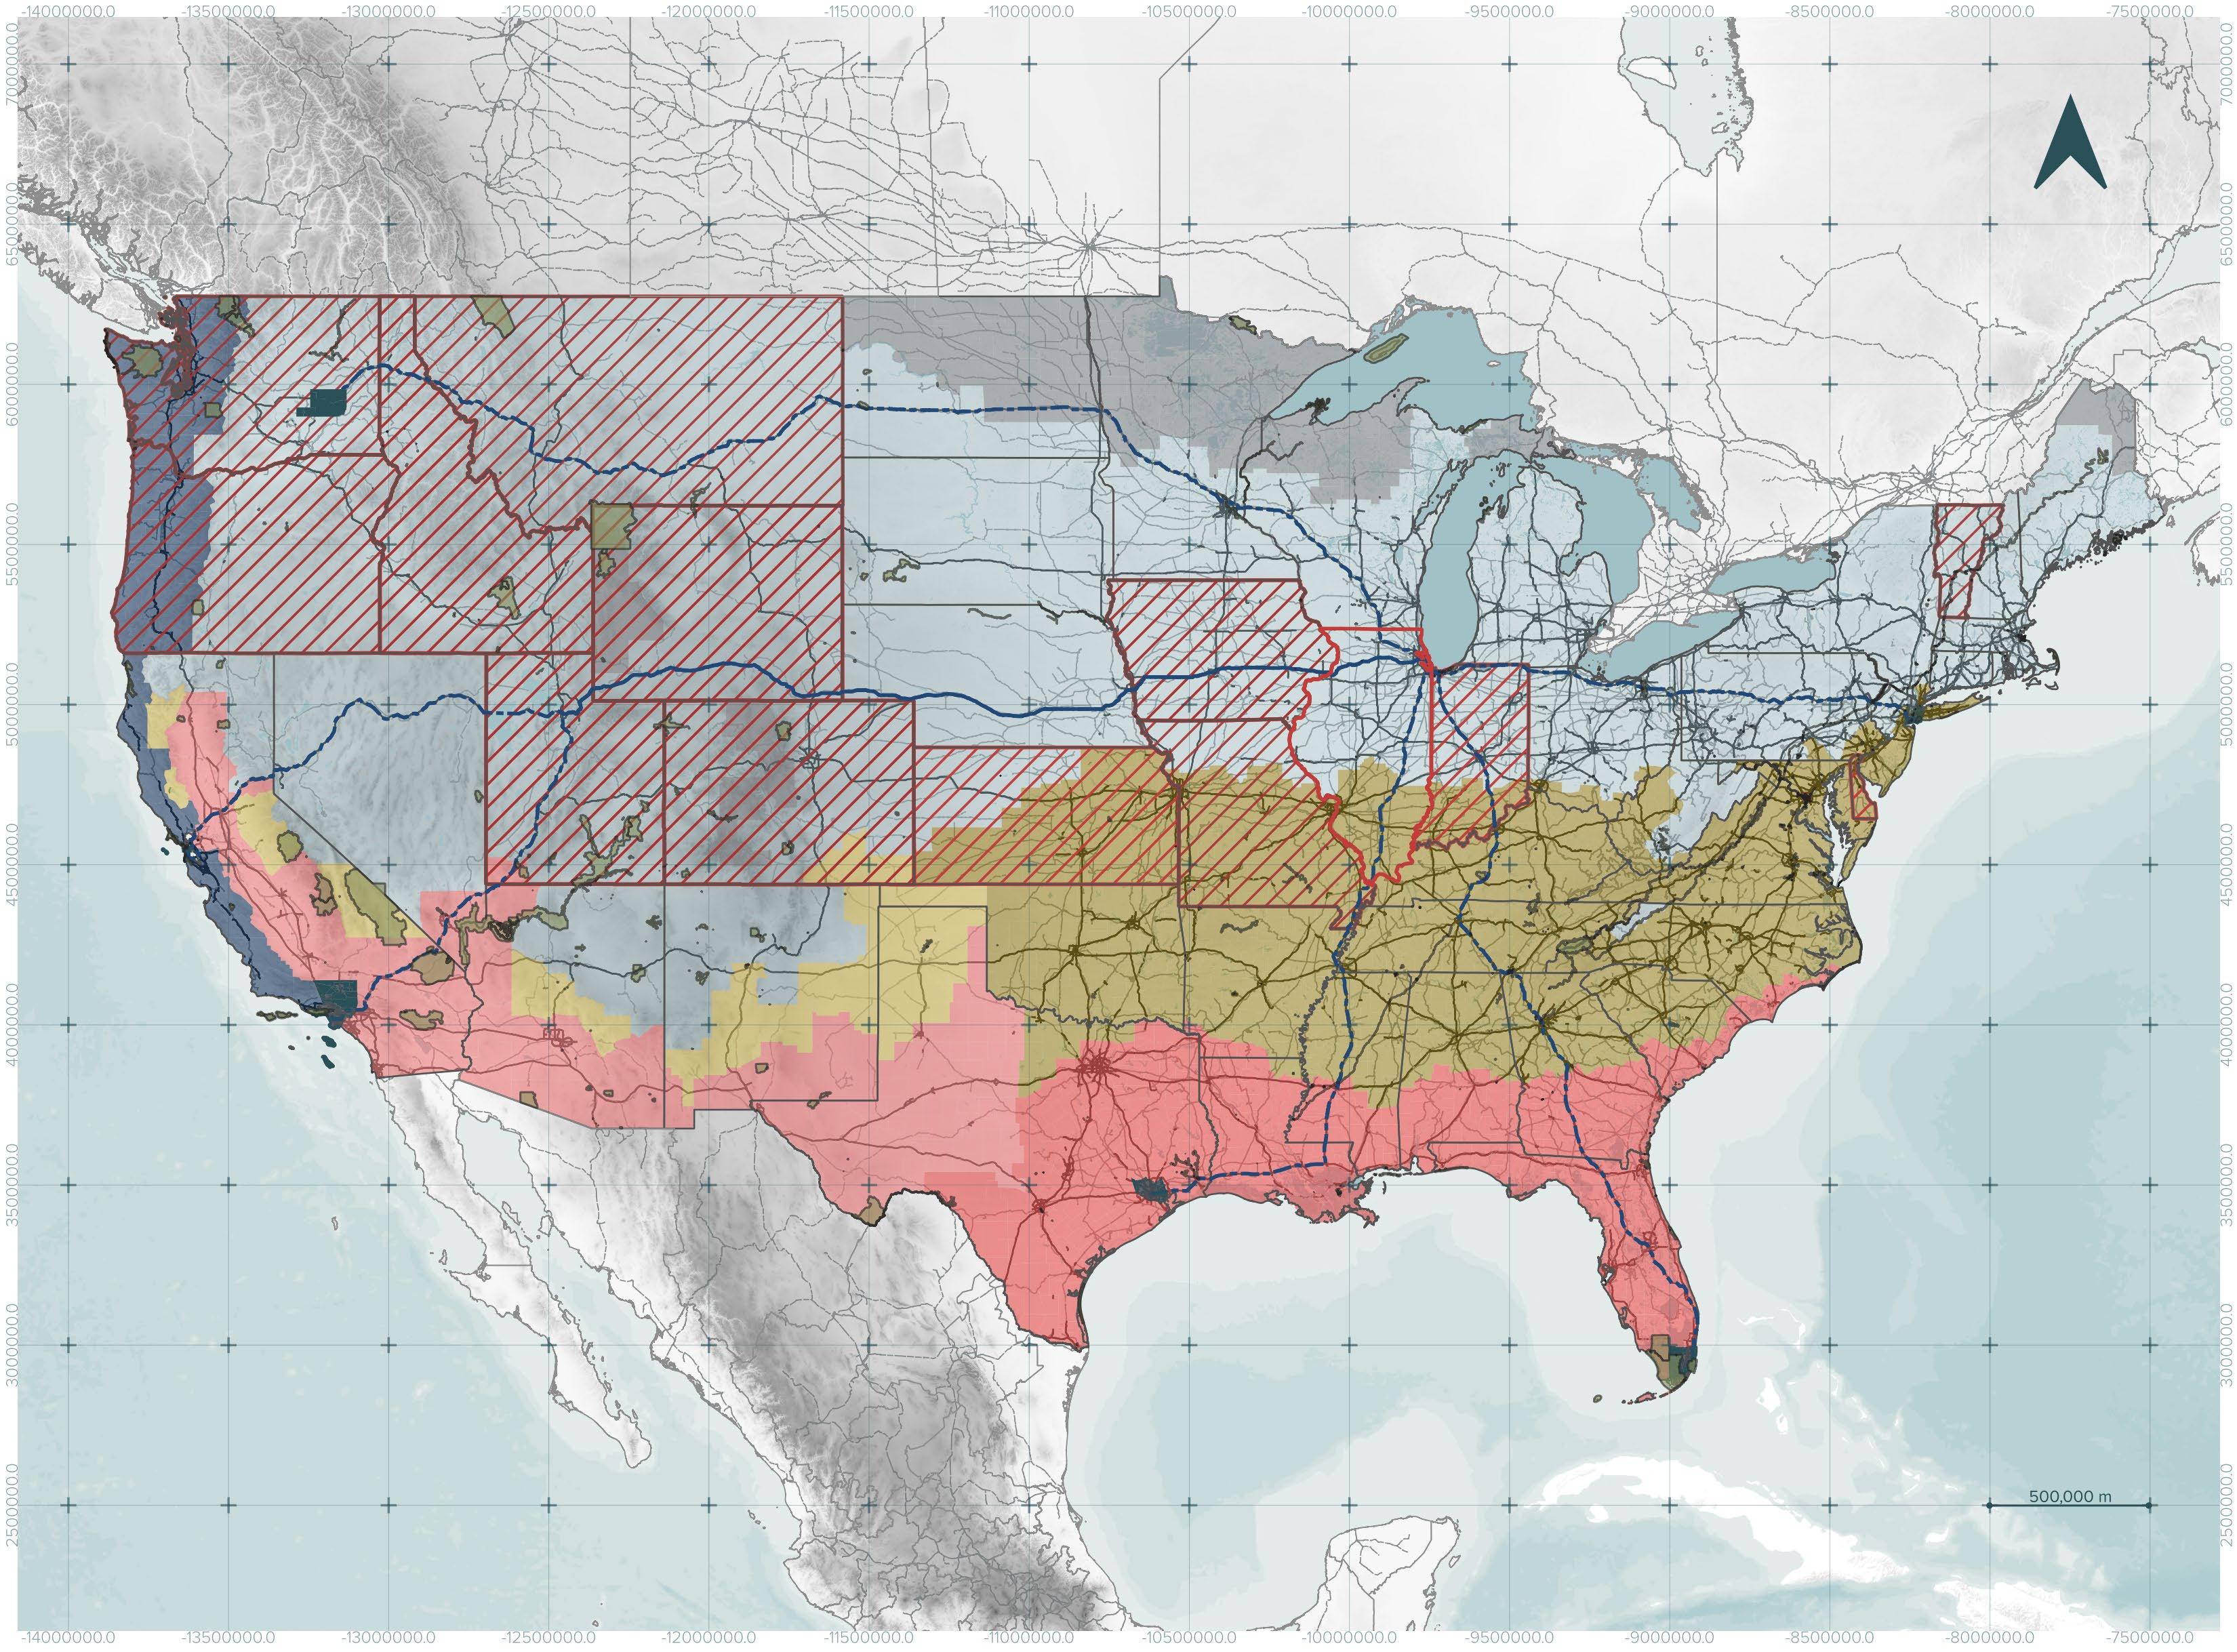
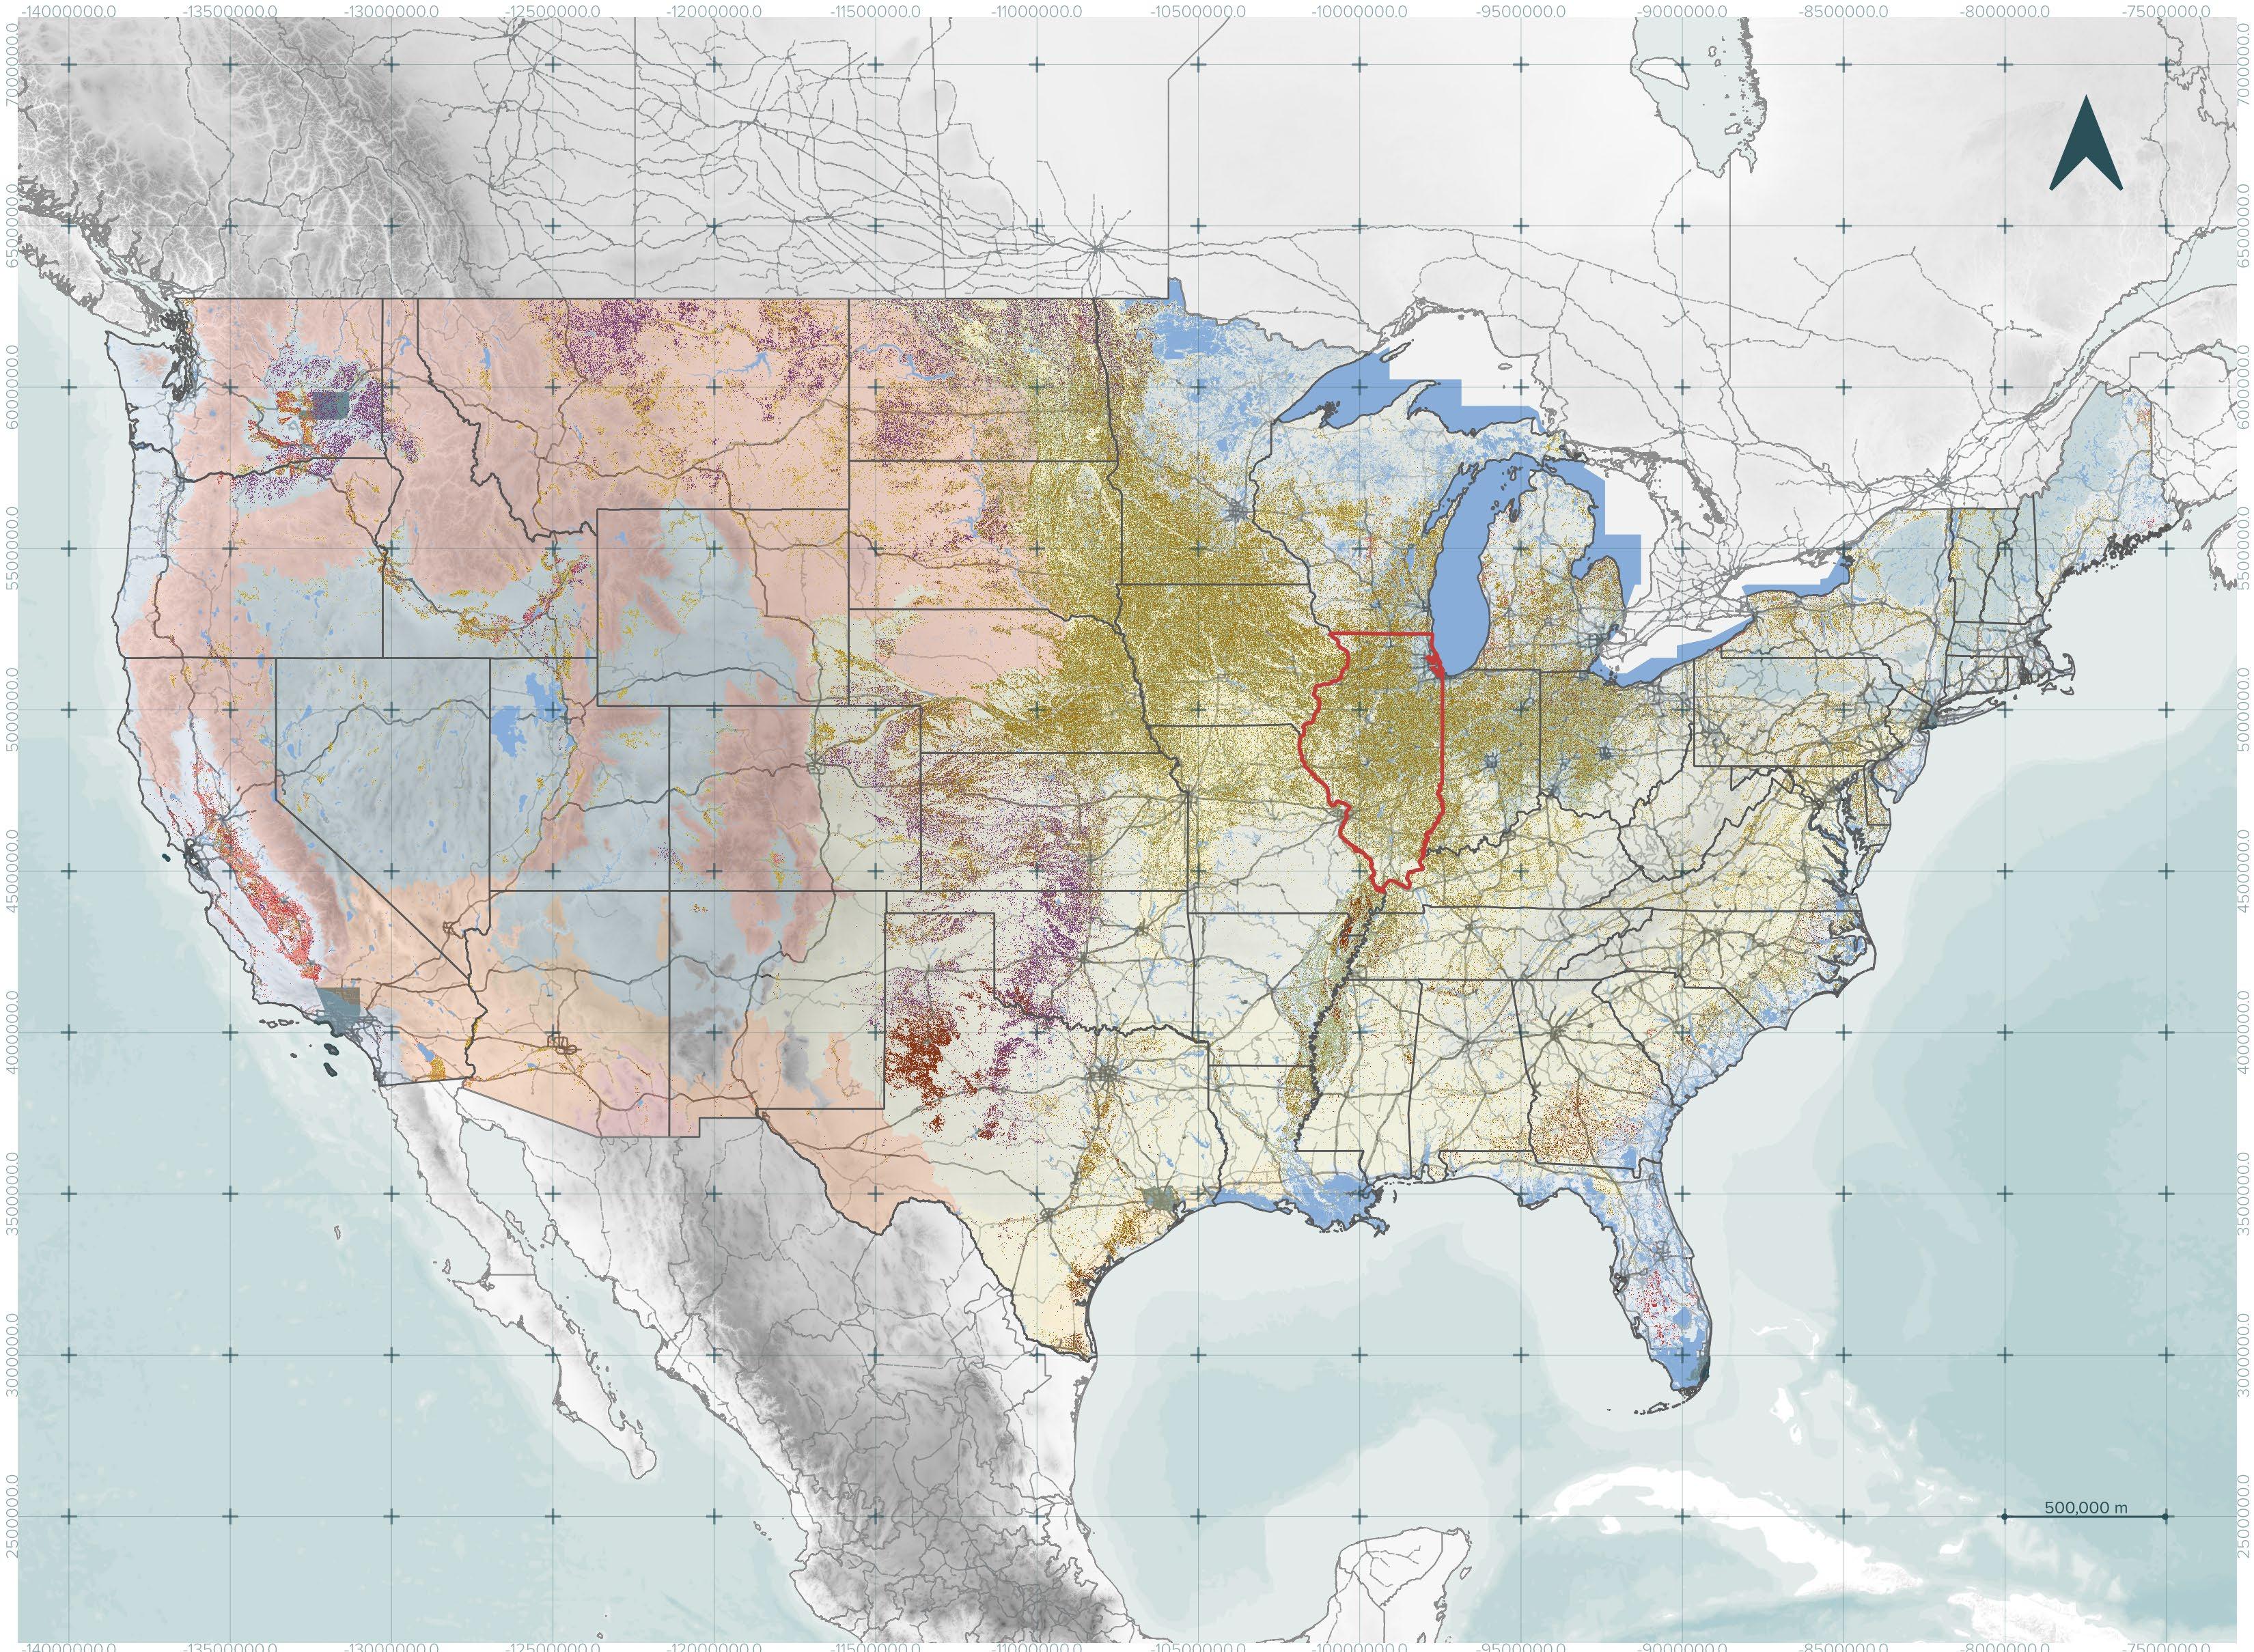
Dry Climates have less Density Index
The population of the United States is mainly concentrated in the eastern region, where warm and humid climates favor human settlement and urban development. In contrast, the western region shows a lower population density due to its more extreme environmental conditions, characterized by arid, dry, and cold climates that make it more difficult for inhabitants to concentrate.
Droughts in the Western USA
Speaking about droughts in the country, they are concentrated and intensified mainly in the northwest part of the United States, a region that has historically faced long periods of water scarcity. This entire territory is defined by mixeddry and cold climates, often accompanied by extreme temperatures, which makes this area one of the most vulnerable and critical in terms of the impacts and consequences generated by prolonged drought conditions..
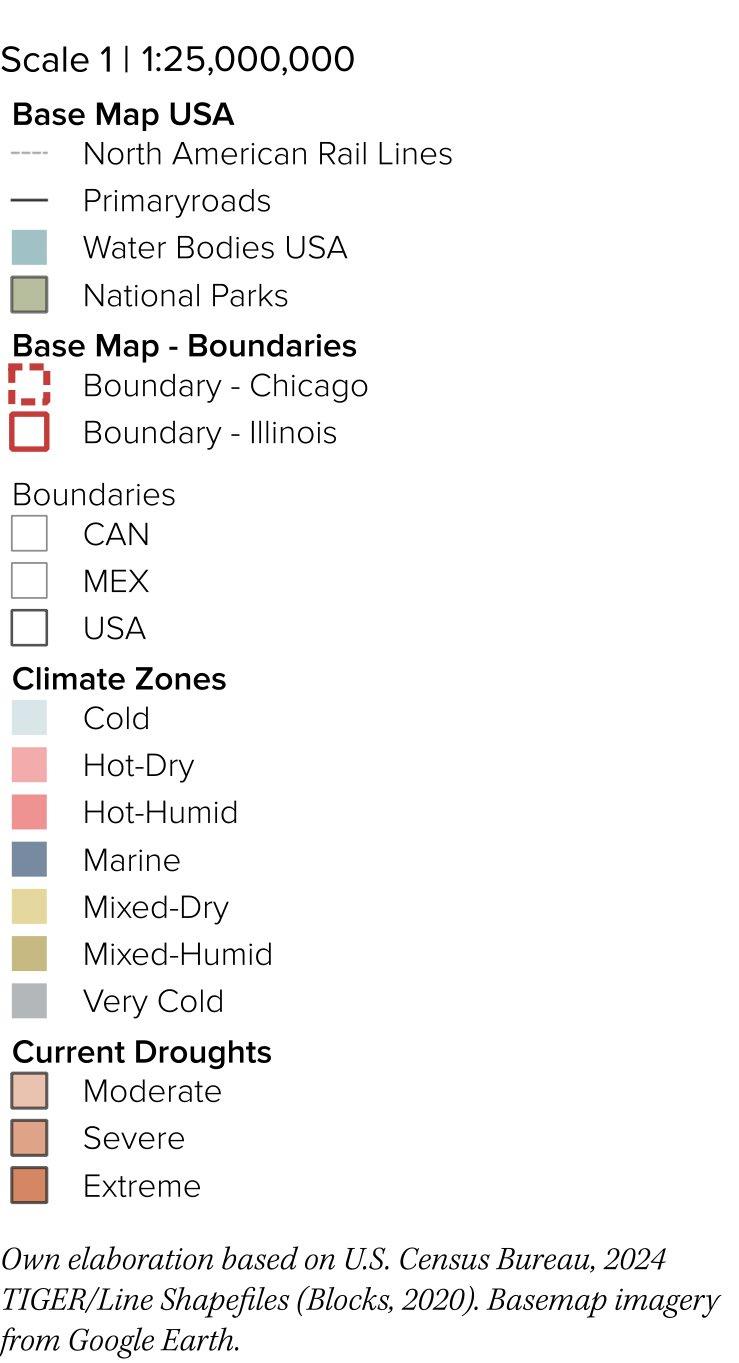
Southern rains intensified in Humid Climates
Focusing on the topic of precipitation at the national level, it is observed that precipitation is most common in the southern part of the United States, although it is mainly concentrated in the southeastern territories. This region stands out for its warm and humid climates, which favor abundant rainfall. Such conditions have historically shaped the landscape, biodiversity, and human activities that directly depend on water availability for survival and development.
Mental Illness concentrated in the Northwest
When addressing the issue of mental health within the United States population, a clear relationship was found between the states with the highest rates of Mental Illnesses and the regions characterized by more extreme climates. In these areas, where prolonged droughts or harsh cold temperatures prevail, mental illnesses such as depression and anxiety are more frequently reported. These conditions are especially concentrated in the northwestern territories of the country, as well as in some central regions, where vulnerability and risk among the population are considerably higher.
Wellness in the United States is shaped by more than individual choices; it is deeply influenced by social, economic, and environmental inequalities. Access to nutritious food, quality healthcare, safe neighborhoods, and opportunities for physical and mental wellbeing varies widely across communities, often along lines of income, race, and geography. Examining wellness through the lens of inequality reveals how systemic factors create disparities in health outcomes and highlights the need for policies and interventions that promote equitable opportunities for all to lead healthy, fulfilling lives.
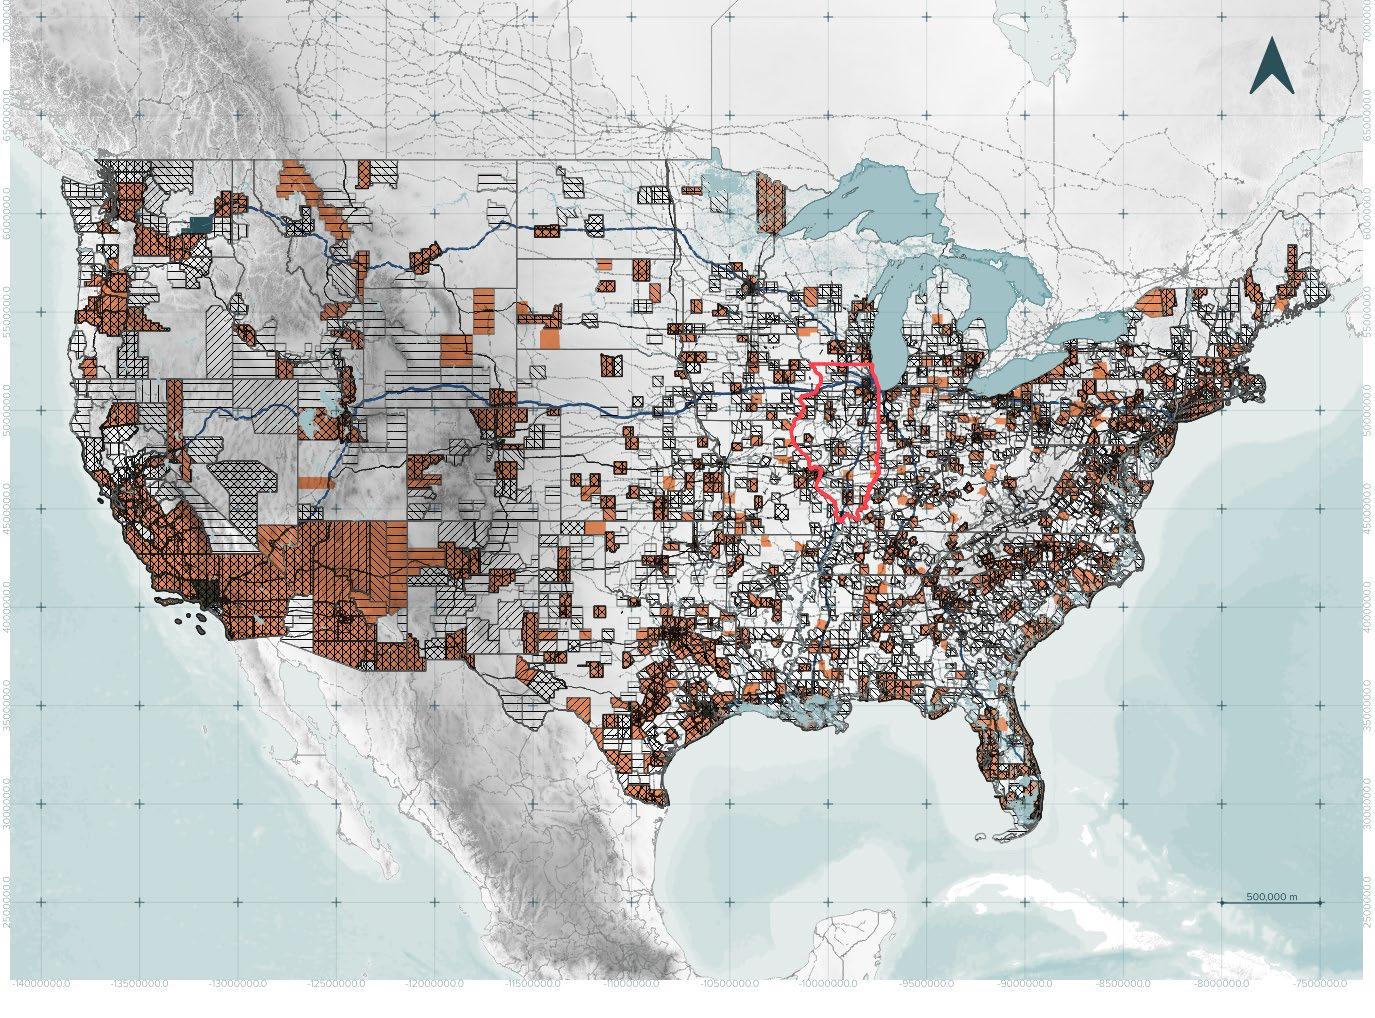
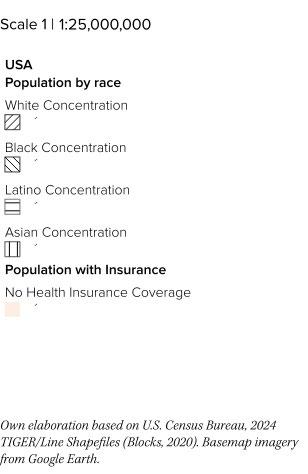
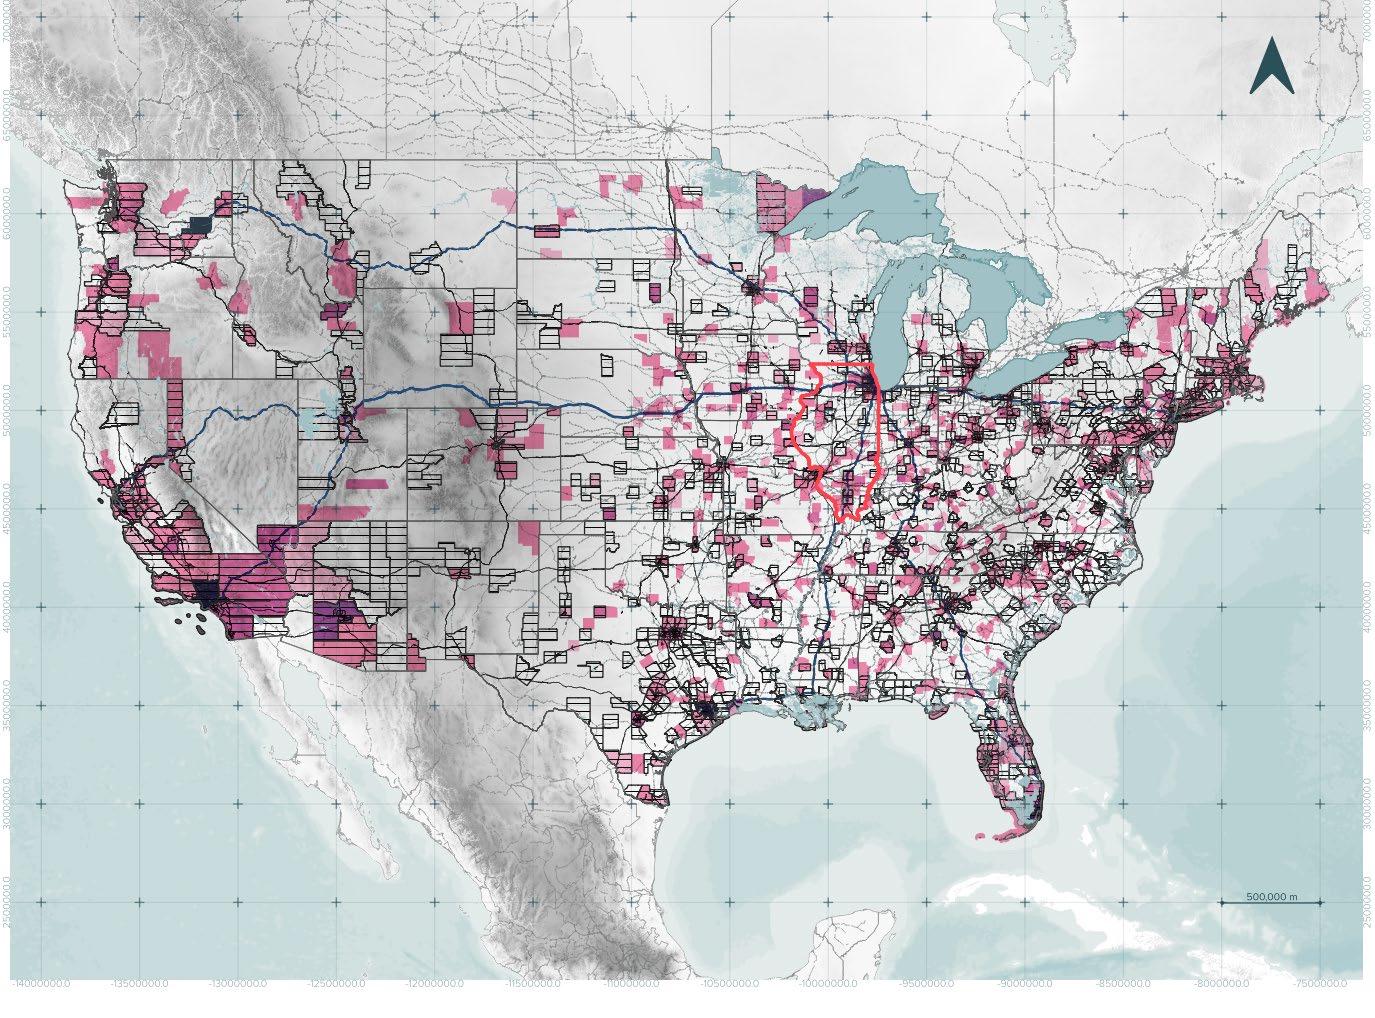
Health Insurance Inbalance by Racial Accesibility
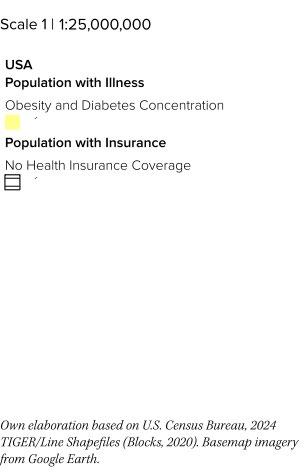
The concentration of population who have no health insurance coverage throughout the United States are concentrated mostly in its metropolitan areas where most of the races blend together, however in the Southern East region where black people are more concentrated and isolated, the cases of no health insurance coverage are concentration also high, allowing us to see a pattern in the access to healthcare and its racial inbalance, specifically in the black community.
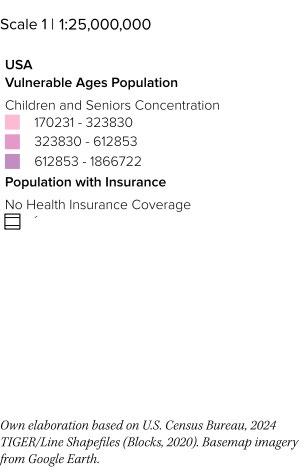
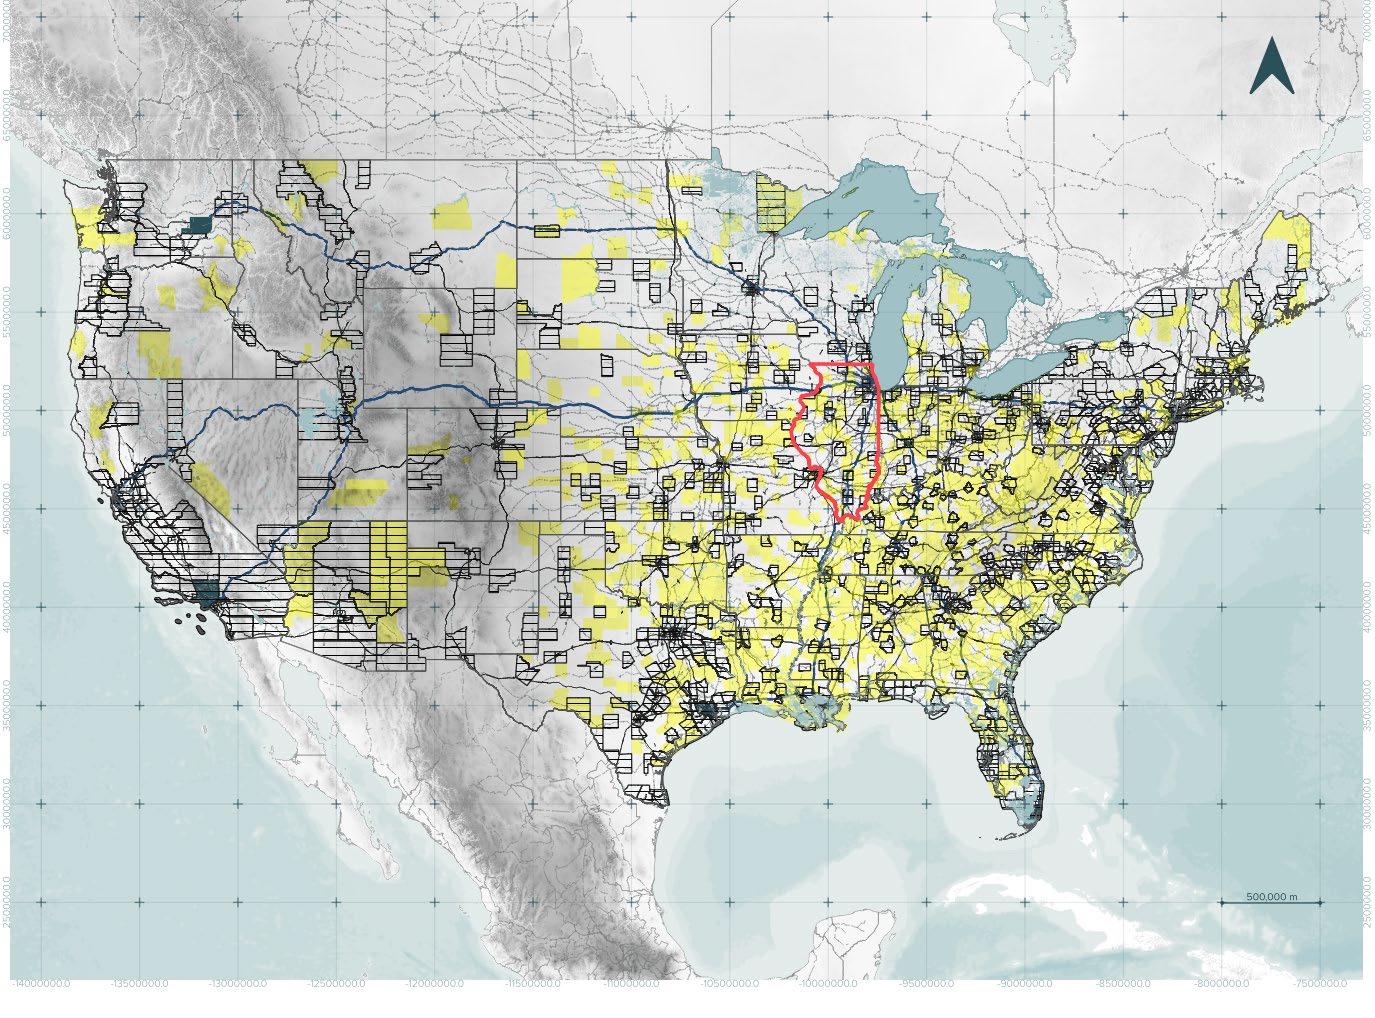
Going through the different population concentration based on age in the United States it became aware that the most vulnerable groups ended up being the two far extremes of the spectrum, the children and the seniors based on the concentration of no health insurance coverage by region in the country. Of course most are concentrated in the metropolitan areas, as well as the Southern East region.
The United States as it has been established has a concentration of no health insurance coverage in the metropolitan areas and in the south east region of the country. Diving specifically into health conditions Obesity and Diabetes reigns in the south east region compared to the rest of the United States. It is also interesting to point out that the metropolitan areas do not have the same concentration tendency in the obesity and diabetes topic, meaning this is a more secluded issue in that specific zone.
Nutrition is a cornerstone of public health, directly affecting physical development, disease prevention, and overall well-being. In the United States, disparities in access to healthy, affordable food contribute to chronic illnesses such as obesity, diabetes, and heart disease, particularly in low-income and marginalized communities. Studying nutrition within a public health framework emphasizes the importance of policies, education, and community programs that promote equitable access to nutritious foods, aiming to improve population health and reduce health inequalities across the country.
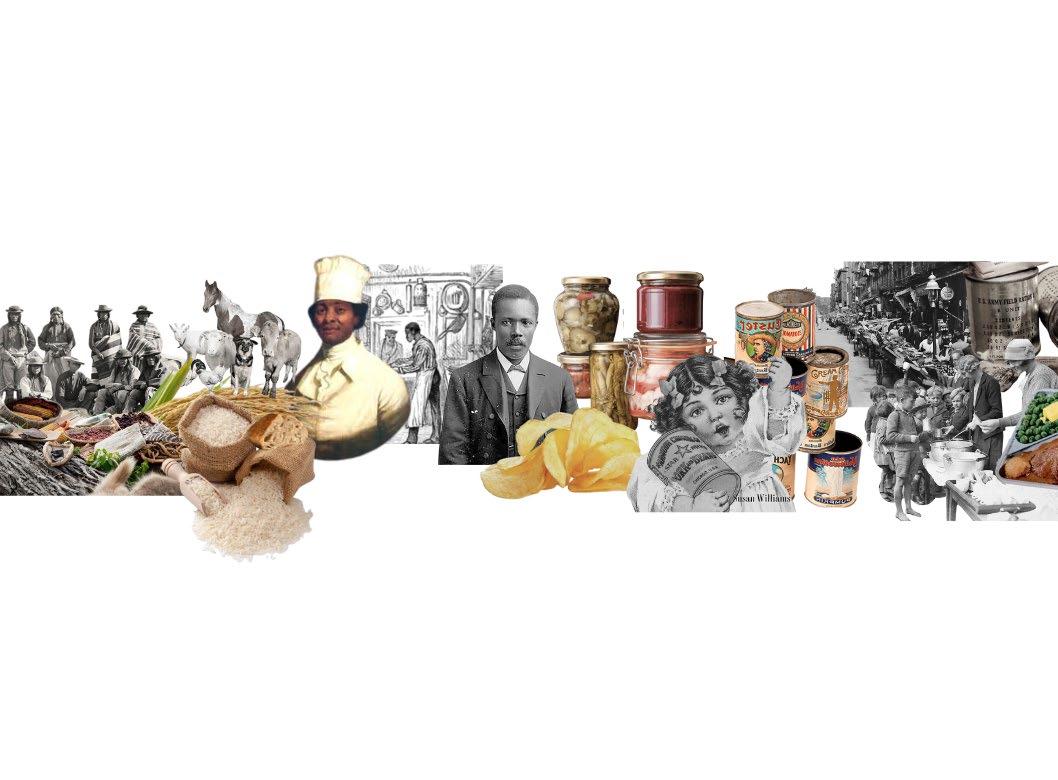
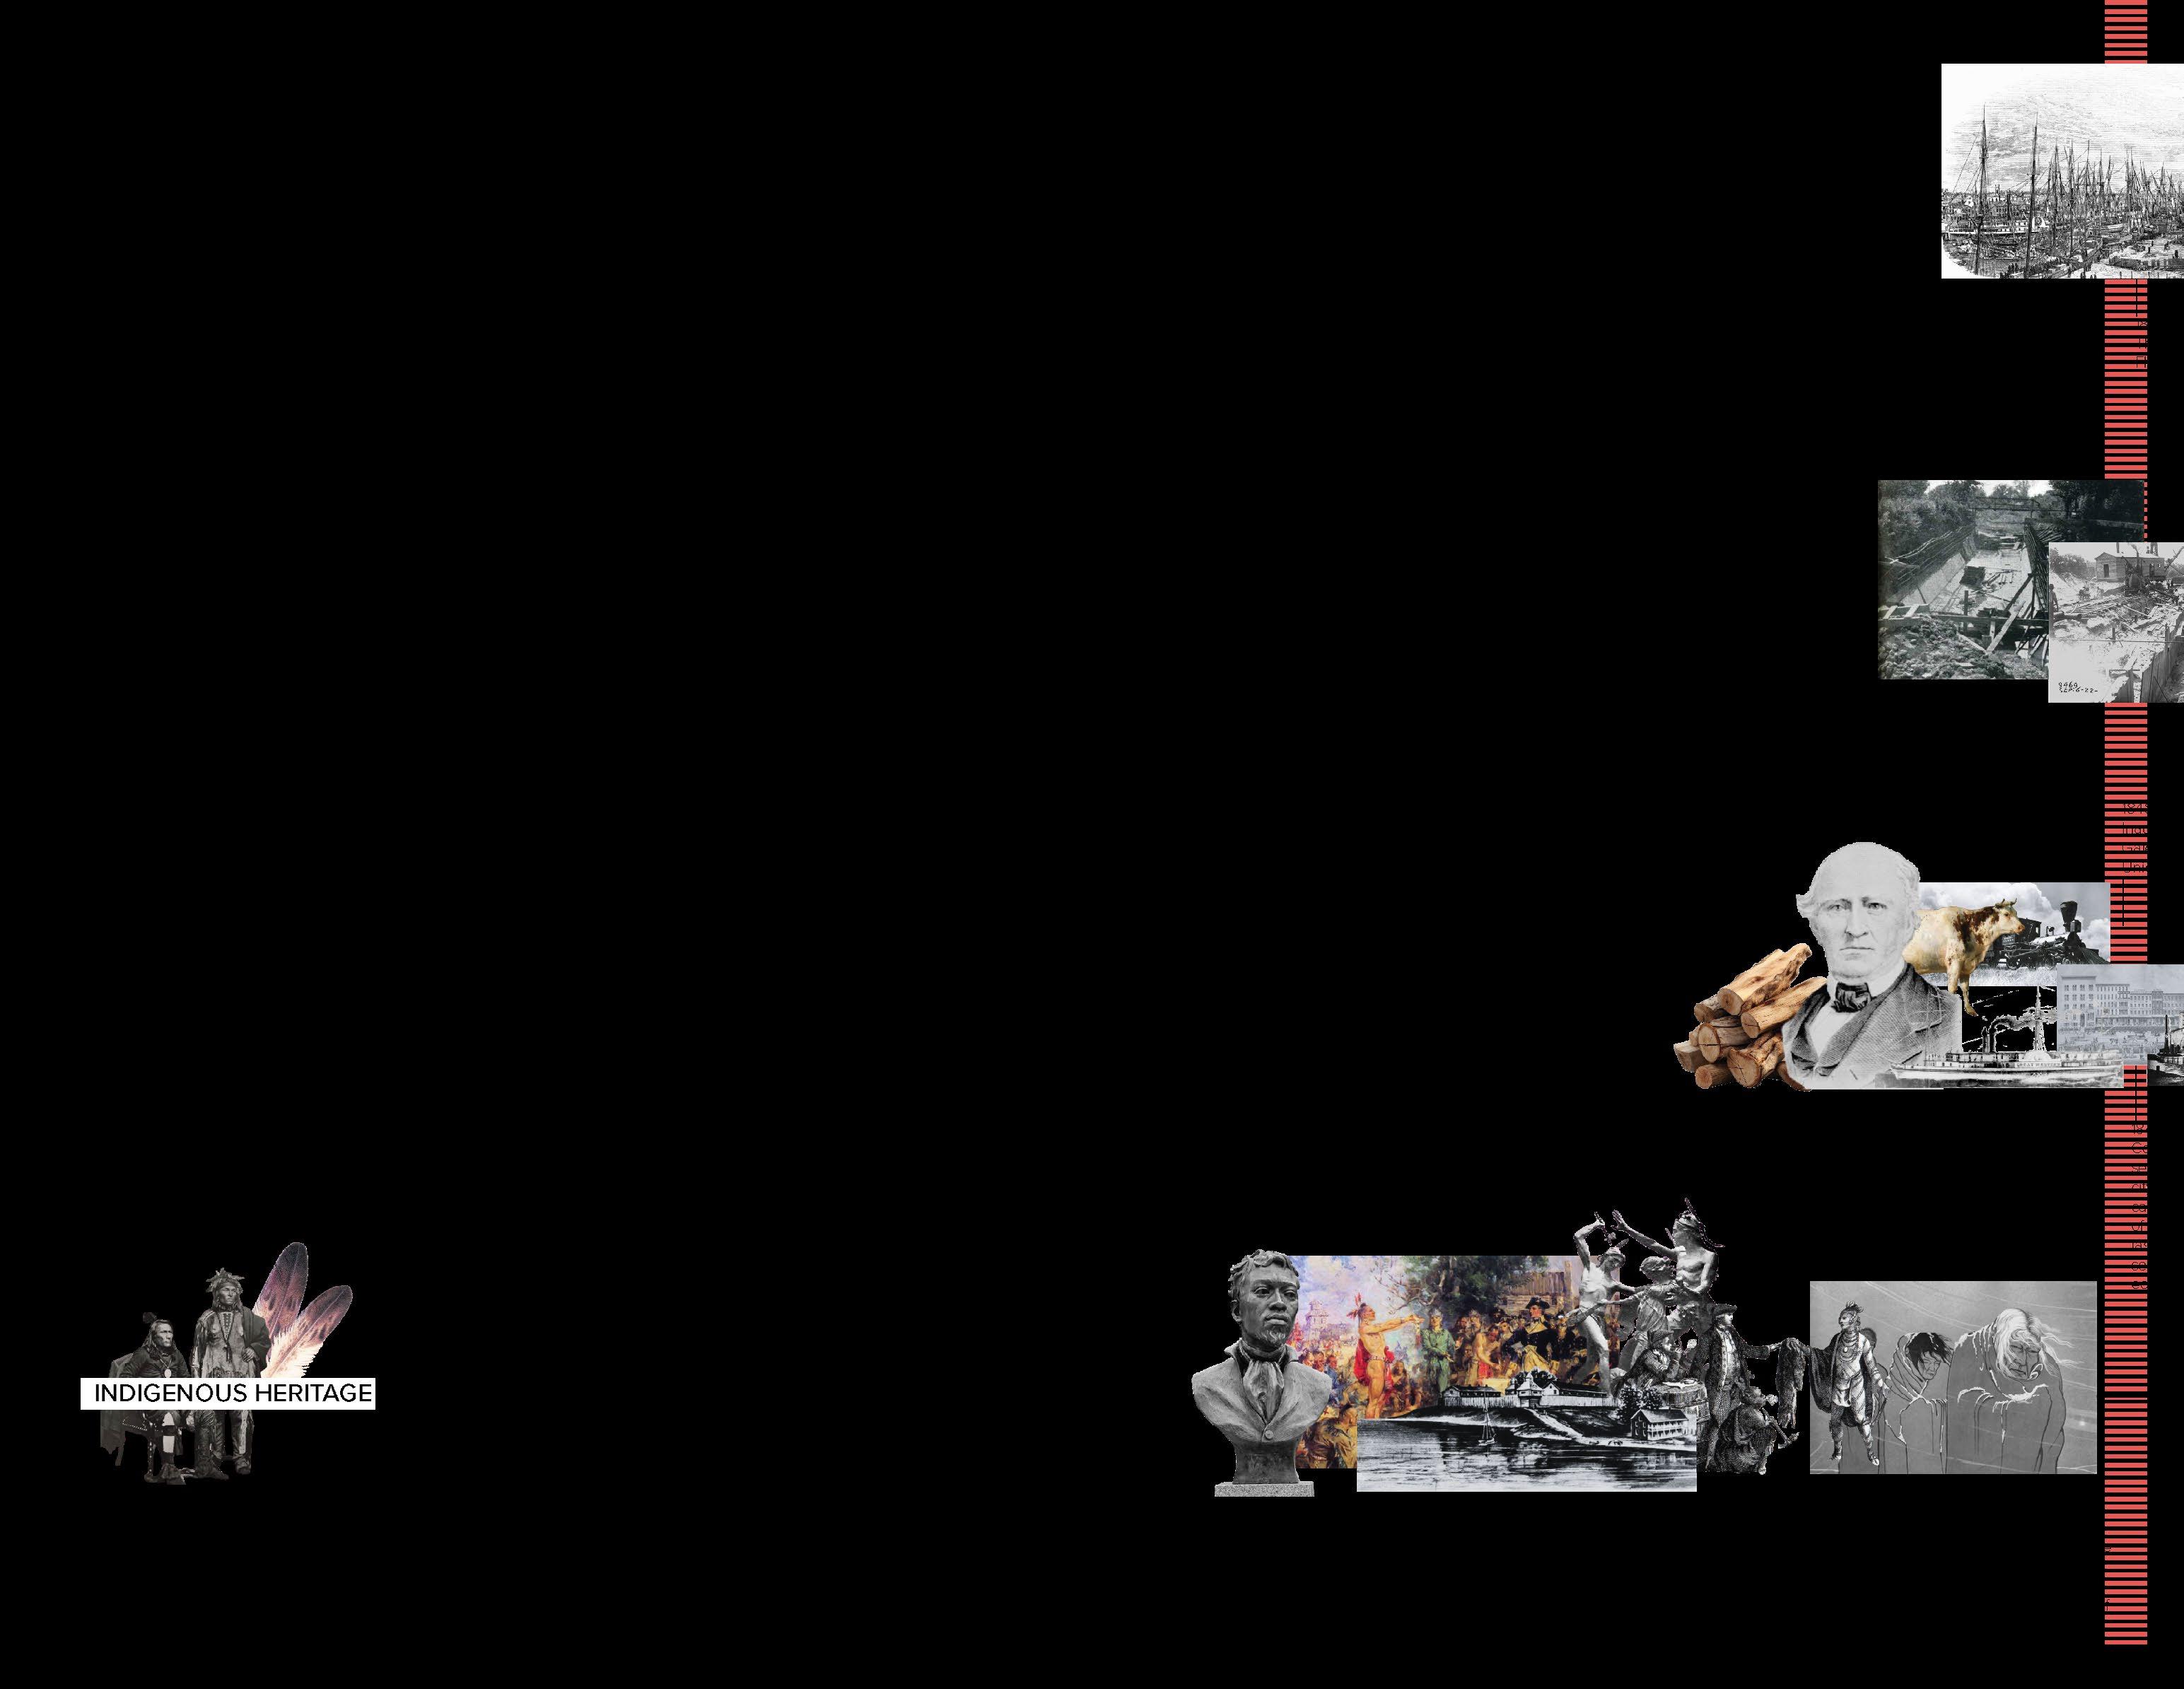
Bef. 1492
Indigenous roots
Dark green vegetables, red and orange vegetables, canned beans, peas, lentils, starchy vegetables
James Hemmings introduces mac & cheese, ice cream, and fries; migrations spread soul food nationwide.
1858
Mason jar invention Home food preservation revolution.
1853
Birth of potato chip
George Crum invents “potato chips.”
1900
Packaged & canned food industry
First mass sales of ketchup & chips; rise of packaged & canned goods and breakfast cereals.
Beg. 1900s
Immigration & adaptation
Italians, Eastern Europeans, and Chinese adapt their cuisines in the U.S.
1920s–1930s
Great Depression diet canned goods and cheap, durable foods.
1940s War Wartime
Fortified nut butter,
1940s (World II)
Wartime food
Fortified bread, peabutter, MSG, and 1953
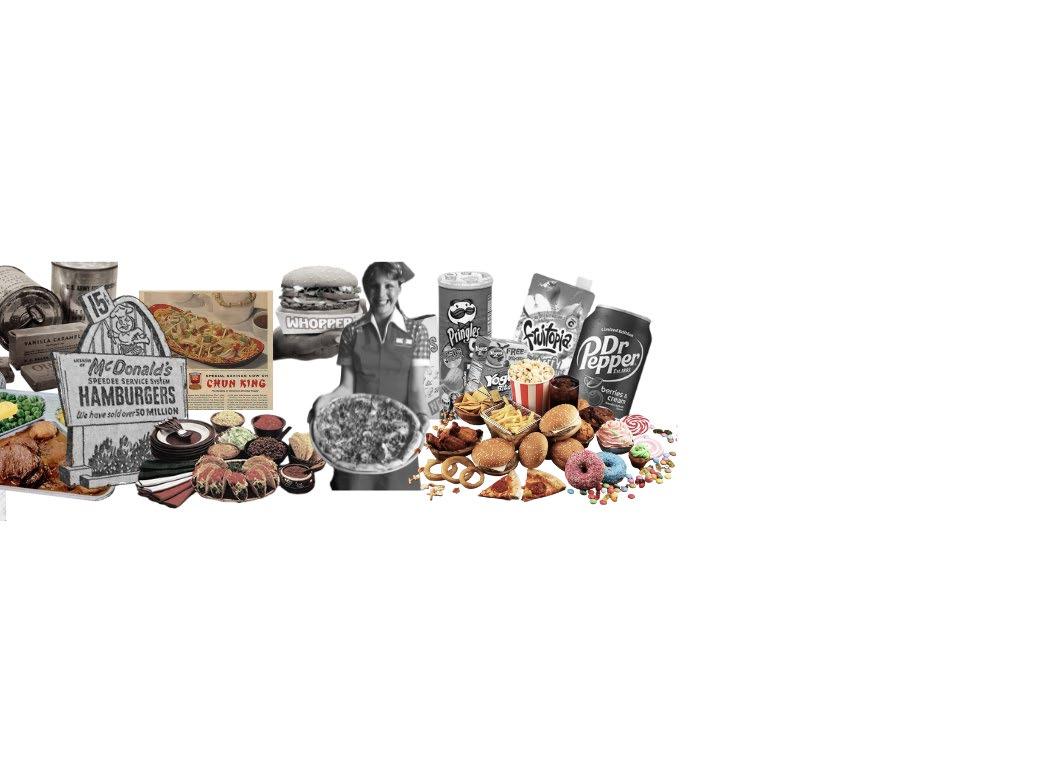
TV dinners
Swanson launches frozen meals for microwaves.
1955
Rise of fast food
McDonald’s sells hamburgers for 15 cents.
1965
New wave of immigration
Asian and Latin American migrants diversify U.S. cuisine.
1970s–1980s
Fast food boom
Expansion of Pizza Hut, Burger King, and Taco Bell.
1990s–2000s
Snackification
Rise of energy drinks, cereal bars, and packaged
Present (2000s–2020s)
Health backlash & overprocessed diet
Today’s American food system is dominated by ultra-processed products, while organic, farm-to-table, and clean-label movements rise as countertrends.
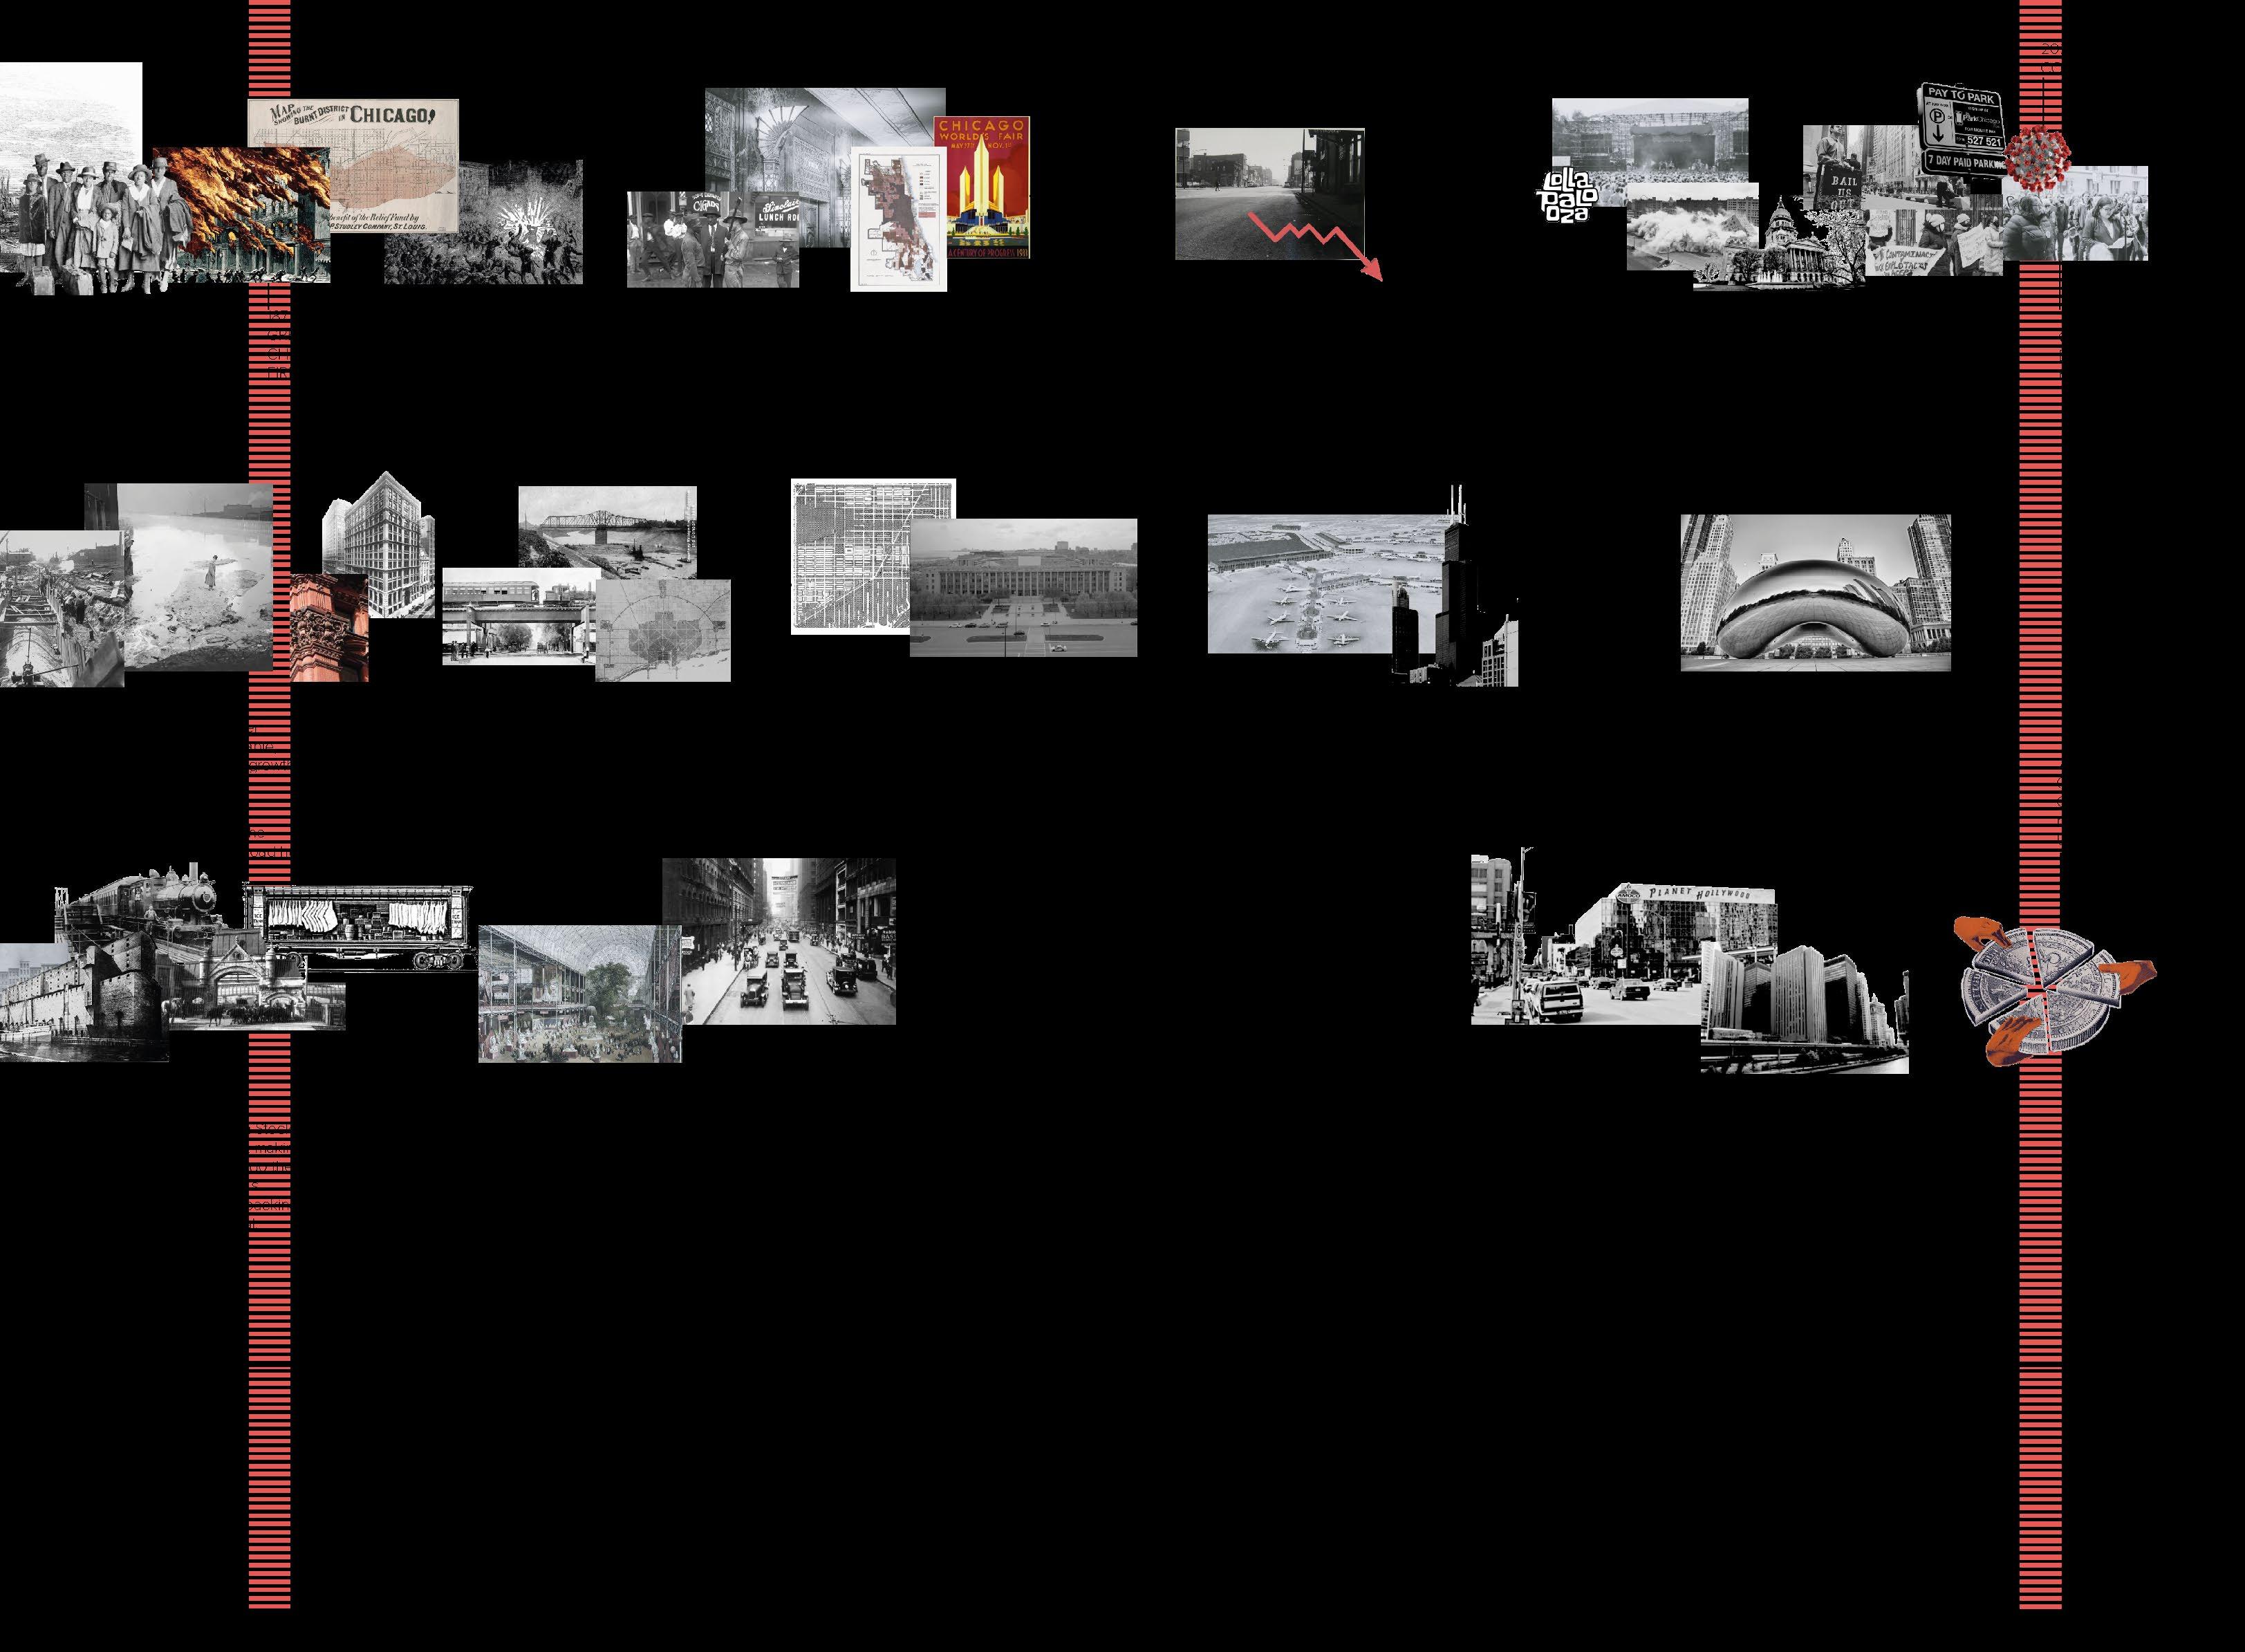
History of American Cuisine: A Cultural Fusion Reflected in Ultra-Processed Foods
American food today is diverse, eclectic, and everevolving. people regularly combine flavors and techniques from multiple cultures in a single meal (fusion cuisine). Over time, american cuisine has been shaped by many influences: first from native americans, then african, italian, asian, and hispanic cultures. today, this cultural blend is reflected in the widespread presence of ultra-processed foods, showing how traditional flavors have been adapted and commercialized for convenience and mass consumption.
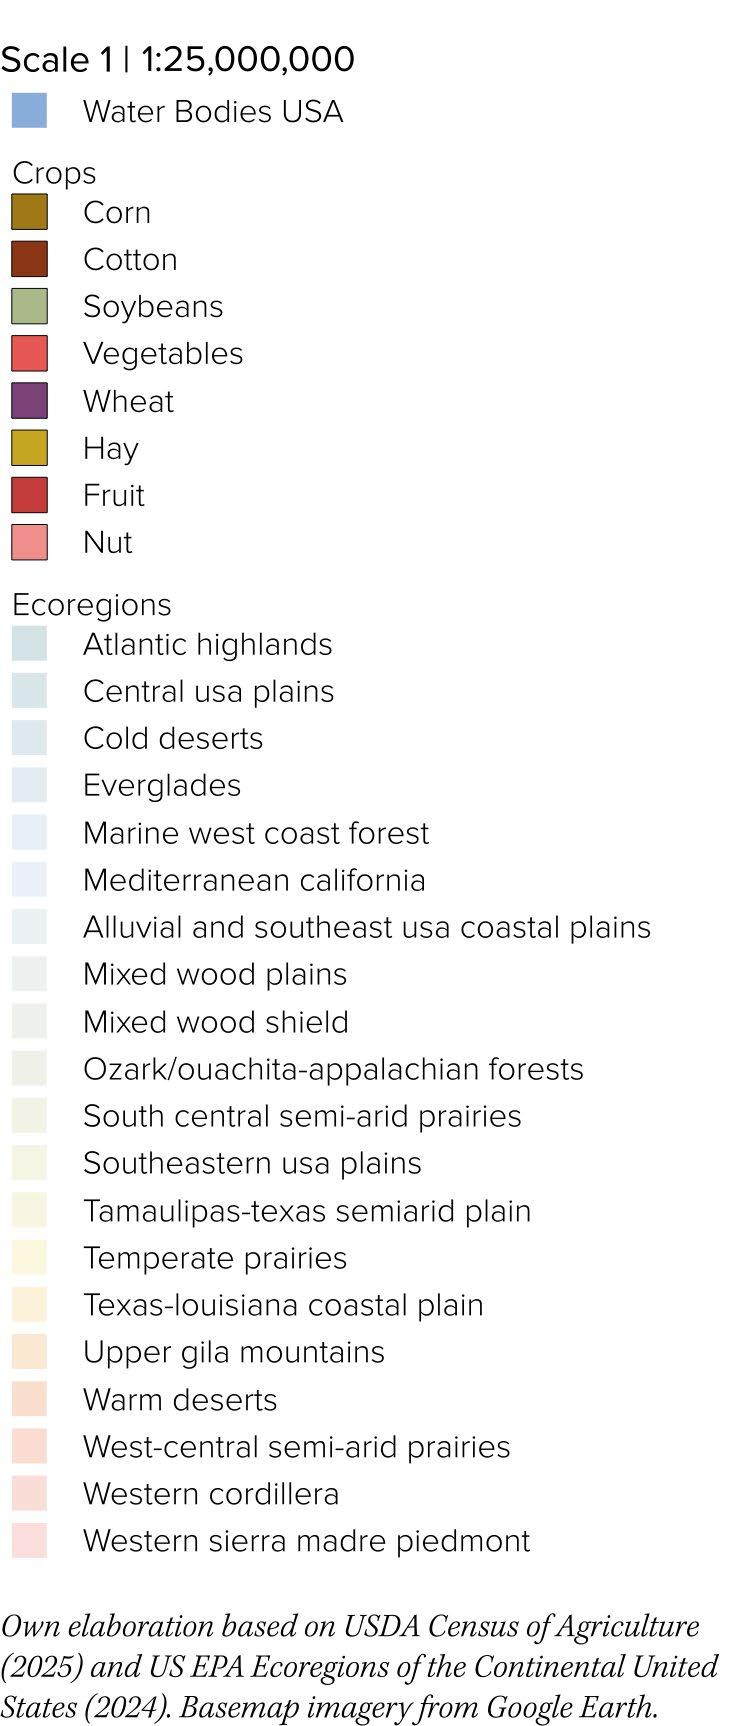
Health Risks from Crop Chemicals
and Hormones
Chemicals and hormones in crops boost production and profits but expose vulnerable populations to health risks. Their widespread use also makes ultraprocessed foods cheaper and more accessible, reinforcing harmful dietary patterns.
CHEMICALS & HORMONES
HUMAN HEALTH EFFECTS
CANCER RISK
HORMONAL DISRUPTION
NEUROLOGICAL EFFECTS
LOW HORMONAL RISK
RESPIRATORY IRRITATION
FERTILITY ISSUES
LIVER KIDNEY TOXICITY
IRRITATION LOW RISK
GASTROINTESTINAL IRRITATION
VULNERABLE GROUPS
CORN
GLYPHOSATE ATRAZINE
NEONICOTINOIDS
GIBBERELLIC ACID
SOYBEANS
DICAMBA
TRIAZOLE FUNGICIDES
COTTON 2,4D
MEPIQUAT CHLORIDE
ETHEPHON WHEAT VEGETABLES
PYRETHROIDS
CHLOROTHALONIL FRUIT
COPPER FUNGICIDES
GIBBERELLINS
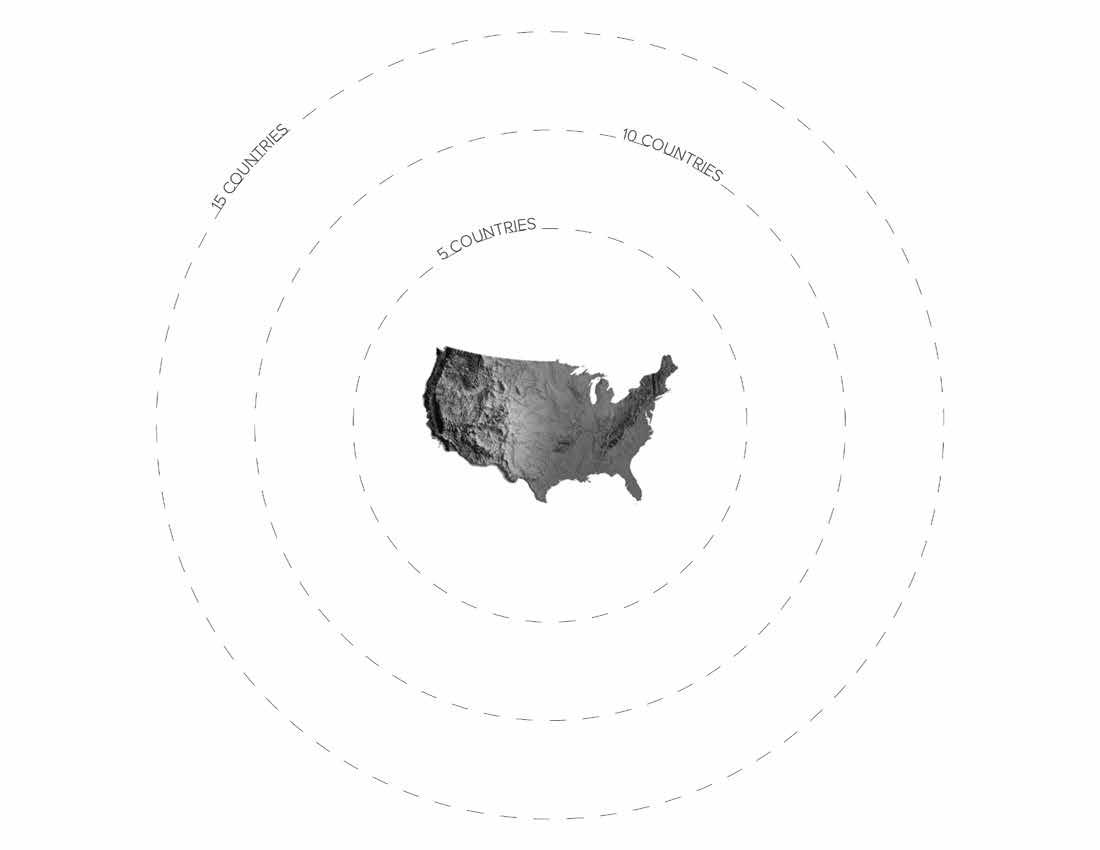
Imported Foods Raise Costs
U.S. food imports are driven by demand for variety, seasonal and climatic limitations, and the need for products not widely produced domestically, such as tropical fruits, cocoa, and coffee. The entire continent exports a wide range of products to the U.S., making fresh produce like fruits and vegetables significantly more expensive.
ANIMALS
VEGETABLES
BEVERAGES
COCOA
COFFEE
DAIRY
FISH
FRUITS
GRAINS
Vegetables
Dark green vegetables, red and orange vegetables, canned beans, peas, lentils, starchy vegetables
Fruit
Whole fruit, and 100% fruit juice
Others
Prepared foods, coffee, tea, table fats, condiments, soda, and candy
Protein
Meat, poultry, eggs, seafood, and nuts, seeds and soy
United States food basket
$193 USD
$3617 MXN
Dairy
Cheese, higher-fat milk, yogurt, soy alternatives, and low- and nonfat milk, yogurt, soy alternatives
Ultra-processed foods are easier and cheaper to access in the U.S.
The basic food basket in the united states reflects a high consumption of ultra-processed foods, resulting from a strong dependence on imports needed to bring fresh products to the table, which also makes them more expensive. Therefore, it is much easier and cheaper for americans to consume ultra-processed foods. In contrast, the mexican food basket, thanks to its biodiversity and food culture, provides much easier and more direct access to fresh foods.
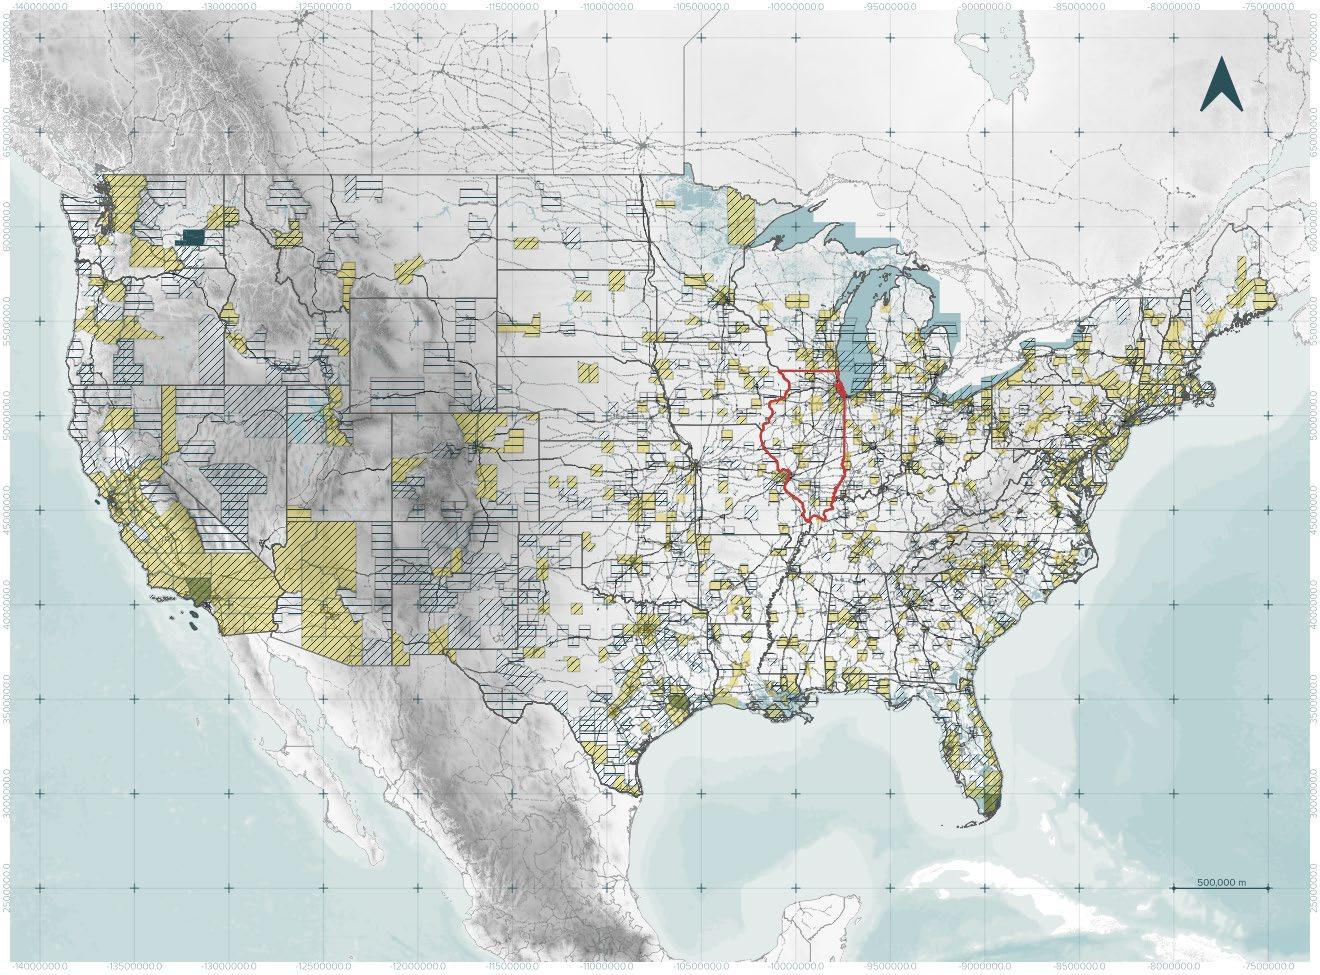
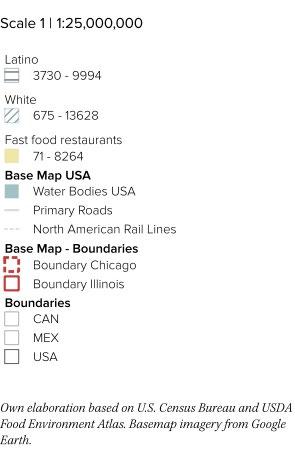
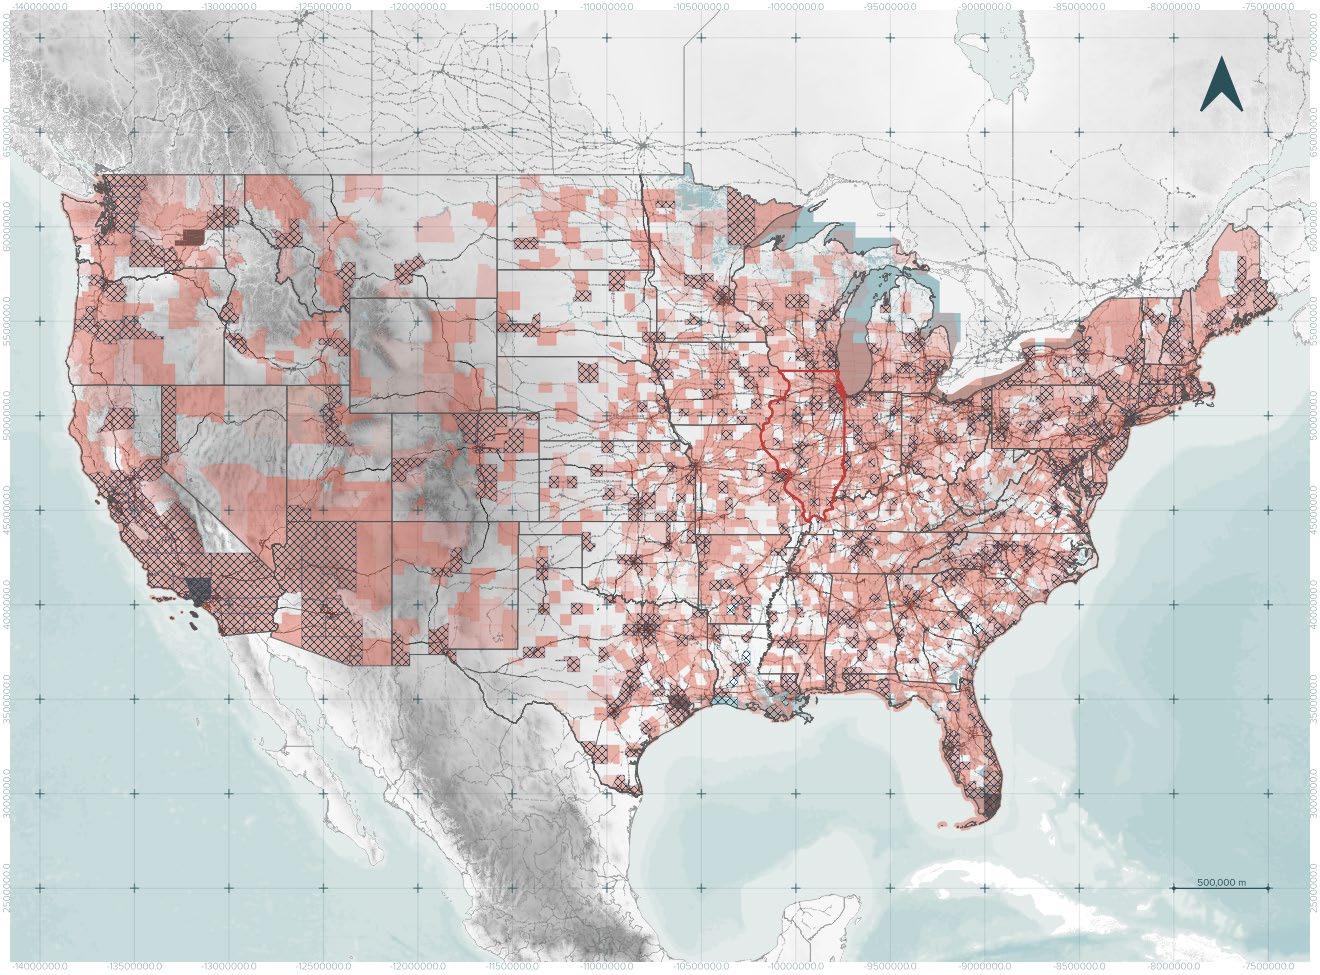
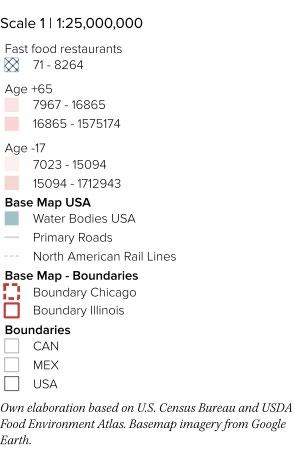
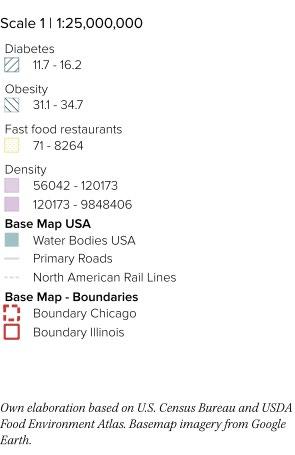
Latino Food Choices in the U.S are Shaped by Culture
The map illustrates that areas with a higher concentration of white residents tend to have a greater number of fast food restaurants, whereas areas with larger latino populations show little to no correlation with the presence of fast food. This pattern reinforces the idea that, even within the United States, latino communities continue to uphold cultural traditions that favor the consumption of fresher, less processed foods, reflecting a strong connection to their culinary heritage and dietary practices.
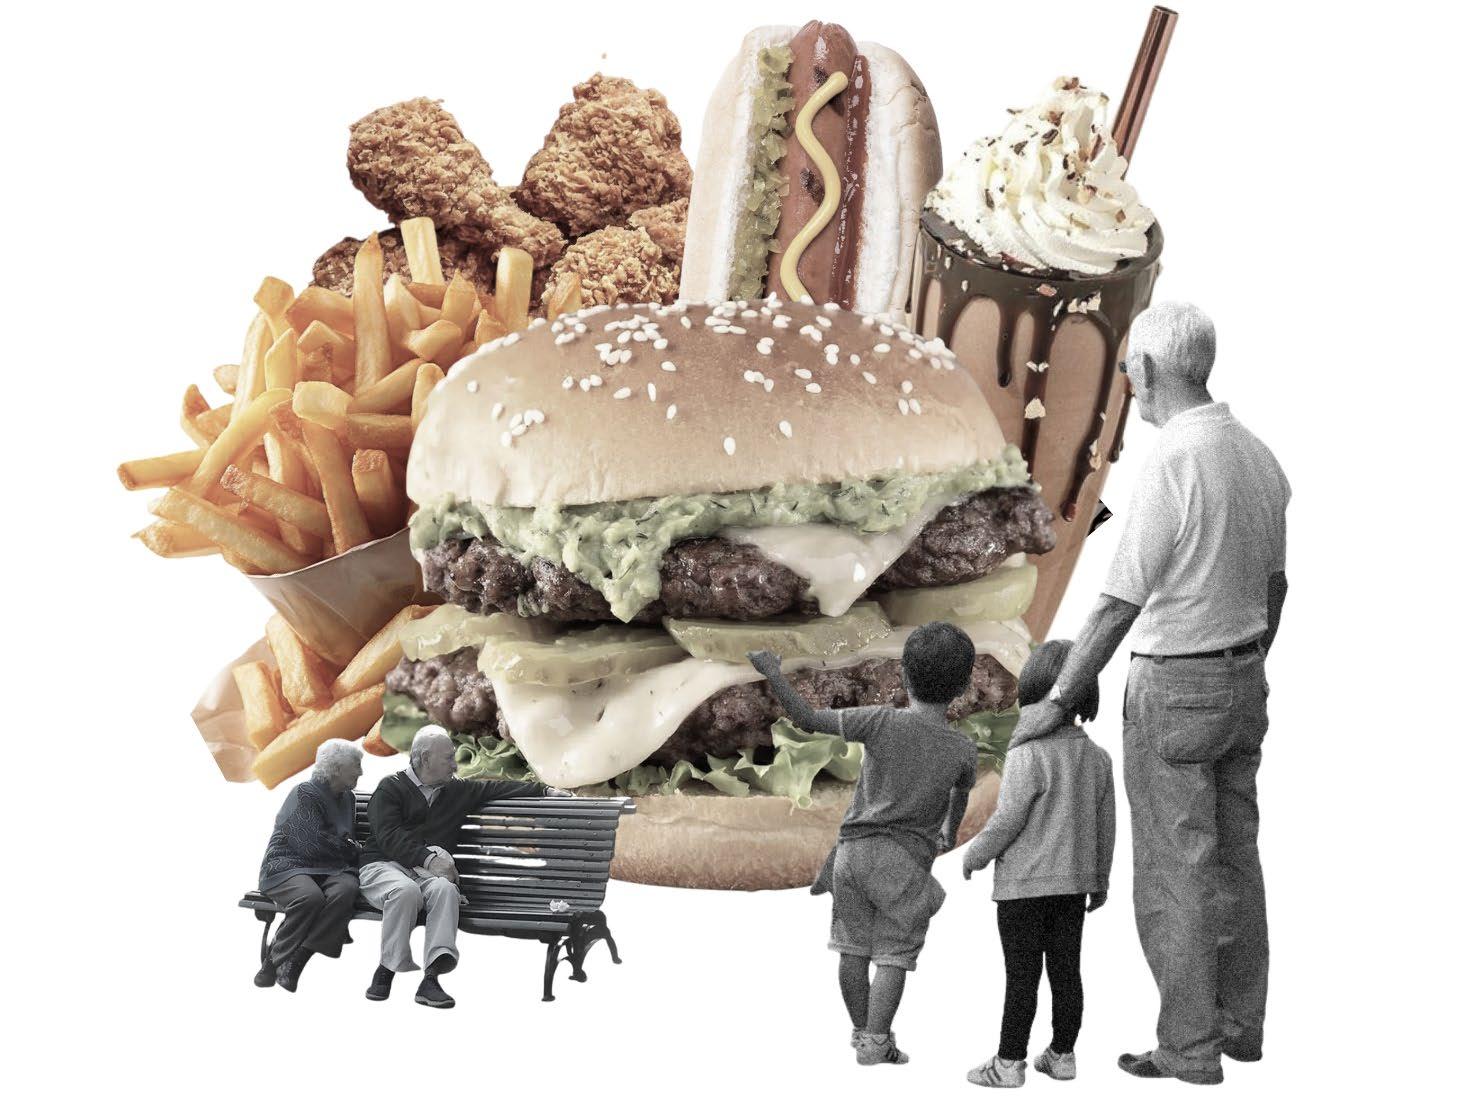
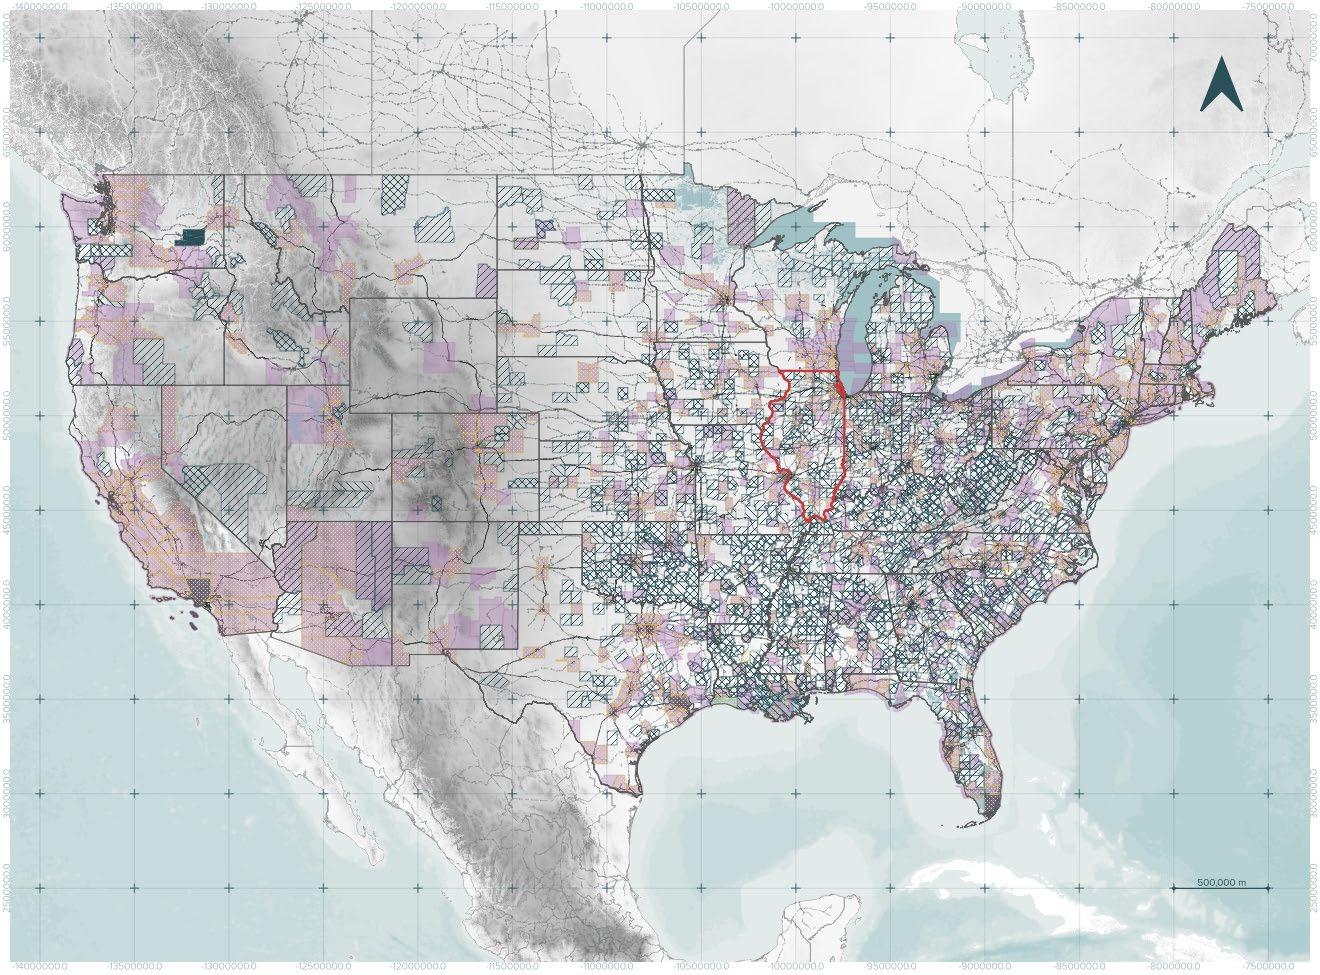
Vulnerable Age Groups are More Exposed to Fast Food
The map shows a clear overlap between vulnerable age groups—children under 17 and adults over 65—and areas with many fast-food restaurants. This raises public health concerns, as children are highly influenced by their food environments, while older adults may rely on convenient, low-cost meals. The pattern suggests that those most in need of nutritious diets are often the most exposed to fast-food–dominated areas, increasing long-term diet-related health risks for individuals and communities.
Fast food–dense Areas
Contribute to Higher Obesity and Diabetes
Areas with dense populations and a high concentration of fast-food outlets tend to show higher rates of obesity and diabetes. This highlights how the local food environment can strongly influence public health outcomes, especially in regions already vulnerable due to demographic and socioeconomic factors. It also confirms that people continue to prefer ultraprocessed foods over fresher options, largely due to limited access or higher costs of fresh, nutritious foods.
WILLIS TOWER (1973)
ICONIC SKYSCRAPER, FAMOUS FOR THE SKYDECK.
BUCKINGHAM
FOUNTAIN (1927)
MONUMENTAL FOUNTAIN IN GRANT PARK.
CLOUD GATE (2004)
REFLECTIVE SCULPTURE BY ANISH KAPOOR IN MILLENNIUM PARK.
CHICAGO RIVERWALK (2001–2016)
WATERFRONT PROMENADE WITH MOVABLE BRIDGES.
WRIGLEY
BUILDING (1924)
LANDMARK OFFICE BUILDING WITH WHITE
MILLENNIUM URBAN SPACE AND CROWN
TERRA-COTTA FAÇADE.
CHICAGO THEATRE (1921)
RENOWNED FOR ITS VERTICAL “CHICAGO” SIGN.
NAVY PIER (1916)
HISTORIC PIER WITH THE CENTENNIAL WHEEL AND CULTURAL SPACES.
JOHN HANCOCK CENTER (1969)
LANDMARK SKYSCRAPER WITH 360 CHICAGO OBSERVATION DECK.
MILLENNIUM PARK (2004)
SPACE WITH PRITZKER PAVILION CROWN FOUNTAIN.
ART INSTITUTE OF CHICAGO (1893)
WORLD-CLASS ART MUSEUM WITH BRONZE LIONS AT THE ENTRANCE.
CHICAGO’S
FRAMEWORK
ECOLOGIES OF HEALTH WELLNES AND INEQUALITIES URBAN STRESS
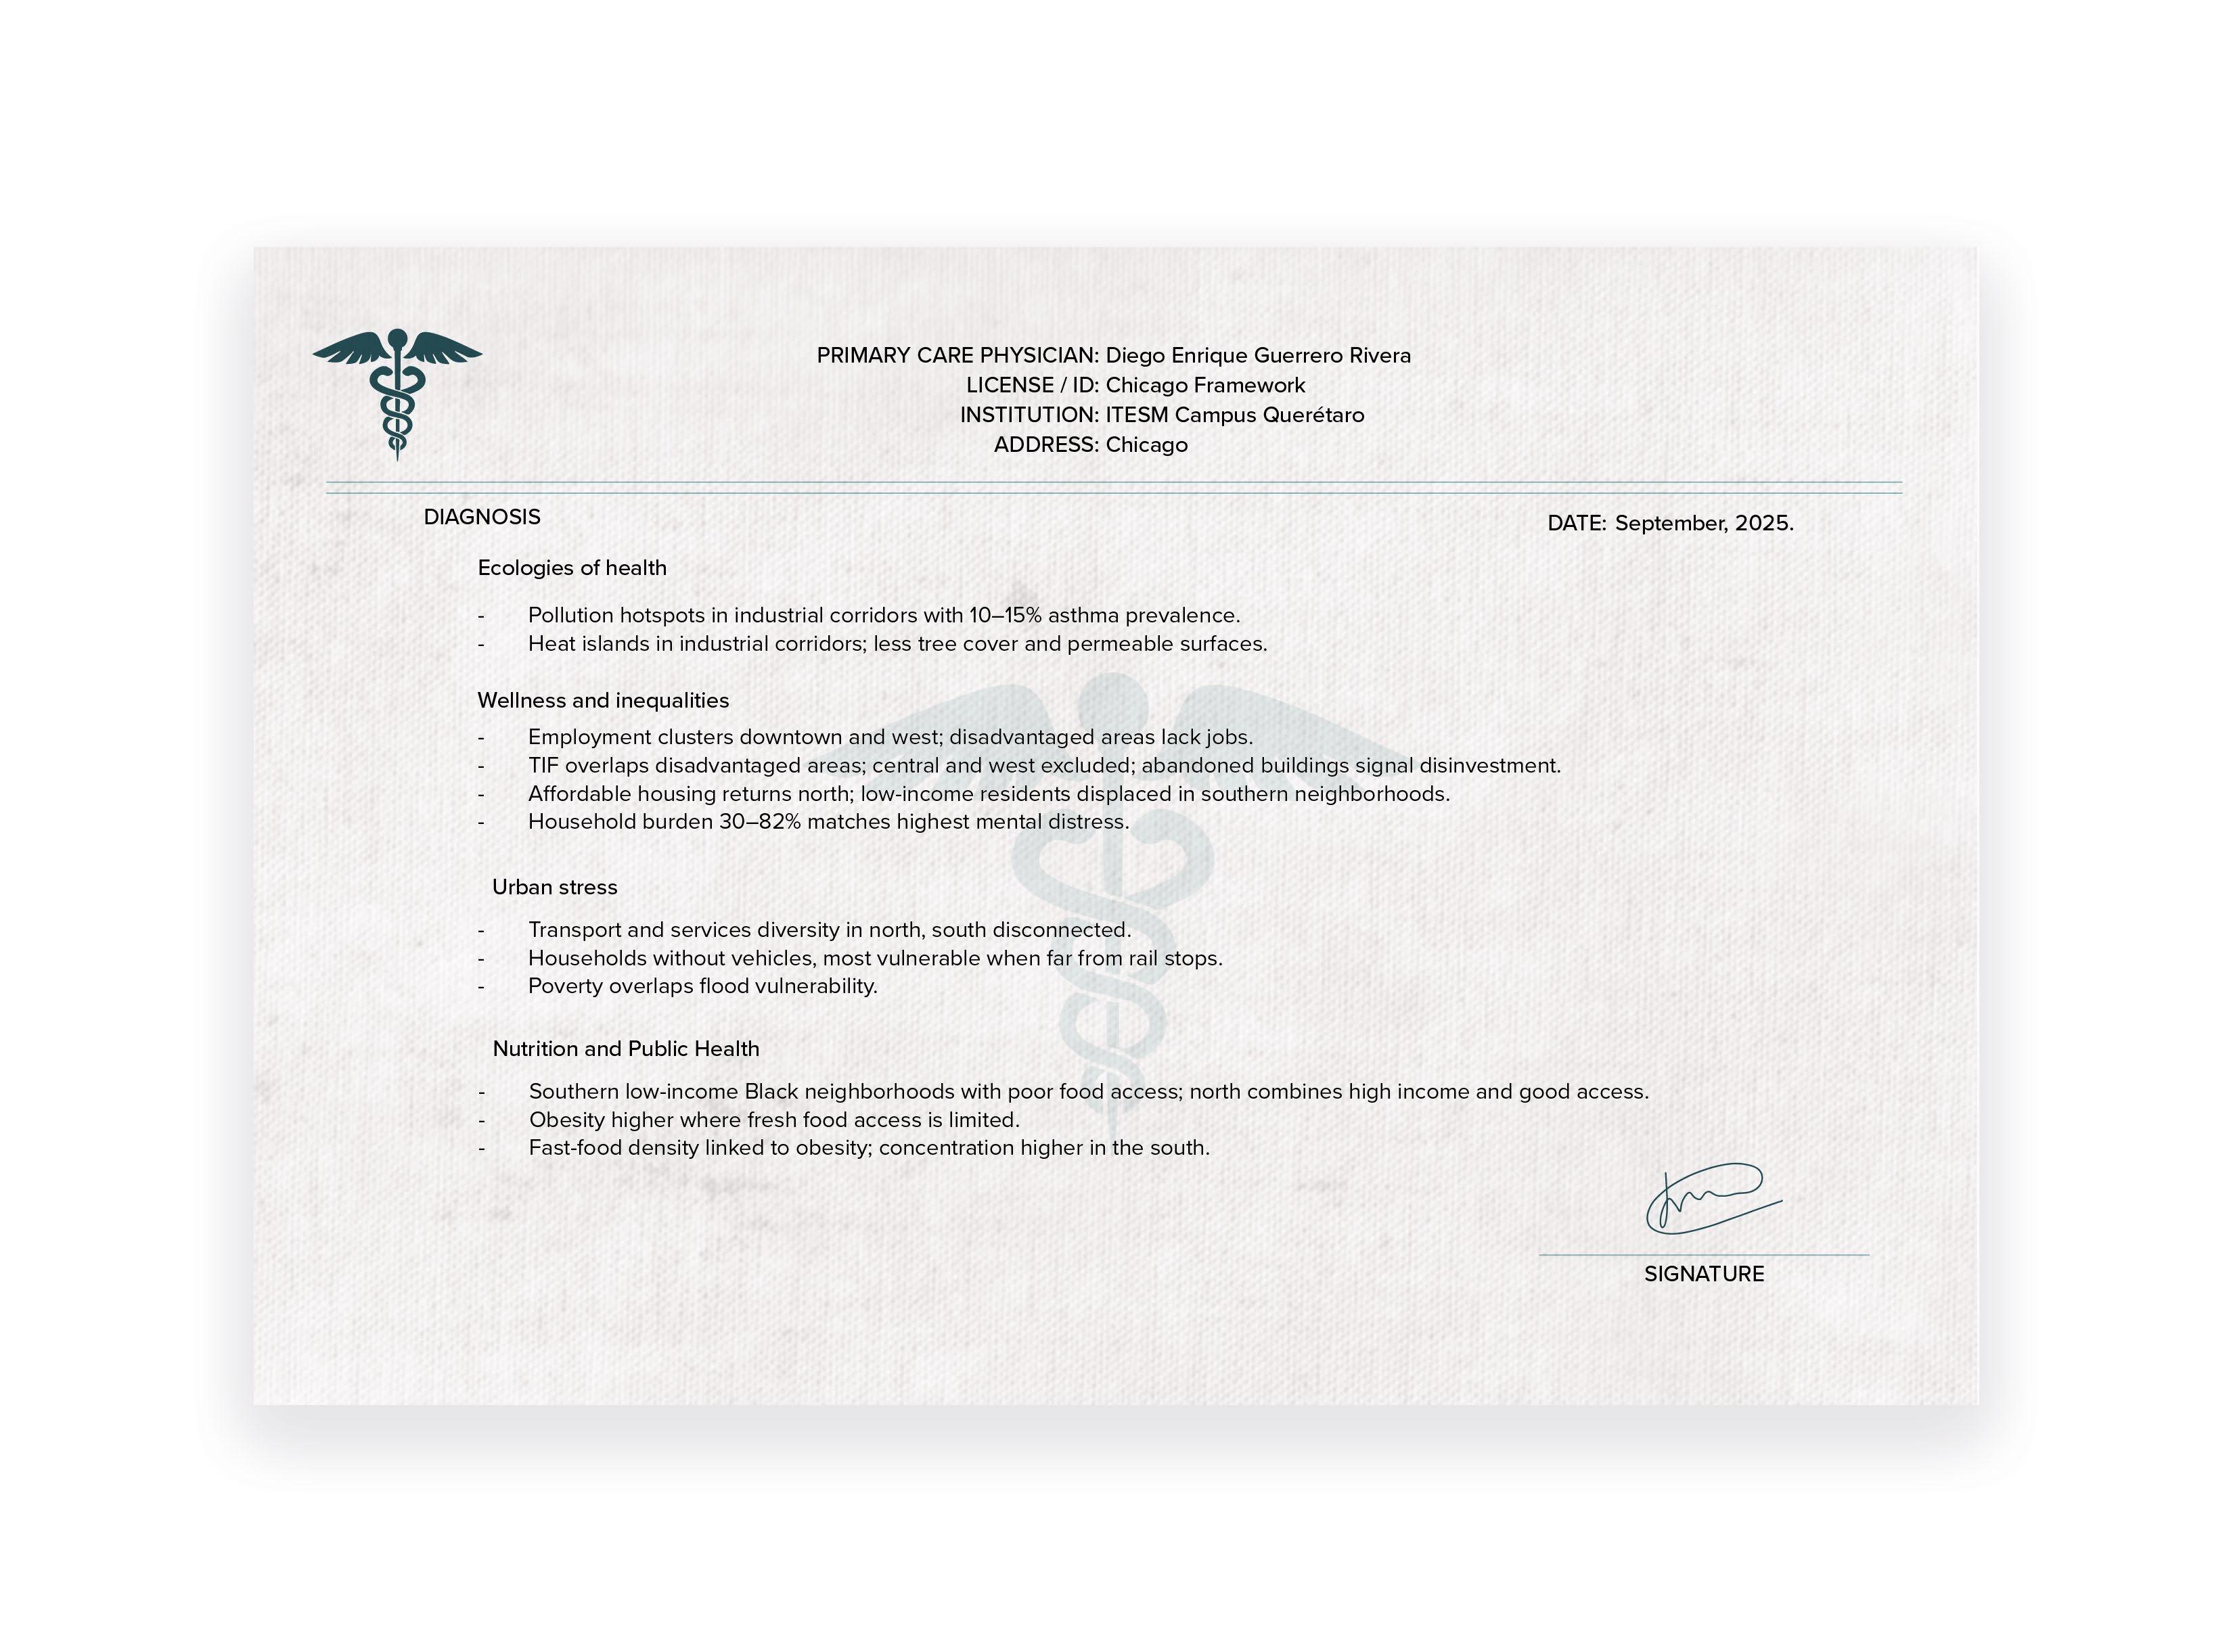
The health of Chicago’s residents is shaped by a complex interplay of social, environmental, and urban factors. Access to clean air and water, green spaces, safe neighborhoods, and quality healthcare all influence well-being, while historical patterns of segregation, economic inequality, and industrial development create uneven health outcomes across the city. Examining Chicago through the lens of health ecologies highlights how the built environment, social networks, and local policies interact to shape both opportunities and barriers for residents to live healthy, fulfilling lives.
ECOLOGIES OF HEALTH
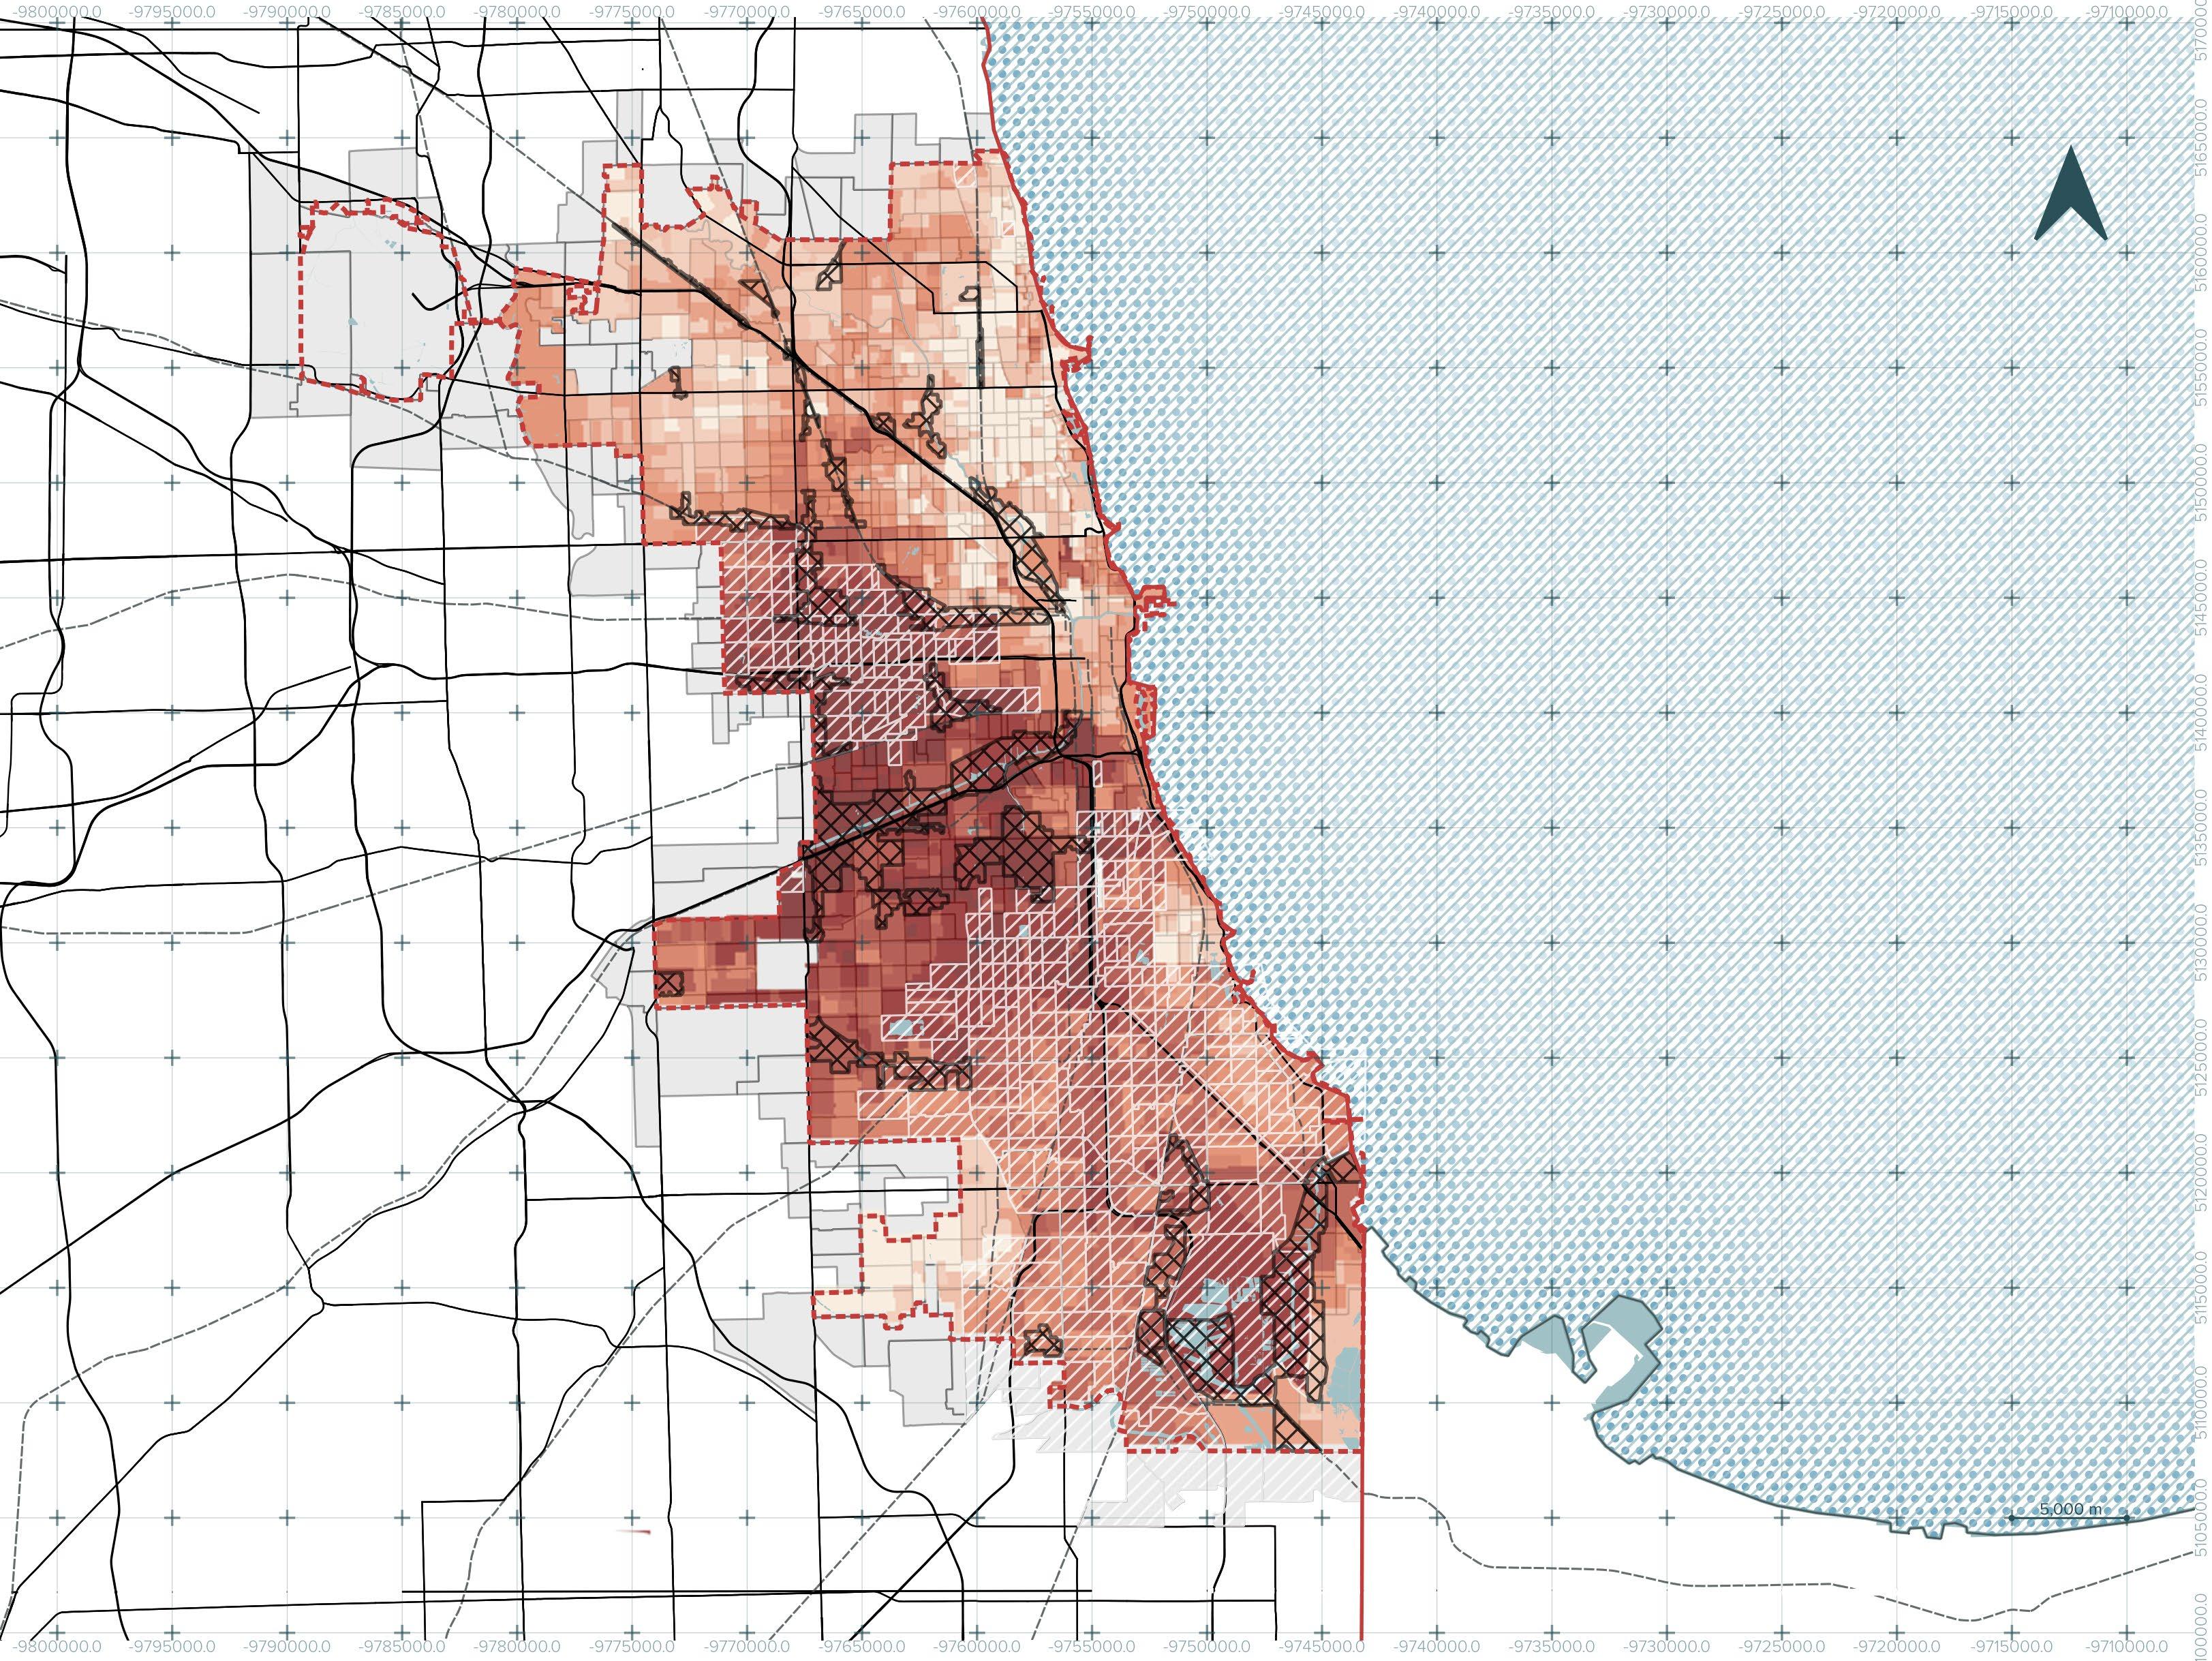
Air Pollution Hotspots Drive
Higher Asthma Rates
Industrial corridors overlap with census tracts that rank in the top 30–100 percentiles of air pollution vulnerability, where asthma prevalence is also highest, showing how contaminated air deepens health disparities. Pollution from freight transport, metallurgy, and fossil fuels often exceeds permitted limits, with pollutants such as PM2.5, NOx, SO₂, and VOCs linked to asthma, lung cancer, and cardiovascular disease. Industries are frequently located near more affordable housing, disproportionately exposing African American, Latino, and Asian communities, reflecting environmental injustice and environmental racism. pollution sources align with disadvantaged neighborhoods.
INDUSTRY
VEHICLE TRAFFIC
COAL-FIRED POWER PLANTS
MEGA-WAREHOUSES / LOGISTICS
HAZARDOUS WASTE & TOXIC SLUDGE
POLLUTANT
DESEASE
ASTHMA
CARDIOVASCULAR DISEASE
SILICA DUST
HEAVY-DUTY TRANSPORT
RAILROADS & INTERMODAL TRANSPORT DIESEL SOOT
COAL AND CLINKER HANDLING
INDUSTRIAL STORAGE
RESIDENTIAL BUILDINGS
PETCOKE PROCESSING
CEMENT & CONCRETE PRODUCTION
AUTOMOTIVE / VEHICLE MANUFACTURING
MERCURY NATURAL GAS POWER PLANTS
CONSTRUCTION MATERIALS INDUSTRY
STEEL AND PRIMARY METALS
CHEMICAL INDUSTRY
METAL RECYCLING
INSTITUTIONAL BUILDINGS
BLACK CARBON
FORMALDEHYDE
LEAD
MANGANESE
LUNG CANCER
NEUROLOGICAL DAMAGE
CANCER
STROKE
CHRONIC BRONCHITIS
COPD
RESPIRATORY IRRITATION
CORONARY HEART DISEASE
DIOXINS
METHANE
HEAVY METALS
PCBS
ASPHALT PLANTS BENZENE
COMMERCIAL BUILDINGS
ASBESTOS
CADMIUM
COGNITIVE IMPAIRMENT
PARKINSONISM
SILICOSIS
HORMONAL DISORDERS
BIRTH DEFECTS
LIVER PROBLEMS
ANEMIA
COGNITIVE IMPAIRMENT
IN CHILDREN
KIDNEY CANCER
MESOTHELIOMA
Own elaboration based on WHO Air Quality Guidelines (2021), IARC Monographs on the Identification of Carcinogenic Hazards to Humans, U.S. EPA Integrated Science Assessments for Particulate Matter, NO₂ and Ozone, and CDC Environmental Health Data (2023).
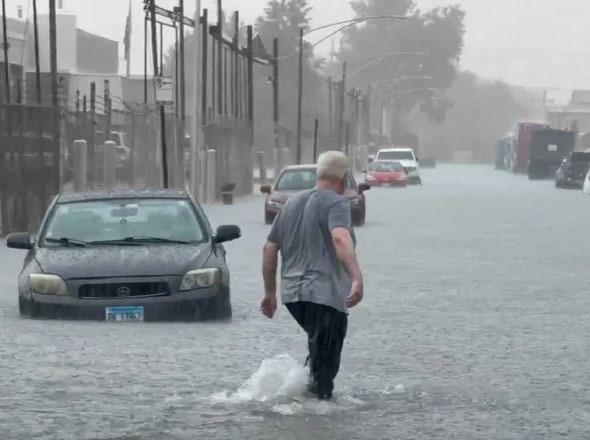
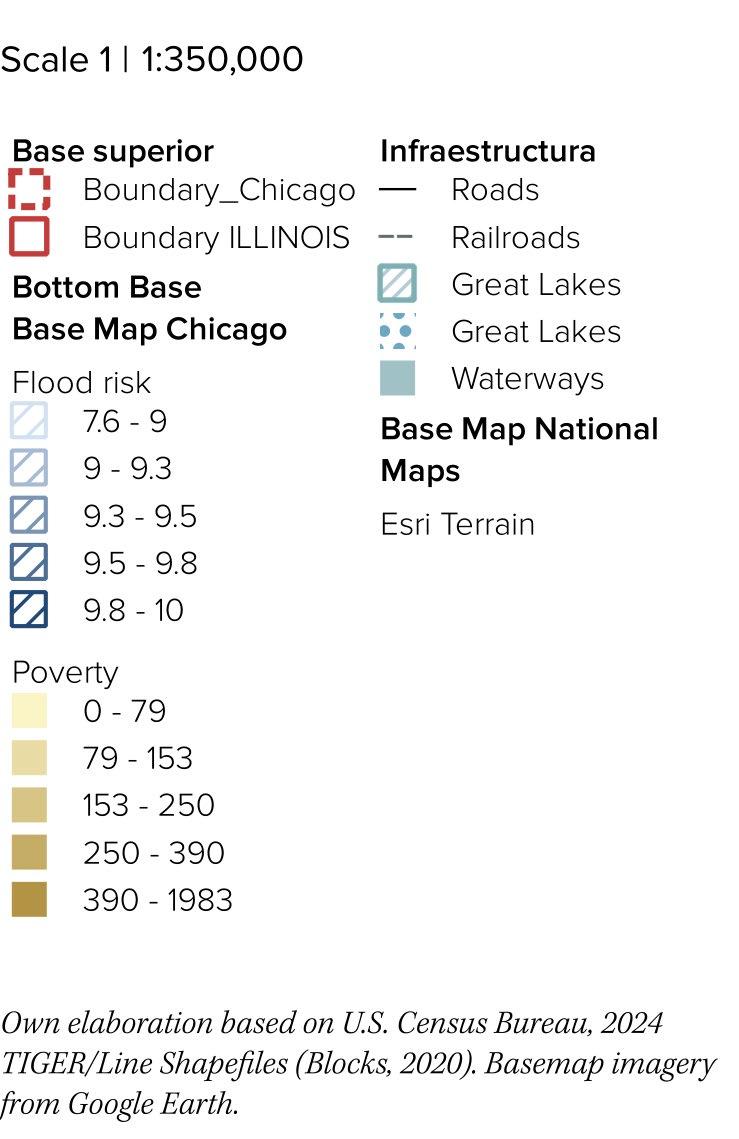
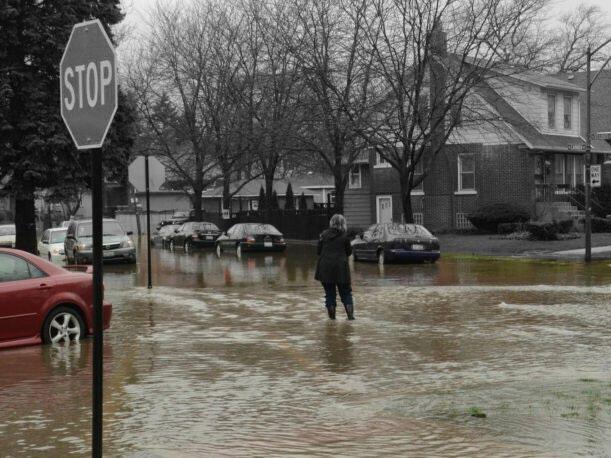
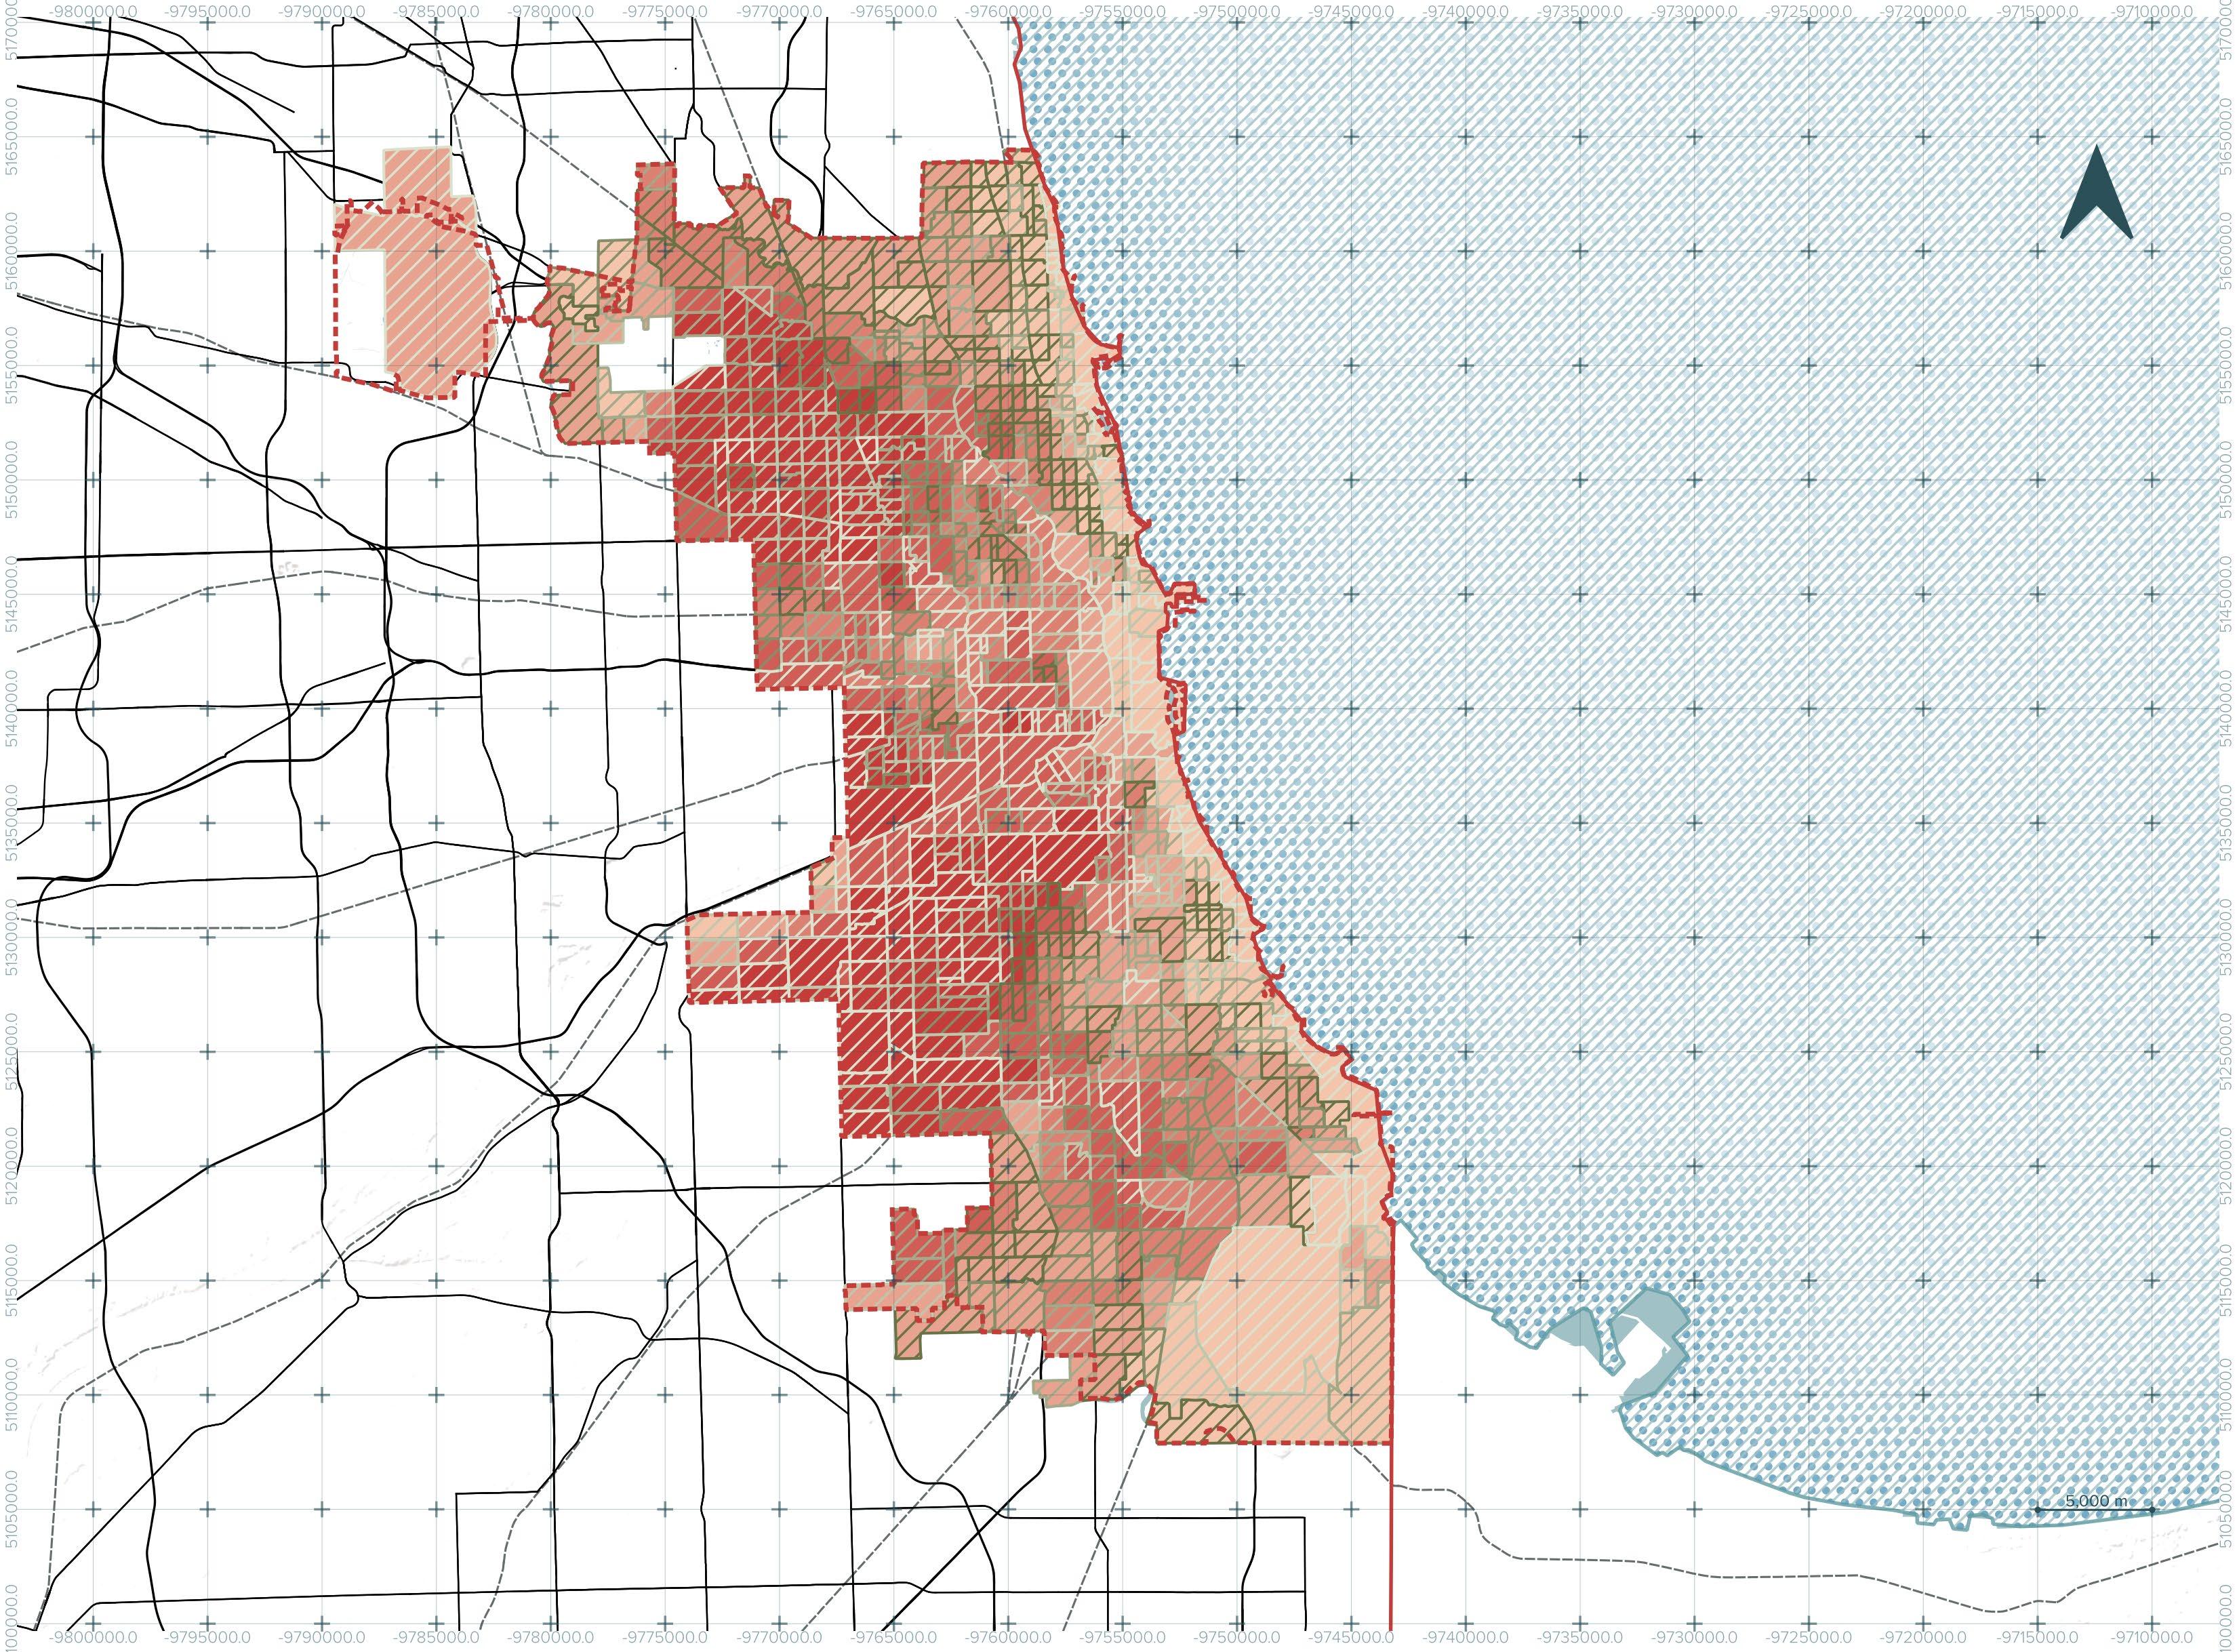
Poverty and Flood Vulnerability
Neighborhoods with the highest poverty coincide with areas most exposed to flooding. Limited resources, inadequate infrastructure, and historical disinvestment exacerbate the risks in these communities, leaving residents more susceptible to property damage, displacement, and longterm economic and health consequences.
Socioeconomic inequality directly amplifies environmental vulnerability, showing that flood risk is not only a natural hazard but also a social issue that requires targeted urban planning and equitable resource allocation.
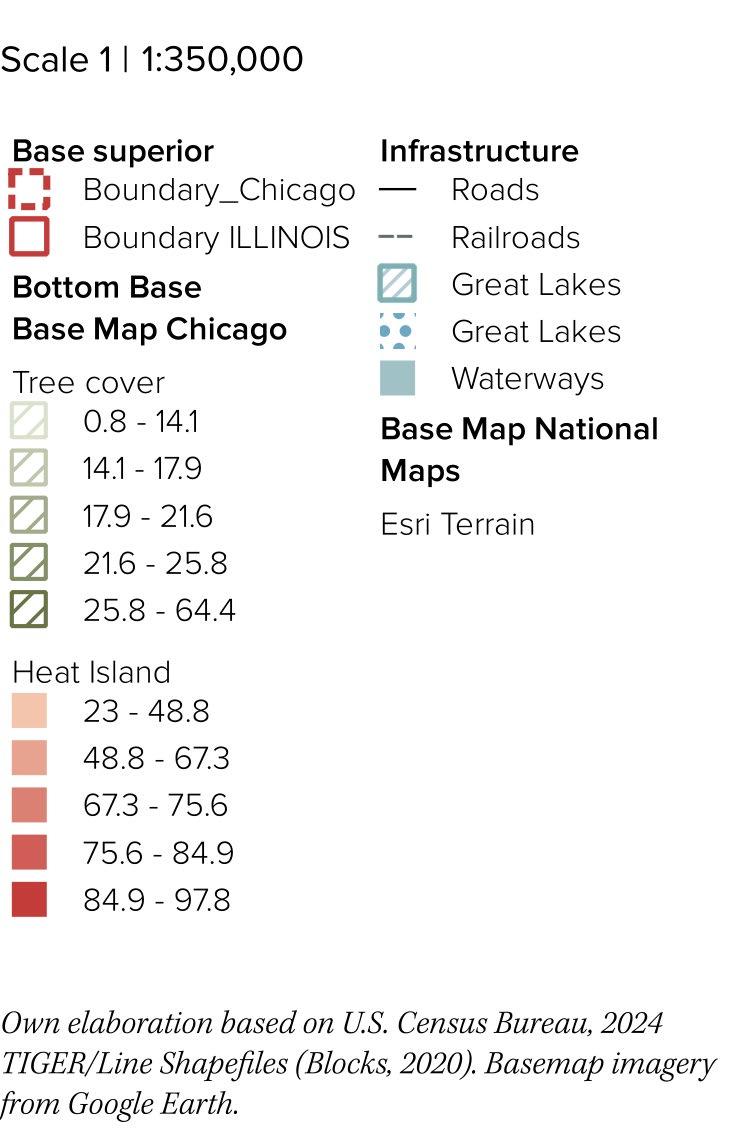
The spatial relationship between vegetation cover and heat islands in Chicago reveals a clear environmental imbalance. Areas with the least tree canopy and green coverage correspond to higher concentrations of urban heat islands, largely driven by impermeable surfaces such as concrete and asphalt. In contrast, the northern and southwestern zones of the city display more extensive vegetation, providing cooling effects and buffering extreme heat. The uneven distribution of vegetation exposes some communities to hotter and more vulnerable conditions, emphasizing the need for equitable greening across Chicago.
Wellness in Chicago is closely tied to social and economic disparities that affect access to healthcare, nutritious food, safe neighborhoods, and opportunities for physical and mental well-being. Neighborhoods with higher poverty rates or historical disinvestment often face greater barriers to maintaining a healthy lifestyle, resulting in uneven health outcomes across the city. Exploring wellness through the lens of inequality in Chicago reveals the systemic factors that shape residents’ quality of life and underscores the need for equitable policies and community initiatives to promote health for all.
WELLNESS AND INEQUALITIES
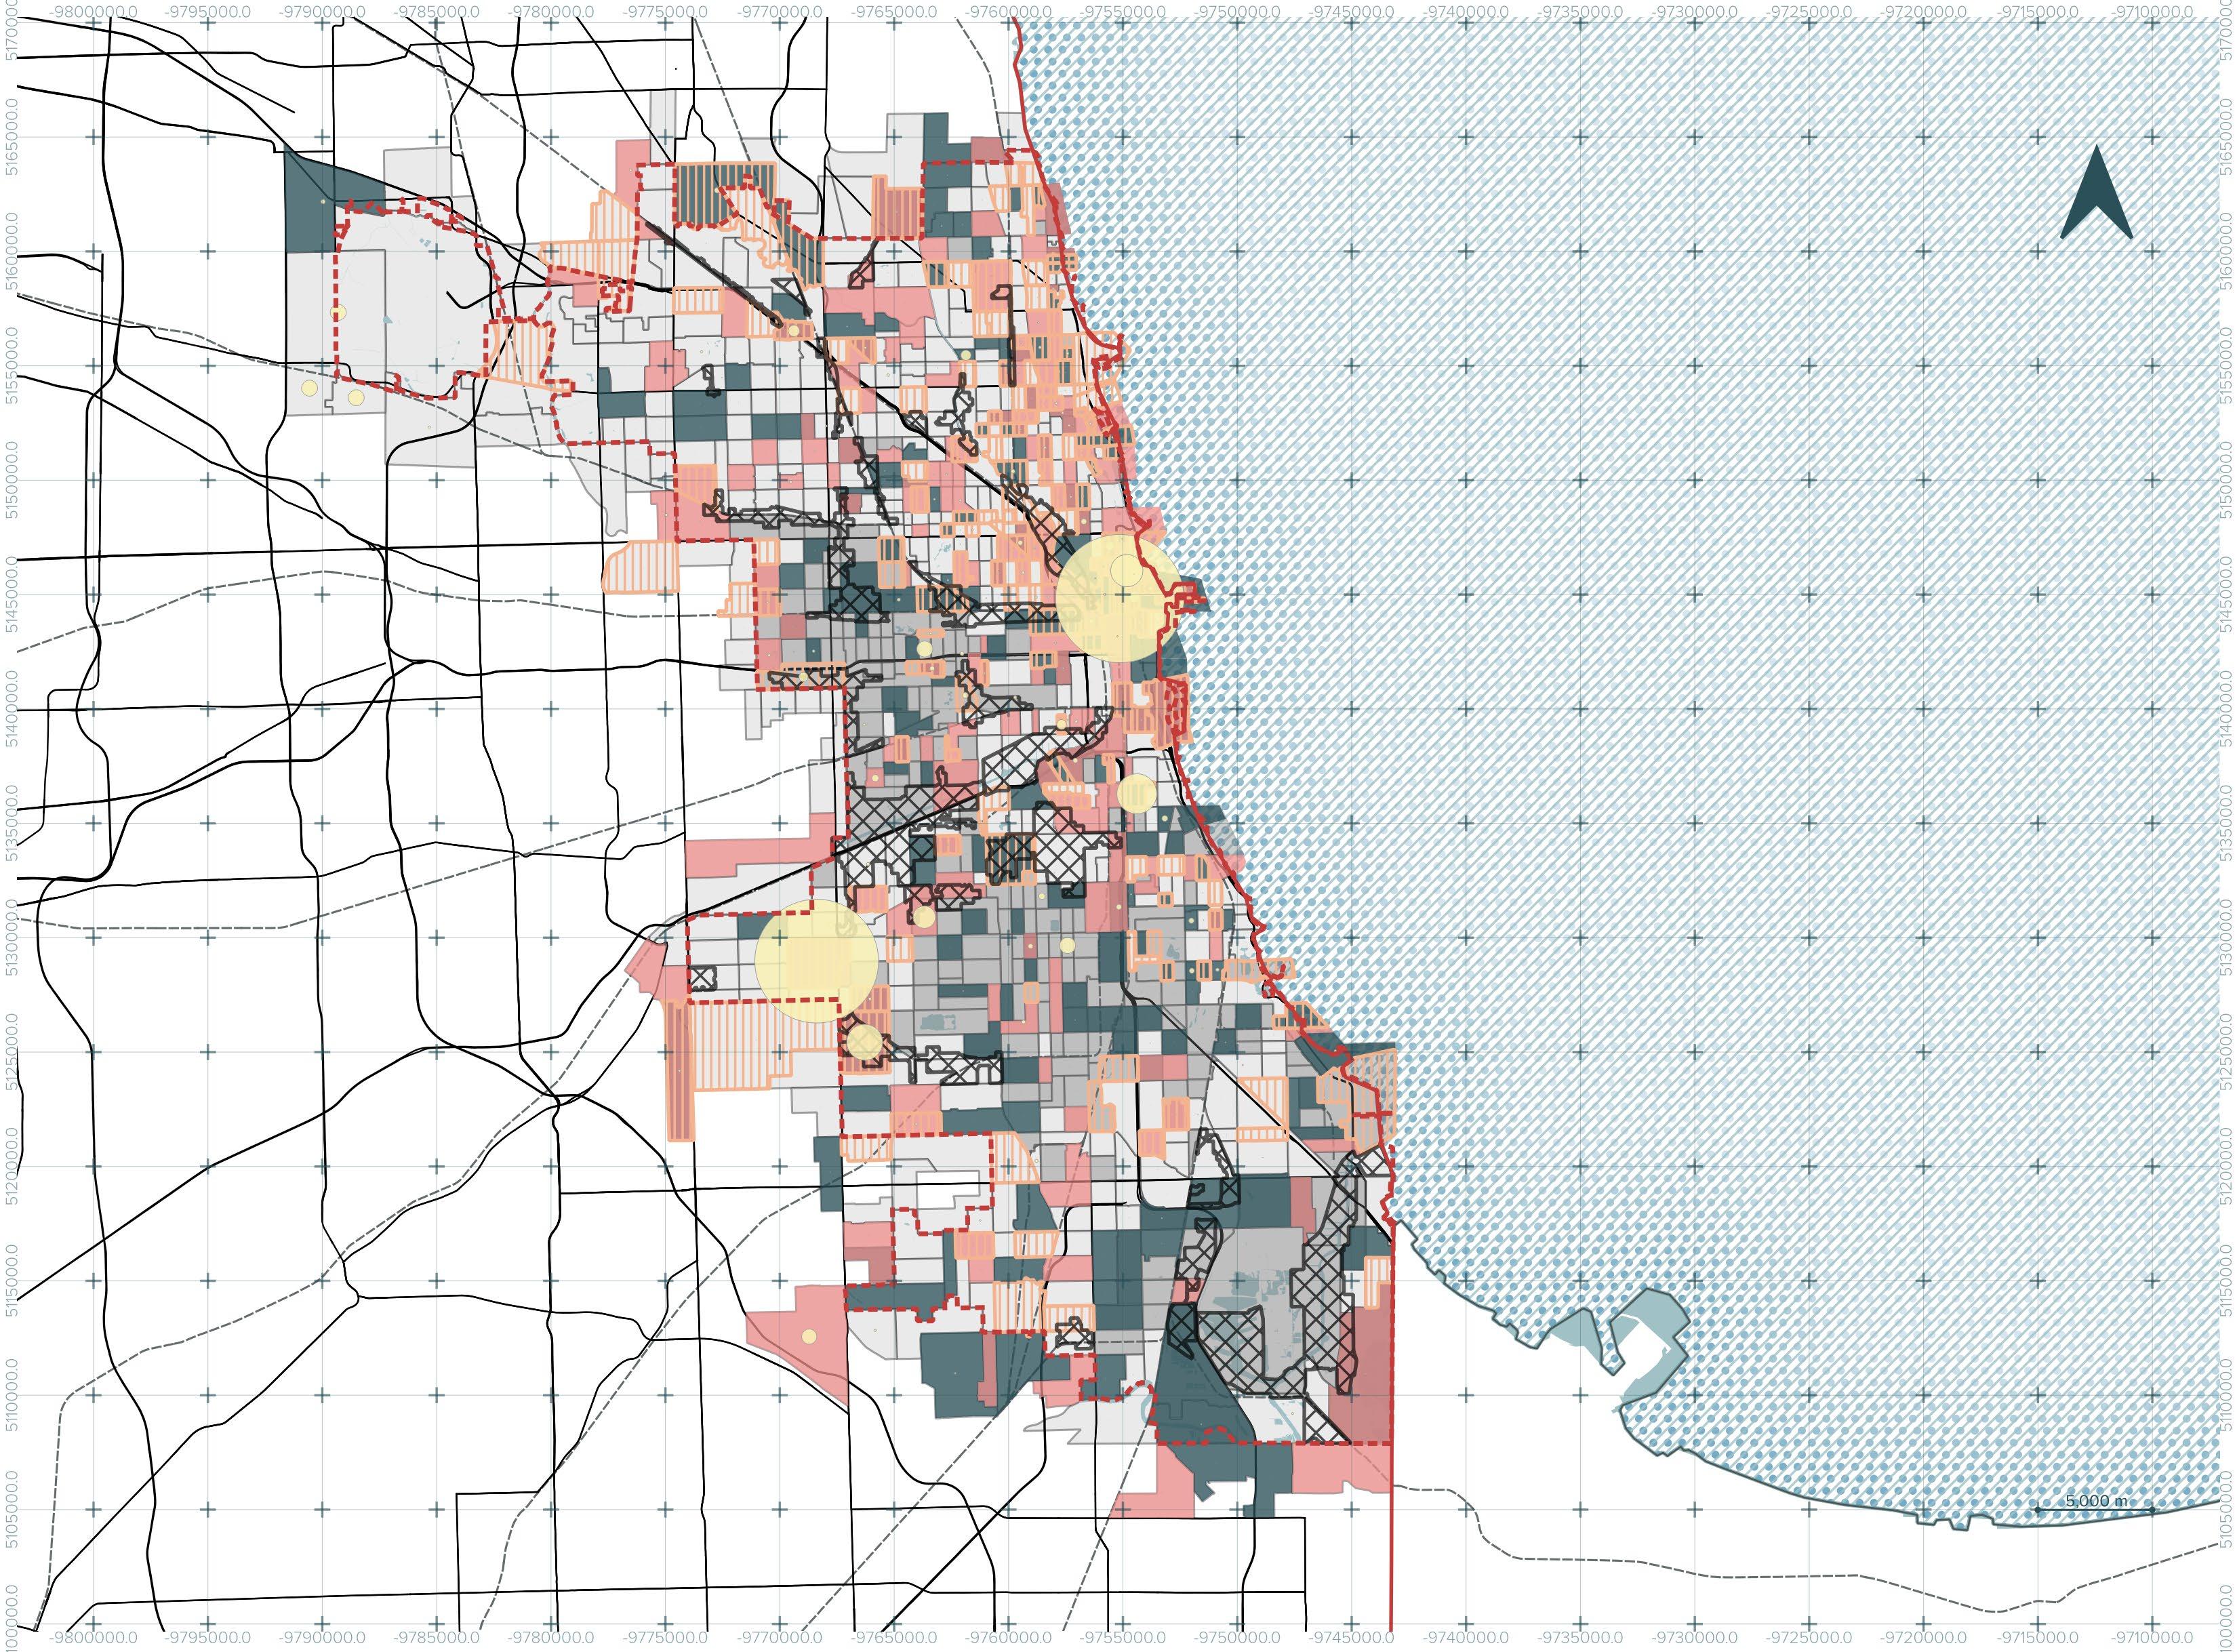
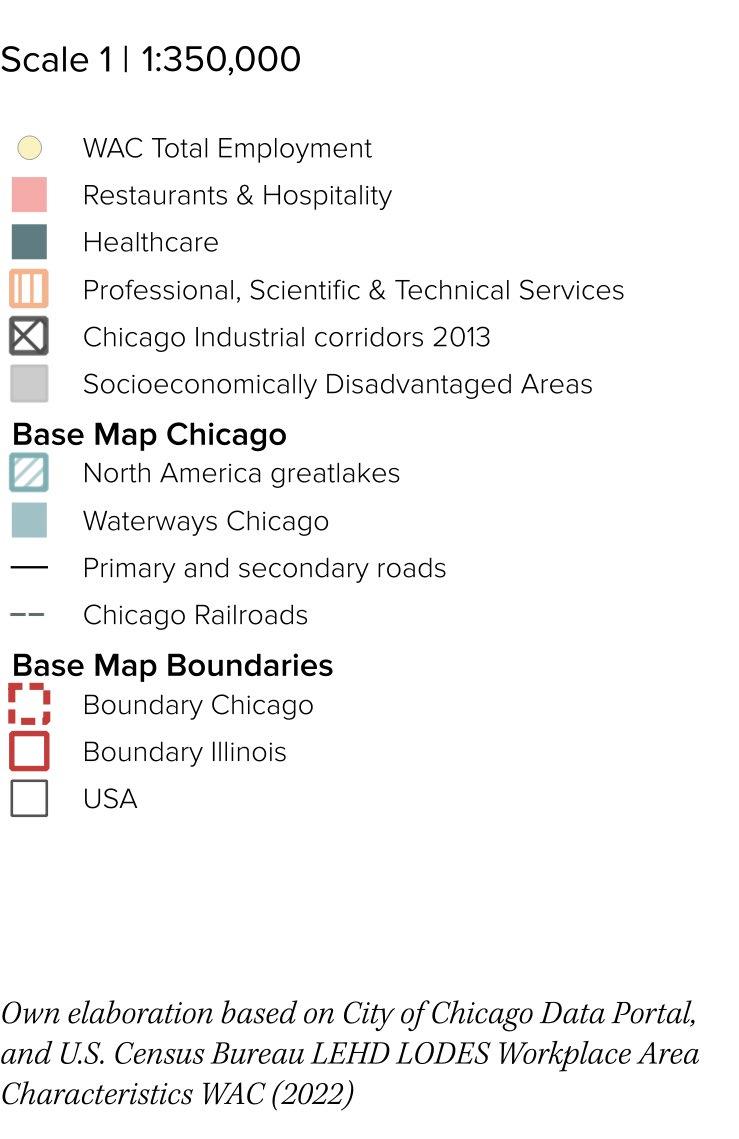
Employment Concentration Drives
Commuting
Chicago’s economy is now centered on services. Employment polygons reveal downtown as the primary hub of economic activity, with an additional concentration in the west side, while northern and southern neighborhoods show little or no significant clustering of jobs. Socioeconomic disadvantage areas mirror this absence, limited presence of professional, scientific, and technical employment. The uneven job concentration forces residents in disadvantaged neighborhoods to travel long distances to access work, reinforcing the commuting patterns driven by service-sector centralization in downtown and the west side.
Chicago Public Library (s.f.); Federal Reserve Bank of Chicago (1990); Federal Reserve Bank of Chicago (1993); The New Yorker (2023); The Washington Post (1990)
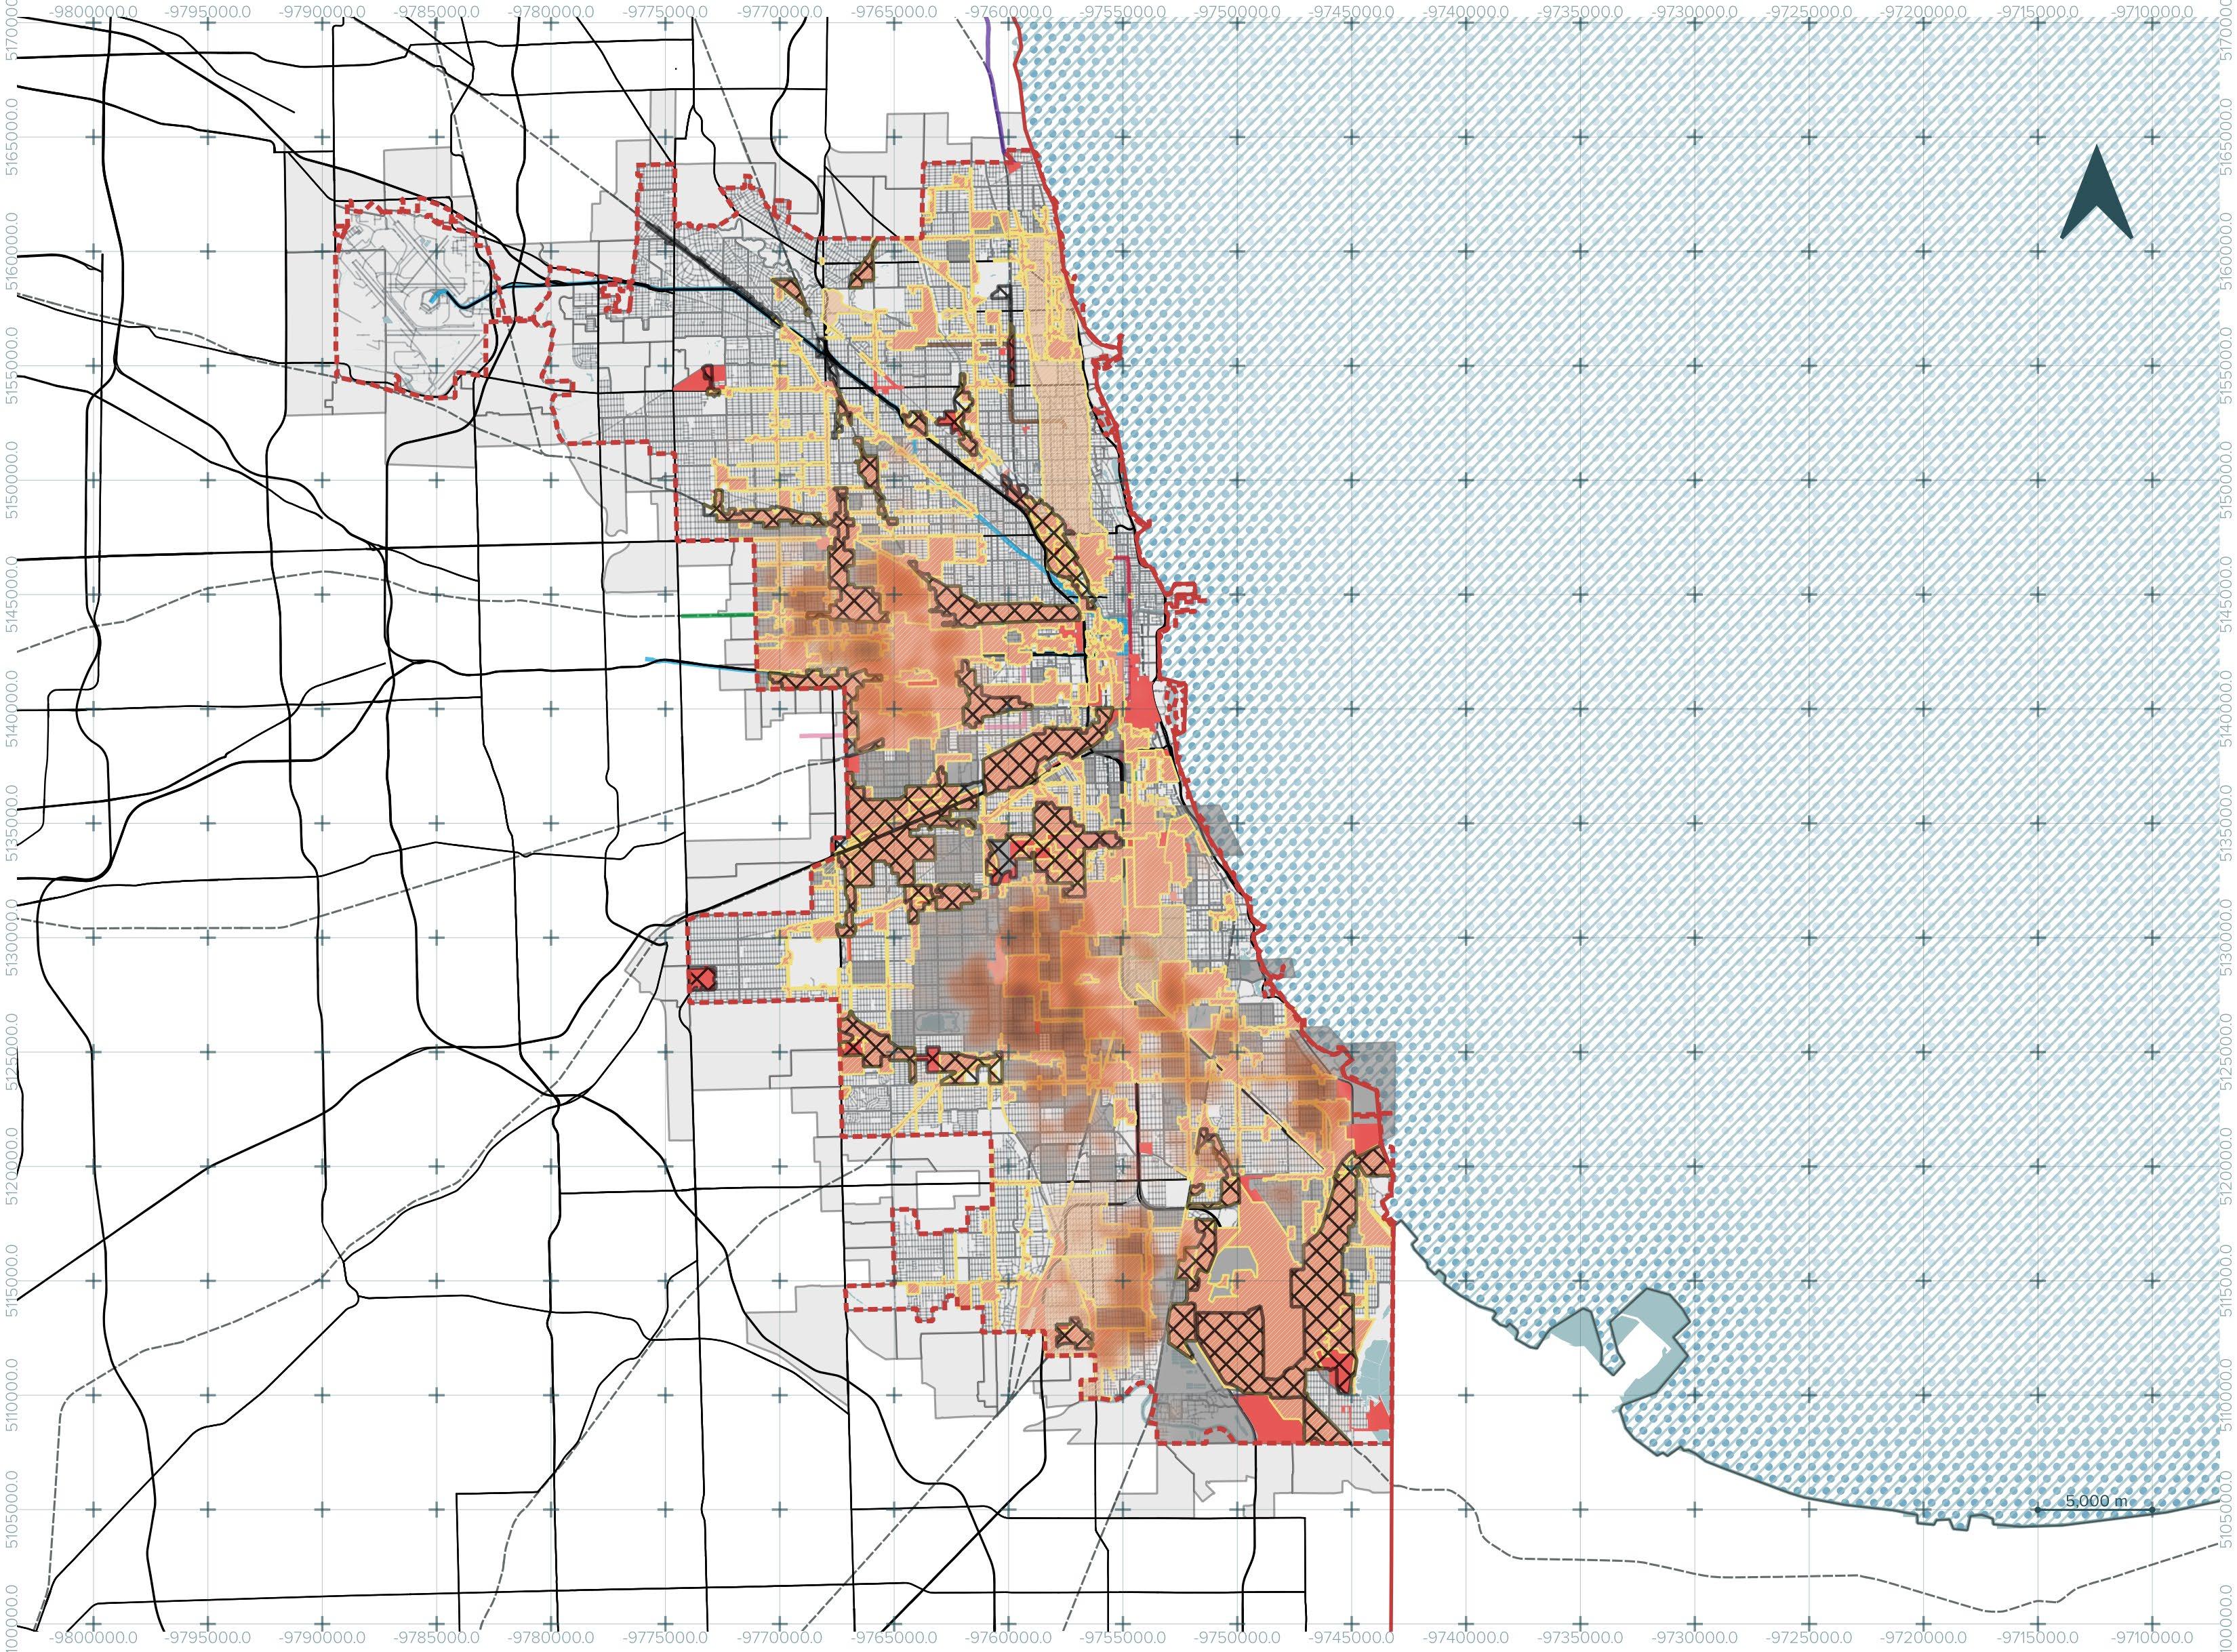
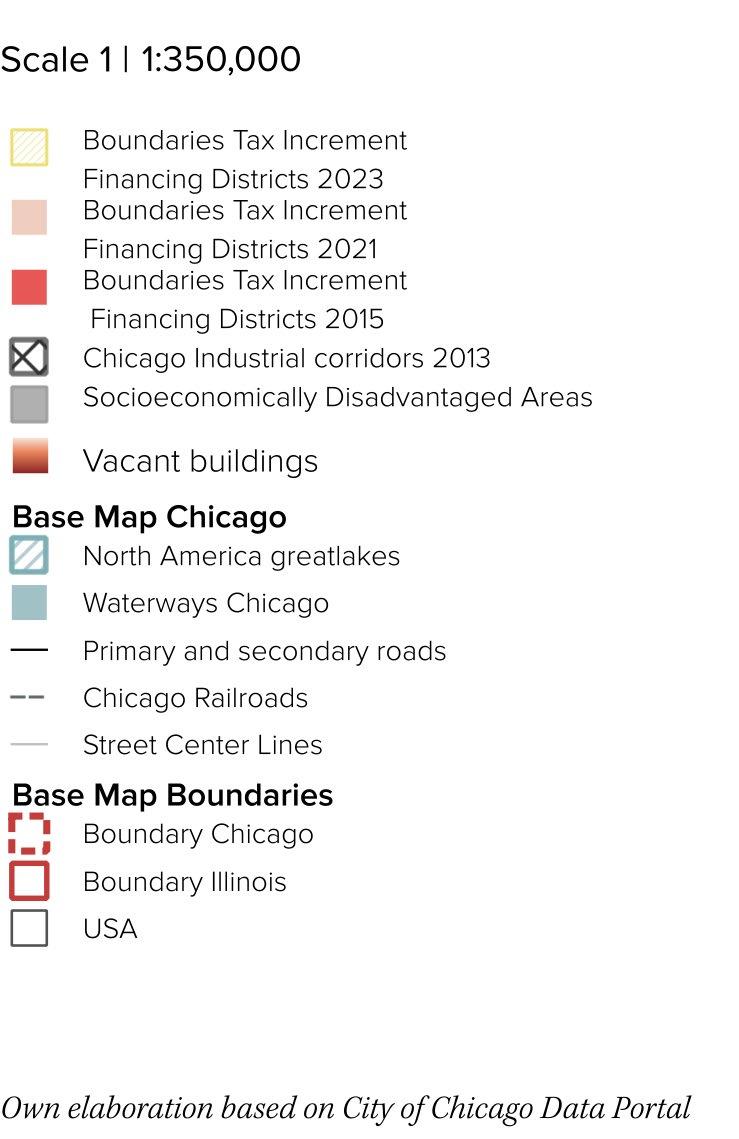
TIF Districts and Abandoned Buildings in Disadvantaged Areas
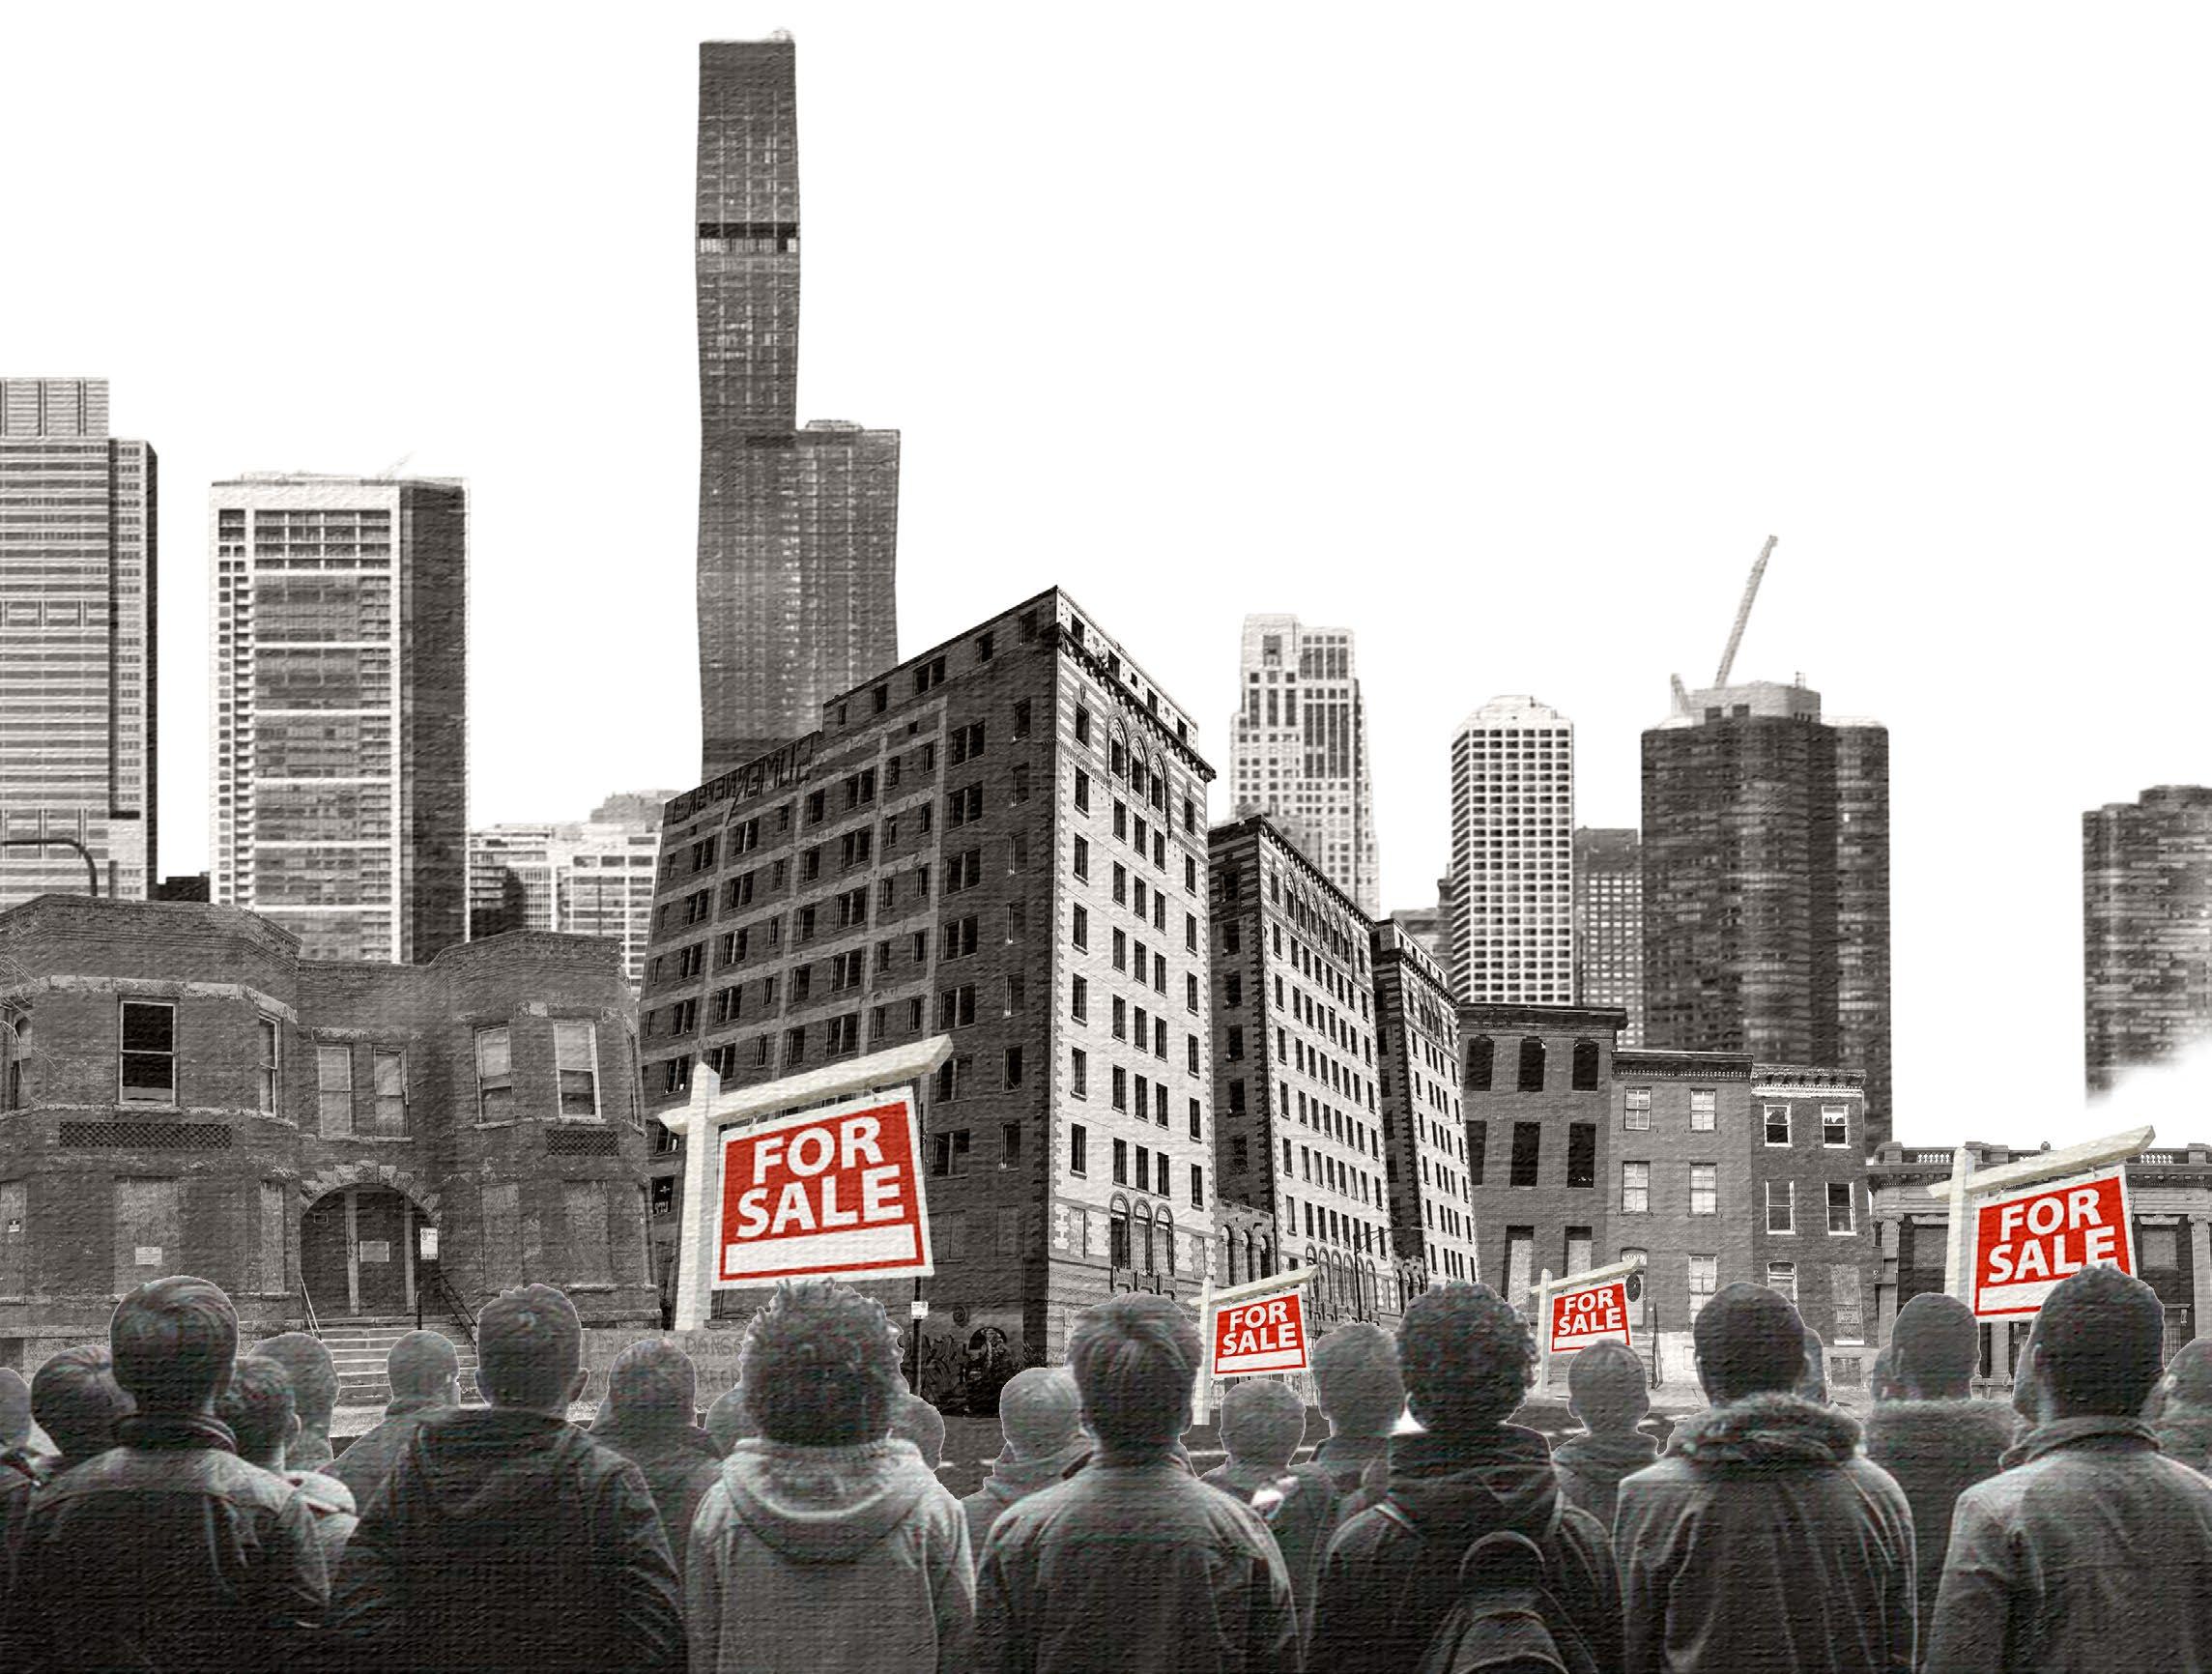
Most TIF districts established in 2015, 2021, and 2023 are concentrated in socioeconomic disadvantaged areas, yet large parts of the central and west side remain excluded despite facing disadvantage. In neighborhoods where TIF overlaps with disadvantaged areas, higher rates of abandoned buildings reveal attempts to regenerate local economies without fully addressing widespread disinvestment. By contrast, northern neighborhoods contain many TIF districts despite not being disadvantaged and show little to no presence of abandoned buildings, underscoring uneven priorities in urban reinvestment.
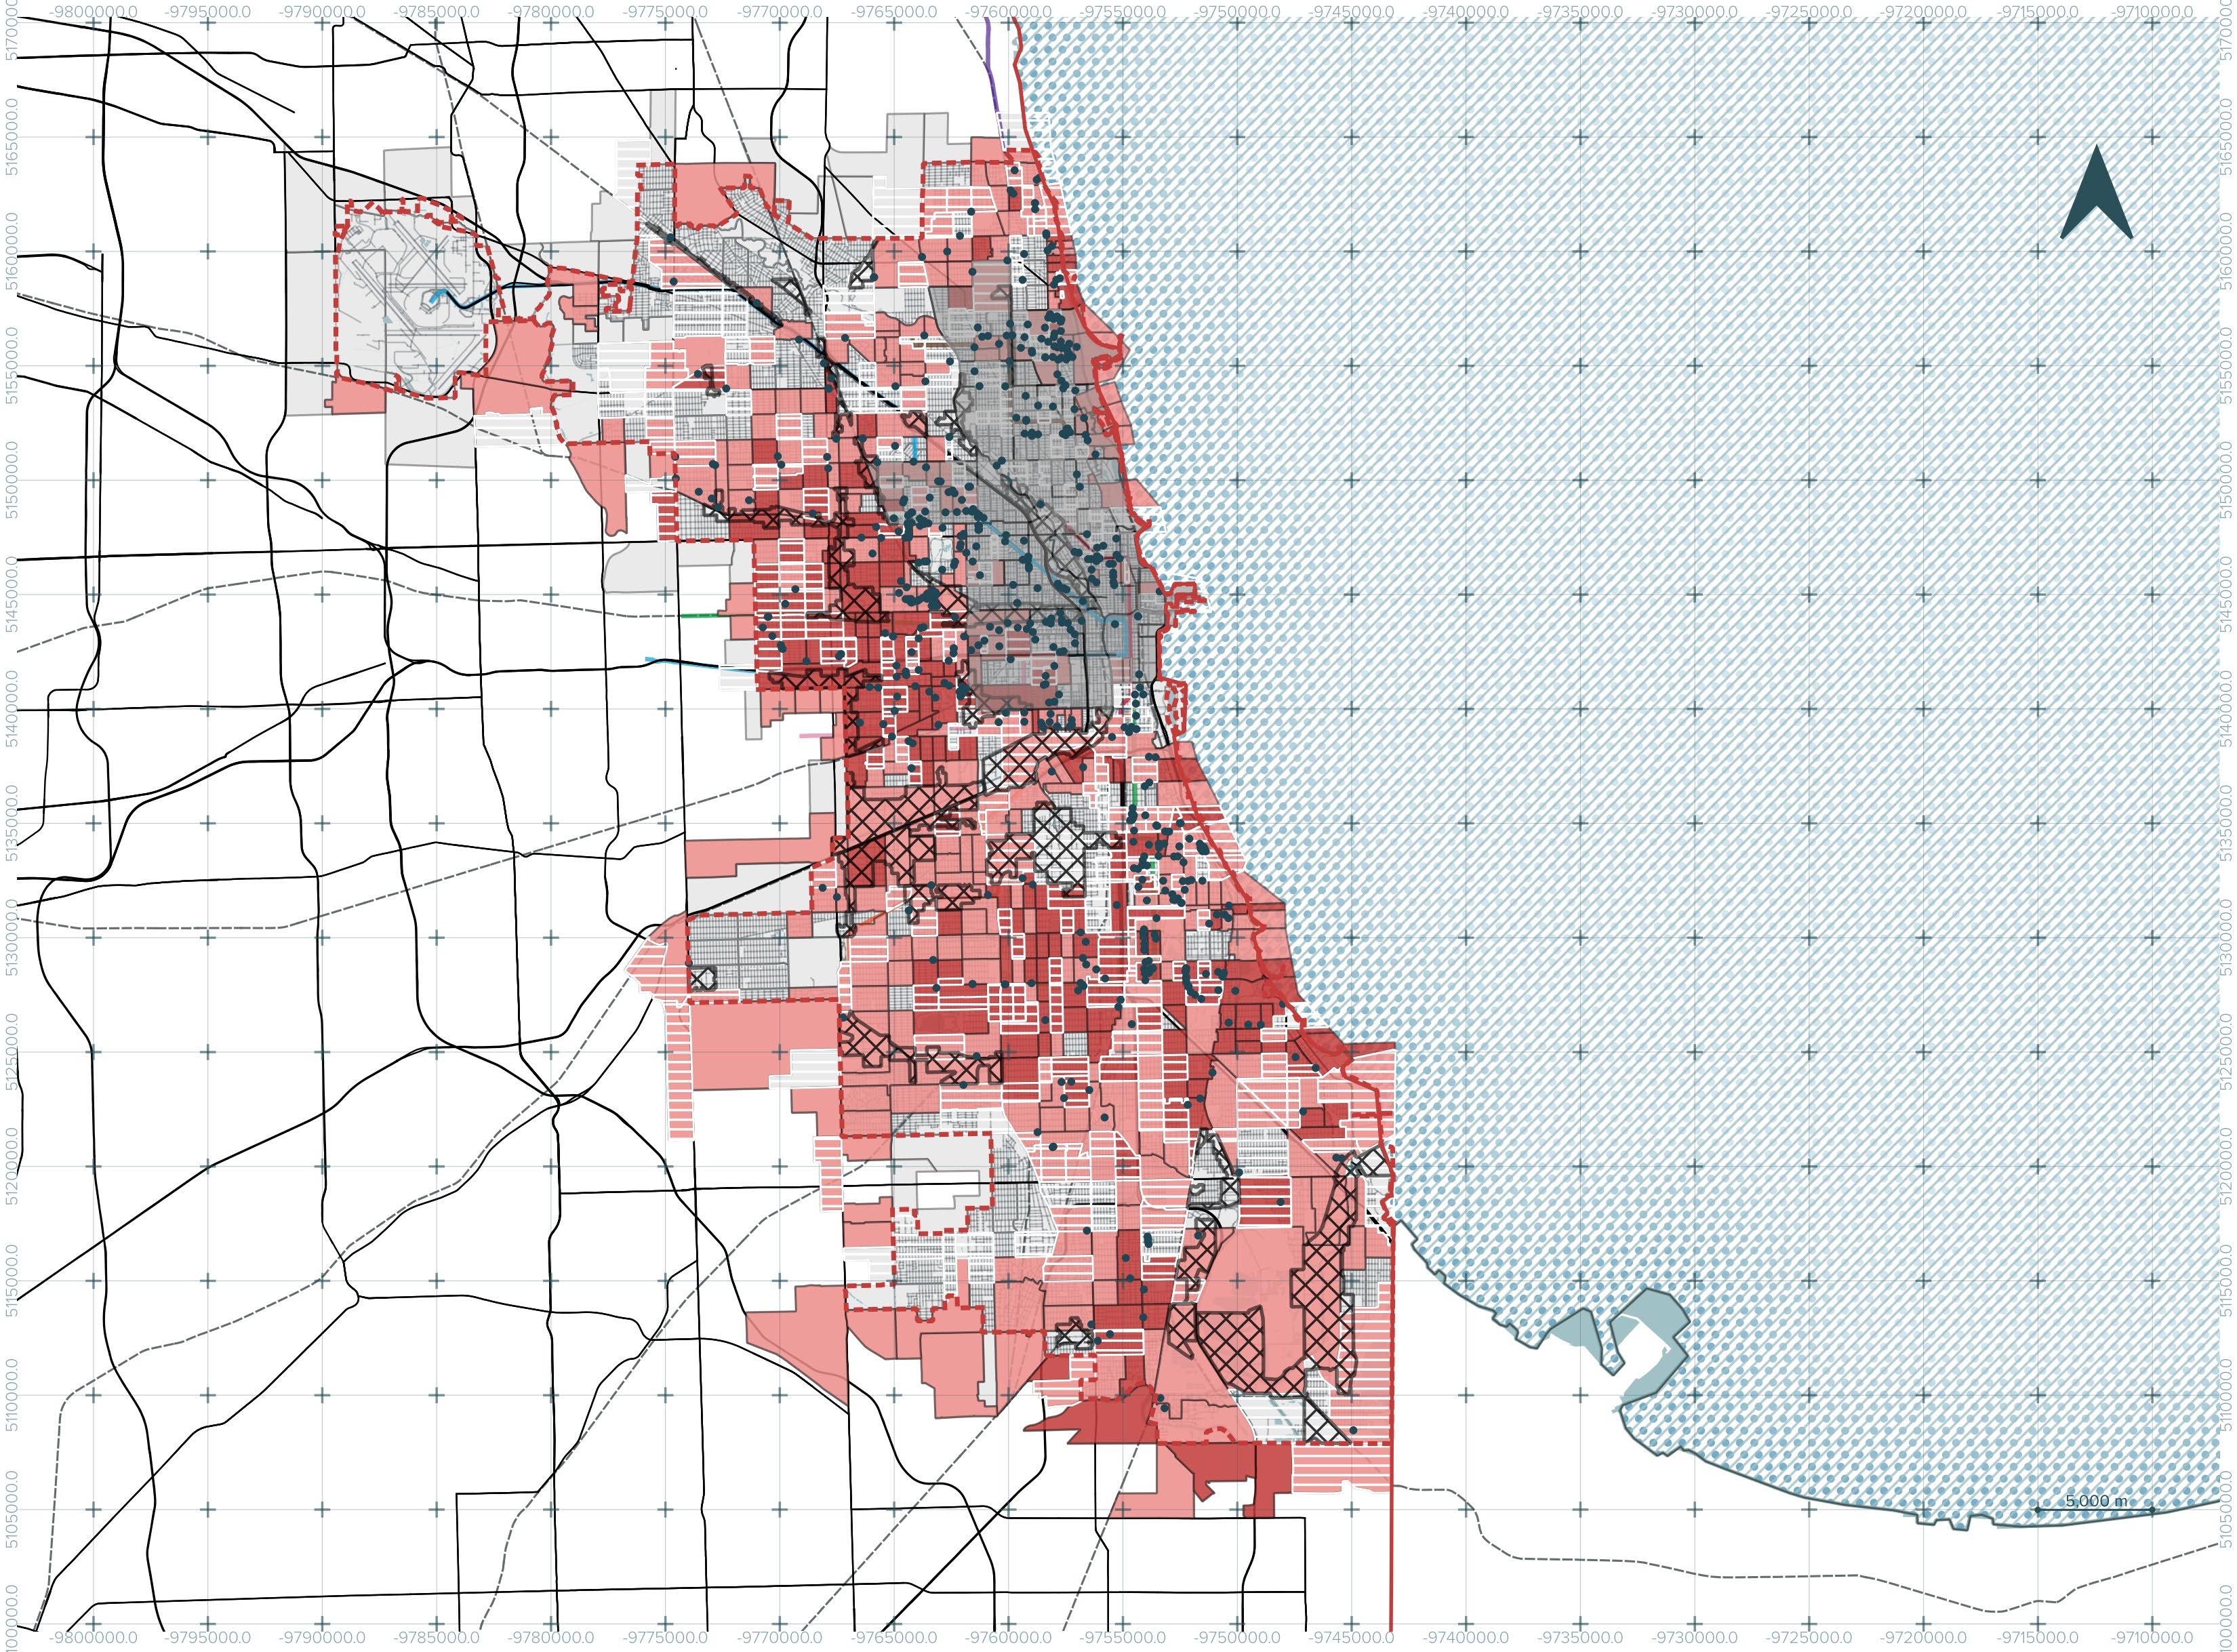
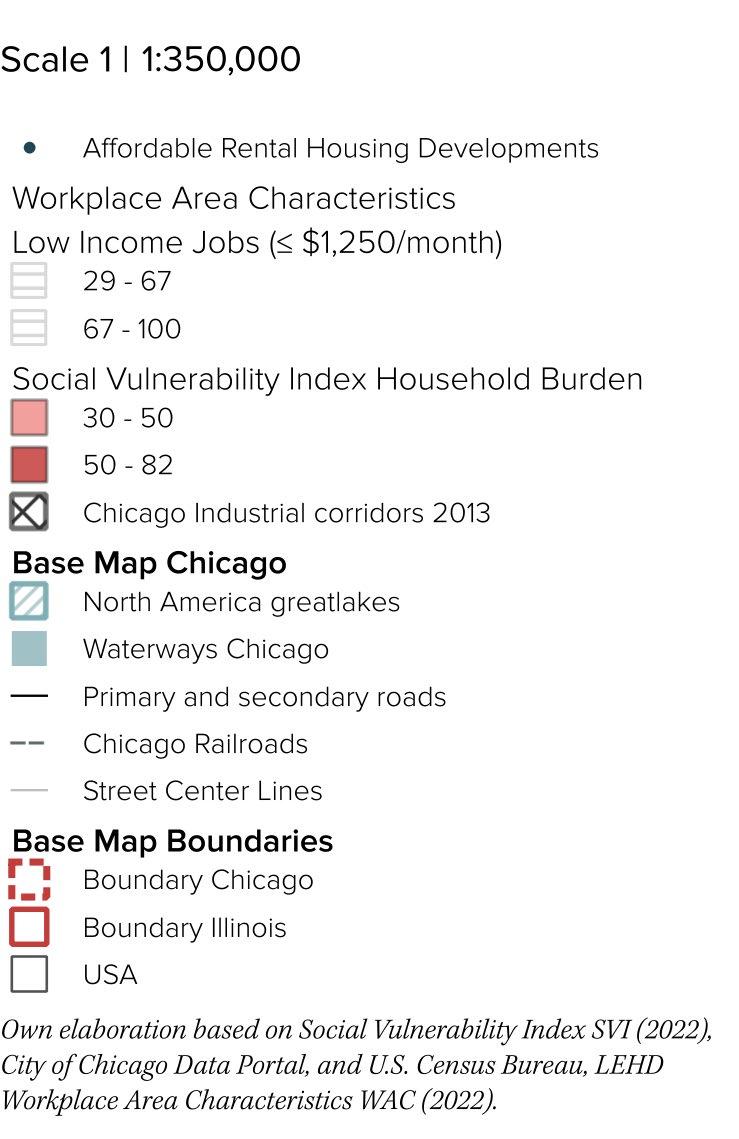
Affordable Housing Returns to Gentrified Neighborhoods
New affordable housing developments are concentrated in Chicago’s northern neighborhoods, where household burden concentrations remain low and low-income jobs are limited, while areas with greater household burden and stronger dependence on low-income jobs continue to lack investment. This spatial mismatch reflects the gentrification that took place, which displaced low-income residents from desirable neighborhoods and reshaped the lives and choices of residents across the city. The recent return of affordable housing to these northern neighborhoods signals an effort to counter past exclusion and reintroduce economic diversity, aiming to create spaces where residents with different income levels can coexist.
Own elaboration based on City of Chicago, n.d.-a; City of Chicago, n.d.-b; City of Chicago, n.d.-c; Cook County Assessor, n.d.; Chicago Housing Trust, n.d.
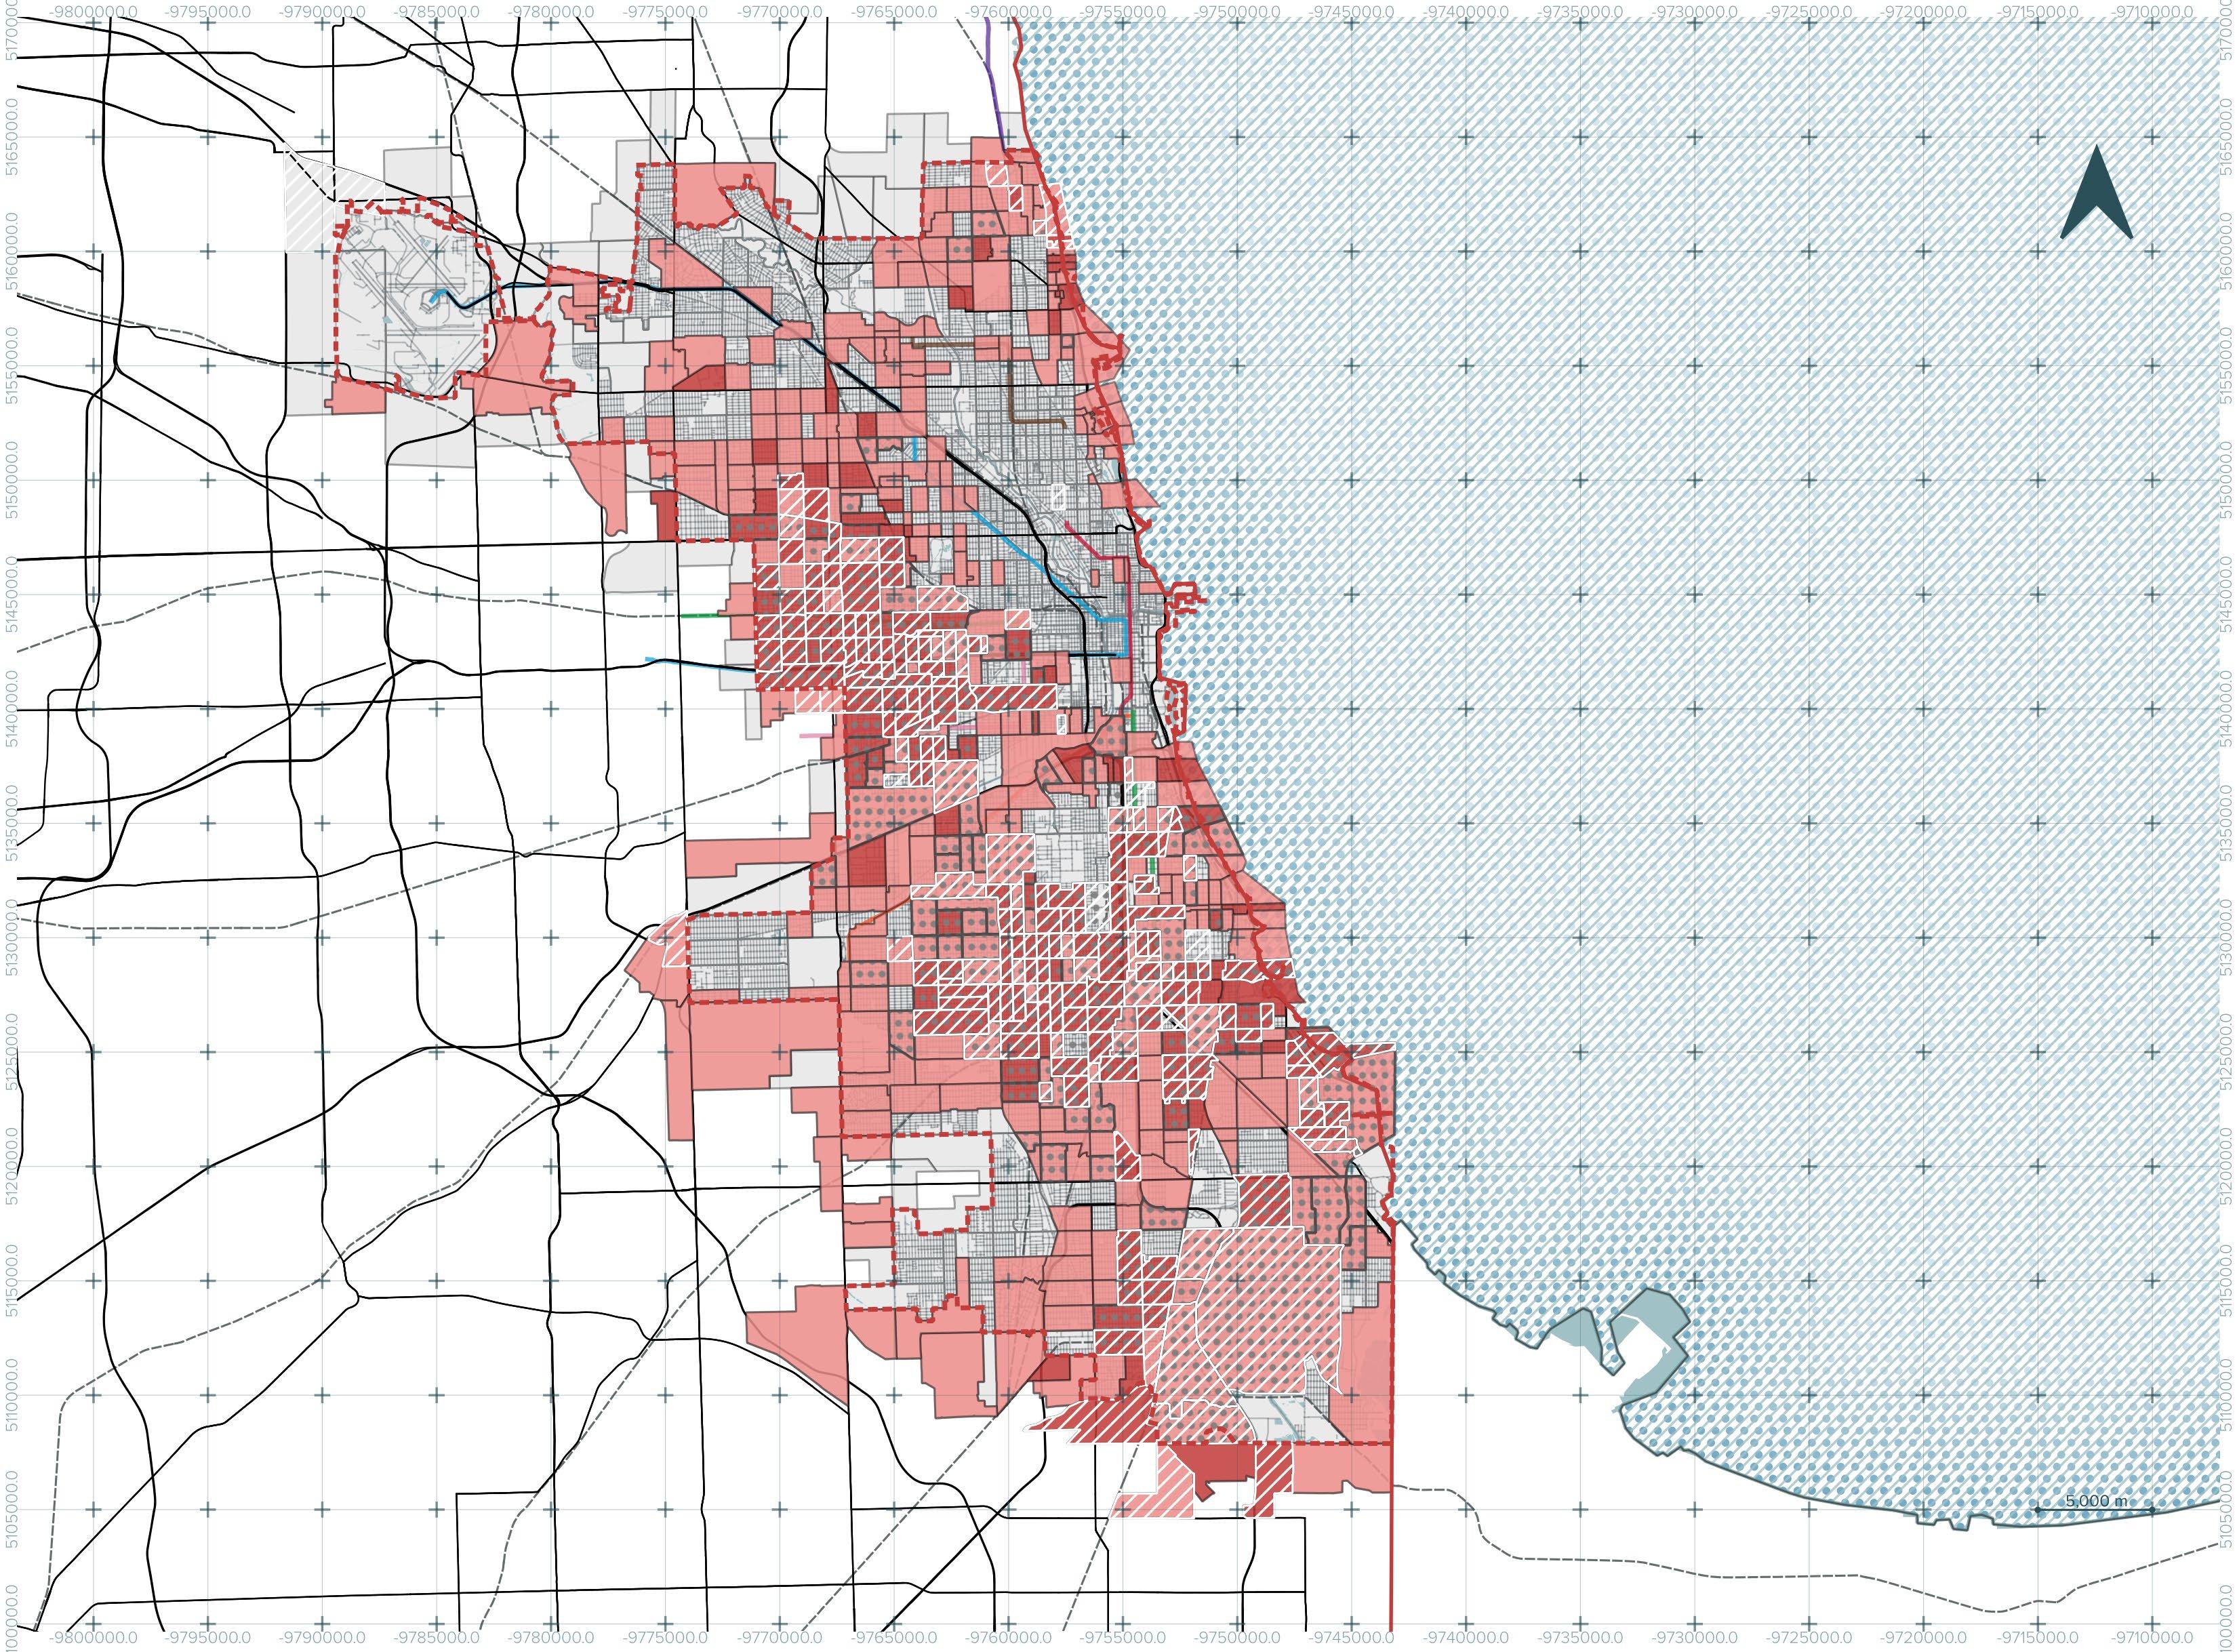
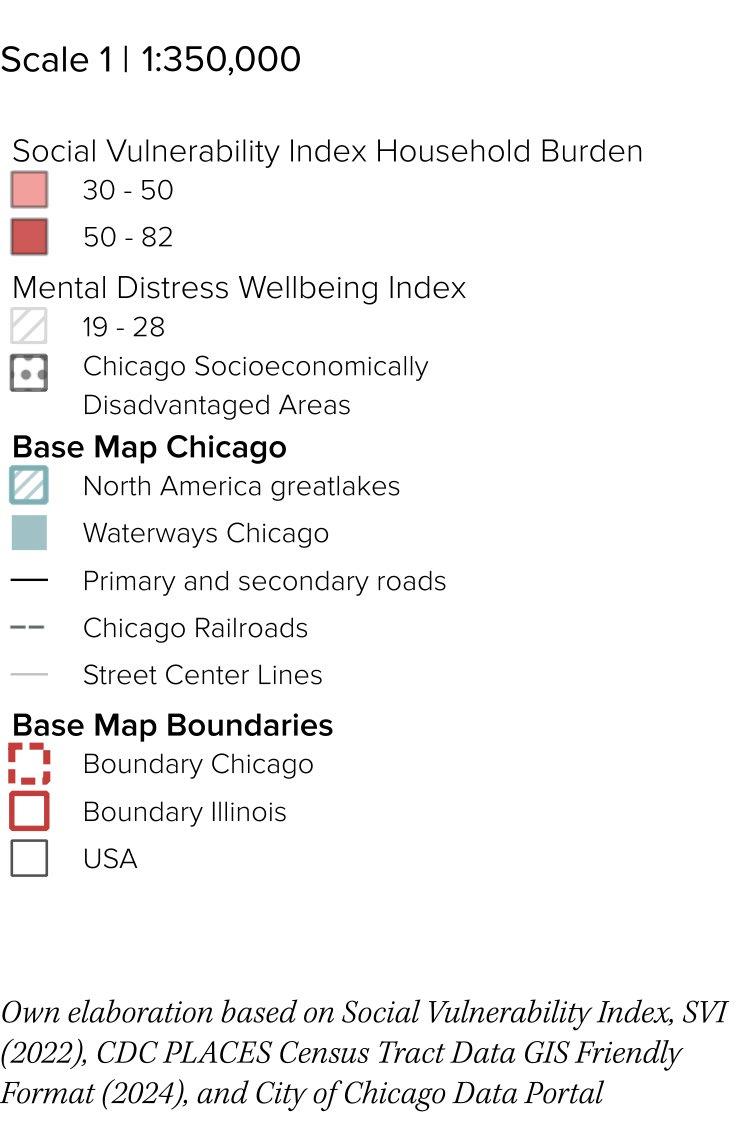
Household Burden Fuels
Mental Distress
Households facing burdens between 30 and 82 percent coincide with the highest levels of mental distress, affecting 19 to 28 percent of residents. Areas with both high household burden and high mental distress also overlap with socioeconomic disadvantage zones, showing how financial strain compounds psychological vulnerability. In contrast, northern neighborhoods with little or no household burden report low rates of mental distress, highlighting the uneven distribution of housing and health pressures across the city. The pattern reveals how housing costs shape not only economic security but also community well-being.
Figure 7. Lake View neighborhood in Chicago (Martinez, s.f.).
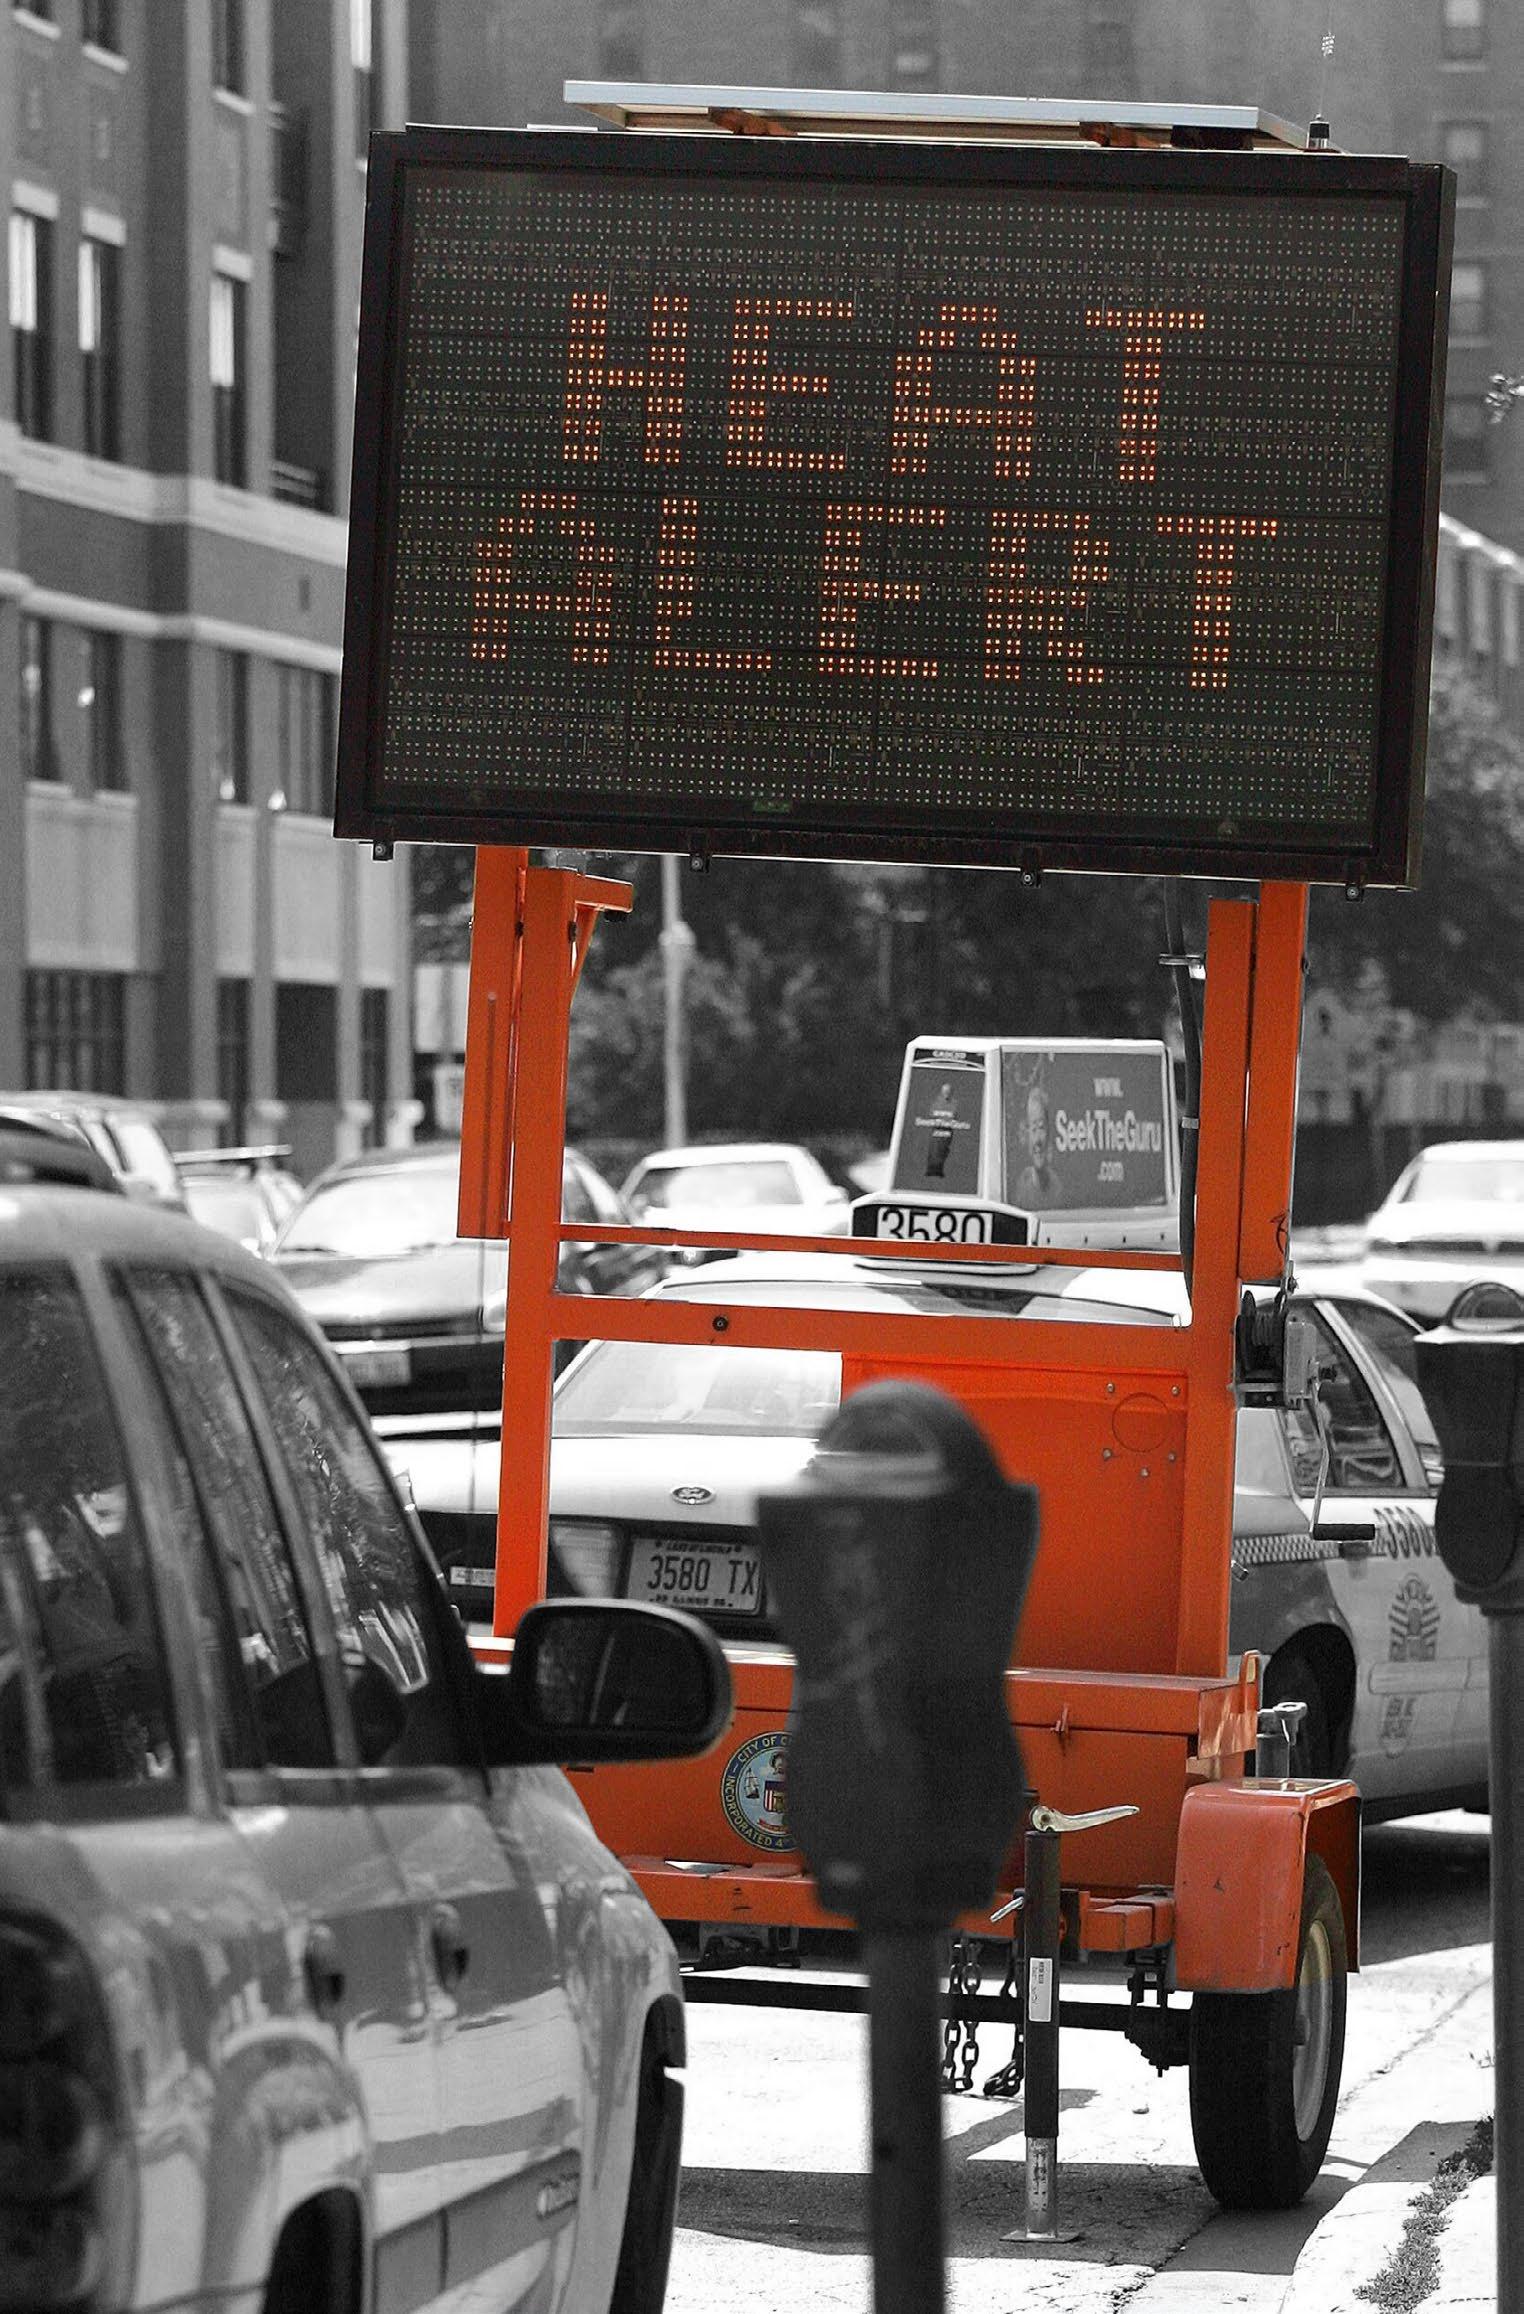
Urban life in Chicago exposes residents to a variety of stressors that can affect physical and mental health. Factors such as traffic congestion, noise pollution, overcrowded housing, limited access to green spaces, and economic pressures contribute to chronic stress, particularly in densely populated or under-resourced neighborhoods. Understanding urban stress in Chicago highlights how the city’s infrastructure, social inequalities, and environmental conditions interact to shape residents’ well-being, pointing to the need for urban planning and community strategies that reduce stress and promote healthier, more resilient communities.
URBAN STRESS
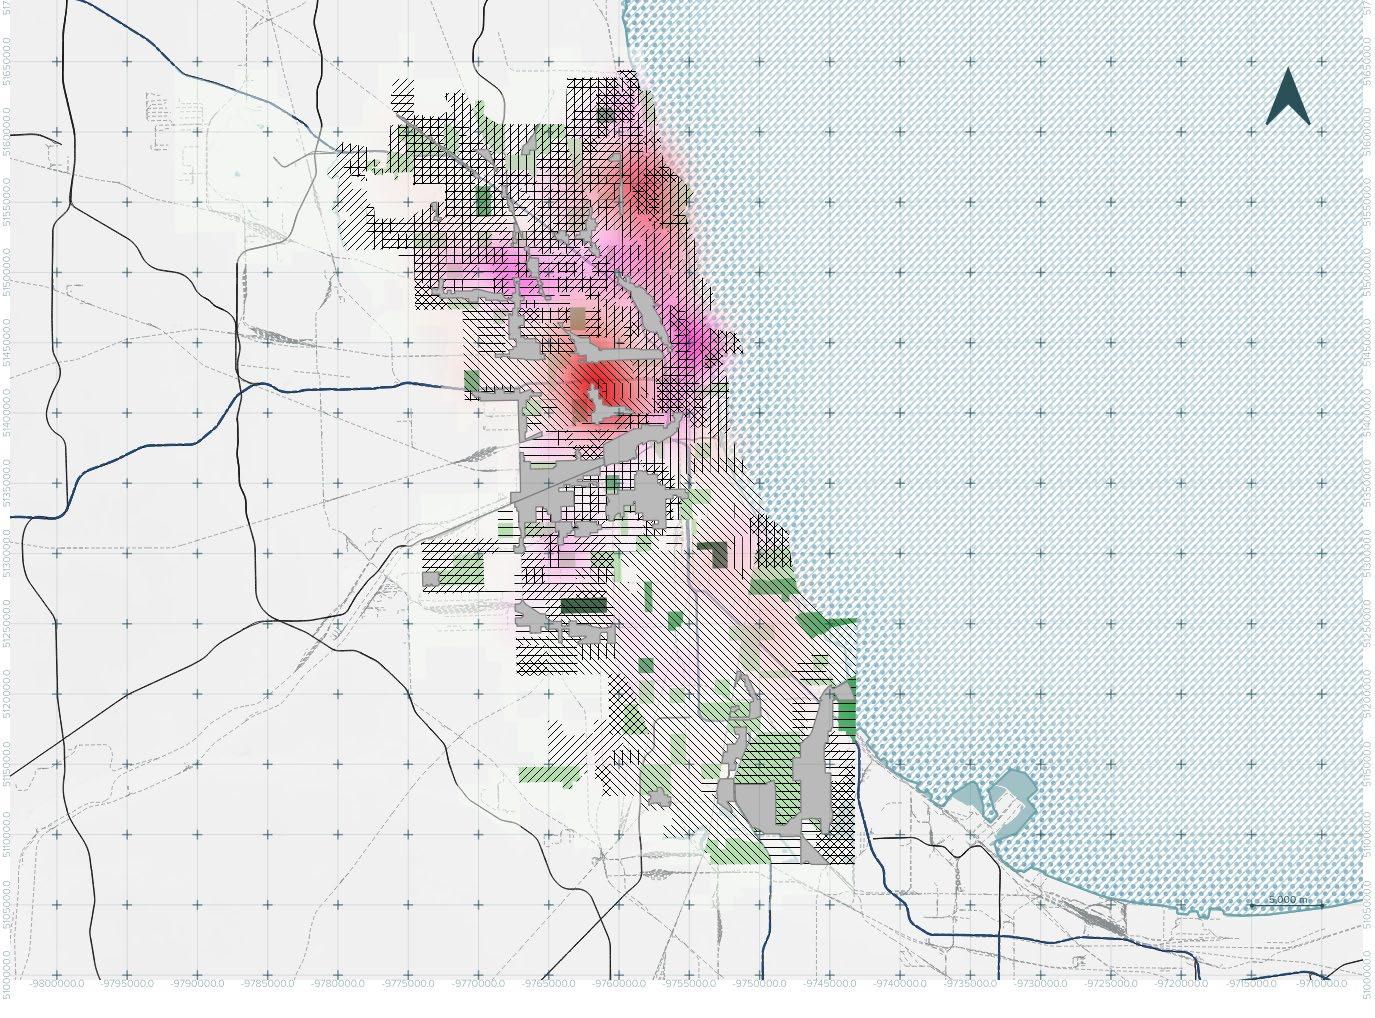
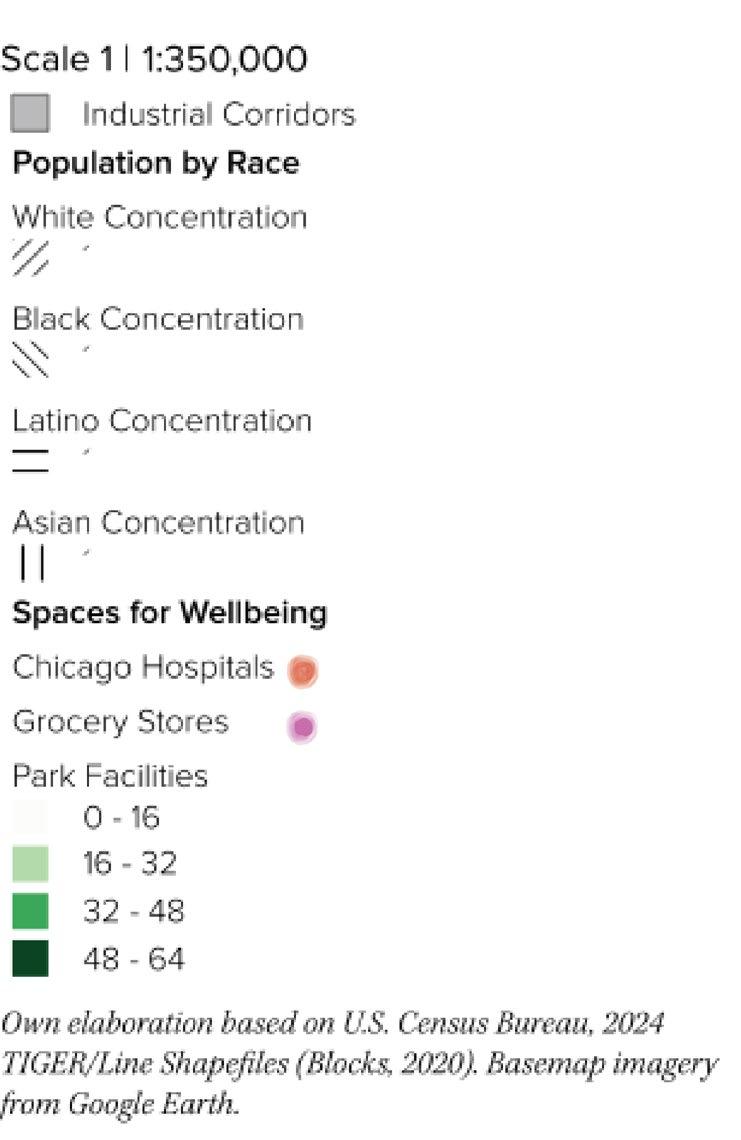
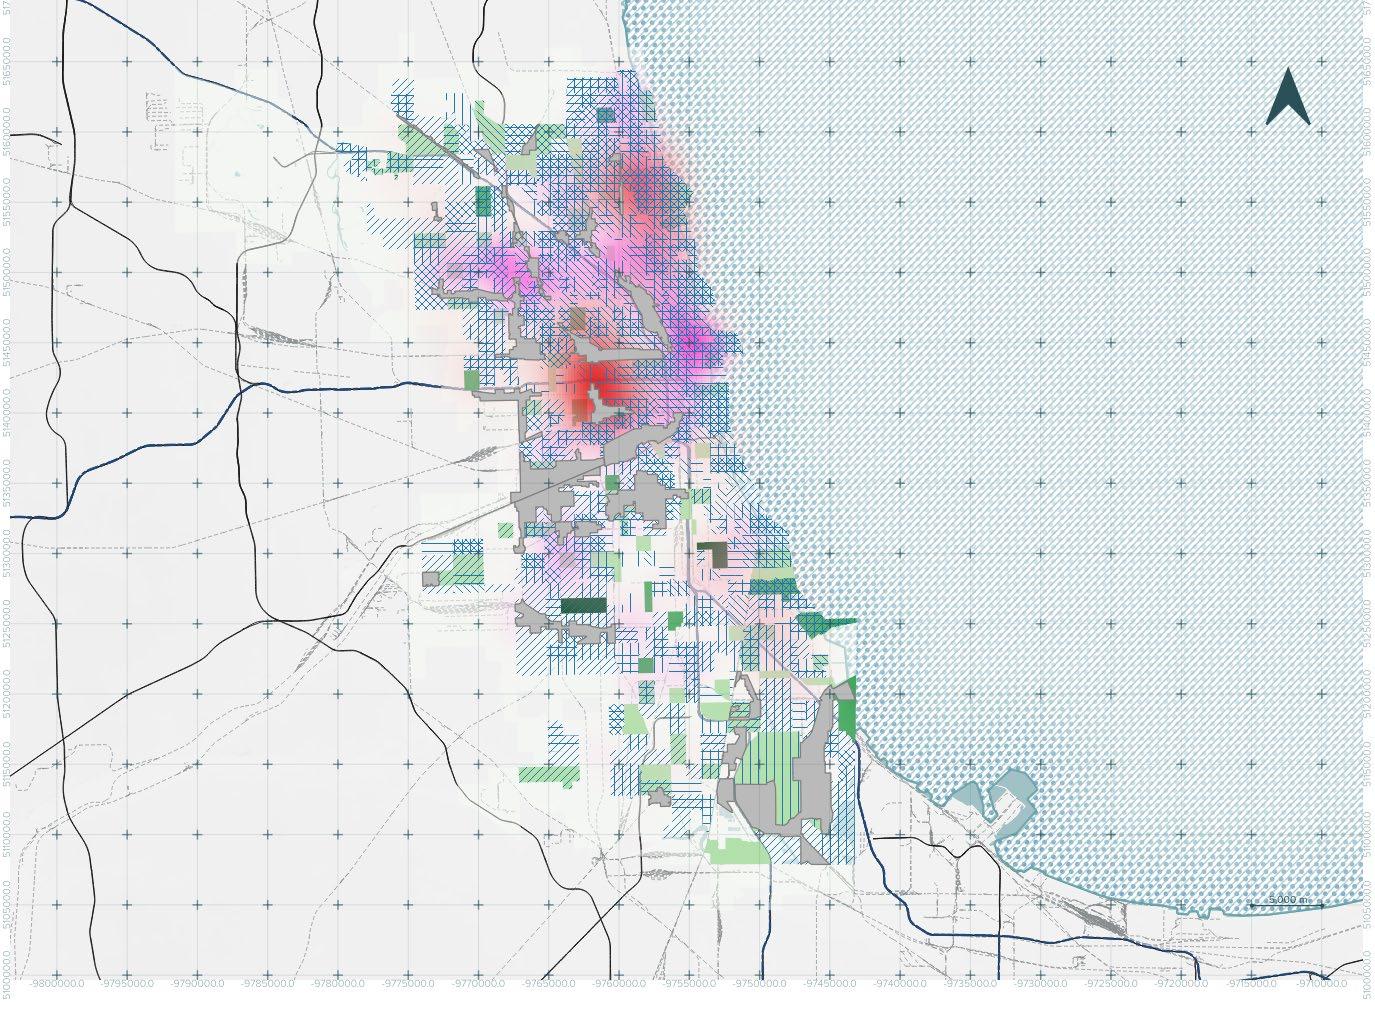
Inbalance
Chicago continues to be a very diverse city having a large concentration of people from every ethnicity and race. This population, however, is very separated in territory throughout the city. The North includes the most mix of races and ethnicities even if it is mostly a white community zone, whereas in the south the black community takes the zone almost entirely. Paired that with the Health Services and Spaces, the north has a bigger concentration of hospitals and grocery stores while the city in the parks and school department is very well distributed in terms of quantity.
Transport Flexibility lead by Health Service Closeness
The concentration of people who use their cars as the main form of transportation is concentrated more on the south in the zones where the least hospitals and grocery stores are placed, reaching a conclusion where perhaps the access to good public transportation and walkability is defined by the more health privilege areas with more services and spaces.
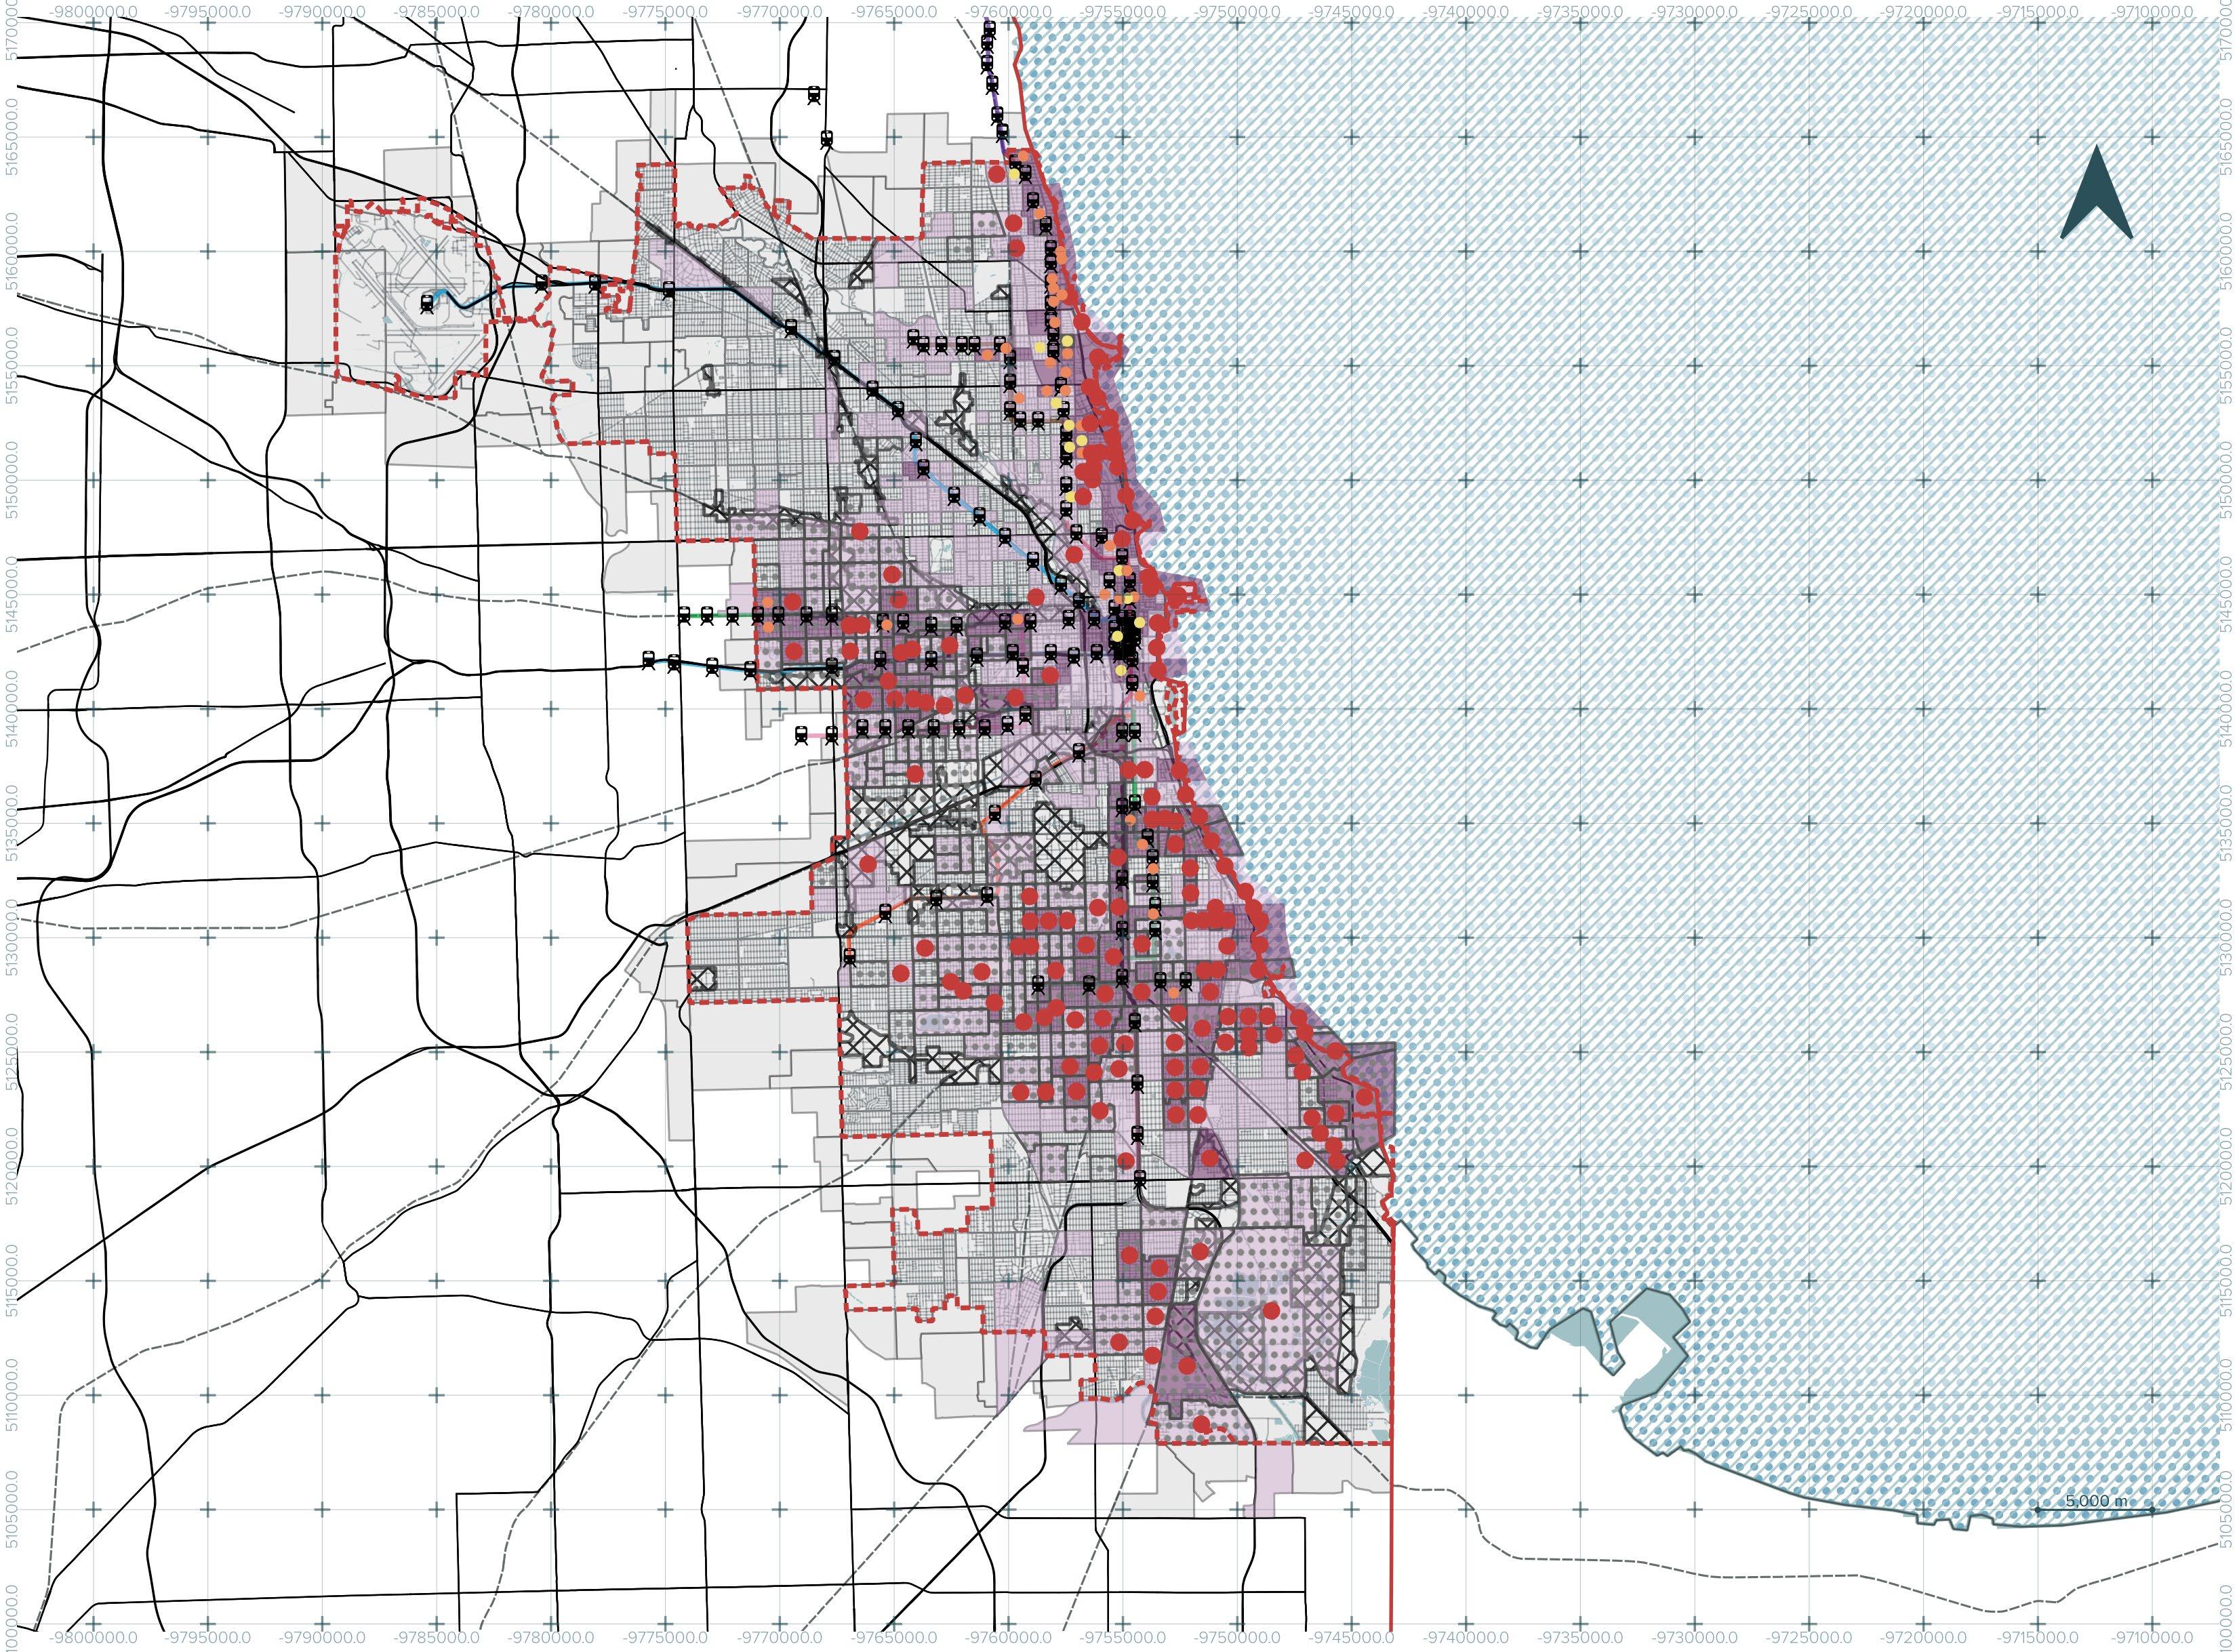
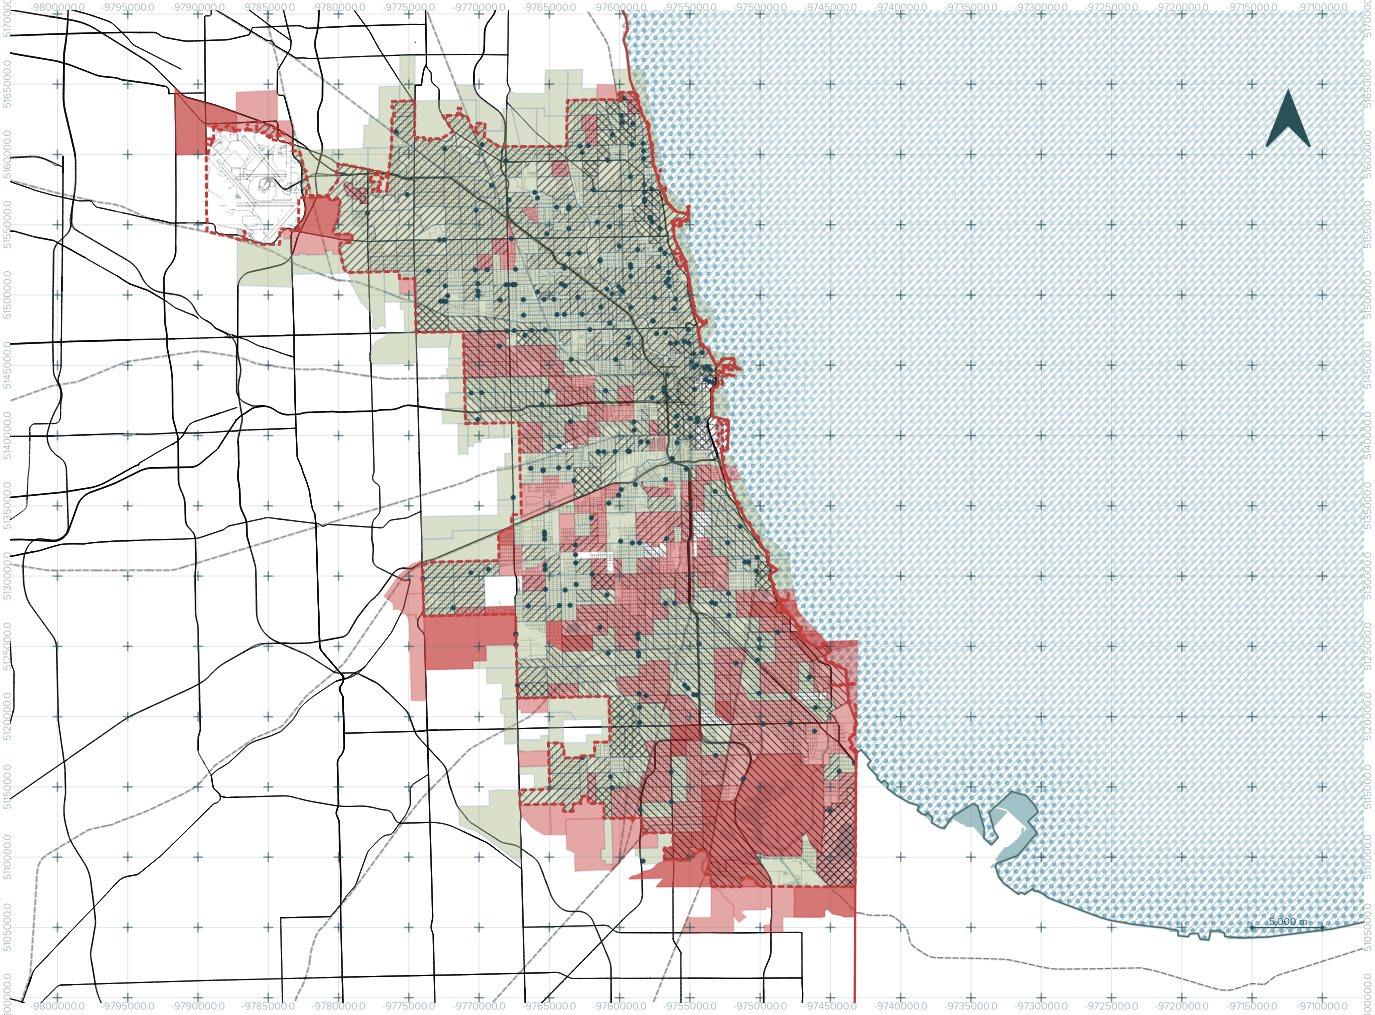
Neighborhoods with the highest share of households without a vehicle, ranging from 18 to 80 percent, show the greatest vulnerability when disconnected from CTA rail stops. Southern areas concentrate this vulnerability, where many residents live beyond an 800-meter walking distance to any station, leaving them with no meaningful transit options. By contrast, northern neighborhoods, despite some households without vehicles, benefit from higher connectivity with multiple rail stops within reach. The west side also reflects significant vulnerability, where high rates of no-vehicle households overlap with limited transit access, underscoring how disconnection compounds urban stress in vulnerable areas.
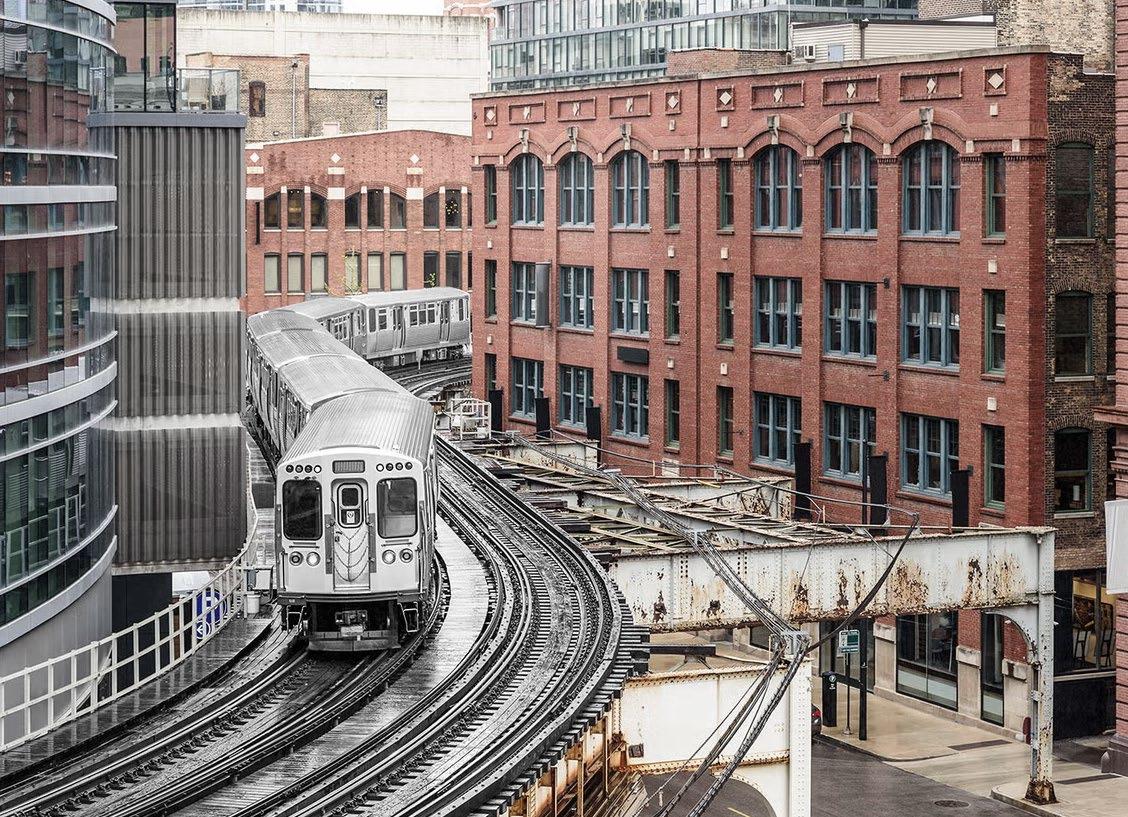
Figure 10 . Chicago elevated trains on tracks above the city (ozgurdonmaz, 2024).
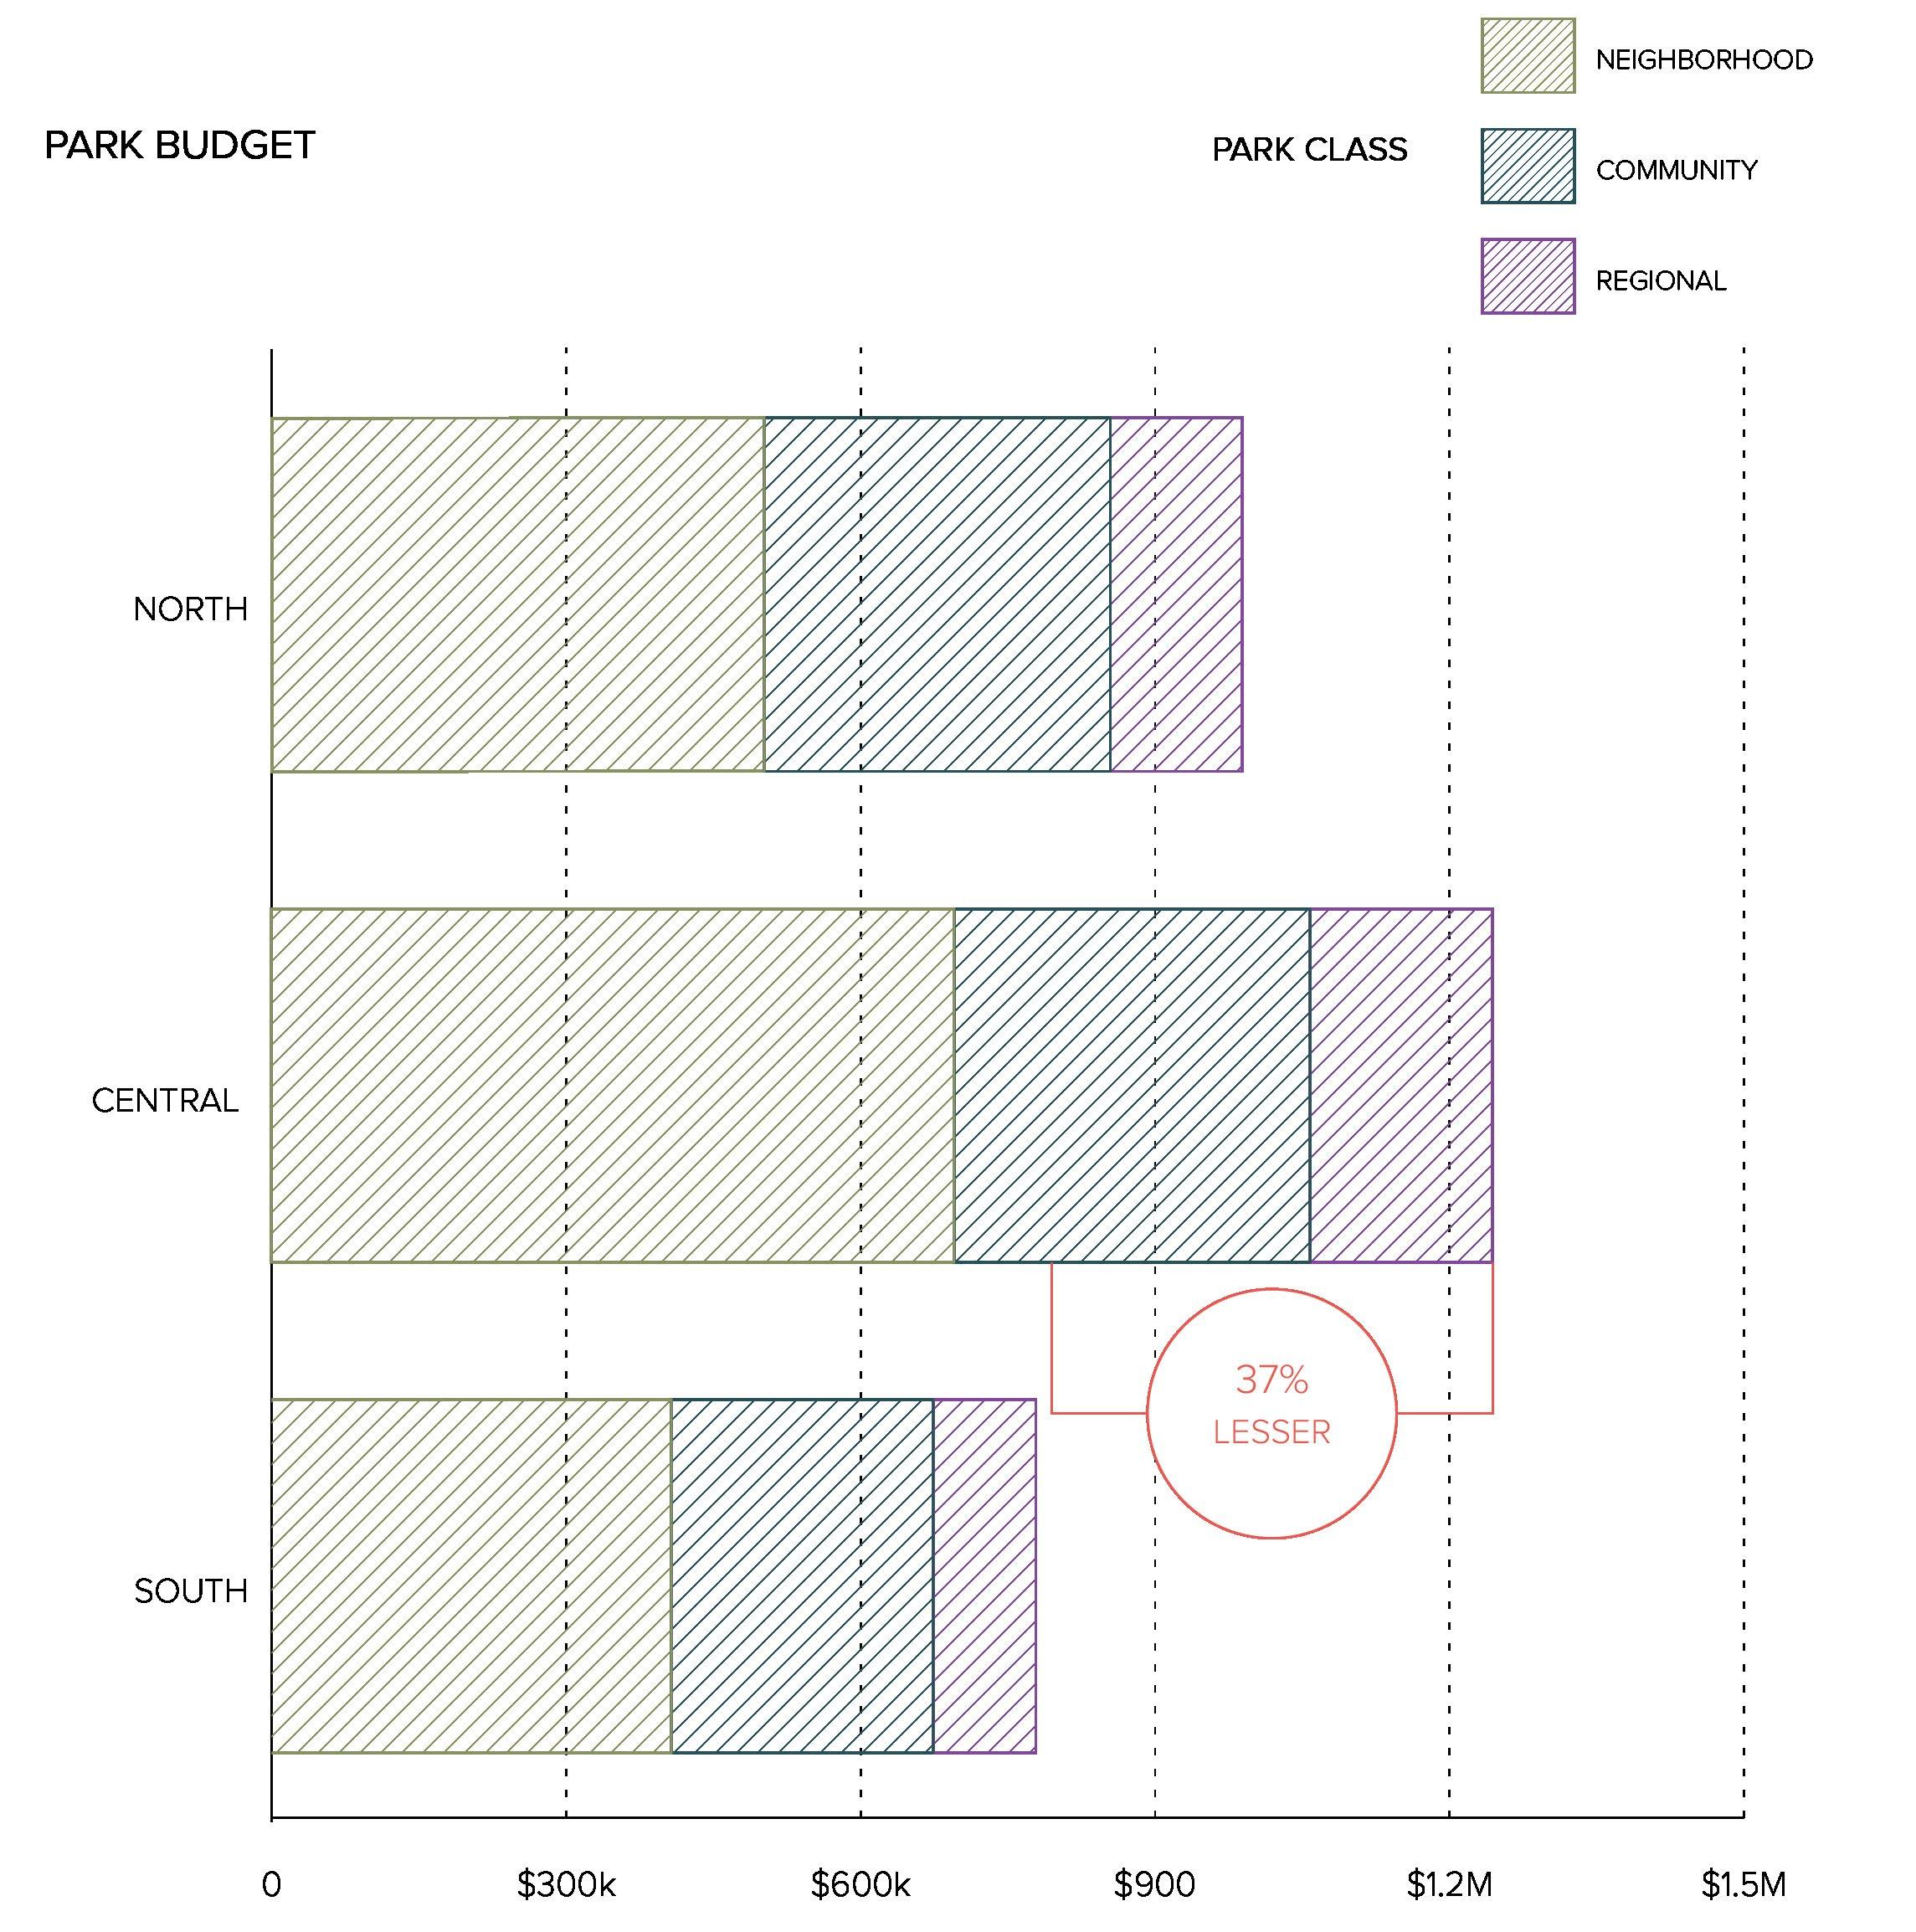
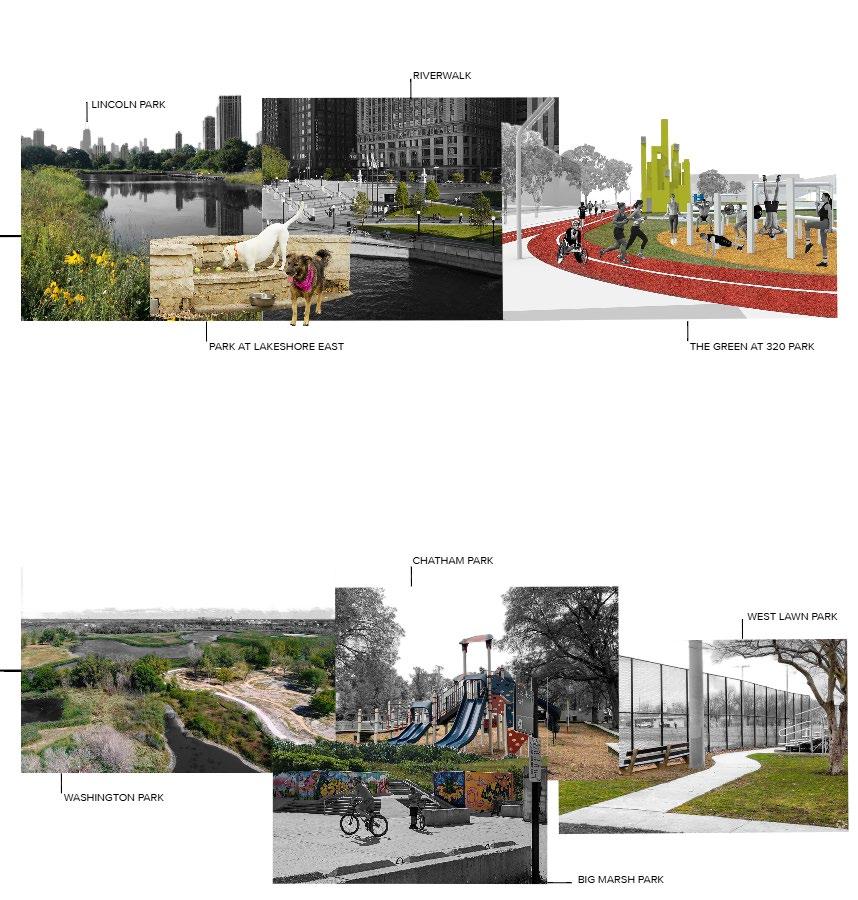
Park Facilities and their Regional Budget
Park facilities are located throughout the entire Chicago city and every census track in the city has a good closeness to at least one of them, in the metropolitan area and the north overall, it seems that the quality radically increases from those in the south and the territory and its vulnerable population influences the amount of budget, safety and community participation.
Facilities Quality and Life based on Region
Due to amenities, governance, community participation, budget, safety. programming, maintenance and lack of development. The parks concentrated on the south suffer from lower qualities and less positive effects to its users.
Park
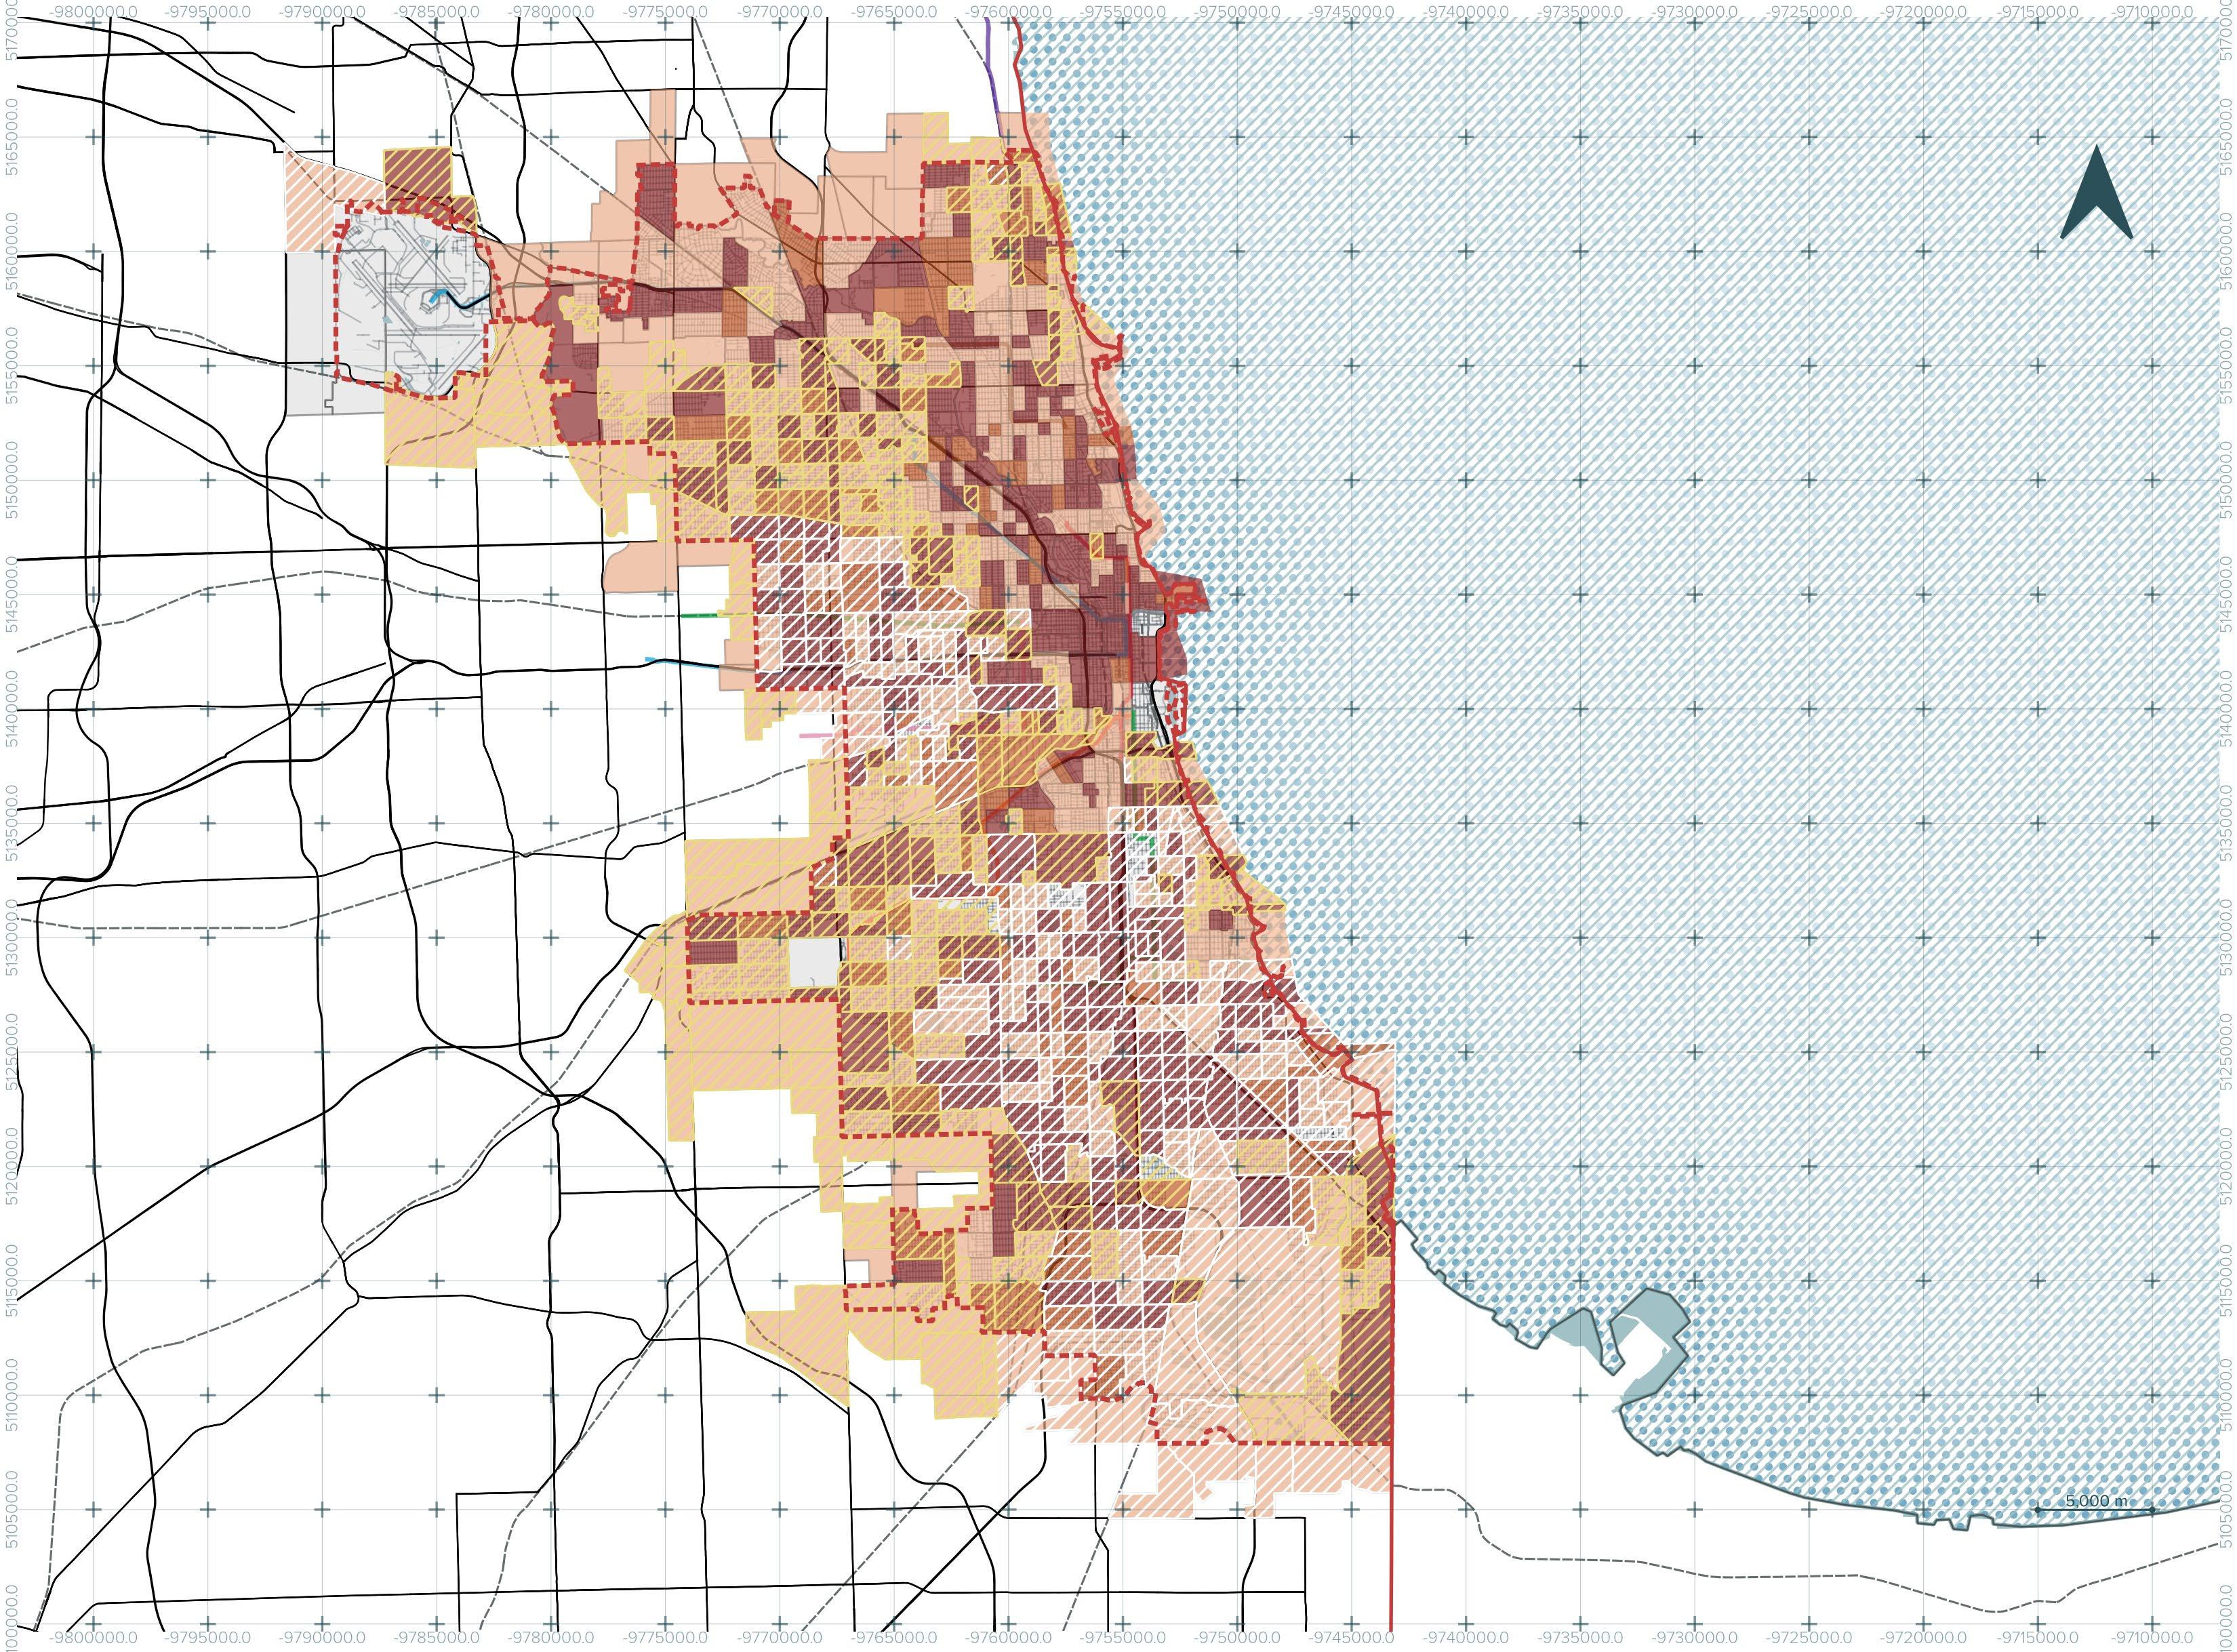
Nutrition plays a central role in public health across Chicago, where access to healthy, affordable food varies widely between neighborhoods. Many communities, particularly those with lower incomes, face food deserts, limited grocery options, and a high prevalence of fast-food outlets, contributing to chronic illnesses such as obesity, diabetes, and heart disease. Examining nutrition in Chicago through a public health lens highlights the connection between food access, social inequality, and community well-being, emphasizing the need for policies and programs that ensure all residents can lead healthier, more nourished lives.
NUTRITION AND PUBLIC HEALTH
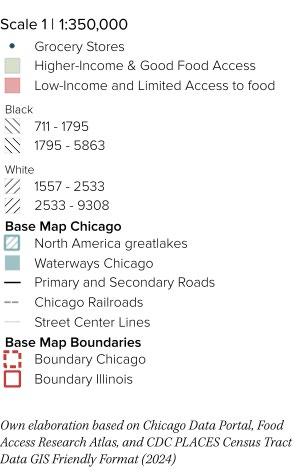
Limited Access to food in Low-Income Black Neighborhoods
This map shows how food access in Chicago is tied to race and income. Predominantly black neighborhoods in the South and West face both lower income and limited access to grocery stores or fresh food. In contrast, predominantly white neighborhoods in the North benefit from higher incomes and greater proximity to food resources. These food access gaps restrict dietary options and contribute to long-term health disparities, reinforcing cycles of disadvantage in marginalized communities.
Figure 11
Photo by Oscar Gomez for Borderless Magazine, 2023
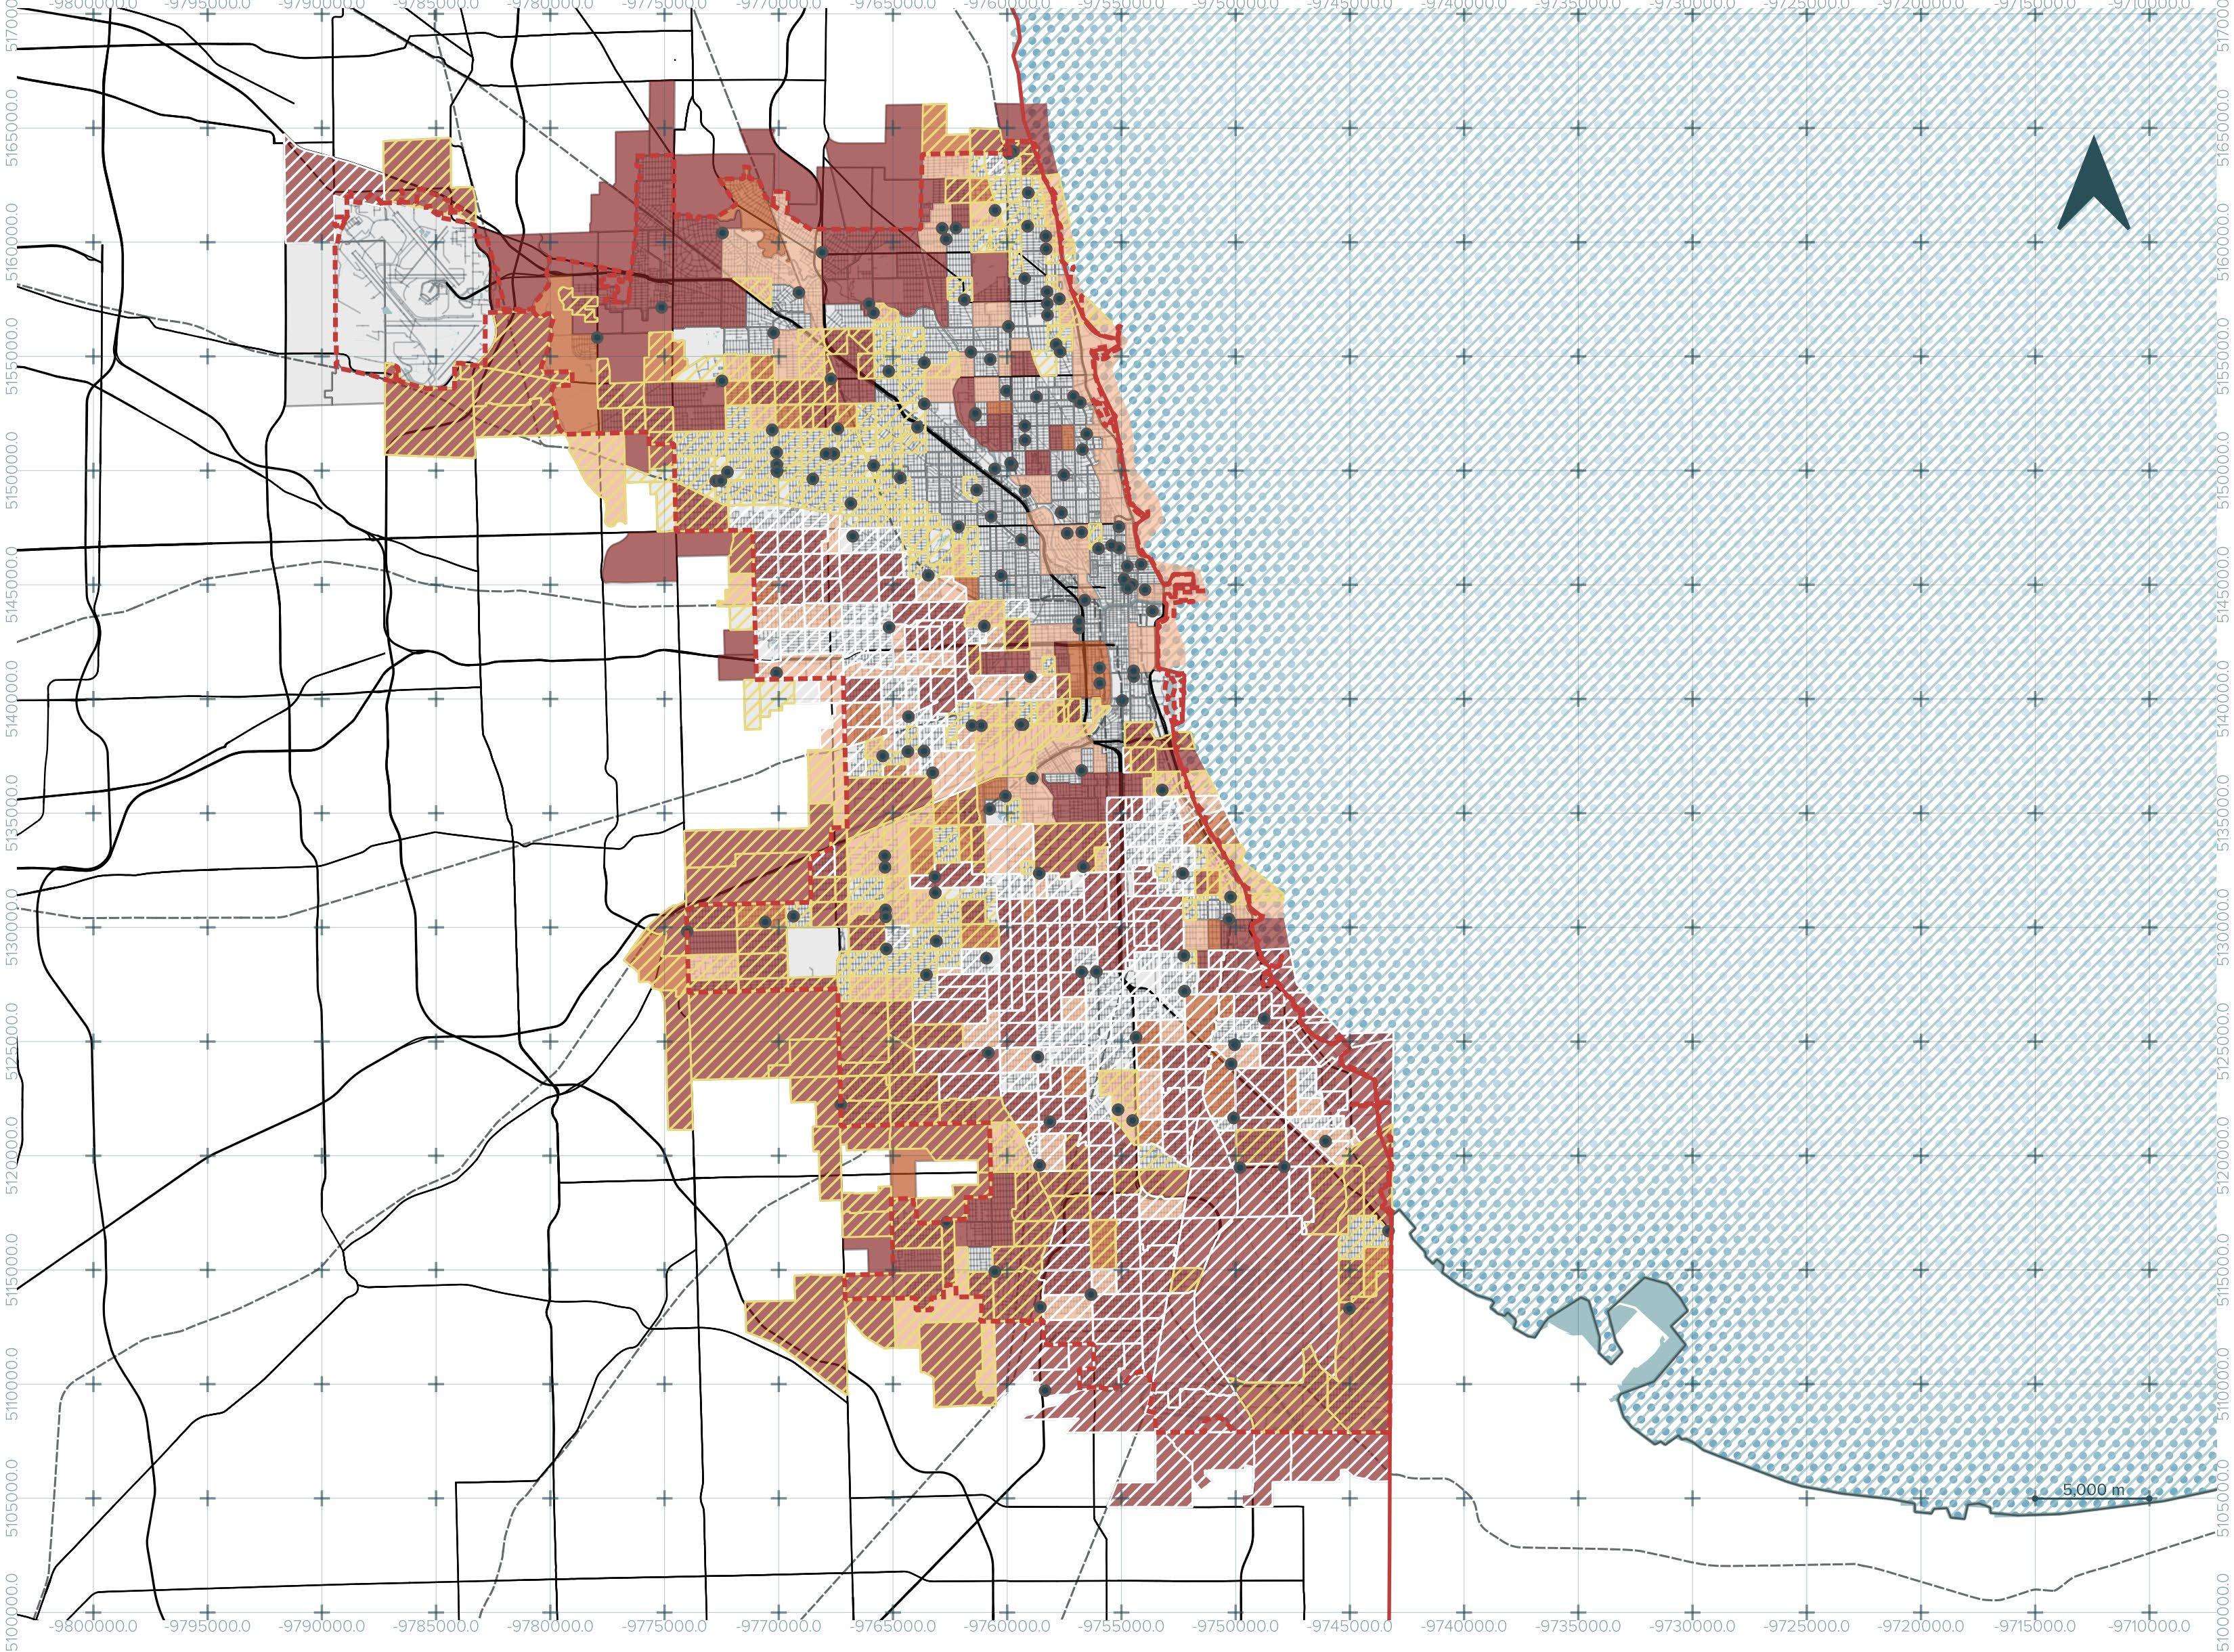
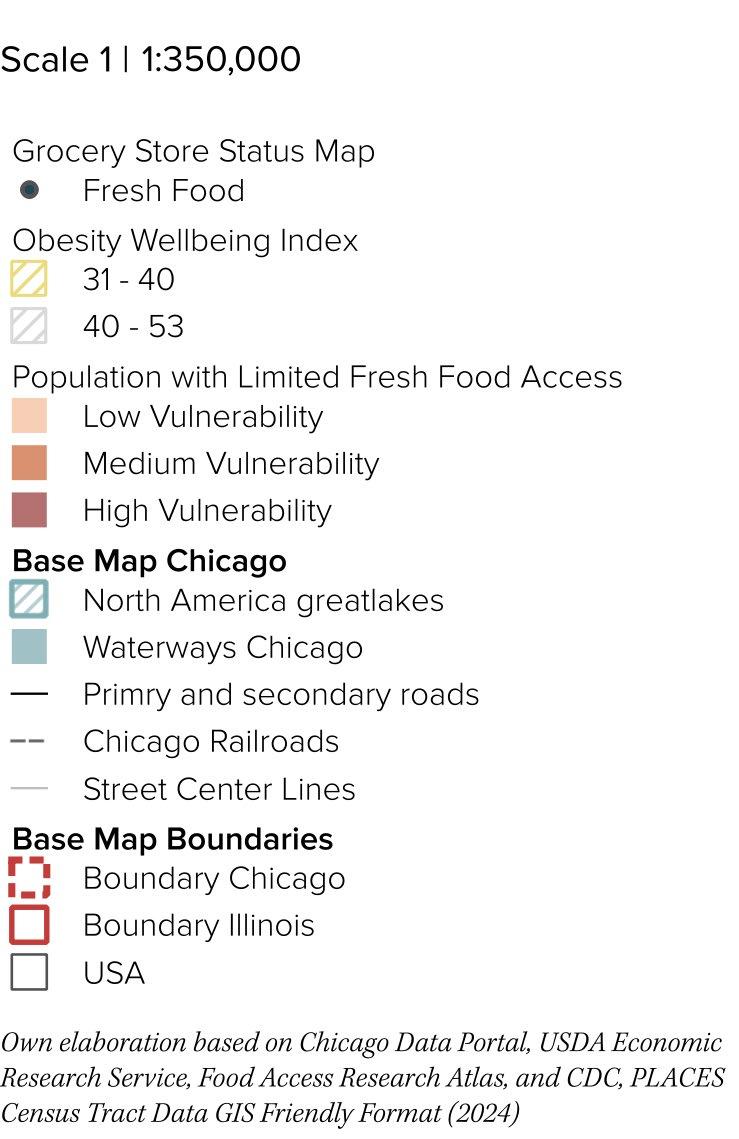
Limited Fresh Food Access
Shapes Obesity
Southern neighborhoods classified as highly vulnerable due to limited fresh food access within a half mile in urban areas, register the highest obesity prevalence, with 40–50 percent of residents affected. The overlap between food insecurity and obesity highlights how limited access reinforces health gaps in disadvantaged areas. Although many grocery stores categorized as fresh food remain in the south, these do not translate into meaningful availability, as vulnerable neighborhoods remain the most affected. In contrast, northern neighborhoods show greater fresh food access, leaving fewer vulnerable communities and lower obesity rates.
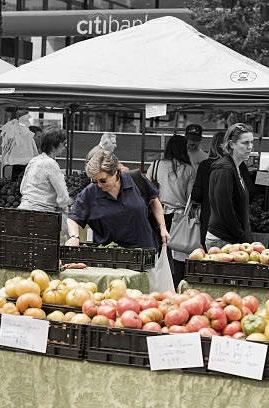
Figure 12 Farmers Market, Chicago (2015).
Fast Food Availability
Shapes Obesity Prevalence
Census tracts lacking supermarket access within a half mile in urban areas or ten miles in rural areas show high concentrations of fast food restaurants, especially in the south and north of the city. Southern tracts combine high fast food availability with the highest obesity prevalence, affecting 40–50 percent of residents. The overlap of limited fresh food, fast food density, and obesity underscores how food environments reinforce health disparities in Chicago. Both north and south display clusters of fast food, but obesity is disproportionately concentrated in the south, revealing how food access and diet-related health outcomes deepen vulnerability in disadvantaged neighborhoods.
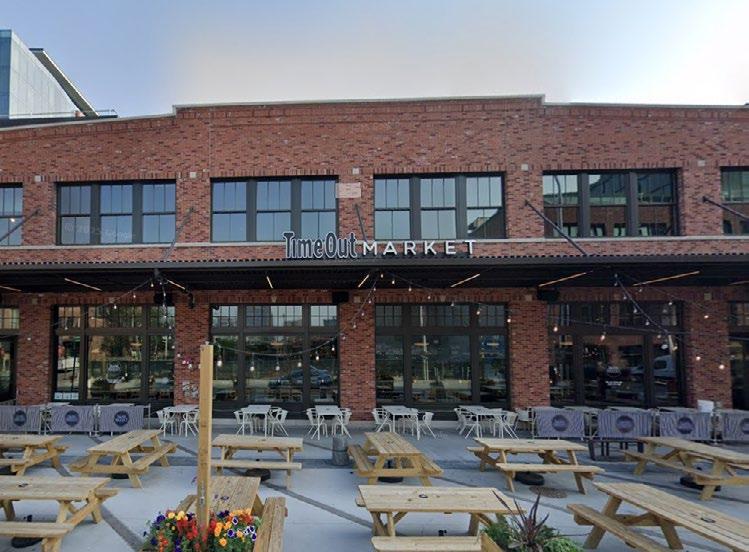
Figure 13.
Interior view of a Chicago food hall (Slaton, s.f.).
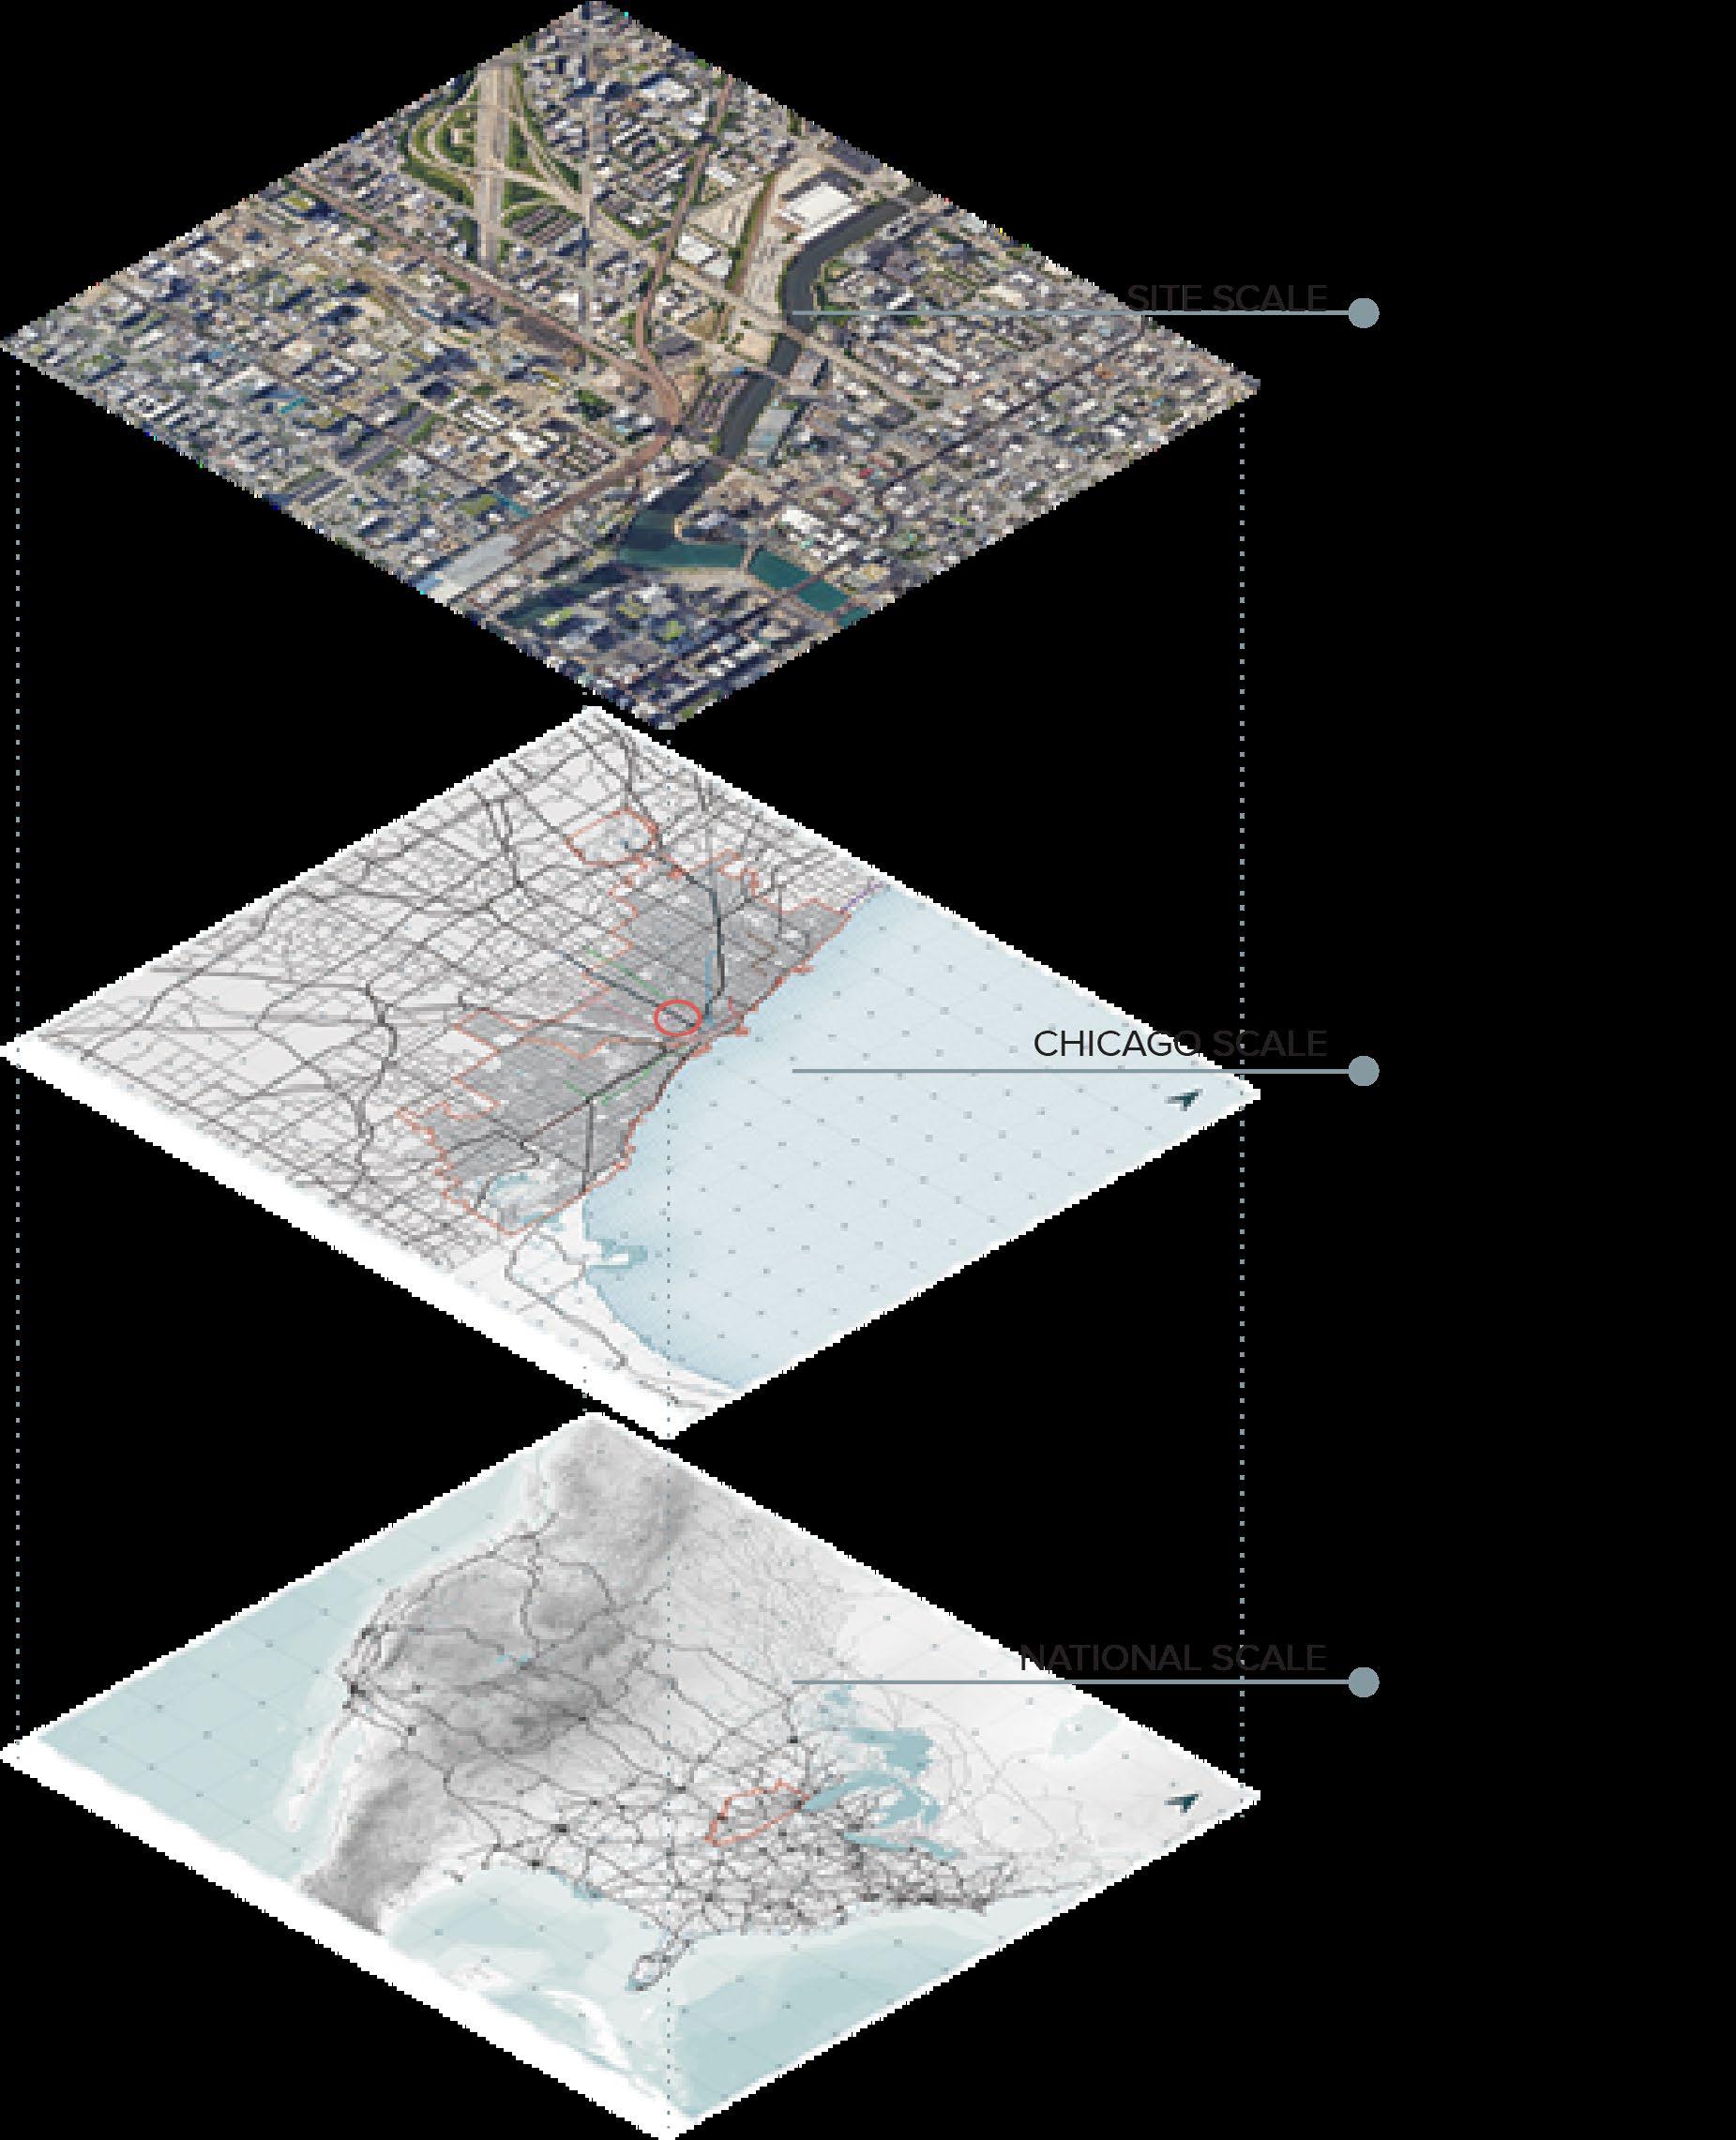
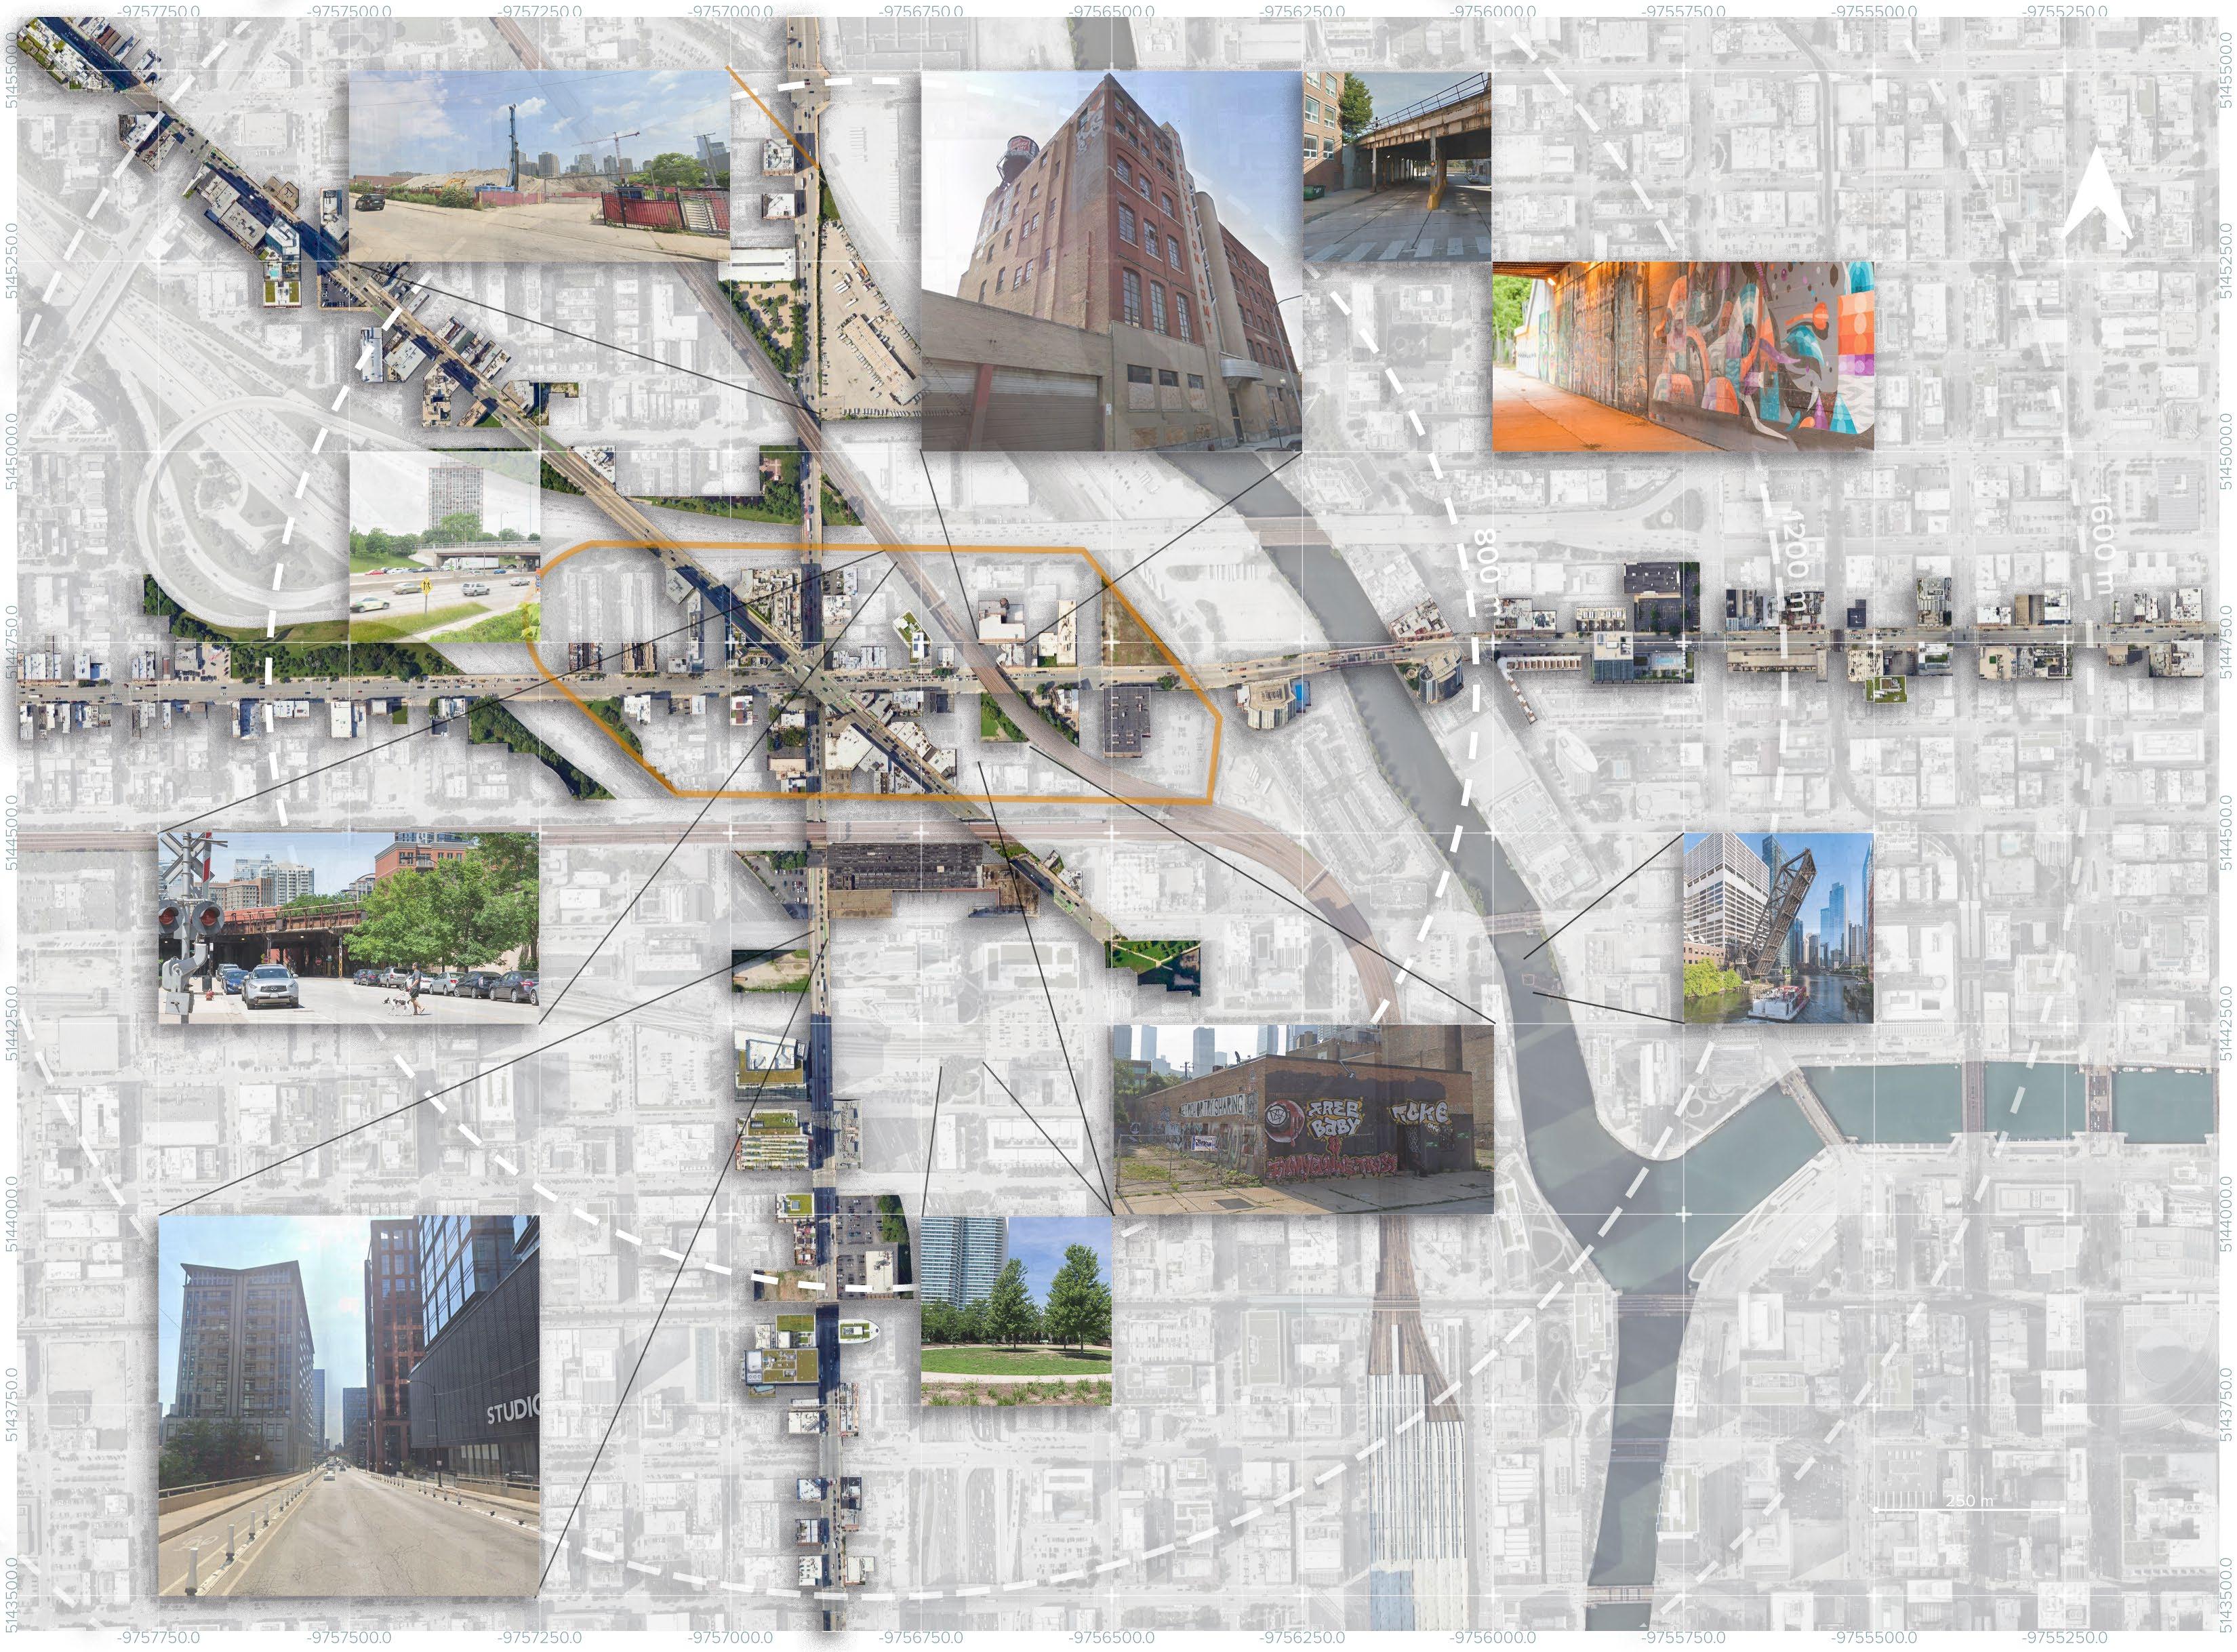
The site is examined through an integrated framework that considers demographics, walkability, mobility networks, public facilities, transportation systems, and patterns of land use. Understanding these layers together allows for a clearer picture of how the area currently operates and where critical gaps exist. This synthesis not only identifies opportunities and constraints but also establishes the basis for interventions that can directly contribute to health and well-being. By situating the property within its wider urban context, the analysis highlights how spatial, social, and environmental factors intersect, guiding proposals that aim to create more resilient and supportive conditions for everyday life.
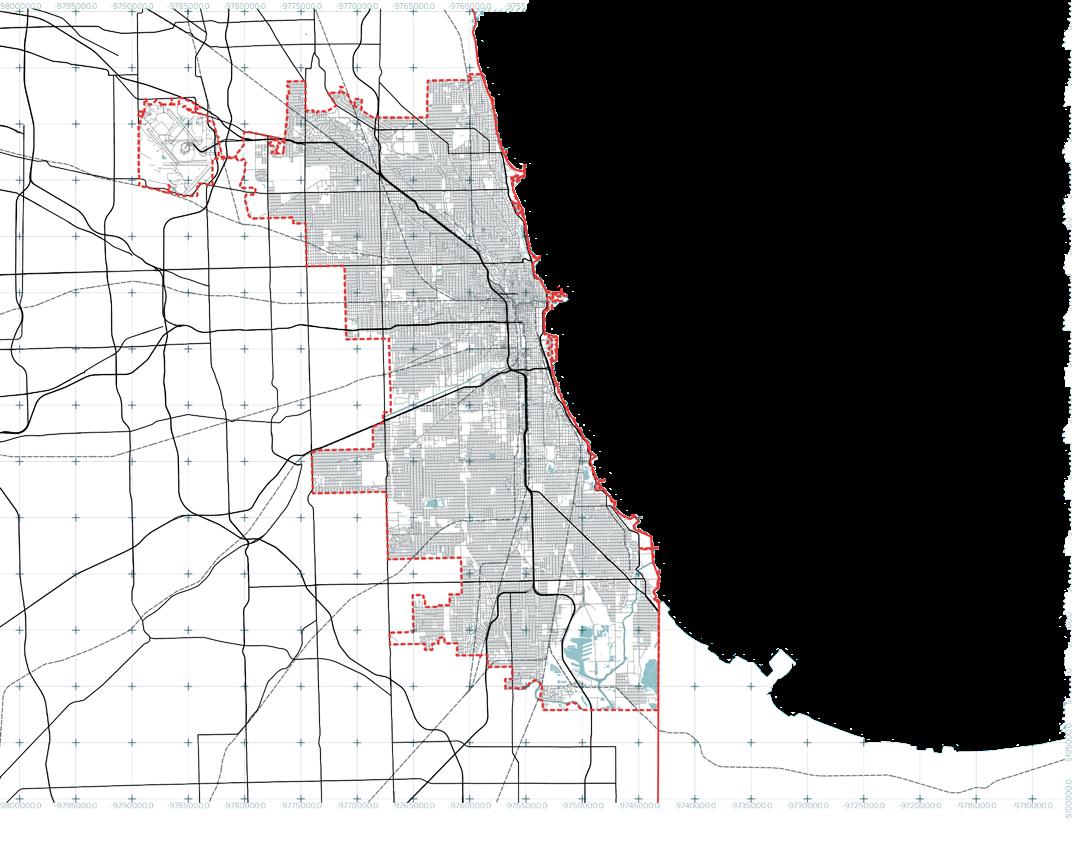
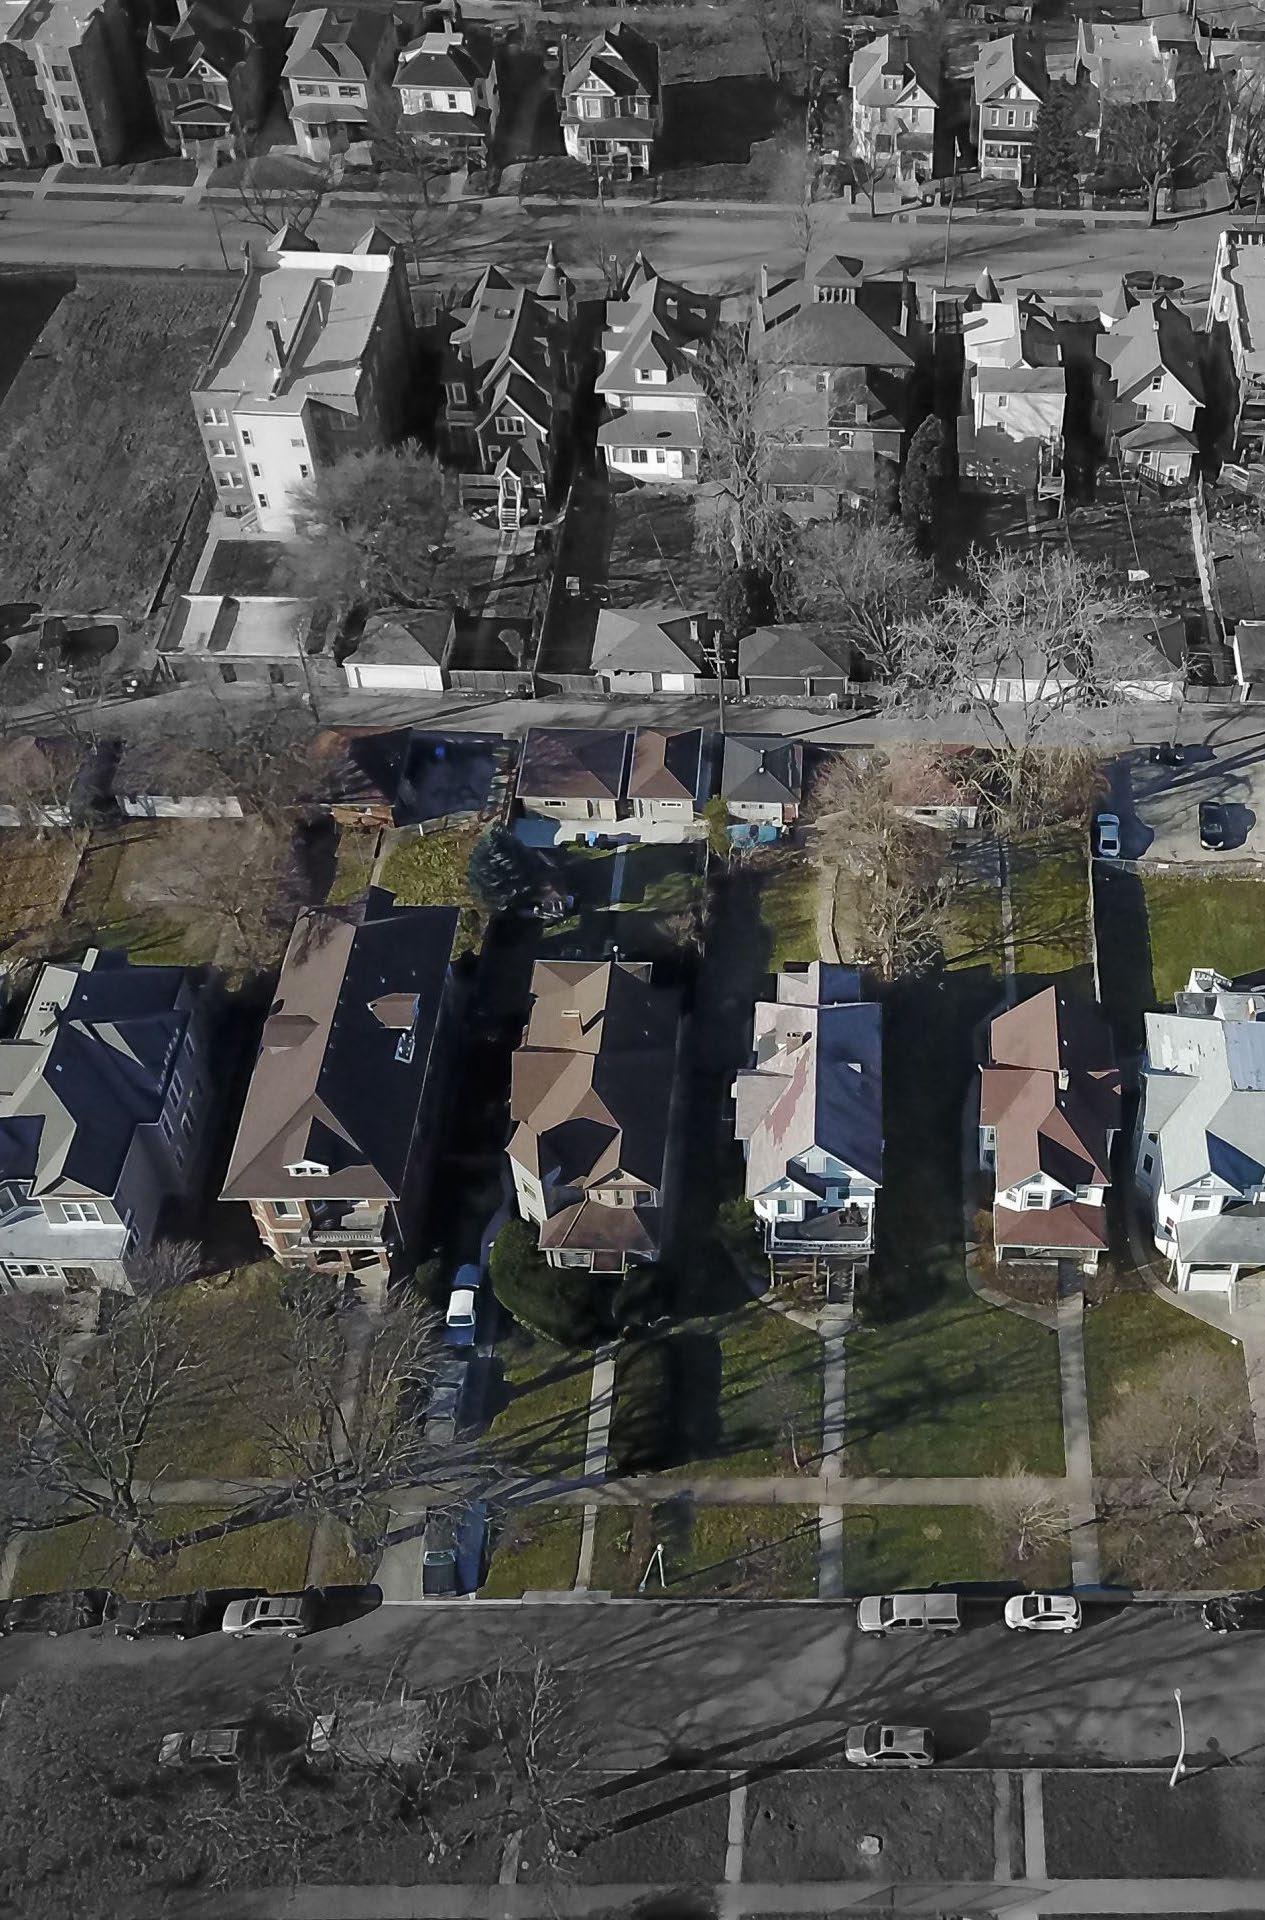
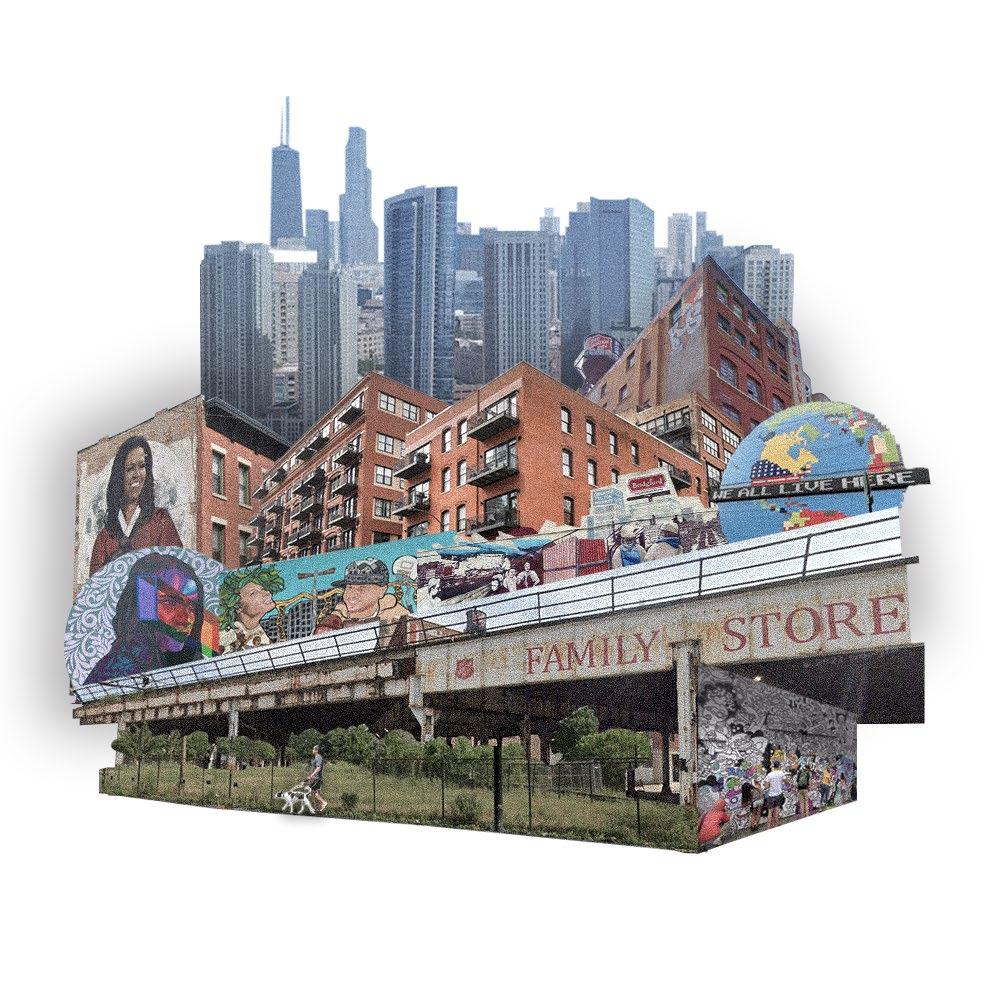
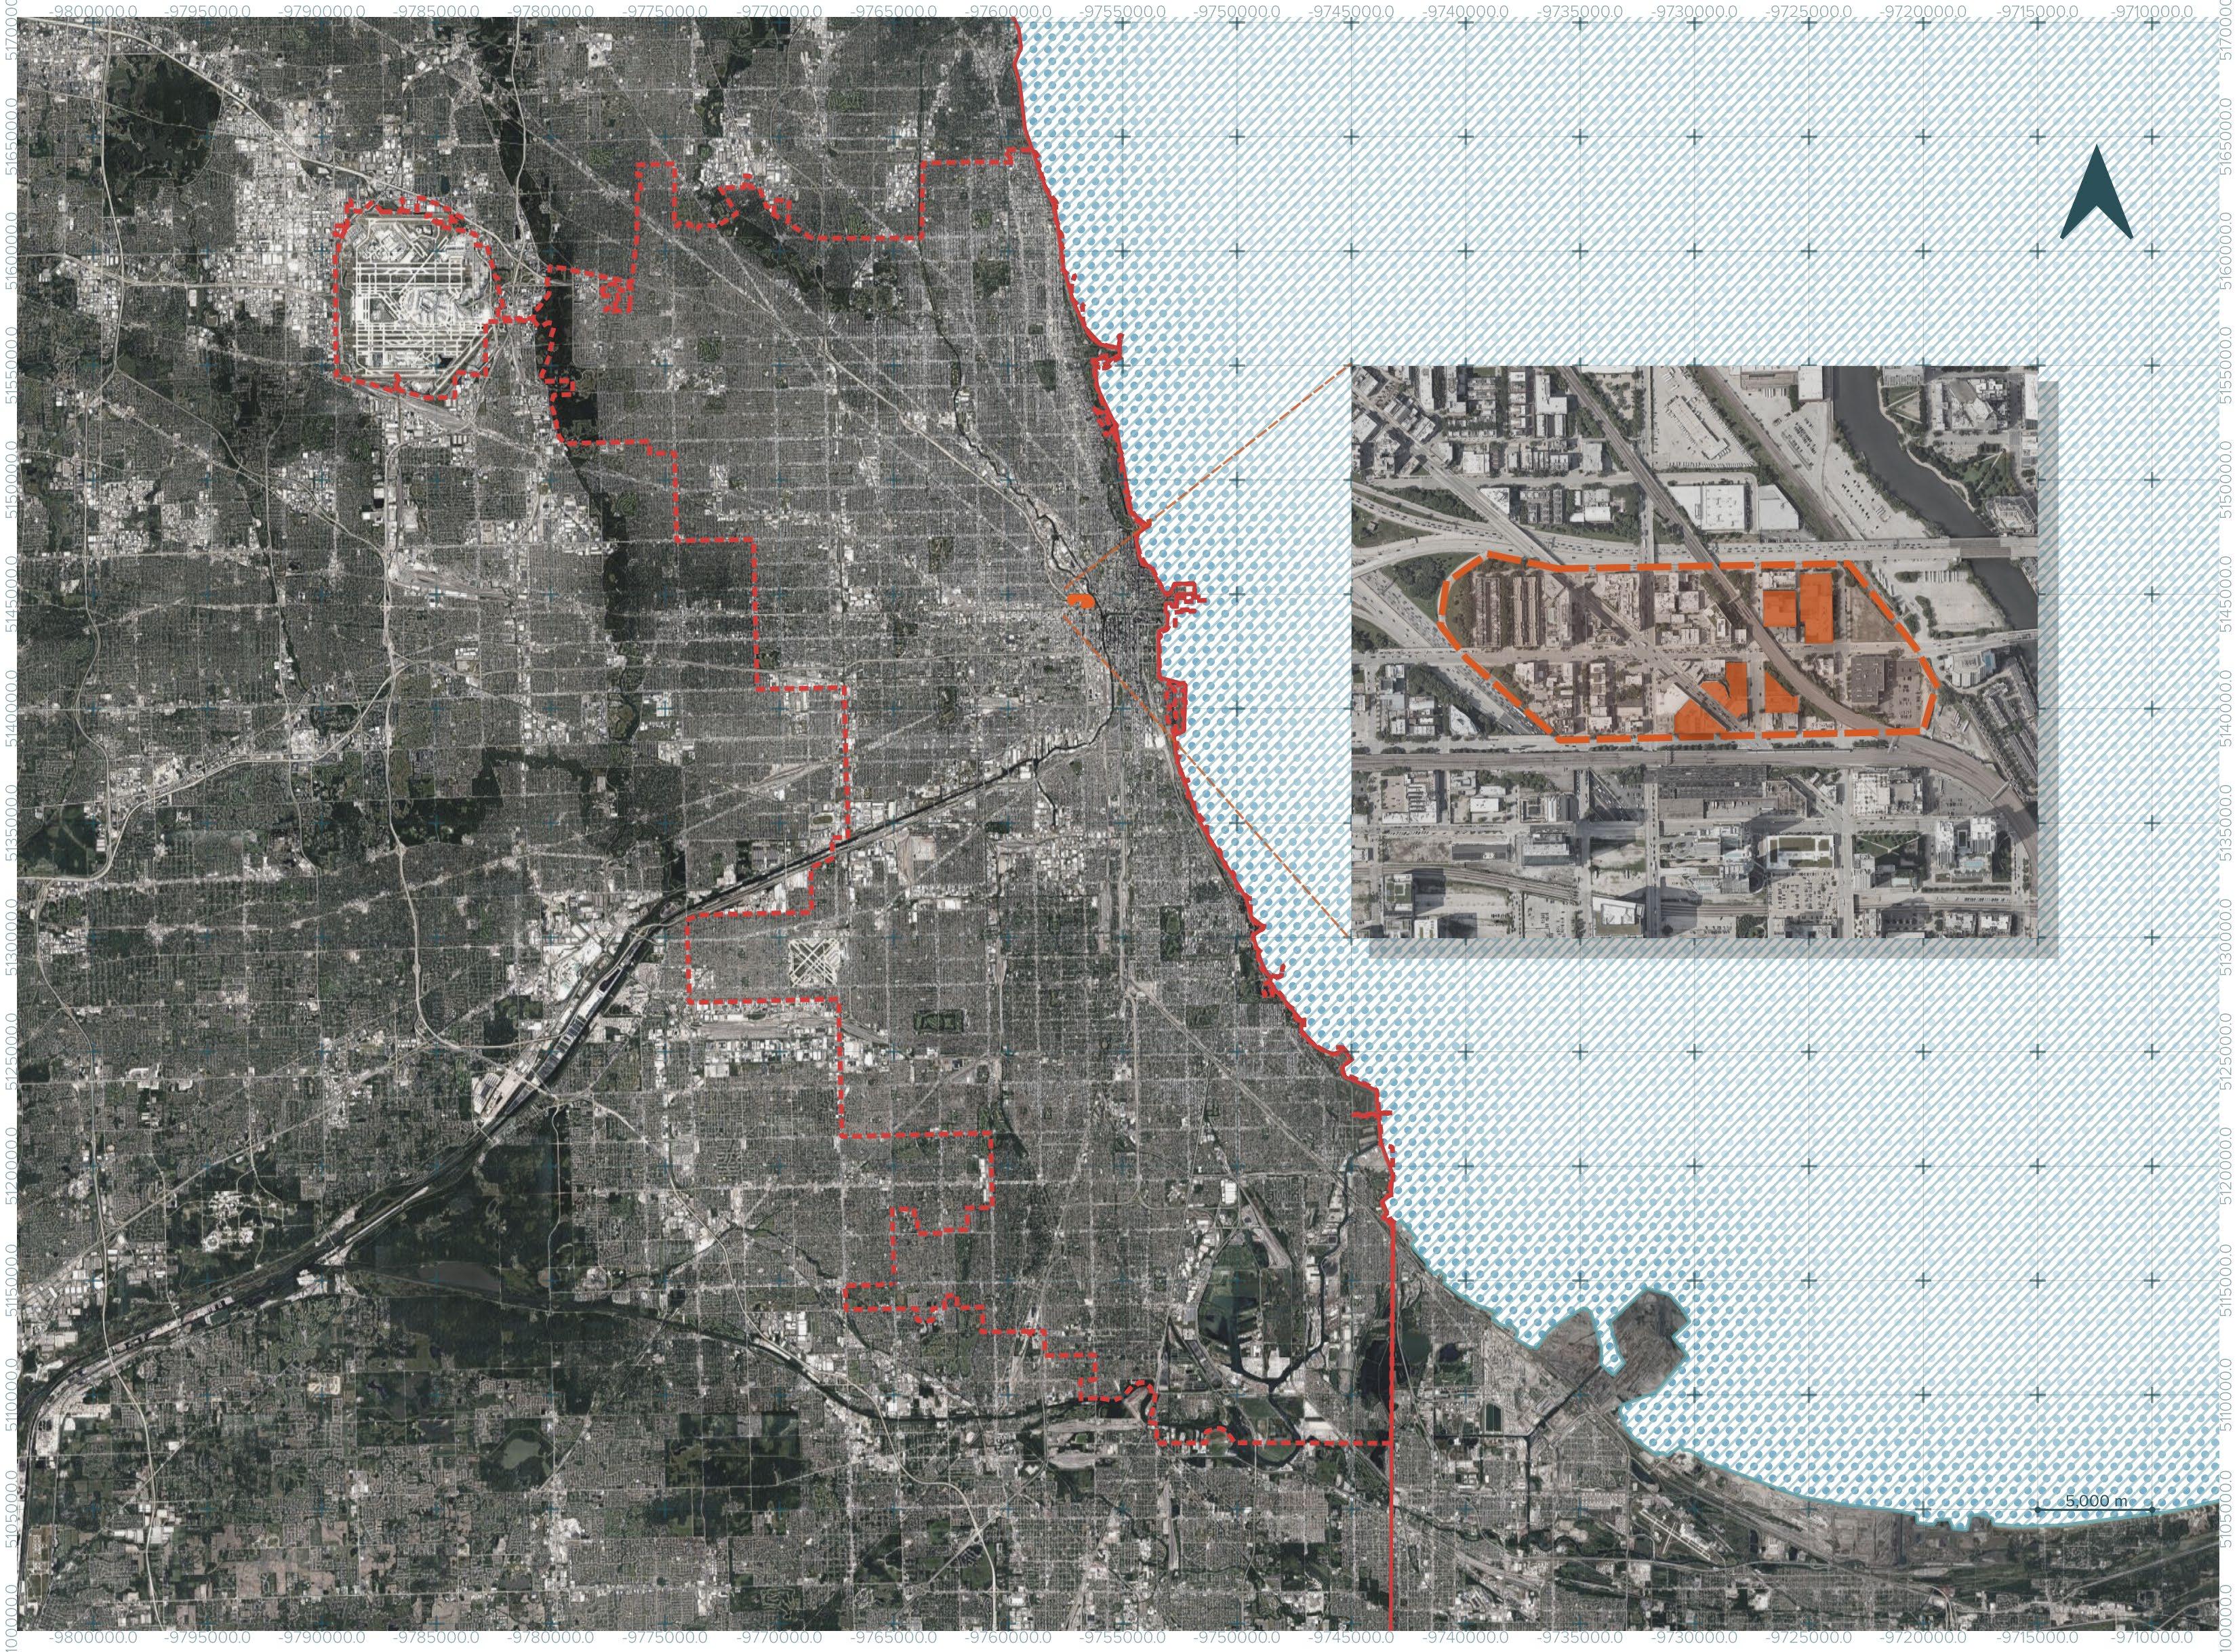
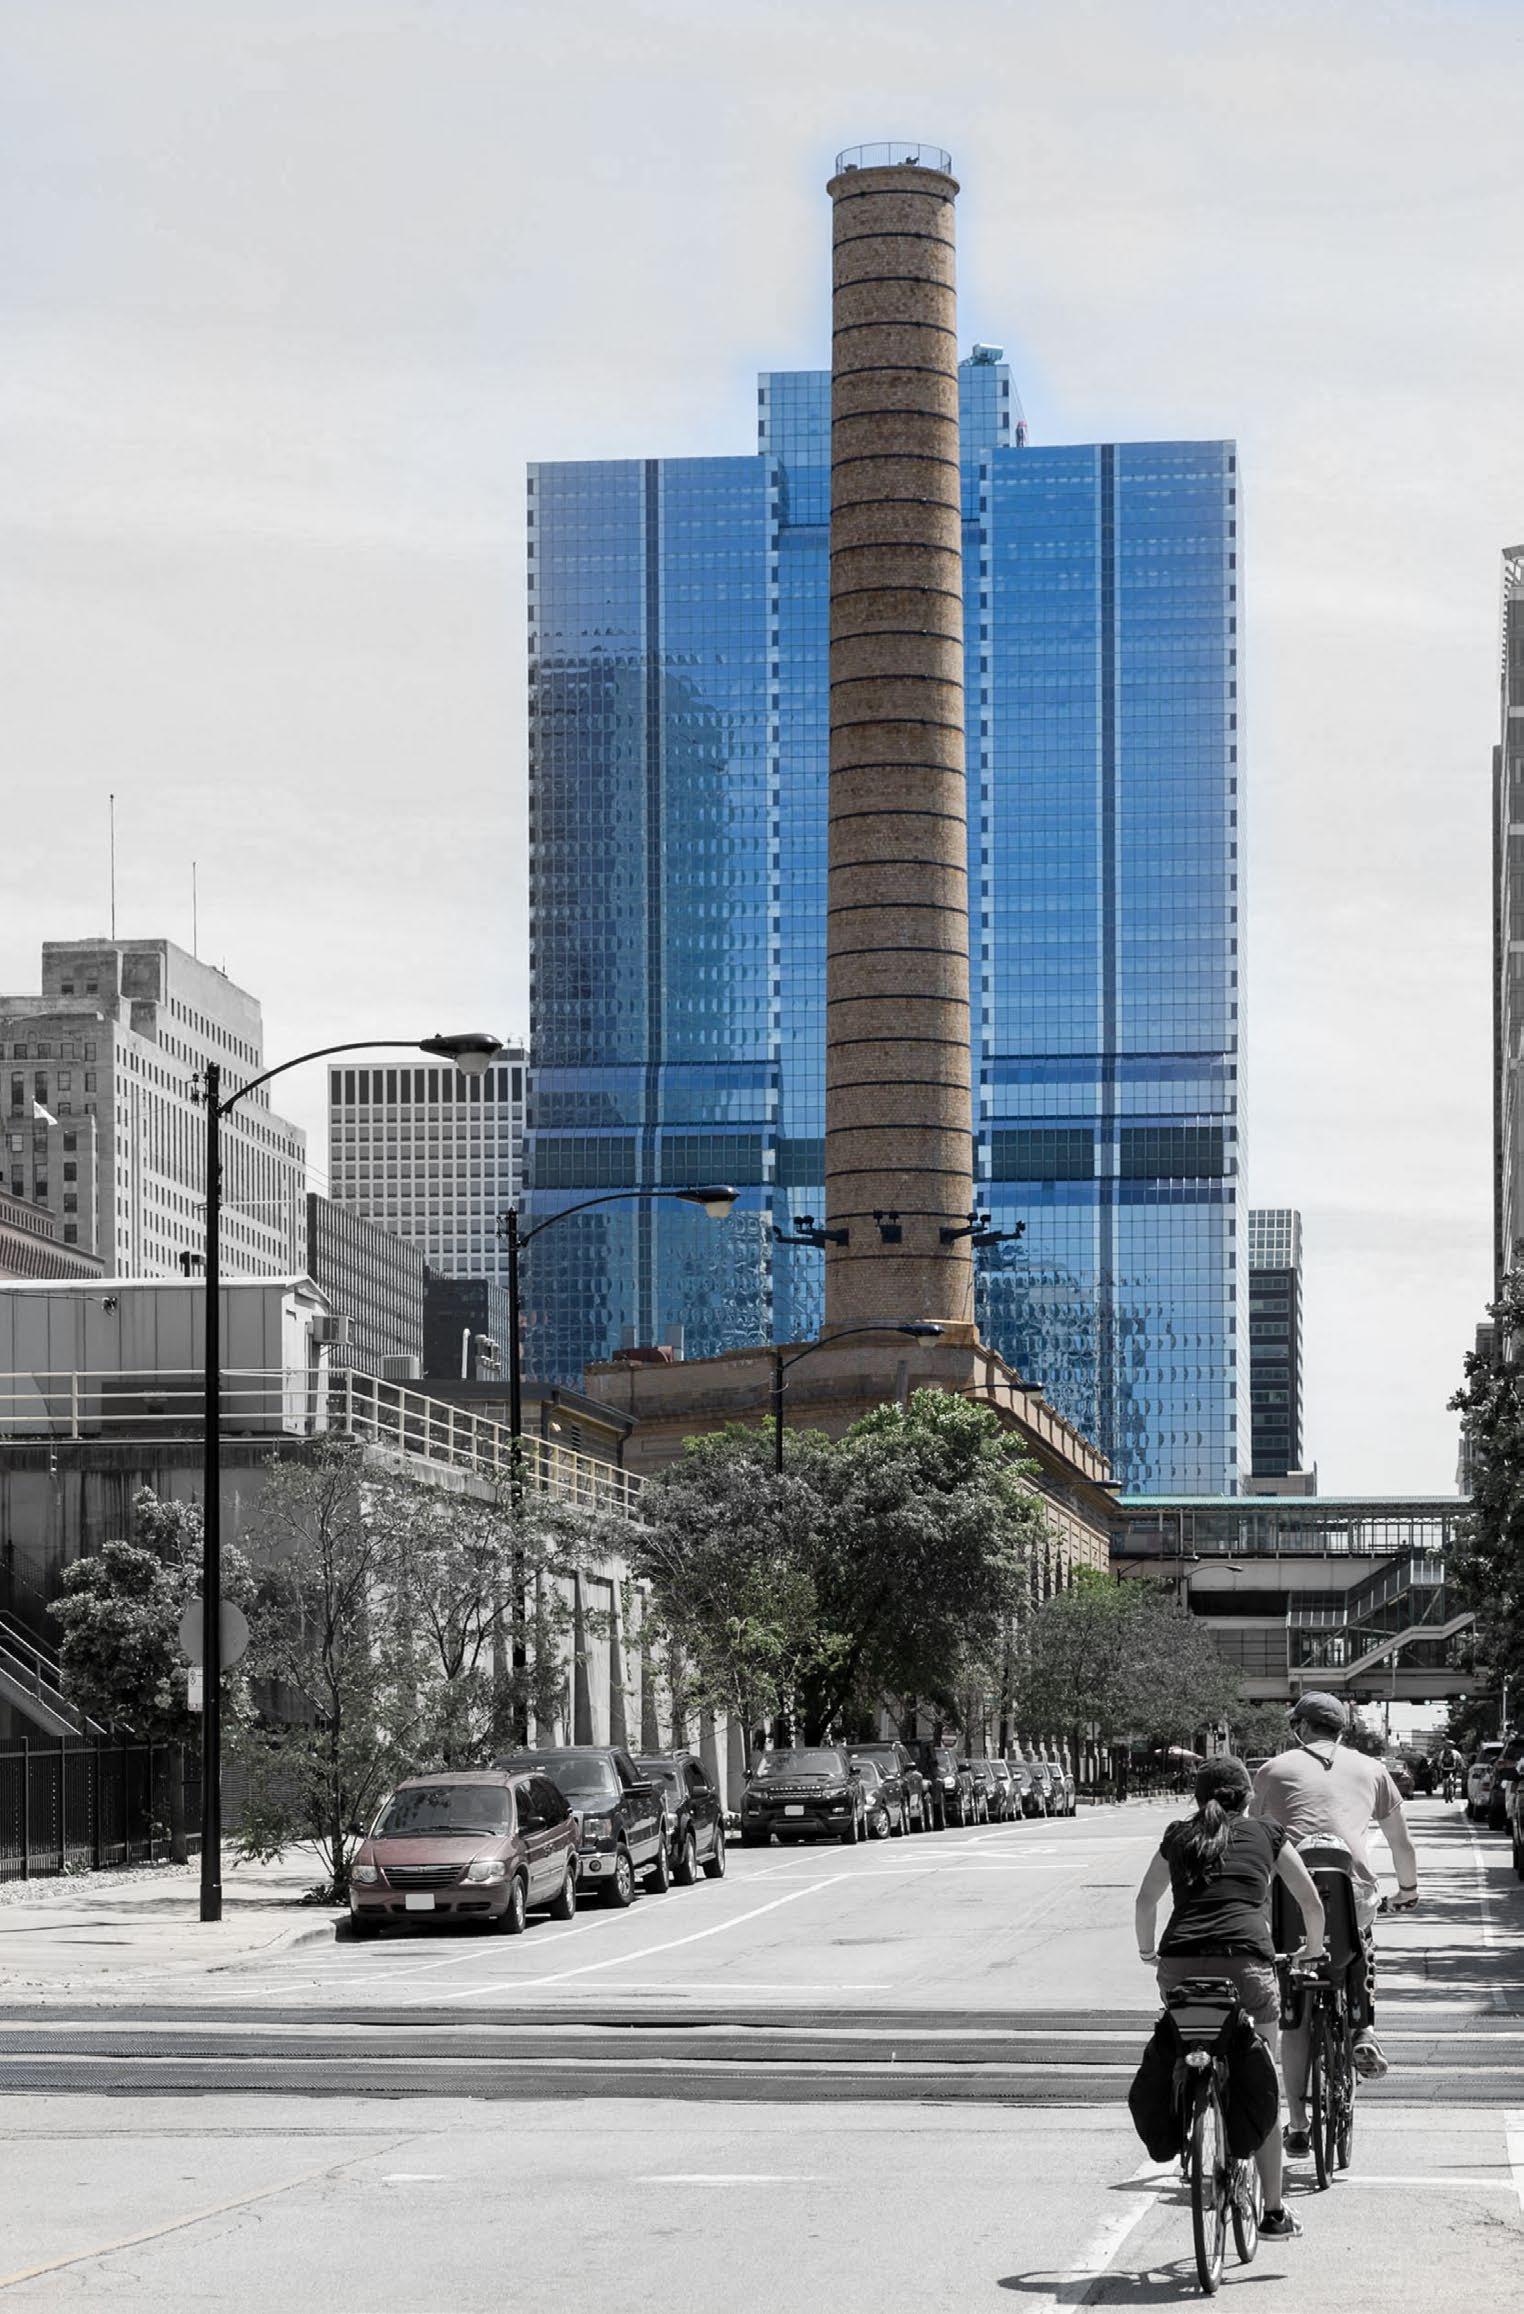
Site Context
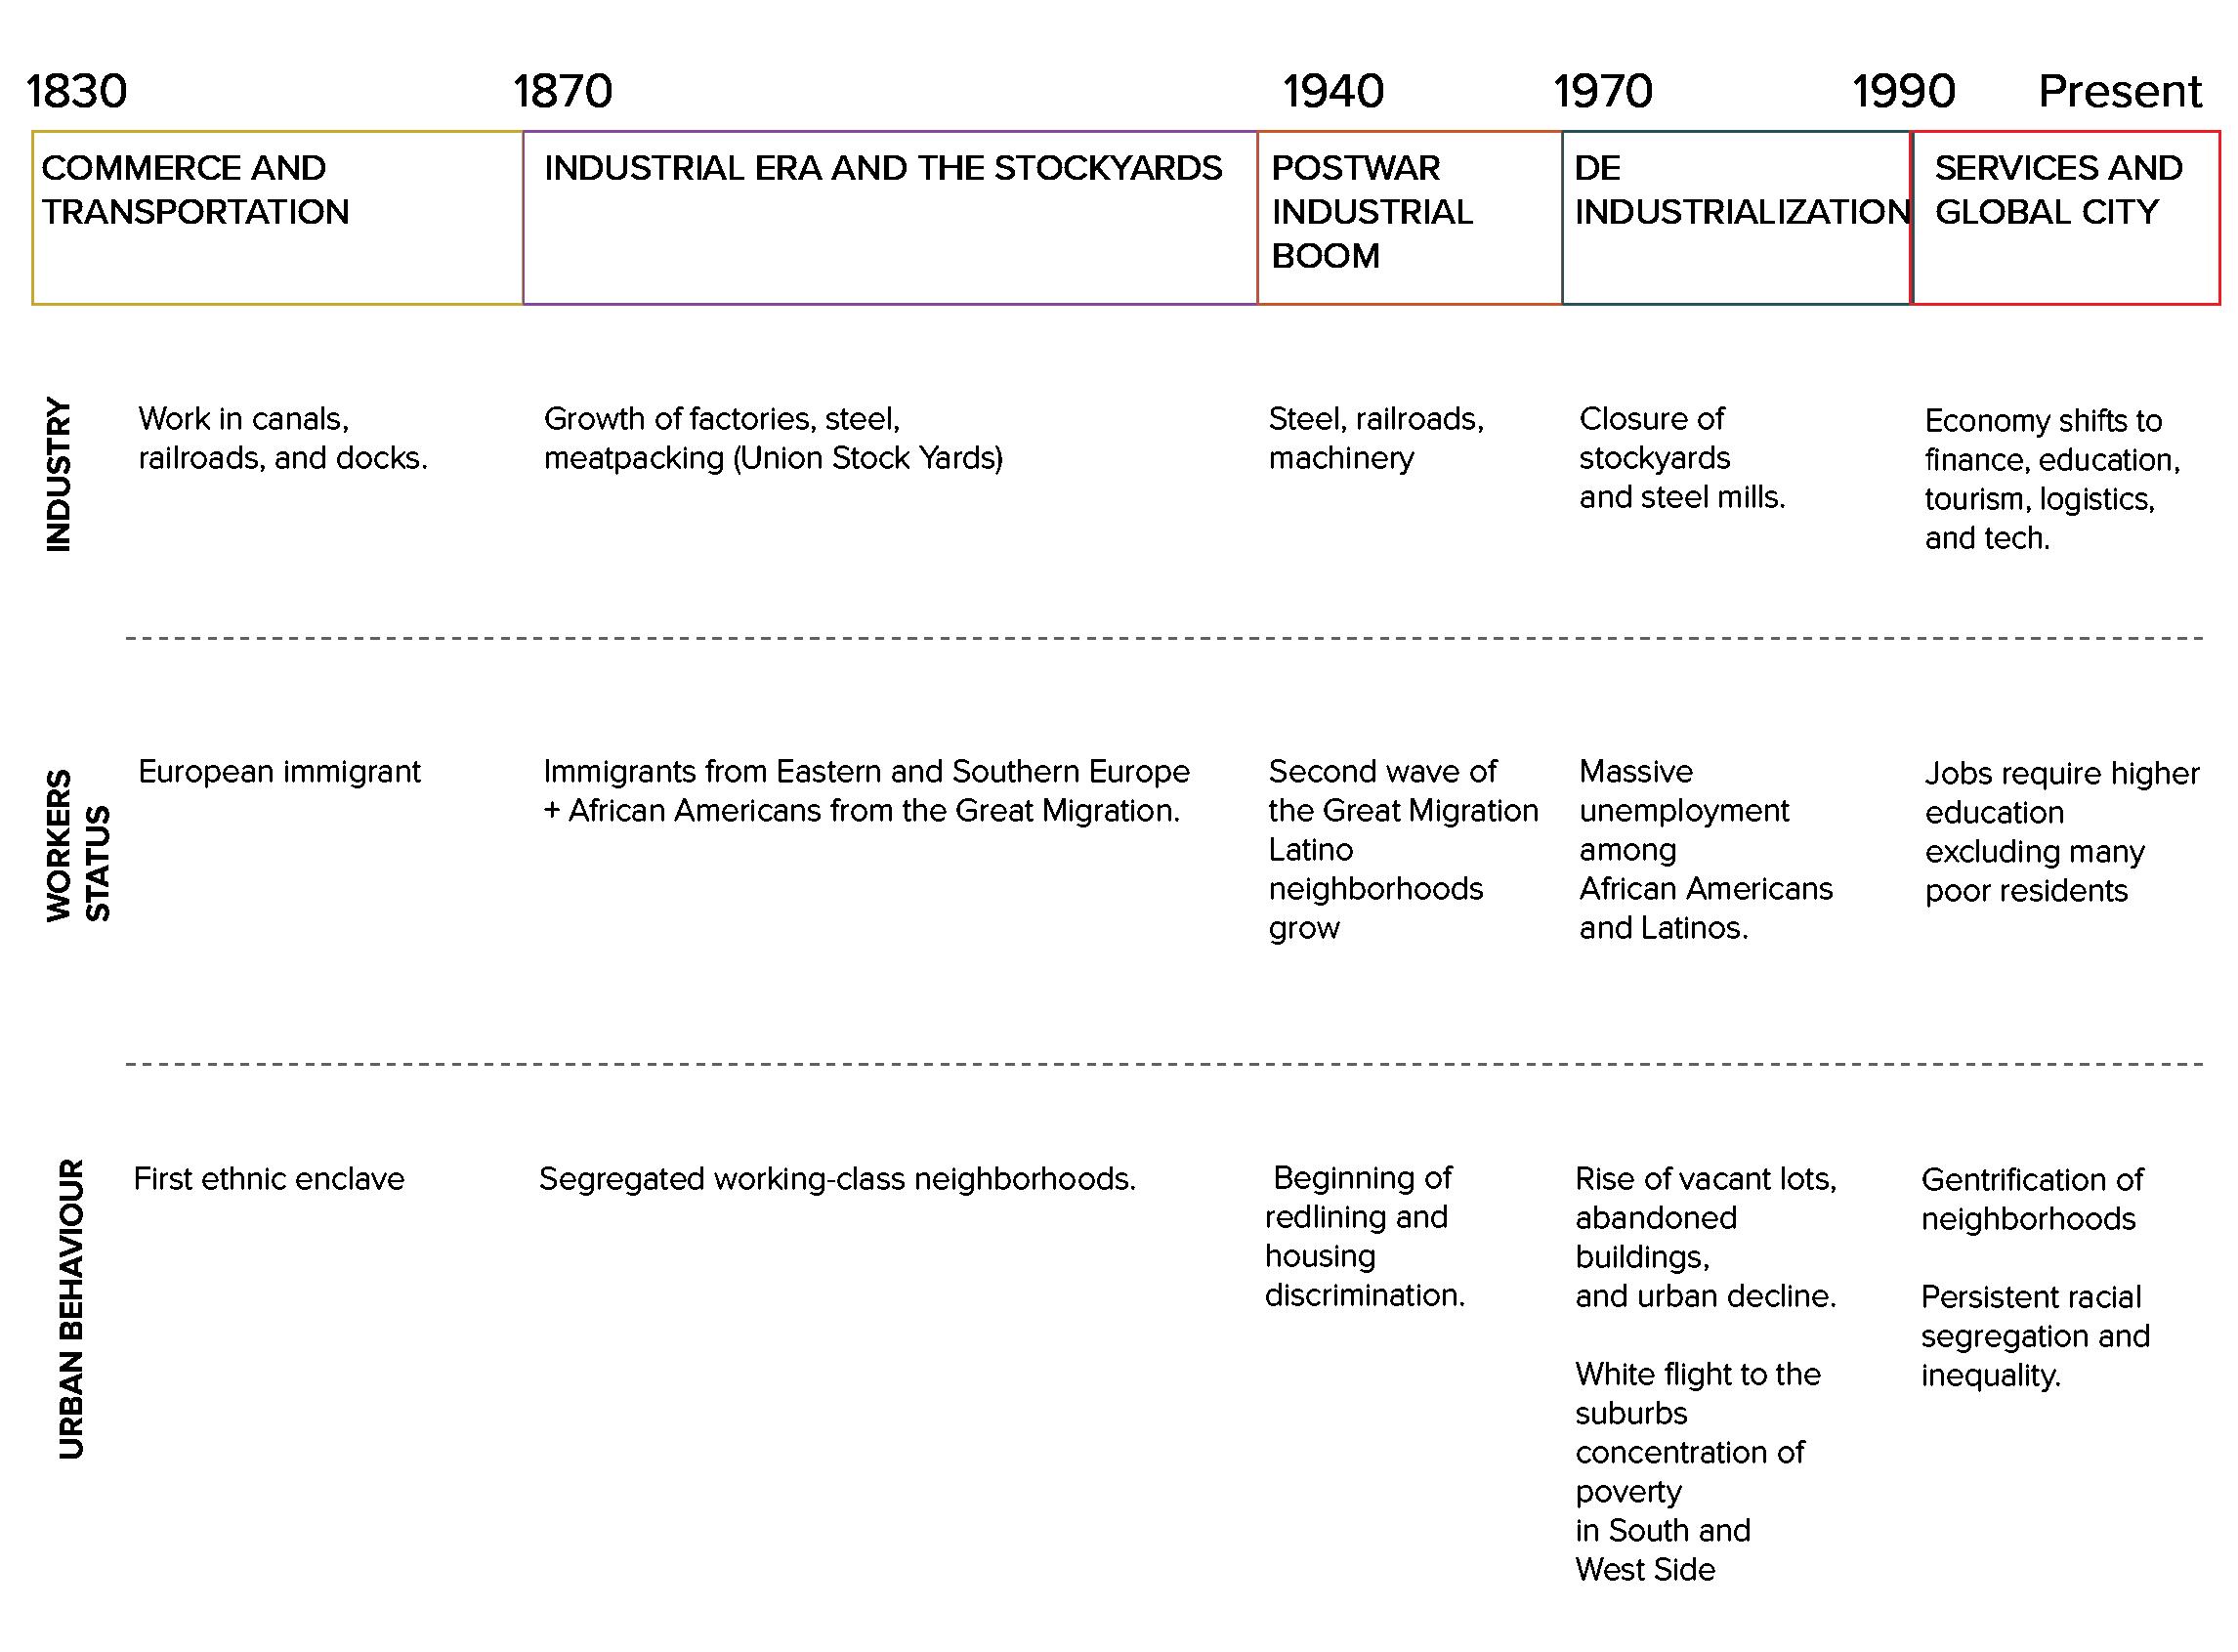
Located in the northwestern section of Chicago, near Downtown, the study area is marked by a predominantly White population and relatively high-income levels. Once characterized by warehouses, factories, and working-class immigrant communities, it has been restructured through processes of adaptive reuse and large-scale reinvestment. The transformation reflects the city’s broader shift from an industrial economy toward one defined by innovation, culture, and residential growth. Historic industrial buildings have been repurposed into offices, restaurants, and cultural venues, generating new economic activity in technology, dining, and the creative industries. At the same time, highdensity residential and commercial development has reinforced its role as a vibrant live-work environment.
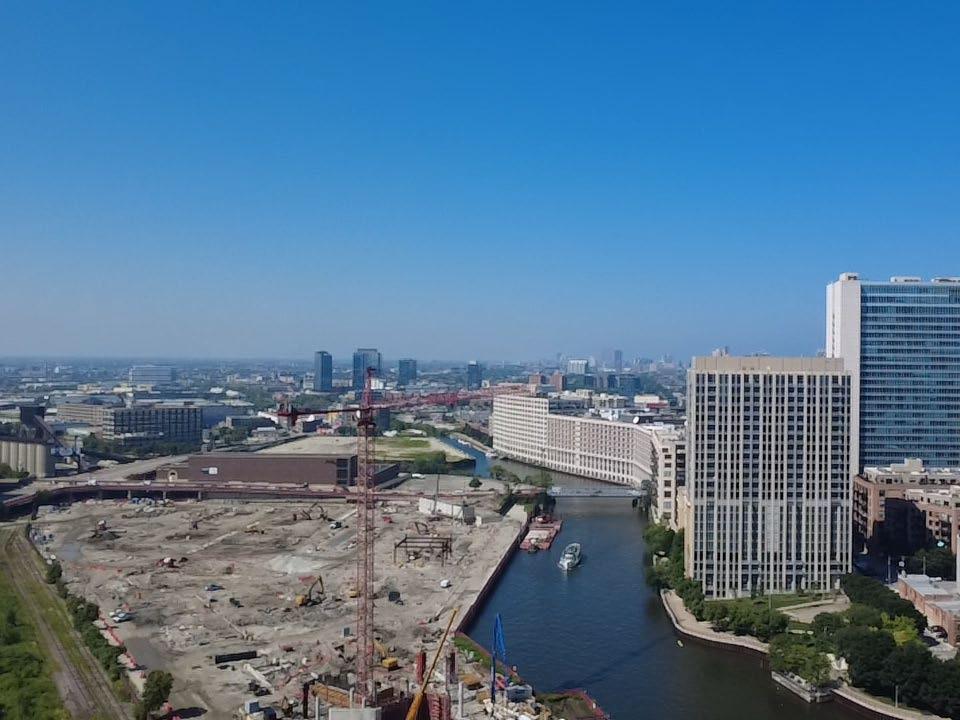
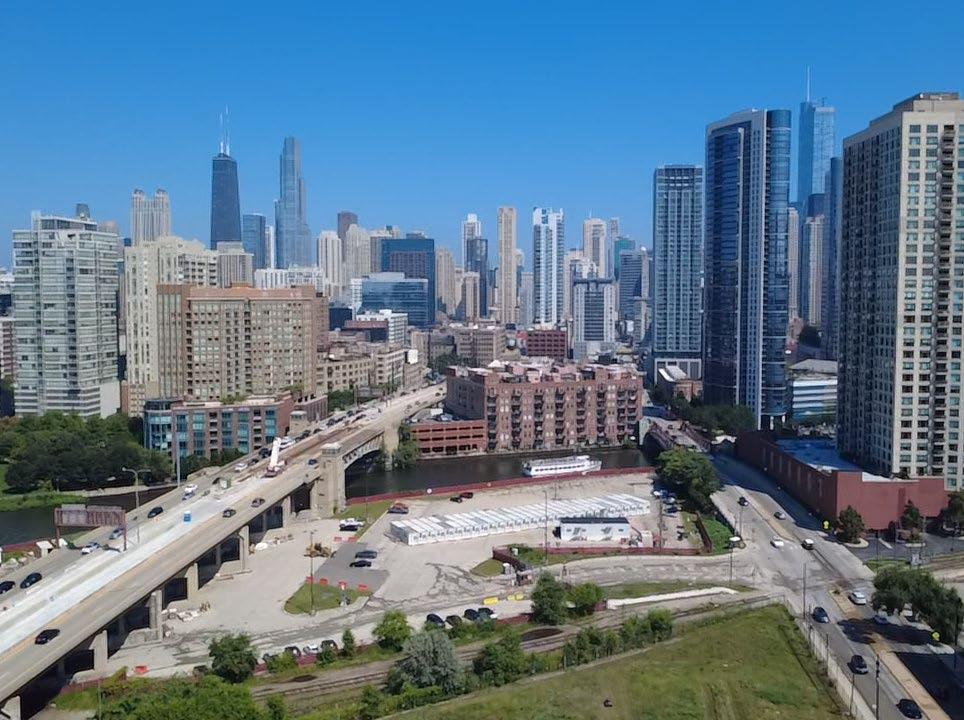
Figure 15. Aerial view
Figure 14. Aerial view
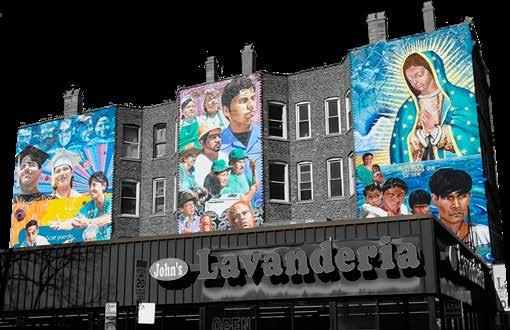
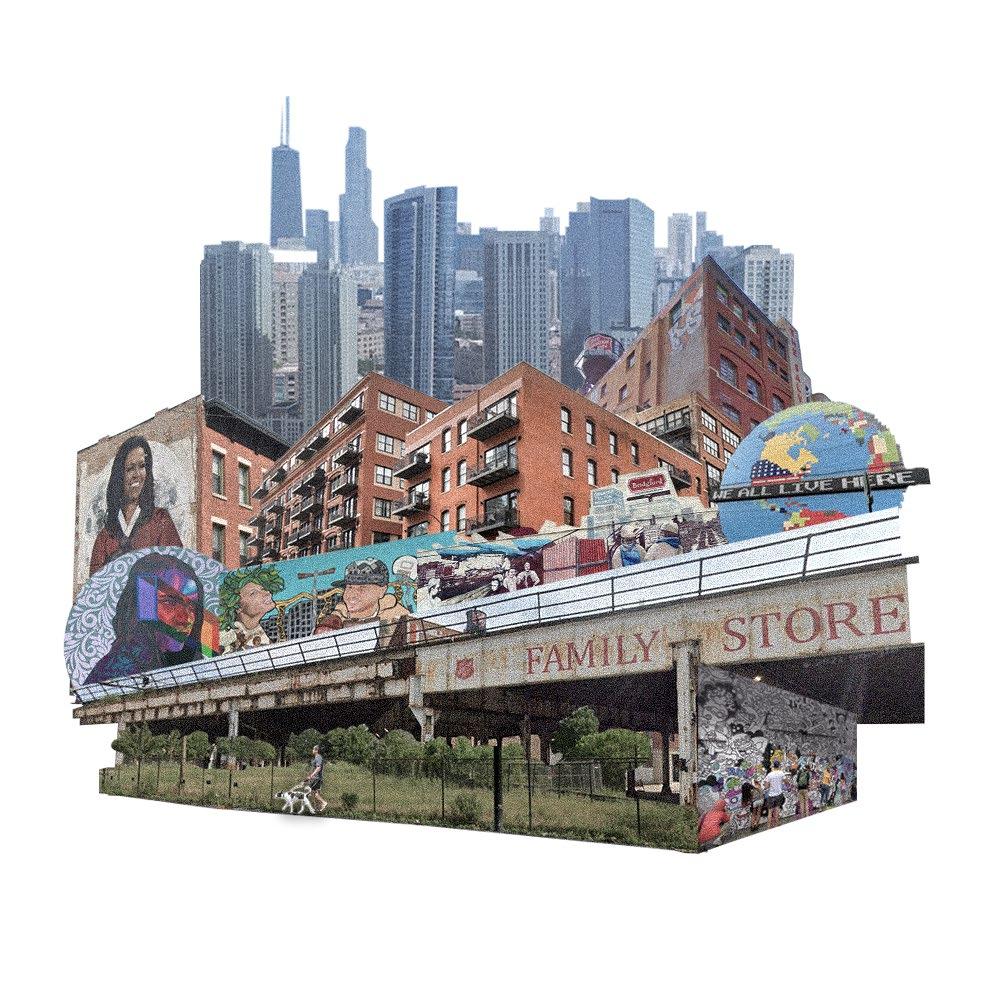
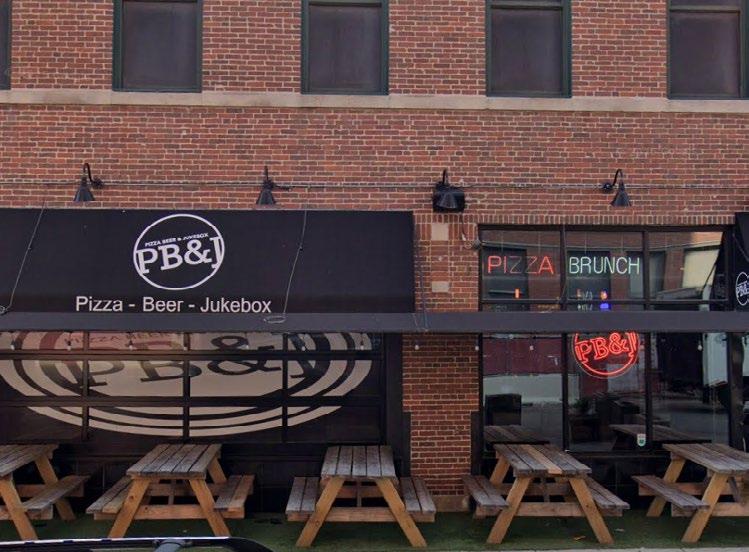
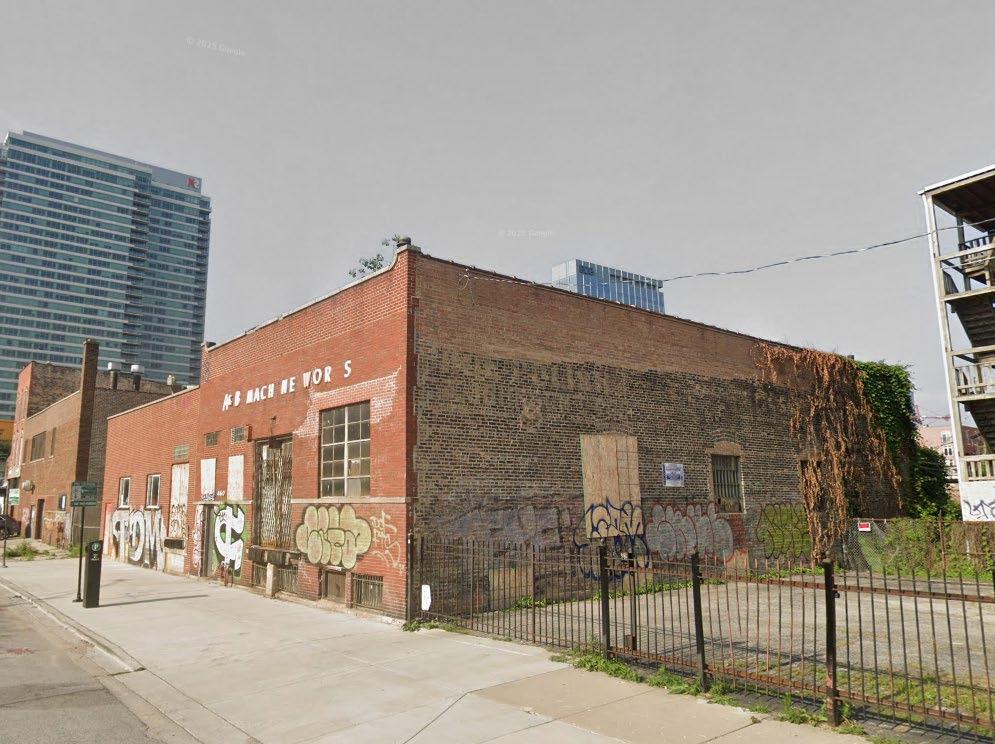
“An urban canvas where graffiti colors abandoned buildings, train tracks cut through the city fabric, and green spaces are scarce, shaping a raw and vibrant local identity.” Essence
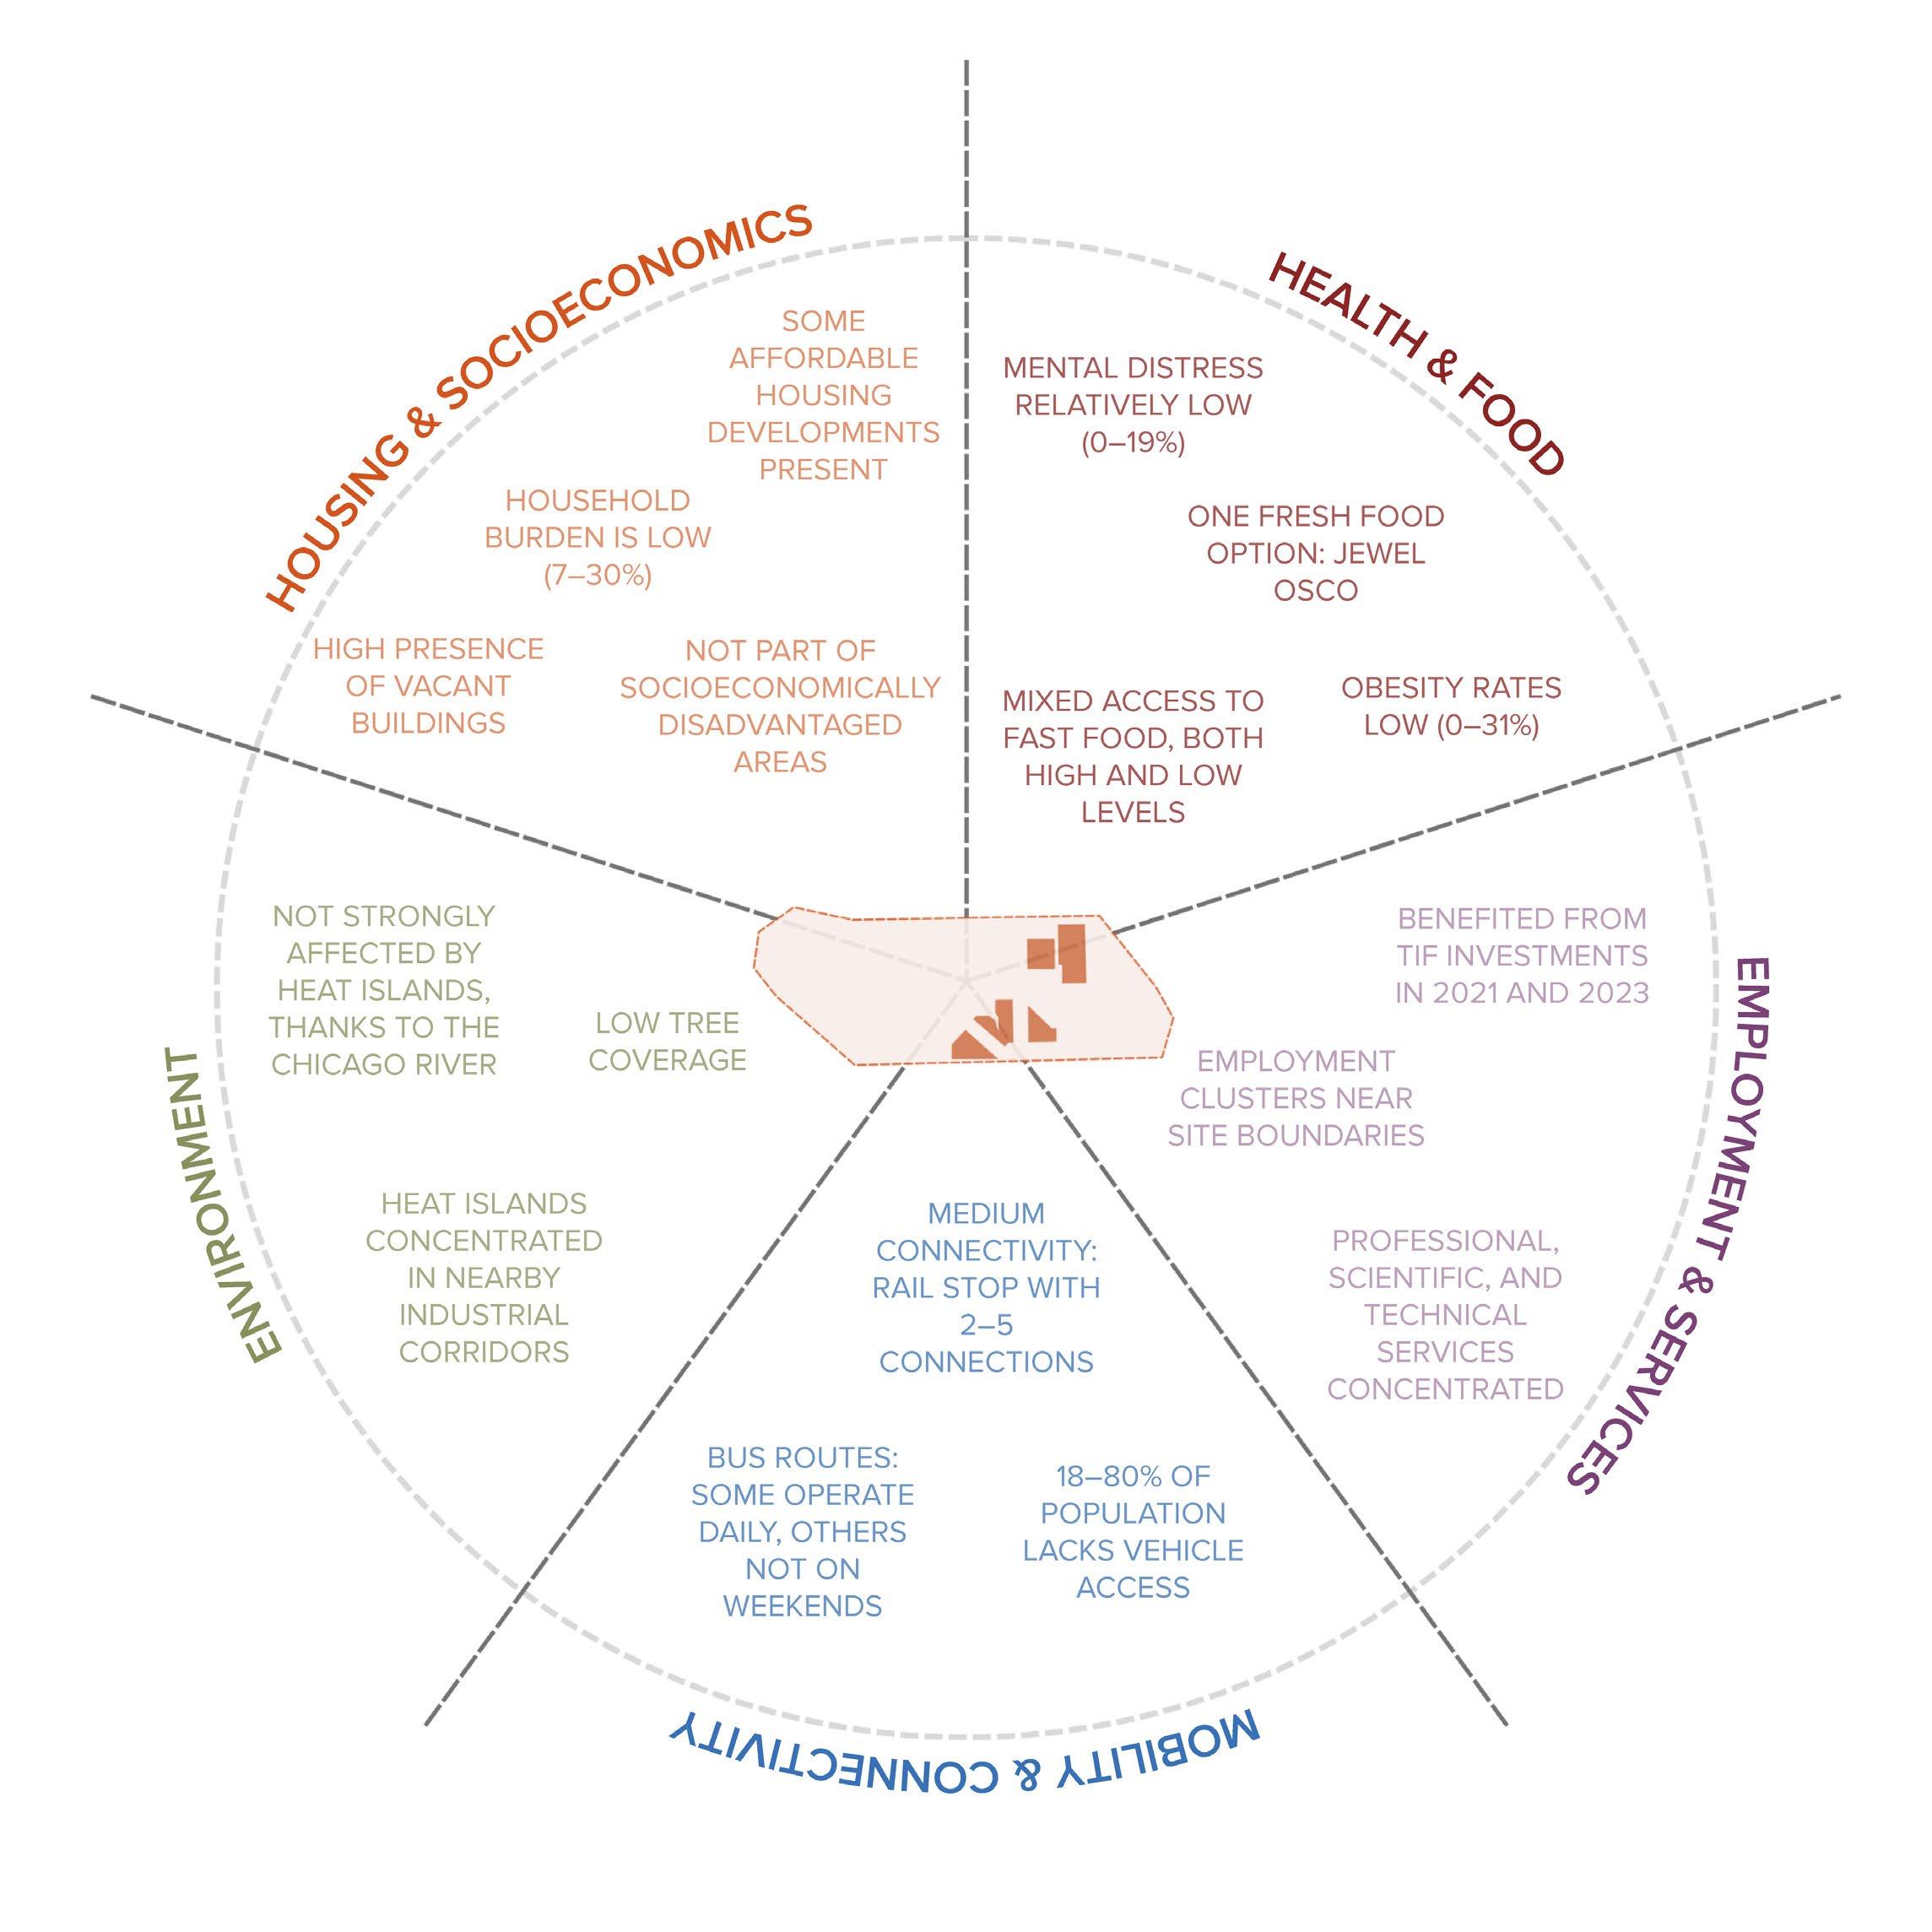
Local Conditions and Patterns
Key characteristics of the study zone include housing availability, health indicators, food access, employment clusters, mobility, and environmental features. Low household burden, moderate connectivity, limited tree coverage, and the presence of vacant buildings reveal how city-level patterns translate to this local context.
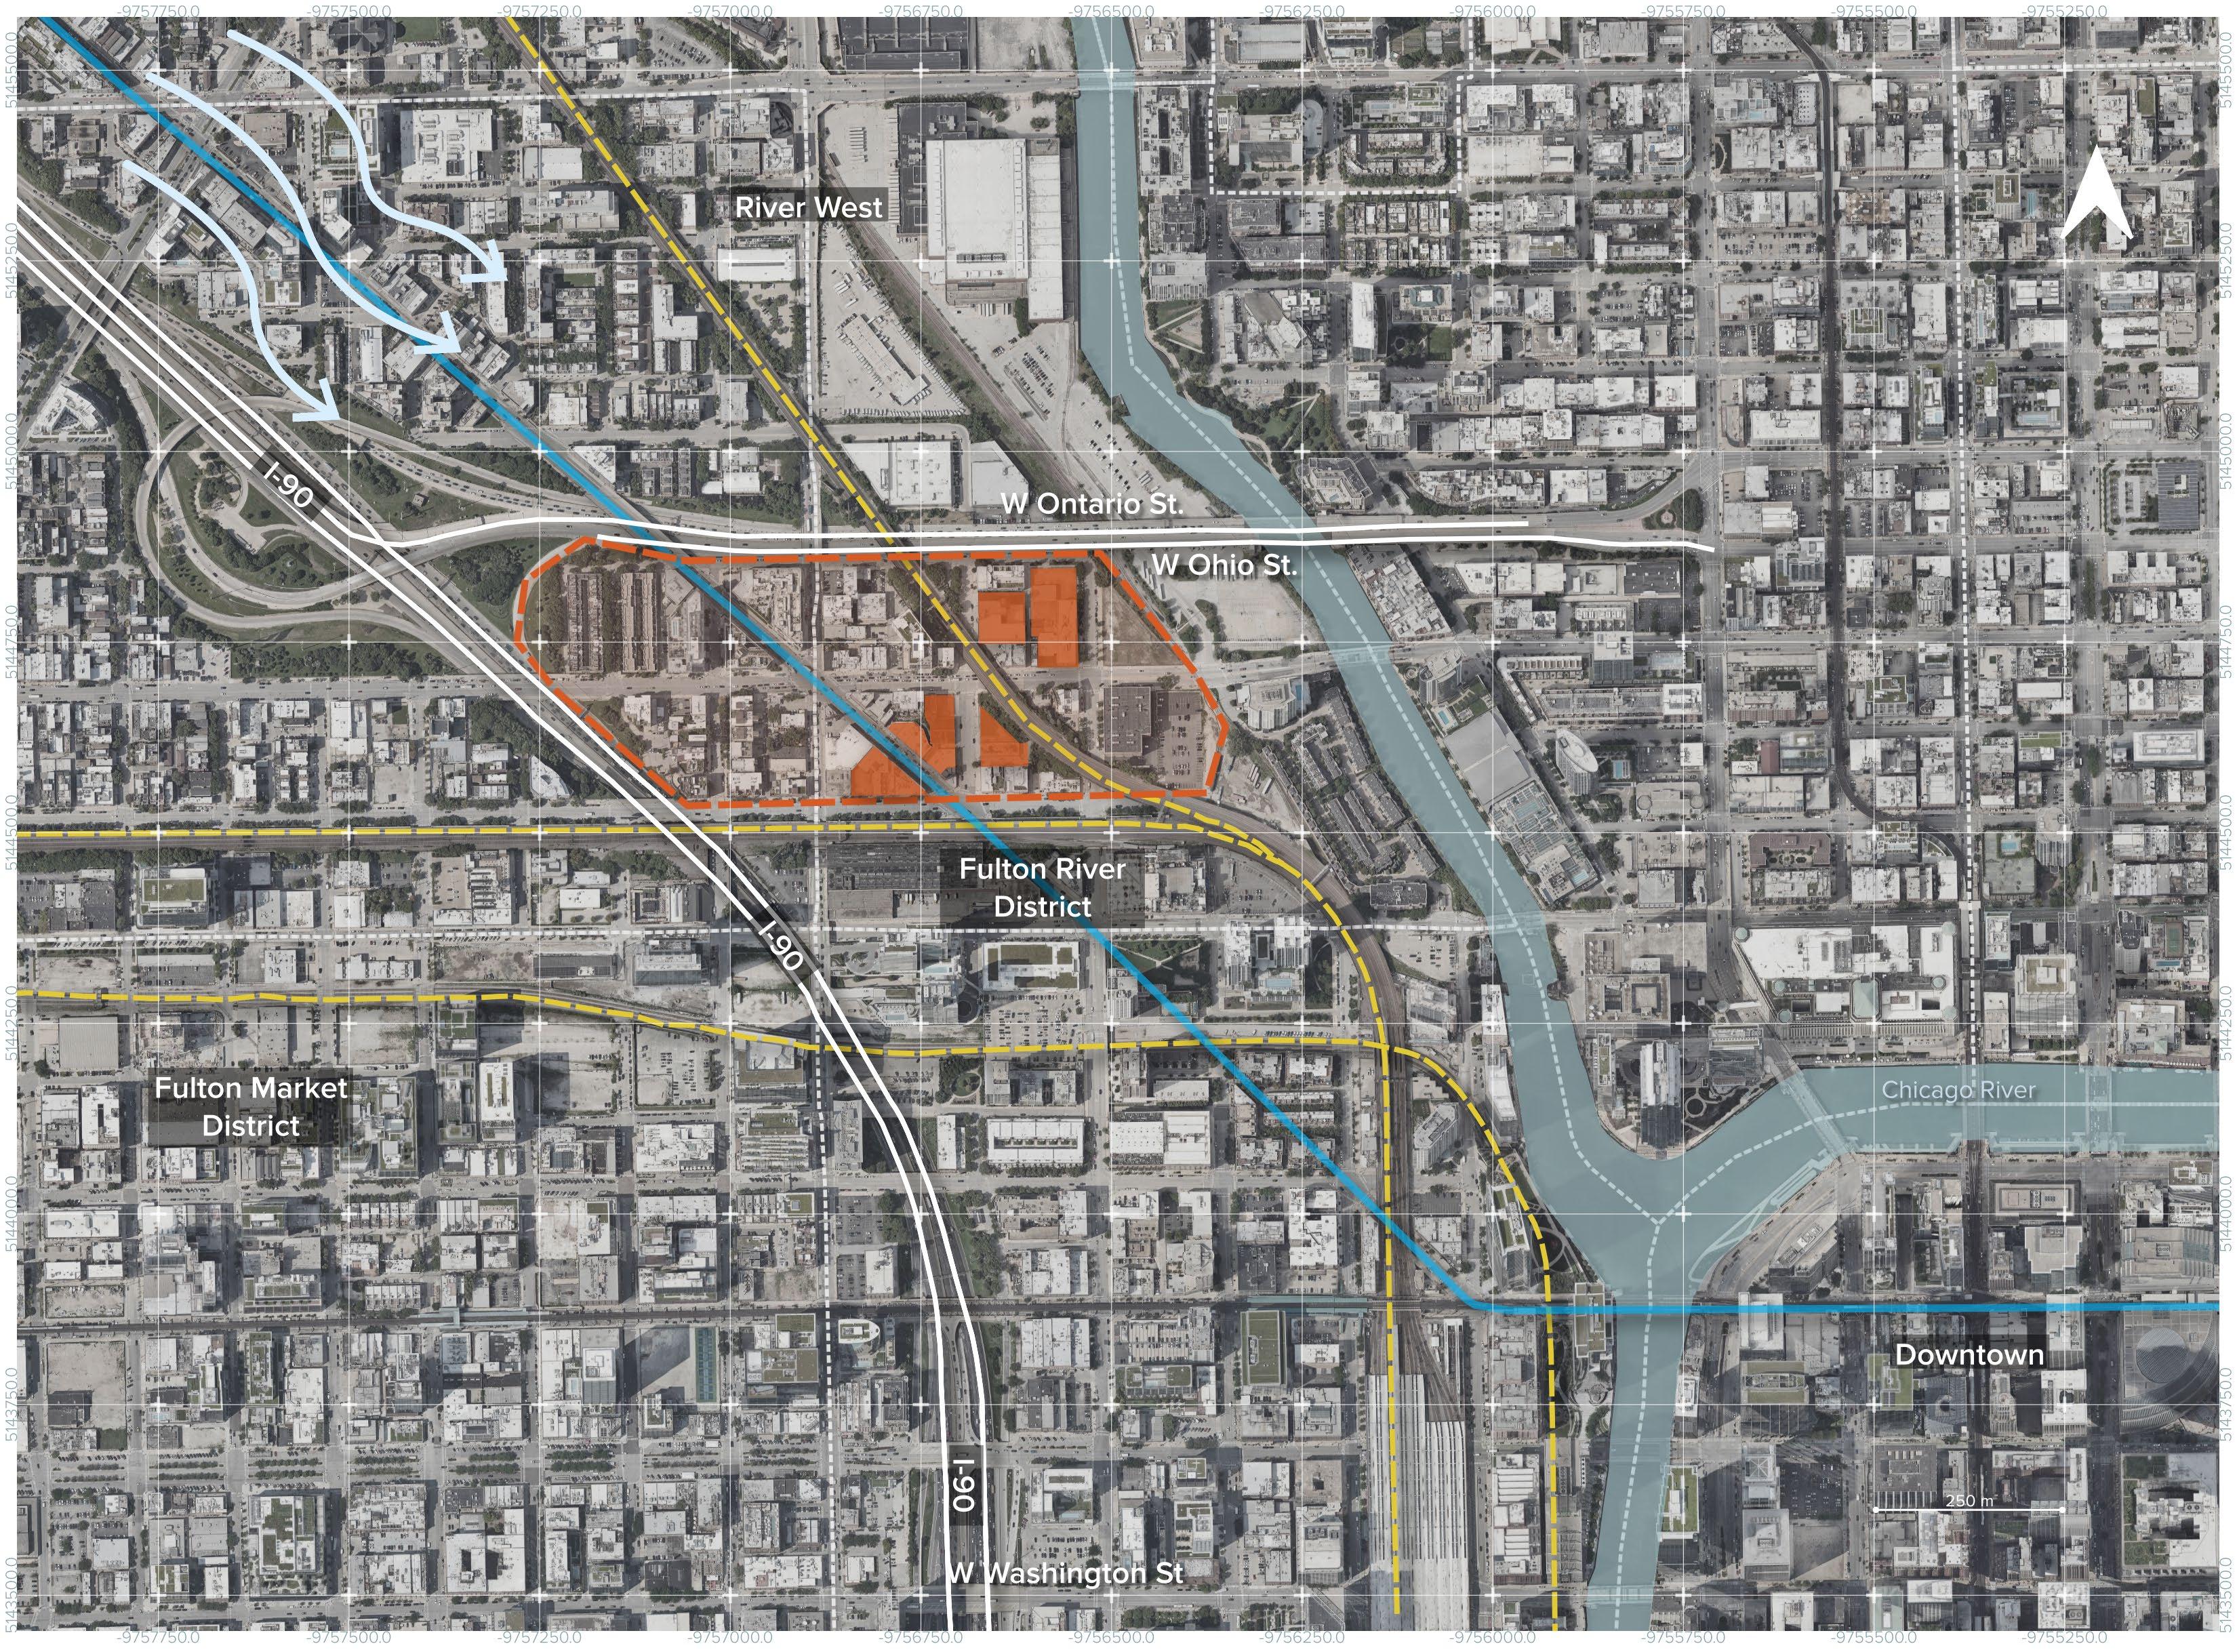
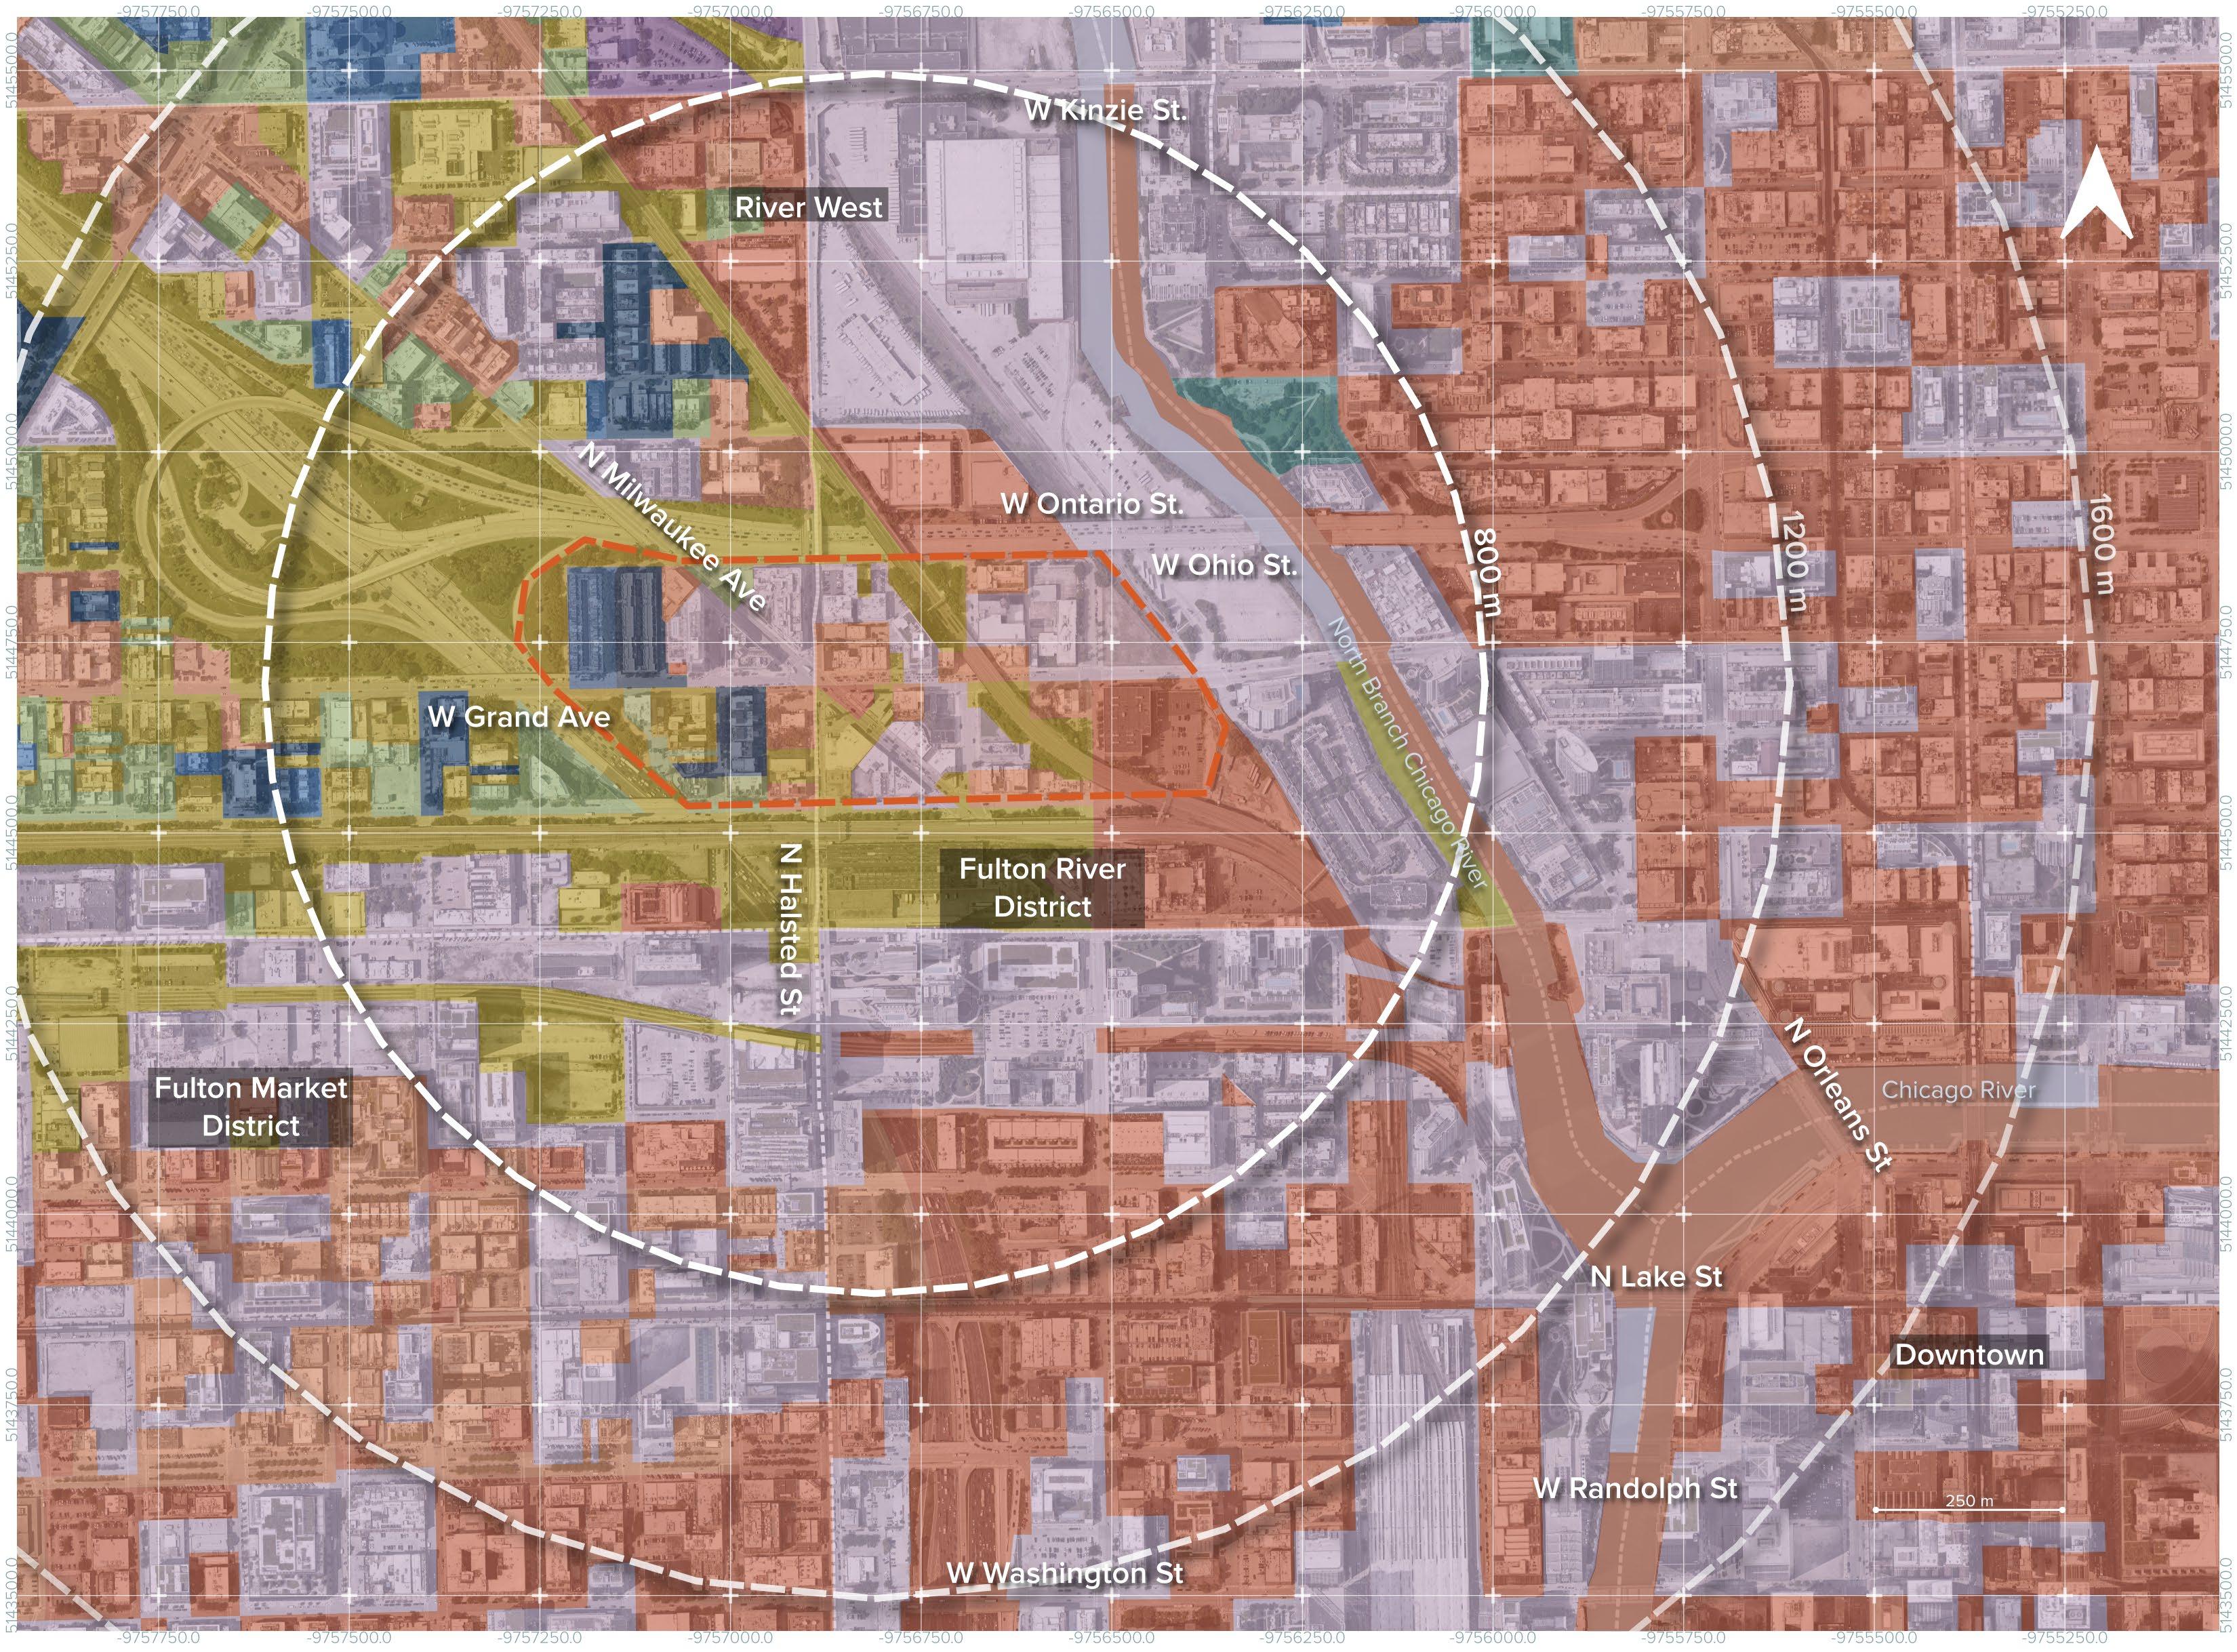
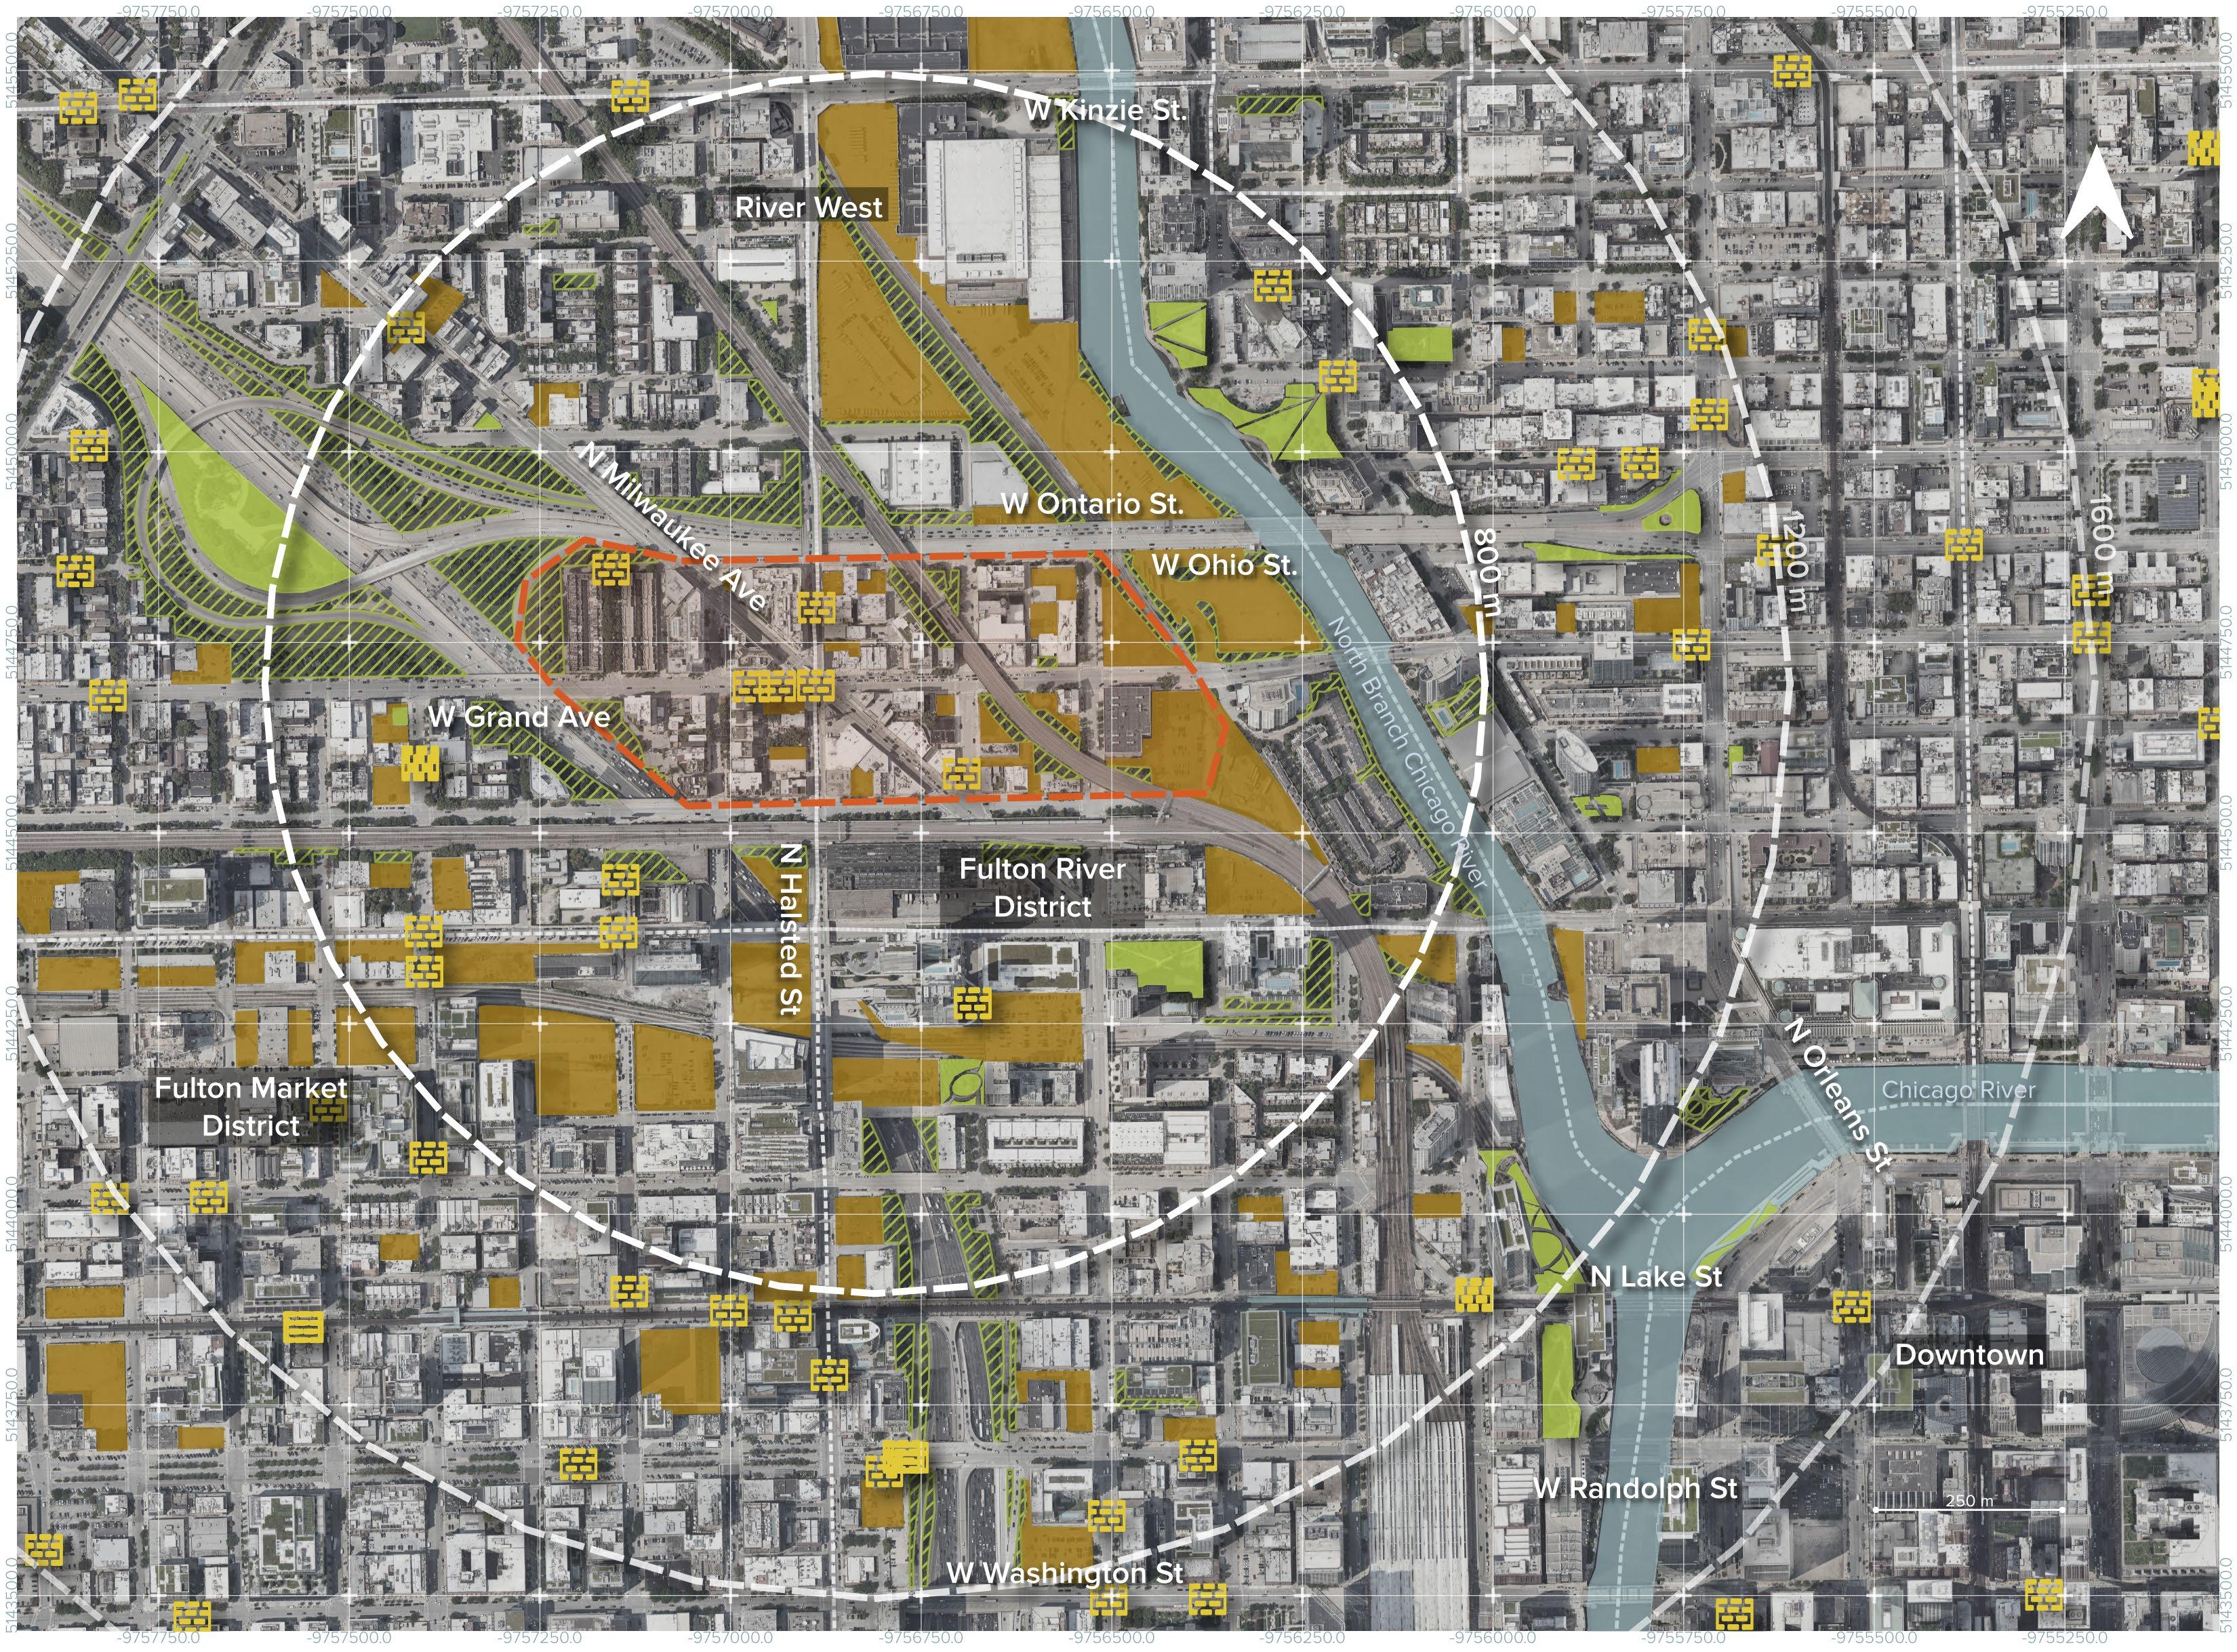
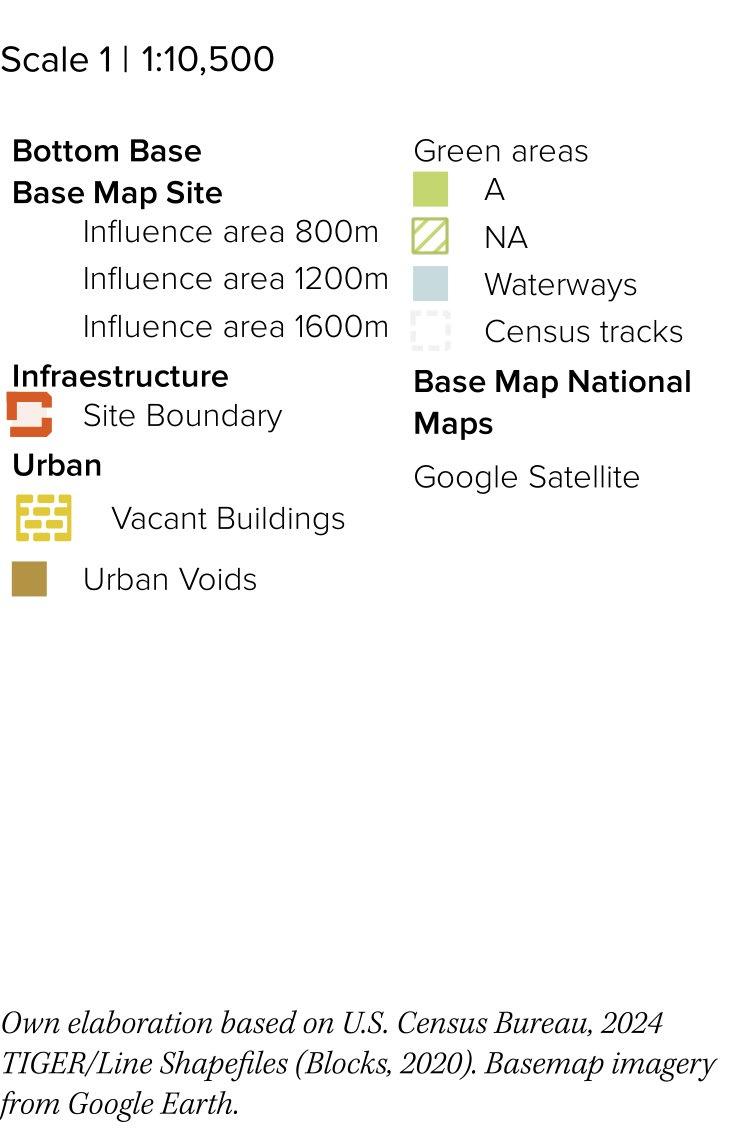
Site Overview
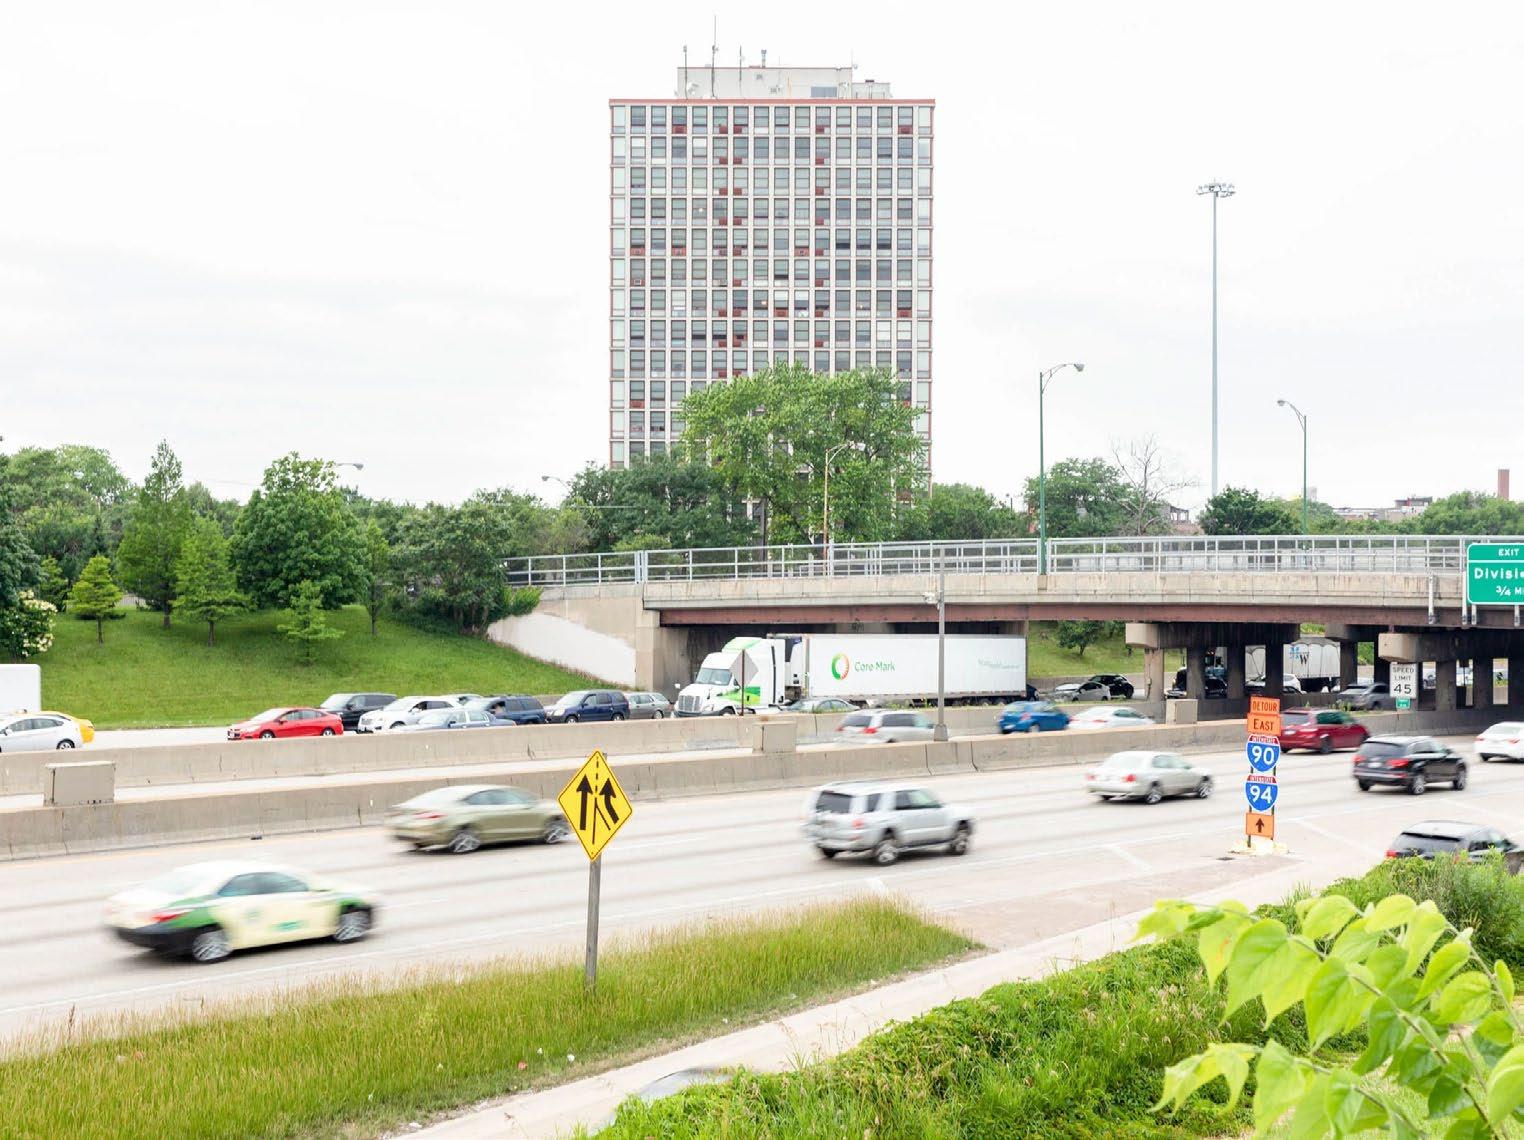
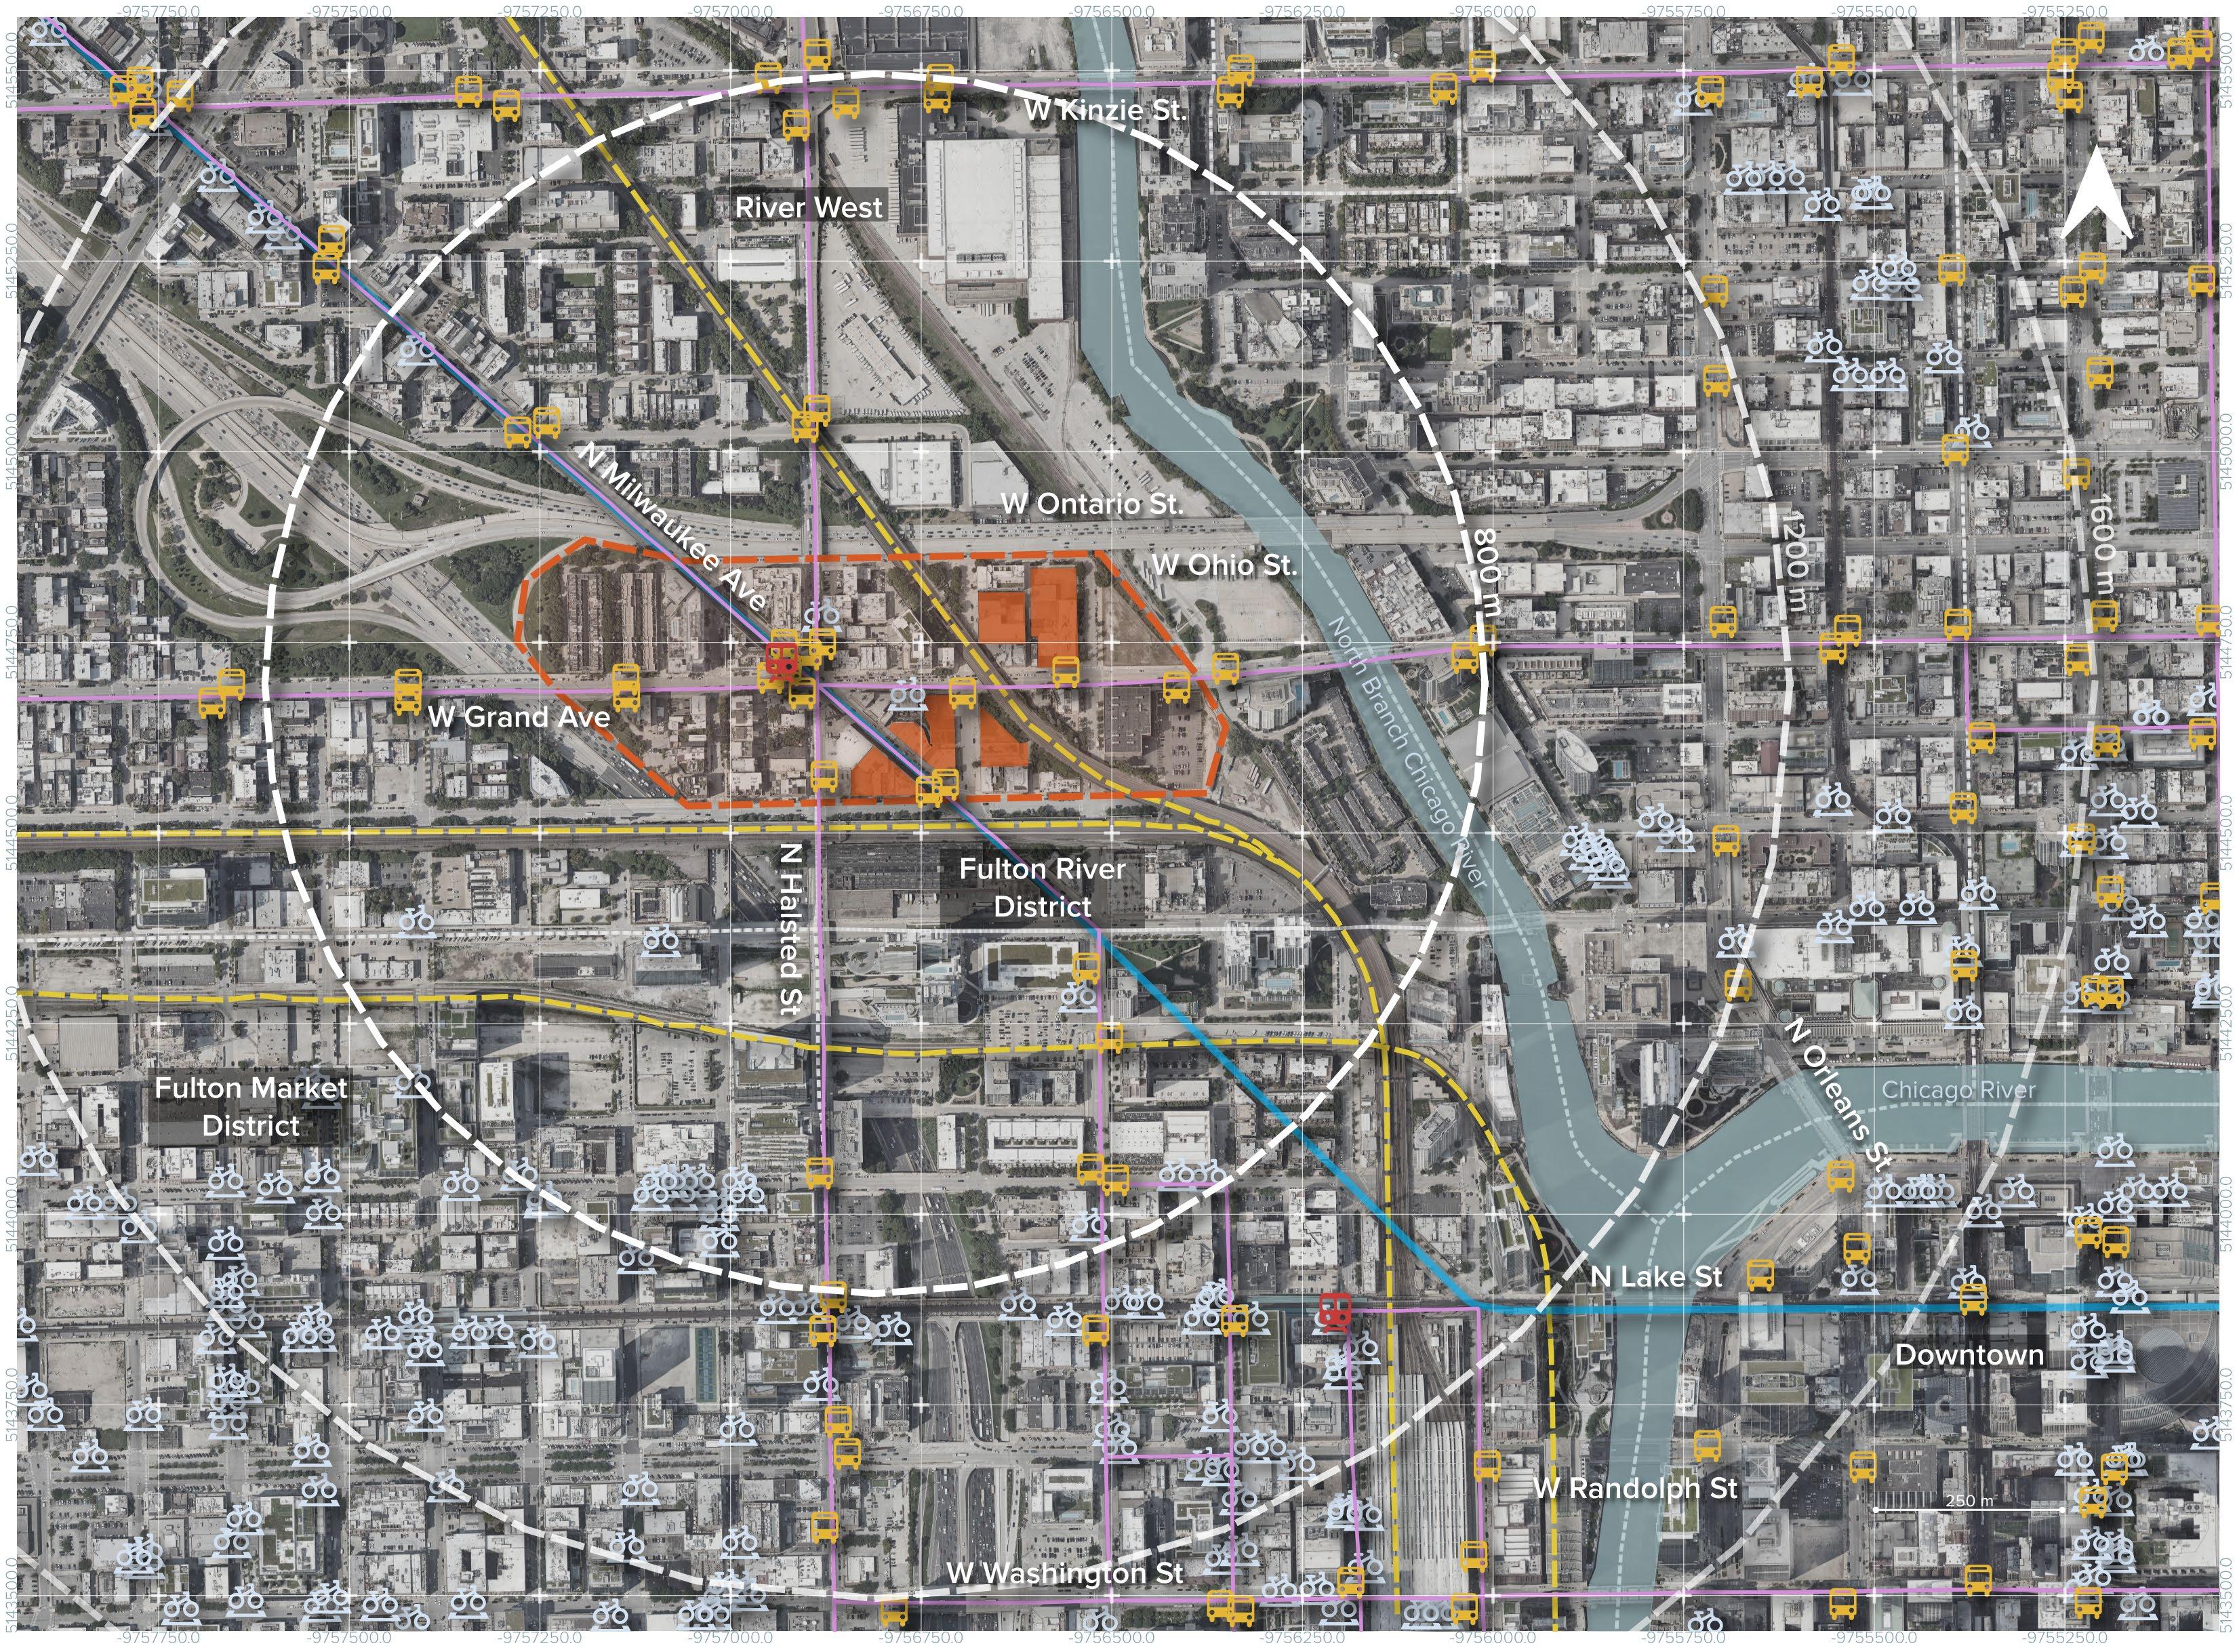
The study area is located within the Fulton River District and sits at the intersection of four Census Tracts, in proximity to the neighborhoods of River West, Fulton Market District, and Fulton River District South. Encompassing approximately 14 hectares (about 35 acres), it is bounded by two major thoroughfares (the I-90 highway and the streets connecting to Downtown, W Ontario Street and W Ohio Street) and is intersected by two rail lines that pass directly through the site. Its proximity to the Chicago River further shapes the spatial and environmental context of the area.
Figure 16. Google Maps (2025).
Figure 17. trulia.com
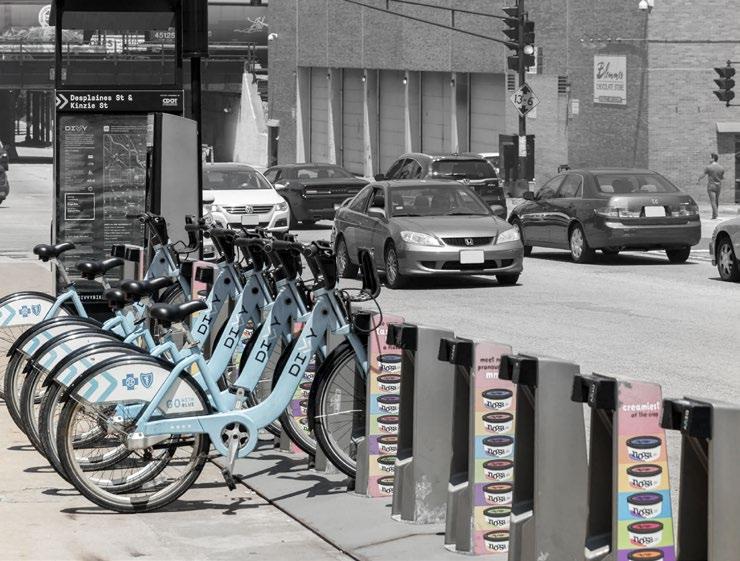
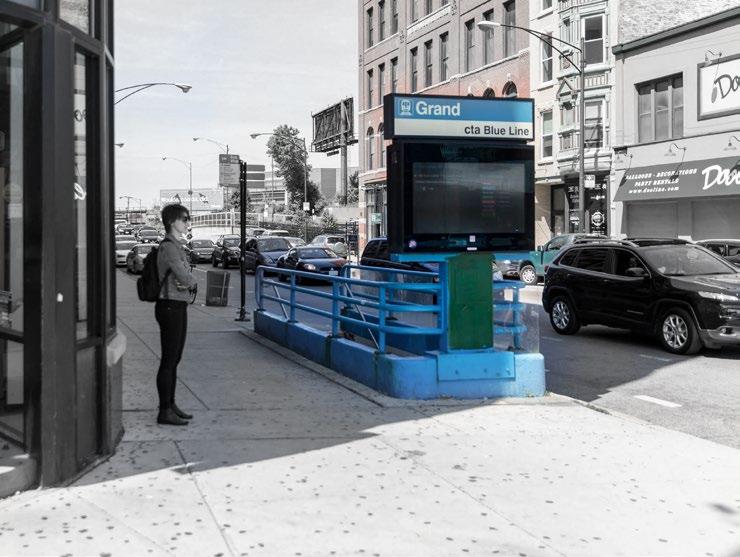
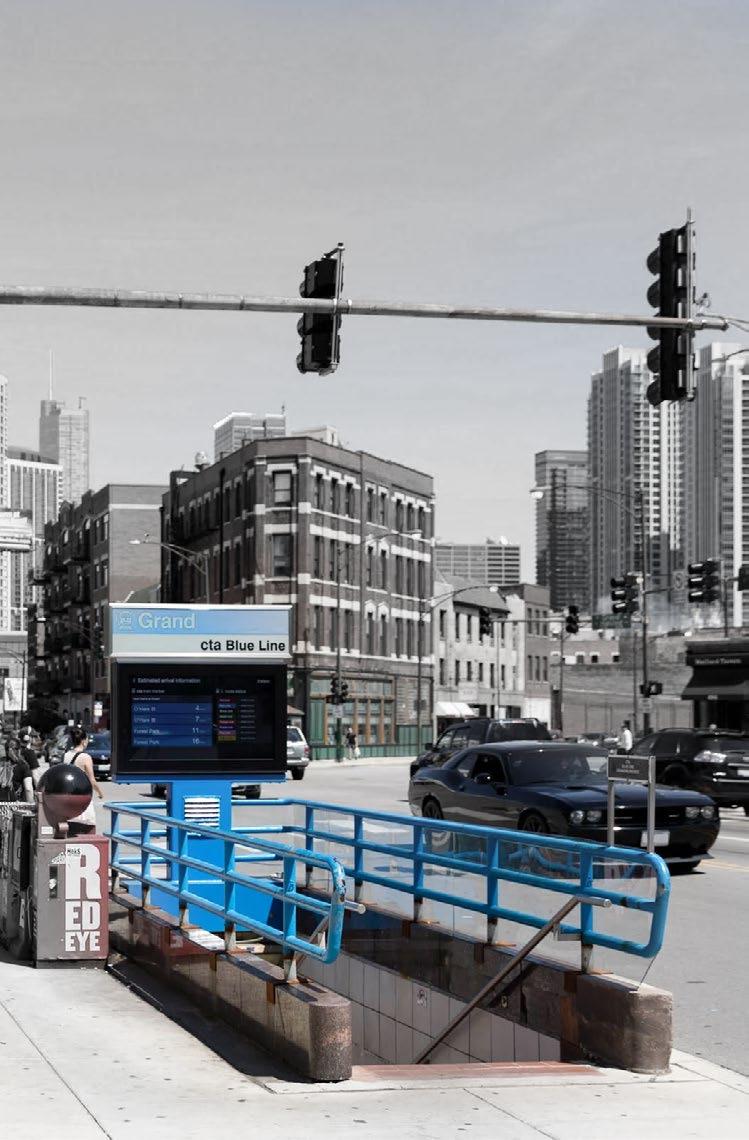
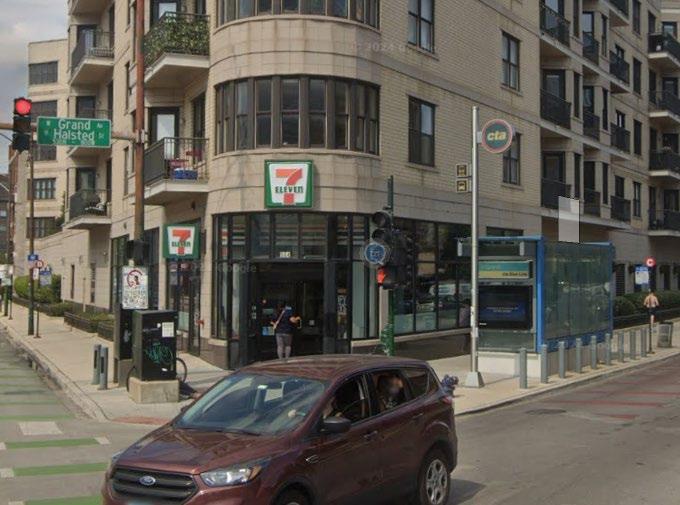
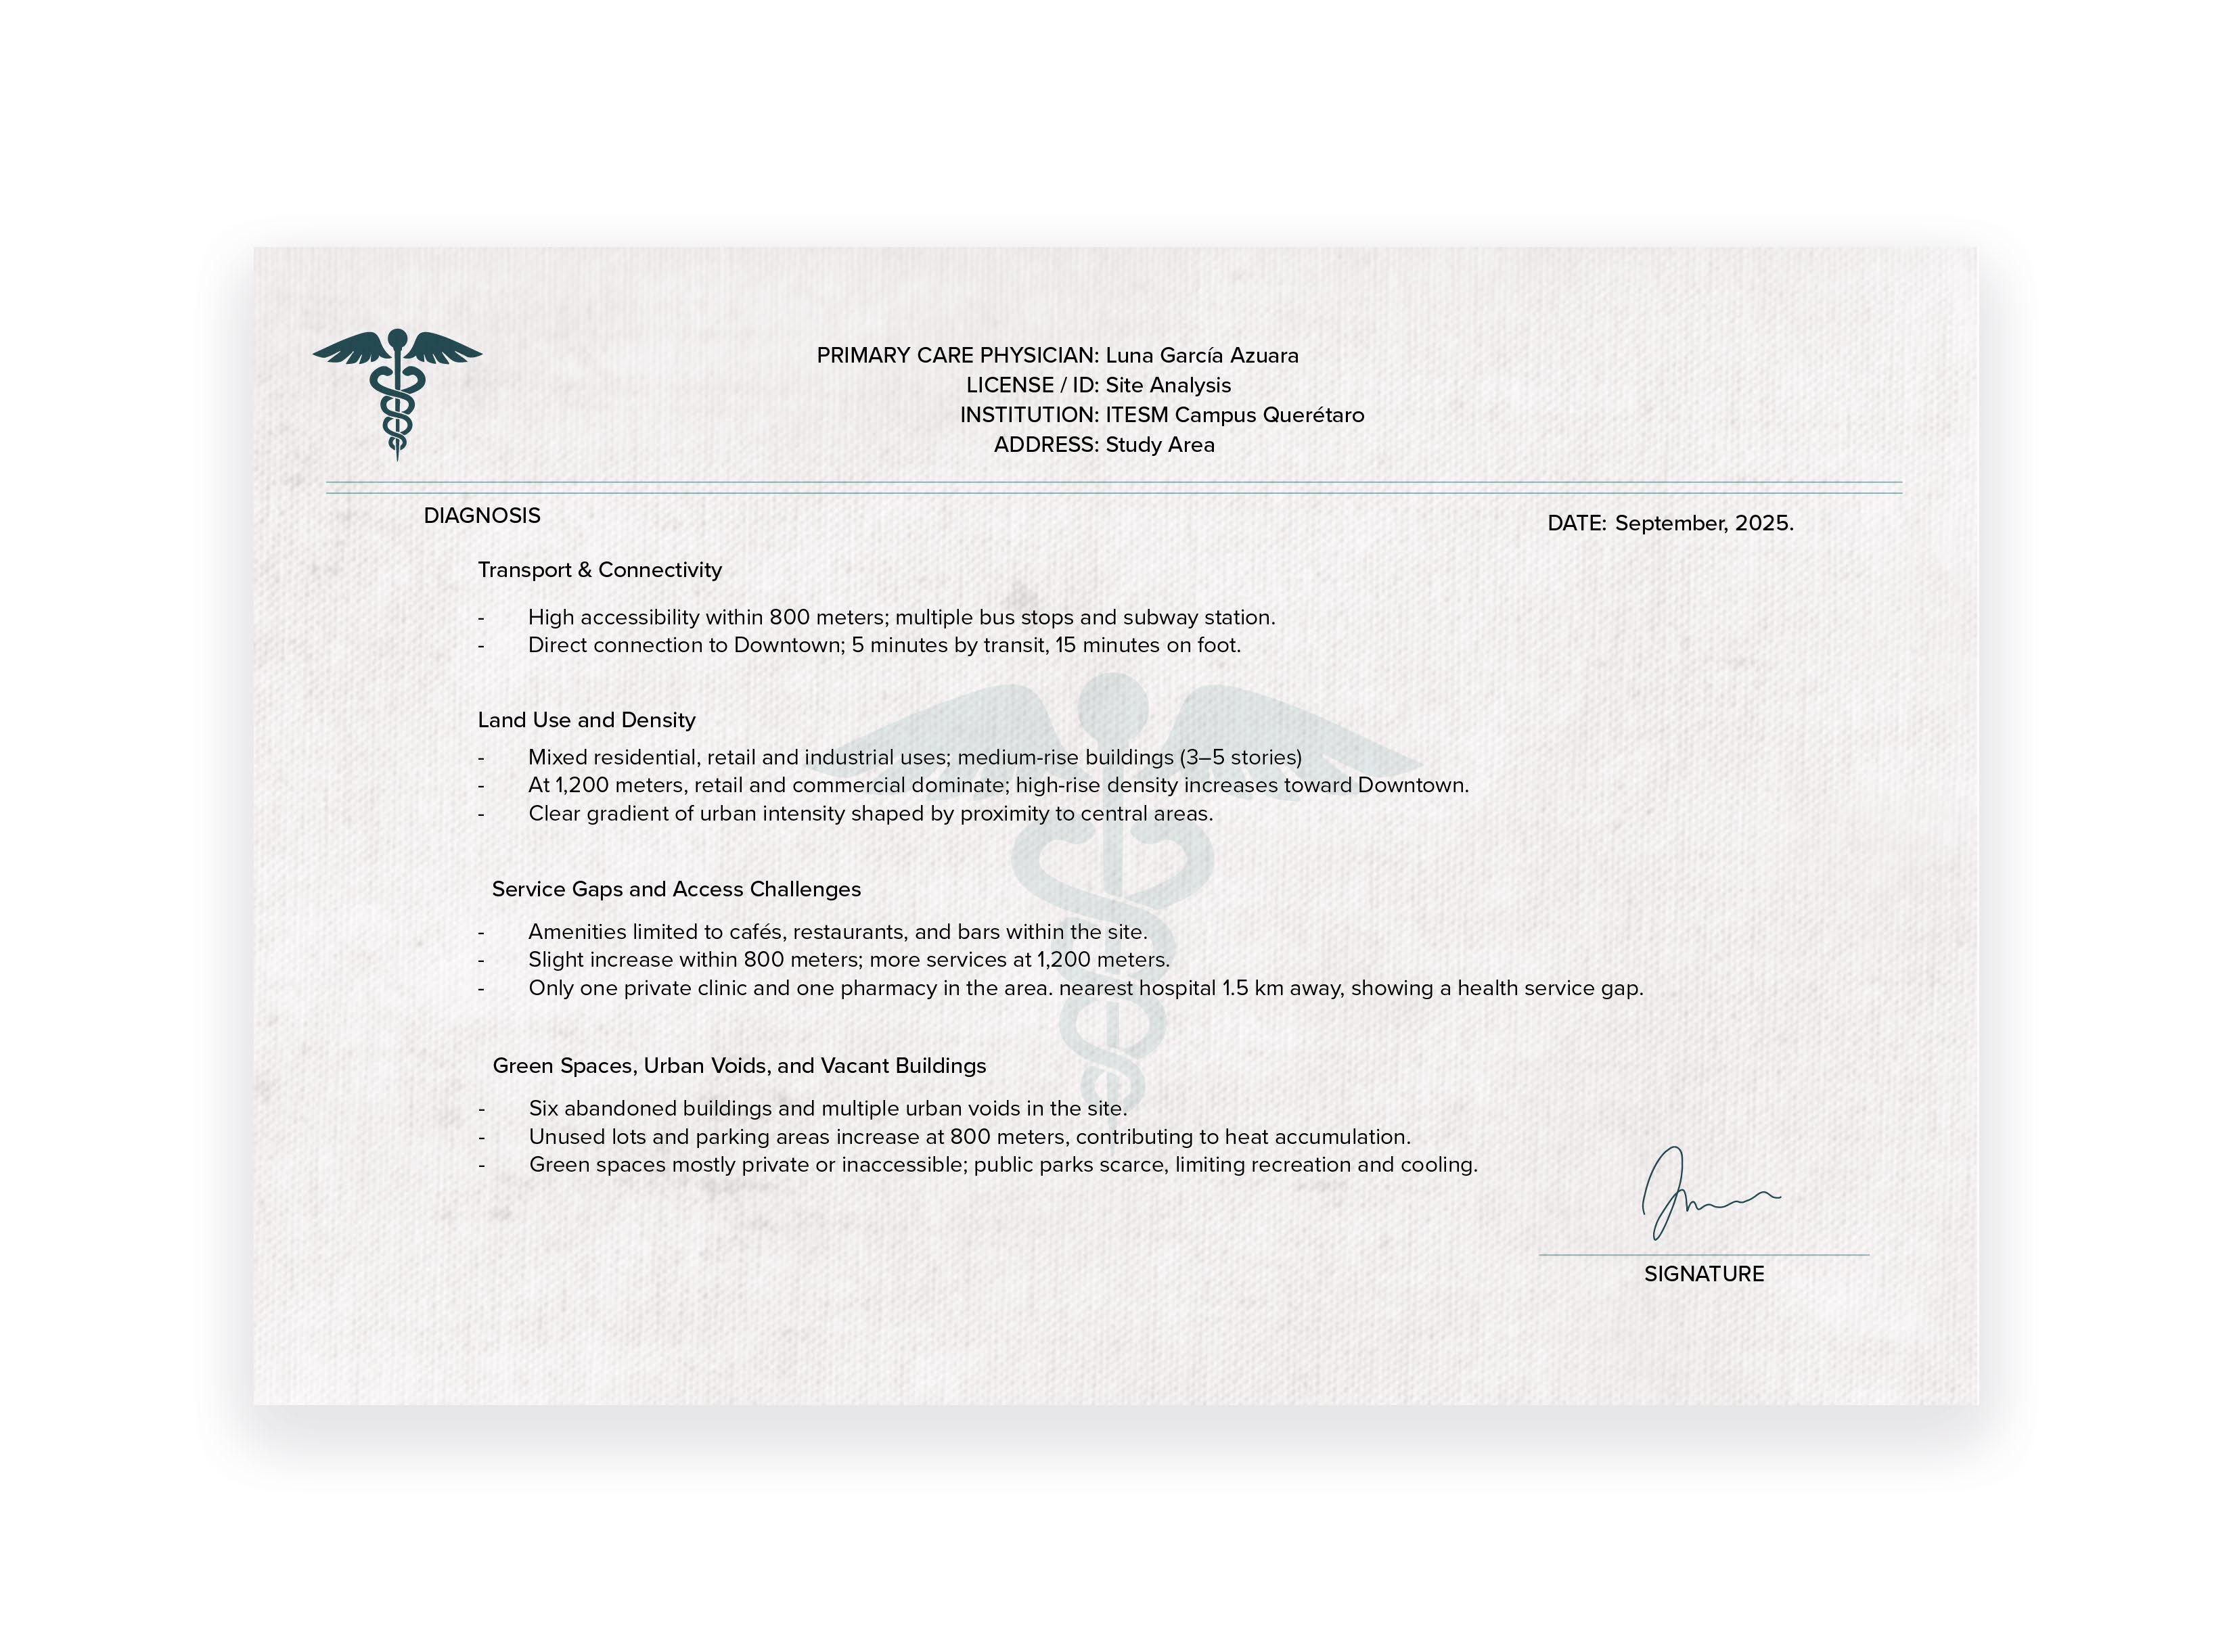
Transport & Connectivity
The study area benefits from high accessibility within an 800-meter radius (0.5 miles), with multiple bus stops along major streets intersecting the site, including N Halsted Street, W Grant Avenue, and N Milwaukee Avenue. A subway station is located within this radius, with an additional station reachable within 1,200 meters (0.75 miles). These transit routes provide direct connections to Downtown Chicago, which is approximately one kilometer away, translating to about five minutes by public transit or fifteen minutes on foot. This concentration of mobility options not only reinforces the district’s role as a gateway between residential and commercial zones but also creates conditions where walkability, reduced travel times, and multimodal connections become defining elements of daily life, shaping both the rhythms of movement and the potential for more cohesive urban patterns.
Figure
Figure
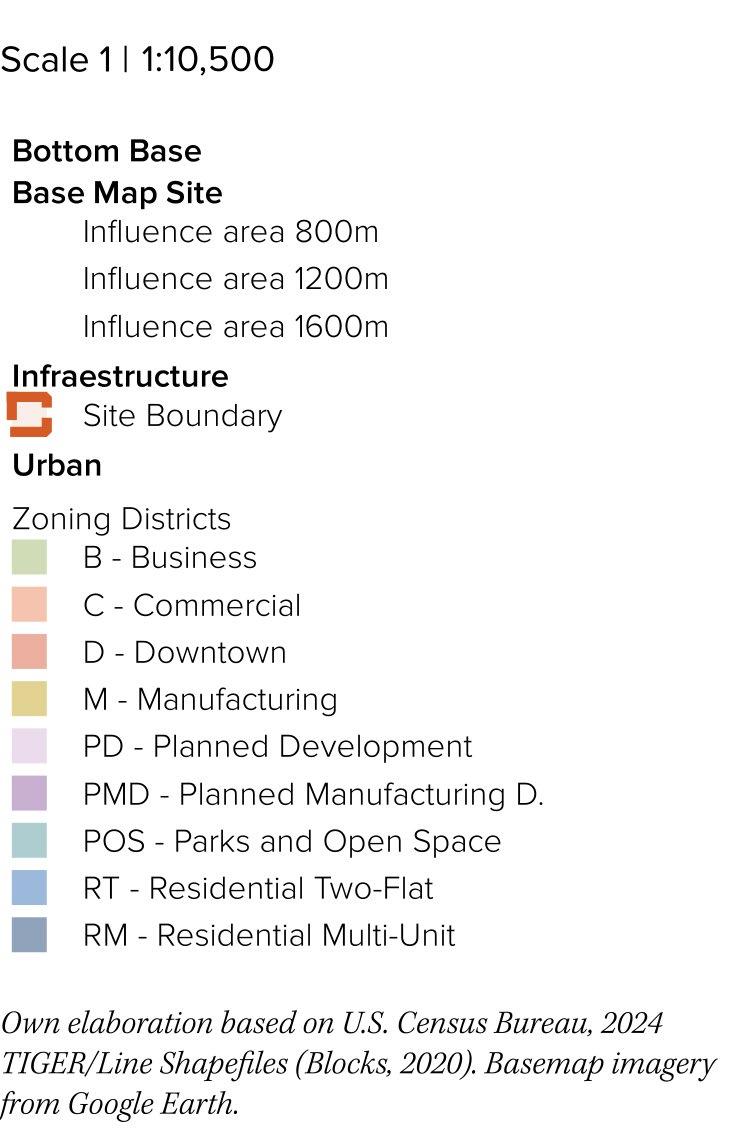
Land Use and Density
The study area exhibits a high population density, with a predominance of mixed-use development combining residential, commercial, and serviceoriented functions. Ground-level activity is concentrated along major streets, while mid-rise and high-rise structures dominate the skyline. Land use is mostly designated as PD (Planned Development) and D (Downtown District), where height limits vary; in most cases, there are no strict restrictions, though any building exceeding the general city height limits requires review under Planned Development regulations. This regulatory flexibility shapes the vertical profile of the area, influencing patterns of occupation, spatial interaction, and the overall urban experience.
Figure 19. trulia.com
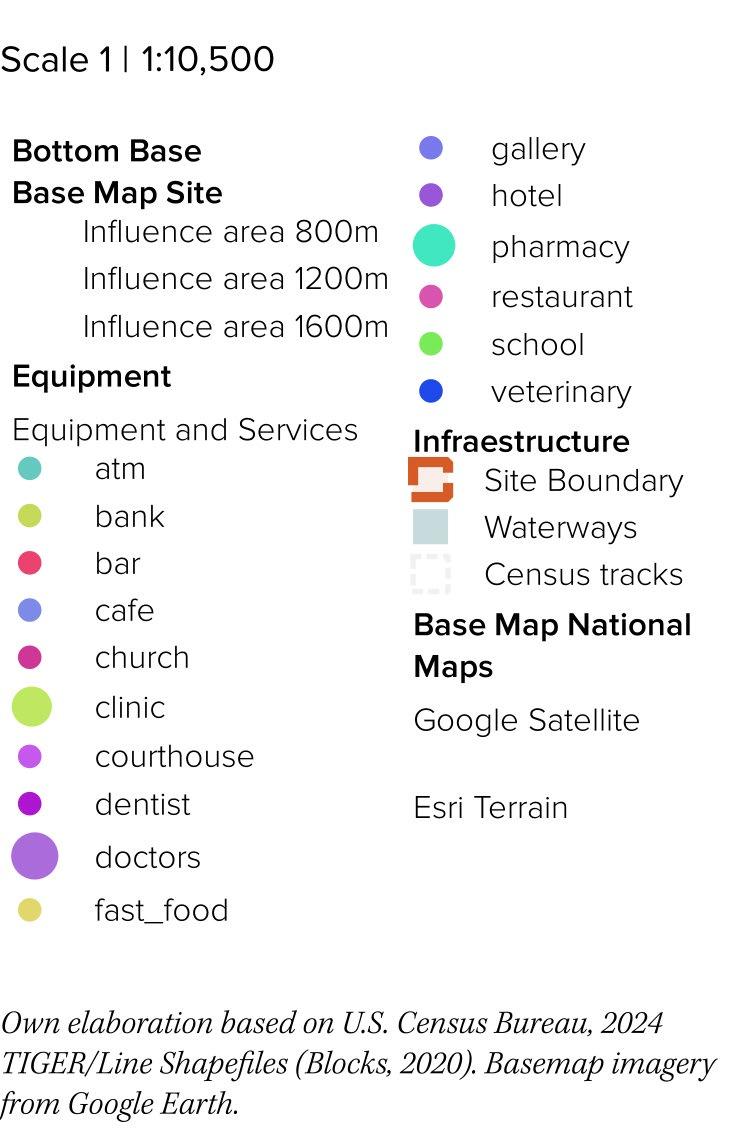
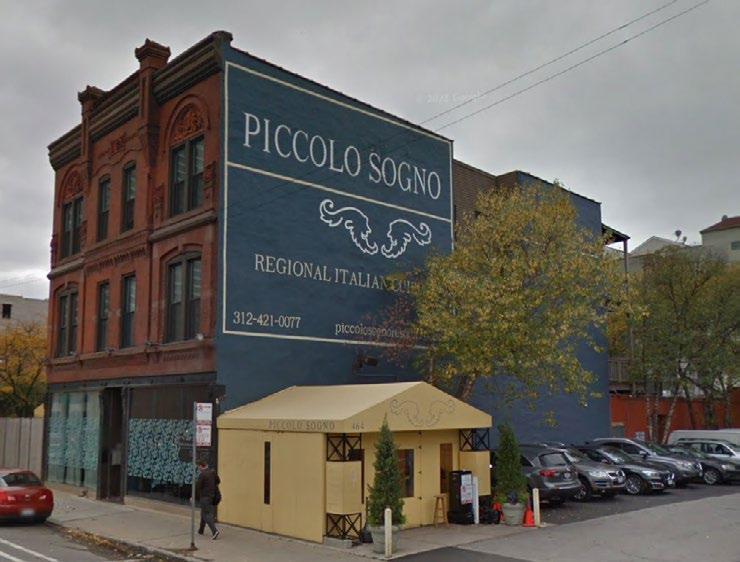
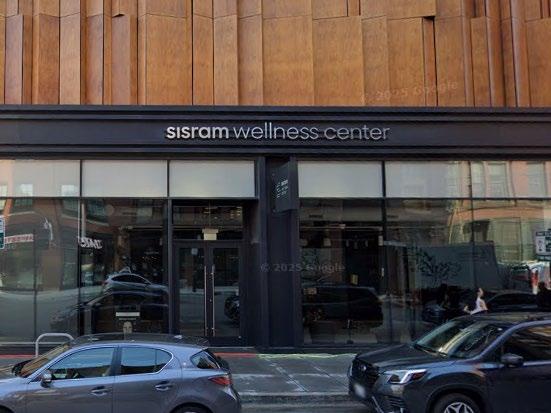
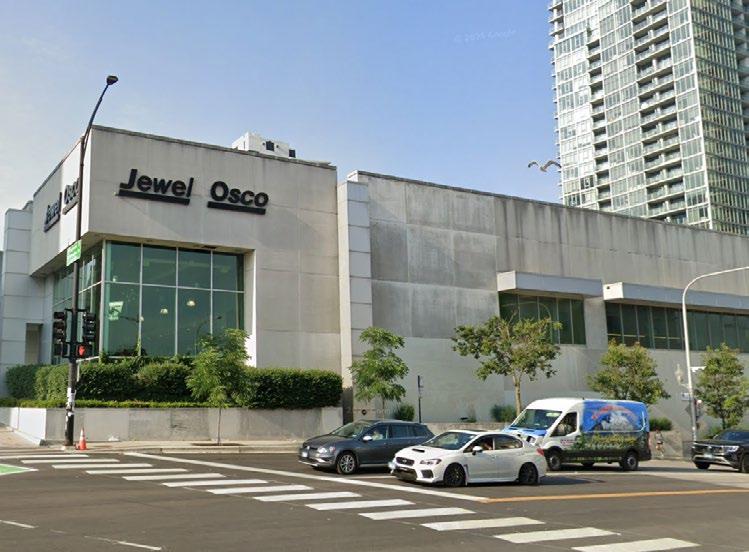
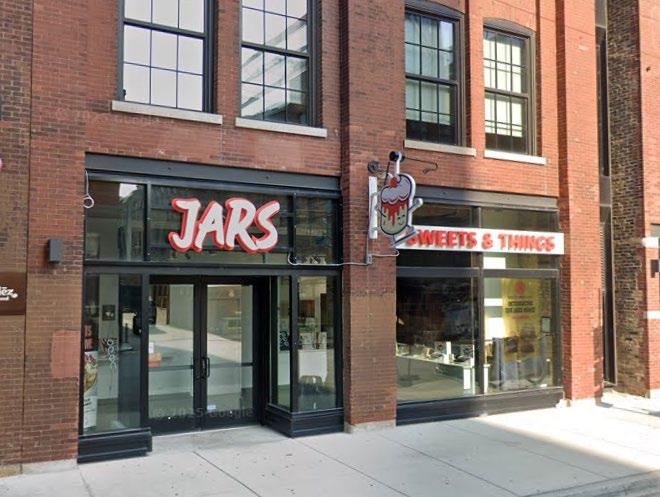
Service Gaps and Access Challenges
Within the site, amenities are limited to a few cafés, restaurants, and bars. Within an 800-meter radius (0.5 miles), services increase slightly, mainly with restaurants, fast food, a bank, and some hotels. At 1,200 meters (0.75 miles), the area shows a higher concentration of services due to permitted land uses. In terms of healthcare, only three private clinics operate within the broader area, most of which focus on cosmetic surgery rather than general medical care. The nearest hospital is located approximately 1.5 kilometers (0.93 miles) away, while a small clinic and a pharmacy are available within closer reach. Despite these presences, the absence of facilities that emphasize preventive care or everyday health support underscores a mismatch between the area’s growing population and the availability of essential services.
Figure 20-28. Google Maps (2025).
Green Spaces, Urban Voids, and Vacant Buildings
Within the site, there are approximately six abandoned buildings and several urban voids, highlighting areas of underutilized land. Within an 800-meter radius (0.5 miles), the number of urban voids increases, mainly consisting of unused lots and surface parking, which contribute to heat accumulation across the area. Green spaces are mostly private or inaccessible, often located on embankments near roads or train lines. Public parks and accessible greenery are scarce, limiting opportunities for recreation, natural cooling, and spaces for disconnection and relaxation. These conditions point to a pattern of spatial imbalance, where underused land and limited greenery intersect with urban density, shaping the environmental and social dynamics of the area.
Figure 29. Google Maps (2025).
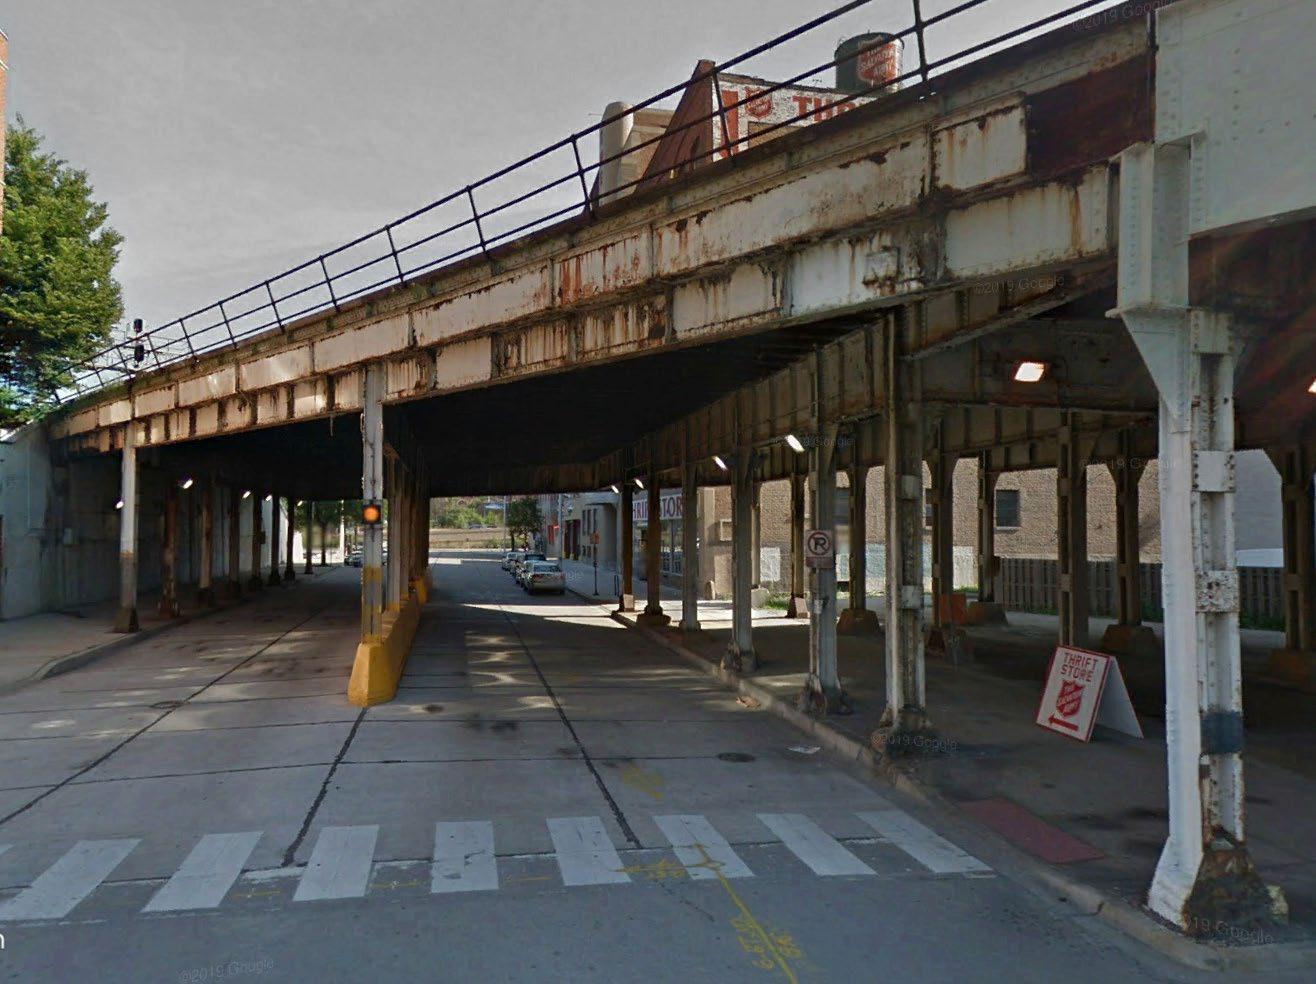
Streetscape and Pedestrian Experience
Along the main axes (Milwaukee Street, Grand Avenue, and Halsted Street), pedestrian activity is notable, with many people walking, often accompanied by pets. However, shade and greenery are minimal, as most vegetation is located on embankments near roads or rail lines. The train infrastructure is a dominant element in the neighborhood, shaping both mobility and visual character. Cultural expressions, such as murals on abandoned buildings and retaining walls along the tracks, highlight the community’s identity. The area maintains a medium-scale urban environment, which limits the perception of walkability within the site. Moving outward, building density increases, enhancing the sense of scale and creating a more defined urban experience.
This semester studio investigates urban dynamics in the United States, Chicago, and a postindustrial site within the city, linking design to health and wellness. Through climate-responsive strategies and urban recycling, the studio explores how architecture and landscape architecture can transform stressed environments into more resilient, equitable, and connected places. The research addresses the multiple dimensions of wellbeing—physical, social, emotional, environmental, occupational, intellectual, spiritual, and financial—emphasizing the role of design in shaping healthier and more inclusive urban futures. Alongside conceptual and spatial proposals, students will integrate executive project criteria, including structural systems, materials, facilities, budgets, and work programming, approached with ethical and environmental responsibility.
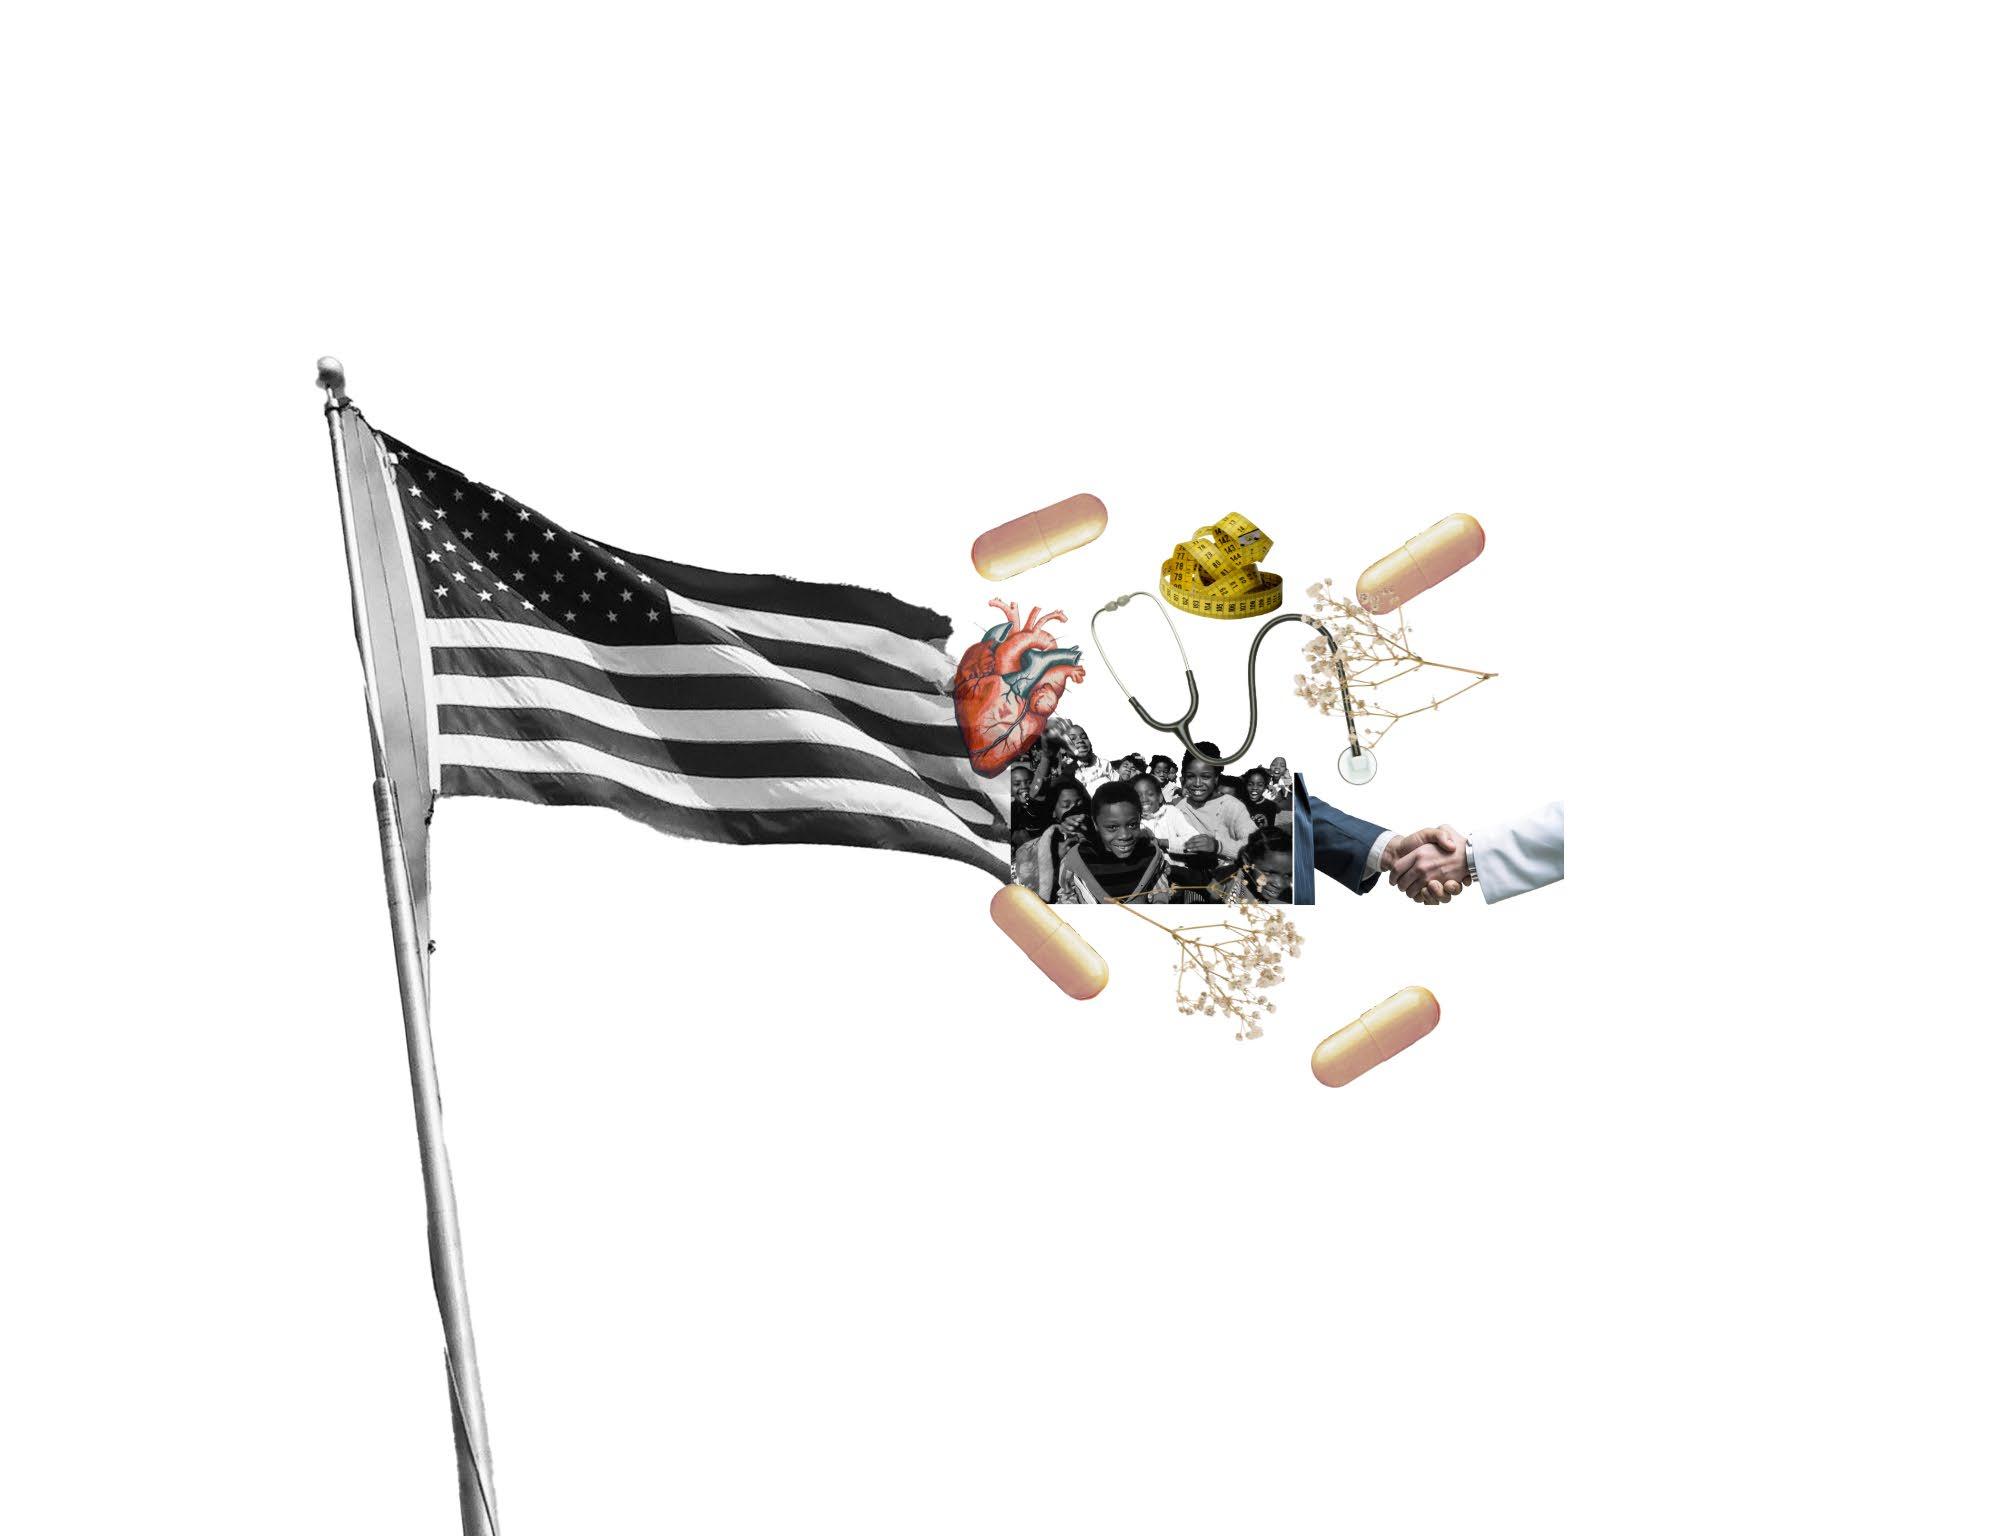
Health is no longer a right, but a currency
In this future, health is no longer a universal right but a form of currency. Public hospitals have disappeared, absorbed by private corporations that charge consultation by the minute. Medical care functions as a subscription; without payment, there is no treatment.
The wealthy access advanced drugs and robotic assistants inside sterilized sanctuaries reserved for the privileged few, those who can afford the price tag
For the lower class, services are reduced to precarious emergency care, overcrowded wards, or AI consultations, where survival depends on whether an algorithm deems a life profitable.
Mega corporations select patients based on genetic value or social status, while clandestine markets for organs, counterfeit medicines, and illegal doctors thrive in the shadows.
Illness is no longer a challenge to overcome but a sentence of invisibility. In this world, to live is to afford.
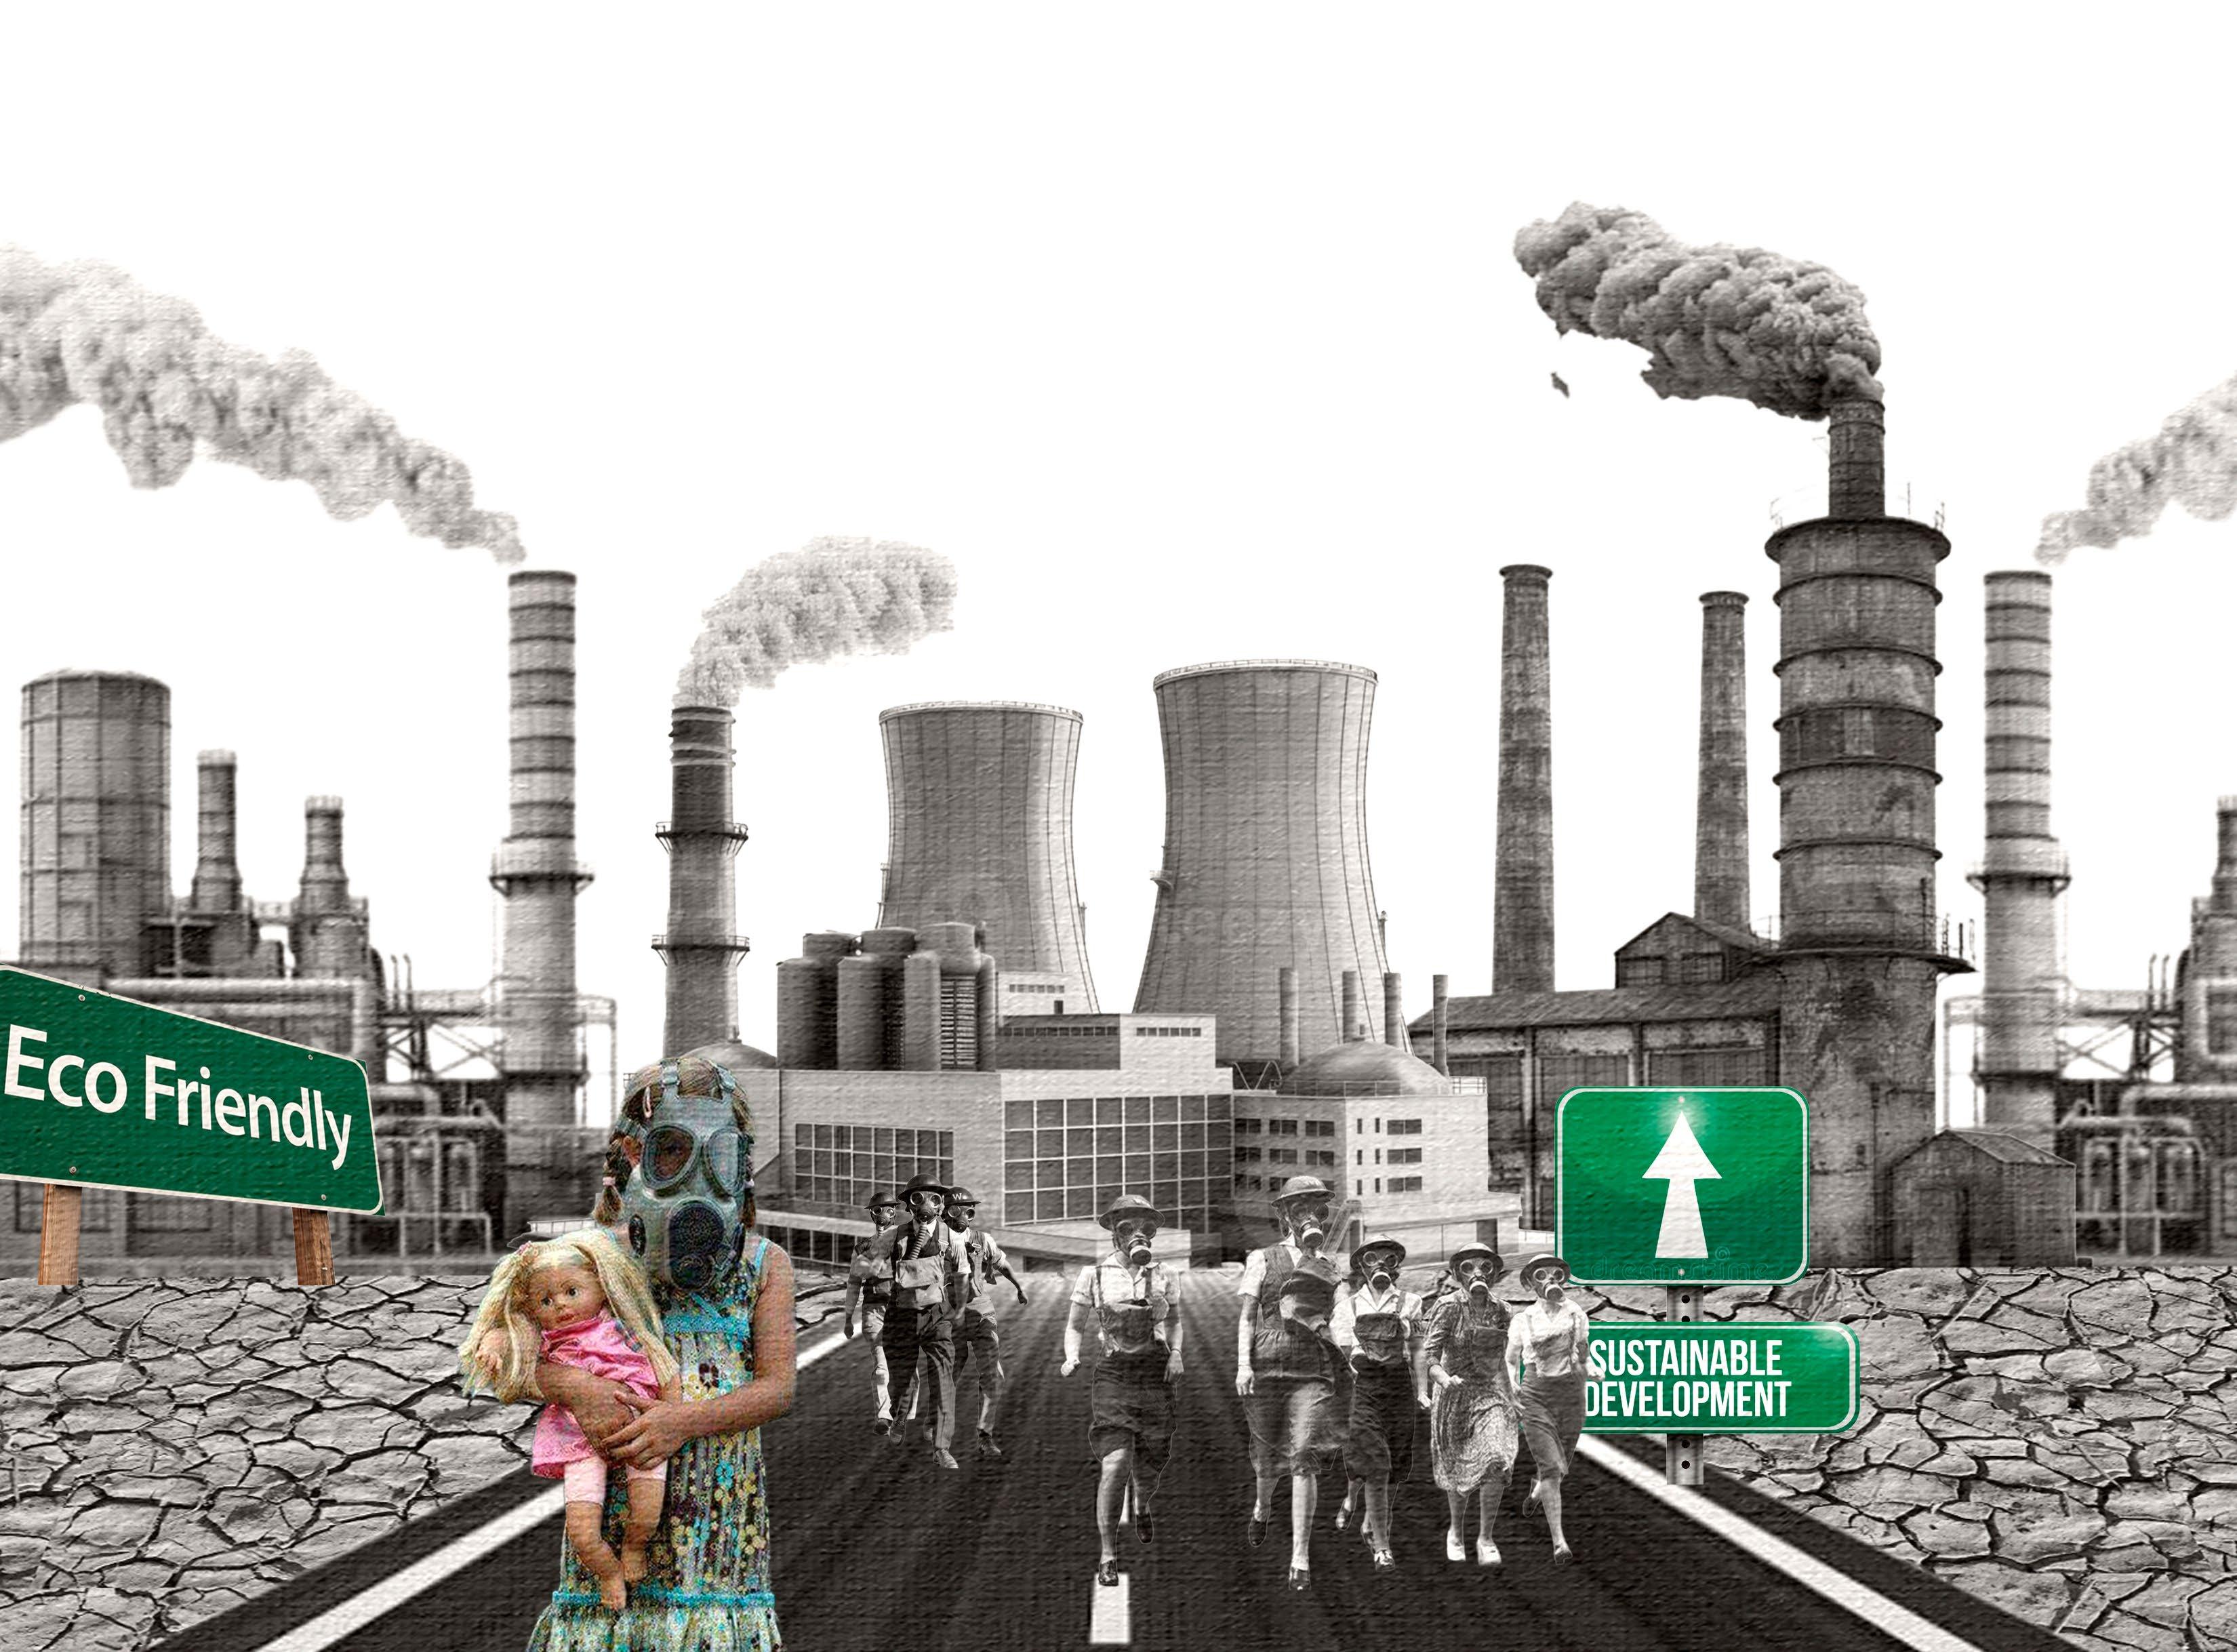
The greenwashed ruins
In this projected future, industries continue to prioritize profit over sustainability, choosing to pay environmental fines rather than transition to renewable energy. Mass production dominates the economy, consumption grows without limits, and collective awareness fades under the promise of immediate gain.
The consequences are unavoidable. Air and water are poisoned, acid rain falls with increasing frequency, and food is contaminated with chemicals and industrial waste. Public health collapses as respiratory diseases, cardiovascular problems, and new illnesses linked to pollution spread. Mortality rises among the most vulnerable communities who face the greatest barriers to accessing the few remaining clean resources controlled by economic elites.
Urban life shrinks into dark, windowless shelters that protect inhabitants from toxic air and uninhabitable surroundings. Abandoned neighborhoods and rising waters swallow entire communities. Inequality deepens as clean air, water, and food become luxury items. Globally, censorship hides the scale of environmental and social collapse while the ruins of greenwashing stand as a reminder of decades of indifference.
From commons to corporations
By 2125, Chicago has been swallowed by the rising waters. The old skyscrapers, rusted and skeletal, stand as relics of a forgotten past. To preserve civilization, megacorporations raised the Vertical Towers, promoted as “the rebirth of humanity,” yet in truth social prisons of steel and glass. Within, the city is divided into three levels: at the lowest, the condemned endure hunger and endless darkness; in the middle, workers sustain daily life for those above, misled by stairways that lead nowhere and a hidden elevator reserved for the elite; at the top, the powerful govern from sterile purity. Nature has almost disappeared—only rats and plagues mutated by pollution remain. A corporate religion has replaced the gods, with rituals of consumption and obedience. Yet even the elite are not free: artificial intelligence rules over them all. Meanwhile, in the sunken ruins, a rumor spreads—the very foundations of the tower are beginning to crack.
This semester studio investigates urban dynamics in the United States, Chicago, and a postindustrial site within the city, linking design to health and wellness. Through climate-responsive strategies and urban recycling, the studio explores how architecture and landscape architecture can transform stressed environments into more resilient, equitable, and connected places. The research addresses the multiple dimensions of wellbeing—physical, social, emotional, environmental, occupational, intellectual, spiritual, and financial—emphasizing the role of design in shaping healthier and more inclusive urban futures. Alongside conceptual and spatial proposals, students will integrate executive project criteria, including structural systems, materials, facilities, budgets, and work programming, approached with ethical and environmental responsibility.
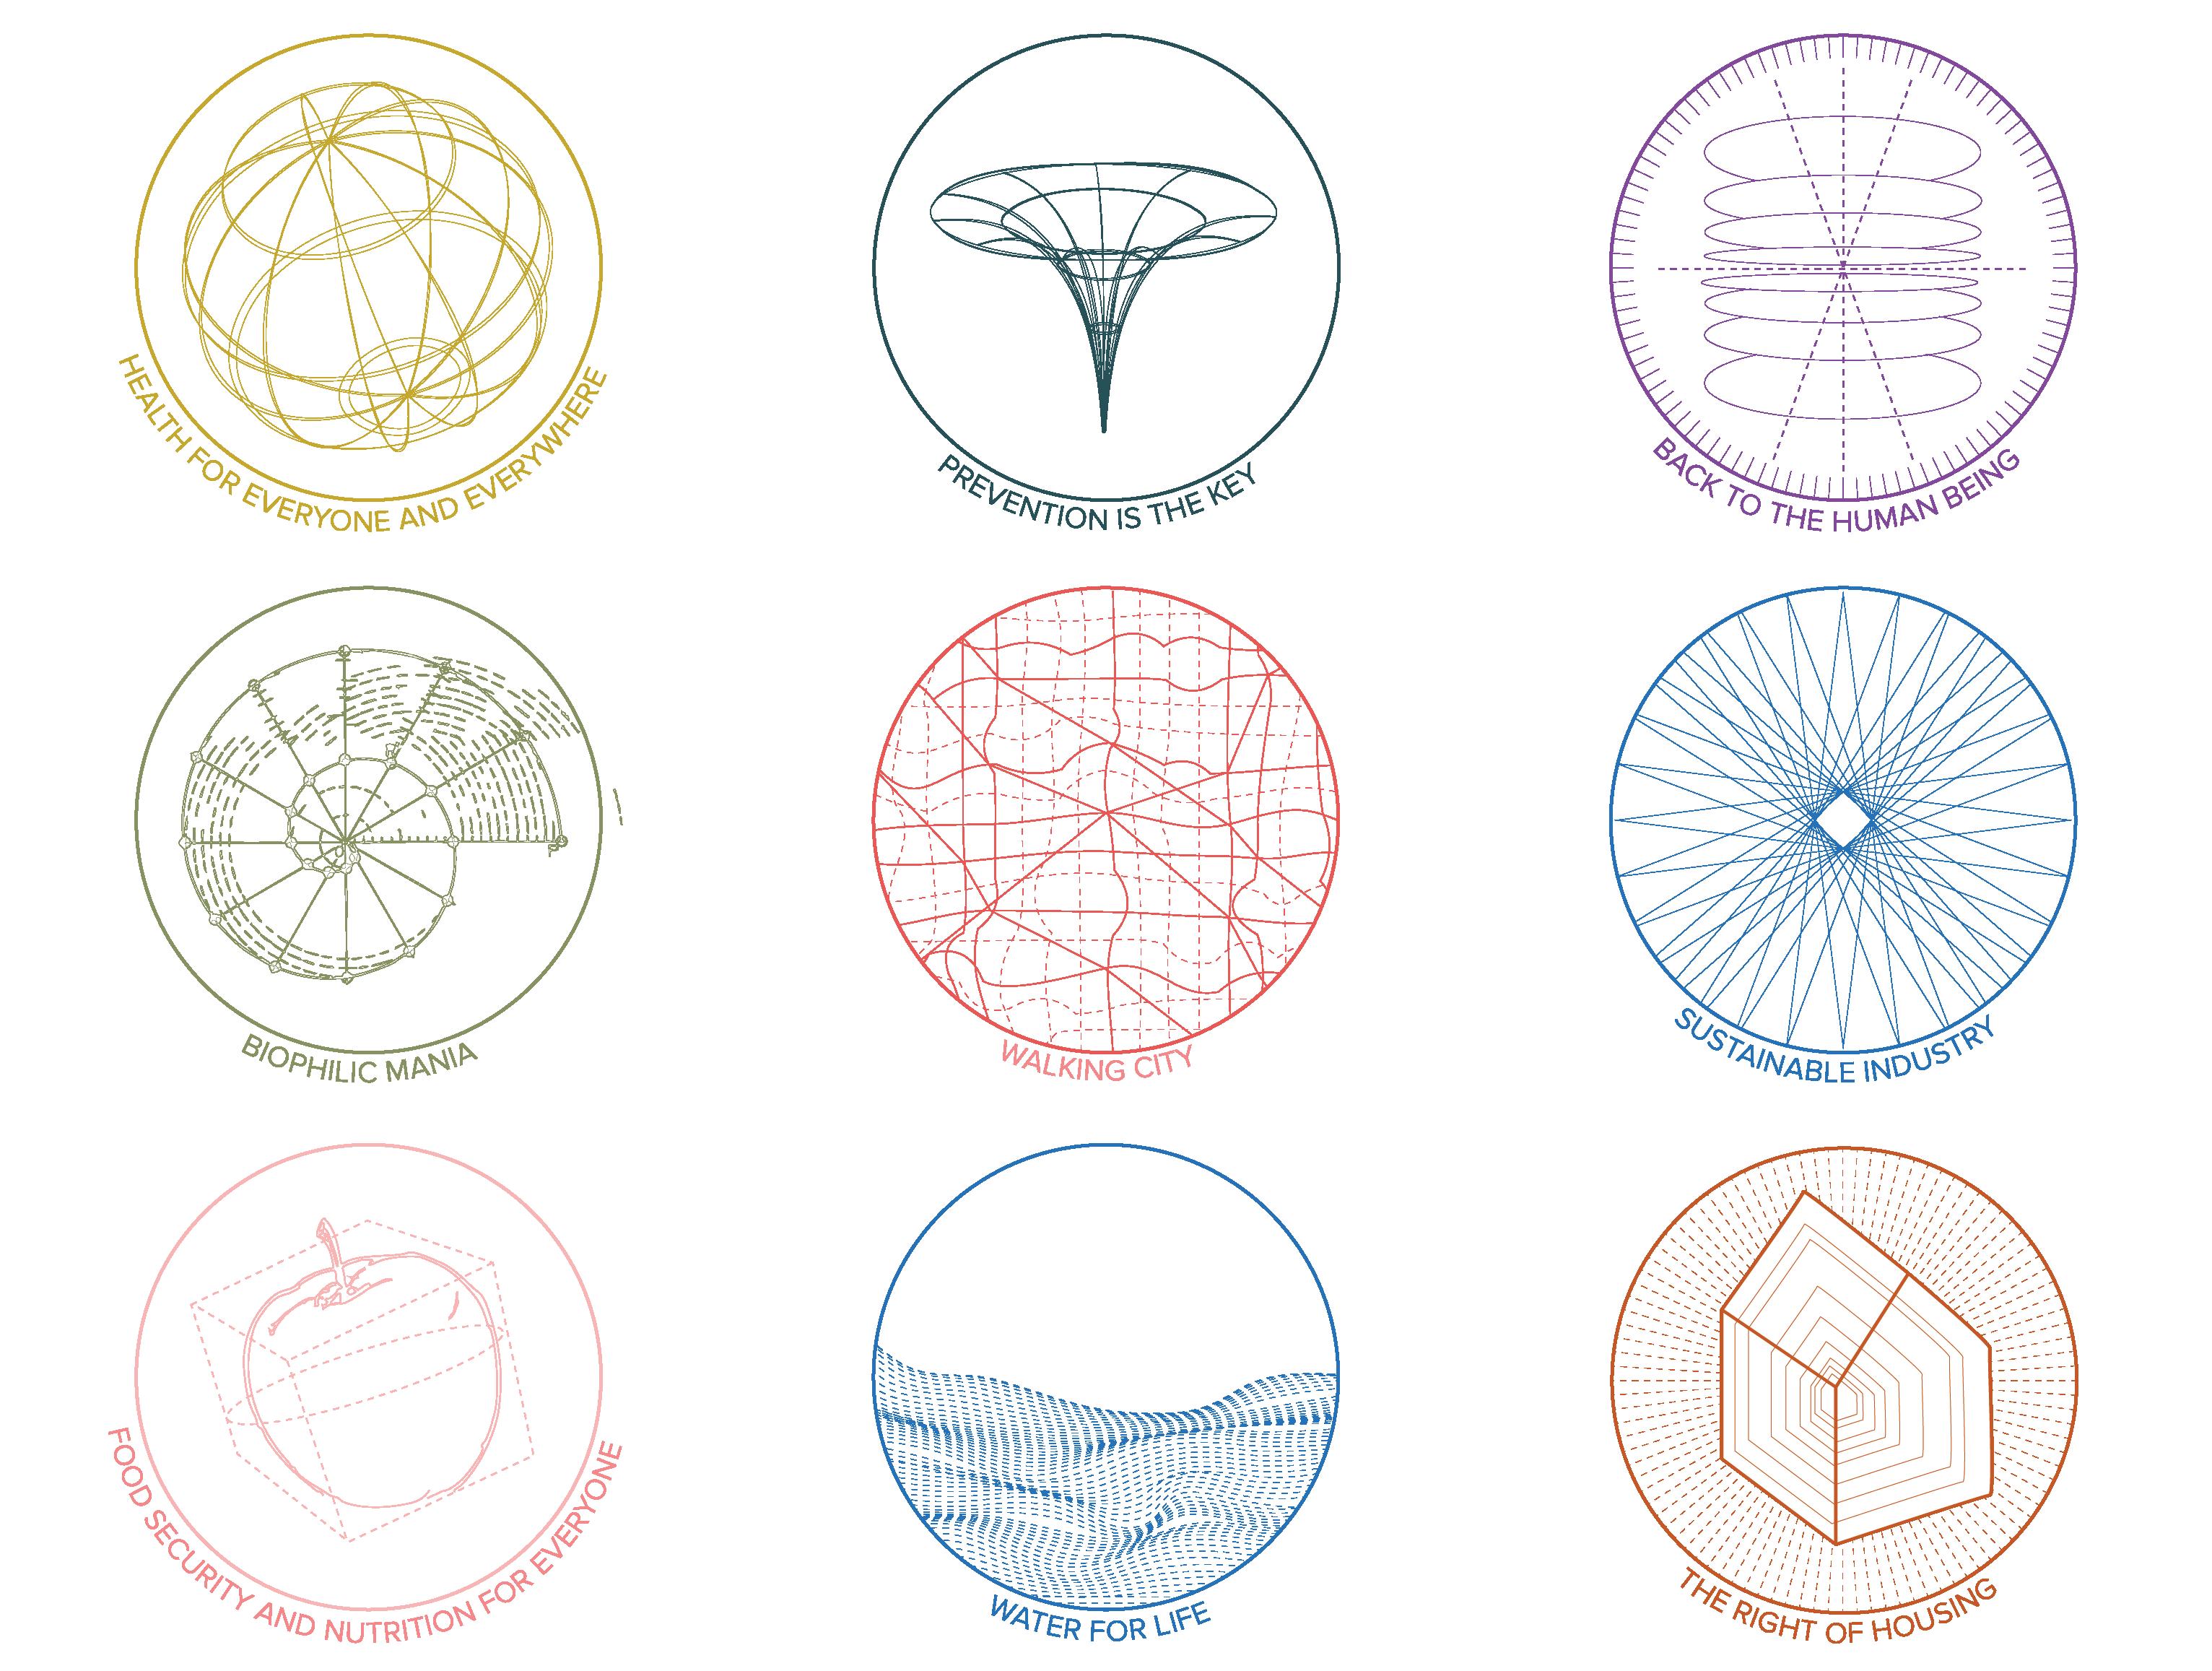
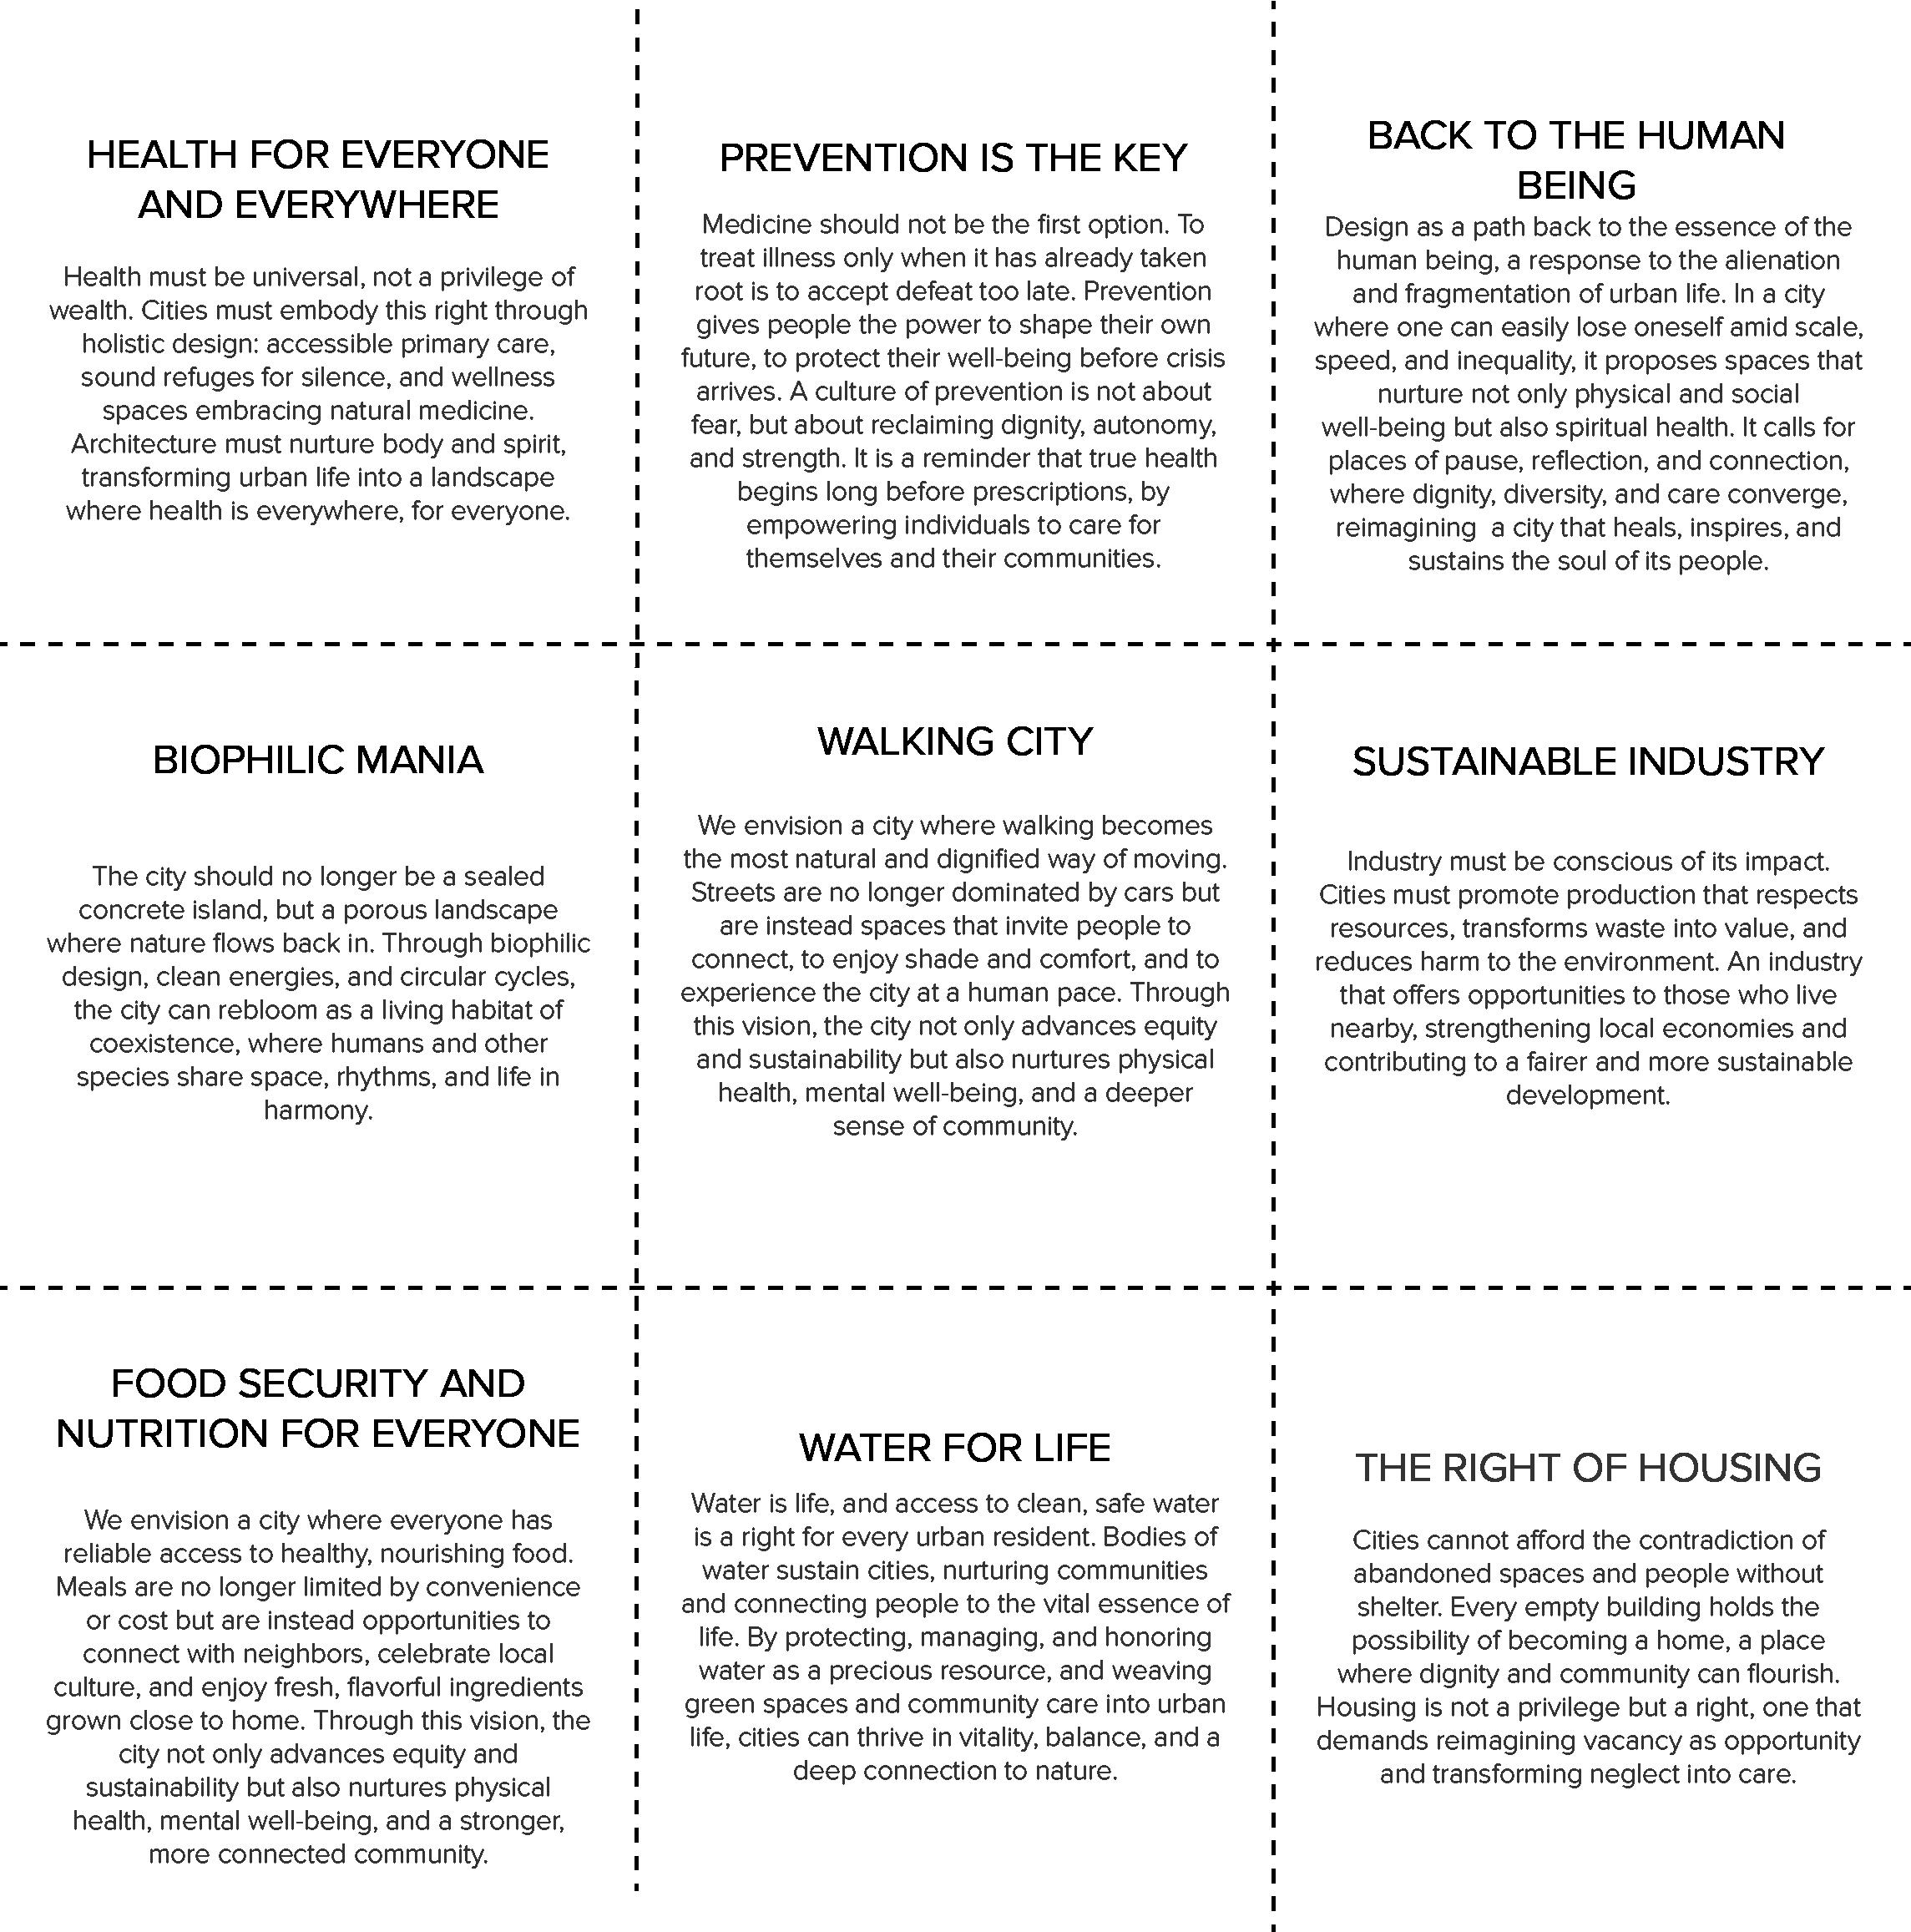
A manifesto, as a shared declaration of vision and principles, becomes our guiding framework for future projects. Emerging from our research, it not only defines aspirations but also illuminates pathways, ensuring every step reflects our commitment to balance, wellness, and harmony.
This semester studio investigates urban dynamics in the United States, Chicago, and a postindustrial site within the city, linking design to health and wellness. Through climate-responsive strategies and urban recycling, the studio explores how architecture and landscape architecture can transform stressed environments into more resilient, equitable, and connected places. The research addresses the multiple dimensions of wellbeing—physical, social, emotional, environmental, occupational, intellectual, spiritual, and financial—emphasizing the role of design in shaping healthier and more inclusive urban futures. Alongside conceptual and spatial proposals, students will integrate executive project criteria, including structural systems, materials, facilities, budgets, and work programming, approached with ethical and environmental responsibility.
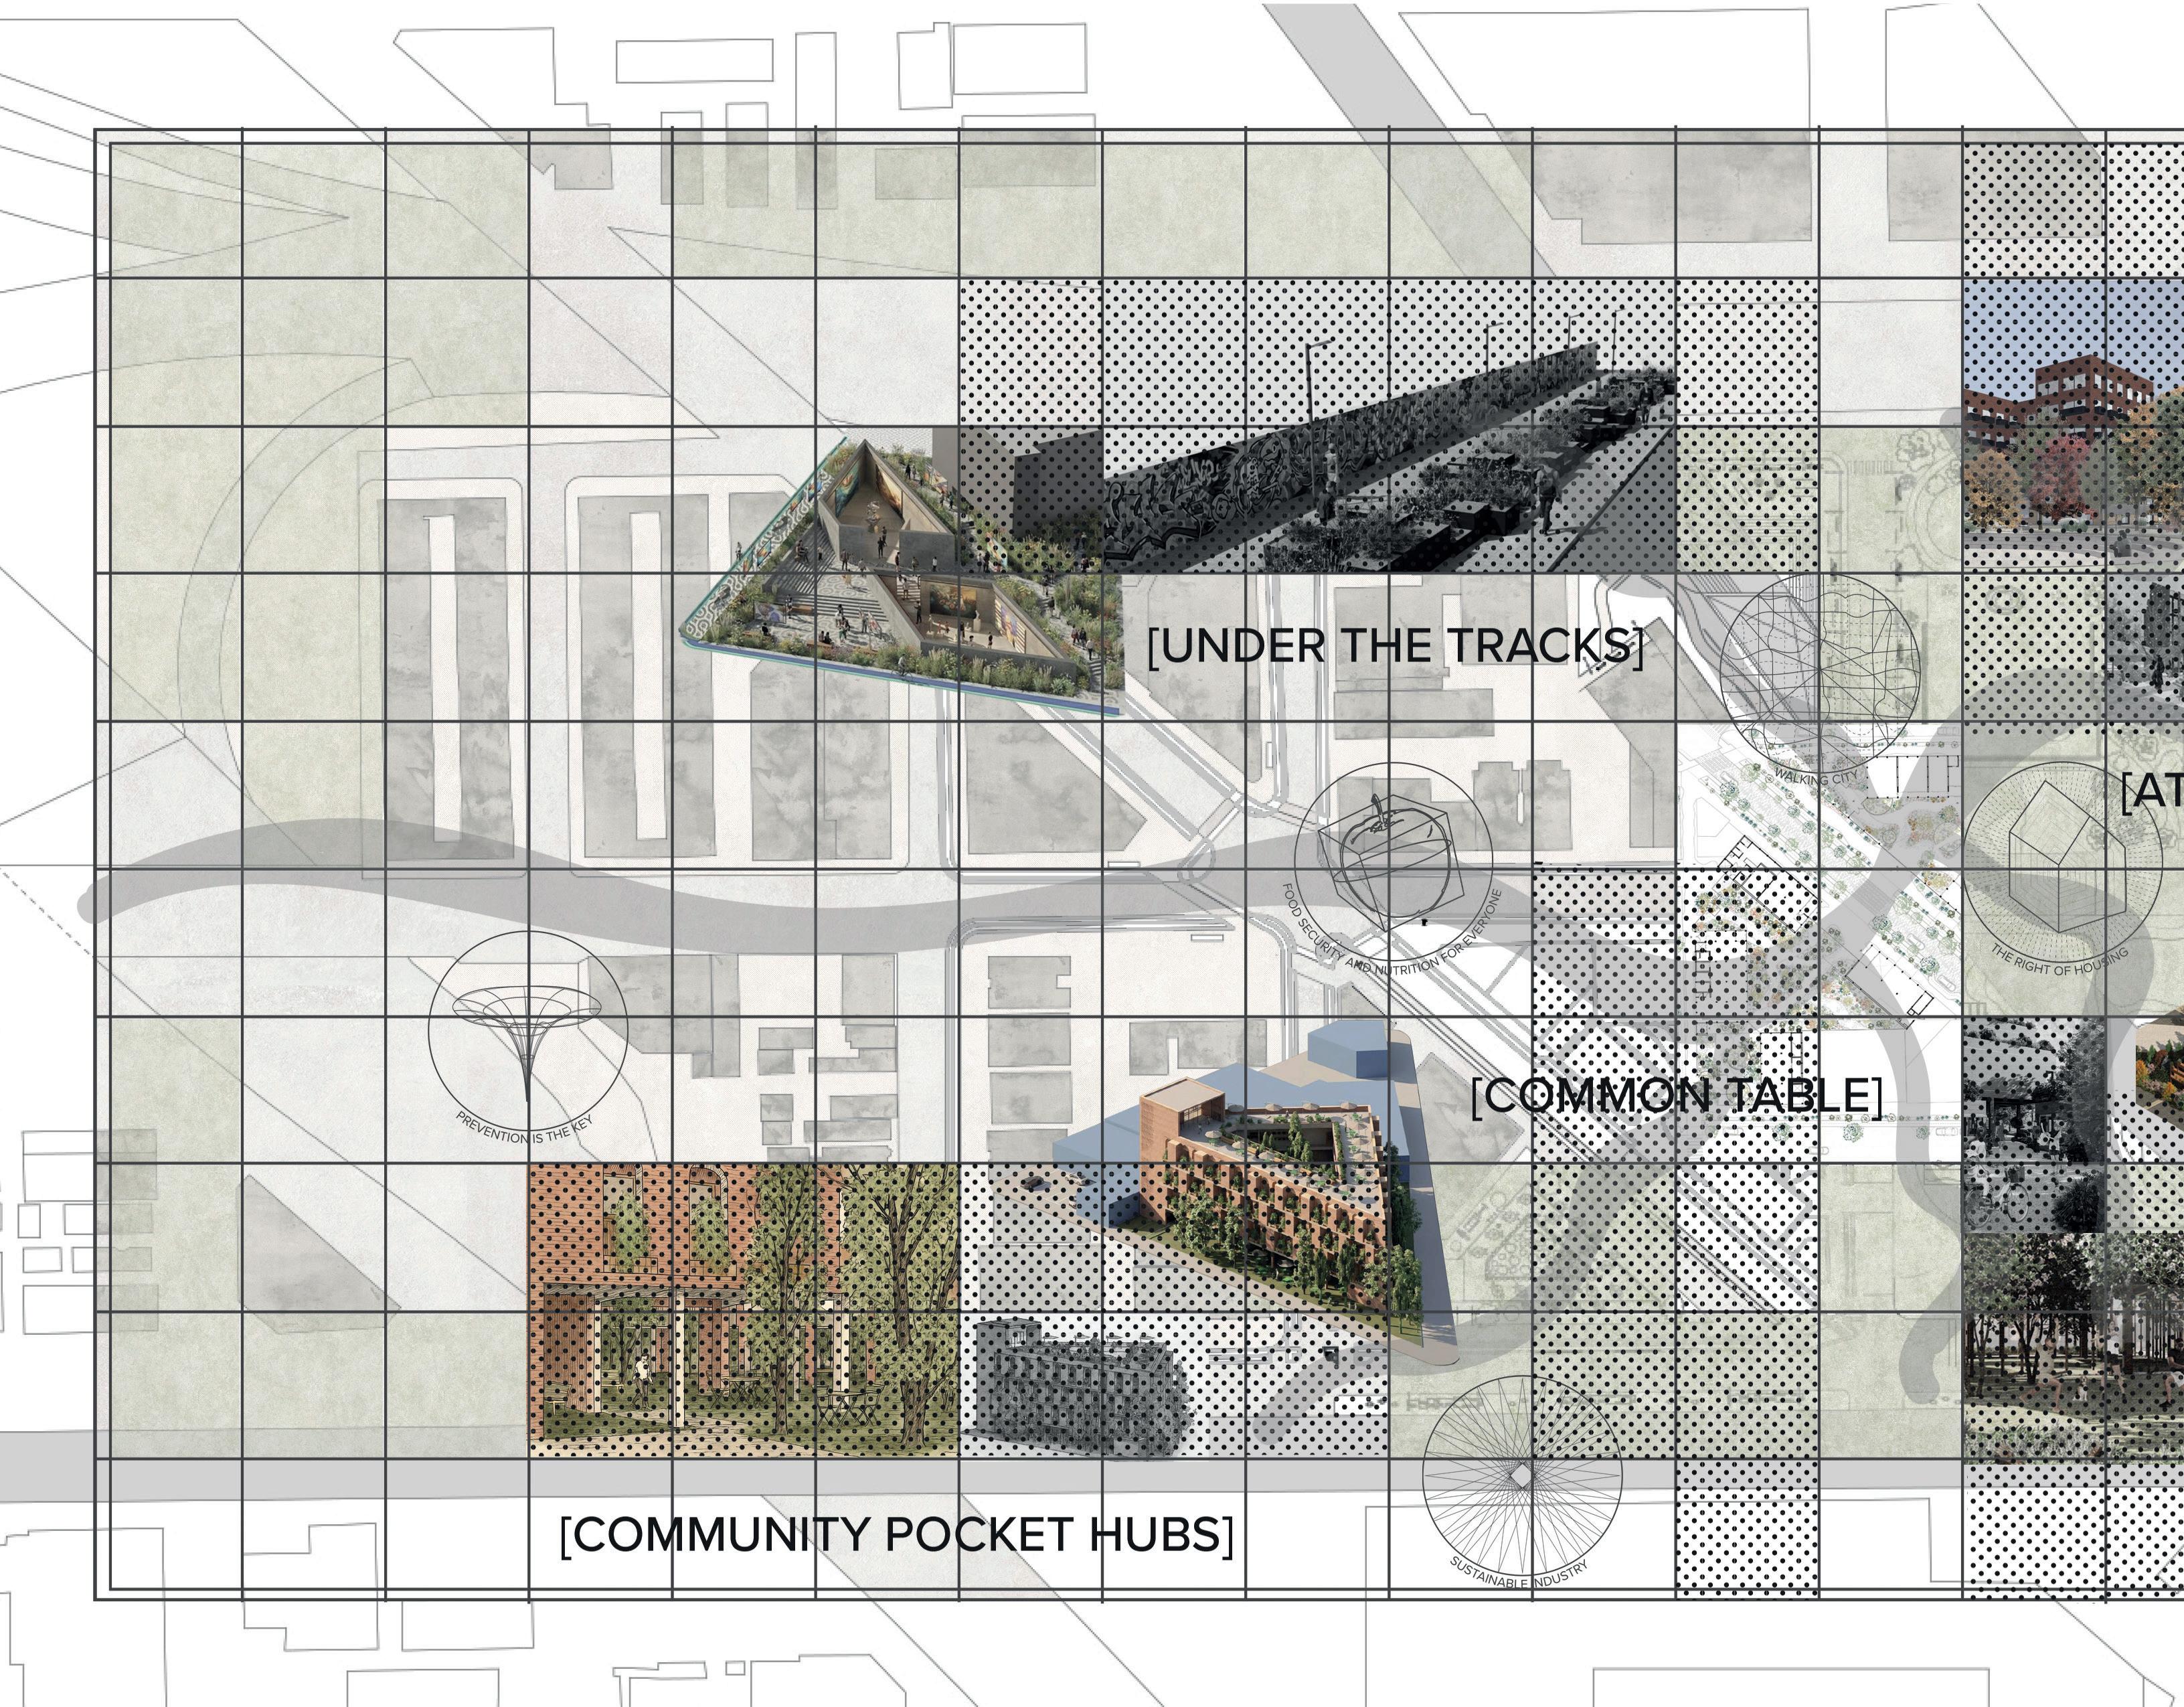
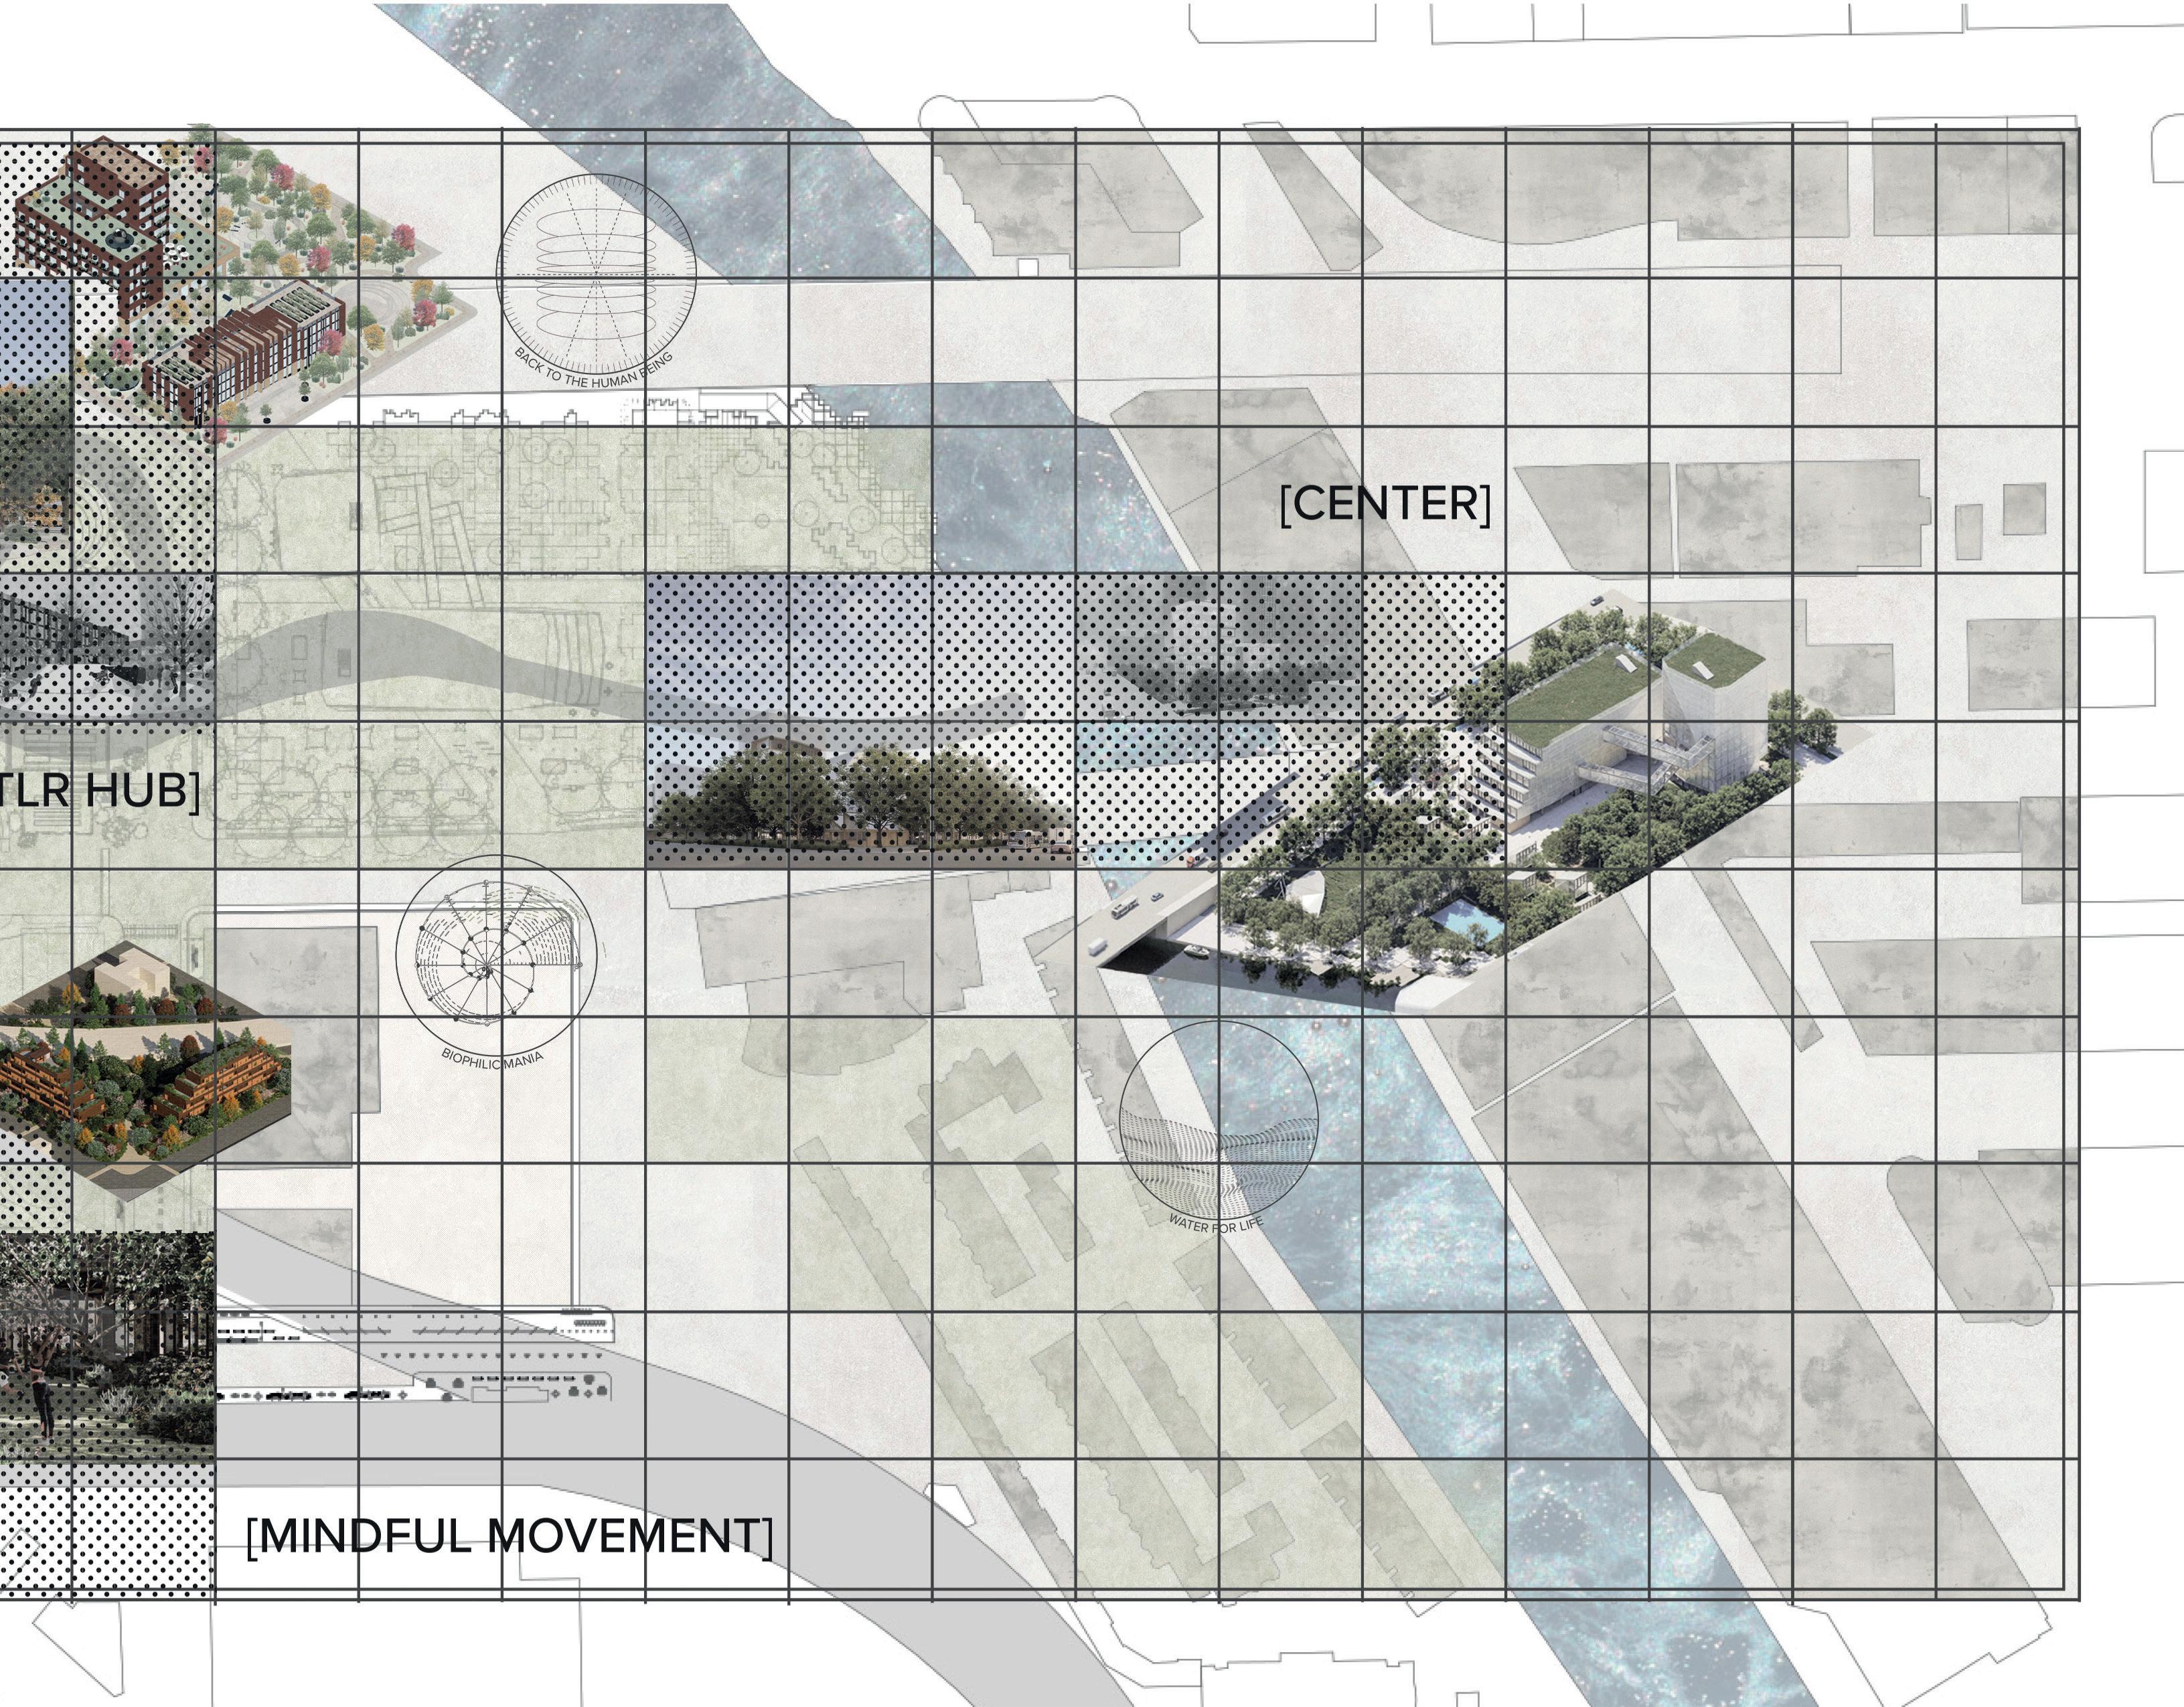
STRATEGIES AND PROJECTS
WELLBEING AND HEALTH ACCESSIBLE IN EVERY SPACE FOR EVERYONE
OPPORTUNITIES
PEDESTRIANITY AND CONNECTION
CONSCIOUS INDUSTRY
URBAN GREEN VITALITY BIOPHILIC MANIA AND GREEN OASIS
HUMAN-CENTERED & INCLUSIVE CITIES
AFFORDABLE HOUSING
WATER AS A RESOURCE
FOOD SECURITY AND NUTRITION FOR EVERYONE
PROJECTS
LIVING WELLNESS NETWORK
An urban ecosystem that weaves together vertical wellness parks, pocket gardens, communal rooftops, and neighborhood wellness centers into a continuous network. By transforming residual and underused spaces, it creates accessible green infrastructures that promote physical activity, mental health, social interaction, and ecological resilience, embedding well-being into the everyday fabric of Chicago.
CHICAGO PEDESTRIAN CONNECTIVITY NETWORK
Develop an integrated network of pedestrian-friendly infrastructures and public spaces that reduce car dependence and enhance quality of life across Chicago’s neighborhoods, connecting key areas through green corridors, pedestrian bridges, and car-free superblocks.
LIVING URBAN TAPESTRY
Where ghost buildings transform into sensory gardens, the river hosts a floating market for food, crafts, and culture, and open-air museums showcase global issues through temporary exhibits. Woven with community urban gardens, creating a network of spaces that nourish the senses, spark dialogue, and regenerate the city’s ecological, cultural, and economic life.
ECO-TRADE & CULTURE HUB
Where ghost buildings transform into sensory gardens, the river hosts a floating market for food, crafts, and culture, and open-air museums showcase global issues through temporary exhibits. Woven with community urban gardens, creating a network of spaces that nourish the senses, spark dialogue, and regenerate the city’s ecological, cultural, and economic life.
CHICAGO´S GREEN LAYER AND MOTION
A living zone that blends the mondane systems and lifestyle of the urban landscape as well as its addition green environments and tendencies. Natural resources, sustainable methods and circular systems added into the known urban lifestyle.
MODULAR GREEN LIVING
Housing in converting vacant and underused lots into modular and mixed-use buildings with rooftop and shared gardens, while larger complexes integrate green parks and expandable modular homes with shared courtyards to foster flexible, sustainable, and community-oriented living.
HYDRO-ECOLOGICAL CORRIDOR
Reimagine the riverfront as a living system where water becomes both infrastructure and culture. A central rain-collecting fountain doubles as a sound installation, floating parks filter the river while creating new community spaces, shaded plazas offer cooler microclimates with playful water features, and constructed wetlands with interior gardens purify water and serve as living classrooms. Together, these interventions weave ecology, art, and public life into a shared urban experience.
FRESH & FAIR COMMUNITY FOOD HUB
A comprehensive community food program that provides daily meals for seniors and the ill, redistributes food surpluses through urban collection points, delivers fresh products via mobile trucks to underserved areas, and operates a local ingredients market.
This semester studio investigates urban dynamics in the United States, Chicago, and a postindustrial site within the city, linking design to health and wellness. Through climate-responsive strategies and urban recycling, the studio explores how architecture and landscape architecture can transform stressed environments into more resilient, equitable, and connected places. The research addresses the multiple dimensions of wellbeing—physical, social, emotional, environmental, occupational, intellectual, spiritual, and financial—emphasizing the role of design in shaping healthier and more inclusive urban futures. Alongside conceptual and spatial proposals, students will integrate executive project criteria, including structural systems, materials, facilities, budgets, and work programming, approached with ethical and environmental responsibility.
2024 TIGER/Line ShapeFiles. (s. f.). https://www.census.gov/cgi-bin/geo/shapefiles/index.php? year=2024&layergroup=Blocks+%282020%29
About VA health benefits | Veterans Affairs. (2025, 21 julio). Veterans Affairs. https://www.va.gov/heal th-care/about-va-health-benefits/
Abdallah, S., Thompson, S., Michaelson, J., Marks, N., & Steuer, N. (2006). The Happy Planet Index. New Economics Foundation
Air Quality and Health. (s. f.). https://www.chicago.gov/city/en/depts/cdph/provdrs/environmental_heal th/svcs/air-quality-and-health.html
Bassil, K., Vakil, C., Sanborn, M., Cole, D., Kaur, J., & Kerr, K. (2007). Cancer health effects of pestici des: Systematic review. Canadian Family Physician, 53(10), 1704. https://pmc.ncbi.nlm.nih.gov/ articles/PMC2231435/
Census of Agriculture. (2025, January 21). United States Department of Agriculture National - Agricul tural Statistics Service. Retrieved August, 2025, from https://www.nass.usda.gov/Publications/ AgCensus/2017/Online_Resources/Ag_Census_Web_Maps/Data_download/index.php
Centers for Disease Control and Prevention (CDC). (2011). CDC/ATSDR Social Vulnerability Index. Atlan ta, GA: CDC.
ChiVes. (s. f.). https://chichives.com/data
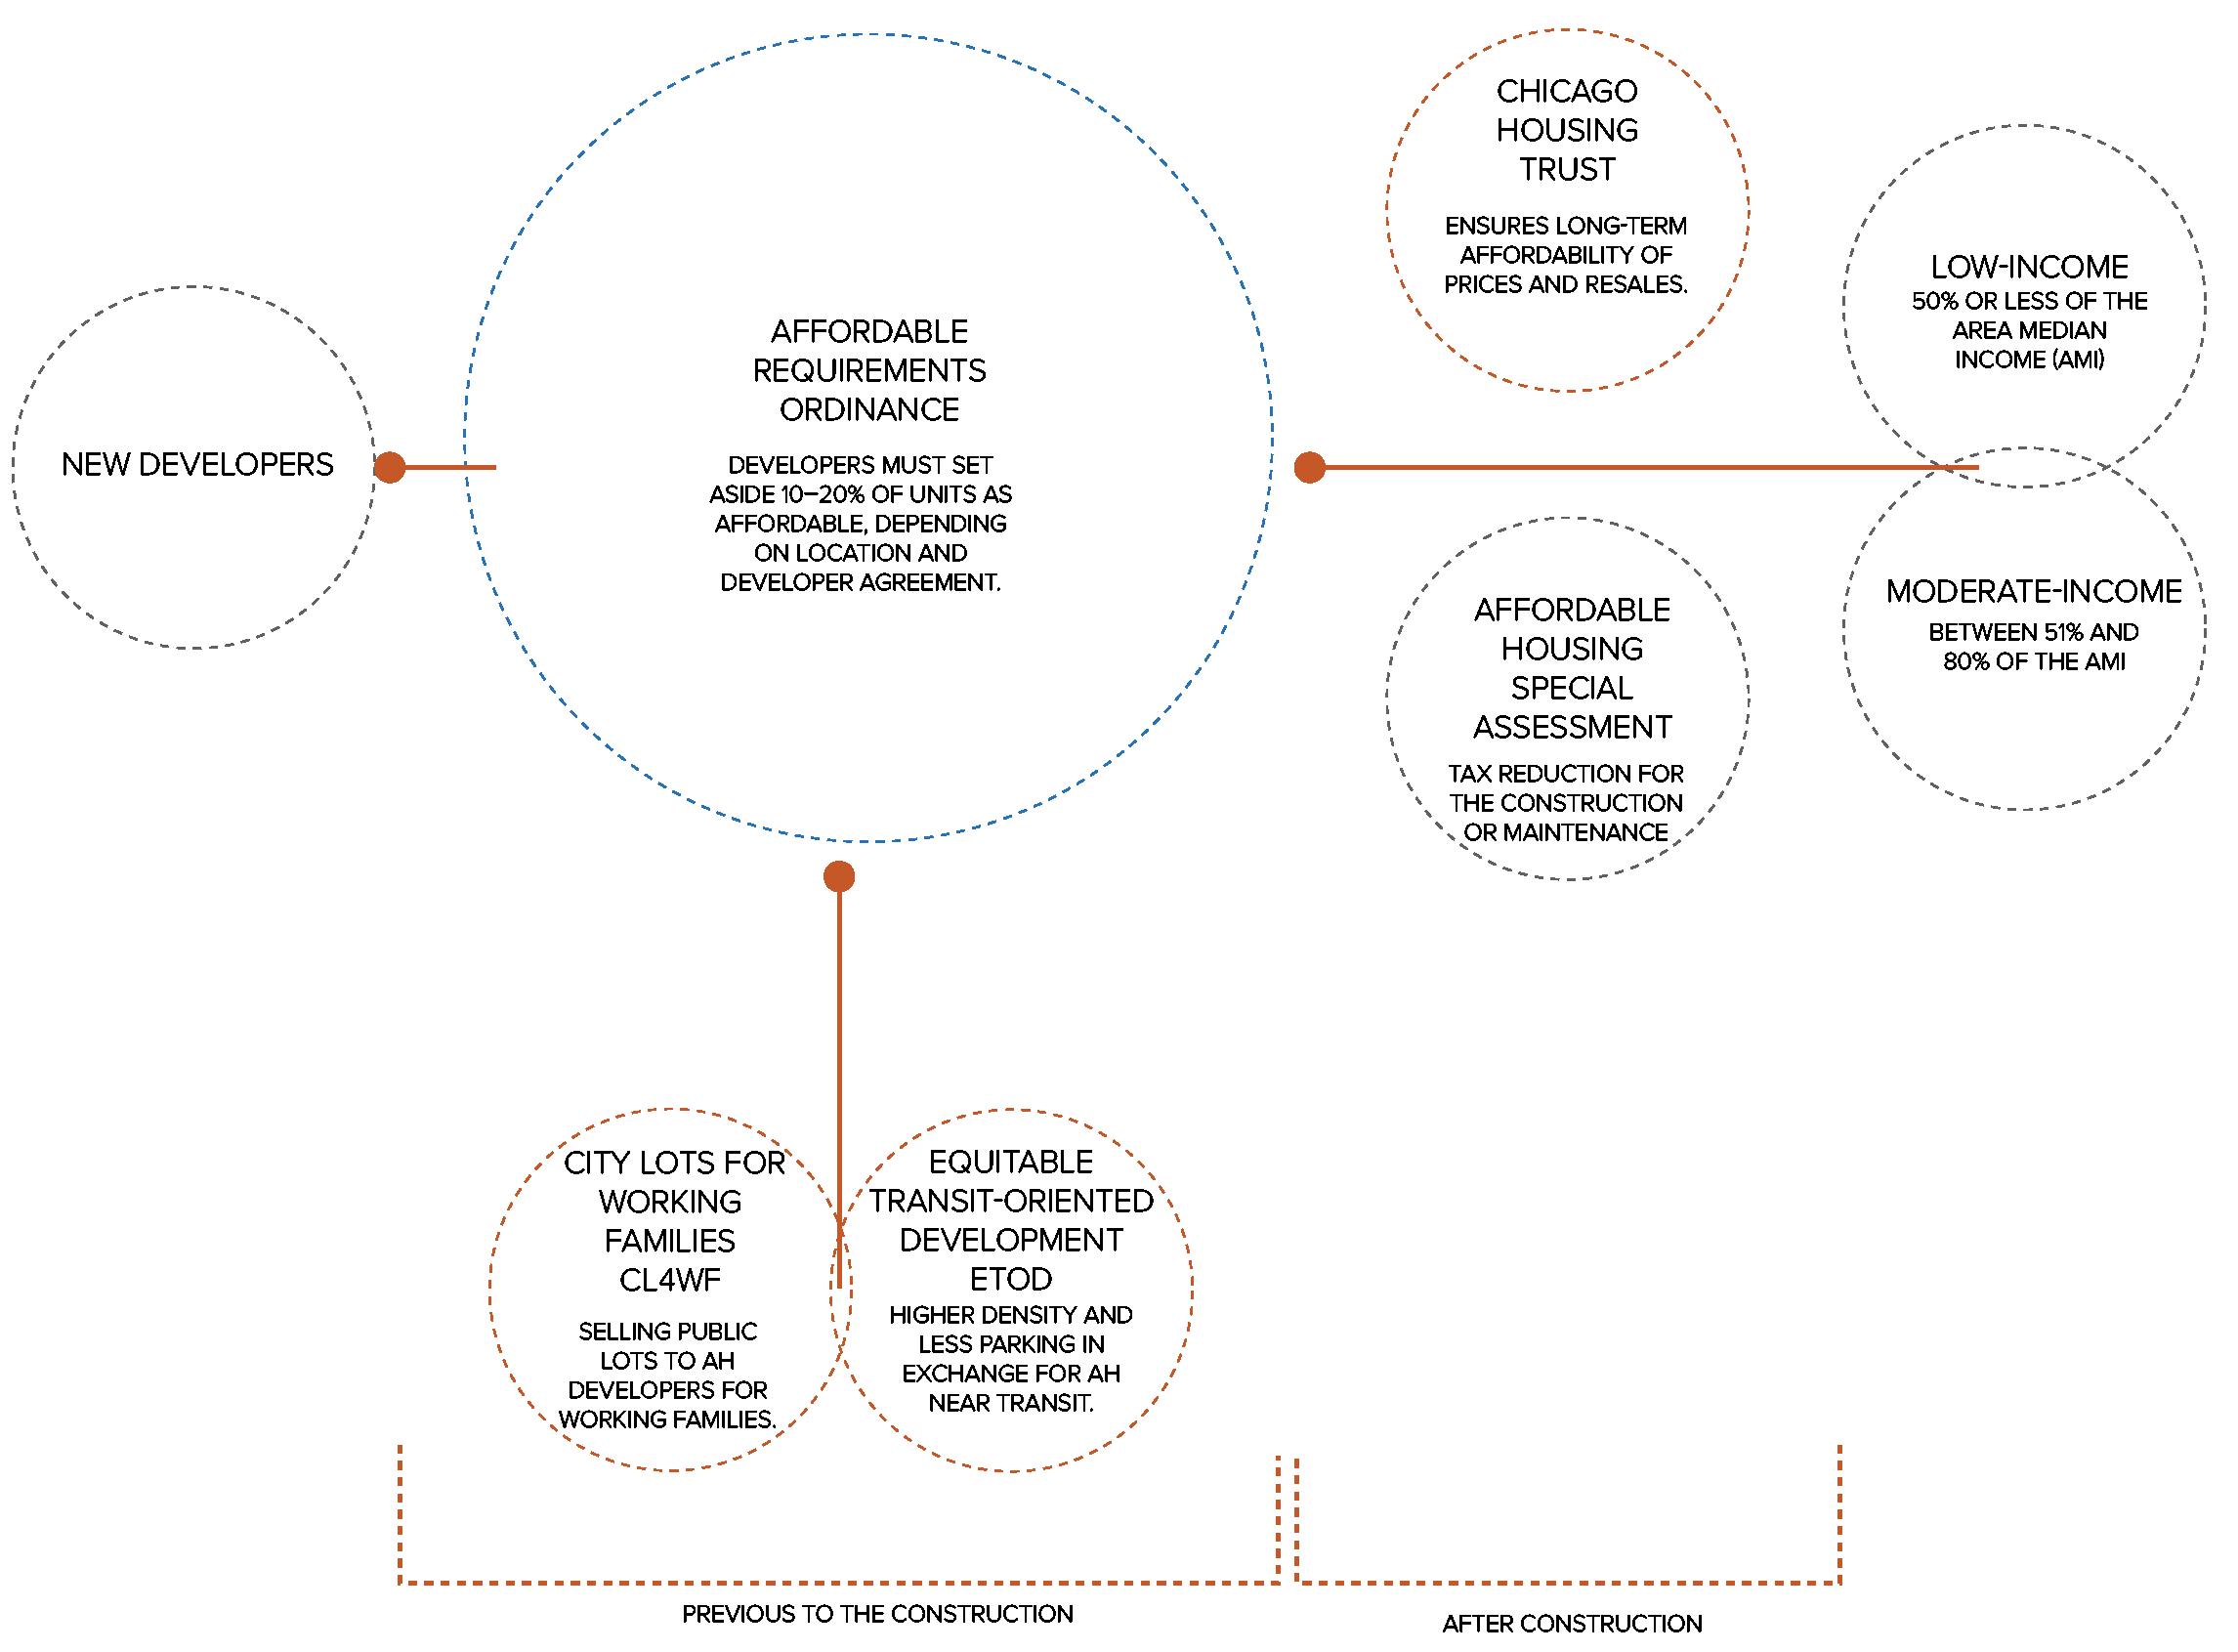
Chicago Housing Trust. (n.d.). Chicago Housing Trust. https://chicagohousingtrust.org
City of Chicago. (n.d.). Affordable Requirements Ordinance. https://www.chicago.gov/city/en/sites/affor dable-requirements-ordinance/home.html
City of Chicago. (n.d.). City Lots for Working Families. https://www.chicago.gov/city/en/depts/doh/prov drs/developers/svcs/city-lots-for-working-families.html
City of Chicago. (n.d.). Connected Communities Ordinance. https://www.chicago.gov/city/en/sites/equi table-transit-oriented-development/home/connected-communities-ordinance.html
City of Chicago | Data Portal | City of Chicago | Data Portal. (s. f.). Chicago. https://data.cityofchicago.org/
Cimino, A. M., Boyles, A. L., Thayer, K. A., & Perry, M. J. (2016). Effects of Neonicotinoid Pesticide Ex posure on Human Health: A Systematic Review. Environmental Health Perspectives, 125(2), 155–162. https://doi.org/10.1289/ehp515
Climate + Health Impacts by Region | ClimateRx. (s. f.). ClimateRx. https://www.climaterx.org/clima te-health-impacts-by-region?utm_source
Climate Prediction Center - U.S. Temperature and Precipitation Outlooks GIS Data. (s. f.). https://www. cpc.ncep.noaa.gov/products/GIS/GIS_DATA/us_tempprcpfcst/seasonal.php
CONEVAL. (2022, February 15). ¿Qué son las canastas alimentaria y no alimentaria? BLOG CONEVAL. Retrieved August, 2025, from https://blog.coneval.org.mx/2022/02/15/que-son-las-canas tas-alimentaria-y-no-alimentaria/
Cook County Assessor. (n.d.). Affordable Housing Program. https://www.cookcountyassessoril.gov/ affordable-housing
County-level data sets. (2025, January 31). United States Department of Agriculture National - Economic Research Service. Retrieved August, 2025, from https://www.ers.usda.gov/data-products/ county-level-data-sets/county-level-data-sets-download-data?
Current Map | U.S. drought monitor. (s. f.). https://droughtmonitor.unl.edu/CurrentMap.aspx
Data.gov - data.gov dataset. (s. f.). https://catalog.data.gov/dataset/
Eight Dimensions of Wellness. (2025, 9 junio). Student Health And Counseling Services. https://shcs. ucdavis.edu/health-and-wellness/eight-dimensions-wellness
Esie, P., Daepp, M. I. G., Roseway, A., & Counts, S. (2022). Neighborhood composition and air pollution in Chicago: Monitoring inequities with a dense, low-cost sensing network. American Journal of Public Health, 112(12), 1765–1773. https://doi.org/10.2105/AJPH.2022.307068
Food Access Research Atlas - Download the Data | Economic Research Service. (2021, 27 abril). https:// www.ers.usda.gov/data-products/food-access-research-atlas/download-the-data
Food Environment Atlas. (2025, July 30). United States Department of Agriculture National - Economic Research Service. Retrieved August, 2025, from https://www.ers.usda.gov/data-products/ food-environment-atlas/data-access-and-documentation-downloads?
Fuchs, M. (2025, June 5). Are Pesticides in Your Food Harmful? TIME; Time. https://time.com/7291075/ are-pesticides-dangerous-maha-glyphosate-atrazine/
Geographic Information Systems (GIS). (s. f.). https://www.chicago.gov/city/en/depts/dti/supp_info/geo graphic-information-systems.html
GIS and Map Data. (2023b, diciembre 6). MWRD. https://mwrd.org/what-we-do/documents-and-data/ gis-and-map-data
Grocery Stores - 2013. (2024, January 5). City of Chicago Data Portal. Retrieved August, 2025, from https://catalog.data.gov/dataset/grocery-stores-2013
Guide to Determining Climate Zone by County: Data Files | Building America Solution Center. (s. f.).
Health and Well-Being. (s. f.). https://www.who.int/data/gho/data/major-themes/health-and-well-being
Helliwell, J. F., Layard, R., Sachs, J. D., De Neve, J., Aknin, L. B., & Wang, S. (2025, 20 marzo). World Hap piness Report 2025. The World Happiness Report. https://www.worldhappiness.report/ ed/2025/
Hodge, C. (2020, November 27). A short history of American food (whatever that is). CNN Travel. Retrie ved August, 2025, from https://edition.cnn.com/travel/article/what-is-american-food-history/ index.html
Kerver, J. M., Wolf, L. E., Li, K., Turner, S. W. D., & Jung, H. O. (2024). Long-term exposure to ambient air pollution and measures of central hemodynamics and arterial stiffness among multiethnic Chicago residents. Environmental Health, 23, 47. https://doi.org/10.1186/s12940-024-01077-z
Krakowka, W. I., Luo, J., Craver, A., Pinto, J. M., Ahsan, H., & Aschebrook-Kilfoy, B. (2024). Household air pollution disparities between socioeconomic groups in Chicago. Environmental Research Communications, 6(9), 091002. https://doi.org/10.1088/2515-7620/ad6d3f
Level III and IV ecoregions of the Continental United States. (2024, December 13). US EPA. Retrieved August, 2025, from https://www.epa.gov/eco-research/level-iii-and-iv-ecoregions-continen tal-united-states
Liptrot, M. (2024, November 14). Former West Side Aldi to become affordable apartments with restau rant, grocery store. Block Club Chicago. https://blockclubchicago.org/2024/11/14/for mer-west-side-aldi-to-become-affordable-apartments-with-restaurant-grocery-store/
Malkan, S. (2025, May 21). Glyphosate: Cancer, liver disease, endocrine disruption and other health concerns. U.S. Right to Know. https://usrtk.org/pesticides/glyphosate-health-concerns/
Mental Health America. (2025a, marzo 5). Prevalence Data | Mental Health America. https://mhanational. org/the-state-of-mental-health-in-america/data-rankings/prevalence-data/
Mental Health America. (2025, 15 julio). State and County Dashboard | Mental Health America. https:// mhanational.org/data-in-your-community/mha-state-county-data
Metropolitan Water Reclamation District of Greater Chicago. (s. f.). Cómo funcionan sus alcantarillas: Una introducción a los sistemas de alcantarillado combinado del área de Chicago [PDF]. Recupe rado de https://mwrd.org/sites/default/files/documents/Understanding_Your_Sewer-Spanish. pdf
Organisation for Economic Co-operation and Development (OECD). (2011–2025). OECD Better Life Index. Paris: OECD.
Pasos, M. (2025, 6 mayo). Climate Zones of North America. Commission For Environmental Coopera
Pham, K. (2023, October 17). How to access food benefits programs and free groceries in Chicago. Borderless Magazine NFP. https://borderlessmag.org/2023/10/17/how-to-apply-for-federal-aidfor-food-in-chicago/
PLACES: Census Tract Data (GIS Friendly Format), 2024 release | Data | Centers for Disease Control and Prevention. (2024c, agosto 23). https://data.cdc.gov/500-Cities-Places/PLACES-Census-TractData-GIS-Friendly-Format-2024-/yjkw-uj5s/about_data
Schroeder, J., Van Riper, D., Manson, S., Knowles, K., Kugler, T., Roberts, F., & Ruggles, S. (2025). IPUMS National Historical Geographic Information System: Version 20.0 [Dataset]. Minneapolis, MN: I PUMS. https://doi.org/10.18128/D050.V20.0
SVI Data & Documentation Download. (2024, 16 diciembre). Place And Health - Geospatial Research, Analysis, And Services Program (GRASP). https://www.atsdr.cdc.gov/place-health/php/svi/ svi-data-documentation-download.html
The Learning Network. (2021). What’s Going On in This Graph? | SNAP ‘Thrifty Food Plan.’ The New York Times. https://www.nytimes.com/2021/10/07/learning/whats-going-on-in-this-graphoct-13-2021.html
U.S. Census Bureau, U.S. Department of Commerce. “Age and Sex.” American Community Survey, ACS 1 -Year Estimates Subject Tables, Table S0101, https://data.census.gov/table/ACSST1Y2023. S0101?q=ages. Accessed on August 2025
U.S. Food Imports. (2025, April 10). United States Department of Agriculture National - Economic Re search Service. Retrieved August, 2025, from https://www.ers.usda.gov/data-products/usfood-imports
United Nations Development Programme (UNDP). (1990–2025). Human Development Report. New York: UNDP.
US Census Bureau. (2024, 15 mayo). Cartographic boundary files. Census.gov. https://www.census.gov/ geographies/mapping-files/2020/geo/carto-boundary-file.html
US Census Bureau, Center for Economic Studies. (s. f.). Data - Longitudinal Employer-Household Dyna mics. https://lehd.ces.census.gov/data/
Why health & wellness matter - Ela Township, IL. (2024, 17 julio). Ela Township, IL. https://elatownship. gov/why-health-wellness-matter/
¿Cómo funciona el sistema de aguas de Chicago? (s. f.). [Vídeo]. Univision. https://www.univision.com/ local/chicago-wgbo/como-funciona-el-sistema-de-aguas-de-chicago-video