2023 ANNUAL REPORT

We have weathered many financial storms over the years, and 2023 proved challenging for the financial industry. These challenges caused many financial institutions, including Triangle Credit Union, to focus on economic stability, sustainability, and soundness.
Looking to 2024, we anticipate a stronger economy with reduced inflation, which is great news for all of us.
Whether we have a challenging or prosperous year, Triangle leans on our core values and strategic anchors to guide us in servicing our members and community. As a team, we have embraced these values and anchors, which have defined our corporate culture to increase transparency, communication, employee participation, member focus, and financial awareness.
In 2024, we will continue to develop our culture and dedicate resources to employee development at all levels of the organization. Our focus will be to enhance our comprehensive financial products and services and offer our members personalized financial solutions and education. We will expand our digital banking
and technology with Interactive Teller Machines (ITMs) at our drive-ups in Derry and Candia Road branches and enhance our infrastructure to support initiatives in cybersecurity, workforce evolution, enterprise risk, network capabilities, disaster recovery, and a new core system.
I am excited about this new year and believe these initiatives will position TCU for growth and future success.
On behalf of myself and the Senior Management Team, I want to thank our employees for their daily commitment to service excellence, the Board of Directors and Supervisory Committee for their continued guidance, and our members for your support—you have many financial service choices, and we’re glad you choose Triangle Credit Union.
Sincerely,
A. Scott MacKnight CEO/PresidentCommunity: We are actively involved in our communities by providing resources that promote engagement and success. Diversity: We welcome all groups and individuals desiring to be part of our mission to build unity by embracing and supporting all cultures.
Service: We connect with our members and employees by respectfully committing to their needs while adhering to Service Strategies Standards.

It is my privilege to provide Triangle Credit Union members with an annual review of the credit union activities for the past year. While it has been a difficult year for the financial industry, Triangle has achieved notable progress in accomplishing its strategic initiatives, thereby demonstrating strong management in a challenging economy. Triangle focused on financial technology (fintech) improvements and improving member experience when utilizing our products. In the technology sector, new Interactive Teller Machines (ITMs) were installed at the Franklin Street, Nashua and Amherst Street, Amherst branches. In addition, the online and mobile banking platforms introduced the newest person-to-person service, PayItNow; began rolling out a new Online Business Banking platform and added Spanish as a preferred language within Online and Mobile Banking.
For strategic growth, deposit initiatives were targeted throughout the year. Other initiatives focused on increasing products and services to grow the business and brand, including collaboration between departments to reintroduce in-person business visits and creation of new financial literacy resources.
Community outreach was in full-swing in 2023 and the Credit Union was delighted to support many area events and activities, including Nashua’s SummerFun series, Kids Fest, Make-A-Wish, Salvation Army’s AppleFest, and the Boys & Girls Club of Greater Nashua and Manchester to name only
a few. Triangle understands the importance of contributing to local communities and how it galvanizes deeper relationships with its members and demonstrates dedication to the areas the Credit Union serves. Triangle received accolades as Best Credit Union in the Greater Nashua area, Best Credit Union within the Souhegan Valley, Best of NH, and Best of the 603. These awards recognize the exemplary manner in which Triangle provides services to its members and how the Credit Union serves as an outstanding corporate citizen within the communities it serves. On behalf of the Board, I would like to thank Triangle staff for their effort and enthusiasm in making us the best Credit Union in NH. I would also like to thank our management team for their commitment and diligence, and to our members—thank you for your continued support.
Sincerely,
Margo Compagna Board Chair
On behalf of the Board of Directors, I am pleased to report Triangle Credit Union ended the fiscal year 2023 in a firm financial position despite a challenging year.
Loan originations in 2023 were $95.8 million, attributed to several external factors impacted by consumer and commercial lending during the year. Although our market area experienced a low inventory of new and used homes and high mortgage interest rates, we continued to serve our homeowners, originating $20.6 million in residential mortgages. Home equity lines of credit (HELOC) grew by $10.1 million from 2022 through new originations and the use of existing lines. Higher interest rates impacted our members with purchases of vehicles totaling $31.5 million, a decrease from the prior year.
Commercial lending remained strong, with new loans totaling $26.8 million. Overall, the Credit Union ended the year with a loan balance of $619.2 million, a decrease of $42.7 million or -6.43% compared to the prior year.
Members took advantage of our higher earning certificates of deposits, increasing balances in 2023 by $62.3 million. Other share products saw a decrease from 2022 of $98.7 million under the pressure of inflation and a high-interest rate environment.
Total assets decreased -5.58% to $865.8 million. Net income for the year was $987 thousand, primarily due to the slowing of loan and deposit growth. Non-interest income and operating expenses were in line with the prior year.
The credit union maintained a low delinquency ratio of 0.41% and a charge-off ratio of 0.11% at year-end; both ratios align with industry standards.
On behalf of the credit union, I would like to express my sincere thanks and appreciation to our elected officials, committee members, and volunteers for their dedication and support to the management team and our employees for their continued service to our members.
Respectfully submitted,
David Fredette Treasurer
The Supervisory Committee of a credit union is tasked to perform and oversee audits. These reviews consist of audits of the institution’s practices, as well as a year-end examination of our books.
As Triangle Credit Union (TCU) continues to grow, the oversight by federal and state regulators increases. TCU uses the accounting firm of Shatswell, MacLeod & Company to conduct comprehensive internal audits of our policies and procedures. The audits are conducted over the course of our fiscal year. The Committee tracks these reports and any findings and reviews any action items they identify with the Management Team.
I am proud to inform our members that TCU continues to perform in an exemplary manner.
This past year we also conducted the Biennial verification of member accounts. As part of this process, each member was asked by us to review their month-end June 2023 statements and inform us of any discrepancies. I am pleased to inform you that findings from the verification were positive, and that there were no issues worthy of note.
Our annual examination of our financial books was conducted by Baker, Newman, Noyes. After an extensive review, they found that for 2023, we were in compliance with “generally accepted accounting principles,” and that our financial statements were correct.
The Committee was pleased to welcome a new member this past year. Mariana Silva filled the vacancy created by the passing of long-time member Ron Rioux.
All of what has been accomplished is due in no small part to the outstanding work of the TCU Management Team, our dedicated employees and the TCU Board of Directors. The committee wishes to thank all of them for their hard work and cooperation throughout this past year.
As chair, I would also like to thank the members of the Supervisory Committee for their efforts during this past year. I can assure you our members, that they are dedicated to serving you and the credit union.
Respectfully,
Ed Lecius, ChairDerek
DanielsonDick Lavoie
Jack Monahan
Mariana Silva


 Margo Compagna Chair
Ed Lecius Chairman
Bob Duhaime Director
Robert Demers 1st Vice President
Richard Lavoie Committee Member
David Degulis Director
Mark Richardson 2nd Vice President
Jack Monahan Committee Member
Lillian Rodriguez Director
Adeel Tahir Director
Rebecca MacLennan Secretary
Mariana Silva Committee Member
David Fredette Treasurer
Derek Danielson Committee Member
Margo Compagna Chair
Ed Lecius Chairman
Bob Duhaime Director
Robert Demers 1st Vice President
Richard Lavoie Committee Member
David Degulis Director
Mark Richardson 2nd Vice President
Jack Monahan Committee Member
Lillian Rodriguez Director
Adeel Tahir Director
Rebecca MacLennan Secretary
Mariana Silva Committee Member
David Fredette Treasurer
Derek Danielson Committee Member


 A. Scott MacKnight CEO/President
Brian Luce VP Triangle Financial Group
Rebecca Thomas SVP Marketing
Karen Wood SVP Chief Financial Officer
Curtis Barnes Executive Assistant
Karin Taylor SVP Human Resources
Lisa VanBiene SVP Member Services
Jeff Mayer Financial Advisor
Jose Rivera Hernandez SVP Information Technology
John Ziemba SVP Commercial Services
Kelley Brown Office Practice Manager
Pamela Ford SVP Lending
Paola Gutierrez Licensed Insurance Agent
A. Scott MacKnight CEO/President
Brian Luce VP Triangle Financial Group
Rebecca Thomas SVP Marketing
Karen Wood SVP Chief Financial Officer
Curtis Barnes Executive Assistant
Karin Taylor SVP Human Resources
Lisa VanBiene SVP Member Services
Jeff Mayer Financial Advisor
Jose Rivera Hernandez SVP Information Technology
John Ziemba SVP Commercial Services
Kelley Brown Office Practice Manager
Pamela Ford SVP Lending
Paola Gutierrez Licensed Insurance Agent


 Lana Dal Molin VP of Community Outreach and Sales Franklin St., Nashua, NH
Seana Hill Branch Manager Franklin St., Nashua, NH
Lyn Anderson Branch Manager Elm St., Manchester, NH
Anabel Ulloa Branch Manager DW Hwy, Nashua, NH
Lisa Ward Branch Manager Candia Rd., Manchester, NH
Heather Hebert AVP Operations Temple St., Nashua, NH
Nathalie Letourneau Branch Manager Windham Rd., Derry, NH
Kathy Card H.R. Manager Temple St., Nashua, NH
Roxanne Nelson AVP of Mortgage Lending Franklin St., Nashua, NH
Angela Johnson Branch Manager DW Hwy, Merrimack, NH
Terri Connolly Marketing Manager Temple St., Nashua, NH
Ryan Ruggiero
AVP Contact Center Temple St., Nashua, NH
Ivan Rochford Information Technology Manager Franklin St., Nashua, NH
Mayra Dominguez Accounting Manager Temple St., Nashua, NH
Muhammad Ali Consumer Lending Manager Temple St., Nashua, NH
Marcel Sánchez Galindo Branch Manager Route 101A, Amherst, NH
David Helie Facilities Manager Temple St., Nashua, NH
Michelle Ducharme AVP Member Experience Temple St., Nashua, NH
Samantha Herod Project Manager Temple St., Nashua, NH
Lana Dal Molin VP of Community Outreach and Sales Franklin St., Nashua, NH
Seana Hill Branch Manager Franklin St., Nashua, NH
Lyn Anderson Branch Manager Elm St., Manchester, NH
Anabel Ulloa Branch Manager DW Hwy, Nashua, NH
Lisa Ward Branch Manager Candia Rd., Manchester, NH
Heather Hebert AVP Operations Temple St., Nashua, NH
Nathalie Letourneau Branch Manager Windham Rd., Derry, NH
Kathy Card H.R. Manager Temple St., Nashua, NH
Roxanne Nelson AVP of Mortgage Lending Franklin St., Nashua, NH
Angela Johnson Branch Manager DW Hwy, Merrimack, NH
Terri Connolly Marketing Manager Temple St., Nashua, NH
Ryan Ruggiero
AVP Contact Center Temple St., Nashua, NH
Ivan Rochford Information Technology Manager Franklin St., Nashua, NH
Mayra Dominguez Accounting Manager Temple St., Nashua, NH
Muhammad Ali Consumer Lending Manager Temple St., Nashua, NH
Marcel Sánchez Galindo Branch Manager Route 101A, Amherst, NH
David Helie Facilities Manager Temple St., Nashua, NH
Michelle Ducharme AVP Member Experience Temple St., Nashua, NH
Samantha Herod Project Manager Temple St., Nashua, NH
Triangle Credit Union is a proud sponsor of over 65 community initiatives and organizations in 2023. Some of these include
• Boys & Girls Club of Nashua
• Salvation Army
• The Front Door Agency
• Make-A-Wish NH
• The Nashua Center for the Arts
• and more!
Angel Tree is an outreach of The Salvation Army of Greater Nashua. In 2023, the Angel Tree Tag program assisted over 1,100 families in need of additional support during the holiday season.

 ANGEL TREE TAG
1
2
ANGEL TREE TAG
1
2
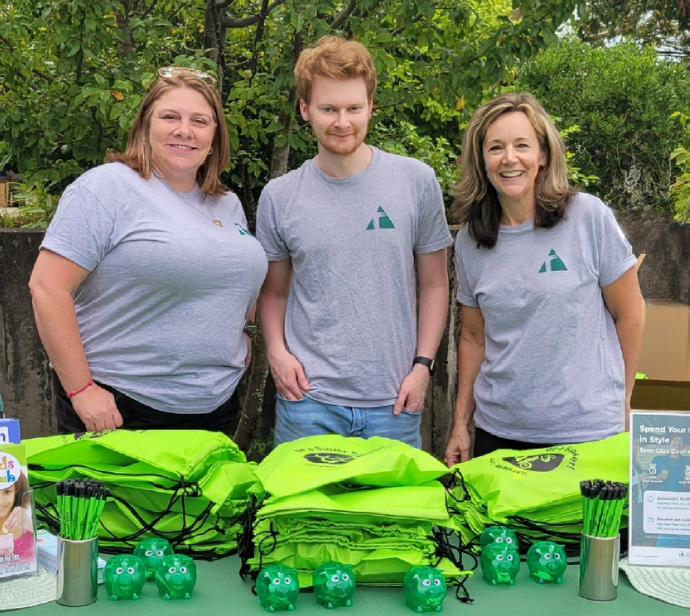
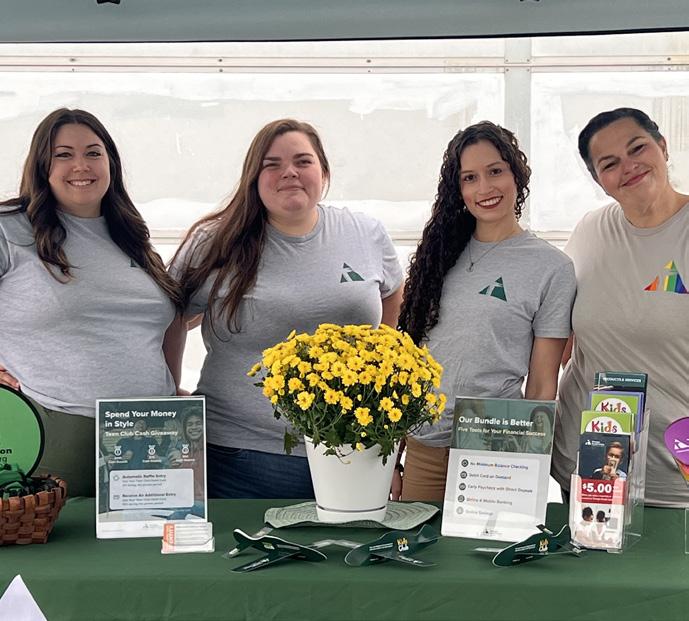
In addition to our sponsorships and donations, Triangle Credit Union is involved in our community through volunteerism at local events, festivals, parades, and fundraisers.


 Nashua Pride
Gate City Brew Fest
Trunk-or-Treat
Apple Fest
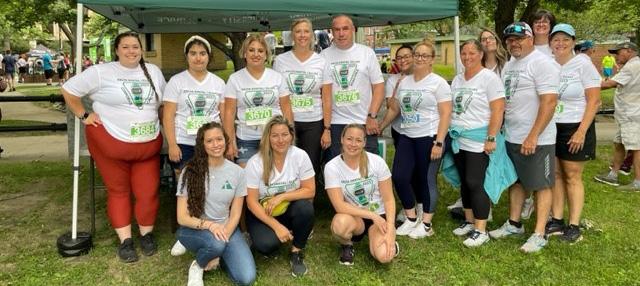
Cigna/Elliot Road Race
Nashua Goes Back to School
Wheels & Wings
Nashua Pride
Gate City Brew Fest
Trunk-or-Treat
Apple Fest
Cigna/Elliot Road Race
Nashua Goes Back to School
Wheels & Wings
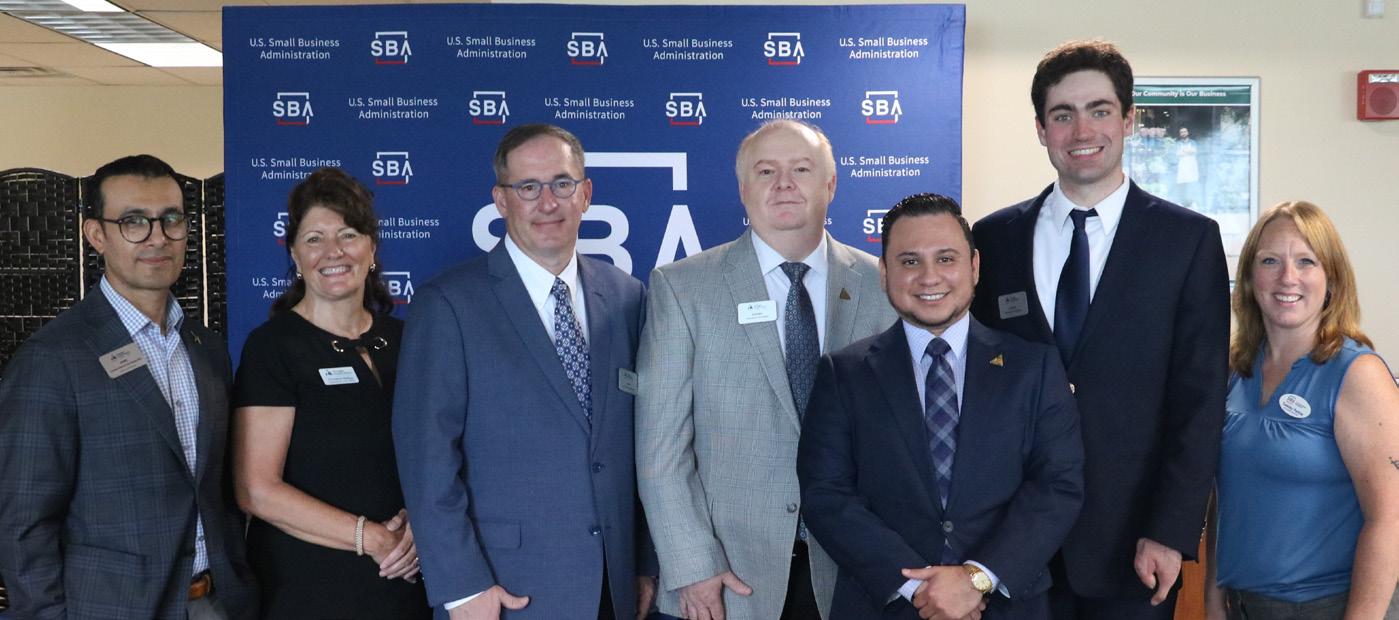


 SBA Lending Expo
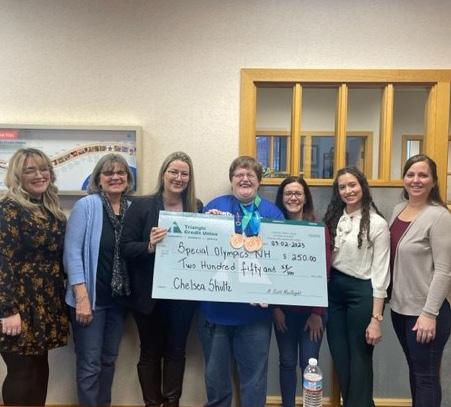
Special Olympics Sponsorship
Multicultural Festival
CMC Gala
Nashua Winter Holiday Stroll
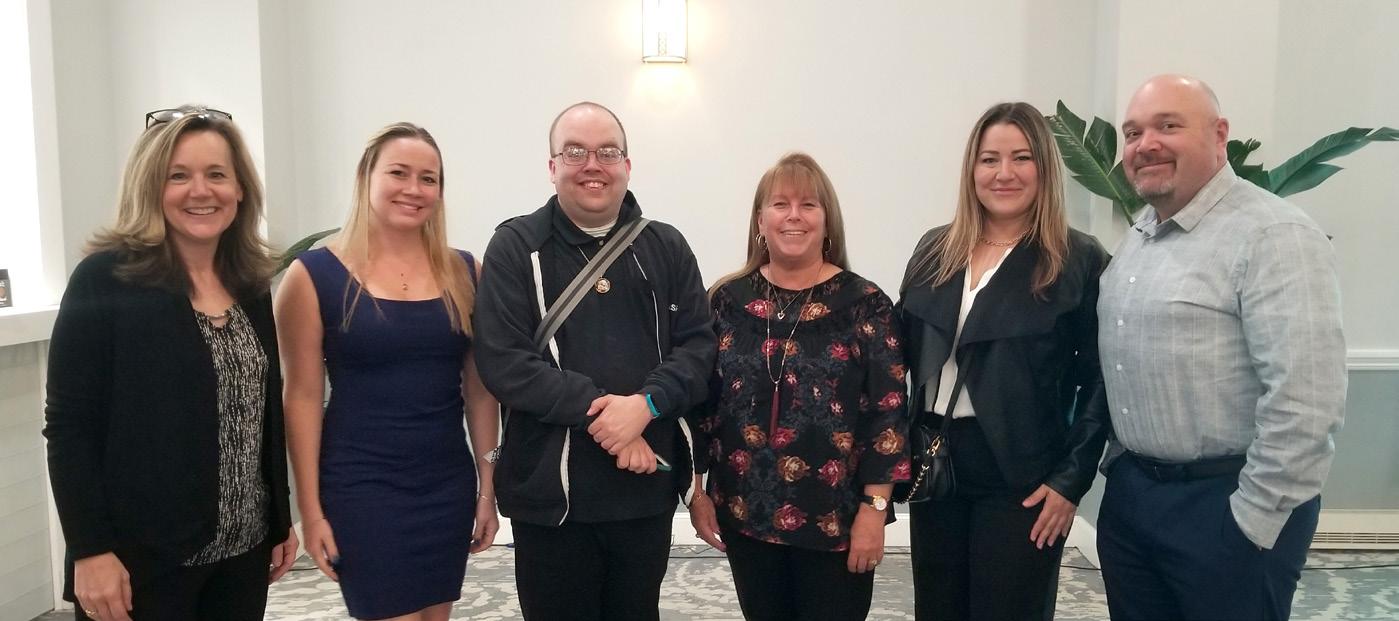
Rob Doherty Recognized at Gateways Annual Fundraiser
SBA Lending Expo
Special Olympics Sponsorship
Multicultural Festival
CMC Gala
Nashua Winter Holiday Stroll
Rob Doherty Recognized at Gateways Annual Fundraiser


Videos & Reels
Join us for fun, relevant financial topics that provide resources to help you make financial decisions. The Making Money Personal Podcast talks about the impact that money has on your personal and professional life. Our podcast examines trends and topics with support from industry professionals.