City of South Jordan

2022 DRINKING WATER QUALITY REPORT

To advance a high quality of life through superior public infrastructure maintenance and utility services by delivering innovative, responsive, and efficient/effective services.
Manages the rebate programs, provides assistance for residents and assesses opportunities to improve water usage throughout South Jordan.
Assesses high water usage, monitors and checks for leaks with residents and commercial customers.

Installs water meters for new construction, performs testing on existing meters, assists in collecting monthly water reads, manages hydrant meter services, and collects hydrant meter reads.
Maintains and manages the city backflow program. Provides knowledge for swing-connections and backflow operation to
Repairs and maintains water lines, valves, fire hydrants, meters, etc.
Works with developers and contractors on new construction of water system and testing to meet state standards.
Ensures compliance with all federal and state water quality standards and regulations.
Takes more than 80 water samples each month throughout the City.
Installs and maintains water quality sample stations.
Investigates all water quality issues.
Maintains the City's water pressure zones, tanks, transmission lines and pressure regulating vaults.

Investigates water pressure issues for residents, and provides fire flow data for new development.
Marks all Bluestakes requests.
Maintains the City's secondary water system; including pipes, weirs, pumps, meters, connection points, valves, etc.
Repairs all secondary water leaks and assists residents in locating secondary water access.
Action Level
AL
MCLG
The concentration of a contaminant which, when exceeded, triggers treatment or other requirements which a water system must follow.
Maximum Contaminant Level Goal
The level of a contaminant in drinking water below which there is no known or expected risk to health. MCLGs allow for a margin of safety.
Maximum Contaminant Level
MCL
The highest level of a contaminant that is allowed in drinking water. MCLs are set as close to the MCLG as feasible using the best available treatment technology.

mg/L Milligrams per Liter
The amount of Lead and Copper were below the Action Level (AL).
The range of detected lead was 0.0 - 3.0 ppb; the AL for Lead is 15 ppb.
The range of detected Copper was 7.8 - 300 ppb; the AL for Copper is 1300 ppb.
NTU
Nepholometric Turbidity Unit
A measure of cloudiness of the water.
pCi/L Picocuries Per Liter
A measure of radiation
PPM Parts Per Million
TT Treatment Technique
A required process intended to reduce the level of a contaminant in drinking water.
ug/L Micrograms Per Liter
This can be caused by a number of different factors, including but not limited to algae growth in the mountain reservoirs in late summer, stagnant water during winter, chlorine levels.
Although these issues just make the water taste or smell different, always contact the Water Division if you notice a problem.
This is most often caused by air in the water lines. Fill a glass with water and if it is air it will become clear after 10-15 minutes.
If the water remains cloudy or if there is a smell with the cloudiness contact the water division immediately.
Is the water pink, reddish-brown, or muddy?
This can be caused by natural occurring sediments in the plumbing lines, dirt from water leak repair, water softener malfunctions or sediments from your water heater. The Water Division will help investigate the cause for free.
The table below lists all of the parameters in the drinking water detected by Jordan Valley the calendar year of this report. The presence of these parameters in the water does not data presented in this table is from testing done in the calendar year of this report. For certain once per year because the concentrations do not change frequently. For questions regarding
Valley Water Conservancy District (JVWCD) or its suppliers in the drinking water during not necessarily indicate that the water poses a health risk. Unless otherwise noted, the certain parameters, EPA and/or the State requires monitoring at a frequency less than regarding JVWCD water quality data, please call (801) 446-2000.
0.0 No 2022
2000 No 2022
NE No 2022
4.0 No 2022
NE No 2022
10.0 No 2022
1.0 No 2022
50.0 No 2022
NE No 2022
NE No 2022
NE No 2022
NE No 2022
TT No 2022
Erosion of naturally occurring deposits and runoff from orchards.
Erosion of naturally occurring deposits.
Erosion of naturally occurring deposits.
Erosion of naturally occurring deposits and discharges from fertilizers. Fluoride added at source.
Erosion of naturally occurring deposits.
Runoff from fertilizer, leaching from septic tanks, and naturally occurring organic material.
Runoff from fertilizer, leaching from septic tanks, and naturally occurring organic material.
Erosion of naturally occurring deposits.
Erosion of naturally occurring deposits and runoff from road deicing.
Erosion of naturally occurring deposits.
Erosion of naturally occurring deposits.
MCL is 5.0 for groundwater. Suspended material from soil runoff.
MCL is 0.3 NTU 95% of the time for surface water. Suspended material from soil runoff.
This is a measure of the concentration of UVabsorbing organic compounds. Naturally occurring.
For questions regarding South Jordan City water quality
Health Advisory: Drinking water, including bottled water, may reasonable be expected to contain at least water poses a health risk. More information about contaminants and potential health effects can be obtained vulnerable to contaminants in drinking water than the general population. Immuno-compromised persons plants, people with HIV/AIDS or other immune system disorders, some elderly, and infants can be particularly providers. EPA/CDC guidelines on appropriate means to lessen the risk of infection by Cryptosporidium and
deposits.
quality data, please call South Jordan City at (801) 446-HELP.
Lead violation is determined by the 90th percentile result. Corrosion of household plumbing systems, erosion of naturally occurring deposits.
Copper violation is determined by the 90th percentile result. Corrosion of household plumbing systems, erosion of naturally occurring deposits.
small amounts of some contaminants. The presence of contaminants does not necessarily indicate that obtained by calling the EPA’s Safe Drinking Water Hotline (1-800-426-4791). Some people may be more persons such as persons with cancer undergoing chemotherapy, persons who have undergone organ transparticularly at risk from infections. These people should seek advice about drinking water from their health care and other microbial contaminants are available from the Safe Drinking Water Hotline (1-800-426-4791).
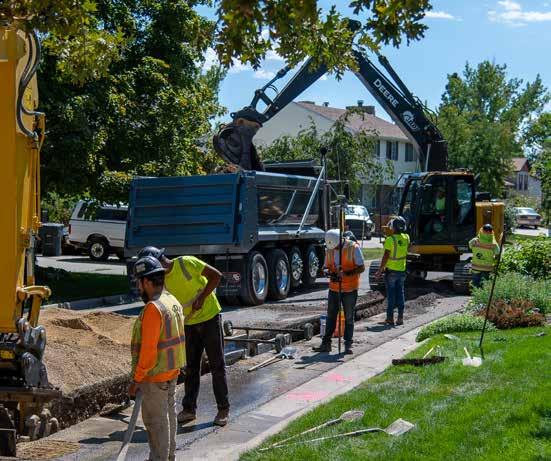
1. Replaced Skye Drive culinary water main
2. Added water conservation technician position
3. Expanded water division to 25 employees
4. Added hardscape and curbing rebates
Water Wise Plant Rebates - 257
Toilet Rebates - 41
Fixture Rebates - 12
Water Customer Portal Sign-Ups: 330
Grass Removal Rebates: 433 rebates amounting to 286,394 square feet of grass removed
South Jordan City is dedicated to providing our residents and customers with safe, clean, drinking water. Maintaining a backflow prevention program is one of the ways the City accomplishes this goal. A joint responsibility between the City and its residents/customers must exist to ensure all areas of the water distribution system are adequately protected.
All sprinkler irrigation systems that are designed to use both the secondary (canal) and culinary water are required to have a physical disconnect, swing joint connection. The swing joint connection makes it impossible for the drinking and secondary water to be used or connected at the same time.

Learn more at sjc.utah.gov/water
OR
Contact Justin Blake
jblake@sjc.utah.gov | (801) 446-HELP
1. Consider lowering your watering times. On average, a sprinkler zone uses 1,020 gallons per watering.
2. Install a smart controller to have greater control of the sprinkler system, and skip watering on weather events such as rain or windy days.

3. Fix leaking irrigation valves or water service leaks outside of the home and leaky toilets, pipes, fixtures, etc. inside the home.
4. Create hydrozones to match watering times to plant irrigation demand. Consider installing drip systems, on their own zone, for shrubs, trees, and water efficient plants.
5. Raise lawnmower height to allow grass to grow longer, healthier and to prevent evaporation.
•
In Utah, residential landscapes can appear stressed in March, prior to the start of the irrigation season. Overwatering tends to occur in April-May. In June-July, if clocks are not adjusted, the landscape appears stressed once again. In response, irrigation supply is increased and not adjusted for the remainder of the season, leading to overwatering from August-October.
• There is ample opportunity to conserve water through irrigation clock adjustments. Refer to page 12 for tricks and tips on how conserve water by monitoring outdoor use.

The online portal allows you to:

• Access your hourly, daily, and monthly water usage

• Set water usage goals and receive text/email alert usage reminders

• View your water usage in comparison to your neighborhood average
To sign up* visit sjc.utah.gov/wateruse
*When you sign up a one-time $20 credit will be applied to your utility bill within 60 days of creating a water usage goal.
An estimated 60% of residential water use is for outdoor purposes. The main way to reduce outdoor water usage is to cut down the amount of time for each zone on sprinkler systems. The next best way is to remove grass and convert areas to water-wise landscaping. A combination of the two efforts is a great start to reducing water use.
While the progress we’ve made is excellent, the continued growth and demand for water continues, especially in South Jordan. 2022 was an extremely tough water year for the state of Utah. The drought conditions across much of the state were considered severe. South Jordan has goals of reducing water usage throughout the city, and has multiple programs and policies in place to acheive this goal. These include grassremoval rebates, leak detection systems, water customer portal, landscape re-design, new construction requirements, and more.
The landscaping surrounding the building consists of turf grass and overgrown shrubs that were watered with pop-up sprayers. Pop-up sprayers are planned to be removed and converted to dripline irrigation. This project is intended to be a water-wise landscape, to conserve water and beautify the landscaping around City Hall.
The City has completed the designs of parkstrips along 2700 W. and 11400 S. Work is planned to start in 2023, with removal and re-construction of these parkstrips to change to waterwise landscaping.


South Jordan City provides over $1,450 per residence in different rebates and programs to encourage residents to save water and save money.
Water-wise plants rebate, drip system conversion kit, weed barrier, and rock mulch
Recieve up to $500 for removing currently watered turf-grass and replacing with hardscape material (concrete, pavers, brick, patio).
Remove 150+ square feet of currently watered turf-grass to create a “shape, or perimeter area” with curbing, rock, and plants, and receive up to $250 for curbing material.

Replace a pre-1992 toilet (1.6+ gal/flush) with a water-efficient toilet (1.28 or less gal/flush) and receive up to $100 per toilet. Limit of 2 toilets per residence.
Replace a pre-2005 fixture with a new water Efficient low-flow fixture to receive up to $100 per fixture. Limit of 2 fixtures per residence.
