
Editor
Lisa Cambridge, NZCS DipQA B.ApplManagement, MNZIMLS, NZIMLS, Rangiora
Deputy Editors
Michael Legge, PhD MRSB FIBMS FNZIMLS FFSc(RCPA), University of Otago, Dunedin
Holly Perry, DipMLS MAppSc(Hons) PhD MNZIMLS, University of Otago
Emeritus Editor
Rob Siebers, PGCertPH FNZIC FNZIMLS FRSB HonFNZAP, Wellington
Editorial Board
Paul Austin, MSc(Hons) DipMLT MNZIMLS, LabPlus, Auckland
Jillian Broadbent, FNZIMLS, NZIMLS, Rangiora
Julie Creighton, DipMLS, FNZIMLS, Canterbury Health Laboratories, Christchurch
Sujata Hemmady, PGDipMLSc, MMLSc, MNZIMLS, LabPlus, Auckland
Chris Kendrick, GradDipSci MSc MNZIMLS, Massey University, Palmerston North
Craig Mabbett, BMLSc PGDipHSM, LabCare Pathology, New Plymouth
Holly Perry, DipMLS MAppSc(Hons) PhD MNZIMLS, University of Otago
Mohd. Shahid, MBBS MD PhD FNZIMLS, PGDipHSM, Arabian Gulf University, Bahrain
Terry Taylor, BSc DipMLS MNZIMLS, Southern Community Laboratories, Dunedin
Sharon Tozer, DipBis Stud, AT CAANZ, NZIMLS, Rangiora
Robyn Wells, BApllSci(MT) GradCert Haem, Milton, Australia
Formatting
Sharon Tozer, AT DipBusStud, Executive Office NZIMLS, Rangiora
About the Journal
The New Zealand Journal of Medical Laboratory Science (the Journal) is the official publication of the New Zealand Institute of Medical Laboratory Science (NZIMLS). The Journal is peer reviewed and publishes original and review articles, case studies, technical communications, and letters to the Editor on all subjects pertaining to the practice of medical laboratory science. The Journal is open access (www.nzimls. org.nz/nzimls-journal) and is published three times per year in March, July, and November. Hard copies are circulated to all NZIMLS members and universities and research units in New Zealand and overseas. Current circulation is about 2,800 copies per issue. Printing is by Blueprint Ltd, Christchurch on environmentally responsible paper using elemental chlorine free third party certified pulp sourced from well managed and legally harvested forests and manufactured under the strict ISO14001 Environmental Management System. The Journal is indexed by CINAHL, EMBASE, SCOPUS, Informit, Thomson Gale, EBSCO and Biosis Citation Index, and the Journal Editors are members of the World Association of Medical Editors (www.wame.org).
Brief instructions to authors
The Journal accepts original submissions from anyone and anywhere. Comprehensive instructions can be found on the NZIMLS website (www.nzimls.org.nz/instructions-to-authors. html). All submissions will undergo single-blind peer review and possibly plagiarism checking with iThenticate™ software. If accepted for publication, copyright is vested in the author(s) under terms of the Creative Commons Attribution License (www. creativecommons.org/licenses/by/2.5/legalcode). The authors are responsible for the scientific content and views. Opinions expressed in the Journal are not necessarily those of the Editors, Editorial Board, or Council of the NZIMLS.
Advertising and subscription
Advertisement bookings and enquiries should be addressed to the NZIMLS Executive Officer, Sharon Tozer: sharon@nzimls.org.nz. Phone +64 3 313 4761.
Journal cover © Joseph Manieda, Te Whatu Ora Hawke’s Bay
Editorial
Sustainability and green laboratory practices.
Lisa Cambridge
Reviews
Blood
03
systems and antigens described in the last 20 years:
Implementation of
In this issue
For the first issue of 2024, we have an absolute star cast of New Zealand authors and articles from New Zealand Medical Laboratories as well as news and events from within the profession and around the country.
I share my thoughts on sustainability initiatives in the New Zealand healthcare sector in the Editorial, looking to understand how government legislation is being interpreted by the healthcare providers and question what can be done to support the implementation of green initiatives into clinical laboratories.
New information about blood group systems and antigens are presented regularly in the literature but not collated into a single text resource. Natalya Clark and Holly Perry from the University of Otago developed a review collection of 122 blood group antigens and 17 blood group systems that have been described in the past 20 years (2003-2023), including genetic basis of variants and the clinical significance of their antibodies where known. Reports showed that blood group systems have a high degree of polymorphism in a large and heterogenous human population, with new variants appearing on a continuous basis. These descriptions, carefully tabled, together with an extensive literature review and an emphasis on clinical practice, provide a useful resource for practising transfusion scientists.
In our second blood group system article, Rei Miyamoto, from the University of Otago and a NZIMLS top student award winner for 2023, reviews the MNS blood group system in the context of transfusion science. This large and important system of polymorphic, high and low frequency antigens are formed through genetic recombination, unequal crossing over, gene conversion and SNPs, as well as the interesting phenotypic frequencies among population groups. In transfusion science, many of the human blood group systems have alloantibodies that are clinically significant with the potential to cause adverse events during blood transfusions. Miyamoto describes the diverse molecular and immunological properties that the MNS blood group system exhibits and emphasizes the importance of matching MNS blood groups for patients requiring blood transfusion in whom atypical clinically significant alloantibodies of the MNS system have been encountered and can cause transfusion reactions or hemolytic transfusion disease (HTR) of the fetus and newborn (HDFN).
Leptospirosis is an illness caused by infection with pathogenic spirochaetes of the Leptospira genus and a notifiable disease in New Zealand. Hall and colleagues from Pathlab, and ESR in the Waikato present a review of ten years of Leptospira serology and PCR testing within New Zealand to identify and report the most sensitive testing strategy. A typically zoonotic transmission, Leptospirosis causes a biphasic illness with a range of presentations that are nonspecific and variable, making the infection difficult to identify by clinical presentation alone. Using a retrospective review of serology and PCR results over a ten period, analysing Leptospira IgM and PCR test data from 3,344 patients they determined the utility and value of the different tests available to determine what strategies have been the most effective in detecting leptospirosis. Results of this study recommend a combination of PCR and well-timed serology to be the most effective testing strategy as no one test captures all clinical cases.
Can the use of triglyceride to glucose and triglyceride to high density lipoprotein ratios indicate metabolic syndrome in the spinal cord injured male? This is the question posed by Jones and Legge from the School of Physical Education and Department of Biochemistry at the University of Otago in an original study. Spinal cord injury resulting in paralysis causes significant changes in body composition below the lesion, loss in motor function leads to skeletal muscle wasting and fat mass increase above and below the lesion and contributes to major metabolic changes strongly associated with cardiovascular disease and the development of factors associated with metabolic syndrome including, glucose intolerance, hyperinsulinaemia, insulin resistance and dyslipidaemia. The investigation of TyG:G and TyG:HDL ratios in twenty matched controls and twenty spinal cord injured males identified significant differences between spinal cord injured complete and spinal cord injured incomplete, concluding that the level of de-innervation has a significant role in the onset of metabolic syndrome in the spinal cord injured.
Dennis Mok from Australia and his global colleagues report on the implementation and International Standard (ISO) requirements of laser warning markings for equipment and instruments in the New Zealand diagnostic laboratory. The objective in their scientific letter is to enhance the awareness of requirements related to risk control measures and present the accepted warning markings for Class1 to Class 4 laser equipment that must be clearly visible. Images of the warning markings can be found in the supplementary material on the Journal website.
Michael Legge shares his book review for; “Most delicious poisons: the story of nature’s toxins from spices to vices” by evolutionary biologist, Noah Whiteman.
A briefing for the incoming minister and associate ministers was prepared by the NZIMLS Council in November 2023 and was submitted to the incoming government ministers of health as a way of directly communicating and outlining issues in the profession. This briefing is republished in this issue for NZIMLS members.
NZIMLS President, Tony Barnett, remembers Paul McLeod, a past NZIMLS president, long-serving Medical Laboratory Scientist and life member, who passed away in June 2022.
Convenors report on Special Interest Group seminars (SIG) held and enjoyed around the country in October and November 2023. Meetings included; Anatomical Pathology, AACB/Biochemistry, Molecular Diagnostics, Microbiology, and Preanalytical, with topics presented by members and invited guests. Participants enjoyed interesting presentations, discussions, catching up with colleagues over the sharing of food.
As well as our regular features; Science Digest, Recent Reviews, Journal Citations and the Pacific Way we share interesting interviews with the three recipients of the NZIMLS Top Student Award for 2023, Alejandra Walker, Lillian Birkett and Rei Miyamoto. These graduates are an inspiration to the profession, with wonderful enthusiasm and energy that will be welcomed wherever they land.
Lisa Cambridge EditorEDITORIAL
Sustainability and green laboratory practices
Lisa CambridgeHealthcaresystemscontributeanestimated4-5%ofgreenhouse emissionsglobally,inNewZealandthisfigurehasbeenreported at between 3-8% and is the largest emitter (excluding transport) in our public sector (1). Healthcare facilities operate 24/7 with
Energy & greenhouse gas emission
− Cold storage, refrigerants
− Transport
− Equipment
− Climate control, air conditioning, insulation
− Lighting
− Computers, systems hardware and storage
− Medical gases
Labs consume 5-10x more energy than Equiv. sized office*
Chemicals & materials
− Reagents
− Catalysts
− Washing, cleaning and flushing
− Gases, metals
− Paper and printing supplies
Implications for wider pollution of air, water and soil
a large footprint that impacts the environment, generating large quantities toxic and non-biodegradable waste, consuming high amounts of energy, emitting greenhouse gases and consuming vast quantities of water (Table 1).
Water consumption
− Heating and cooling equipment
− Washing, cleaning
− Reagents
Up to 60% of water usage in buildings by laboratories* autoclaves can use up to 227L water per cycle+
Waste
− Single-use plastics (e.g. gloves, syringes, pipette-tips, culture plates)
− Biological, medical waste
− Packaging
Biological, medical or agricultural research waste est. ~5.5Mt of lab plastic waste/year or 2% total global plastic waste*
*Royal Society of Chemistry (6), + My Green Lab (5), Mt = metric tonne
Unequivocal scientific evidence on the detrimental impact of human activity on the planet and the critical environmental tipping points (2), shows that the planet may never recover. On a global scale, conversations, policy and governmentinitiated projects for reducing emissions have gained significant momentum since the 196 countries, including New Zealand, signed the Paris Agreement (2015) at the UN Climate Change Conference (COP21). As part of this agreement, the New Zealand government committed to reducing our greenhouse gas emissions to 30% below 2005 levels, by 2030 and amending legislation and establishing a Climate Change Commission. Climate-related Disclosures and Other Matters Amendment Act (2021), requires mandatory climate-related reporting and disclosure by publicly listed companies, such as insurers and banks. The Ministry of Health requires the healthcare sector to report its sustainability actions and goals in annual planning and budgeting to meet the Climate Change Response (Zero Carbon) Amendment Act (2019) legislation.
Te Whatu Ora released its baseline Greenhouse Gas Emissions Inventory Report in September 2023 (1), quantifying emissions including; gas (medical and industrial), electricity, transport and waste directly attributed to their operations and reporting a 10.3% decrease in CO2 emissions between 2019 and 2020. However, they did not provide a breakdown of emissions attributed to clinical laboratories in its charge nor address laboratories specifically in their guidance material (3), released in September 2023 as a; “guide to support and encourage the New Zealand health sector to take an active role in implementing sustainability as integral part of its practice.”
How many of these types of reports and guidelines are paying lip-service to the Acts without taking practical steps towards sustainability for the planet? Or provide the teeth to make decisions, offer effective solutions, resources and assistance to clinical laboratories to meet these initiatives?
Is it too little too late? Afterall we are a mere six years away from this committed target. Statistics NZ reported in 2020
that New Zealand’s gross greenhouse emissions showed no sustained reduction when compared with 2005 figures (4). Has sustainability been given the sense of urgency and priority that it deserves?
The guidelines only serve to put the onus back on hospitals, laboratories and primary healthcare providers to do all the heavy lifting. As we dive into 2024, the medical laboratory profession and healthcare services in New Zealand remain in crisis. Any management plans to minimise emissions, reduce waste and implement green practices, will ultimately fail, if they compound upon already untenable workloads and pressure for the current healthcare workforce, without providing sufficient and additional resourcing and opportunities.
The creation of sustainable and green practices in laboratories requires a multidisciplinary approach that cannot be undertaken solely by the laboratories and quality managers but involves sweeping changes to company culture from the top down. Healthcare management must provide the influence, financial support and provision of dedicated resources. Organisations need to establish networks across different business sectors (e.g. construction (energy efficient building /laboratory design), transport, supply chains, suppliers and manufacturers), coordinate rollout of new technologies, advocate for change across healthcare professions and researchers, promote and recognise achievement by rewarding laboratories for their sustainability initiatives, negotiating shared spaces and pooling resources, securing public funding for green initiatives and offering sustainability education in academic degree courses.
There are established certification routes, for example; Liggins Institute Laboratory, at the University of Auckland, is the first university research laboratory in New Zealand to achieve ‘My Green Lab’ certification (5) in 2022. In March 2022, the Awanui pathology group obtained Carbon Reduce Certification (emissions to ISO14064-1 requirements) from Toitū Envirocare (www.toitu.co.nz). But for most laboratories, it is more practical to develop steps, targets and measures to reduce energy
emissions, chemical and material use, waste and water usage as they apply to their own workflows. Multiple online resources provide tips, tools, networking and interactive guides to get the green ball rolling, including, My Green Lab (5), the Royal Society of Chemistry (6) and labconscious (www.labconscious. com). Literature also provides an increasing number of studies and commentaries for clinical laboratories, for example, Lopez (7)presented methods to review current lab operation and introduce sustainable practices using the quality improvement model PDCA tools to develop key targets and actions.
There is wide agreement and good-will amongst laboratory and healthcare workers to reduce the impact of their work on the environment. Healthcare professionals are astutely aware of the barriers and challenges for a working clinical laboratory and the compromises between implementing sustainability actions and ensuring the health and safety of workers, patients and the public, and maintaining testing efficacy, quality and throughput. Consultation across and up and down the sector during planning and implementation is crucial, as will buy-in and participation in any decision-making and implementation.
In the same way that confusing and inconvenient recycling instructions imposed by local government are causing green or recycling fatigue that threaten our eco-friendly behaviour in the community, overly complex measures, under resourcing, impossible targets and poor management will only serve to further erode the goodwill of the profession and fail to implement sustainable and green practices that the healthcare sector and the planet cannot afford to lose.
Author information: Lisa Cambridge, B.Appl.Management, DipQA, NZCS, MNZIMLS, Editor, NZIMLS. Email: editor@nzimls.org.nz
REFERENCES
1. Geesink M, Te Whatu Ora - Health New Zealand. Greenhouse gas emissions inventory report – FYI2022/23 baseline year. Te Whatu Ora 2023. Available from: https://www.tewhatuora.govt.nz/publications/greenhousegas-inventory-report/
2. Lenton TM, McKay D, Loriani S et al (eds.) The global tipping points report. University of Exeter, Exeter, 2023. Available from: www.global-tipping-points.org/
3. Te Whatu Ora – Health New Zealand. Sustainability and the health sector: a guide to getting started. Te Whatu Ora, Wellington, 2023. ISBN:9781991067616.
4.Stats NZ. New Zealand greenhouse gas emissions. Stats NZ, Wellington 2022. [cited January 2024] Available from: www.stats.govt.nz/indicators/new-zealands-greenhousegas-emissions
5.My Green Lab. [cited January 2024] www.mygreenlab.org
6.Royal Society of Chemistry. Sustainable laboratories: a community-wide movement toward sustainable laboratory practices. [cited January 2024] Available from: www.rsc.org/policy-evidence-campaigns/environmentalsustainability/sustainability-reports-surveys-andcampaigns/sustainable-laboratories/
7.Lopez JB, Jackson D, Gammie A and Badrick T Reducing the environmental impact of clinical laboratories. Clin Biochem Rev 2017: 38(1): 3-11.
Copyright: © 2024 The author(s). This is an open-access article distributed under te terms of the Creative Commons Attribution License, which permits unrestricted use, distribution, and reproduction in any medium, provided the original author(s) and source are credited.
Call for nominations for Life Membership of the NZIMLS
The Council of the New Zealand Institute of Medical Laboratory Science (Inc.) (NZIMLS) is calling for nominations for suitable candidates for Life Membership. A Life Member is any member of the NZIMLS who the Council considers has given outstanding service to the Institute of Medical Laboratory Science (typically but not exclusively) who notwithstanding anything to the contrary in these rules shall retain the privileges of his/her previous category of membership.
Guidelines for Life Membership:
Publications
Oral Presentations
Voluntary contributions to Institute activities, e.g. Council, SIGs, Conferences etc.
Special projects
Other areas considered relevant by nominators. will be considered.
for the current year. or download from our website.
Blood group systems and antigens described in the last 20 years: an update
Natalya J Clark and Holly E PerryABSTRACT
Objectives: New information about blood group systems and antigens appears frequently but has not been recently collated as a single text. Books such as the Blood Group Antigen FactsBook by Reid, Lomas-Francis and Olsson provide an excellent reference source. However, the last edition was released a decade ago, and much has been discovered since then. New information is used to review requirements for red cell antibody screening cells, maintain rare donor databases, monitor clinical events and educate practitioners. The aim of this study was to summarise information elucidated in the past 20 years, with emphasis on significance in clinical practice. We aimed to provide a resource that may be useful to practising transfusion scientists.
Methods: Information was gathered by literature search.
Results: 122 blood group antigens and 17 blood group systems were described in the past 20 years (2003 – 2023). 31 antibodies were either implicated in transfusion reactions or haemolytic disease of the fetus and newborn or were considered to have the potential to cause these events.
Conclusion: Discovery and elucidation of blood group systems continues. Due to the rarity of clinical events, the clinical significance of many of the newer antigens and antibodies described is not yet certain. Nevertheless, it is important for transfusion scientists to be aware of new blood groups and monitor the likelihood of antibodies to cause transfusion reactions and/or haemolytic disease of the fetus and newborn. This literature review provides an update for transfusion scientists.
Key words: Blood group antigen, Rare blood group antibodies
NZ J Med Lab Sci 2024; 78(1): 06:19
INTRODUCTION
Blood group antigens are inherited markers found on surfaces includingtheredbloodcellmembrane. Correspondingantibodies can have a range of clinical effects, including haemolytic transfusion reactions (HTR), haemolytic disease of the fetus and newborn (HDFN) and autoimmune haemolytic anaemia (AIHA).
TheInternationalSocietyofBloodTransfusion(ISBT)classifies all known blood group systems and antigens. It defines a blood group system as a genetically discrete system of “one or more bloodgroupantigensthatarerelatedbyonegene,oronecomplex of two or more closely linked genes that are homologous” (1). A homolog is a gene that has a very similar nucleotide sequence to another gene.
Thereareseveralbloodgroupantigensthatcannotcurrentlybe classified as a system based on ISBT requirements. These form the 700 series (low prevalence antigens found at a population frequency of <1%), the 901 series (high prevalence antigens found at a population frequency of >90%) and independent collections which contain antigens that are related, but not yet fully elucidated at a genetic level (1).
Blood group systems frequently arise from an ancestral gene coding for a protein on the red cell surface, and polymorphisms are the result of single nucleotide changes. For example, in the Duffy system, the gene is FY and the reference allele is FY*02 (Fyb), which encodes 4 antigens on the Duffy glycoprotein, a receptor for chemokines. FY*01 (Fya) arises from a change at nucleotide 125, producing an amino acid (aa) change at aa42 (2). Single nucleotide polymorphisms (SNP) are responsible for most of the variation in blood groups.
Hybrid genes are responsible for the high degree of these polymorphism seen in the Rh and MNS blood group systems. These genetic variants occur at different frequencies around the world due to both selective pressures and geographic isolation. Null phenotypes (where no blood group structure in a system is present on the red cell) may be associated with a survival advantage. For example, Duffy null provides protection against some species of malaria; lacking the Duffy glycoprotein on the cell surface removes the ability of the parasite to bind and invade the red cell (2). Consequently, Duffy null is rare in countries where malarial parasites are absent, but common in malaria-endemic countries (3).
Advances in molecular technology in the past 20 years have greatly assisted the modern description of blood groups and allow classification of systems and antigens based on their exact genetic basis. As of December 2023, there were 49 genes determining 45 blood group systems and 360 blood group antigens, as well as 33 blood group antigens that have not yet
been classified into a blood group system (1). Of these, 17 blood group systems and 122 blood group antigens were discovered in the last 20 years (2003 – 2023).
This report provides an update on the blood group antigens that have been described in the last 20 years, including genetic basis of variants and the clinical significance of their antibodies where known.
MATERIAL AND METHODS
A rigorous systematic literature search of the Wiley Online Library was performed, focusing on three journals: Vox Sanguinis, Transfusion and Transfusion Medicine. Information was also gathered from the Blood Group Antigens FactsBook (3rd ed.) and the Genome Aggregation Database (gnomAD) (4). ISBT nomenclature was used.
Data is presented in two sections: additions to systems and new systems. Data is tabulated throughout, with the column “clinical significance” referring to the reported potential of the antibody to the antigen described to cause haemolysis. The word “new” refers to antigens or systems described since 2003. Although some antigens described have been known for many years, the “year described” in tables refers to the year the antigen was fully elucidated at a genetic level. Where antigen frequencies are known to differ in different regions, more than one frequency is provided. When a single figure is given, it is assumed that antigen frequency is similar across many populations (4).
RESULTS
122 blood group antigens and 17 blood group systems were described in the past 20 years (2003 – 2023). Of these, the following have antibodies that are either clinically significant, or potentially clinically significant but infrequent: ENEV (MNS45), SARA (MNS47), Pk (P1PK3), CETW (RH63), VONG (KEL28), KEAL (KEL39), KHOZ (KEL41), DISK (DI22), YTGT (YT6), SCAN (SC7), SCAC (SC9), DOMR (DO7), GECT (GE13), INFI (IN3), PX2 (GLOB4), DSLK (RHAG3), Kg (RHAG5), THIN (RHAG7), Jra (JR1), Lan (LAN1), Vel (VEL1), Ata (AUG2), ATML (AUG3), ATAM (AUG4), Sda (SID1), MAM (MAM1), Emm (EMM1), Er3 (ER3), ERSA (ER4), ERAMA (ER5) and CD36.1. Anti-Kg, anti-Jra, anti-Lan, anti-Vel, anti-Ata and Anti-Sda were clinically significant antibodies seen in multiple clinical cases. These six antibodies were discovered more than 20 years ago, but the respective blood group systems were fully elucidated more recently.
Section 1. Additions to Blood Group Systems
002 - MNS
Table 1. New antigens in the MNS system (5-12)
ENDA, KIPP and JENU are the result of hybrids between Glycophorin A (GYPA) and Glycophorin B (GYPB), while ENEV, MNTD, SARA and SUMI are the result of SNPs. One antithetical pair of antigens was discovered: ENDA with DANE (MNS32, previously described).
One antigen, SARA, was previously assigned 700.052, and moved to the MNS blood group system when its genetic basis was identified. It is a low prevalence antigen found in one Australian and one Canadian family, and its antibody has caused severe HDFN in one newborn (9).
003 - P1PK
The P1PK system was renamed from P after the P and Pk antigens were found to be tied to the same gene - Alpha 1,4-Galactosyltransferase (A4GALT), which is found on 22q13.2 chromosome (2). During this change, Pk (P1PK3) was moved from the now obsolete Globoside collection into the P1PK system. Globoside is now a blood group system in its own right (system 028, Table 18).
Pk (previously 209.002) is only expressed strongly on the cells of P1k and P2k individuals (2). Inactivating mutations in the B3GALNT1 gene cause an increase in expression of Pk. Rare inactivating mutations in A4GALT lead to the Pk negative null phenotype (p). AntiPk is usually found alongside anti-P and anti-P1 (anti-PP1Pk), which can cause severe transfusion reactions, spontaneous abortions and HDFN (2).
004 - Rh
CENR, CEST, CELO, CEAG, PARG and CEVF are caused by hybrid RHCE alleles, while CEWA and CETW are the result of SNPs in RHCE. Two antithetical pairs of antigens were discovered: CEST and JAL (RH48), and CELO and Crawford (RH43).
Of the eight antigens recently assigned to the Rh blood group system, only CETW is known to be clinically significant, having caused HDFN in one indigenous Australian newborn (22).
005 - Lutheran
All new antigens in the Lutheran blood group system are the result of SNPs in Basal Cell Adhesion Molecule (BCAM). LUAC has some relevance to New Zealand, as its antibody was found in a Māori patient in Auckland (26). Its clinical significance is unknown. 006 - Kell
All new antigens in the Kell blood group system are the result of SNPs in Kell metallo-endopeptidase (KEL); KELP is unique in that it is a result of two separate SNPs in KEL. Four pairs of antithetical antigens have been identified; VONG with VLAN (KEL25, previously identified), KYO with KYOR, KHUL with KEAL, and KHIZ with KHOZ.
010 - Diego
Both new antigens in the Diego blood group system are the result of SNPs in Solute Carrier Family 4 Member 1 (SLC4A1) DISK is antithetical to Wu (DI9). Anti-DISK was found in an Irish proband after she miscarried, but its clinical relevance to the miscarriage was uncertain (44).
011 - Yt
Table 7. New antigens in the Yt system (46-48)
All new antigens in the Yt blood group system are the result of SNPs in acetylcholinesterase (ACHE). Anti-YTGT was found in two unrelated Native American patients, one of whom experienced an acute HTR following transfusion (48).
013 - Scianna
Table 8 New antigens in the Scianna system (49-52)
All new antigens in the Scianna blood group system are the result of SNPs in Erythroblast Membrane Associated Protein (ERMAP). In vitro tests suggest anti-SCAR is unlikely to be clinically significant, and there was no evidence of haemolysis after one SCAR negative proband received an antigen mismatched transfusion (51). However, the patient was receiving hydroxyurea at the time and may have otherwise developed anti-SCAR at high enough titres to be clinically significant.
014 - Dombrock
Table 9. New antigens in the Dombrock system (53-57)
All new antigens in the Dombrock blood group system are the result of SNPs in ADP-Ribosyltransferase 4 (ART4); DOMR is the result of two SNPs in ART4 Anti-DOMR caused a positive DAT, jaundice and reticulocytosis in a newborn (54).
015 - Colton
Table 10. New antigens in the Colton system (58)
is the result of a SNP in Aquaporin 1 (AQP1).
016 - Landsteiner-Wiener
Table 11. New antigens in the Landsteiner-Wiener system (59)
LWEM is the result of a SNP in Intercellular Adhesion Molecule-4 (ICAM4)
All antigens in the Gerbich blood group system are the result of SNPs in Glycophorin C (GYPC)
All new antigens in the Cromer blood group system are the result of SNPs in Decay accelerating factor (DAF). Anti-CRUE was found in Auckland in a Thai patient (68)
All new antigens in the Knops blood group system are caused by SNPs in Complement Component (3b/4b) Receptor 1 (CR1). KCAM and KDAS are antithetical antigens, as are DACY and YCAD.
020 - Gerbich023 - Indian
Table 15 New antigens in the Indian system (77-79)
All new antigens in the Indian blood group system are caused by SNPs in CD44.
024 - OK
Table 16. New antigens in the OK system (80,81)
Both new antigens in the OK blood group system are caused by SNPs in Basigin (BSG)
026 - John Milton Hagen
Table 17. New antigens in the John Milton Hagen system (82-86)
All new antigens in the JMHK blood group system are the result of SNPs in Semaphorin 7A(SEMA7A)
Section 2. New Systems
028 – Globoside (promoted from a collection to a system in 2003).
In 2003 the system contained one antigen Pbut new antigens have subsequently been added (Table 18).The Globoside blood group system is encoded by Beta-1,3-N-Acetylgalactosaminyltransferase 1 (B3GALNT1), which is found on 3q26 chromosome (2). The gene encodes an enzyme which transfers N-acetylgalactosamine onto the Pk antigen in the P1PK system to form P.
Anti-PX2 is found in patients with the very rare Pk phenotype. This phenotype arises from inactivations of the B3GALNT1 gene. Usually, anti-PX2 is found alongside other antibodies (anti-P, anti-P1) so its clinical significance is hard to determine. PX2 is abundant on p cells (PPlPk negative) so patients with anti-PX2 have an incompatible crossmatch with cells from p individuals. ExtB is associated with the B antigen. Anti-ExtB is found in group O individuals, as well as group AB and B Pk individuals, and reacts with B cells that are PPlPk-.
030 - Rh-Associated Glycoprotein (RHAG) (promoted to a system in 2008).
Antigens described since 2003 are listed in Table 19
The RHAG blood group system is encoded by Rh-Associated Glycoprotein (RHAG), which is found on 6p21.3 chromosome (2). The gene encodes a multi-pass membrane glycoprotein which is associated with RhD, RhCE, GPB, LW and CD47. This complex of molecules helps to maintain erythrocyte membrane integrity. RHAG is also involved in transporting some molecules and cations across the red cell membrane. It is expressed only on RBCs, but RHAG homologs can be found in other tissues.
Table 19. New antigens in the RHAG system (89-95)
*“Provisional number assigned awaiting further examples of the DSLK− phenotype to confirm the polymorphism.” (1)
† Provisional number assigned.
All antigens in the RHAG blood group system are the result of SNPs in RHAG. One new pair of antithetical antigens were discovered: DSLK and Kg. Three of the antigens were identified more than 20 years ago but elucidated more recently: DUCLOS (previously 901.013), Ola (previously 700.043) and Kg (previously 700.045). Kg is present in approximately 0.2% of the Japanese population (90). Anti-Kg has caused two severe cases of HDFN that required exchange transfusion, and in vitro tests have suggested that it is capable of causing HTRs (90,93). In vitro tests suggest that the antibody to its antithetical antigen, DSLK, may also be clinically significant.
031 - FORS
The FORS blood group system is encoded by Globoside Alpha-1,3-N-Acetylgalactosaminyltransferase 1 (GBGT1), which is found on 9q34.2 chromosome (2). The gene encodes a glycosyltransferase, which catalyses the formation of Forssman glycolipids. These glycolipids are usually seen in animals and humans have corresponding naturally occurring antibodies.
Table 20. Antigens in the FORS system (96)
FORS1 is caused by a SNP in GBGT1
032 - JR
The JR blood group system is encoded by ATP Binding Cassette Subfamily G Member 2 (ABCG2), which is found on 4q22.1 chromosome (97). The gene encodes an ATP-dependent transporter that can transport a wide specificity of substrates, particularly uric acid. It is expressed on a range of cells, including the placenta and epithelial cells.
Table 21. Antigens in the JR system (97-102)
The null phenotype of Jra (previously 901.005) is caused by mutations in ABCG2. Jr(a-) has a prevalence of 0.03% in Japanese and <0.01% of most other populations.Anti-Jra is clinically significant, having caused severe and even fatal HDFN, and sometimes causes HTRs (98-102).
033 - LAN
The LAN blood group system is encoded by ATP-binding Cassette Subfamily B Member 6 (ABCB6), which is found on 2q36 chromosome (103). The gene encodes anATP-dependent transport protein which transports heme and its precursors across the red blood cell membrane and outer mitochondrial membrane (104).
Table 22. New antigens in the LAN system (103,105)
The null phenotype of Lan (previously 901.002) is caused by inactivating mutations in ABCB6
034 - Vel
The Vel blood group system is encoded by Small Integral Membrane Protein 1 (SMIM1), which is found on chromosome 1p36.32 (106). It encodes a transmembrane protein and is found in a range of tissues, particularly in the bone marrow, testes and kidney (107). Table 23 Antigens in the Vel system (108-113)
The null phenotype of Vel is caused by inactivating mutations in SMIM1. Anti-Vel is capable of causing AIHA, severe HTR and rarely HDFN (109-113).
035 - CD59
The CD59 blood group system is encoded by CD59 which is found on 11p13 chromosome (114). The gene encodes a glycoprotein that has a role in complement regulation (inhibition of the MAC complex) (115). It is expressed on all blood cells, endothelial cells and epithelial cells. It is also present in tear fluid (116).
Table 24. Antigens in the CD59 system (117)
Anti-CD59.1 was found in a patient with a CD59 deficiency. Very few cases of CD59 deficiency have been reported; seven as of 2014, and three distinct CD59-null alleles were implicated. Of several transfusions given to one proband, only one posttransfusion test revealed a transiently positive DAT with no clinical signs of HTR (117).
036 - Augustine
The Augustine blood group system is encoded by Solute Carrier Family 29 Member 1 (SLC29A1), which is found on 6p21.1 chromosome (118). The gene encodes the ENT1 protein, which may have a role in adenosine transport and erythroid differentiation, as well as being involved in regulating bone metabolism (119). This protein is found ubiquitously in human tissues.
Table 25. Antigens in the Augustine system (119-124)
All antigens in the Augustine blood group system are the result of SNPs in SLC29A1, except for AUG1 whose loss is associated with the rare Augustine null phenotype. Anti-Ata has been found in a number of African American individuals. In vitro tests suggest that anti-Ata is clinically significant, and it has been implicated in cases of HDFN (one of which was moderate), HTRs (one of which was severe) and AIHA (120-122).
037 - KANNO
The KANNO blood group system is encoded by Prion Protein (PRNP), which is found on 20p13 chromosome (125). The gene encodes prion protein, a glycoprotein found in the brain and other tissues. It may have a role in copper transport and neuroprotection, as mutations are associated with Creutzfeldt-Jakob disease (126). Its function in RBCs is unknown
Table 26. Antigens in the KANNO system (125,127,128)
The clinical significance of anti-KANNO is unknown, but among 16 reported cases of pregnancy and 7 reported cases of transfusion there were no cases of HDFN or HTR, with only one newborn testing DAT positive (127).
038 - SID
The SID blood group system is encoded by Beta-1,4-N-Acetyl-Galactosaminyltransferase 2 (B4GALNT2), which is found on 17q21.32 chromosome (129). The gene encodes an enzyme which catalyses the formation of the carbohydrate determining the Sda antigen. This enzyme is absent on gastrointestinal cancer cells, suggesting it may play a role in eliminating metastasis. It is found in the kidney, colon and stomach, as well as human serum, milk, meconium and urine.
Table 27. Antigens in the SID system (130-133)
The loss of Sda is associated with mutations in the B4GALNT2 gene. 91% of the population carries this antigen on red cells, but only 4% are Sda negative in all tissues and therefore capable of making anti-Sda (130). Anti-Sda can cause HTR, particularly when RBCs of the rare Cad (Sda++) phenotype are transfused, as these react more strongly with anti-Sda (132,133).
039 - CTL2
The CTL2 system is encoded by Solute Carrier Family 44 Member 2 (SLC44A2), which is found on 19p13.2 chromosome (134,135). The gene encodes the CTL2 glycoprotein, which has a role in choline transport and carries HNA-3 (human neutrophil antigen), the antibody of which causes severe and fatal transfusion-related acute lung injury (TRALI). CTL2 is found in a variety of tissues, notably blood cells, inner ear and lung endothelium (135).
Table 28. Antigens in the CTL2 system (136)
Anti-VER was found in one CTL2 null proband (136). RIF is the result of a SNP in SLC44A2.
040 - PEL
The PEL blood group system is encoded by ATP Binding Cassette Subfamily C Member 4 (ABCC4), which is found on 13q32.1 chromosome(137). The gene encodes an ATP-dependent transport protein which transports a variety of molecules and is involved in erythropoiesis (138). It is found in a variety of tissues, particularly the prostate and kidney (139).
Table 29 Antigens in the PEL system (140)
The loss of PEL (previously 901.014) is caused by a deletion of ABCC4
041 - MAM
The MAM blood group system is encoded by Epithelial Membrane Protein 3 (EMP3), which is found on 19q13.33 chromosome (141). The gene encodes the EMP3 protein, which has a role in tumour suppression (142). It is expressed in the ovary, rectum, liver, kidney and embryonic lung (142).
Table 30. Antigens in the MAM system (143,144)
The loss of MAM (previously 901.016) is caused by various inactivating mutations in EMP3. A total of eleven MAM negative probands have been described, including one in New Zealand (143). Anti-MAM causes severe and fatal HDFN, and in vitro tests suggest that anti-MAM is capable of causing HTR (141,144).
042 - EMM
The EMM blood group system is encoded by Phosphatidylinositol Glycan Anchor Biosynthesis Class G (PIGG), on 4p16.3 chromosome (145).The gene encodes an enzyme that has a role in glycosylphosphatidylinositol (GPI) anchor synthesis. Mutations in PIGG are associated with intellectual disability, seizures and hypotonia (146).
Table 31. Antigens in the EMM system (147-150)
The loss of Emm (previously 901.008) is caused by inactivating mutations in PIGG. Anti-Emm is thought to be a naturally occurring antibody in Emm negative individuals and has caused one acute HTR (148,149). In vitro tests suggest that a ti-Emm does not cause HDFN, and one recorded pregnancy was unaffected by anti-Emm, but this evidence is not conclusive (150).
043 - ABCC1
The ABCC1 blood group system is encoded by ATP Binding Cassette Subfamily C Member 1 (ABCC1), which is found on 16p13.11 chromosome (137). The gene encodes an ATP-binding cassette (ABC) transporter, which plays a role in protection of kidney epithelial cells. The protein is expressed ubiquitously in almost all human tissues (151).
Table 32. Antigens in the ABCC1 system (137)
The rare null phenotype is caused by an intron deletion (137).
044 - Er
The Er blood group system is encoded by Piezo Type Mechanosensitive Ion Channel Component 1 (PIEZO1), which is found on 16q23-q24 chromosome (152). The gene encodes a red cell calcium channel, which helps change RBC volume in response to deformation (153). It is also expressed in the bladder, colon, lung and skin (154).
Table 33. Antigens in the Er system (155)
All antigens in the Er blood group system are the result of a SNP in PIEZO1, except for Er3, whose loss is associated with the very rare Er(a-b-) phenotype. Era and Erb are antithetical antigens.
In vitro tests suggest that anti-Era is unlikely to be clinically significant, and a small number of incompatible transfusions have been reported without complications. Results of in vitro tests performed to determine the clinical significance of anti-Er3 showed that incompatible RBCs were destroyed faster than normal, suggesting anti-Er3 may be capable of causing HTRs (156).
045 - CD36
The CD36 blood group system is encoded by CD36, which is found on 7q11.2 chromosome (156). The gene encodes a type B scavenger receptor with roles in cell signalling, fatty acid transport, and immune cell function (157). It is expressed in a range of immune and non-immune cells in the blood, including the endothelium (158).
Table 34. Antigens in the CD36 system (159)
DISCUSSION
This report provides an update on what has been learnt about blood group antigens and systems over the last 20 years, and how their antibodies may affect patients in a clinical context. The results of this study had the potential to reveal limitations in our current ability to identify clinically significant antibodies and provide up to date information that will allow requirements of red cells used in red cell antibody screening to be reviewed.
The following blood group antigens produced antibodies that wereeitherclinicallysignificantorlikelytobeclinicallysignificant:
ENEV (MNS45), SARA (MNS47), Pk (P1PK3), CETW (RH63), VONG (KEL28), KEAL (KEL39), KHOZ (KEL41), DISK (DI22), YTGT (YT6), SCAN (SC7), SCAC (SC9), DOMR (DO7), GECT (GE13),INFI(IN3),PX2(GLOB4),DSLK(RHAG3),Kg(RHAG5), THIN (RHAG7), Jra (JR1), Lan (LAN1), Vel (VEL1), Ata (AUG2), ATML (AUG3), ATAM (AUG4), Sda (SID1), MAM (MAM1), Emm (EMM1), Er3 (ER3), ERSA(ER4), ERAMA(ER5) and CD36.1.
There were some limitations in the information found during the literature search. Many antigens were only described in one studyorabstract,andafewwereonlyreferencedbyasecondary source. The coverage for each antigen varied; only a handful of studies gave a prediction of clinical significance, in some studies the quantity of antisera was limited, and therefore many studies were unable to estimate antigen or antibody frequency. The identification and classification of antigens is transitioning to molecular sequencing.
Future research could investigate antigen or allele frequencies in different populations as resources permit, as this can help us determine whether their antibodies are likely to appear more frequently. It could also focus on determining the clinical significance of antibodies, using such tests as the monocyte monolayer assay.
CONCLUSION
Blood group systems show a high degree of polymorphism in a large and heterogeneous human population and new variants appear on a continuous basis. Corresponding antibodies can have real-world consequences in transfusion, pregnancy and autoimmunity. This report described 122 blood group antigens and 17 blood group systems that were elucidated in the last 20 years.
AUTHOR INFORMATION
Natalya J Clark, BMLSc, Student1
Holly E Perry, PhD, MSc, MPHIL, Lecturer2
1University of Otago, Dunedin, New Zealand
2Department of Pathology, University of Otago, Dunedin, New Zealand
Correspondence: Natalya Clark email: natalya.clark@protonmail.com
REFERENCES
1. ISBT. Red Cell Immunogenetics and Blood Group
Terminology. Amsterdam, the Netherlands: International Society of Blood Transfusion; 2023 [cited 2023 April 1]. Available from: https://www.isbtweb.org/isbt-workingparties/rcibgt.html
2. Reid ME, Lomas-Francis C, Olsson ML. The Blood Group Antigen FactsBook, 3rd ed. Academic Press; 2012; 758.
3. Hodgson JA, Pickrell JK, Pearson LN et al. Natural selection for the Duffy-null allele in the recently admixed people of Madagascar. Proc R Soc B 2014; 281(1789): 20140930. Available from: https://doi.org/10.1098/rspb.2014.0930
4. Karczewski KJ, Francioli LC, Tiao G, Cummings BB et al. The mutational constraint spectrum quantified from variation in 141,456 humans. Nature 2020; 581: 434-443.
5. Velliquette RW, Palacajornsuk P, Hue-Roye K, et al. Novel GYP(A-B-A) hybrid gene in a DANE+ person who made an antibody to a high-prevalence MNS antigen. Transfusion 2008; 45(12): 2618-2623.
6. Velliquette RW, Hu Z, Lomas-Francis C, et al. Novel singlenucleotide change in GYP*A in a person who made an alloantibody to a new high-prevalence MNS antigen called ENEV. Transfusion 2010; 50(4): 856-860.
7. Uchikawa M, Tsuneyama H, Ogasawara K, et al. Molecular basis for a novel low frequency antigen in the MNS blood group system. Vox Sang 2006; 91(s3): 133.
8. McBean RS, Hyland CA, Hendry JL, et al. SARA: a “new” low-frequency MNS antigen (MNS47) provides further evidence of the extreme diversity of the MNS blood group system. Transfusion 2014; 55(6): 1451-1456.
9. Towns D, Hannon J, Hendry J, et al. Hemolytic disease of the fetus and newborn caused by an antibody to a lowprevalence antigen, anti-SARA. Transfusion 2011; 51(9): 1977-1979.
10. Lopez GH, Wei L, Ji Y, et al. GYP*Kip, a novel GYP(BA-B) hybrid allele, encoding the MNS48 (KIPP) antigen. Transfusion 2015; 56(2): 539-541.
11. Lopez GH, Wilson B, Liew YW, et al. An alloantibody in a homozygous GYP*Mur individual defines JENU (MNS49), a new high-frequency antigen on glycophorin B. Transfusion 2016; 57(3): 716-717.
12. Ito S, Kaito S, Miyazaki T, et al. A new antigen SUMI carried on glycophorin A encoded by the GYPA*M with c.91A>C (p.Thr31Pro) belongs to the MNS blood group system. Transfusion 2020; 60(6): 1287-1293.
13. Hagman JR, Hult AK, Westman JS, et al. Multiple miscarriages in two sisters of Thai origin with the rare Pk phenotype caused by a novel nonsense mutation at the B3GALNT1 locus. Transfus Med 2018; 29(3): 202-208.
14. Suchanowska A, Kaczmarek R, Duk M, et al. A single point mutation in the gene encoding Gb3/CD77 synthase causes a rare inherited polyagglutination syndrome. J Biol Chem 2012; 287(45): 38220-38230.
15. Westhoff CM, Storry JR, Walker P, et al. A new hybrid RHCE gene (CeNR) is responsible for expression of a novel antigen. Transfusion 2004; 44(7); 1047-1051.
16. Lomas-Francis C, Alcantara D, Westhoff C, et al. JAL (RH48) blood group antigen: serologic observations. Transfusion 2009; 49(4): 719-724.
17. Hipsky CH, Lomas-Francis C, Fuchisawa A, et al. RHCE*ceCF encodes partial c and partial e but not CELO, an antigen antithetical to Crawford. Transfusion 2011; 51(1): 25-31.
18. Westhoff CM, Vege S, Hipsky CH, et al. RHCE*ceAG (254C>G, Ala85Gly) is prevalent in blacks, encodes a partial ce-phenotype, and is associated with discordant RHD zygosity. Transfusion 2015; 55(11): 2624-2632.
19. Scharberg EA, Rink G, Roth S, et al. The RHCE*Ce(501A) allele encodes the PARG antigen (RH60). Transfusion 2017; 57(2): 484-486.
20. Westhoff CM, Vege S, Horn T, et al. RHCE*ceMO is
frequently in cis to RHD*DAU0 and encodes a hrS–, hrB–, RH:–61 phenotype in black persons: clinical significance. Transfusion 2013; 53(11): 2983-2989.
21. Poole J, Grimsley S, Thornton N: A novel mutation in RHCE giving rise to the Rh:-51 phenotype and an antibody to a high frequency Rh antigen present on other Rh:-51 cells. Transfus Med. 2012;22(s1):56. Cited in: Storry JR, Clausen FB, Castilho L, et al. International Society of Blood Transfusion Working Party on Red Cell Immunogenetics and Blood Group Terminology: Report of the Dubai, Copenhagen and Toronto meetings. Vox Sang 2018; 114(1): 95-102.
22. Flower R, Wilson B, Davidson C, et al. A case of HDFN defines a novel low frequency Rh antigen associated with indigenous heritage and identified in a blood group genomic study. Intern Med J 2021; 51(s6): 6-9.
23. Crew VK, Thornton N, Burton N, et al. Two heterozygous mutations in an individual result in the loss of a novel high incidence Lutheran antigen Lurc. Transfus Med 2009; 19(1): 1-19
24. Hustinx H, Lejon-Crottet S, Henny C, et al. LUIT: a novel high incidence antigen in the Lutheran blood group system. Vox Sang 2014; 107(s1): 172.
25. Floch A, Lomas-Francis C, Vege S, et al. A novel highprevalence antigen in the Lutheran system, LUGA (LU24), and an updated, full-length 3D BCAM model. Transfusion 2023; 63(4): 798-807.
26. Crew VK, Laundy R, Bahashwan A, et al. Two novel high incidence antigens in the Lutheran blood group system (LUAC and LUBI). Vox Sang. 2016; 111(s1): 63.
27. Vrignaud C, Ramelet S, Amiranoff D, et al. Characterization of a Novel High-Prevalence Antigen in the Lutheran Blood Group System. Transfusion. 2018; 58(s2): 6A-254A.
28. Crew VK, Mayer B, Baglow L, et al. A novel high frequency antigen in the Lutheran blood group system (LUNU). Vox Sang. 2019; 114(s1): 5-240.
29. Yosephi L, Crew VK, Shinar E, et al. A Lutheran related antibody detected in a patient with a homozygous missense BCAM mutation indicating a novel antigen of the system. Vox Sang. 2019; 114(s1): 5-240.
30. Alsubhi S, Mankelow T, Crew VK et al. The expression of BCAM c.674G>A in K562 and HEK293T cell lines helps to define a novel Lutheran antigen LUOM. Vox Sang 2023; 118(S1): 6-118.
31. Grey D, Poole J, Martin P, et al: Haemolytic disease of the newborn caused by a new Kell antigen. Transfus Med. 2003; 13(1): 30. Cited in: Daniels GL, Fletcher A, Garratty G, et al. Blood group terminology 2004: from the International Society of Blood Transfusion committee on terminology for red cell surface antigens. Vox Sang. 2004; 87(4): 304-316.
32. Lee S, Debnath AK, Wu X, et al. Molecular basis of two novel high-prevalence antigens in the Kell blood group system, KALT and KTIM. Transfusion. 2006; 46(8): 13231327.
33. Boturão-Neto E, Bordin JO. Frequencies of KEL*29 (KALT) and KEL*30 (KTIM) alleles in blood donors and patients with hemoglobinopathies in Brazil. Transfusion 2007; 47(8): 1552.
34. Uchikawa M, Onodera T, Ogasawara K, Tsuneyama H, Toyoda C, Yabe R, Enomoto T, Satake M, Nakajima K. Molecular basis for a novel low-frequency antigen in the Kell blood group system, KYO. Vox Sang 2006; 91(s3): 136.
35. Velliquette RW, Hue-Roye K, Lomas-Francis C, et al. Molecular basis of two novel and related high-prevalence antigens in the Kell blood group system, KUCI and KANT, and their serologic and spatial association with K11 and KETI. Transfusion 2013; 53(11pt2): 2872-2881.
36. Crew VK, Poole J, Watson T, et al. KASH (KEL34): A novel high incidence antigen in the Kell blood group system. Vox Sang 2010; 99(s1): 357.
37. Crew VK, Poole J, Bullock T, et al. KELP (KEL35): A New High Incidence Antigen in the Kell Blood Group System Defined By Two Homozygous Missense Mutations in KEL. Transfus Med 2010; 20(s1): 30.
38. Crew VK, Poole J, Bullock T, et al. KETI, a novel high incidence antigen in the Kell blood group system: a serological and molecular study. Vox Sang 2011; 101(s1): 19.
39. Lomas-Francis C, Vege S, Velliquette RW, et al. Expansion of the Kell blood group system: two new high-prevalence antigens and two novel K0 (Kellnull) phenotypes. Transfusion 2013; 53(11pt2): 2887-2891.
40. Lomas-Francis C, Fuchisawa A, Uchikawa M, et al. A new high prevalence Kell antigen KYOR, antithetical to the lowprevalence antigen KYO, is the second trypsin-sensitive Kell antigen. Transfusion 2012; 53(s3):158A-159A.
41. Scharberg EA, Wieckhusen C, Luz B, et al. Fatal hemolytic disease of the newborn caused by an antibody to KEAL, a new low-prevalence Kell blood group antigen. Transfusion 2016; 57(1): 217-8.
42. Martin-Blanc S, Laget L, Babinet J, et al. Characterization of a novel high-prevalence antigen in the KEL blood group system. Vox Sang 2022; 117(s1): 56.
43. Hyland C, Buhariwala K, Lopez G et al. Intertwining roles for genomics and international data sharing defines a novel low prevalence Kell antigen in a blood donor. Transfusion Medicine 2022; 32(s3): 3-37.
44. Poole J, Thornton NM, Tilley L, et al. Novel high incidence antigen in the Diego blood group system (DISK) and the clinical significance of anti-DISK. Vox Sang 2010; 99(s1): 54-55.
45. Scharberg EA, Stürtzel A, Rothenberger-Mürb S, et al. A new low prevalence Diego blood group antigen found in a Caucasian blood donor. Vox Sang 2021; 116(s1): 29.
46. Laundy R, Crew VK, Davies H, et al. A novel high frequency antigen in the Yt blood group system. Transfus Med 2017; 27(s2): 42-43.
47. Crew VK, Laundy R, Walser P, et al. Serological and molecular characterisation of a novel high frequency antigen in the Yt blood group system. Vox Sang 2018; 113(s1): 63.
48. Van Buren NL, Gillen B, Lomas-Francis C, et al. YTGT: A new high-prevalence antigen in the Yt blood group system in two unrelated Native Americans and transfusion management. Transfusion 2022; 62(9): 1917-1922.
49. Hue-Roye K, Chaudhuri A, Velliquette RW, et al. STAR: a novel high-prevalence antigen in the Scianna blood group system. Transfusion 2005; 45(2): 245-247.
50. Flegel WA, Chen Q, Reid ME, et al. SCER and SCAN: two novel high-prevalence antigens in the Scianna blood group system. Transfusion 2005; 45(12): 1940-1944.
51. Srivastava K, Albasri J, Alsuhaibani OM, et al. SCAR: The high-prevalence antigen 013.008 in the Scianna blood group system. Transfusion 2020; 61(1): 246-254.
52. Floch A, Lomas-Francis C, Vege S, et al. Two new Scianna variants causing loss of high prevalence antigens: ERMAP model and 3D analysis of the antigens. Transfusion 2022; 63(1): 230-238.
53. Mayer B, Thornton N, Yürek S, et al. New antigen in the Dombrock blood group system, DOYA, ablates expression of Doa and weakens expression of Hy, Joa, and Gya antigens. Transfusion 2010; 50(6): 1295-1302.
54. Costa FPS, Hue-Roye K, Sausais L, et al. Absence of DOMR, a new antigen in the Dombrock blood group system that weakens expression of Dob, Gya, Hy, Joa, and DOYA antigens. Transfusion 2010; 50(9): 2026-2031.
55. Crew VK, Poole J, Marais I, et al. DOLG, a novel high incidence antigen in the Dombrock blood group system. Vox Sang 2011; 101(s1): 263.
56. Crew VK, Thornton N, Bullock T, et al. Serological and molecular characterisation of DOLC, a novel high incidence
antigen in the Dombrock blood group system. Vox Sang 2013; 105(s1): 30.
57. Shakarian G, Vege S, Hue-Roye K, et al. A Dombrock System Antibody Detects a New High-Prevalence Antigen, DODE. Transfusion 2015; 55(s3): 35A-36A.
58. Arnaud L, Helias V, Menanteau C, et al. A functional AQP1 allele producing a Co(a–b–) phenotype revises and extends the Colton blood group system. Transfusion 2010; 50(10): 2106-2116.
59. Lopez GH, Wilson B, Millard GM, et al. A new highprevalence LW antigen detected by an antibody in an Indigenous Australian homozygous for LW*A c.309C>A variant. Vox Sang 2022; 117(7): 958-965.
60. Yabe R, Uchikawa M, Tuneyama H, et al. Is: a new Gerbich blood group antigen located on the GPC and GPD. Vox Sang 2008; 87(s3): 79.
61. Poole J, Tilley L, Hudler P, et al. Novel mutations in GYPC giving rise to lack of Ge epitopes and anti-Ge production. Vox Sang 2008; 95(s1): 181.
62. Lomas-Francis C, Tahiri T, Vege S, et al. GECT: A New High-Prevalence Antigen in the GE Blood Group System in a SCD Patient with an Apparent Anti-GE2. Transfusion 2020; 60(s5): 13A.
63. Shakarian G, Ong J, Vege S, et al. A New Antibody in the Gerbich Blood System against a Novel High Prevalence Antigen Named GEAR. Transfusion 2016; 56(s4): 140A
64. Banks J, Poole J, Ahrens N, et al. SERF: a new antigen in the Cromer blood group system. Transfus Med 2004; 14(4): 313-318.
65. Suwanwootichai P, Phiancharoen S, Bejrachandra S, et al. Cromer system: SERF negative Thai patient with allo antiSERF. Vox Sang 2022; 117(s1): 191.
66. Hue-Roye K, Lomas-Francis C, Belaygorod L, et al. Three new high-prevalence antigens in the Cromer blood group system. Transfusion 2007; 47(9): 1621-1629.
67. Crew VK, Poole J, Thornton N, et al. Two unusual cases within the Cromer blood group system: I) a novel hgh incidence antigen Croz and II) a novel molecular basis of Inab phenotype. Transfus Med 2010; 20(s1): 12.
68. Crew VK, Poole J, Mathlouthi R, et al. A novel Cromer blood group system antigen, CRUE, arising from two heterozygous DAF mutations in one individual with the corresponding anti-CRUE. Vox Sang 2012; 103(s1): 56.
69. Lomas-Francis C, Fuchisawa A, Hamilton J, et al. CRAG: A new high-prevalence antigen in the Cromer blood group system. Vox Sang 2012; 103(s1): 211.
70. Asher O, Finkel L, Yosephi L, et al. CROK (CROM19): A new high-prevalence antigen in the Cromer blood group system. Transfusion 2021; 61(11): E85-E87.
71. Vrignaud C, Chiaroni J, Durieux-Roussel E, et al. CORS (CROM20): A new high-prevalence antigen in the Cromer blood group system. Transfusion 2020; 60(11): E40-E42.
72. Moulds JM, Pierce S, Peck KB, et al: KAM: a new allele in the Knops blood group system. Transfusion 2005; 45:27A. Cited in: Daniels G, Flegel WA, Fletcher A, et al. International Society of Blood Transfusion Committee on Terminology for Red Cell Surface Antigens: Cape Town report. Vox Sang 2007; 92(3): 250-253.
73. Scharberg EA, Rink G, Schulz D, et al. KDAS, a new blood group antigen in the Knops blood group system antithetical to KCAM. Transfusion 2020; 60(8): E25-E27.
74. Grueger D, Zeretzke A, Habicht CP, et al. Two novel antithetical KN blood group antigens may contribute to more than a quarter of all KN antisera in Europe. Transfusion 2020; 60(10): 2408-2418.
75. Bugert P. Knops blood group system: A molecular view. Vox Sang 2023; 118(s1): 6-118.
76. Weinig E, Rink G, Stürtzel A, et al. KNMB, a novel Knops blood group antigen located in LHR-C. Transfusion 2023. Available from: https://doi.org/10.1111/trf.1754
77. Poole J, Tilley L, Warke N, et al. Two missense mutations
in the CD44 gene encode two new antigens of the Indian blood group system. Transfusion 2007; 47(7): 1306-1311.
78. Jones B, Joshi S, Crew VK, et al. A new high incidence antigen of the Indian blood group system. Transfus Med 2016; 26(s2): 20-21.
79. Henny C, Thornton N, Crottet SL, et al. An antibody against a novel high incidence antigen in the Indian blood group system. Vox Sang 2018; 113(s1): 231.
80. Crew VK, Daniels G, Poole J. A New Variant in the OK Blood Group System. Transfus Med 2003; 13(s1): 32.
81. Crew VK, Thomas R, Gillen B, et al. A Novel Variant in the Ok Blood Group System. Transfus Med 2006; 16(s1): 41.
82. Seltsam A, Strigens S, Levene C, et al. The molecular diversity of Sema7A, the semaphorin that carries the JMH blood group antigens. Transfusion 2006; 41(1): 133-146.
83. Richard M, St-Laurent J, Perreault J, et al. A new SEMA7A variant found in Native Americans with alloantibody. Vox Sang 2010; 100(3): 322-326.
84. Tilley L, Laundy R, van der Mark-Zoet J, Folman C, de Haas M, Thornton N, Daniels G. Homozygosity for a Variant SEMA7A Allele Resulting in Loss of a Novel High Frequency JMH Antigen. Transfus Med 2014; 24(s2): 27-28.
85. Vrignaud C, Ramelet S, Herb A, et al. Characterization of a novel high-prevalence antigen in the JMH blood group system. Vox Sang 2019; 114(s1): 52-3.
86. Henny C, Thornton N, Laundy R, et al. An antibody against a novel high prevalence antigen in the JMH blood group system. Vox Sang . 2020; 115(s1): 231.
87. Westman JS, Benktander J, Storry JR, et al. Identification of the Molecular and Genetic Basis of PX2, a Glycosphingolipid Blood Group Antigen Lacking on Globoside-deficient Erythrocytes. J Biol Chem 2015; 290(30): 18505-18518.
88. Hagman JR, Barone A, Westman J, et al. β1,3GalNAc-T1dependent extension of the human blood group B antigen results in a novel ABO-related glycolipid structure on erythrocytes. Vox Sang 2019; 114(s1): 53.
89. Tilley L, Green C, Poole J, et al. A new blood group system, RHAG: three antigens resulting from amino acid substitutions in the Rh-associated glycoprotein. Vox Sang 2010; 98(2): 151-159.
90. Tanaka M, Abe T, Minamitani T, et al. The Kg-antigen, RhAG with a Lys164Gln mutation, gives rise to haemolytic disease of the newborn. Br J Haematol 2020; 191(5): 920926.
91. Ichikawa Y, Sato C, McCreary J, Lubenko A. Kg, a new low-frequency red cell antigen responsible for hemolytic disease of the newborn. Vox Sang 1989; 56(2): 98-100.
92. Kubo S, Takahashi J, Yoshizawa H, et al. Male newborn with anti-Kg antibody-induced hemolytic disease of the newborn. Pediatr Int 2009; 51(4): 582-584.
93. Tanaka M, Horikawa T, Kusumi T, et al. Anti-Kg antibodies induce monocyte phagocytosis of the red blood cells. Transfusion 2021; 61(10): 3050-3051.
94. Gonzalez-Santesteban C, Nogués N, Ruiz NB, et al. Identification of a new low prevalence antigen in the RHAG glycoprotein. Vox Sang 2022; 117(s1): 55-56.
95. Long S, Millard G, Liew YW. Haemolytic disease of the fetus and newborn caused by a novel RhAG antigen with c.140T>C (p.Phe47Ser) missense mutation. Transfus Med 2022; 32(s3): 3-37.
96. Svensson L, Hult AK, Stamps R, et al. Forssman expression on human erythrocytes: biochemical and genetic evidence of a new histo-blood group system. Blood 2013; 121(8): 1459-1468
97. Wieckhusen C, Rink G, Scharberg EA, et al. A new genetic background for the Jr(a–) blood group phenotype caused by the ABCG2*439T allele encoding a p.Arg147Trp change. Transfusion 2017; 57(12): 3063-3064.
98. Saison C, Helias V, Ballif BA, et al. Null alleles of ABCG2 encoding the breast cancer resistance protein define the new blood group system Junior. Nat Genet 2012; 44(2):
174-177.
99. Haer-Wigman L, Soussan AA, Ligthart P, et al. Molecular analysis of immunized Jr(a–) or Lan– patients and validation of a high-throughput genotyping assay to screen blood donors for Jr(a–) and Lan– phenotypes. Transfusion 2014; 54(7): 1836-1846.
100. Hundric Haspl HHZ, Jurakovic Loncar JLN, Tomicic TM, et al. The clinical significance of anti-Jr(a): mild or severe? Vox Sang 2007; 93(s1): 208-209.
101. Peyrard T, Pham BN, Arnaud L, et al. Fatal hemolytic disease of the fetus and newborn associated with anti-Jra. Transfusion 2008; 48(9): 1906-1911.
102. Kwon MY, Su L, Arndt PA, et al. Clinical significance of anti-Jra: report of two cases and review of the literature. Transfusion 2004; 44(2): 197-201
103. Helias V, Saison C, Ballif BA, et al. ABCB6 is dispensable for erythropoiesis and specifies the new blood group system Langereis. Nat Genet 2012; 44: 170-173.
104. Boswell-Casteel R, Fukuda Y, Schuetz JD. ABCB6, an ABC transporter impacting drug response and disease. AAPS; 20(1): 8.
105. Tanaka M, Yamamuro Y, Takahashi J, et al. Novel alleles of Lan− in Japanese populations. Transfusion 2014; 54(5): 1438-1439.
106. Cvejic A, Haer-Wigman L, Stephens JC, et al. SMIM1 underlies the Vel blood group and influences red blood cell traits. Nat Genet 2013; 45: 542-545.
107. SMIM1 small integral membrane protein 1 (Vel blood group) Homo sapiens (human). United States: National Library of Medicine, 2023. Available from: https://www.ncbi.nlm.nih. gov/gene/388588
108. Cvejic A, Haer-Wigman L, Stephens JC, et al. SMIM1 underlies the Vel blood group and influences red blood cell traits. Nat Genet 2013; 45: 542-545.
109. Becton DL, Kinney TR. An infant girl with severe autoimmune hemolytic anemia: apparent anti-Vel specificity. Vox Sang 1986; 51(2): 108-111.
110. Herron R, Hyde RD, Hillier SJ. The second example of an anti-Vel auto-antibody. Vox Sang 1979; 36(3): 179-181.
111. Ferrer Z, Cornwall S, Berger R, et al. A third example of haemolytic auto-anti-Vel. Rev fr transfus immuno hématol 1984; 27(5): 639-644.
112. Levine P, White JA, Stroup M. Seven Vea (Vel) Negative members in three generations of a family. Transfusion 1961; 1(2): 111-115.
113. Van Gammeren AJ, Overbeeke MAM, Idema RN, et al. Haemolytic disease of the newborn because of rare antiVel. Transfus Med 2008; 18(3): 197-198.
114. Li XF, Lin FQ, Li JP. Identification of c.238 A>G (p.Arg80Gly) of CD59 blood group gene. Transfusion 2018; 58(12): 3033-3034.
115. Madjd Z, Pinder SE, Paish C, et al. Loss of CD59 expression in breast tumours correlates with poor survival. J Pathol 2003; 200(5): 633-639.
116. Cocuzzi E, Szczotka LB, Brodbeck WG, et al. Tears contain the complement regulator CD59 as well as decayaccelerating factor (DAF). Clin Exp Immunol 2001; 123(2): 188-195.
117. Anliker M, von Zabern I, Höchsmann B, et al. A new blood group antigen is defined by anti-CD59, detected in a CD59deficient patient. Transfusion 2014; 54(7): 1817-1822.
118. Mikdar M, González-Menéndez P, Cai X, et al. The equilibrative nucleoside transporter ENT1 is critical for nucleotide homeostasis and optimal erythropoiesis. Blood 2021; 137(25): 3548-3562.
119. Daniels G, Ballif BA, Helias V, et al. Lack of the nucleoside transporter ENT1 results in the Augustine-null blood type and ectopic mineralization. Blood 2015; 125(23): 36513654.
120. Sweener JD, Holme S, McCall LA, et al. At(a−) phenotype: description of a family and reduced survival of At(a+) red
cells in a proposita with anti-Ata. Transfusion 1995; 35(1): 63-67.
121. Cash KL, Brown T, Sausais L, et al. Severe delayed hemolytic transfusion reaction secondary to anti-Ata. Transfusion 2002; 39(8): 834-837.
122. Culver PL, Brubaker DB, Sheldon RE, et al. Anti-Ata causing mild hemolytic disease of the newborn. Transfusion 1987; 27(6): 468-470.
123. Millard GM, McGowan EC, Wilson B, et al. A proposed new low-frequency antigen in the Augustine blood group system associated with a severe case of hemolytic disease of the fetus and newborn. Transfusion 2018; 58(5): 1320-1322.
124. Vrignaud C, Mikdar M, Duval R, et al. Molecular and structural characterization of a novel high-prevalence antigen of the Augustine blood group system. Transfusion 2023; 63(3): 610-618.
125. Omae Y, Ito S, Takeuchi M, et al. Integrative genome analysis identified the KANNO blood group antigen as prion protein. Transfusion 2019; 59(7): 2429-2435.
126. PRNP gene. Bethesda, United States: National Library of Medicine, 2014. Available from: https://medlineplus.gov/ genetics/gene/prnp/
127. Ogasawara K, Omae Y, Ito S, et al. The new blood group system no, 37 - “Kanno”. Vox Sang 2020; 115(s1): 59.
128. Bullock T, Folman C, van der Mark-Zoet J, et al. The first example of anti-KANNO found outside of Japan. Vox Sang 2015; 109(s1): 261.
129. Gassner C, Castilho L, Chen Q, et al. International Society of Blood Transfusion Working Party on Red Cell Immunogenetics and Blood Group Terminology Report of Basel and three virtual business meetings: Update on blood group systems. Vox Sang 2022; 117(1): 1332-1344.
130. Stenfelt L,Hellberg Å, Möller M, et al. Missense mutations in B4GALNT2 in Sd(a–) individuals with anti-Sda enable genotypic prediction of Sda deficiency and form the basis of a new blood group system. Transfus Med 2019; 29(s2): 21.
131. Veldhuisen B, Ligthart P, van der Mark-Zoet J, et al. Identification of a single homozygous mutation in the B4GALNT2 gene in individuals lacking the Sd(a) (SID) antigen on red blood cells. Vox Sang 2019; 114(s1): 193.
132. Reznicek MJ, Cordle DG, Strauss RG. A hemolytic reaction implicating Sda antibody missed by immediate spin crossmatch. Vox Sang 1992; 62(3): 173-175.
133. Peetermans ME, Cole-Dergent J. Haemolytic transfusion reaction due to Anti-Sda. Vox Sang 1970; 18(1): 67-70.
134. Santoso S. New insights into TRALI: activation of monocytes and endothelial cells as triggers of transfusionrelated acute lung injury. Vox Sang 2012; 103(s1): 20.
135. Flesch BK, Wesche J, Berthold T, et al. Expression of the CTL2 transcript variants in human peripheral blood cells and human tissues. Transfusion 2013; 53(12): 3217-3223.
136. Vrignaud C, Mikdar M, Koehl B, et al. Alloantibodies directed to the SLC44A2/CTL2 transporter define two new red cell antigens and a novel human blood group system. Transfusion 2019; 59(s3): 18A.
137. Sugier H, Vrignaud C, Duval R et al. Null allele of ABCC1 encoding the multidrug resistance protein 1 defines a novel human blood group system. Vox Sang. 2020; 115(S1): 4041.
138. Sassi Y, Lipskaia L, Vandecasteele G, et al. Multidrug resistance-associated protein 4 regulates cAMP-dependent signaling pathways and controls human and rat SMC proliferation. J Clin Invest 2008; 118(8): 747-757.
139. Reid G, Wielinga P, Zelcer N, et al. The human multidrug resistance protein MRP4 functions as a prostaglandin efflux transporter and is inhibited by nonsteroidal antiinflammatory drugs. Proc Natl Acad Sci USA 2003; 100(16): 9244-9249.
140. Azouzi S, Mikdar M, Hermand P, et al. Lack of the multidrug transporter MRP4/ABCC4 defines the PEL-negative blood group and impairs platelet aggregation. Blood 2020; 135(6): 441-448.
141. Baglow L, Tilley L, Crew VK, et al. A novel EMP3 null allele detected in a patient with the MAM- phenotype. Vox Sang 2021; 116(s1): 32-33.
142. Zhang N, Zhu HP, Huang W, et al. Unraveling the structures, functions and mechanisms of epithelial membrane protein family in human cancers. Exp Hematol Oncol 2022 Oct 10;11:69.
143. Thornton N, Crew VK, Tilley L, et al. Disruption of the tumour-associated EMP3 enhances erythroid proliferation and causes the MAM-negative phenotype. Nature Communications 2020; 11: 3569.
144. Montgomery Jr WM, Nance SJ, Donnelly SF, et al. MAM: a “new” high-incidence antigen found on multiple cell lines. Transfusion 2002; 40(9): 1132-1139.
145. PIGG phosphatidylinositol glycan anchor biosynthesis class G. United States, National Library of Medicine. 2023. Available from: https://www.ncbi.nlm.nih.gov/gtr/ genes/54872/
146. Makrythanasis P, Kato M, Zaki MS, et al. Pathogenic Variants in PIGG Cause Intellectual Disability with Seizures and Hypotonia. Am J Hum Genet 2016; 98(4): 615-626.
147. McOmish C. A monthly roundup of key articles in other journals. Transfusion 2021; 62(1): 11-13
148. Daniels GL, Taliano V, Klein MT, McCreary J. Emm, a red cell antigen of very high frequency. Transfusion 1987; 27(4): 319-321.
149. Takahashi J, Date E, Kusumi T, et al. The first example of an acute hemolytic transfusion reaction due to anti-EMM and the first Japanese proband. Vox Sang 2013; 105(s2): 21.
150. Wagner MM, van Dunné FM, Kuipers I, et al. Anti-Emm in a pregnant patient - case report. Vox Sang 2013; 106(4): 385-386.
151. Jiye Y, Jianting Z. Multidrug resistance-associated protein 1 (MRP1/ABCC1) polymorphism: from discovery to clinical application. Zhong Nan Da Xue Xue Bao Yi Xue Ban 2011; 36(10): 927–938.
152. Andolfo I, Alper SL, De Franceschi L, et al. Multiple clinical forms of dehydrated hereditary stomatocytosis arise from mutations in PIEZO1. Blood 2013; 121(19): 3925-3935.
153. Antonelou MH. Tools and metrics for the assessment of post-storage performance of red blood cells: no one is left over. Transfusion 2022; 63(1): 1-6
154. Coste B, Mathur J, Schmidt M, et al. Piezo1 and Piezo2 are essential components of distinct mechanically-activated cation channels. Science 2010; 330(6000): 55-60.
155. Crew VK, Tilley LA, Satchwell TJ, et al. Missense mutations in PIEZO1, encoding the Piezo1 mechanosensor protein, define the Er red blood cell antigens. Blood. 2022. Cited In: McOmish C. A monthly roundup of key articles in other journals. Transfusion 2022; 63(1): 7-10.
156. Rać ME, Safranow K, Poncyljusz W. Molecular Basis of Human CD36 Gene Mutations. Mol Med 2007; 13: 288296.
157. Chen Y, Zhang J, Cui W, Silverstein RL. CD36, a signaling receptor and fatty acid transporter that regulates immune cell metabolism and fate. J Exp Med 2022; 219(6): e20211314. Available from: https://www.ncbi.nlm.nih.gov/ pmc/articles/PMC9022290/
158. van Schravendijk MR, Handunnetti SM, Barnwell JW, Howard RJ. Normal Human Erythrocytes Express CD36, an Adhesion Molecule of Monocytes, Platelets, and Endothelial Cells. Blood 1992; 80(8): 2105-2114.
159. Alattar AG, Storry JR, Olsson ML. Challenging the definition of a blood group: proposal to make CD36 a novel blood group system based on a case report and preexisting genetic, proteomic and clinical data. Vox Sang 2023; 118(s1): 6-118.
Copyright: © 2024 The author(s). This is an open-access article distributed under the terms of the Creative Commons Attribution License, which permits unrestricted use, distribution, and reproduction in any medium, provided the original author(s) and source are credited.
The MNS blood group system: a review
Rei Miyamoto
ABSTRACT
In transfusion science, blood group systems are one of the significant factors that must be considered throughout the donation and transfusion processes. One of these blood group systems is the MNS system, which was discovered second only to the ABO system, in 1927. The system is comprised of a large group of polymorphic, high-frequency and low-frequency antigens, which have formed from genetic recombination, unequal crossing over, gene conversion, and single nucleotide polymorphisms (SNPs). Besides the genetic mechanisms, the phenotypic frequencies among population groups are interesting characteristics of this blood group system.The antigens are found on single pass sialoglycoproteinsAand B on the red blood cell (RBC) membrane as well as the renal endothelium and epithelium. They are involved in many roles such as preventing RBC agglutination in blood vessels, complement regulation, transmembrane signalling, anion exchange, and binding cytokines. They are even thought to bind bacteria and malarial parasites, meaning that individuals with null phenotypes have resistance to some infectious diseases. The clinical significance of this blood group system in transfusion practice comes from the alloantibodies that can cause transfusion reactions or haemolytic disease of the fetus and newborn (HDFN). This review aims to provide an informative and critical summary of the MNS blood group system in the context of transfusion science. Keywords: MNS blood group system, sialoglycoproteins, red blood cell, transfusion reactions.
NZ J Med Lab Sci 2024; 78(1):20:23
INTRODUCTION
In transfusion science, many of the human blood group systems have alloantibodies that are clinically significant, with the potential to cause adverse events during blood transfusion (1). It is therefore important to understand the potential for adverse immunological events for each of the blood group systems and in this review the MNS blood group system will be considered.
Discovery
In the MNS blood group system, the major antigens are M, N, S, s, and U (2, 3). After the discovery of the ABO system, Landsteiner and Levine later discovered the M and N antigens in 1927. The letters of these antigens were taken from the word ‘immune’, as they discovered that rabbits became immunised to produce anti-M and anti-N, following exposure to human red blood cells (RBCs) (3-5). Later in 1947, Walsh and Montgomery discovered an antibody in a patient against a new antigen which they called S, named after ‘Sydney ’ in Australia where it was first found. The antithetical antigen of S was named s, following its discovery in 1951 (3-5). Genetic studies into several families showed that the loci of M/N and S/s were closely linked and that there was a high degree of polymorphism of this blood group system (6). The U antigen of the MNS system was later discovered in 1953 by Wiener, Unger, and Gordon, and stands for ‘universal’ based on its universal distribution as it is expressed in almost all Caucasians and Africans (3-5, 7, 8).
According to the most recent classifications by the International Society of Blood Transfusion (ISBT), there are a total of 50 antigens in the MNS blood group system (ISBT 002) (9). The frequencies of different MNS phenotypes in Caucasian and African populations are displayed in Table 1 (1, 4, 7, 10). Other than the main antigens, there are others of high prevalence, existing in over 90% of the population, or low prevalence, seen in less than 1% of the population (6).
Genetics
The genes encoding the MNS proteins are found on the long arm of chromosome 4 (2, 4, 5, 11). The two codominant alleles for the M (MNS1) and N (MNS2) antigens are found on the GYPA gene which encodes the glycophorin A (GPA) protein (2, 3, 11). It is thought that the GYPA gene duplicated and underwent crossover between two chromatid strands, resulting in progenitor GYPB and GYPE segments that became independent genes (3, 4). This makes the GYPA, GYPB, and GYPE genes very similar (>95% homology) and closely linked, allowing further recombination to occur (3, 4). This confers the formation of a highly diverse group of antigens in this system that is much larger than in other blood group systems such as ABO, Kell, Duffy, and Kidd (2, 4, 9 12). The GYPB gene encodes for glycophorin B
(GPB) and has an MNS3 allele for the S antigen, and an MNS4 allele for the s antigen, which are also co-dominantly expressed (2, 3, 11). The M and N alleles differ by three single nucleotide polymorphisms (SNPs) on the GYPA gene, leading to serine and glycine in the M antigen and leucine and glutamic acid in the N antigen at amino acid positions 1 and 5, respectively (Figure 1) (2-4, 7). On the other hand, the S and s alleles only have one SNP difference in the GYPB gene, leading to methionine on the S antigen and threonine on the s antigen at position 29 (Figure 1)(2-4, 7). The role of the GYPE gene is not well understood as its protein is not found on the RBC surface; however, it is thought to contribute to other MNS variants through gene rearrangement with GYPB. It has an identical genetic sequence to GYPA, so expression would result in M antigens on the RBC surface (3-5, 11).
Proteins and antigens
The M/N and S/s antigens are found on single pass sialoglycoproteins A and B, respectively, as displayed in Figure 1. They are found in the glycocalyx of the RBC membrane as well as the renal endothelium and epithelium (2-5). GPA is glycated by N-linked and O-linked oligosaccharides, while GPB only has N-glycosylation (4, 6). The sialic acid contributes to the negative charge on the RBC surface, preventing RBC agglutination for good blood flow in small blood vessels (2-5, 14). This glycation is also essential for the insertion and expression of GPA and GPB on the RBC surface (6). Other major functions include complement regulation, transmembrane signalling, facilitating anion exchange by band 3, and binding cytokines (2, 5, 6, 14). By interacting with band 3, the glycophorins provide physical support to the RBC cytoskeleton and assist with CO2 exchange between tissues. This is reinforced by the fact that individuals with the Mur glycophorin variant with high band 3 expression were found to have a higher rate of CO2 respiration (15). They also bind bacteria, viruses, and the Plasmodium falciparum parasite, due to the high abundance of glycophorins on RBCs and other cells (2, 3, 5). The MNS null phenotype of the system provides a selective advantage for resistance to some infections with some of the populations from African malaria-endemic countries having a relatively higher frequency of the S-s- and U-phenotypes (Table 1) (2, 4, 14, 16). It is thought that P. falciparum binds to band 3 and the sialic acid on GPA or some GPB to form a tight complex and invade the RBCs (17). Despite the overall low prevalence of S-s- phenotypes indicated by Table 1, some select African populations were found to have a S-sfrequency of up to 35%. Furthermore, a vast majority of these individuals also had the U- phenotype (18). A more recent study by Leffler et al. revealed that a rare MNS hybrid variant called Dantu, is present in East African populations which also confers
protection against severe malaria (16). This variant is thought to result in a hybrid between the extracellular domain of GPB and the transmembrane and intracellular domains of GPA, reducing the ability of P. falciparum to bind to band 3 (16, 17). Not only does the Dantu variant reduce the risk of severe malaria, it also reduces the morbidity of individuals once infected (17).
The GPA structure is thought to act as a receptor for bacteria such as pathogenic strains of Escherichia coli, causing urinary tract infections and possibly meningitis and septicaemia in neonates (19, 20). Several viruses have been reported to also use glycophorin structures for RBC invasion, including hepatitis A virus, reovirus, Influenza virus, and rotavirus. In contrast to P.falciparum infection, the presence of glycophorins on the RBC surface helps to protect individuals against these viruses, bringing viruses in the blood to sites of immune processing away from important target tissues via RBCs (21, 22).
As discussed earlier, the genetic linkage and high similarity between the genes result in a highly polymorphic and diverse group of antigens (5, 11). The main antigens M, N, S, s, and U are expressed on the cord RBC surface at birth (7). The U antigen is also present on the GPB structure and is distributed in high frequency along with other antigens such as Ena, as listed in Table 2 (2, 4, 11). Most U- individuals have associated S-sphenotype due to the absence or alteration of the GPB protein overall (1, 5, 8). Similarly, Ena- is associated with the absence of the M and N antigens on GPA (14). The Ena antigen is present on GPA, close to the RBC surface and is part of the RBC envelope, where its name comes from (7).
Another interesting property of the MNS blood group antigens is their sensitivity to certain laboratory enzymes. For example, M and N antigens are cleaved from the glycophorin structures using ficin, papain, trypsin, and pronase, while the S and s antigens are sensitive to a-chymotrypsin and pronase with some sensitivity to both ficin and papain (2, 10). Their cleavage sites in the GPA and GPB structures are shown in Figure 1 (12). This characteristic is useful in the diagnostic identification of alloantibodies, as laboratory enzymes can destroy specific antigens and enhance the activity of others (e.g., ABO, Rh, Kidd, Lewis, P) (23). This fact also allows the differentiation of antibodies in a mixture of antibodies that respond differently to enzyme treatment (24). Some of the low frequency MNS antigens are enzyme resistant with the M variant antigen resistant to trypsin, papain, ficin, and bromelin (25).
Alloantibodies
Alloantibodies against the MNS blood group antigens have different characteristics and properties. Anti-M and anti-N are usually IgM and show a dosage effect, and some anti-M can have a partial IgG component. Alloantibodies can directly agglutinate M or N-positive RBCs due to the high expression of GPA (2, 3, 5, 11) in saline (8). Both anti-M and anti-N are more reactive and specific at a slightly acidic pH, around 6.5 (6). As they are coldreactive, they can be detected at lower temperatures meaning they can often interfere in ABO grouping reactions, necessitating ABO grouping to be performed at 37°C (5, 11). Anti-M & N are naturally occurring alloantibodies, having been found in children without exposure to M or N antigens. As they are mostly reactive at body temperature, most are not clinically significant in blood transfusion (2-5, 11). Rare examples of anti-M and anti-N that are reactive at 37°C have been reported and have led to both immediate and delayed-type haemolytic transfusion reactions (HTR) bringing about extravascular red cell destruction (2, 4, 5, 8, 11). Anti-M rarely causes haemolytic disease of the fetus and newborn (HDFN) and neonatal RBC aplasia (2, 4-6, 8, 11). Anti-M is more common in young children, patients with bacterial infections, and pregnant women with an M+ fetus. Generally, anti-N is less often seen due to the structurally similar “N” antigen on GPB, preventing N- individuals from producing anti-N (10). On the other hand, anti-Ena are usually IgG and have caused severe HTR and HDFN reacting with the high-frequency epitopes on GPA. Because of the high prevalence of Ena epitopes in the
population, it is difficult to find compatible donor units for Enapatients with anti-Ena, who are usually also M-N- (2, 3, 5).
In contrast, antibodies against the S, s, and U antigens are generally IgG, though rare cases of IgM anti-S have been reported (2, 5, 10, 11). IgG class antibodies require the use of anti-human antiglobulin in the indirect antiglobulin test (IAT) alloantibody screen. Agglutination by anti-s can be enhanced by slightly reducing the pH to 6.0 from the buffered saline pH of 7.0 (5, 8, 10). The presence of these alloantibodies is more clinically significant than anti-M and anti-N, as they are reactive at body temperature and can cross the placenta. Anti-S and anti-s have been reported to cause delayed HTR and HDFN, in higher frequencies than anti-M or anti-N (1, 8, 14). Anti-U is rare but is known to be more severe or fatal in the event of transfusion reactions and must be considered in S-s- individuals due to the GPB-null phenotype (1, 3, 8). This means that S-, s-, or U- patients require transfusion with null phenotype blood to avoid adverse transfusion reactions (13).
Autoantibodies in this blood group system are rare, but some autoimmune diseases have been reported in the past (2, 14, 26). This includes auto anti-N in a dialysis patient using equipment that was disinfected by formaldehyde. Other examples of auto anti-N, auto anti-S, and auto anti-U have been reported to cause autoimmune haemolytic anaemia as well as warm autoantibodies against M, N, S, s, U, and Ena antigens (2, 6, 7, 26).
Genetics, Antigens, and Antibodies of Hybrid Variants
Many hybrid variants are formed through unequal crossing over, gene conversion, missense mutations, and splicing variants (4, 22, 27). New hybrid glycophorins are expressed following a repair of a defective splice site in exon III of the GYPB gene and this is the ‘hotspot’ of recombination between the homologous sequences (22, 27).The different hybrid types are named GYP(A-B) and GYP(B-A) caused by unequal crossing over; and GYP(A-B-A), GYP(B-A-B), GYP(A-E-A), and GYP(B-E-B) caused by gene conversion (4, 27, 28). Unequal crossing over between two chromatin strands results in different hybrid variant types based on the recombination site and arrangements as demonstrated in Figure 2. For instance, the GYP(A-B) strand is missing GYPA and GYPB, but the GYP(B-A) strand has both GYPA and GYPB. GYP(A-B-A) only has GYPB and GYP(BA-B) has GYPA, by the replacement of defective splice sites (4, 27). Missense mutations or splicing variants are caused by SNPs present in the introns or exons and lead to a change in the amino acid sequence or splice site (4). Unequal crossing over as well as gene deletion are also responsible for null phenotypes such as M-N-Ena-, S-s-U-, and MkMk (lack of both M/N and S/s antigens) (5, 26).
MNS hybrid variants are more commonly seen in Asian populations (4). Most of the hybrid variants are low-prevalence antigens (Table 2); however, corresponding alloantibodies may be clinically significant for causing both immediate and delayed HTR and HDFN (4, 5). For example, the Mur glycophorin is common in China, Thailand, Taiwan, Singapore, Malaysia, and Vietnam, and exposure triggers an antibody response to Mia, Mur, MUT, and Hil antigens. The IgG class alloantibodies formed against these antigens have caused HTR and HDFN; however, some are naturally occurring and harmless (27). Alloantibodies against the Vw and Mia antigens on the Vw glycophorin are also common however they are clinically insignificant unless they are IgG (22, 27). Clinically significant IgG class anti-Vw examples are more common in European countries such as Switzerland, causing HDFN (22). In transfusion medicine, the identification of irrelevant IgM antibodies is avoided by using alloantibody screening cells without corresponding antigens (22). Conversely, new alloantibody screening cells or kodecytes have been developed to include specific blood group variant antigens for which antibodies may be more common and clinically significant in certain populations. For example, the epitopes of Mur and MUT peptides were successfully attached onto RBCs by KODETM technology, without affecting the qualitiy of alloantibody screening or identification tests (30).
Polymorphic M, N, S, s
High prevalence
Low prevalence
U, Ena, ENKT, “N”, ENEP, ENEH, ENAV, ENDA, ENEV, JENU
He, Mia, Mc, Vw, Mur, Mg, Vr, Me, Mta, Sta, Ria, Cla, Nya, Hut, Hil, Mv, Far, sD, Mit, Dantu, Hop, Nob, Or, DANE, TSEN, MINY, MUT, SAT, ERIK, Osa, HAG, MARS, MNTD, SARA, KIPP, SUMI
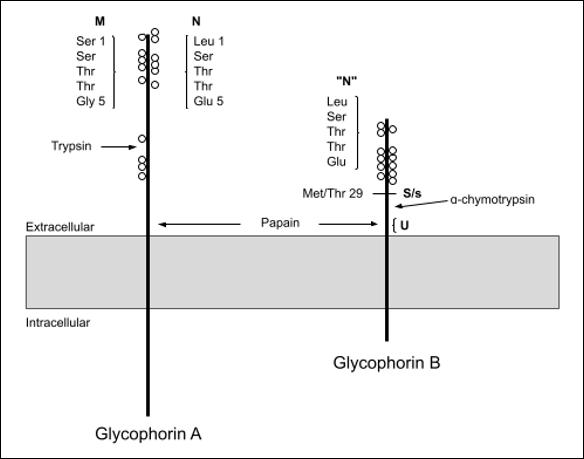
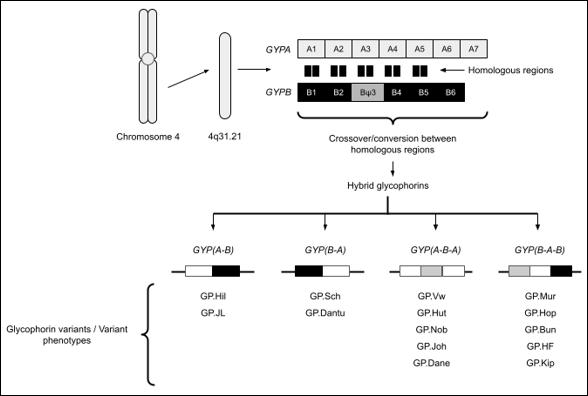 Table 1: MNS Phenotype Frequencies in Caucasians and Africans (1, 4, 7, 10)
Table 2. Other antigens in the MNS Blood Group System (4, 7)
Figure 1. Structure of glycophorin A and glycophorin B adapted from (12)
Table 1: MNS Phenotype Frequencies in Caucasians and Africans (1, 4, 7, 10)
Table 2. Other antigens in the MNS Blood Group System (4, 7)
Figure 1. Structure of glycophorin A and glycophorin B adapted from (12)
CONCLUSION
The MNS blood group system exhibits diverse molecular and immunological properties. The genes, proteins, antigens, and corresponding alloantibodies can contribute to an individual’s unique MNS blood group. This review emphasizes the importance of matching MNS blood groups for patients requiring blood transfusion in whom atypical clinically significant alloantibodies of the MNS system have been encountered and threaten HTR or HDFN. While some MNS blood group variations are rare or less clinically significant, each should be considered, as clinical consequences can be severe.
The understanding of the MNS system has been evolving since its discovery in 1927 and today, 50 antigens have been identified in this highly polymorphic system.
AUTHOR INFORMATION
Rei Miyamoto, BMLSc, Medical Laboratory Scientist, University of Otago.
Correspondence: Rei Miyamoto email: rei1004miyamoto@gmail.com
REFERENCES
1. Stendahl K, Tormey CA, Baine IL. Methods of RBC Alloimmunization to ABO and Non-ABO antigens, and test methodologies. In: Maitta RW, eds. Immunologic Concepts in Transfusion Medicine. Elsevier, Philadelphia 2020; 15–33.
2. Aeschlimann J, Westhoff CM. MNS and duffy blood group systems. In: Shaz BH, Hillyer CD, Gil MR, eds. Transfusion Medicine and Hemostasis: clinical and laboratory aspects. Elsevier Science, Amsterdam 2019; 163–167.
3. Dean L. The MNS blood group. In: Beck B, eds. Blood Groups and Red Cell Antigens. National Center for Biotechnology Information, Bethesda 2005; 65-69.
4. Lopez GH, Hyland CA, Flower RL. Glycophorins and the MNS blood group system: a narrative review. Annals of Blood 2021; 6: 1-16.
5. Reid ME, Westhoff CM. Other blood group antigens and antibodies. In: Hillyer CD, Silberstein LE, Ness PM, et al, eds. Blood Banking and Transfusion Medicine. Churchill Livingstone/Elsevier, Philadelphia 2007; 96–111.
6. Daniels G. Human Blood Groups. 2nd ed. John Wiley & Sons, Incorporated, 2002.
7. Reid ME, Lomas-Francis C, Olsson ML. MNS Blood Group System. In: Reid ME, Lomas-Francis C, Olsson ML, eds. The Blood Group Antigen FactsBook. Academic, Oxford 2012; 53–134.
8. Knowles S, Regan F. Blood cell antigens and antibodies: erythrocytes, platelets, and granulocytes. In: Lewis SM, Bain BJ, Bates I, eds. Dacie and Lewis Practical Haematology Churchill Livingstone/Elsevier, Philadelphia 2006; 481–522.
9. ISBT. 201 Table of blood group systems [Internet]. International Society of Blood Transfusion 2022; Available from: https:// www.isbtweb.org/resource/tableofbloodgroupsystems.html
10. Castillo B, Dasgupta A, Klein K, et al. Red cell antigens and antibody. In: Castillo B, Dasgupta A, Klein K, et al, eds. Transfusion Medicine for Pathologists. Elsevier 2018; 69–112.
11. Quraishy N, Sapatnekar S. Advances in blood typing. In: Makowski GS, eds. Advances in Clinical Chemistry. Clinical Laboratory Partners, Newington 2016; 221–269.
12. Aeschlimann J, Westhoff CM. MNS and duffy blood group systems. Transfusion Medicine and Hemostasis 2019. Figure 28.1, Diagram of glycophorin A and glycophorin B; p.163.
13. Hagman JR, Storry JR. Other protein blood groups. In: Simon TL, Gehrie EA, McCullough J, et al, eds. Rossi’s Principles of Transfusion Medicine. Wiley-Blackwell, Chichester, 2022; 109–117.
14. Reid ME, Lomas-Francis C, Olsson ML. Section III. Other useful facts. In: Reid ME, Lomas-Francis C, Olsson ML, eds. The Blood Group Antigen FactsBook. Academic, Oxford 2012; 692–729.
15. Hsu K. Exploring the potential roles of band 3 and aquaporin-1 in blood CO2 transport–inspired by comparative studies of glycophorin B-A-B hybrid protein GP.Mur. Front Physiol 2018; 9: 1-10.
16. Leffler EM, Band G, Busby GBJ, et al. Resistance to malaria through structural variation of red blood cell invasion receptors. Science 2017; 356(6343): 1-31.
17. Jaskiewicz E, Jodłowska M, Kaczmarek R, Zerka A. Erythrocyte glycophorins as receptors for plasmodium merozoites. Parasit Vectors 2019; 12(1): 317. doi: 10.1186/ s13071-019-3575-8
18. Lu YQ, Liu JF, Nagel RL, Blumenfeld OO. Erythrocyte membrane glycophorins of Central Africans and some hematological patients. Chin Med J 1987; 100(10): 787–794.
19. Parkkinen J, Rogers GN, Korhonen T, et al. Identification of the O-linked sialyloligosaccharides of glycophorin A as the erythrocyte receptors for S-fimbriated Escherichia coli. Infect Immun 1986; 54(1): 37–42.
20. Wright KJ, Hultgren SJ. Sticky fibers and uropathogenesis: bacterial adhesins in the urinary tract. Future Microbiol 2006; 1(1): 75–87.
21. Salas A, Marco-Puche G, Triviño JC, et al. Strong downregulation of glycophorin genes: a host defense mechanism against rotavirus infection. Infect Genet Evol 2016; 44: 403–411.
22. Heathcote DJ, Carroll TE, Flower RL. Sixty years of antibodies to MNS system hybrid glycophorins: what have we learned? Transfus Med Rev 2011; 25(2): 111–124.
23. Castillo B, Dasgupta A, Klein K, et al. Blood bank testing. In: Castillo B, Dasgupta A, Klein K, et al, eds. Transfusion Medicine for Pathologists. Elsevier, 2018; 51–68.
24. Strobel E. Use of the enzyme method for antibody identification. Clin Lab 2004; 50(9-10): 575–580.
25. Tsuneyama H, Isa K, Watanabe-Okochi N, et al. An unusual variant glycophorin expressing protease‐resistant M antigen encoded by the GYPB‐E(2‐4)‐B hybrid gene. Vox Sang 2020; 115(7): 579–585.
26. Schenkel-Brunner H. MNS System. In: Schenkel-Brunner H, eds. Human Blood Groups. Springer, Vienna; 2000: 304-63.
27. Hassan SN, Kannan TP, Mohamad S, et al. Molecular detection of glycophorins A and B variant phenotypes and their clinical relevance. Transfus Med Rev 2019; 33(2): 118–124.
28. ISBT 002. MNS Blood Group Alleles [Internet]. International Society of Blood Transfusion 2023; V5.7. Available from: https://www.isbtweb.org/resource/002mnsalleles.html
29. Hassan SN, Kannan TP, Mohamad S, et al. Molecular detection of glycophorins A and B variant phenotypes and their clinical relevance. Transfus Med Rev 2019 Apr. Figure 1, General overview of hybrid glycophorins A and B: 120.
30. Heathcote D, Carroll T, Wang JJ, et al. Immunohematology: novel antibody screening cells, MUT+Mur kodecytes, created by attaching peptides onto red blood cells. Transfusion 2009; 50(3): 635–641.
Copyright: © 2024 The author(s). This is an open-access article distributed under the terms of the Creative Commons Attribution License, which permits unrestricted use, distribution, and reproduction in any medium, provided the original author(s) and source are credited.


A review of ten years of Leptospira serology and PCR testing
Tégan A. Hall, Andrew W. Soepnel and Michael AddidleABSTRACT
Objective: To evaluate the use of diagnostic Leptospira laboratory testing within the Midlands region of New Zealand and identify the most sensitive testing strategy.
Method: Leptospira serology and polymerase chain reaction (PCR) testing performed within the Pathlab remit in 2013-2022 were reviewed by comparing methodologies and request origins to identify trends over time and evaluate the relative performance of serology and PCR testing.
Results: 81% of the cases tested by both serology and PCR that were confirmed infections were detected by either blood PCR, urine PCR, or serology alone. No significant difference was observed between the detection rates of blood PCR and urine PCR. Serology was the most frequently requested methodology, though PCR testing quadrupled in 2017 and uptake has continued to increase since then, becoming the favoured methodology amongst hospital-based requestors in 2022.Appropriately timed paired serological testing was rarely performed.
Conclusions: No single methodology can be relied on to consistently detect leptospirosis infections. Follow-up serology was underutilised.Acombination of PCR and serology testing was the most effective testing strategy.
Key words: Leptospirosis, ELISA, microscopic agglutination test (MAT), serology, PCR.
NZ J Med Lab Sci 2024; 78(1): 25:30
INTRODUCTION
Leptospirosis is an illness caused by infection with pathogenic spirochaetes of the Leptospira genus and is a notifiable disease in New Zealand, which has an annual incidence of approximately 2 per 100,000 population (1). Transmission is typically zoonotic, occurring through contact with infected farm animals or rats, or through contact with water or soil contaminated with the urine of infected animals. Risk of exposure is therefore highest for rural occupations and meat workers (2).
After a mean incubation period of ten days, leptospirosis causes a biphasic illness with a range of presentations. During the acute phase, leptospires are present throughout the blood and tissues, commonly causing flu-like symptoms such as headache, fever, myalgia and conjunctival suffusion. In the 10% of cases that are severe, Weil’s disease (jaundice, renal failure, haemoptysis, and dyspnoea), meningitis, or respiratory failure can develop. After three to nine days, the acute phase may cede to a brief asymptomatic period before the immune phase begins. The immune phase is characterised by a rise in anti-Leptospira IgM antibodies and clearance of leptospires from the blood and tissues, except kidney tubules, resulting in prolonged intermittent shedding in the urine. This phase can present similarly to the acute-phase symptoms, which may progress to multiple organ failure (3,4). When clinical suspicion for leptospirosis is high, treatment with antibiotics is initiated immediately, as treatment is most effective when commenced within five days of illness (4).
The non-specific and variable manifestations of leptospirosis make the infection difficult to identify by clinical presentation alone. The presentation may be similar to other conditions such as viral hepatitis, influenza, toxoplasmosis and septicaemia; other rural infections, such as rickettsiosis; or tropical diseases in the case of returned travellers (3,4). This makes laboratory findings essential to confirming the diagnosis. Leptospirosis tests available in New Zealand include serology and polymerase chain reaction (PCR). Two types of serological tests are used for leptospirosis diagnosis in New Zealand: Leptospira IgM by enzyme-linked immunosorbent assay (ELISA) or chemiluminescent immunoassay (CLIA), and the microscopic agglutination test (MAT). The IgM assays qualitatively detect the presence of anti-Leptospira IgM antibodies and are commonly employed as a screening test with the MAT used as a confirmatory assay. Leptospira IgM assays can be performed on automated platforms with a short turn-around-time. However, a positive Leptospira IgM result is not confirmatory for leptospirosis as it may represent a recent infection, a cross-reaction, or a past infection, since anti-Leptospira antibodies can remain detectable for months to years post-infection (3,5). MAT is regarded as the gold standard serological test for leptospirosis (2,3), though it also has drawbacks. The method involves the use of a panel
of live Leptospira serovars. Antibodies of both IgG and IgM isotypes from patient serum bind to the causative serovar in the panel, resulting in agglutination and therefore identification of the infecting serovar (6). A minimum of 50% agglutination at a titre ≥ 400 in a single serum sample, or a minimum four-fold rise between acute and convalescent sera titres is considered serological confirmation of leptospirosis in New Zealand (2). The two diagnostic laboratories where Leptospira MAT is available in New Zealand use the same panel of eight serovars known to cause infection in New Zealand and Australia. As there are over 250 pathogenic Leptospira serovars worldwide, leptospirosis acquired overseas may give false negative results if the infecting serovar is not present in the MAT panel (2,6). The restriction of MAT to only two laboratories nationwide is a result of its complex and labour-intensive nature. The need to maintain live Leptospira cultures presents both a technical difficulty and a biosafety hazard. The test cannot be standardised and must be maintained as an in-house assay and has an interpretation that may be subject to reader variation (6,7).
The sensitivity of serological tests for leptospirosis varies with the stage of infection. Testing should therefore be carried out on temporally paired sera. Both Leptospira IgM and MAT have low sensitivity during the acute phase of infection, when the humoral immune response is yet to appear. Sensitivity becomes optimal during the immune phase (8). In practice, this means that a convalescent sample of an infected patient, which is recommended to be taken three weeks after the onset of symptoms (4), compared to the acute sample taken at the first presentation, should show either seroconversion or a rise in MAT titre (7,9), providing a retrospective diagnosis. In some cases, early antibiotic therapy can interfere with the antibody response, and repeat testing beyond the paired sera may be necessary (4,7).
In contrast to serology, PCR can provide a more rapid “realtime” laboratory diagnosis of leptospirosis using blood or urine samples, and in cases of meningitis, cerebrospinal fluid (CSF) (4). PCR on blood samples can detect leptospirosis during the first week of symptomatic illness, before antibodies are detectable by serological methods (10,11). However, leptospiraemia is efficiently cleared during the immune phase, resulting in blood PCR becoming unreliable from the second week of illness (11). Urine is the recommended PCR sample-type during the immune phase. However, as leptospires are shed intermittently from the kidneys during infection, a negative urine PCR result does not exclude leptospirosis and should be repeated in cases with high clinical suspicion of leptospirosis (2,4). A single positive PCR result is sufficient for confirmation of leptospirosis (2).
Testing for leptospirosis is inconsistent throughout New Zealand, as test accessibility, which is dependent on location, dictates how
a patient is tested, as opposed to official guidance. Leptospira IgM is performed by three diagnostic laboratories using different test kits and platforms. All positive and equivocal Leptospira IgM samples are sent to the same reference laboratory for MAT. Patients who have Leptospira serology performed outside the areas covered by these laboratories are only tested by MAT, not IgM ELISA or CLIA, and only when both acute and convalescent serum samples have been submitted (with exceptions). PCR testing is also available at three laboratories, and acceptance criteria for testing varies from none to provision of specific clinical details and sample timing (unpublished survey of New Zealand’s medical laboratories, November 2021). Guidance for laboratory testing is also inconsistent. The Ministry of Health recommends that patients be tested by both MAT and PCR (2). This conflicts with advice from Best Practice Advocacy Centre New Zealand (bpacnz) to perform paired serology and only add PCR when illness is severe or if it is necessary to confirm an occupationally acquired infection (4).
This study undertook a retrospective review of Leptospira serology and PCR results over a ten-year period from patients in the Pathlab remit, to evaluate the utilisation and value of the different test methods available for diagnosing leptospirosis in the Midlands region. The aim was to identify which testing strategies have been most effective in detecting leptospirosis.
METHODS
Ethics
Ethical approval was not required as per the Health and Disability Ethics Committees’ (NZ) screening questionnaire.
Data Collection
Leptospira serology and PCR results were retrieved from the Pathlab results repository accompanied by patient National Health Index (NHI), requestor location, sample identifier, and collection date, to cover 2013–2022, inclusive. The retrieval captured requests from community-based requestors throughout the Midlands region of New Zealand, excluding Tairāwhiti and Taranaki, in addition to four public hospitals located in Tauranga, Whakatāne, Rotorua, and Taupō. Requests collected at Waikato, Thames, Tokoroa, Te Kuiti, and Taumarunui Hospitals do not fall under the Pathlab testing remit and were not included in the data.
Serology consisted of IgM ELISA (PanBio) performed at Pathlab Waikato, and MAT performed by ESR Wallaceville on samples equivocal or positive by IgM ELISA. PCR was performed at Waikato Hospital Laboratory, initially almost exclusively on blood samples, with urine officially validated as a sample-type in 2017.
Result Interpretation
IgM ELISA results were reported qualitatively as either negative, equivocal, or positive, as per manufacturer cut-offs. MAT results were reported quantitatively as a titre, as well as qualitative interpretation. Interpretations included “negative” (titre < 50), “exposed” (titre 50–200, where only one sample was collected, or the titres from paired sera remained within this range without a four-fold rise), and “confirmed” (single titre ≥ 400, or fourfold increase in titre between acute and convalescent sera). PCR results were reported qualitatively as “not detected” or “detected”. Any case with a confirmed MAT result and/or PCR detected was regarded as confirmed positive for leptospirosis, as per the Ministry of Health New Zealand’s laboratory criteria for diagnosis (2).
Data Analysis
Serology and PCR test numbers, and PCR sample-types used, were compared for hospital- and community-based requestors over time. The relative performance of serology and PCR tests was analysed by applying an inclusion criterion of both serology and PCR results being available for each case of suspected leptospirosis. Test results grouped for each case were required to pertain to the same episode of illness. Where multiple requests were made for the same test during the same episode of illness and the result changed between requests, the convalescent or confirmatory results were deemed to be most useful and used for the purposes of data analysis.
Using the data that met the inclusion criterion, the negative predictive value (NPV) of Leptospira IgM ELISA was calculated as the number of cases where IgM and PCR were negative (IgM true-negative) divided by the total number of cases where IgM was negative. The positive predictive value (PPV) of Leptospira IgM ELISA was calculated as the number of cases where IgM was positive and supported by a confirmed MAT or detection by PCR (IgM true-positive) divided by the total number of cases where IgM was positive. Equivocal IgM results were excluded from these calculations as they defer to the MAT result.
Results preceding 2017 were removed to give an overview of how clinicians requested Leptospira-specific tests when serology, blood PCR, and urine PCR were all available as options, and to review the outcomes of the different testing strategies. A further inclusion criterion of both blood and urine PCR results being available was applied to compare the relative performance of sample-types using McNemar’s test (12). Finally, a subset of requests from 2022 was analysed to gauge the frequency at which serology is followed up with convalescent sample testing.
RESULTS
The data collected for the study period included 3,703 Leptospira IgM and 843 PCR tests from 3,344 patients. As CSF PCR was performed on only three patients, data on CSF was excluded from this review.
The results of serology and PCR testing are summarised in Table 1 using only the cases that met the inclusion criterion of having both serology and PCR results (241 cases). 43 cases (18%) met the laboratory case-definition for confirmed leptospirosis. Of those 43 cases, 23 (53%) met the laboratory case-definition for leptospirosis due to PCR testing only. 35 (81%) confirmed cases were detected by only one of the three possible confirmatory tests: Blood PCR alone was responsible for 9 (21%) confirmed cases, urine PCR for 13 (30%), and MAT for 13 (30%). IgM ELISA had a NPV of 90% compared to PCR, and a PPV of 58% compared to MAT and PCR.
The number of cases tested by each available combination of testing methodologies during the years 2017-2022 and the proportion that returned confirmatory results is summarised in Table 2.
The 125 cases with both blood and urine PCR results are summarised in Table 3, from which McNemar’s test two-tail p-value was calculated to be 0.06. Using a significance threshold of 0.05, this provides insufficient evidence for a difference in the proportion of detected results between blood and urine PCR sample-types.
DISCUSSION
In the community setting, Leptospira IgM testing decreased throughout the study period (Figure 1). Uptake of PCR in the community during this period never reached sufficient volume to explain, by way of replacement, the continual and marked decline in IgM testing illustrated in Figure 1. Conversely, serology requests originating from hospitals remained steady throughout, even as PCR was adopted, with PCR eventually becoming the more frequently used methodology for this requestor group in 2022 (Figure 2). A survey to investigate the cause of these trends is out of scope for the current study, but we suggest that the availability of Leptospira PCR, a test performed at Waikato Hospital Laboratory, was better known to hospital-based requestors, and GPs may have been unaware that they had access to PCR testing.
As illustrated in Figures 2-4, an increase in the number of Leptospira PCR requests and confirmed cases was seen in 2017. This year’s quadrupling in total PCR requests coincided with the year urine became a validated PCR sample-type at Waikato Hospital, though the increased requests were for both sample types (Figure 4). 2017 also saw a peak in the national notification rate of leptospirosis at 3 cases per 100,000 compared to 1.8 cases per 100,000 the previous year. Additionally, in this peak year, Waikato had the highest notification rate for leptospirosis, nationwide, at 13.2 cases per 100,000 (13). Beyond the new availability of urine as a PCR sample-type raising awareness of Leptospira testing, reasons for the 2017 spike in test numbers and confirmations are unclear.
Since the upsurge in 2017, it can be seen in Figure 2 that the proportion of Leptospira test requests that were for PCR increased with a concurrent upwards trend in the number of confirmed cases. The two spikes in confirmed cases in 2017 and 2021 (Figures 2 and 3) are matched by spikes in community PCR testing (Figure 4), and a relatively small spike in community IgM testing for 2021 only but are not reflected in the proportion of
non-negative IgM results, which is steady in 2017 and at a trough in 2021 (Figure 5). This indicates that PCR detected cases that were missed or not tested by IgM ELISA during these spikes in testing.
We have reported a low PPV of 58% for IgM ELISA, which does not correlate with the performance reported by other studies (8,9,14). This could be attributed to calculating the PPV based on the corresponding MAT and/or PCR result for each positive IgM ELISA. Research has suggested that the non-serovarspecific IgM detected by ELISA can be detected earlier than the serovar-specific antibodies detected by MAT (6,15). Therefore, the non-confirmed MAT results, taken from a population that has been demonstrated not to test serology routinely with paired sera (Figure 6), may have falsely lowered the IgM ELISA’s PPV. Eugene et al. calculated a PPV of 80% for IgM ELISA by using Bayesian latent class modelling to account for the unreliability of MAT in the acute phase (9), which supports the notion that the performance of IgM ELISA may be better than our data suggests.
Analysis of the relative performances of the differing methodologies showed serological testing alone to be responsible for confirming leptospirosis in 30% of cases where both serology and PCR had been performed. This is consistent with Earl et al.’s finding that 36% of the leptospirosis-positive patients enrolled in their study did not have their illness confirmed by PCR (5). In our data review, when both serology and PCR were tested, a greater proportion of the confirmed cases (53%, 23/43) were detected by PCR only. It is not surprising that only 17% (2/12) of the cases that tested positive for blood PCR were also confirmed by serology compared to the 32% (6/19) of urine cases that were also confirmed by serology. This is because the acute leptospiraemic phase is the only window when blood PCR can detect an infection, and this window precedes the antibody response. Cases that are confirmed by blood PCR in the acute phase do not require follow-up serology unless it is deemed necessary to identify the infecting serovar for Public Health purposes. Leptospires are cleared from the blood and intermittently shed in the urine at the time when the antibody response becomes detectable (4), thereby explaining the higher incidence of urine PCR and serology co-confirmations. While urine PCR was responsible for confirming more cases than blood PCR, a comparison of the two sample-types by McNemar’s test did not indicate that one detected leptospirosis significantly more than the other. This, in addition to the fact that 81% (35/43) of confirmed cases were detected by only one of the three possible confirmatory tests, indicates that the combined use of serology, blood PCR, and urine PCR is the most sensitive strategy for detecting leptospirosis in suspected cases. This is evident in Table 2, where combined serology and PCR testing gave the highest proportion of cases detected. Earl et al.’s study came to the same conclusion that blood and urine PCR and serology should all be employed for leptospirosis laboratory investigations (5). Additionally, a review by Budihal and Perwez of various laboratory tests for leptospirosis concluded that PCR and IgM ELISA used together is the most effective way to achieve an early diagnosis of leptospirosis (16).
We recommend that New Zealand incorporate this multi-modal approach into the development of a national standardised testing strategy for leptospirosis that optimises case detection, by way of judicious test selection, in an equitable fashion. In order to implement this, further work is required, such as evaluating the worth of the additional expense incurred by increased testing by
a cost-benefit analysis.
While this review has shown that testing by both serology and PCR has been the most sensitive approach for detecting leptospirosis, the sensitivity of either methodology can be undermined by inappropriate sample collection or sampletype. Blood PCR is not indicated after the first week of illness, but appropriate sample timing could not be assessed for our data as date of symptom onset was not available. The timing of serum collection is also important. Earl et al. reported that 84% of patients with suspected leptospirosis presented to their general practitioner during the acute phase of the illness (5). At this time, the antibody response is usually undetectable and a negative Leptospira IgM result is to be expected, which should be followed up with a convalescent sample. The importance of testing convalescent samples was demonstrated by Bajani et al., who calculated the sensitivity of IgM ELISA to be 49% in acute sera and 75% in convalescent sera, with MAT also being 49% in acute sera but rising to 94% in convalescent sera (8).
Our analysis of serology testing from 2022 (Figure 6) suggests that sample timing is not performed optimally. That year, no follow-up serology was collected for 87% of cases where serology was performed, and leptospirosis was not confirmed by initial serology or PCR (Figure 6). More than half of the 5.9% that
did had the follow-up serum collected earlier than recommended. This is despite each initial negative Leptospira IgM result being reported with a comment recommending repeat serology in 3-4 weeks. This rate is comparable to that seen by Waikato Hospital Laboratory, where in 2013, only 16% of Leptospira serology requests were followed up with a convalescent sample (17). Earl et al. found that, even with prompting from their medical centre, 32% (15/47) of patients in their study did not return for follow-up serology, and the researchers estimated that up to 31% (4/13) of patients who did not return could have had leptospirosis which was not detected by acute-phase tests (5). It is not always necessary to test follow-up serology, such as when the diagnosis of a different illness is made; also, patients may move between different laboratory remits, resulting in their acute and convalescent samples being tested by different laboratories, giving the false appearance of follow-up serology not being performed. However, these factors are unlikely to fully explain the relative frequency of 2.7% for appropriately paired IgM ELISA samples reported here. In light of this suboptimal use of Leptospira IgM ELISA, investigation into its value compared to other methods used outside New Zealand, such as point of care testing, may be of interest.
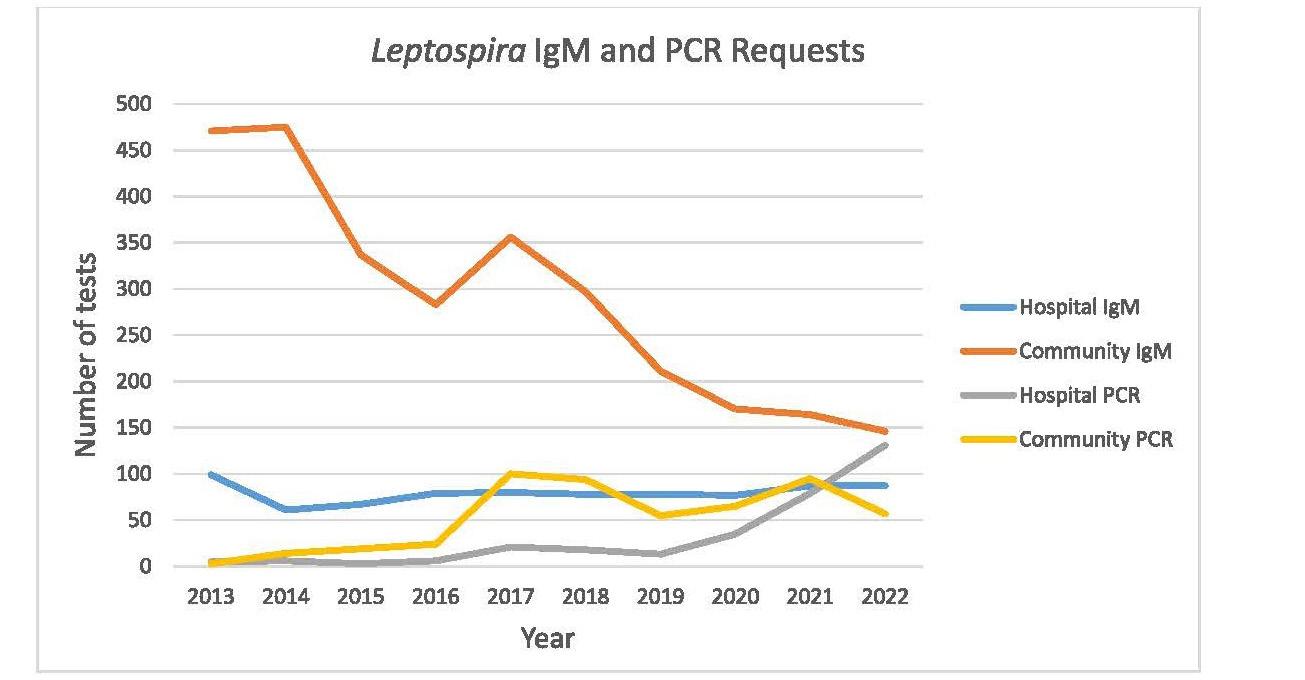
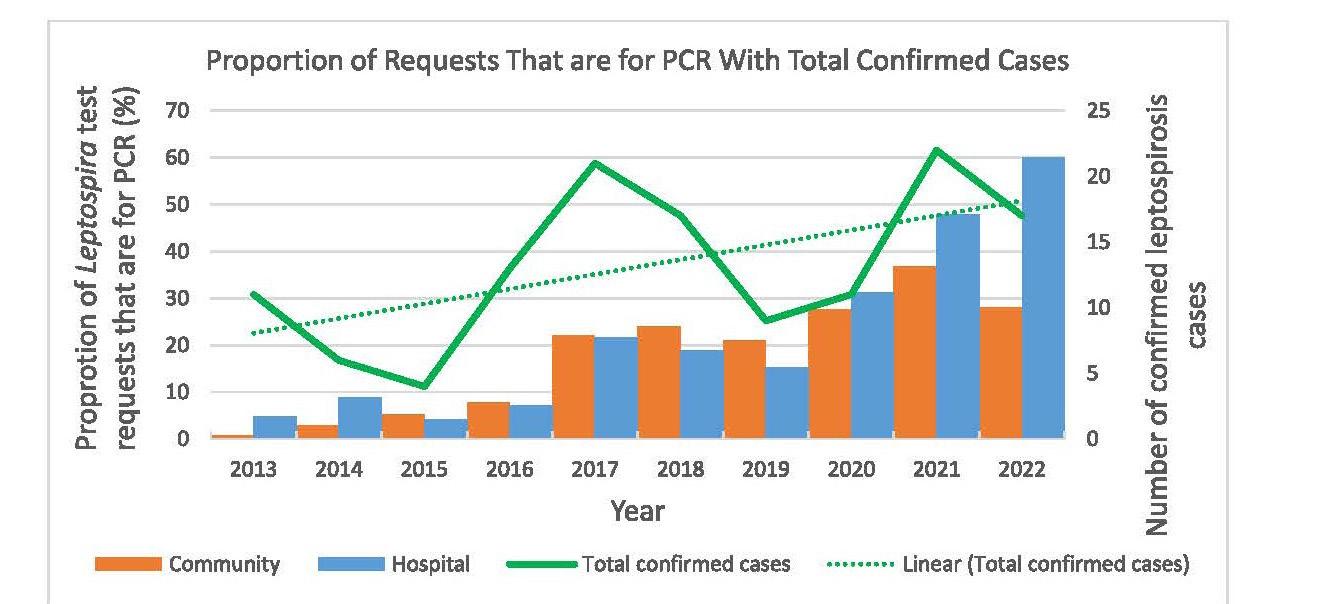 Figure 1. Uptake of Leptospira IgM and PCR testing by community- and hospital-based requestors over time.
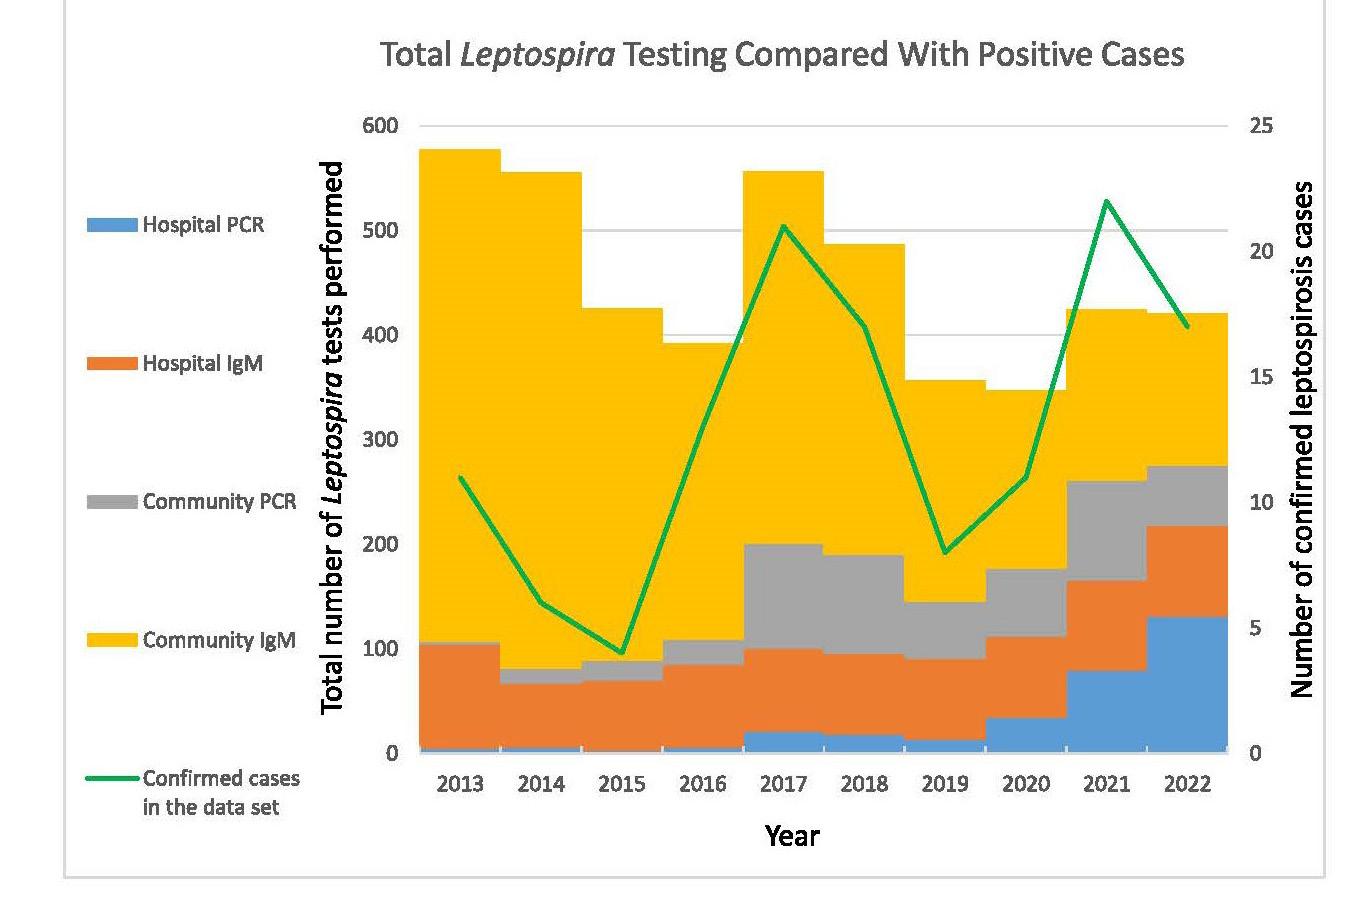
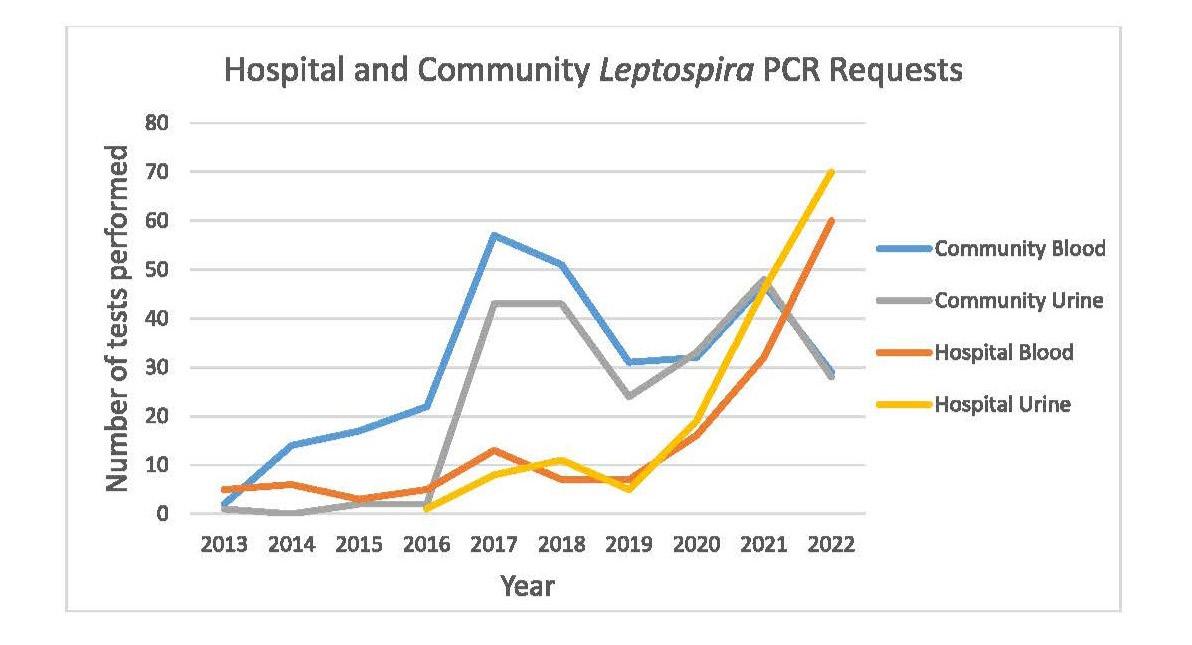
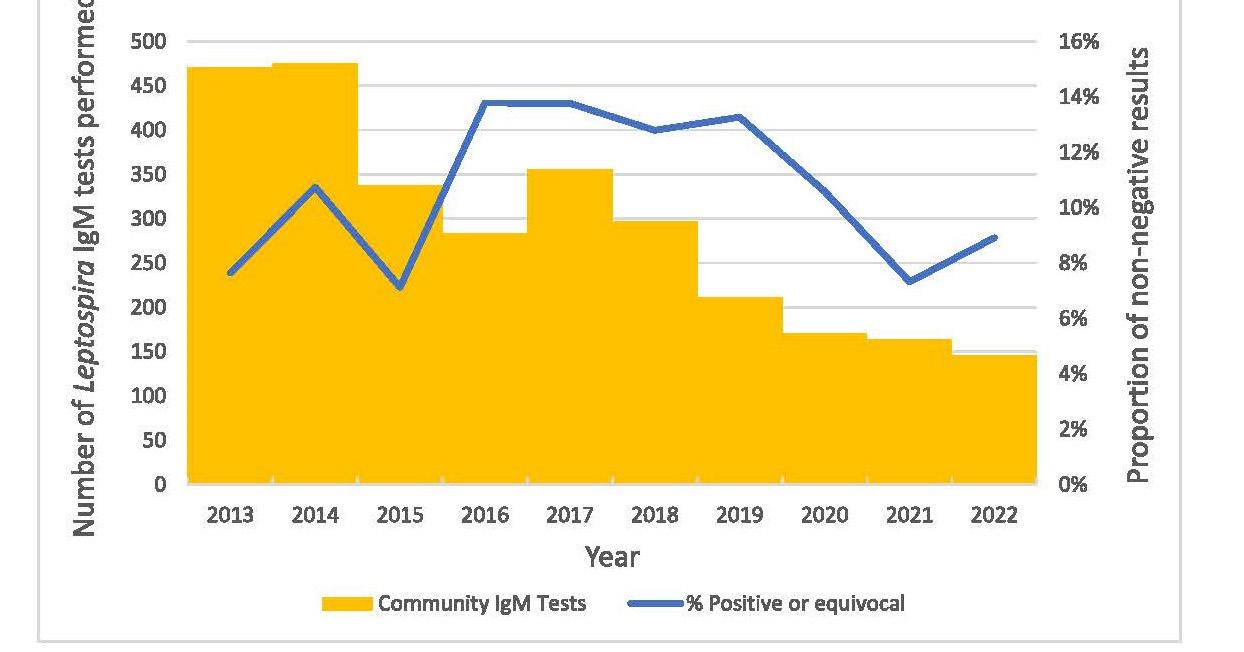 Figure 3. Overall test numbers grouped by requestor and test type over time, with our data set’s confirmed case numbers overlaid.
Figure 4. Number of blood and urine Leptospira PCR tests per year, originating from community- and hospital-based requestors.
Figure 3. Overall test numbers grouped by requestor and test type over time, with our data set’s confirmed case numbers overlaid.
Figure 4. Number of blood and urine Leptospira PCR tests per year, originating from community- and hospital-based requestors.
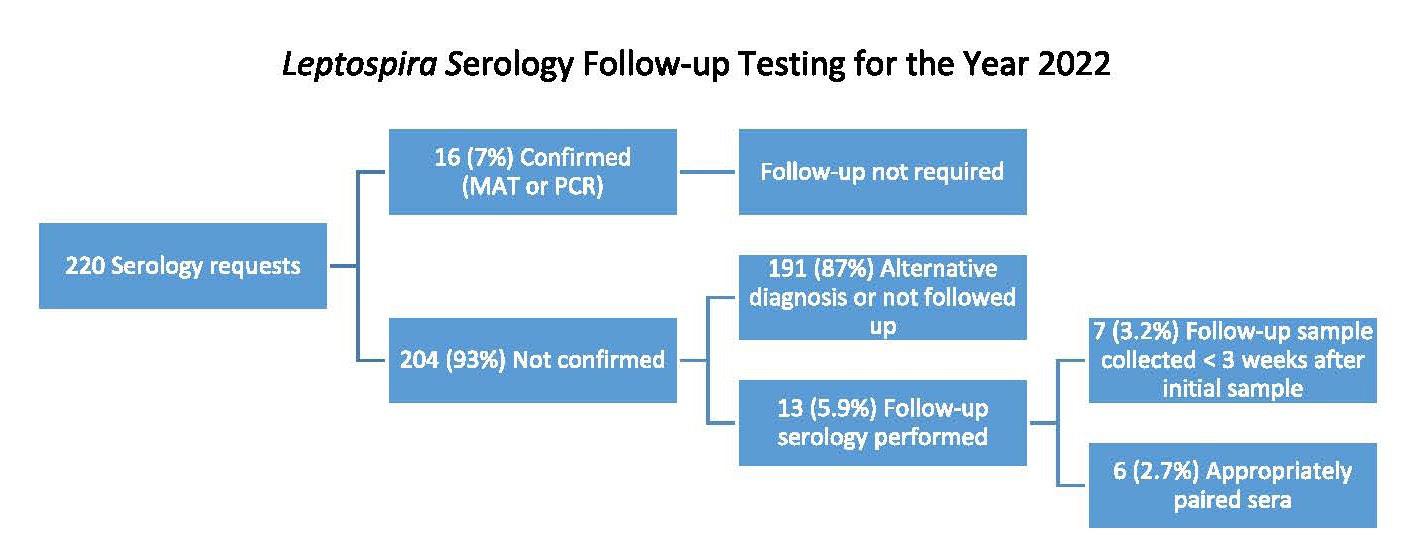
Limitations
As leptospirosis is a biphasic illness, studies into Leptospiraspecific tests often differentiate acute and convalescent results. Such differentiation was not possible here as this information is not a pre-requisite for testing and is seldom provided to the laboratory. Where the identification of follow-up testing was necessary, a presumptive status was assigned primarily by correlating sample collection dates in addition to manual caseby-case review of clinical details provided to the laboratory. The lack of information provided on sample timing relative to symptom onset also precluded any analysis into the appropriateness of blood PCR sample timing.
CONCLUSION
Laboratory diagnosis of leptospirosis in New Zealand remains both challenging and geographically heterogeneous. Our data indicated that follow-up serology is under-utilised. A combination of PCR and serology has been shown to be the most effective testing strategy, as no one test modality captures all clinical cases.
ACKNOWLEDGEMENTS
Warren Wright (Pathlab IT Department) for performing the data extraction.
AUTHOR INFORMATION
Tégan A. Hall, BA, BMLSc, Scientist1
Andrew W. Soepnel, BMLSc, MSc, Head of Department, Immunology1
Michael Addidle, MBChB, MRCP, FRCPath, DTM&H, Clinical Microbiologist2, 3
1 Pathlab Waikato, Hamilton, New Zealand
2 ESR, Wallaceville Science Centre, Upper Hutt, New Zealand
3 Pathlab Waikato, Tauranga, New Zealand
Corresponding author: Tégan Hall, Pathlab Waikato, email: tegan.hall@pathlab.co.nz
REFERENCES
1. Nisa S, Wilkinson D, Angelin-Bonnet O, et al. Diverse epidemiology of Leptospira serovars notified in New Zealand, 1999-2017. Pathogens 2020; 9(10): 841.
2. Te Whatu Ora. Leptospirosis: part of the communicable disease control manual [internet] Wellington (NZ). Te Whatu Ora 2014 [updated 2017 Dec; cited 2023 Jun 2]. Available from: www.health.govt.nz/our-work/diseasesand-conditions/communicable-disease-control-manual/ leptospirosis.
3. World Health Organization. Leptospirosis: Fact sheet [Internet]. New Delhi (India) World Health Organization Regional Office for South-East Asia 2009 Jan 1 [cited 2023 Jun 2] Available from: https://www.who.int/publications/i/ item/B4221
4. Best Practice Advocacy Centre (bpac). Rural infection series: leptospirosis [Internet] Dunedin (NZ) bpacnz 2013 Nov [cited 2023 Jun 2]. Available from: https://bpac.org.nz/ BT/2013/November/rural-infections.aspx
5. Earl E, Fang F, Janes R, et al. An evaluation of diagnostic tests in a case series of suspected leptospirosis patients seen in primary care. NZ Med J 2021; 134(1539): 33-43.
6. Musso D, La Scola B. Laboratory diagnosis of leptospirosis: A challenge. J Microbiol Immunol Infect 2013; 46(4): 245252.
7. World Health Organization. Human leptospirosis: guidance for diagnosis, surveillance and control. World Health Organization, Geneva, 2003.
8. Bajani MD, Ashford DA, Bragg SL et al. Evaluation of four commercially available rapid serologic tests for diagnosis of leptospirosis. J Clin Microbiol 2003; 41(2): 803-809.
9. Eugene EJ, Handunnetti SM, Wickramasinghe SA et al. Evaluation of two immunodiagnostic tests for early rapid diagnosis of leptospirosis in Sri Lanka: a preliminary study. BMC Infect Dis 2015; 15: 319.
10. Merien F, Portnoi D, Bourhy P, et al. A rapid and quantitative method for the detection of Leptospira species in human leptospirosis. FEMS Microbiol Lett 2005; 249(1): 139-147.
11. Agampodi SB, Matthias MA, Moreno AC, Vinetz JM. Utility of quantitative polymerase chain reaction in leptospirosis diagnosis: association of level of leptospiremia and clinical manifestations in Sri Lanka. Clin Infect Dis 2012; 54(9): 1249-1255.
12. Lowry, R. Clinical research calculators [internet]. Poughkeepsie (NY): VassarStats; [date unknown] [cited 2023 Jun 25]. Available from: http://vassarstats.net/
13. Health Intelligence Team, Health and Environment Group. Notifiable diseases in New Zealand Annual Report 2017. Overview of notifiable diseases [internet]. Institute of Environmental Science and Research 2019 March 27 [cited 2023 June 2] Available from: https://www.esr.cri. nz/our-research/nga-kete/infectious-disease-intelligence/ notifiable-diseases/
14. Mullan S, Harivadanbhai Panwala T. Polymerase chain reaction: an important tool for early diagnosis of leptospirosis cases. J Clin Diagn Res 2016; 10(12): DC08-DC11.
15. Niloofa R, Fernando N, de Silva NL, et al. Diagnosis of leptospirosis: comparison between microscopic agglutination test, IgM-ELISA and IgM rapid immunochromatography test. PLoS One 2015; 10(6): e0129236.
16. Veerappa Budihal S, Perwez K. Leptospirosis diagnosis: competency of various laboratory tests. J Clin Diagn Res 2014; 8(1): 199-202.
17. Mansell C, Benschop J. Leptospirosis is an important multispecies zoonotic disease in New Zealand. NZ Med J 2014; 127(1388): 5-8.
Can the use of triglyceride to glucose and triglyceride to high density lipoprotein ratios indicate metabolic syndrome in the spinal cord injured male?
Lynnette M Jones and Michael LeggeABSTRACT
Aim: To determine whether the use of triglyceride to glucose (TyG:G) and triglyceride to high density lipoprotein (TyG:HDL) indices can indicate the onset of metabolic syndrome in spinal cord injured (SCI) males.
Methods: Fasting plasma from 20, age, BMI, and physical parameters matched controls and 20 spinal cord injured males was analysed for triglycerides, glucose and insulin. In addition to the analyte values HOMA-IR was calculated for both groups. Results: Significant differenceswere identified between spinal cord injured complete and incomplete injuries for theTyG:G (p=0.042) and TyG:HDL (p=0.037) when compared with matched controls. Complete spinal cord injured were significantly different for TyG:G (p=0.039) and TyG:HDL (p=0.001). Those with incomplete lesions were not significantly different from the matched controls TyG:G (p=0.871) and TyG:HDL (p=0353).
Conclusion: Those with complete spinal cord injuries demonstrated outcomes consistent with metabolic syndrome, whereas those with incomplete spinal cord injuries did not differ from the able-bodied controls. It is concluded that the level of de-innervation has a significant role in the onset of metabolic syndrome in the spinal cord injured.
Keywords: spinal cord injured (SCI)
NZ J Med Lab Sci 2024; 78(1): 31:33
INTRODUCTION
Spinal cord injury (SCI) resulting in paralysis causes significant change in body composition below the lesion. The resultant loss of motor function leads to significant skeletal muscle wasting and a fat mass increase at both above and below the lesion (1,2). This significant change in body composition initiates major metabolic changes (3) that has been strongly associated with the development of cardiovascular disease (4). In addition, the development of glucose intolerance, hyperinsulinaemia, insulin resistance and dyslipidaemia are all contributing factors associated with the metabolic syndrome, which is frequently identified in SCI (3,5).
Our previous research using biochemical parameters and factor analysis in SCI identified a strong association with markers of metabolic syndrome (6). Subsequently, we identified using fatty acid analysis that desaturase and elongase activity was significantly different in SCI when compared with matched able-bodied controls (7), confirming a disruption of lipid metabolism. More recently we reported significantly elevated fasting plasma free fatty acids and glycerol in the SCI when compared to the matched controls (8).
In this current work we have investigated the use of the triglyceride: glucose index (TyG:G ratio) in SCI as a potential inexpensive surrogate marker for insulin resistance (9). In addition, we compare the TyG:G ratio to other potential biochemical markers of cardiovascular disease – the triglyceride to HDL ratio (TyG:HDL) and Homeostatic Model Assessment for Insulin Resistance (HOMAIR) (10,11,12).
MATERIAL AND METHODS
Participants and outcomes
The present study was undertaken using plasma from SCI and control individuals from our previous study (7).All data relating to biophysical information, spinal injury classification, dual energy x-ray absorptiometry (DEXA) results and physical activity have beenpreviouslypublished(6).Inbrief,therewere20participants in each group (SCI and controls) who were male and matched for age, height, weight, BMI and physical activity. There were no significant differences between all these parameters and between the groups (7). Ethical approval was obtained from both theRegionalHealthFundingAuthorityandtheCanterburyEthics Committee.
Biochemical data
Triglyceride (TyG) levels were determined enzymatically, while high density lipoproteins (HDL) were determined using the
direct assay method. Both analytes were determined using the Aeroset system (Abbott Laboratories Diagnostics Division, Illinois, USA). Glucose was analysed using the Ultimate 5 glucose kit (Roche Diagnostics Corporation, Indianapolis, USA). And insulin was analysed by radioimmunoassay using the Coat-A-Count assay (Diagnostic Products, Los Angeles, USA). Analysis was undertaken on a Cobas Mira Plus autoanalyser (Roche Diagnostics Corporation, Indianapolis, USA).
Statistical analysis
All data were normally distributed and variances for the groups were the same. The TyG index was log transformed. The tests were two-sided independent t-tests. While able bodied and spinal injured men were similar in height, weight and age, they were independent groups. The t-tests were used primarily as an exploratory procedure to ascertain statistical differences between the controls and the SCI with complete and incomplete spinal injury, and a one-way ANOVA was performed to compare the TyG:G ratio, HOMA-IR and TyG:HDL ratio between the groups.All statistical analyses were undertaken using Statistical Packages for Social Sciences (SPSSv25), (IBM Statistics, Armonk, USA).
RESULTS
The initial exploratory between group t-test revealed a significant differenceintheTyG:GratiobetweentheSCImenwithcomplete lesions and those with incomplete lesions, p=0.042 and for the TyG:HDL ratio p=0.037. Significant differences were also found for comparisons between men with complete lesions and their matched controls, TyG:G p=0.039 and TG:HDL, p=0.001. Results for men with incomplete lesions and controls were not significant for either TyG:G or theTyG:HDLindices, p=0.871 and p=0.325 respectively.
The one-way ANOVA revealed that there was no statistical difference between the groups for TyG:G and HOMA-IR (F(2,7)=2.858, p=0.07 and (F(2,37)=0.087, p=0.92 respectively. However, the TG:HDL ratio was significant (F(2,37)=7.163, p=0.02. Post hoc tests for multiple comparisons found significant differences between SCI with complete lesions and incomplete spinal lesions (p=0.037, 95% CI=0.056,2.10) and between complete spinal lesions and controls (p=0.02, 95% CI=4.496, 2.319). There was no statistically significant difference for TyG:HDL between the SCI with incomplete injuries and controls (p=0.614)
DISCUSSION
The purpose of this study was to investigate whether routine biochemical indices could identify at risk SCI for diabetes and cardiovascular disease, namely the use of triglycerides, glucose and HDL. The TyG:G ratio has been previously shown to correlate with insulin resistance (13,14) and with cardiovascular disease (9) in able bodied populations. Similarly, the TyG:HDL ratio has been found to be a suitable marker to identify insulin resistance in the able-bodied population (11.12). Given that SCI are at higher risk for developing both type 2 diabetes and cardiovascular disease (4,15) it was considered that there was a potential to use these indices to identify SCI at risk using routine relatively inexpensive biochemistry tests. More sophisticated noninvasive testing such as ultrasound for local arterial stiffness can provide diagnostic information, however this and related techniques required access to ultrasound and an experienced operator.
The results from this limited small study have identified an interesting relationship between complete and incomplete SCI. Briefly, complete SCI is considered to be where nerve damage is sufficiently severe that nerve impulses cannot be transmitted, whereas incomplete SCI does not have total nerve damage. However, the relationship between nerve damage and function in the incomplete SCI may depend on the level of the spinal cord injury (16). The result from the current investigation clearly indicates an outcome which could be related to the level of nerve damage i.e. completes vs incomplete. There were significant differences for TyG:G and TyG:HDL ratios between the complete and the incomplete SCI. Additionally, TG:HDL ratios from the complete SCI were also significantly different from the matched controls, whereas the incomplete SCI showed no significant difference with controls. We consider that this may well reflect the retention of some muscle innervation in the incomplete SCI thereby providing sufficient metabolic signalling to retain some muscle metabolic activity. Whether this would ultimately be sufficient to prevent metabolic syndrome is outside of the scope of this current work. However, we have previously identified significant changes in individual free fatty acids which are associated with insulin resistance and metabolic syndrome in all SCI (7). Additionally, we have demonstrated significant elevation in total free fatty acids and glycerol in both SCI groups compared to controls (7). This would indicate an overall shift from normal skeletal muscle metabolism below the injury to fat deposition and lipolysis. Although the BMI between the controls and SCI groups has been shown to be not significant, there was a 47% increase in the fat mass and a 16% decrease in lean tissue mass below the lesion (15). This was consistent with subsequent investigations identifying that while the BMI remained within normal limits, the SCI group demonstrated metabolic variables consistent with metabolic syndrome (6). This indicates an overall shift from normal skeletal muscle metabolism below the injury to fat deposition and lipolysis. Although we did not identify a significant difference in the TyG:G index, and no significant difference with HOMA-IR, we consider that the sample size may well be a limitation of this work rather than the overall predictive value of the ratio.
Skeletal muscle is a major body organ involved in both glucose and fatty acid metabolism (17) and a loss of this metabolic activity will ultimately give rise to disruption of the interaction of energy substrates i.e. the loss of the ability to metabolise glucose. Typically, with the loss of the ability to metabolise glucose, insulin resistance will develop and is a precursor to metabolic syndrome and diabetes (18,19). While we accept the limitations of this study, it is clear that the transformation from lean tissue mass to fat mass below the lesion following denervation disrupts the normal metabolic function of skeletal muscle. The possibility of using simple biomarker ratios may help in the early detection of insulin resistance and metabolic syndrome in SCI individuals.
AUTHOR INFORMATION
Michael Legge. BSc, MRSB, FIBMS, FNZIMLS, FFSc (RCPA), PhD,Associate Professor2
Lynnette M Jones. BSc, BPhEd (Hons), PhD, Hon Associate Professor1
1TheSchoolofPhysicalEducation,UniversityofOtago, Dunedin, New Zealand
2 DepartmentofBiochemistry,UniversityofOtago,Dunedin, New Zealand
Correspondence: Michael Legge, University of Otago, Dunedin New Zealand
email: michael.legge@otago.ac.nz
REFERENCES
1. Gorgey AS, Dulbow DR, Duobow JD et al, Effects of spinal cord injury on body composition and metabolic profile, part I. J Spinal Cord Med 2014; 37(6): 693-702.
2. Spungen AM, Adkins RH, Steward CA et al. Factors influencing body composition on persons with spinal cord injury: a cross sectional study. J Appl Physiol 2003; 95(6): 2398-2407.
3. Jones LM, Legge M. Factor analysis of the metabolic syndrome in spinal cord injured men. Metabolism 2004; 53(10): 1327-1377.
4. Nightingale TE, Walhin J-P, Thompson D, Bilzon JLT. Biomarkers of cardiovascular health are associated with body composition characteristics but not physical activity or persons with spinal cord injury. J Spinal Cord Med 2017; 42(3): 326-337.
5. Moller DE, Kaufman KD. Metabolic syndrome: a clinical and metabolic perspective. Ann Rev Med 2005; 56: 45-62.
6. Jones LM, Legge M. Plasma fatty acids as markers for desaturase and elongase activities in spinal cord-injured males. J Spinal Cord Med 2019; 42(2): 163-170. doi:10/108 0/10790268.2017.1405154.
7. Jones LM, Legge M. Fasting plasma fatty acids and glycerol in spinal cord-injured males. NZ J Med Lab Sci 2019; 73(2): 46-48.
8. Hong S, Han K, Park C-Y. The triglyceride glucose index is a simple and low-cost marker associated with atherosclerotic cardiovascular disease: a population based study. BMC Med 2020; 18(1): 361. doi.org/10.186/s12916-020-01824-2.
9. Wallace TM, Levy J, Matthew DR. Use and abuse of HOMA modelling. Diabetes Care 2004; 27(6): 1487-1495.
10. Kim-Dorner S-J, Deuster PA, Zeno SC. et al. Should triglycerides and the triglyceride to high density lipoprotein cholesterol ratio be used as a surrogate for insulin resistance? Metabolism 2010; 59(2): 299-304.
11. Gianni C, Santoro N, Caprio S. et al. The triglyceride-tocholesterol ratio. Diabetes Care 2011; 34(8): 1869-1874.
12. Jeong S, Ho Lee J, Ren M. et al. The verification of the of the reliability of the triglyceride-glucose index and its availability as an advanced tool. Metabolomics 2021; 17(11): 97. doi. org/10.1007s11306-0221-01837-9.
13. Zhang Y, Ren L, Ren M. et al. Correlation between the triglyceride-glucose index and high risk of cardiovascular disease: A cohort study of 102,061 subjects from Tiajin, China. Risk Manag and Healthc Policy 2021; 14: 2803-2810.
14. Bauman WA, Spungen AM. Carbohydrate and lipid metabolism in chronic spinal cord injury. J Spinal Cord Med 2001; 24: 266-277.
15. Jones LM, Goulding A, Gerrard DF. DEXA: a practical and accurate tool to demonstrate total and regional bone loss, lean tissue and fat mass in paraplegia. Spinal Cord 1998; 36(9): 637-640.
16. Roberts TT, Leonard GR, Cepela, DJ. Classifications in brief: American spinal cord injury association (ASIA) impairment scale. Clin Orthop Relat Res 2017; 475(5): 1499-1504.
17. Glancy B, Balaban, RS. Energy metabolism design of the
striated muscle. Physiol Rev 2021; 101(4): 1561-1607.
18. Eckel RH, Grundy SM, Zimmet PZ. Metabolic syndrome. Lancet 2005; 365(9468): 1415-1428.
19. Samson,SL, Garber AJ. Metabolic syndrome. Endocrinol Metab Clin N Am 2014; 43(1): 1-23. doi.org/10.1016/j. ecl.2013.09.009
Copyright:


 Tony Barnett President
New Zealand Institute of Medical Laboratory Science.
Tony Barnett President
New Zealand Institute of Medical Laboratory Science.


 This year the PPTC aims to deliver 4 courses in the disciplines of, Quality Management, Biochemistry, Haematology and Transfusion Medicine
Figure 1. 2023 Transfusion Medicine course students with PPTC CEO and course convener Telesia Apikotoa
Figure 2. Students at the New Zealand Blood ServicePalmerston North
This year the PPTC aims to deliver 4 courses in the disciplines of, Quality Management, Biochemistry, Haematology and Transfusion Medicine
Figure 1. 2023 Transfusion Medicine course students with PPTC CEO and course convener Telesia Apikotoa
Figure 2. Students at the New Zealand Blood ServicePalmerston North