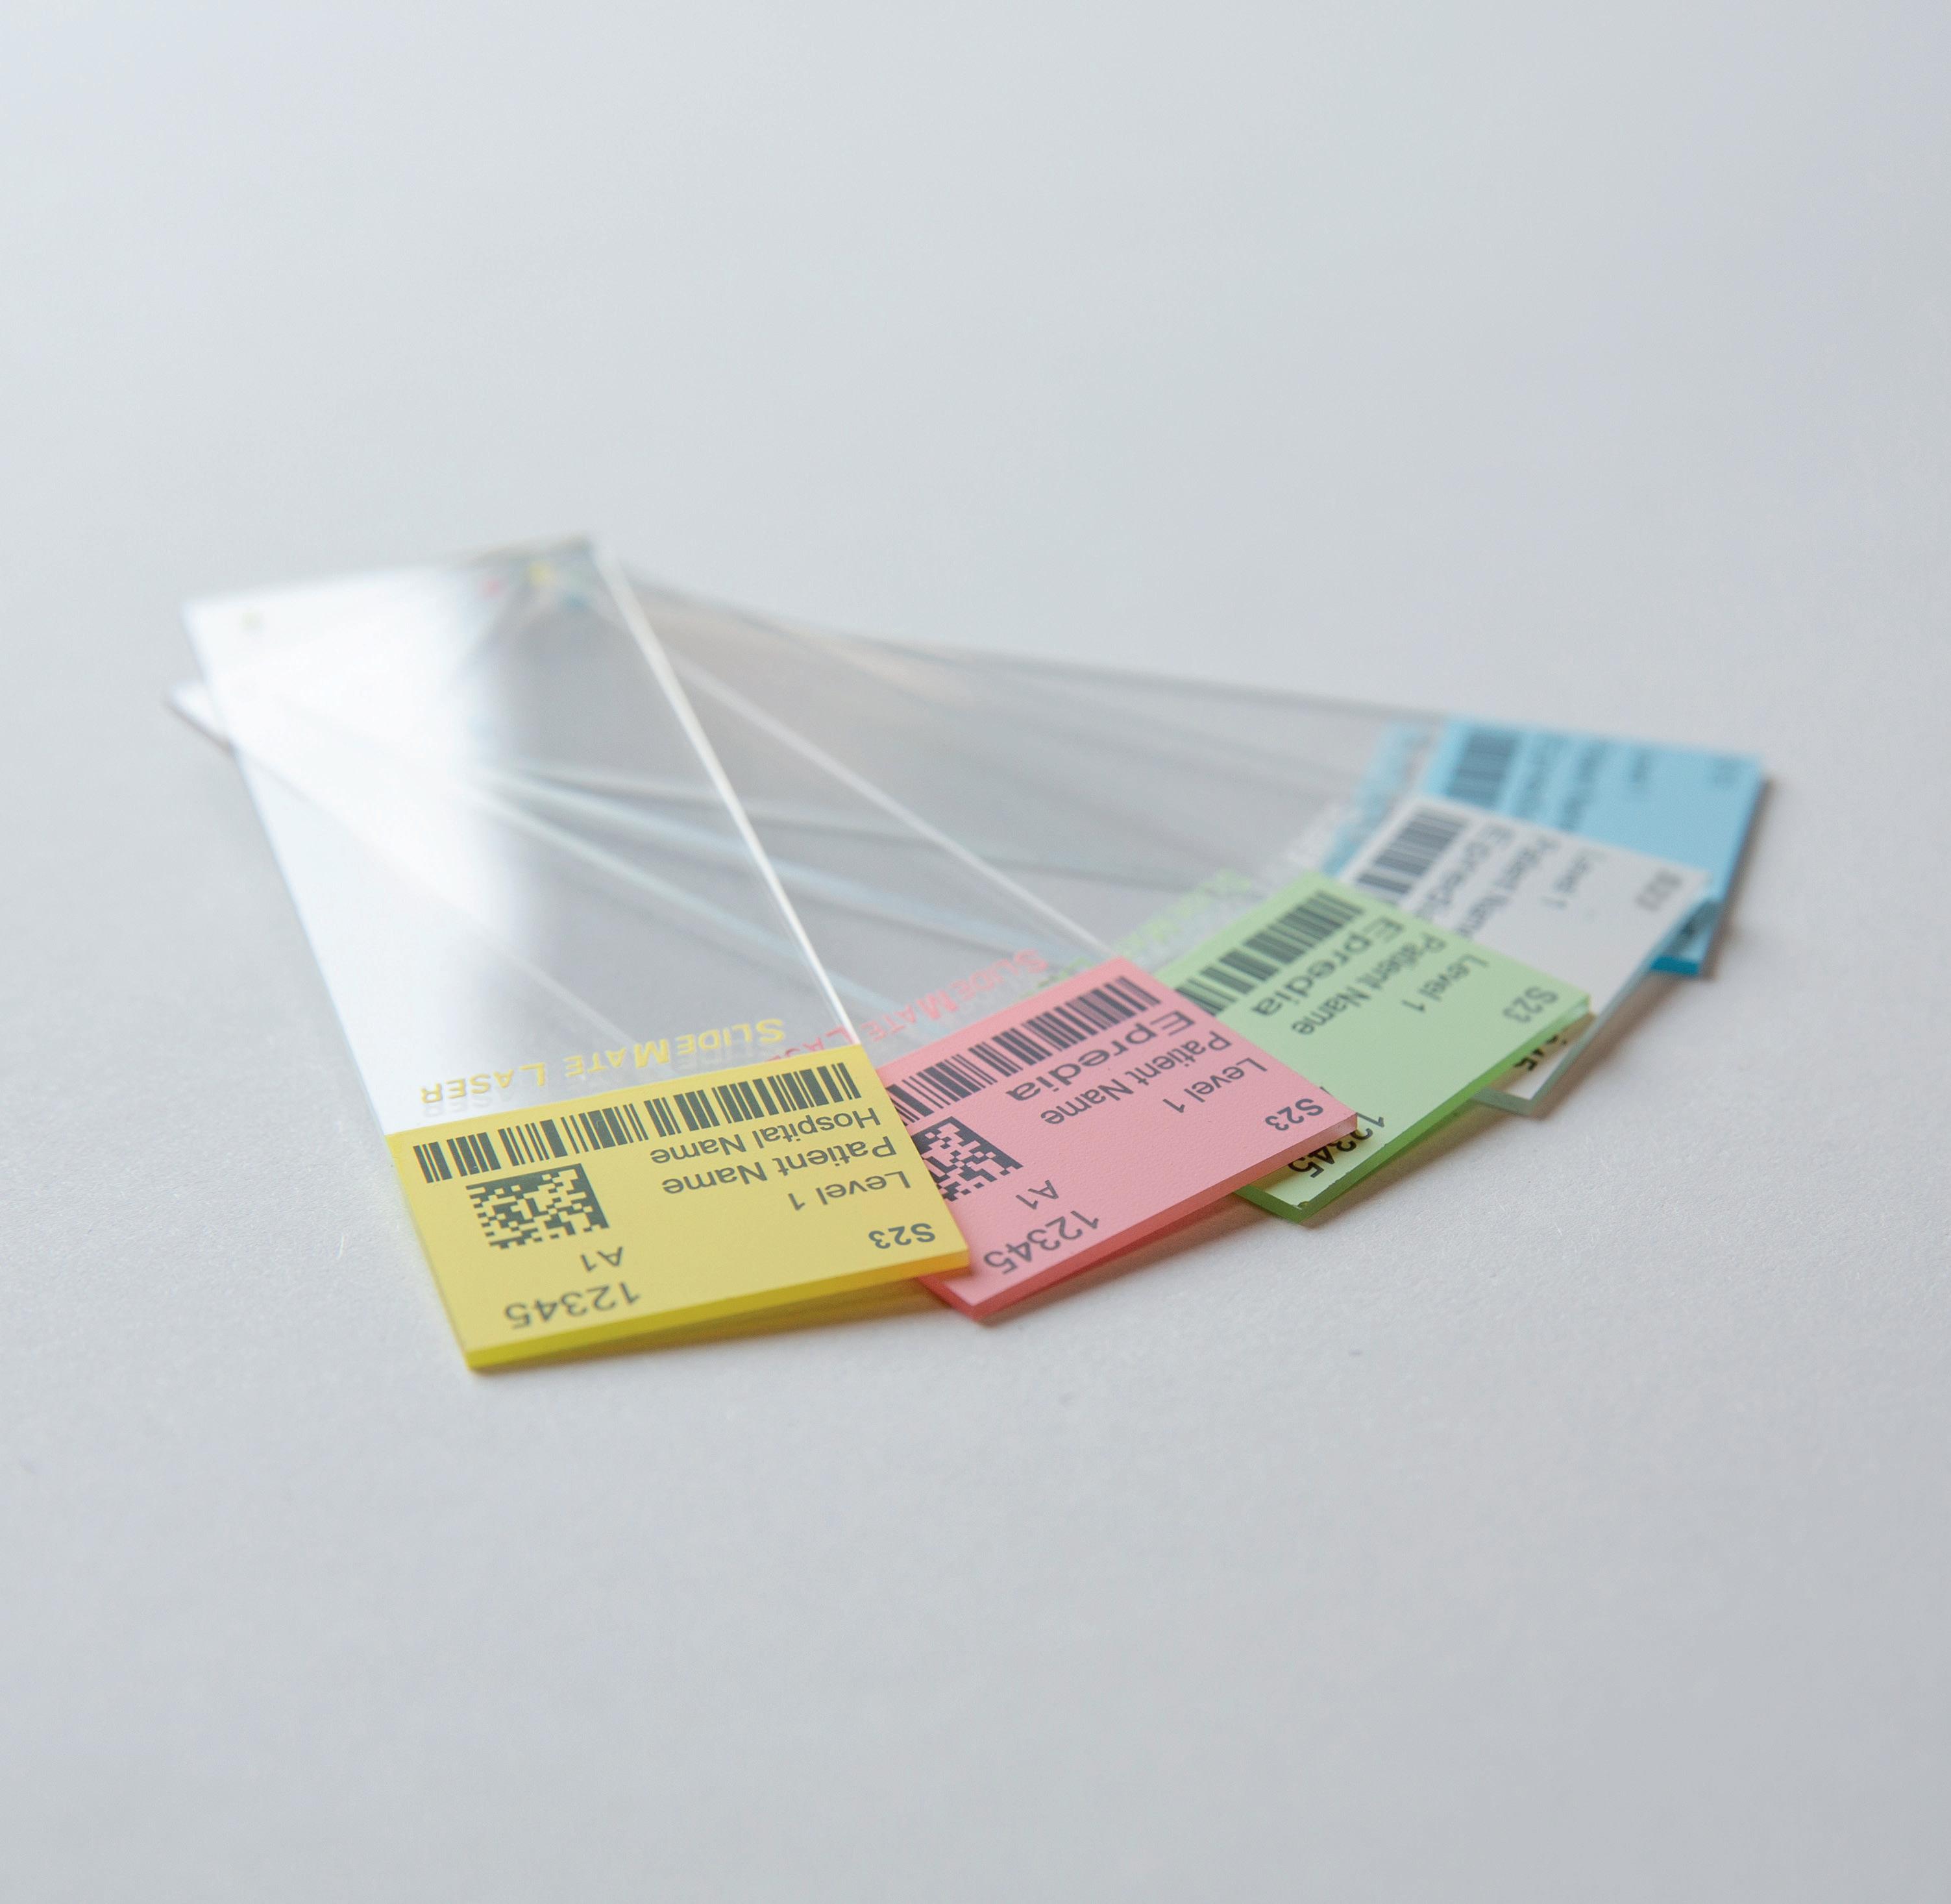
•High-resolution, 600dpi printing
•Laser-optimised slides provide clear and robust printing surface
•Adhesion slides use same technology as Superfrost PLUS™ slides
•True on-demand slide barcode printing
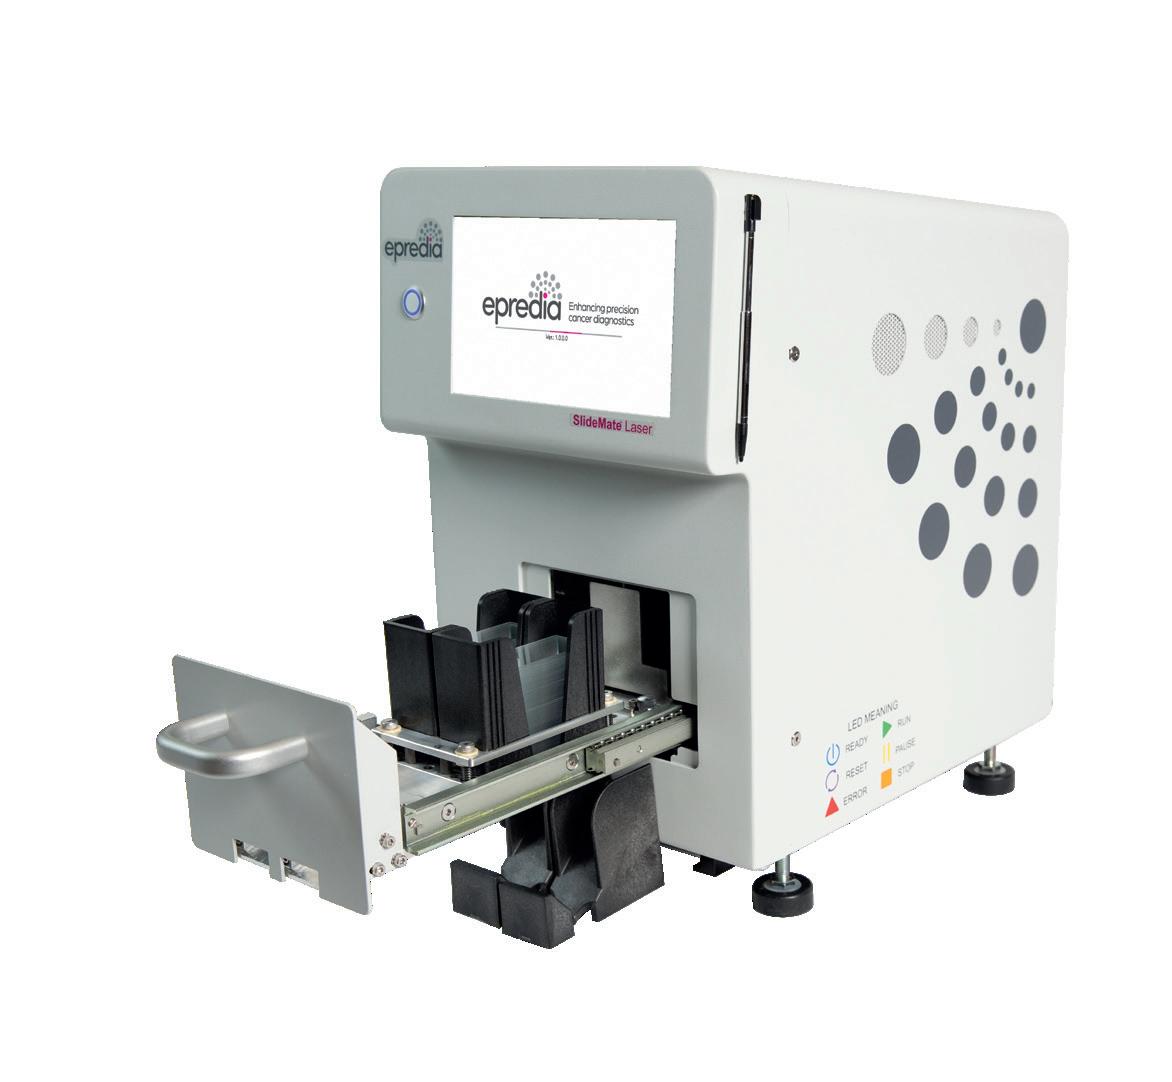
•Reliable laser technology helping reduce instances of instrument downtime
• No additional consumables required such as ink, bulbs or ribbon
Confidence
•Improved barcode quality can enhance downstream workflow with improved scannability
•Installation and connectivity support provided by experienced local Abacus dx team

Editor
Lisa Cambridge, NZCS DipQA B.ApplManagement, MNZIMLS, NZIMLS, Rangiora
Deputy Editors
Michael Legge, PhD MRSB FIBMS FNZIMLS FFSc(RCPA), University of Otago, Dunedin
Holly Perry, DipMLS MAppSc(Hons) PhD MNZIMLS, University of Otago, Dunedin
Emeritus Editor
Rob Siebers, PGCertPH FNZIC FNZIMLS FRSB HonFNZAP, Wellington
Editorial Board
Paul Austin, MSc(Hons) DipMLT MNZIMLS, LabPlus, Auckland
Jillian Broadbent, FNZIMLS, NZIMLS, Rangiora
Heather Brooks, Bsc(Hons), PGDip MLS, PhD, University of Otago, Dunedin
Julie Creighton, DipMLS, FNZIMLS, Canterbury Health Laboratories, Christchurch
Lauren Eddington, DipGradSci BMLSc MSc, Awanui Laboratories, Dunedin
Sujata Hemmady, PGDipMLSc, MMLSc, MNZIMLS, LabPlus, Auckland
Chris Kendrick, GradDipSci MSc MNZIMLS, Massey University, Palmerston North
Craig Mabbett, BMLSc PGDipHSM, LabCare Pathology, New Plymouth
Mohd. Shahid, MBBS MD PhD FNZIMLS, PGDipHSM, Arabian Gulf University, Bahrain
Terry Taylor, BSc DipMLS MNZIMLS, Awanui Laboratories, Dunedin
Robyn Wells, BApllSci(MT) GradCert Haem, Milton, Australia
Formatting
Sharon Tozer, AT DipBusStud, Executive Office NZIMLS, Rangiora
About the Journal
The New Zealand Journal of Medical Laboratory Science (the Journal) is the official publication of the New Zealand Institute of Medical Laboratory Science (NZIMLS). The Journal is peer reviewed and publishes original and review articles, case studies, technical communications, and letters to the Editor on all subjects pertaining to the practice of medical laboratory science. The Journal is open access (www.nzimls. org.nz/nzimls-journal) and is published three times per year in March, July, and November. Hard copies are circulated to all NZIMLS members and universities and research units in New Zealand and overseas. Current circulation is about 2,800 copies per issue. Printing is by Blueprint Ltd, Christchurch on environmentally responsible paper using elemental chlorine free third party certified pulp sourced from well managed and legally harvested forests and manufactured under the strict ISO14001 Environmental Management System. The Journal is indexed by CINAHL, EMBASE, SCOPUS, Informit, Thomson Gale, EBSCO and Biosis Citation Index, and the Journal Editors are members of the World Association of Medical Editors (www.wame.org).
Brief instructions to authors
The Journal accepts original submissions from anyone and anywhere. Comprehensive instructions can be found on the NZIMLS website (www.nzimls.org.nz/instructions-to-authors. html). All submissions will undergo single-blind peer review and possibly plagiarism checking with iThenticate™ software. If accepted for publication, copyright is vested in the author(s) under terms of the Creative Commons Attribution License (www. creativecommons.org/licenses/by/2.5/legalcode). The authors are responsible for the scientific content and views. Opinions expressed in the Journal are not necessarily those of the Editors, Editorial Board, or Council of the NZIMLS.
Advertising and subscription
Advertisement bookings and enquiries should be addressed to the NZIMLS Executive Officer, Sharon Tozer: sharon@nzimls.org.nz. Phone +64 3 313 4761.
Volume 78; Number 02
Editorial
Working toward translational research in pathology
Michael Legge...........................................................................
NZIMLS Fellowship Treatise
The efficacy of general practitioner guided electronic ordering on allergy testing at Awanui laboratories
Cathrine Littlechild.................................................................
Biography Catherine Littlechild
crossmatch:
Factor VIII inhibitor laboratory assay: state of the art
Hamza Siyar, Hassane Mamad, Imane el Omari, Souad Benkirane and Azlarab Masrar...............................................................72-76
Original articles
Evaluation of NOVA view single-well titre determination for antinuclear antibody testing under routine conditions in a New Zealand medical laboratory
Andrew W Soepnel................................................................77-81
Analysis of simple markers of subclinical inflammation in Syrian patients with familial Meditteranean fever Husam Khalil, Knida Touban and Raneem Mousa...............82-86
Blocking natural antibodies with Kode technology to investigate false positives in an immunoassy Holly E Perry and Selene S Mak..........................................
Book reviews
Breaking through: my life in science by Katlin Kariko Reviewed by Michael Legge........................................................92
Master Builder: how the new science of the cell is rewriting the story life by Alfonso Martinez Arias Reviewed by Michael Legge.......................................................92
The Code Breaker: Jennifer Doudna, gene editing and the future of the human race by Walter Issacson Reviewed by Ehsan Ullah.........................................................
Regular features In this issue................................................................................59 Otago BMLSc student research project abstracts: semester 2, 2023....................................................................................98-105 Pacific Way...........................................................................97-98
Michael Legge presents “working toward translational research in pathology” with his editorial. Describing a genomics approach to diagnostic monitoring, the types of genomics technologies and consideration of therapy that is increasingly being used in modern medicine and healthcare. He also asks a big question of the New Zealand pathology workforce as to whether the current workforce requirements can support this movement from translational research to diagnostic use.
NZIMLS Fellowship recipient, Catherine Littlechild, from Awanui Labs in Wellington provides a short biography of her professional journey and we publish her Fellowship Treatise article in this issue of the New Zealand Journal of Medical Laboratory Science. Cathrine reviews the impact of GP electronic ordering (e-ordering) on allergy testing at Awanui Wellington. The incidence of allergic disease, atopy and asthma is increasing in industrialised nations, including New Zealand and over the last 50 years this has become an increasingly major health problem. Data was collected and analysed from the Laboratory Information Management System (LIMS) to determine if the introduction of guided e-ordering altered the allergy testing patterns and found that although it aided primary care physicians in requesting appropriate testing and increased the number of IgE testing it did not change the percentage of positive results. It also had a positive impact on laboratory staff time, but overall Littlechild concluded that the introduction of guidance had not improved clinical outcomes.
All forms of crossmatching are crucial for confirming compatibility between the patient and the donor before transfusion. It is the final check to ensure all pre-transfusion testing is correct and to prevent transfusion reactions in recipients. Rei Miyamoto, a recent BMLSc graduate from Otago University reviewed the current use, advantages and disadvantages of using electronic crossmatching (EXM) as an alternative to serological methods in transfusion science in New Zealand and internationally. Miyamoto’s review concluded electronic Crossmatch (EXM) is a large asset to transfusion medicine in many parts of the world. Caveats such as complex algorithms, system downtime, implementation costs, human error, and stringent requirements must be considered but overall, it overcomes many challenges. As with other aspects of medical laboratory science, providing safety and accuracy is one of the priorities when treating patients. EXM contributes to this goal through increased time efficiency, reduced long-term cost, improved blood storage management and simplicity.
Hamza Siyar and colleagues at Ibn Sina Hospital and the University of Mohammed V Soussi in Morocco, report on Factor VIII inhibitors and their serious negative impacts on patient health, and describes current laboratory research and test methodology. In a haemophilia reference laboratory, the most observed are Factor VIII (FVIII) inhibitors for congenital haemophilia A (HA), factor IX (FIX) inhibitors for haemophilia B (HB), and occasionally FVIII inhibitors for acquired haemophilia inhibitors. Siyar identifies and explains the challenges and pitfalls of inhibitor testing methods and how they impact laboratory assays, emphasising that laboratories must be able to distinguish between different factor inhibitors, and between factor inhibitors and other inhibitors. With an understanding of how inhibitors impact different laboratory assays and being aware of the drawbacks and restrictions of the assays are necessary for the laboratory detection of inhibitors, particularly when separating FVIII inhibitors from Lupus anticoagulants.
Indirect immunofluorescence assay using human epithelial cells (HEp-2 IFA) remains the reference method for antinuclear antibody (ANA) detection for patients with suspected connective tissue disease (CTD), autoimmune hepatitis, and juvenile idiopathic arthritis. Andrew Soepnel from Pathlab, Waikato reports on an alternative automated ANA reader with singlewell titre (SWT) called ‘NOVA View’. This study evaluated the agreement between NOVA-View and manual fluorescence microscopy with the intention of verifying SWT for use in place of endpoint-titre (ET) determination by serial dilution. Results showed basic agreement between SWT and ET for each of the determined ANA patterns and based on this evaluation
Pathlab implemented restricted used of SWT for ANA endpoint titre determination for patient samples in late 2023. SWT was authorised for use on monospecific homogeneous and dense fine speckled-like patterns of any SWT value, speckled patterns with SWT values of 1:80 or 1:160, centromere patterns with SWT values ≥1:1280, and homogeneous plus cytoplasmic speckled or anti-mitochondrial-like patterns with SWT values of 1:80 or 1:160. Post implementation reagent consumption was also reduced by 20%, and 55% of ANA-positive sample had a one day reduction in turnaround times benefitting the laboratory and reporting.
Familial Mediterranean Fever (FMF) is the most common genetic autoinflammatory disease and primarily occurrs in populations of the eastern mediterranean region. The disease is caused by a gain-of-function mutation in the MEFV gene, which encodes the protein called ‘Pyrin’ and expressed in neutrophils, monocytes, eosinophils and dendritic cells. Recent studies have shown that subclinical inflammation may continue in FMF even during symptom-free periods. Husam Khalil and colleagues at the Al Rasheed International Private University for Science & Technology in Syria, report a case-controlled study to investigate the possible correlation of each of the platelet/lymphocyte ratio, neutrophil/lymphocyte ratio, and red cell distribution width values with Familial Mediterranean Fever (FMF) and to determine which of these markers served as the best indicator of subclinical inflammation in FMF patients. Results showed the neutrophil/ lymphocyte ratio was significantly higher in FMF patients than the control group and had the strongest correlation with subclinical inflammation and CRP in FMF among the analysed markers, suggesting the neutrophil/lymphocyte ratio of 1.65 as a diagnostic of subclinical inflammation, a reliable inflammatory maker and predictor of the development on amyloidosis.
Holly Perry and Selene Mak from the Department of Pathology and the University of Otago investigated the possibility that two human antibodies; anti-Gal and anti-Forsmann (Fs), were a cause of false positives in syphilis immunoassays. A further aim was to establish the minimum concentration of synthetic antigens able to block activity of anti-Gal and anti-Fs in human plasma samples using Kode™ a surface cell attachment technology enabling attachment of synthetic forms of αGal and Fs antigens in the form of function-spacer-lipids (FSLs) to red blood cells forming ‘kodocytes’ which can specifically bind antiGal and anti-Fs antibodies. Syphilis testing was selected as the immunoassay for this study, due to availability of samples which had tested false positive for antibody to the causative organism Treponema pallidum, and a rapid test within the resources of the study. Results disproved that natural carbohydrate antibodies anti-Gal and anti-Fs were the likely cause of interference with these immunoassays, however using synthetic α-Gal and Fs antigens were shown to be an effective technique for blocking Anti-Gal and anti-Fs activity in human plasma.
Michael Legge reviews two books for this issue; “Breaking Through: my life in science” by Katalin Kariko, “Master Builder: how the new science of the cell is rewriting the story of life” by Alfonso Martinez Arias.
Ehsan Ullah, from Anatomical Pathology, Health NZ, Auckland shares a book review of “The Code Breaker: Jennifer Doudna, gene editing and the future of the human race” by Walter Isaacson.
As well as our regular features; Science Digest, Recent Reviews, Journal Citations, and the Pacific Way, we publish the Otago BMLSc student research project abstracts from Semester 2, 2023.
Lisa Cambridge, Editor
Michael Legge
A genomics approach to diagnostic monitoring and therapy is increasingly being considered in modern medicine and healthcare. Genomics technologies are based on the transfer and use of sound research and include the following categories:
• Technologies for greater molecular characterisation of individuals or disease. E.g. genomics, metabolomics, proteomics.
• Technologies for personalized therapeutic intervention. E.g. stem cell therapy, cellular therapies, genome editing/ therapy robotics and artificial intelligence.
• Technologies for personalised disease and health monitoring. E.g. consumer health apps, point of care.
• Technologies that enable the transformation and the performance of capabilities of other technologies. E.g. artificial intelligence, machine learning, computational biology, microfluidics, nanomedicine.
Applications of these techniques are transforming approaches to cancer treatment, and in addition, re-defining healthy and diseased states, providing novel approaches to pathogen identification and treatment and identification of long-term effects of genetic variants. These will be powerful technologies which ultimately will form an everyday part of diagnostic pathology. However, they should also be considered in the context of incidental findings of uncertain value and what may be treatable. In addition, a move to whole genome screening may stigmatise vulnerable populations such as children and indigenous groups. This may well cause anxiety in those identified as having a mutation for which the long-term consequences are unknown. This applies to minor mutations in genes or their regulatory elements. The data produced from the new gene technologies is enormous and requires complex analyses. Consequently, questions must be raised relating to who the appropriate person(s) are to deliver the information and assess risk factors.
Consideration would also need to be given relating to privacy, rights of access to genetic data, trust, and an understanding by members of the public who would be recipients of genomic data. Additionally, safeguards will be necessary for projecting personal data to ensure it cannot be used for employment, insurance applications, or financial obligations.
A big question for the New Zealand pathology workforce is whether the current workforce requirements can support this movement from translational research to diagnostic use. Precision Health resulting from translational research is already incorporated in health care systems in the United Kingdom and is rapidly emerging in Australia. In New Zealand the pathology workforce faces a crisis with little being undertaken to stabilise the workforce. There are failures to commit to advanced training or to provide clear career pathways. If improvement in modern diagnostic capabilities is considered important then the workforce issue urgently needs to be resolved.
The technologies indicated in this editorial are no longer science fiction and are gaining significant importance in routine diagnostic pathology. New disciplines are emerging in informatics, computational biology, and image analysis, and skills in these will be essential in diagnostic pathology services. Universities have the knowledge and skill-base for the necessary training of the new generation of scientists required in the diagnostic technology revolution but are inadequately funded to provide the necessary training. Government inaction has not provided the profession any opportunity to create the necessary career structure for the security of diagnostic pathology in New Zealand, and the regulatory authority is too slow to respond to a rapidly changing profession. It is essential that education, training and retention of skilled scientists becomes a high priority in a modern New Zealand healthcare system.
Author information: Michael Legge, PhD, MRSB ,FIBMS, FNZIMLS, FFSC(RCPA), University of Otago, NZIMLS. Email: mike.legge@nzimls.org.nz Advertisers in this issue
Copyright: © 2024 The author(s). This is an open-access article distributed under the terms of the Creative Commons Attribution License, which permits unrestricted use, distribution, and reproduction in any medium, provided the original author(s) and source are credited.
Advertise in the New Zealand Journal of Medical Laboratory Science
The Journal is distributed free to all members of the NZIMLS, wihch at present number approximately 3,500. this means that the Journal is read by most medical laboratory scientists and technicians and enters all hospital and community medical laboratories in New Zealand. It is also sent to members employed in commercial and veterinary laboratories, as well as governments establishments and members overseas.
For prospective advertising enquires, please contact sharon@nzimls.org.nz
Advertising rates are avaliable at: https://www.nzimls.org.nz/newpage4cfb513d
Sponsoring & exhibiting opportunites are avaliable for the NZIMLS ASM 2024 (28-30 August, Te Pae Christchurch) Please visit: www.nzimlsasm.co.nzvisitexhibit


Fully automated instrument— sample to result
High-throughput, producing multiplex results up to 75 patient results per hour
Easy-to-use, with star t-up and maintenance in under 30 minutes
Less interac tion, help sta focus on value -added tasks
Load & go feature
True random access

An innovative, multiplexing microarray
Distinctive design
Provides high multiplexing—up to 11 analytes on a single microarray in a single step
Multiple results in one run
Small sample volume needed to process results


Intelligent Smar t algorithm, reliable results
Displays clear results on the graphical user inter face with no need for user interpretation—analysis is completed by the instrument
Full traceability
0800 34 24 66 sales.nz@bio -strategy.com shop.bio -strategy.com www.bio -strategy.com
Catherine Littlechild
Aim: To review the impact of General Practitioner (GP) electronic ordering (e-ordering) on allergy testing at Awanui Wellington after a GP guided e-ordering tab with specific allergens listed was developed in 2019 and implemented in 2021.
Materials and Methods: All allergy requests were reviewed and analysed from a data extract of the Laboratory Information Management System (LIMS) from June-August 2019 (pre implementation) and June-August 2022 (post implementation) using Microsoft Excel and pivot tables.
Results: The total number of patients and allergens requested did decrease slightly over the three months we reviewed. We determined whether clinical details were included with the request and whether skin prick testing was also performed at the same time as the specific IgE testing. To make the data manageable, the allergens tested were broken down into three groups based on the e-ordering template and reviewed pre and post implementation. The total number of aeroallergens tested more than doubled over the three years, although the number of positive results did not significantly change. Of the food mixes tested, seafood mix and nut mix 2 showed a large increase in patients tested, although again the positive rates did not significantly change.
Conclusion: We feel the implementation of the guided e-ordering has not made an appreciable difference to positive rates of allergy detection, which suggests the e-order tab may require some adjustments. There has been a positive impact on laboratory staff time, with less hands-on time required both pre and post testing, freeing up staff for other tasks within the department.
Keywords: Specific IgE (EAST testing), skin prick testing, IgE-mediated, allergen, e-ordering, LIMS (laboratory Information Management System).
NZ J Med Lab Sci 2024; 78(2): 62-67
The incidence of allergic disease, atopy and asthma is increasing in industrialised nations, including New Zealand (1). Over the last 50 years this has become an increasingly major health problem (2). Studies carried out in the 1980s and 1990s in New Zealand showed that the prevalence of asthma in the general population was increasing over time (3,4). The European Community Respiratory Health Survey (ECRHS) has also demonstrated that New Zealand has one of the highest prevalence’s of asthma in the world (5).
New Zealanders also have one of the highest rates of house dust mite (HDM) allergy in the world. Exposure to HDMs is strongly associated with sensitisation, and in turn sensitisation to HDM is strongly associated with asthma (6). Both house dust mite and cat dander have been identified as independent risk factors in the development of childhood asthma (7).
The diagnosis and management of human allergic (type 1 – IgE mediated) disease begins with a thorough clinical history and physical examination. If these point towards a diagnosis of an allergic disorder, this is further aided using laboratory specific IgE testing and skin prick testing (6). Allergy testing is used to confirm sensitisation of an allergen which strengthens the diagnosis (6,8).
The specific IgE (sIgE) allergy testing (EAST testing) has been performed at Wellington Hospital using a Phadia ImmunoCAP250 analyser since 2012. Historically, all EAST testing was requested manually, with each requestor clearly indicating which specific allergen(s) were required by writing them on the patients’ laboratory request form. When a request form and sample were received in the laboratory, a generic panel was entered by specimen reception staff to order EAST testing. This enabled an aliquot to be automatically created from the primary sample for EAST testing and for the patients’ EAST request to appear on a specific allergy worklist in the Immunology department. Each allergen had to be manually added by staff in the Immunology department into the Laboratory Information Management System (LIMS) using a scanned image of the patient request form for reference. Each patient request with the individual allergens then went to the Phadia analyser automatically via a bi-directional interface.
Because this was a very cumbersome and labour-intensive process for the laboratory, a review of allergy testing was carried out by an Immunology Registrar in 2019. Guidance for
allergy testing was developed from this review and provided to requestors as a dedicated allergy tab in the laboratory electronic ordering (e-ordering) system from April 2021 (Appendix 1). It was hoped that this guidance would provide meaningful information for requestors of allergy requesting in the Wellington region so that clinically relevant allergy testing could take place. This e-ordering system is currently available primarily to GPs, but it is hoped this will be rolled out to all requestors in the future.
This move to guided e-ordering in April 2021 was an attempt to streamline allergy testing for both requestors and for laboratory staff. The principal aim for guided allergy e-ordering was to make it easier for requestors to know which allergens were available for testing, and therefore select clinically appropriate allergens for their patients. The secondary aim was to reduce laboratory staff time on allergen test entry in the LIMS and sIgE result validation.
With the introduction of allergy guided e-ordering, anyone using the laboratory e-ordering system can currently see the most clinically relevant allergens that are available for testing at Awanui Labs (Appendix 1). They can easily select an allergen or mix of allergens by ticking a box beside the allergen(s) of interest. Clinical details are strongly encouraged. Any unusual allergens required that are not listed must be written into the clinical information field as a free text comment. The allergy e-ordering tab allows the e-order to be automatically downloaded from the requestor directly to the LIMS at the time of sample collection. Each ordered allergen is therefore able to come into the LIMS automatically. Immunology laboratory staff handling time has been reduced to checking that each e-order has been receipted correctly and that all the allergens have been entered as requested. Manual entry of any unusual allergens requested in the clinical details field where GP’s have been unable to find a tick box is still required, as is allergy testing for any specialist requestors who do not have access to the GP e-ordering system.
Laboratory middleware (RippleDown) rules were created and implemented at the same time the guided allergy e-order tab went live which automatically added 11 of the comments used with sIgE results, where the comment is appropriate (based on the reported results). This was done to standardise commenting by laboratory scientists reviewing and releasing results (refer to appendix 2 for comments).
Since the implementation of the guided allergy e-order tab in April 2021, there has not been a formal review of the changes made to allergy testing at Wellington Hospital.
However, it was perceived the workload had increased. The aim of this review was therefore to determine the efficacy of the guided allergy tab in the laboratory e-ordering system and the impact it has had on the laboratory.
A data extract was requested from the Awanui IT department. This extract was generated as an excel spreadsheet that included sIgE requests referred to Awanui Wellington Lab from specialists based at Hutt Hospital, Kenepuru Hospital, Masterton Hospital as well as those of Wellington Hospital and primary care GP requests. Data was requested from the LIMS for the three months of June-August in 2019 prior to the use of the dedicated allergy tab in the GP e-ordering portal. Because of the COVID pandemic that swept the globe and resulted in numerous long lockdowns in New Zealand from March 2020, it was decided to request the pre-implementation data from 2019 rather than 2020. We saw a large reduction in allergy testing during the two years of the COVID pandemic, and we did not want to artificially skew the data. We therefore made the decision to exclude the two years most affected by COVID. The same three months were then requested for 2022, a year post implementation. The same three months were requested both pre and post implementation to avoid seasonal variations. Each laboratory patient request form was viewed to determine whether it was an e-order, whether clinical details were provided, whether skin prick tests were requested with the sIgE testing, and whether the requestor was a GP or a specialist. This information was subsequently added to the initial data extract. All patient data was anonymised to ensure privacy rules were adhered to. Because the data extract was used as a quality audit of a laboratory intervention and therefore a routine review of the impact of the intervention, no formal ethical approval was sought. This project was at the direction of the manager of Immunology, Awanui Lab in consultation with the Clinical Director and Immunologists of Wellington Regional Hospital. The data was analysed using Microsoft Excel and pivot tables.
The data extract of 2019 included 264 “e-Orderable” patient requests, and 306 non “e-Orderable” patient requests. However, as these e-orders were not guided e-Orders, they have merely been summed to give the total number of sIgE patient requests in the three months of data analysed (Table 1).
Table 1. Total number of patient requests for sIgE using e-Order
Guided e-orders 2019 2022
Yes n/a 339
No n/a 172
Total sIgE patient requests 570 511
Total allergens tested 2792 2617
The data extract of 2022 included additional data from the laboratory in Taranaki that Awanui Labs perform sIgE testing for. These were excluded because Wellington didn’t do the sIgE work for this lab in 2019. This left a total of 339 sIgE e-Orderable requests. The non-e-Orderable requests, excluding the Taranaki Lab equated to a total of 172 requests (Table 1). Requestor type (GP or specialist) was also considered relevant to how many e-orders were received by the laboratory. A small number of specialists have access to the laboratory e-ordering system as can be seen in Table 2 (2.3%), however the vast majority of e-Orders received by the laboratory were from GPs. Next, all patient requests where clinical details were provided were reviewed. This required a review of each request form submitted for testing. Results are summarised in Table 3. It appears there has been a slight increase in clinical details being provided with allergy requests over time. This may have been
prompted by the addition of a comment to sIgE results indicating that clinical details aid in the interpretation of results where none had been provided.
The next stage of the review looked at whether skin prick testing (SPT) was performed along with sIgE testing, regardless of the requestor (primary or secondary care). It has been accepted in general practice for some time that skin prick testing should be performed along with serum specific IgE testing as part of the diagnostic process used to determine true IgE mediated allergies (8) from non-IgE mediated sensitivities. From the small number of requests where skin prick testing was performed (Table 4) there did seem to be a slight increase in skin prick requesting over time. The requestor of each of the skin prick testing for each patient was also reviewed. This showed a marked increase in skin prick testing requests coming from GPs in the Hutt Valley district. In 2019 there were only two medical centres in the Hutt Valley requested skin prick testing. In 2022, there were 14 medical centres in the Hutt Valley requesting skin prick testing. Also of note, there were not many GPs requesting allergy testing in 2019 who were still asking for allergy testing in 2022 in the district (data not shown). We also looked at whether there were significant differences in sIgE testing between males and females (Table 5). From the snapshot of these three months, slightly more females underwent allergy testing in 2022 compared to 2019, with a corresponding slight decrease in males being tested.
In order to determine if giving the GPs guided e-order allergen requesting has provided clinical benefit, we looked at the number of individual allergens requested from 2019 where just a generic EAST was ordered (where GPs had to write which allergens they were interested in having testing), to 2022 with the current system where the most common allergens are listed on the guided allergy e-Ordering tab. Looking at specifically the e-Order requests from 2019 and 2022, we determined the total number of requests of each allergen and the number that were considered positive (≥0.35 kU/L) when tested on the Phadia 250 analyser using ThermoFisher ImmunoCAPS. Although the GP e-orders of allergy testing in 2019 were not guided, this review is limited to looking at the e-ordering process of GP’s, rather than all GP requests. This has excluded 39 patient requests from 2019, and 4 from 2022. This data has been split into three tables: aeroallergen requests (Table 6), the food mixes (Table 7) and the individual food caps (Table 8). It can be seen from Table 6 that the total number of aeroallergen requests from GPs who have electronic ordering has more than doubled for all 7 aero allergens over the 3 years, despite the impact of COVID. However, the percentage of positive results has decreased slightly over this time, apart from plantain which has increased slightly. It should be noted that the house dust mite tested was Dermatophagoides pteronyssinus. The laboratory does not stock D farinae
For the food mixes that have been added to the GP allergen e-Order tab, the largest increase in total test numbers is seen with nut mix 2 and the seafood mix. It may be theorised that GPs were not aware that there were two different nut mixes, or that a comprehensive seafood mix was available. Despite the increase in the total number of mixes tested, the percentage of positive results has generally decreased over time. The large decrease in positive rates of the nut mix 2 from 100% to 33.3% is due to the increased number of requests.
From Table 8 it can be noted that there has been a large increase in the number of individual seafood allergens and nuts (these are the individual caps for the seafood mix and nut mix 2) being tested. This most likely can be attributed to the increase in the total number of mixes being ordered that were subsequently positive. The total number of test requests for foods that are part of the common food panel (egg white, soybean, wheat, cod, cow’s milk, and peanut) and for nut mix 1 are largely unchanged. Coconut, pecan, blue mussel and salmon are the only allergens to show an increase in the number of positive results. However, the low test numbers for many of these allergens limit the conclusions that can be drawn from this data.
Table 2. sIgE patient requests by requestor type
Table 3. Clinical details provided per sIgE patient request
Table 4. Whether SPT was performed with sIgE testing per patient request
Table 5. sIgE Requests by gender per patient request
It was clear from the data extract that there has been a pleasing uptake in the number of GPs using e-Orders since the implementation of the allergy tab to the GP e-Ordering system in 2021. This was the goal of the original work of creating the GP guided allergy tab. Indeed, most GP requests received in the three months of data reviewed from 2022 were e-orders, with just 4 of the 331 (1.2%) being manual requests.
One point of note from Table 2 is the 12.3% overall drop in specialist allergy ordering from 2019 to 2022. This data was further split into paediatricians and adults, with almost a third of the decrease attributed to a drop in paediatrician requests. One possible explanation for this is referrals to allergy specialists (including paediatricians) have been limited due to the COVID pandemic, and patients are being screened at the primary care level to ensure appropriate referrals are being made. Another potential explanation is the immunology pathologists available for accepting allergy referrals in the Wellington district in 2022 were reduced in number from 2019 levels due to maternity leave and staff vacancies. Specialist referrals may have therefore been triaged back to the requesting GP for sIgE testing prior to accepting or rejecting of a referral.
There has been a 5.4% increase in the number of skin prick testing being performed along with sIgE testing from 2019 to 2022, and a large increase seen particularly by GPs in the Hutt Valley district. Identifying the root cause of this is beyond the scope of this review. However, one possible influence could be that the healthy homes standards that came into law in July 2019 has enabled tenants to access better outcomes with the tenancy
tribunal by proving that poor health is being contributed to by their cold and damp rental home (9).
The main consideration of this project was to determine whether giving clinicians specific IgE allergens to order (a tick box rather than a blank box they had to fill out) has altered the pattern of requesting by those using the laboratory e-ordering system. We also wanted to know if having provided the list of what are considered common allergens, was this guiding allergy requesting in such a way that more positive than negative results were being generated. It was known from test numbers collated over time from the Phadia ImmunoCAP 250 that we were ordering more caps in 2022 than we were in 2019, but we wanted to quantify this.
There was clearly a large increase (25.4%) in the total number of allergens requested by GPs from 2019 to 2022. It was hoped this was because of an increase in allergy awareness in primary healthcare practice and appropriate testing was being performed on patients that had clinical history suggestive of IgE mediated allergies. If this was the reason for the increase, it should have shown as an increase in the percentage of positive results of allergens. From the data analysed, this is not the case. It raises the question of why there such a large increase in allergy has been testing when there may not be an increase in clinical value. The large increase in the total number of allergens requested by GPs over the last few years may be a reflection of a general increase in the prevalence of allergies in the general population over time and the increased concern patients have about possible allergic symptoms they are experiencing.
Alternatively, it may be that GPs are finding it easier to order allergy tests and therefore are ordering more tests on their patients. As we do not have access to clinical notes for patients, and GPs have not been surveyed on how they are finding the new guided e-ordering system, it is beyond the scope of this review to answer this question.
A large part of the e-order implementation process that was anticipated to save laboratory staff time was in not having to add each allergen manually in the LIMS and not having to add the majority of comments when reviewing sIgE results prior to reporting. While doing a formal time and motion study is outside of the scope of this review, it could be noted that Immunology staff time saved using an e-order compared to a manual request has been estimated to be up to 50%.
Reviewing sIgE results has become simpler with the LIMS middleware adding 11 comments based on the specific IgE and total IgE results (Appendix 2). These comments no longer need to be added manually by laboratory staff when reviewing results. It has also enabled the standardisation of comments added, ensuring that the same comments are always added for a set of results, regardless of the staff member reviewing them.
A literature search for similar studies that have been undertaken with regards to electronic ordering was made to see how our
results compared to published research. A search in Pubmed found 155 hits with the words “pathology electronic order entry” used as the search criteria (August 2023). A more limited search using “allergy” and “electronic order” yielded 5 articles (Appendix 3). However, none of these articles were a review of allergy e-ordering and how its implementation has altered ordering patterns over time and potentially improved clinical outcomes.
Supplementary material (Appendices 1, 2 and 3) is available at: https://mix.nzimls.org.nz/journal-archive.html
This review was designed to determine whether the introduction of guided allergy e-ordering for GPs has altered allergy testing patterns and aided primary care physicians by assisting them with requesting appropriate allergy testing for the clinical history and symptoms of their patients. While it is clear that the number of requests by GPs for specific IgE testing has increased, it is disappointing to see that the percentage of positive results has not. The introduction of guidance for GPs has, on balance, likely not had the improved clinical outcomes we anticipated.
The second aim of this review was to determine whether the changes made in April 2021 have significantly improved Table 6:
processes in the laboratory. It has been anecdotally noted by laboratory staff the changes made have had a significant positive impact on the workflow, although this has not been formally quantified for this review. Immunology staff time is largely reduced to reviewing patient requests prior to testing rather than adding each allergen requested for the majority of e-orders. sIgE reported results have less variation due to the introduction of 11 comments automatically being added. Staff have therefore been freed to attend to other duties.
We have identified further areas of data analysis that may help guide future decisions made from the conclusions of this review. Due to the restriction of the length of this treatise, they were unable to be included. We aim to include these further findings together with this treatise in a published paper.
We would like to determine the positive rates of specialist requestors to see how these compare to those of GPs already analysed and reported in this review. It would be inappropriate to find fault with GPs for the increase in sIgE ordering that has produced fewer positive results if the trend is similar in specialist patient results.
A review of the clinical details provided with each allergy request by a clinician would be helpful to determine whether allergyrelevant clinical details were provided. While some requestors do add relevant clinical information to help laboratory staff and pathologists interpret results, many do not. The mandatory completion of the clinical details field may be required in the Table 8:
future. It may be that further testing and/or guidance with results could be added if appropriate clinical information is included with the EAST request.
We would like to review the total number of allergens requested per patient. We believe this would provide additional information to determine whether there are certain requestors ordering considerably more tests per patient that may be more indicative of a generalised screen rather than targeted testing. Requesting feedback from any “high allergen requestors” may help us understand the possible reasons why some GPs request more allergens than others.
A further review by clinical staff of the allergens listed in the GP e-ordering tab and whether the mixes that we provide are suitable for determining true IgE mediated allergies is also warranted. It may be that the list of allergens available in the allergen tab should be reduced. Some further additional information around allergy testing may also be helpful and why the patient’s history of symptoms should be carefully considered before specific IgE testing is performed.
A survey of users was unfortunately not carried out prior to the introduction of the guided GP e-ordering tab in 2021. However, a survey of users prior to changes being made to the current tab and then again 6-12 months after changes are made may help us establish whether any further changes are warranted, and if we are providing a suitable and meaningful service for our customers.
The limitations due to the word length of this treatise include not having space to determine the positive rates of specialist requestors; not having space to review and report on clinical details supplied with allergy requests to ascertain whether information provided is meaningful for the allergens requested; not having space to review the total number of allergens per patient in order to identify requestors who may be screening patients rather than targeting a specific suspected allergen, and finally not having space to review the GP e-ordering tab and the allergens listed and whether they are appropriate and provide meaningful information for requestors.
Many thanks to the Immunology Department at Awanui Labs Wellington, in particular; Paul Tustin, Dr Richard Steele and Dr Arthur Price.
Catherine Littlechild, FNZMLS, MSc, Medical Laboratory Scientist, Awanui Labs, Wellington.
Correspondence: catherine.littlechild@awanuilabs.co.nz
1. Epton MJ, Town GI, Ingham T, et al. and the New Zealand Asthma and Allergy Cohort Study Group. The New Zealand asthma and allergy cohort study (NZA2CS): assembly, demographics and investigations. BMC Public Health 2007; 7(26): 1-9.
2. Wickens K, Crane J, Lewis S, et al. A case-control study of risk factors for asthma in New Zealand children. Aust N Z J Public Health 2001; 25(1): 44-49.
3. Shaw RA, Crane J, O’Donnell TV, et al. Increasing asthma prevalence in a rural New Zealand adolescent population: 1975-89. Arch Dis Child 1990; 65(12): 1319-1323.
4. Mitchell EA. Increasing prevalence of asthma in children. N Z Med J 1983; 96(734): 463-464.
5. No authors listed (paper drafted by Burney P, Chinn S, Jarvis D, et al. on behalf of the European Community Respiratory Health Survey). Variations in the prevalence of respiratory symptoms, self-reported asthma attacks, and use of asthma medication in the European Community Respiratory Health Survey (ECRHS). Eur Respir J 1996; 9(4): 687-695.
6. Hamilton RG. Clinical laboratory assessment of immediatetype hypersensitivity. J Allergy Clin Immunol 2010; 125 (2supple 2): S284-296.
7. Sears NR, Herbison GP, Holdaway MD, et al. The relative risks of severity to grass pollen, house dust mite and cat dander in the development of childhood asthma. Clin Exp Allergy 1989; 19(4): 419-424.
8. Sinclair J, Brothers S, Jackson P, et al. IgE mediated food allergy – diagnosis and management in New Zealand children. N Z Med J 2013; 126(1380): 57-67.
9. New Zealand Ministry of Housing and Urban Development. Residential Tenancies (Healthy Homes Standards) Regulations 2019 (internet). Wellington: New Zealand; 2019 [updated 2022 November 26].Available from: www.legislation. govt.nz/regulation/public/2019/0088/latest/whole.html
Copyright: © 2024 The author(s). This is an open-access article distributed under the terms of the Creative Commons Attribution License, which permits unrestricted use, distribution, and reproduction in any medium, provided the original author(s) and source are credited.
I began my scientist training with the dawn of the new degree at Massey University in 1992 as part of the first intake. Our degree head and mentor Dr Mary Nulsen was instrumental in seeing a need and creating a university path for us to follow.
Once my degree was completed after specialising in chemistry and immunology, and a job was secured where I had completed my training in Palmerston North Hospital, my thoughts turned to what would come next. Mary was keen for a Master’s Degree to be available, but it was still winding though the university cogs for final approval. Some of the proposed papers existed already so I started with Advanced Health care Law – a fascinating paper that was sadly never included in the final MSc programme. Once the MSc programme had been finalised, I enrolled and got stuck into the last three papers.
Sadly our lab in Palmerston North was sold, the first lab at the forefront of privatisation of the pathology sector. After spending a year at the private lab, a job came up in Whakatane. It was a dream job for me at the time, I was young and the oncall was good money. I travelled and saved for my first house. Sadly my best friend contracted meningitis and passed away. I moved to Waikato Hospital to have the opportunity to complete my thesis - P3NP amino terminal type 3 procollagen is still available to this day. I even managed to be awarded some grant money which I was very thankful for to pay for the evaluation kits. I was awarded my MSc in 2005, the first candidate in New Zealand to be awarded the MSc in Medical Laboratory Science.
The lure of an OE was calling so after registering with the HCPC, I headed off to Addenbrookes Hospital in Cambridge United Kingdom (thanks to a friend who was already working there), where I obtained a work visa and a one-year contract. It was a large and busy biochemistry lab with some amazing research going on. Despite being asked to stay on, I did finally head back home with my parents after a brilliant trip around Europe. 99p flights from the UK to Europe were shamelessly exploited, despite the annoying flight times. Back home and camping with my best friend and her family,
a temporary job came up at Waikato Hospital managing specimen reception. I had no idea if I would like it or not, but reasoned since it was temporary it was good experience. I loved the job. When the contract ended, I moved on to Pathlab where they were about to move into their purpose-built building and take over the laboratory community contract for the district. I would still be there today if love had not intervened. I packed up my house and moved back to the UK and first a job as the Head of Department of biochemistry at a private hospital lab on the outskirts of London, then back to Addenbrookes Hospital and to Immunology. After many stressful months of renewing spouse visas, my husband and I decided to head back to New Zealand to live. I managed to time it right with a vacancy at Awanui Wellington Immunology, where I am today.
I finally decided in 2022 that it was time to enrol in my NZIMLS Fellowship, so I enlisted the help of our clinical director to give me a topic. This paper is the result of that research.
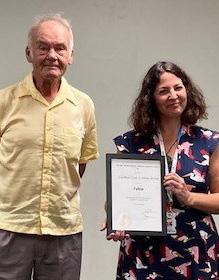
Catherine
Miyamoto
All forms of crossmatching are crucial for confirming compatibility between the patient and the donor before transfusion. It is the final check to ensure all pre-transfusion testing is correct and to prevent transfusion reactions in recipients. The aim of this review is to highlight the importance of electronic crossmatch (EXM) in transfusion science in New Zealand and across the globe, in consideration of the advantages and disadvantages. Several articles and guidelines were used to understand the background, implementation, characteristics, and features of EXM in medical laboratories. Interestingly, the prerequisites for utilising EXM varies across the globe and some transfusion centres do not approve EXM at all. EXM has disadvantages and caveats; however, many of these are insignificant compared to the ability to provide improved patient care and efficiency in the laboratory
Keywords: Electronic crossmatch, transfusion, crossmatching, computer.
NZ J Med Lab Sci 2024; 78(2): 68-71
As an alternative to serological crossmatching methods in transfusion science, electronic crossmatch (EXM) is a major asset to laboratories that require an accurate means of determining blood group compatibility. Crossmatching blood components prior to transfusion is vital for preventing adverse reactions in patients, and there are several methods implemented in laboratories (1,2). EXM is one type of abbreviated crossmatching used in New Zealand and across the globe (1).
The aim of this review is to outline the features, advantages and disadvantages, and the implementation of EXM in New Zealand and internationally.
Electronic Crossmatch (EXM) was first used in the United States of America (USA) in 1992 (1). Its main role in transfusion medicine is to rapidly confirm ABO blood group compatibility between a donor and a recipient (1, 3-5). It relies on the electronic record of the patient’s blood group, laboratory automation, and a robust computer system in the laboratory (1, 6).
Prior to the introduction of EXM in New Zealand, abbreviated crossmatch for patients without clinically significant alloantibodies involved mixing the patient’s serum with donor red cells suspended in saline. Up until twenty years ago, a full indirect antiglobulin test (IAT) crossmatch was required for all patients (7). Currently, EXM involves antibody screening, blood group checks using two different reagents, and electronic issuing implemented to minimize mistakes and reduce the workload (3, 5, 6).
Generally, EXM can only be used when the recipient’s antibody screen is negative, electronic data is available, and at least two identical ABO/Rh types of the patient are available (1, 8).
Antibody screening is a routine IAT method used to detect clinically significant alloantibodies across a variety of non-ABO blood group systems. Usually, two or three cells with known corresponding red cell antigens are mixed with the patient’s plasma (5). According to the International Society of Blood Transfusion (ISBT), the computer system is deemed reliable if it can recognise valid blood type and screen results, recognise and permit the use of a compatible unit, and recognise and prevent the issue of an incompatible unit (8). Although this is the general principle of EXM, there are some variations in different parts of the world, which will be discussed in later sections. Laboratories and transfusion centres use EXM under international guidelines, including those from the Association for the Advancement of Blood & Biotherapies (AABB, formerly known as the American Association of Blood Banks) and the British Society for Haematology (BSH, formerly known as the British Committee for Standards in Haematology) (1, 9). Specifically in New Zealand, the New Zealand Blood Service is responsible for standardising and controlling the policies for compatibility testing.
In New Zealand and all other countries that use electronic
systems ensure quality control with a barcode system (5, 6). All forms, samples, and blood units are labelled with a barcode and hold important information about the unit and the patient. Generally, the barcode provides the unique identification number of the patient and the component, the ABO and RhD blood group, compatibility tests and results, component type, and the expiry date. Barcoding prevents clerical errors and allows easy transfer of all information into the laboratory information system. It also allows a confidential and secure storage of patient information and traceability (5, 6). Some facilities also use a two-person check or additional bedside identification check. Furthermore, blind entry is a requirement in some laboratories to avoid a mixup of past and current test results that may be displayed on the screen together (6).
EXM has many advantages, as summarized in Table 1. One significant benefit of using EXM in the transfusion medicine laboratory is the reduction in workload, as serological testing is not needed (Table 1). This alleviates hands-on time and reduces the turnaround time while ensuring reliable crossmatching (1, 8, 10, 11). A study done in Sweden showed that the introduction of EXM reduced the workload by 65% (12, 13). Furthermore, less hands-on time means that laboratory staff are less exposed to biohazardous material and experience less stress. Scientists can allocate their expertise to other tasks that require specialised skills, and to other patient samples with positive antibody screens which take longer (1, 3, 6, 11, 14). EXM also reduces the time duration between clinicians’ orders and the subsequent issuing of blood. This is because EXM itself is simple and fast, but also because some facilities allow remote EXM (1, 5, 15, 16). It overcomes many difficulties that may be seen in urgent situations if EXM and electronic issuing aren’t used. Without EXM, blood units are crossmatched only after they are ordered, and then issued to the facility from the blood bank. This delay is particularly amplified if issued units are not used immediately or returned to the blood bank without even being used. EXM allows laboratory practitioners to quickly glance at the electronic data of all available units with their pre-transfusion test results and the storage situation (1, 10, 13). Furthermore, the use of EXM in emergency transfusions is allowed if the laboratory has a computer system that selects group O units only, until the patient’s ABO grouping is available (5). Remote EXM enables the storage of crossmatched units close to the facilities where they are used, mitigating the delivery time (1, 10, 13, 15). As a result, this improves the efficiency of storing, ordering, and issuing and significantly reduces the number of unused or expired blood units (Table 1) (8, 13). For instance, in an Australian pathology service, EXM and computerized issuing led to a 30% reduction in expired red cell units (3).
As EXM eliminates the need for serological tests to confirm compatibility, it reduces the required sample volume from the patient, reserved units waiting for serological crossmatch, and
confusing serological reactions (1, 11). It is important to select the most personalized and relevant methods to avoid false reassurance from unnecessary and confusing results (17). Cost is also a large factor in transfusion science laboratories. The financial burden is lowered by implementing EXM as it reduces wasteful discard of expired units and consumables, and equipment for manual or automated tests (1, 11, 13). Furthermore, EXM is a simple task that can be done by almost any registered staff, which means that the labour costs of specialists as well as human error can be reduced (Table 1) (3, 7, 11).
As displayed in Table 1, EXM has an advantage over serological tests if the patients are eligible and the laboratory meets all the requirements. The benefits have a large impact on the laboratories as a vast majority of the patients have a negative antibody screen (14).
Disadvantages and caveats
The potential disadvantages of EXM are also summarized in Table 1. A drawback of EXM in blood transfusion is the prerequisites that are put in place (1, 8, 11). In most countries, there must be at least two records of the patient’s ABO and Rh types, the donor ABO group must be verified, prior antibody screening must be performed, and there must be a reliable computer system that is compatible with the existing laboratory system. The laboratory must use software that can interpret the results and correctly alert the staff if there are incompatibilities, clinically significant antibodies, discrepant results, and blood units that are expired or misplaced (1, 8, 11, 18). Although these requirements apply to other crossmatch methods, they counteract the expected reduction in workload in EXM especially for patients without historical blood group data. Laboratory management must consider and balance between high-quality patient care and laboratory staff workload when deciding whether to implement EXM (1, 8, 11).
Additionally, although EXM reduces human error seen in manual tests, there is still a chance of mislabelling or misreading the barcode. As EXM heavily relies on the correct labelling of all components, overlooked errors can lead to incompatible transfusion and additional work for laboratory staff. For example, two adverse transfusion reactions occurred in the same batch of units in Denmark, due to both human error and system malfunction. This unusual event occurred because the laboratory staff were dependent on the computer system and didn’t question any errors, despite the control procedures (6). However, it is important to note that human error is a risk that is common to all crossmatch tests and laboratory procedures, which should be minimized through thorough training and careful planning. It is also easily traceable for future improvements and haemovigilance if electronic systems are in place (5, 6, 11, 18).
Implementing this technology into all transfusion science laboratories can be expensive, especially in countries that mandate automation or are less developed in investing in fully automated systems (1, 11, 18). Depending on the size and throughput of the laboratory, EXM can be costly to implement and be used routinely; however, the cost is not the main hindrance in most Western countries (12).
There is also a risk of impeding workflow during system downtime, maintenance, or in certain circumstances. For instance, BSH prohibits the use of EXM during downtime, when the blood grouping or screening results are not transferred to electronic data, when the stock units are not stored electronically, and when the results are manually edited (16). In turn, this can be more time-consuming and be a predicament in emergencies, as scientists must use backup methods such as immediate spin or IAT crossmatch that they may not be used to (1, 6, 11). Another weakness of EXM is that antibodies against low-frequency antigens may remain undetected and cause haemolytic transfusion reactions in susceptible patients (1, 3, 6). The antibodies cannot be detected if these low-frequency antigens are not present on the antibody screening cells. However, this limitation is not exclusive to EXM and the risk of causing severe
transfusion reactions is relatively low (3, 6, 19, 20).
Table 1. Summary of advantages and disadvantages of EXM in the laboratory
• Less hands-on time and turnaround time
• Lower risk of ABO incompatibility
• Less physical and mental stress
• Better efficiency – storage, ordering, issuing
• Less wasted units
• Less sample requirement
• Cost-efficient (equipment, labour)
• Can be performed by nonblood bank specialists
• Reduced human error
• Cost to implement
• System downtime and maintenance
• Can’t detect antibodies against low-frequency antigens or rare variants
(References; 1, 3, 6, 8, 10, 11, 13)
In New Zealand, some form of crossmatching is required before transfusion, depending on the results of mandatory ABO forward and reverse grouping, RhD typing, confirmation, and antibody screening (5). When using EXM, New Zealand transfusion centres follow the guidelines of the Australian and New Zealand Society of Blood Transfusion (ANZSBT), which are based on BSH and AABB (5). Requirements include a comprehensive and validated computer system, completion of all mandatory testing, identical past and current blood groups, and no clinically significant antibodies in the past or current recipient samples (5, 8, 20). These prerequisites are associated with the caveats mentioned in Table 1; however, the advantages outweigh the disadvantages and are a part of providing exceptional safety to patients. This is reinforced by the fact that EXM has not had significant problems or changes over the past twenty years since its introduction in New Zealand (6). Other technical criteria by BSH and AABB are fully automated testing and result entry; a valid identification system; a result verification system; the use of validated reagents, cells, and technology; and samples and reagents that are identifiable by analysers. Moreover, the computer system must be able to control the suitability of patients as well as alert and differentiate between permanent or temporary deferrals (2, 19). Conversely, EXM cannot be used if there is no historical record of the patient, or uncertainty and unresolved problems in the serological tests (5, 6, 8).
International
Like New Zealand, EXM is generally used in patients with no clinically significant antibodies in Denmark, Italy, Hong Kong, and Sweden, as shown in Table 2 (6). An exception is in Sweden, where most centres permit EXM even if antibody screennegative patients had antibodies in the past, and if only one ABO and Rh type is available (6). In addition to the disadvantages mentioned in Table 1, Denmark and Sweden utilise the ABCD procedure which was found to cause undetected mislabelling (Table 1). The ABCD procedure involves an antibody screen, blood grouping, and a ‘computerized delivery control’ (3, 6, 12). This set of procedures are the same as EXM in New Zealand and other countries; therefore, undetected mislabelling is a shared concern across many transfusion centres. The electronic issue or computerized delivery is used in almost all crossmatch methods for better efficiency and to prevent the expiration of units (3).
As displayed in Table 2, Australia, Canada, Ireland, the United Kingdom (UK), and the USA use EXM under similar requirements (6). However, this does not apply to all transfusion centres unlike New Zealand which has standard national procedures. Hong Kong and Australian transfusion centres have implemented
remote EXM which allows practitioners to electronically search for all available and compatible units that are stored at their healthcare facilities (3, 16). There is a lag in the introduction of EXM into mainland China due to the highly diverse population and unrepresentative guidelines. Some hospitals have started utilising EXM; however, not all clinically significant antibodies are covered by screening reagents imported from countries with different antigen frequencies (4). For example, an MNS hybrid antigen called Mur is relatively common in the Chinese and Thai populations, compared to Caucasians. Imported standards and reagents using predominately Caucasian donors may miss the unexpected antibodies binding to these antigens that are rare in other populations (4).
Table 2 Summary of pre-transfusion tests used in a range of countries, in patients with no unexpected antibodies
Country EXM
New Zealand
Australia
Austria
Canada
Denmark
France
Germany
Hong Kong
Ireland
Italy
Japan
Sweden
UK
USA


Other procedures
ABO/RhD type, antibody screen
ABO/RhD type, antibody screen, remote release
ABO/RhD type, antibody screen, IAT crossmatch bedside test
ABO/RhD type, antibody screen
ABO/RhD type, antibody screen
ABO/RhD type, antibody screen, bedside test
ABO/RhD type, antibody screen, IAT crossmatch, bedside test
ABO/RhD type, antibody screen, remote release
ABO/RhD type, antibody screen
ABO/RhD type, antibody screen
ABO/Rh type, antibody screen, immediate spin, IAT crossmatch after transfusion
ABO/RhD type, antibody screen
ABO/RhD type, antibody screen
ABO/RhD type, antibody screen (References; 3, 6, 20).
In France, EXM is used in both situations where the antibody screen is positive or negative, coupled with an IAT crossmatch if positive. Prior to transfusion, a bedside ABO crossmatch is performed using anti-A and anti-B reagents. A small number of hospitals in France perform the EXM at the bedside with a laptop (6). In Japan, EXM is used in conjunction with immediate spin and IAT after transfusion. However, this is only done in a small number of transfusion centres and some use EXM on all patients regardless of their antibody screen results, as a final check (6). Interestingly, EXM is not permitted at all in Austria and Germany, and patients require the full IAT and bedside ABO crossmatch even without the presence of clinically significant antibodies (6, 21). This is because of inconsistency between the laboratories and transfusion centres, and the idea that bedside crossmatching is crucial for preventing transfusion reactions. Nevertheless, many centres have been using automated serological tests for antibody screening and crossmatching, which have similar benefits as EXM (6, 21).
This review concludes that Electronic Crossmatch (EXM) is a large asset to transfusion medicine in many parts of the world. Although there are several caveats such as complex algorithms, system downtime, implementation costs, human error, and stringent requirements, it overcomes many challenges. As with other aspects of medical laboratory science, providing safety and accuracy is one of the priorities when treating patients. EXM contributes to this goal through its time efficiency, reduced longterm cost, improved blood storage management, and simplicity. Comparing the use of EXM in various transfusion centres showed that each experiences the advantages and disadvantages of EXM differently. EXM is the most reliable when combined with other tests such as duplicated ABO and Rh typing, antibody screening, IAT, and bedside checks. It is an essential tool in transfusion medicine and will most likely continue to improve and diffuse further around the world.
Rei Miyamoto, BMLSc, Medical Laboratory Scientist, Christchurch Blood Bank (New Zealand Blood Service).
Correspondence: rei1004miyamoto@gmail.com
1. Arslan Ö. Electronic Crossmatching. Transf Med Rev 2006; 20(1): 75–79.
2. Alquist CR, Harm SK. Transfusion-service-related activities: pretransfusion testing and storage, monitoring, processing, distribution, and inventory management of blood components. In: Cohn CS, Delaney M, Johnson ST, Katz LM, eds. Technical Manual (AABB). 20th ed. AABB, Maryland, 2020: 503-535.
3. Chapman JF, Milkins C, Voak D. The computer crossmatch: a safe alternative to the serological crossmatch. Transfus Med 2001; 10(4): 251–256.
4. Wang YJ, Liu JR, Liu Y. Safety issues related to the electronic cross-matching of blood in mainland China: a prospective cohort study involving cross-matching of 40,228 blood samples. Medicine 2019; 98(35): e16703.
5. Zacher N, Benson S, Irwin G, et al. Guidelines for transfusion and immunohaematology laboratory practice [Internet]. Australian and New Zealand Society of Blood Transfusion Ltd; 2020. Available from: https://anzsbt.org.au/ wp-content/uploads/2021/04/Guideline_-for_Transfusion_ and_Immunohaematology_Laboratory_Practice_FINAL_ Published_20210426.pdf
6. Reesink HW, Davis K, Wong J, et al. The use of the electronic (computer) cross-match. Vox Sang 2013; 104(4): 350–364.
7. Flanagan P. Blood issues a transfusion medicine newsletter (Issue 3) [Internet]. New Zealand Blood Service 2002. Available from: www.nzblood.co.nz/assets/TransfusionMedicine/Blood-Issues/Blood-Issues-No-3-Mar-2002.pdf
8. Yazer M. Use of electronics in the blood bank and for the enhancement of patient blood management [Internet]. International Society of Blood Transfusion. Available from:www.isbtweb.org/isbt-working-parties/clinicaltransfusion/resources/patient-blood-managementresources/13-use-of-electronics-in-the-blood-bank.html.
9. Judd WJ. Requirements for the Electronic Crossmatch. Vox Sang 1998; 74(2): 409–417.
10. Bentley N. Reducing transfusion risk using computer software. Surgical Services Management 2000; 6(8): 49-52.
11. Mazepa MA, Raval JS, Park YA. Pathology consultation on electronic crossmatch. Am J Clin Pathol 2014; 141(5): 618–624.
12. Säfwenberg J, Högman CF, Cassemar B. Computerized delivery control - a useful and safe complement to the type and screen compatibility testing. Vox Sang 1997; 72(3): 162–168.
13. Özdamar M, Çetinkaya F, Özdamar Oİ, et al. The use of the electronic cross-matching in transfusion center. J Biotechnol Strategic Health Res 2019; 3(3): 250–254.
14. Ko KH, Yoo BH, Kim KM, et al. Frequency of unexpected antibody and consideration during transfusion. Korean J Anesthesiol 2012; 62(5): 412–417.
15. Boisen ML, Collins RA, Yazer MH, Waters JH. Pretransfusion testing and transfusion of uncrossmatched erythrocytes. Anesthesiology 2015; 122(1): 191–195.
16. Jones J, Ashford P, Asher D, et al. Guidelines for the specification, implementation and management of information technology systems in hospital transfusion laboratories. Transfus Med 2014; 24(6): 341–371.
17. Freedman DB. Towards better test utilization - strategies to improve physician ordering and their impact on patient outcomes. EJIFCC 2015; 26(1): 15–30.
18. Demirkan F, Gunal V, Dereli Y. A new method for electronic crossmatch: ABO/Rh blood group confirmation and antibody screening concomitantly with serologic crossmatch. Blood
2013; 122(21): 4833-4833.
19. Padmore R, Berardi P, Erickson K, et al. Acute extravascular hemolytic transfusion reaction due to anti-Kpa antibody missed by electronic crossmatch. Transfus Apher Sci2014; 51(2): 168–171.
20. Milkins C, Berryman J, Cantwell C, et al. Guidelines for pretransfusion compatibility procedures in blood transfusion laboratories. Transfus Med 2012; 23(1): 3–35.
21. Lange J, Selleng K, Heddle NM, et al. Coombs’ crossmatch after negative antibody screening - a retrospective observational study comparing the tube test and the microcolumn technology. Vox Sang 2010; 98(3p1): 269–275.
Copyright: © 2024 The author(s). This is an open-access article distributed under the terms of the Creative Commons Attribution License, which permits unrestricted use, distribution, and reproduction in any medium, provided the original author(s) and source are credited.
Are you wanting to earn more CPD points?
Have you ever considered speaking at the 2024 NZIMLS Annual Scientific Meeting?
Then we want you!
The ASM programme is looking good, however we have speaking spots available across all disciplines. This is a great way to share your experiences with peers, earn CPD points, and network with like-minded people.
If you are interested in presenting, then please email the ASM Convenor, Vanessa Buchan: vanessa.buchan@cdhb.health.nz

Hamza Siyar, Hassane Mamad, Imane el Omari, Souad Benkirane and Azlarab Masrar
Coagulation factor inhibitors include antibodies that selectively bind and then oppose different plasma proteins that have a pro-coagulant effect. The development of coagulation factor inhibitors can occur against any of the factors involved in coagulation cascades, with the most frequently affected factor VIII (FVIII). Individuals with inherited haemophilia A (HA) may experience the development of these conditions as a result of an immune response to factor replacement therapy or the presence of autoantibodies, which subsequently lead to the onset of acquired HA. The laboratory diagnosis of factor inhibitors necessitates a thorough and systematic methodology that eliminates other plausible reasons for extended screening tests, primarily the activated partial thromboplastin time (APTT). The measurement of inhibitor titre, which is guided by the results of the Bethesda assay, is performed to determine the optimal treatment approach. The purpose of this review for our laboratory is to enhance understanding, offer a framework to place and validate our work, and consequently improve our chances for achieving success. Data obtained from a literature review typically encompasses subjects and methodologies that have been investigated in this field, as well as the currently recognized optimal approaches. The paper summarizes the laboratory research into factor inhibitors and briefly reviews the latest research.
Keywords: Factor VIII inhibitors, haemophilia, Nijmegen Bethesda assay, lupus anticoagulant.
NZ J Med Lab Sci 2024; 78(2): 72-76
The deficiency of clotting factor VIII (FVIII) that causes haemophilia A can be inherited or acquired (1,2). The estimated prevalence of hereditary haemophilia A, an X-linked disorder, is 17.1 cases per 100,000 men worldwide (1). When receiving FVIII replacement therapy, many patients with haemophilia A develop neutralising alloantibodies against FVIII (2). The effectiveness of FVIII replacement therapy is compromised by the presence of these FVIII antibodies, making the patient more susceptible to bleeding symptoms and at higher risk of morbidity and mortality (3,4). In patients with severe haemophilia A (FVIII activity less than 1 IU/dL) who have not received prior treatment, antibodies develop in 25-35% of cases. Since 50% of the inhibitors are present after 14 to 15 days of exposure (EDs), the majority of the inhibitors develop during the first 50 EDs of FVIII replacement therapy (5).
Factor VIII inhibitors are polyclonal IgG antibodies known as coagulation factor inhibitors. They bind to and then neutralize procoagulant plasma proteins, inhibiting a variety of haemostasis assays depending on the specific factor affected. Depending on where the target factor is located within the coagulation cascade, the coagulation tests that show prolongation will vary. For instance, factor VIII will have an impact on the contact factor pathway, extending the activated partial thromboplastin time (APTT). In haemophilia treatment centres, inhibitors for patients with confirmed haemophilia will be more common, whereas acquired inhibitors would be more common in non-haemophilia treatment centres. Therefore, medium to large haematology laboratories may only see 1-2 cases annually (6). Acquired HA are caused by spontaneous onset, while the remaining cases are related to other diseases like rheumatoid arthritis, cancer, systemic lupus erythematosus or the postpartum period (7–10). Acquired HA antibodies are typically characterized by non-linear inactivation of FVIII following Type II kinetics (11), where FVIII can still be detected in vitro despite the presence of high titre antibodies.
In a haemophilia reference laboratory, the most observed are Factor VIII (FVIII) inhibitors for congenital haemophilia A (HA), factor IX (FIX) inhibitors for haemophilia B (HB), and occasionally FVIII inhibitors for acquired haemophilia inhibitors. Laboratories must be able to distinguish between different factor inhibitors and between factor inhibitors and other inhibitors. The more common lupus anticoagulants (LA) and anticoagulants such as heparin may resemble factor inhibitors in some laboratory tests.
Factor VIII inhibitors’ characteristics
Haemophilia inhibitors are typically polyclonal (8) and belong
primarily to the IgG class, although there are also cases of other immunoglobulin classes. IgG1 and IgG4 subclasses are typically present FVIII inhibitors. The precursor protein for factor VIII, which has an A1-a1-A2-a2-B-a3-A3-C1-C2 domain structure, is 330 kDa in size. After proteolytic processing, FVIII forms heterodimers with von Willebrand factor (vWF) in heavy chains (A1-a1-A2-a2) and light chains (a3-A3-C1-C2) linked by a metal ion interaction. Most FVIII inhibitors obtained bind to either the C1, C2 or A2 domains (12). The binding of FVIII to phospholipid and vWF is disrupted by anti-C2 antibodies, whereas the binding of FVIII to factor X and factor IXa is impaired by antibodies against A2 and A3, like other IgG4 antibodies, FVIII inhibitors do not fix complement or create precipitating complexes in gels (13).
Genetic factors have a significant impact on the risk of developing inhibitors. Large deletions, nonsense mutations and inversions have a higher risk than missense mutations, small deletions or splice site mutations, according to studies. A codependent genetic variable, the individual’s MHC phenotype, controls whether an immune response is mounted against the portion of the FVIII molecule that is recognized as foreign in people with the severe form of haemophilia (14), Intensive treatment durations have been associated with a higher risk of developing inhibitors in patients with severe HA who have not received prior treatment. Patients with mild or moderate forms of HA occasionally develop inhibitors (15). The rate of inhibitor formation may also be influenced by the type of FVIII concentrate administered and by switching between FVIII concentrates (16).
First-order kinetics describes how most alloantibodies inactivate FVIII in direct proportion to their concentration; Type II or second-order kinetics describes how acquired inhibitors and autoantibodies exhibit a nonlinear pattern of inhibition (17). The kinetics diagrams in Figure 1 show how a type 1 alloantibody can linearly inactivate FVIII, ultimately leading to complete inhibition of FVIII activity. The type 2 antibody, on the other hand, has a rapid initial inactivation phase, which is followed by a slower equilibrium phase in which factor VIII is typically measurable. Detectable factor activity provides little or no protection against bleeding in vivo, although type 2 inhibitors typically do not completely inhibit factor VIII in vitro. Autoantibodies have type 2 kinetics and can bind to factor VIII to form complexes that may have some residual factor VIII activity, which makes accurately measuring a titre challenging.
The time-dependent property is used to distinguish an antilupus antibody (14,15) from factor VIII inhibitors with type 1 kinetics. A subnormal mixture test is a time that increases if
the measurement is repeated sometime later, indicating the presence of an inhibitor of factor VIII. However, the mixture test remains unchanged and indicates an anti-lupus antibody a more specific test should be carried out. (Screening test on dRVVT, confirmatory test on dRVVT, testing for anticardiolipin antibodies and anti-beta2 glycoprotein I antibodies).
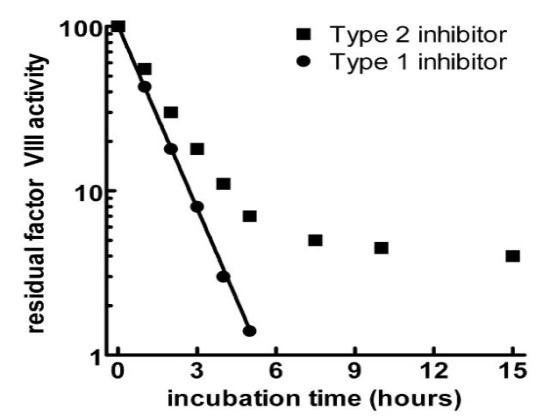
Laboratory tests show isolated prolonged activated partial thromboplastin time (APTT) and decreased FVIII activity (FVIII: C) in patients with AHA. Factor VIII inhibitors result in prolonged APTT; to rule out the possibility of a coagulation factor deficiency, a mixed test is carried out with a pool of normal pooled plasma (NPP) in a 1:1 ratio. The APTT is corrected when there is a coagulation factor deficiency. However, if the APTT is not corrected, it indicates the presence of a lupus-type inhibitor or an inhibitor against a coagulation factor (FVIII, FIX and FXI). Most inhibitors show a progressive mode of inhibition, so it is interesting to make two measurements in one time interval. It should be noted that type 2 inhibitors may show correction of APTT.
Specific assay
Two tubes are used, a test tube and a control tube Figure 2. The methods for determining inhibitors have been modified several times to improve the sensitivity and specificity of the methods. Considering the factors that can inactivate factor VIII or alter the inhibitor-factor VIII interaction, pH, temperature and incubation time are among the most frequently studied factors. Since Biggs et al publication of the Oxford method (20), which uses factor VIII concentrates, which gives a very significant variation in antibody title, to address this problem, Kasper et al used the plasma pool of NPP and imidazole as a control and was named Bethesda Method (21). Then the Nijmegen method appeared to overcome the lack of sensitivity through two modifications: 1) NPP buffering and 2) use of deficient factor VIII plasma in the control tube (22). Bert Verbruggen et al (23) have developed a highly sensitive method whose sensitivity is increased tenfold after ultracentrifugation and using a volume three times the NPP volume. Albumin can also be used as a control sample in conjunction with substrate plasma containing von Willebrand to reduce testing costs (24) Plasma samples can be heated to 56°C for 30 minutes prior to testing to destroy any endogenous FVIII present without affecting FVIII antibodies (25). Heat inactivation of samples eliminates the need to pre-test each sample for FVIII. If the test is performed with FVIII present in the sample, which the case is often with acquired HA, a simple arithmetic correction to the residual values can be made before reading the corrected titre (Equation 1) where Rc Residual activity correction, F factor VIII pre-test, D dilution factor. The Nijmegen ultra-sensitive Bethesda Assay (NusBA) for the detection of very low-titre inhibitors, is an NBA modification that changes the patient to normal pooled plasma ratio from 1:1 to 9:1 (26). Table 1 shows the different variants of the Bethesda methods.
Titre calculations can be determined from the standard chart (Figure 3) or preferably read from tables created in a spreadsheet to make readings more consistent and less prone to error. In the mathematical representation of the graph (Equation 2). By definition, 1 BU inhibitor is what inhibits 50% of the FVIII in a normal pool. There are several methods for determining the inhibitory titre: 1/First dilution with residual activity(RA) >25%(27), 2/Mean value of all titres with residual activities between 25% and 75%(17), 3/Mean value of all titres with residual activities between 25% and 75%(17), 4/Semi -Log(y) diagram: residual activities (25%-75%) vs. dilutions, Titre calculation with dilution, which results in a residual activity of 50% through interpolation(22). The first two methods have limitations related to the type 2 antibody compared to the theoretical kinetic model, especially when we have a plateau of more than 25%, which does not correspond to the true inhibitory value.
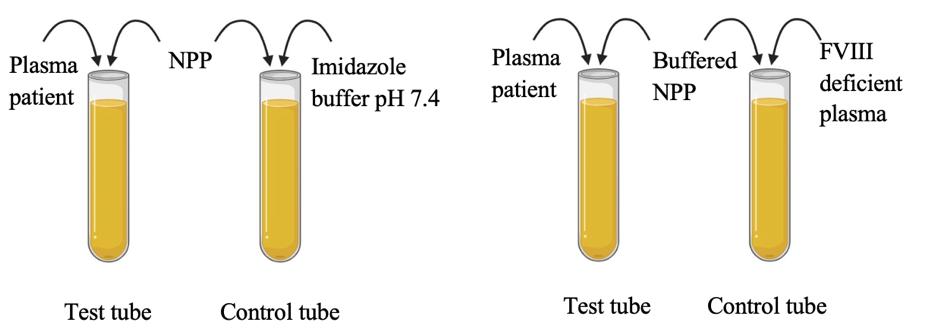
Table 1. Demonstrates diverse versions of the Bethesda methods
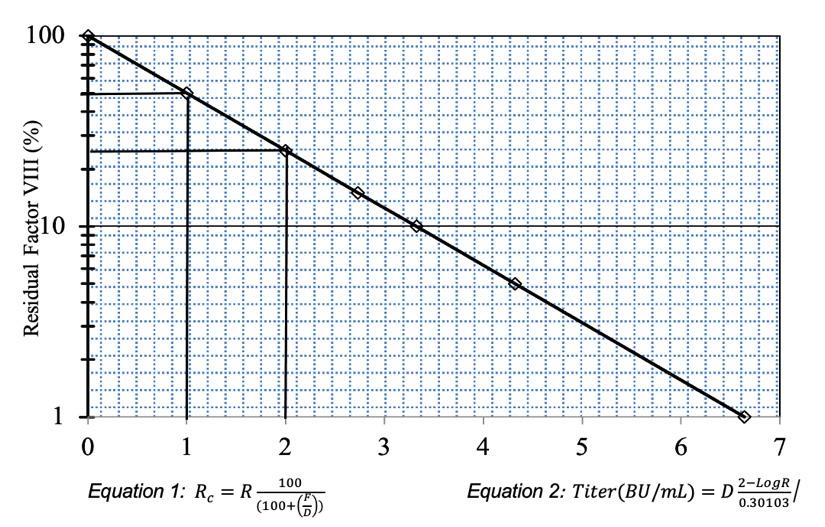
Figure 3. Reference graph for determining residual factor VIII. 1 BU/mL corresponds to 50% of residual activity
Chromogenic assay
Certain limitations apply to inhibitor assays that use factor assays with clot formation as an endpoint. Unfractionated heparin (UFH) from central lines or ports may prevent the formation of a fibrin clot, although this depends on a number of other factors (28), LA and nonspecific anticoagulants. Nevertheless, 26% of samples with 0.5–1.9 NBU did not show anti-FVIII antibodies or react in chromogenic Bethesda assay, suggesting that the observed inhibition was not FVIII specific and the test results were false positive (29). Chromogenic tests, which are used in inhibitor assays, are thought to be more costly than clotting tests, but they may reduce the number of false-positive results, which in turn reduces the need for follow-up care and additional testing. Assay expenses resulting from chromogenic test kit modifications, such as packaging adjustments or verification of the reagents’ capacity to be frozen, can be on par with or lower than those associated with clotting reagents (30).
Emicizumab and laboratory assays
Emicizumab is a genetically engineered, human-like antibody that exhibits FVIII-like properties and is now widely prescribed as the primary preventive treatment. All assays involving human FIX(a) and FX(a) are significantly affected by Emicizumab. At sub-therapeutic levels, the drug has a notable effect on shortening the APTT, causing it to fall within or below the normal reference range.
The efficacy of APTT-based assays in determining activated protein C resistance (APC-R) and Protein S is affected (31). The long half-life of Emicizumab may continue to exhibit interference with APTT after discontinuation of treatment. For prothrombin time and fibrinogen (Van Claus method) assay is not affected by the presence of Emicizumab. The chromogenic technique for measuring patients who are administered Emicizumab shows variations based on the origin of the reagents used, specifically whether they are sourced from humans or animals. The employment of a reagent kit that is human recombinant causes interference with Emicizumab, resulting in an overestimated residual factor VIII value as shown by Nougier et al (32). At present, there are no other viable options to chromogenic assays that incorporate bovine FX for precisely measuring FVIII levels in individuals receiving Emicizumab therapy. During Emicizumab treatment, it may be necessary to screen and measure FVIII inhibitors. In order to perform the Bethesda assay, pre-analytical heat inactivation methods are commonly employed to deactivate any remaining FVIII. However, it is important to note that these methods are not entirely effective in eliminating Emicizumab from the sample. When assessing FVIII inhibitor levels, it is advisable to utilize chromogenic assays (CSA) with bovine components. To maintain a consistent approach in monitoring and testing, it is crucial to measure the patient’s FVIII inhibitor titre in a pretreatment sample using CSA method.
Patients receiving treatment for a bleeding episode or receiving prophylactic or ITI therapy may have constant circulation of FVIII. Unless a relatively high-titre inhibitor is present, failing to account for this factor in the performance of the BA or NBA may result in a false-negative test by causing RA to be 100%, leading to an NBU of 0. According to Boylan and Miller (25) There are results showing that a temperature of 56°C is optimal, but a higher temperature affects the activity of the antibody. Other authors have reported that 58°C for 30 minutes showed a consistent reduction of FVIII: C < 1 IU/dL without apparently affecting inhibitor detection (33). De Lima et al (34) studied 46 severe haemophilia A patients divided into three groups according to their history of exposure to factor VIII and the presence of inhibitors in the past After applying the heat treatment, samples from six of the 21 patients who had previously tested negative became positive, An even more significant difference between
the mean results of the heated and non-heated samples was observed in the third group of patients who underwent ITI.
There are variations in FVIII-deficient preparation methods, immunodepletion, and chemical preparation methods. Verbruggen et al in immunodepleted FVIII have shown a discrepancy in results and have attributed this difference to the composition of the von Willebrand factor (VWF). Stago plasma and Biopool plasma were <0.05 U/ml and >0.80 U/ml, respectively (35). Shi et al (36) showed that VWF exerted a protective effect both in vivo and in vitro by reducing the inactivation of FVIII inhibitor, as shown. These authors found that when inhibitor samples were incubated with recombinant human FVIII in the absence of VWF, there was lower residual FVIII activity than in the presence of VWF, resulting in apparently higher inhibitor titres (37). For chemically depleted plasma using EDTA or oxalate (38). Some chemically depleted plasma samples may contain inactive FVIII fragments, which could represent antigenic sites for FVIII antibodies present in the test plasma, explaining false negative inhibitor results (39). It is likely that some FV becomes active while the deficient plasma is being restored or purified.
Interference of lupus anticoagulant
Lupus anticoagulants (LA) in the circulation prolong APTT clotting times, which can lead to problems with factor inhibitor assays and false-positive inhibitor titres (40). The simultaneous presence of an acquired FVIII inhibitor and LA is extremely rare, with fewer than 20 documented cases (41).
LA-insensitive APTT reagent can be used to largely neutralize the interference when performing factor assays for these factors or a Bethesda assay for inhibitors on samples with strong LA. An insensitive reagent contains high concentration phosphatidylserine, which masks the LA effect on the aPTT resulting in a normal result (42). In the PTT mixing study, LAs often act as immediate inhibitors with no correction at 0 min, whereas FVIII autoantibodies usually exhibit temperature and time-dependent inhibition. Because FVIII is bypassed in the diluted Russell viper venom (dRVVT) method, which is unaffected by these inhibitors, it can be used to confirm the presence of LA in a sample. The chromogenic assay for factor VIII and also the incorporation of immunologic tests into the clinical toolkit have the capacity to induce a paradigm shift in the management of inhibitors by offering a more comprehensive depiction of the immune response as shown by Rampersad et al (43).
Although they are uncommon, coagulation factor inhibitors can have a serious negative impact on health. There are now several laboratory tests available to identify and classify haemophilia inhibitors. Understanding how inhibitors impact different laboratory assays and being aware of the drawbacks and restrictions of the assays are necessary for the laboratory detection of inhibitors, particularly when separating FVIII inhibitors from Lupus anticoagulants.
The authors declare that they have no conflicts of interest concerning this article.
Hamza Siyar, PhD, Medical Resident1 Hassane Mamad, Assistant Professor1 Imane el Omari, PhD, Medical Resident1 Souad Benkirane, Professor1, 2
Azlarab Masrar, Professor, Head of Department of Haemotology1, 2
1 Department of Hematology, Ibn Sina Hospital, University of Mohammed V Souissi, Rabat, Morocco
2 Faculty of Medicine and Pharmacy, University of Mohammed V Souissi, Rabat, Morocco
Correspondence: Siyar Hamza, Department of Hematology, Ibn Sina Hospital, University of Mohammed V Souissi, Rabat, Morocco.
Email: hamza_siyar@um5.ac.ma
1. Iorio A, Stonebraker JS, Chambost H, et al. Establishing the prevalence and prevalence at birth of haemophilia in males: a meta-analytic approach using national registries. Ann Intern Med 2019; 171(8): 540-546.
2. Tiede A, Collins P, Knoebl P, et al. International recommendations on the diagnosis and treatment of acquired haemophilia A. Haematologica 2020; 105(7): 1791-1801.
3. Zwagemaker AF, Gouw SC, Jansen JS, et al. Incidence and mortality rates of intracranial hemorrhage in haemophilia: a systematic review and meta-analysis. Blood 2021; 138(26): 2853-2873.
4. Hassan S, Monahan RC, Mauser-Bunschoten EP, et al. Mortality, life expectancy, and causes of death of persons with haemophilia in the Netherlands 2001-2018. J Thromb Haemost. 2021; 19(3): 645-653.
5. Fischer K, Lassila R, Peyvandi F, et al. Inhibitor development in haemophilia according to concentrate. Four-year results from the European HAemophilia Safety Surveillance (EUHASS) project. Thromb Haemost 2015; 113(5): 968975.
6. Arslan DE, Demirci Z, Yılmaz U, et al. Acquired haemophilia a in adults: a multicenter study from Turkey. Indian J Hematol Blood Transfus 2023; 39(1): 107-115.
7. Seethala S, Gaur S, Enderton E, Corral J. Postpartum acquired haemophilia: a rare cause of postpartum hemorrhage. Case Rep Hematol 2013; 2013: 735715.
8. Tang Q, Liao J, Xie X. Acquired haemophilia associated with rheumatic diseases: a case-based systematic review. J Inflamm Res 2022; 15: 4385-4393.
9. Cao XY, Li MT, Zhang X, et al. Characteristics of acquired inhibitors to factor VIII and von Willebrand factor secondary to systemic lupus erythematosus: experiences from a chinese tertiary medical center. J Clin Rheumatol 2021; 27(5): 201-205.
10. Yang F, Zhou YS, Jia Y. Systemic lupus erythematosus with acquired haemophilia A: a case report. Beijing Da Xue Xue Bao Yi Xue Ban 2018; 50(6): 1108-1111.
11. Franchini M, Favaloro EJ, Lippi G. Mild haemophilia A. J Thromb Haemost 2010; 8(3): 421-432.
12. Alice DMa, Carrizosa D. Acquired factor VIII inhibitors: pathophysiology and treatment. Hemotology Am Soc Hematol Educ Program 2006; 432-437.
13. Nilsson IM, Berntorp E, Zettervall O, Dahlbäck B. Noncoagulation inhibitory factor VIII antibodies after induction of tolerance to factor VIII in haemophilia A patients. Blood 1990; 75(2): 378-383.
14. Gunasekera D, Vir P, Karim AF, Ragni MV, et al. Haemophilia A subjects with an intron-22 gene inversion mutation show CD4+ T-effector responses to multiple epitopes in FVIII. Front Immunol 2023; 14: 1128641.
15. Pediatric Hematology-Oncology Working Group of the Indonesian Pediatric Society. FVIII inhibitor surveillance in children with haemophilia A in Indonesia: a report from the Indonesian Pediatric Hematology-Oncology Working Group. Blood Res 2022; 57(4), 272-277.
16. Mathias M, Abashidze M, Abraham A, et al. Long-term immunogenicity, efficacy and tolerability of simoctocog alfa in patients with severe haemophilia A who had completed the NuProtect study in previously untreated patients. Haemophilia 2023; 1005-1012.
17. Ketteler C, Ingrid H, Simon D, et al. Impact of different factor
VIII inhibitor kinetic profiles on the inhibitor titre quantification using the modified Nijmegen-Bethesda assay. Res Pract Thromb Haemost 2022; 6(8): e12799.
18. Rasool ZS, Tiwari V. Biochemistry, lupus anticoagulant. [Updated 2023 Jul 17]. In: StatPearls [Internet]. Treasure Island (FL): StatPearls Publishing; 2023 Jan-. Available from: https://www.ncbi.nlm.nih.gov/books/NBK544357/.
19. Simanek R, Panzer S, Lechner K, Pabinger I. Late spontaneous remissions in severe adult autoimmune thrombocytopenia. Ann Hematol 2007; 86(10): 705-710.
20. Biggs R, Bidwell E. A method for the study of antihaemophilic globulin inhibitors with reference to six cases. Br J Haematol 1959; 5:379-395.
21. Kasper CK, Aledort L, Aronson D, et al. Proceedings: a more uniform measurement of factor VIII inhibitors. Thromb Diath Haemorrh 1975; 34(2): 612.
22. Verbruggen B, Novakova I, Wessel, et al. The Nijmegen modification of the Bethesda assay for factor VIII:C inhibitors: improved specificity and reliability. Thromb Haemost 1995; 73(2): 247-251.
23. Verbruggen B, Waander L, Ewald M, Irena Novakova. The Nijmegen low-titre factor VIII inhibitor assay: a highly sensitive assay for the detection of low-titre factor VllhC Inhibitors. [PDF hosted at the Radboud Repository of the Radboud University Nijmegen] 2003; 7: 100-112.
24. Verbruggen B, van Heerde W, Novákovà I, Lillicrap D, Giles A. A 4% solution of bovine serum albumin may be used in place of factor VIII:C deficient plasma in the control sample in the Nijmegen Modification of the Bethesda factor VIII:C inhibitor assay. Thromb Haemost 2002; 88(2): 362-364.
25. Boylan B, Miller CH. Effects of pre-analytical heat treatment in factor VIII (FVIII) inhibitor assays on FVIII antibody levels. Haemophilia 2018; 24(3): 487-491.
26. Valke LLFG, Verhagen MJA, Mulders BTPM, et al. The Nijmegen ultra-sensitive Bethesda assay detects very lowtitre factor VIII inhibitors in patients with congenital and acquired haemophilia A. Thromb Res 2023; 231: 112-120.
27. Miller CH. Specific factor inhibitor testing. Transfusion Medicine and Hemostasis. 2nd ed. Elsevier, 2019: 789-792.
28. Wehner JE, Boehne M, David S, et al. Activated clotting time (ACT) for monitoring of low-dose heparin: performance characteristics in healthy adults and critically ill patients. Clin Appl Thromb Hemost 2020; 26. doi: 1076029620975494.
29. Miller CH, Rice AS, Boylan B, et al. Comparison of clot-based, chromogenic and fluorescence assays for measurement of factor VIII inhibitors in the US Haemophilia inhibitor Research Study. J Thromb Haemost 2013; 11(7): 1300-1309.
30. Kitchen S, Blakemore J, Friedman KD, et al. A computerbased model to assess costs associated with the use of factor VIII and factor IX one-stage and chromogenic activity assays. J Thromb Haemost 2016; 14(4): 757-764.
31. Adamkewicz JI, Chen DC, Paz-Priel I. Effects and interferences of Emicizumab, a humanised bispecific antibody mimicking activated factor VIII cofactor function, on coagulation assays. Thromb Haemost 2019; 119(7): 10841093.
32. Nougier C, Jeanpierre E, Ternisien C, et al. Emicizumab treatment: Impact on coagulation tests and biological monitoring of haemostasis according to clinical situations (BIMHO group proposals). Eur J Haematol 2020; 105(6): 675-681.
33. Batty P, Hart DP, Platton S. Optimization of pre-analytical heat treatment for inhibitor detection in haemophilia A. Int J Lab Hematol 2018; 40(5): 561-568.
34. de Lima Montalvão SA, Tucunduva AC, de Almeida Sambo AL, et al. Heat treatment of samples improve the performance of the Nijmegen-Bethesda assay in haemophilia A patients undergoing immune tolerance induction. Thromb Res 2015; 136(6): 1280-1284.
35. Verbruggen B, Giles A, Samis J, Verbeek K, Mensink E,
Novákovà I. The type of factor VIII deficient plasma used influences the performance of the Nijmegen modification of the Bethesda assay for factor VIII inhibitors. Thromb Haemost 2001; 86(6): 1435-1439.
36. Shi Q, Kuether EL, Schroeder JA, et al. Factor VIII inhibitors: von Willebrand factor makes a difference in vitro and in vivo. J Thromb Haemost 2012; 10(11): 2328-2337.
37. Pouplard C, Desconclois C, Sobas F, et al. Does the presence of von Willebrand factor in FVIII-deficient plasma influences the measurement of FVIII inhibitor titres in haemophilia A patients? Int J Lab Hematol 2015; 37(1): 125-132.
38. Chantarangkul V, Ingram GI, Thorn MB, Darby SC. An artificial ‘haemophilic’ plasma for one-stage factor-VIII assay. Br J Haematol 1978; 40(3): 471-488.
39. Giles AR, Verbruggen B, Rivard GE, et al. A detailed comparison of the performance of the standard versus the Nijmegen modification of the Bethesda assay in detecting factor VIII:C inhibitors in the haemophilia A population of Canada. Association of Haemophilia Centre Directors of Canada. Factor VIII/IX Subcommittee of Scientific and Standardization Committee of International Society on Thrombosis and Haemostasis. Thromb Haemost 1998; 79(4): 872-875.
40. Ames PR, Graf M, Archer J, Scarpato N, et al. Prolonged activated partial thromboplastin time: difficulties in discriminating coexistent factor VIII inhibitor and lupus anticoagulant. Clin Appl Thromb Hemost 2015; 21(2): 149154.
41. Jacobs JW, Gisriel SD, Iyer K, Rinder HM. Concomitant factor VIII inhibitor and lupus anticoagulant in an asymptomatic patient. J Thromb Thrombolysis 2022; 53(4): 945-949.
42. Brancaccio V, Ames PR, Glynn J, Lannaccone L, Mackie IJ. A rapid screen for lupus anticoagulant with good discrimination from oral anticoagulants, congenital factor deficiency and heparin, is provided by comparing a sensitive and an insensitive APTT reagent. Blood Coagul Fibrinolysis 1997; 8(3): 155-160.
43. Rampersad AG, Boylan B, Miller CH, Shapiro A. Distinguishing lupus anticoagulants from factor VIII inhibitors in haemophilic and non-haemophilic patients. Haemophilia 2018; 24(5): 807-814.
Copyright: © 2024 The author(s). This is an open-access article distributed under the terms of the Creative Commons Attribution License, which permits unrestricted use, distribution, and reproduction in any medium, provided the original author(s) and source are credited.

Andrew W Soepnel
Objectives: To evaluate the agreement between NOVA View single-well titre (SWT) function for antinuclear antibody (ANA) testing and manual fluorescence microscopy, and to evaluate any benefits post-implementation.
Methods: ANA endpoint titres as determined by traditional serial dilution (ET) and as estimated by SWT were recorded for nine months of routine testing at Pathlab. Agreement between ET and SWT was calculated for each ANA pattern, and at each SWT value for the more commonly encountered patterns. Acceptance criteria (80% agreement at ±1 dilution, 100% agreement at ±2 dilutions) were applied to determine in which cases SWT would be fit to replace ET during routine testing at Pathlab. A post-implementation review calculated the proportion of reagents saved and turnaround time reductions.
Results: Agreement (±1 dilution) ranged from 87-100% for the patterns encountered. However, the 80% target was not met at all SWT values for the common patterns encountered (DFS-like, homogeneous plus cytoplasmic speckled or anti-mitochondrial-like, speckled, and centromere), except for monospecific homogeneous, which did meet the criteria at all SWT values.
Conclusions: Pathlab implemented restricted use of SWT for routine ANA testing, a first for a New Zealand diagnostic laboratory. SWT was authorised for use on monospecific homogeneous and dense fine speckled-like patterns of any SWT value, speckled patterns with SWT values of 1:80 or 1:160, centromere patterns with SWT values ≥1:1280, and homogeneous plus cytoplasmic speckled or anti-mitochondrial-like patterns with SWT values of 1:80 or 1:160. ET continues to be determined by serial dilution in all other cases, and when the operator does not agree with the SWT suggestion based on their own estimation of the fluorescence intensity. Post-implementation, reagent consumption was reduced by 20%, and 55% of ANA-positive samples had a one-day reduction in turnaround time.
Keywords: antinuclear antibodies, automation, quantitation, indirect immunofluorescence
NZ J Med Lab Sci 2024; 78(2) 77-81
The indirect immunofluorescence assay using human epithelial cells (HEp-2 IFA) remains the reference method for antinuclear antibody (ANA) detection for patients with suspected connective tissue disease (CTD), autoimmune hepatitis, and juvenile idiopathic arthritis (1,2). However, HEp-2 IFA, being manually interpreted, is subject to both intra- and inter-laboratory reader variation, affecting both pattern recognition and endpoint titre (ET) determination (3,4). Automated ANA readers have provided a potential pathway towards harmonisation of results by reducing reader subjectivity. One aspect of this is automated ET determination based on fluorescence intensity measurement at a single screening dilution, which has the further benefit of reducing reagent usage and turnaround time by forgoing the need for serial dilution.
NOVA View (Werfen, San Diego, USA) is an automated ANA reader with “single-well titre” (SWT) functionality. This function produces an estimated ET based on the fluorescence intensity measured from an ANA-screen well in light intensity units (LIU). The calculation is performed by accompanying QUANTA Link middleware, and is only possible if the following conditions are met: a successful read by NOVA View at a 1:80 dilution, the result is positive, the LIU value is ≥16, only one ANA pattern is selected for the 1:80 dilution, and the selected pattern has an auto titre algorithm assigned in QUANTA Link configuration. QUANTA Link has five auto titre algorithms specific to each of the five ANA patterns that NOVA View can recognise automatically: homogeneous, speckled, nucleolar, centromere, and nuclear dots.
Pathlab provides clinical laboratory services for communitybased requestors throughout the Midlands region of New Zealand, excluding Tairāwhiti and Taranaki, in addition to four public hospitals located in Tauranga, Whakatāne, Rotorua, and Taupō. ANA testing is centralised to a single laboratory which performs 1000 ANA tests each month. The laboratory started using NOVA View to routinely read and report ANA results in January 2023 but continued to determine ET by dilution series rather than utilising SWT.
The goal of this study was to evaluate NOVA View SWT under
local configuration at Pathlab, with the intention of verifying SWT for use in place of ET determination by serial dilution. Benefits in terms of reduced reagent usage and faster turnaround times for positive samples would then be calculated.
Local ANA testing process
ANA samples were processed by a QUANTA-Lyser 3000 (Werfen, San Diego, USA) automated IFA processing platform under default configuration, using slides and reagents from the NOVA-Lite DAPI ANA Kit (Werfen, San Diego, USA). Slides were evaluated by a combination of NOVA View (Werfen, San Diego, USA) with software version 2.0.5.2, and manual immunofluorescence microscopy (Axio Lab A1, Zeiss, Carl Zeiss AG, Oberkochen, Germany). NOVA View was operated per manufacturer instructions and default configuration, including a positivity threshold of 48 LIU.
Serum samples were run at a screening dilution of 1:80. Positive samples were further diluted on the next working day at one (if very weakly positive) or two doubling dilutions, up to 1:1280, until ET was determined or otherwise reported as >1:1280.
NOVA View functioned as the first reader, followed by a nonblinded manual second read by a certified operator. Manual reading was facilitated by the QUANTA Link “Review” screen. NOVA View digital images and interpretation were displayed during analysis of each well during this process, and although they were checked for consistency, the manual microscope was the primary image-source for manual reading. If in agreement with NOVA View interpretation, the second reader validated negative results or added further dilutions to samples that screened positive. If in disagreement with NOVA View interpretation, the second reader altered the result and flagged it for review in QUANTA Link. A second certified operator performed third reading of any disagreements, considering both NOVA View and second reader-suggested results (visible via QUANTA Link audit trail). If no consensus was reached, the interpretation was escalated to the immunology service lead or immunopathologist.
QUANTA Link was custom configured with all ANA patterns reported by the laboratory, which are aligned with the. Auto titre d International Consensus on Antinuclear Antibody Patterns (ICAP) (www.anapatterns.org). This allowed interfaced reporting of patterns additional to the five recognised by NOVA View patterns, a configuration not validated by the manufacturer: the homogeneous auto titre algorithm was assigned to nuclear dense fine speckled (DFS-like) pattern; nuclear dots were assigned to few nuclear dots and multiple nuclear dots patterns; speckled was assigned to NuMA-like and nuclear envelope patterns.
While unable to distinguish between subclasses of cytoplasmic patterns, NOVA View does automatically comment when cytoplasmic staining is detected. The comment field is not part of the exported result string, so cytoplasmic patterns were assigned and validated by the second and third readers. The Pathlab QUANTA Link-to-laboratory information system (LIS) interface required cytoplasmic patterns to be appended to a 1:40 dilution in QUANTA Link, to have only cytoplasmic patterns display on the final report with no associated endpoint titre. This unusual configuration consequently allowed for an ANA pattern to be assigned an SWT value, even if accompanied by a cytoplasmic pattern.
Commercial negative and homogeneous pattern controls from the test kit were run at the start of each batch, in addition to one of several pre-characterised in-house patient serum pattern controls at the end of each batch. The negative control was run undiluted, while the homogeneous commercial control was run at a 5x dilution, and the in-house controls were run at specific pre-determined endpoint dilutions.
Study design
After the ANA pattern was finalised by the above process, routine ANA screen results with SWT estimate available were recorded over a nine-month period. Data collection occurred most days, with some missed at random if the study lead was unavailable. Endpoints determined by SWT and ET were compared, and agreement calculated (at ±1 dilution and ±2 dilutions) for each ANA pattern encountered. Agreements were then calculated at each SWT value for each of the more commonly encountered patterns. The number of samples required for verification was flexible depending on the level of agreement observed; but generally, at least 30 results were required for further analysis of a pattern to be considered. To further analyse trends, the number and proportion of results at each possible SWT value were categorised by the number of doubling-dilutions difference between SWT and ET results (SWT minus ET).
The generally accepted variation of end-point titre reading in a manual evaluation setting is ±1 doubling dilution. Following consultation with an immunopathologist, a realistic target of 80% agreement within ±1 dilution was set to allow implementation of SWT for a particular ANA pattern at Pathlab, with the additional requirement that no results differ by more than two dilutions i.e. 100% agreement at ±2 dilutions (some allowances made if the only disagreement was SWT over-reading, as opposed to underreading). Effects on reagent usage and turnaround time were calculated based on one week of SWT use in routine testing.
This study was exempt from HDEC review per the Health and Disability Ethics Committees’ screening questionnaire.
Basic agreement between SWT and ET for each ANA pattern satisfied the acceptance criteria for homogeneous, homogeneous plus cytoplasmic speckled or anti-mitochondrial (AMA)-like, DFSlike, and speckled patterns (Table 1). Agreement was similar for DFS-like patterns, whether the presence of anti-DFS70 IgG was subsequently confirmed or not. These two groups were combined into a single “DFS-like” group for further analysis. Patterns with less than 30 data points were excluded from further analysis, except for a limited evaluation of centromere.
Agreement between SWT and ET for each ANA pattern satisfied the criteria at all SWT values for monospecific homogeneous patterns (Table 2), at SWT values <1:320 for homogeneous plus cytoplasmic speckled or AMA-like patterns (Table 3), at SWT values ≤1:320 for DFS-like patterns (Table 4), at SWT values <1:320 for speckled patterns (Table 5), and at SWT values ≥1:1280 for centromere patterns (Table 6).
Table 1. Simple agreement between SWT and ET for each ANA pattern encountered.
Monospecific patterns
(DFS70IgG negative)
(DFS70IgG detected)
patterns
plus cytoplasmic speckled or AMA-like
Speckled plus cytoplasmic speckled or AMA-like
Multiple nuclear dots plus cytoplasmic speckled or AMA-like
Table 2. Agreement between SWT and ET at each possible SWT value for samples with a monospecific homogeneous pattern. Homogeneous SWT value Results
Table 3. Agreement between SWT and ET at each possible SWT value for samples with a homogeneous plus cytoplasmic speckled or AMA-like pattern.
Homogeneous plus cytoplasmic speckled or AMA-like
SWT value
with ET (±1 dilution)
dilutions) 80 23 100%
Post-implementation audit
HEp-2 well usage decreased by 20%. SWT was used, forgoing the need for further dilutions, in 55% of positive ANA screen tests.
Table 4. Agreement between SWT and ET at each possible SWT value for samples with a DFS-like pattern.
with ET (±2 dilutions)
Based on this evaluation, Pathlab implemented restricted use of SWT for ANA endpoint titre determination for patient samples in late 2023. SWT suggestions are only validated if the value aligns with the operator’s impression of the fluorescence intensity of the well, and only in the following cases: monospecific homogeneous and DFS-like patterns of any SWT value, speckled patterns with SWT values of 1:80 or 1:160, centromere patterns with SWT values ≥1:1280, and homogeneous plus cytoplasmic speckled or AMA-like patterns with SWT values of 1:80 or 1:160. ET continues to be determined by serial dilution in all other cases. Agreement between SWT and ET for DFS-like patterns was less than 80% in samples with an SWT value >1:1280, and insufficient high-titre DFS-like samples were included in the study. However, a ±1 dilution disagreement at a titre-level greater than 1:640 is unlikely to be of clinical relevance because the result is clearly positive either way. Furthermore, for DFS-like patterns, the laboratory reflexes ENA screen and anti-dsDNA antibody testing regardless of the ANA titre.
Table 5. Agreement between SWT and ET at each possible SWT value for samples with a speckled pattern.
Speckled
Table 6. Agreement between SWT and ET at each possible SWT value for samples with a centromere pattern.
Centromere
Risks and limitations associated with SWT have been previously identified, some of which were apparent in this evaluation (5). A very high titre antibody may be masked at the screening dilution due to prozone effect. Prozone was encountered in one case during the current study (0.1% of samples), comparable with the 0.7% reported in a similar study by Van Hoovels et al. (5). The laboratory considered this low-risk due to the infrequent occurrence and because, with all samples still being read by manual microscopy, an experienced operator may still recognise the signs of prozone at the screening dilution, triggering the serial dilution process instead of relying on SWT. Furthermore, while the singular case encountered here led to a three-fold under-read of the titre by SWT, the positive ANA result was not missed entirely, still returning an SWT value of 1:320. Secondly, use of NOVA View SWT for mixed nuclear and cytoplasmic patterns is not supported by the manufacturer and has not been previously published. Cytoplasmic overlay could cause NOVA View to over-estimate the endpoint titre, and this is a possible explanation for the right-hand skew seen in Figure 2. However, the impact appears to be minimal if the fluorescence is low, as in the cases with SWT values <1:320 (Table 3). In a single case, a cytoplasmic pattern only detected by NOVA View was associated with a three-dilution over-read of a homogeneous pattern by SWT. As a precaution, the laboratory introduced a further stipulation for SWT use: always perform ET by serial dilution if NOVA View detects a cytoplasmic pattern that is not interpreted as positive by the operator. Finally, a component of a mixed ANA pattern may be masked at the screening dilution if another pattern is present in high titre. No such masking was encountered in this study. Therefore, the laboratory determined that the risk is sufficiently low in the population currently serviced. If the population serviced were to change, such as the laboratory taking on additional work from a population with higher disease prevalence, this risk would need to be reassessed.
Implementation of SWT under the conditions above has accounted for a 20% decrease in HEp-2 slide and associated reagent consumption at Pathlab, and same-day turnaround time is now achieved for 55% of positive ANA screens (normally two working days). Local factors such as ANA positivity rate, the number of wells used for screening and titration, as well as any limitations applied to SWT use, would influence these outcomes when implementing NOVA View SWT at another laboratory. The stipulation “accept SWT estimate if the value aligns with the operator’s impression of the fluorescence intensity of the well” is the predominant reason for SWT not being utilised in the remaining 45% of positive cases at Pathlab.
Studies using smaller sets of well-characterised samples have reported excellent agreement between NOVA View SWT and
ET determination by serial dilution (6,7). The sample set used by Copple et al included 37 ANA-positive samples resolved into disease cohorts (6). Agreement between NOVA View SWT and ET by serial dilution was 100% (±1 titre) for each patient cohort. Van den Bremt et al. sent 3 well-characterised, hightitre ANA samples to 10 laboratories using NOVA View (7). They reported excellent inter-laboratory agreement in terms of fluorescence intensity and SWT value, as well as agreement with ET determined by serial dilution at the same laboratories. These studies support the use of NOVA View SWT, however they do not reflect SWT use under routine diagnostic laboratory conditions.
Previous studies on NOVA View SWT agreement with ET determination by serial dilution using large sample sets, similar to the present evaluation, have not resolved data by each possible titre value, opting instead to analyse overall agreement for each ANA pattern, similar to Table 1 (5,8). Where results can be compared between the current and previous studies, they are generally consistent. The tendency for SWT to over-estimate the ET value more often than under-estimating it is illustrated in Figures 1-4, and a similar trend was observed by Van Hoovels et al. across all four laboratories included in the study, suggesting the trend is site-independent (5). In their study, 36% of cases were over-estimated by SWT by 1 titre across the homogeneous, speckled, centromere, and nucleolar pattern groups evaluated. Across the same pattern groups in the current study, 33% of cases were overestimated by SWT by 1 titre.
Overall agreement was consistent with the data from both Van Hoovels et al. and Zheng et al , except for a greater proportion of >1 titre-level disagreements seen in the Pathlab speckled pattern group (5,8). Zheng et al reported 98.4% agreement between NOVA View SWT and ET by serial dilution for speckled patterns, compared to 87% seen at Pathlab (8). They also reported a higher proportion of speckled patterns, at a rate of 1.2 for everyone homogeneous pattern, compared to the current study which saw only 0.35 speckled patterns for every one homogeneous. One possible explanation for this is a difference in the prevalence of speckled ANA in the New Zealand population compared to Chinese or Belgian populations. However, there is also a difference in methodology between the three studies. Zheng et al assessed raw NOVA View pattern decisions, Van Hoovels et al sent out samples with pre-defined ANA patterns, while the current study applied the auto titre algorithms to pattern decisions after an operator had checked, and potentially changed, the pattern assignment. Changing pattern assignment could result in NOVA View pattern-specific dilution curves being applied to patterns that were not intended by the manufacturer to be used together, leading to erroneous SWT values. Nevertheless, the current study was a local method verification, requiring SWT to be used as it is intended for routine samples. The identification of inadequate agreement for the specified array of pattern/titre combinations under local conditions, and the subsequent rules introduced to mitigate errors when in routine use, demonstrate the very purpose and success of this study.
Other ANA-reading platforms feature SWT functionality, and these have been subject to similar studies with various levels of agreement with ET reported. Ricchiuti et al. used relatively few samples (115 ANA-positive at 1:80), but provided a three-method comparison of titres determined by manual microscopy and two automated readers: EUROPattern (EUROIMMUN, L, Germany), and ANAFLUOR (DiaSorin, Stillwater, MN, USA) accompanied by end point determination by a PolyTiter system (Polymedc, Inc., Cortland Manor, NY, USA) (9). Overall agreement between PolyTiter and EUROPattern SWT was only 57.1% (±1 dilution), whereas EUROPattern SWT showed 100% agreement with manual microscopy (±1 dilution). This suggests there are viable alternatives to NOVA View, but thorough local verification should always be performed.
By removing some of the subjective visual interpretation introduced by human operators during ANA ET determination, NOVA View SWT is expected to improve the consistency and reproducibility of ANA results at Pathlab, as has been demonstrated in multiple laboratories using NOVA View SWT (7). However, variation between the same instruments at different laboratories has already been observed, and harmonisation between different manufacturers’ reagents and instruments cannot be improved unless they are first harmonised to each other (7, 10). No such inter-manufacturer standardisation exists for automated ANA-readers (11).
As this was a single-centre study, ET by serial dilution was assumed to be the ‘gold standard’. This method had been subject to regular successful assessment as part of external quality assurance programmes, and operators generally had >10 years’ experience. However, a multi-centre study with target ET determined by consensus would have added value by providing a more robust target result
To further investigate the relatively poor agreement seen with speckled patterns, and because additional data is required for speckled patterns at high titre, data collection will continue for this pattern group at Pathlab. Future data collection will include the sub-patterns (fine and coarse speckling), as this may reveal whether the auto titre algorithm is better suited to one sub-pattern over the other. Future data collection will also include both original NOVA View-suggested pattern and the final operatordetermined pattern and their corresponding SWT values, to investigate whether operator reassignment of patterns adversely affects NOVA View SWT accuracy.
Insufficient data was obtained during the study period to verify SWT for use with nucleolar patterns, and centromere patterns with SWT values <1:1280. The data collected showed a high level of agreement between SWT and ET (Table 1), suggesting the laboratory could ultimately verify SWT for use with these patterns. Data collection will continue until sufficient data is obtained.
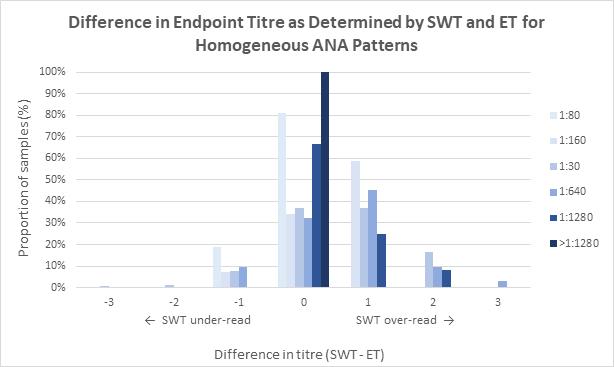
Figure 1: The proportion of samples with a monospecific homogeneous pattern per SWT value and the number of doubling-dilutions difference between endpoint titres determined by SWT and ET (SWT minus ET). SWT under/over-reading, relative to ET, is indicated
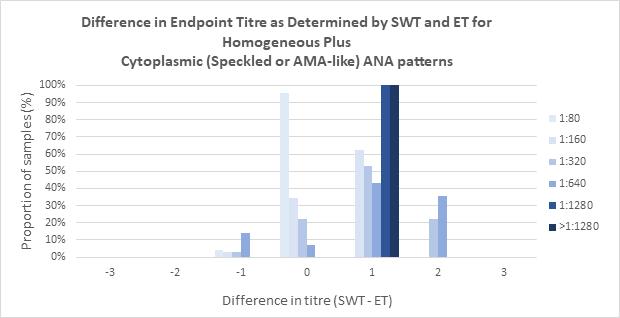
Figure 2. The proportion of samples with a homogeneous plus cytoplasmic speckled or AMA-like pattern per SWT value and the number of doubling-dilutions difference between endpoint titres determined by SWT and ET (SWT minus ET).
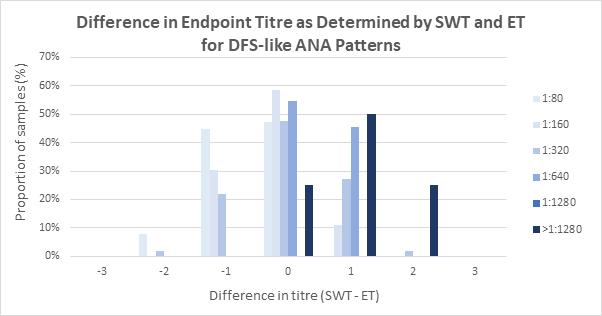
Figure 3. The proportion of samples with a DFS-like pattern per SWT value and the number of doubling-dilutions difference between endpoint titres determined by SWT and ET (SWT minus ET)
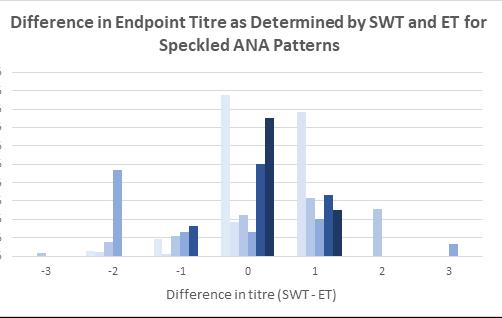
Figure 4. The proportion of samples with a speckled pattern per SWT value and the number of doubling-dilutions difference between endpoint titres determined by SWT and ET(SWT minus ET).
Although it had inadequate agreement with ET determination by serial dilution in some instances, NOVA View SWT was successfully implemented for the most common ANA patterns and titre levels encountered at Pathlab. This is the first time SWT functionality has been utilised for routine ANA testing in New Zealand.
Even in this limited capacity, SWT has benefitted the laboratory with reduced reagent use and turnaround times, in addition to being a step towards, and a means to, standardisation of ANA reading.
ACKNOWLEDGEMENTS
Tégan Hall for kindly reviewing this manuscript.
AUTHOR INFORMATION
Andrew W Soepnel, BMLSc, MSc, Service Lead: Immunology, Pathlab Waikato.
Correspondence: Andrew.Soepnel@pathlab.co.nz
1. Meroni PL, Schur PH. ANA screening: an old test with new recommendations. Ann Rheum Dis 2010; 69: 1420-1422.
2. Agmon-Levin N, Damoiseaux J, Kallenburg C, et al. International recommendations for the assessment of autoantibodies to cellular antigens referred to as antinuclear antibodies. Ann Rheum Dis 2014; 73: 17-23.
3. Soepnel A. A New Zealand based quality assurance programme for the indirect immunofluorescence antinuclear antibody assay on HEp-2 / HEp-2000 cells. The first year. N Z J Med Lab Sci 2020; 74: 119-125.
4. Van Blerk M, Van Campenhout C, Bossuyt X, et al. Current practices in antinuclear antibody testing: results from the Belgian External Quality Assessment Scheme. Clin Chem Lab Med 2009; 47: 102-108.
5. Van Hoovels L, Schouwers S, Van den Bremt S, et al. Analytical performance of the single well titer function of NOVA View: good enough to omit ANA IIF titer analysis? Clin Chem Lab Med 2018; 56: 258-261.
6. Copple S, Jaskowski T, Giles R, et al. Interpretation of ANA indirect immunofluorescence test outside of the darkroom using NOVA View compared to manual microscopy. J Immunol Res 2014; 2014: 149316.
7. Van den Bremt S, Schouwers S, Van Blerk M, et al. ANA IIF automation: moving towards harmonization? results of a multicentre study. J Immunol Res 2017; 2017: 603813
8. Zheng B, Li E, Zhu H, et al. Automated antinuclear immunofluorescence antibody analysis is a reliable approach in routine clinical laboratories. Clin Chem Lab Med 2017; 55: 1922-1930.
9. Ricchiuti V, Adams J, Hardy D, et al. Automated processing and evaluation of anti-nuclear antibody indirect immunofluorescence testing. Front Immunol 2018; 9: 927.
10. Van Hoovels L, Schouwers S, Van den Bremt S, et al. Variation in antinuclear antibody detection by automated indirect immunofluorescence analysis. Ann Rheum Dis 2019; 78(6): e48.
11. Wener M, Fink S, Bashleben C, et al. Long-term variability in immunofluorescence titer of antibodies to nuclear antigens observed in clinical laboratory proficiency testing surveys. Arch Pathol Lab Med 2021; 145: 937-942.
Copyright: © 2024 The author(s). This is an open-access article distributed under the terms of the Creative Commons Attribution License, which permits unrestricted use, distribution, and reproduction in any medium, provided the original author(s) and source are credited.
Husam Khalil, Kinda Touban, Raneem Mousa
Background: Recent studies have shown that subclinical inflammation may continue in Familial Mediterranean Fever even during symptom-free periods. Simple markers such as platelet/lymphocyte ratio, neutrophil/lymphocyte ratio, and red cell distribution width may be indicators of systemic subclinical inflammation. The current study aimed to investigate the possible correlation of each of the platelet/lymphocyte ratio, neutrophil/lymphocyte ratio, and red cell distribution width values with Familial Mediterranean Fever (FMF) and to determine which of these markers serves as the best indicator of subclinical inflammation in FMF patients.
Methods: A case-control study that included 63 individuals, aged between 20-47 years. Participants were distributed into a control group and a Familial Mediterranean Fever (FMF) patient group. A complete blood count and CRP titration were performed for all study participants.
Results The neutrophil/lymphocyte ratio (N/L ratio) in the Familial Mediterranean Fever patient group was significantly higher than in the control group (p<0.05). There was a statistically significant positive correlation (r=0.545, p<0.001) between the neutrophil/lymphocyte ratio and C-reactive protein in Familial Mediterranean Fever patients participating in this study. The neutrophil/lymphocyte ratio showed an area under the curve (AUC) of 0.9497 (95% CI, 0.881–1.019) with an excellent accuracy of test and a cut-off value of 1.65.
Conclusions: The neutrophil/lymphocyte ratio (N/L ratio) can be a reliable inflammatory marker in Familial Mediterranean Fever. The neutrophil/lymphocyte ratio (N/L ratio) is also a simple marker to determine subclinical inflammation because it can be obtained easily from a routine Complete blood count and does not require additional costs. Based on our results, an N/L ratio of 1.65 is considered diagnostic of subclinical inflammation. Subclinical inflammation occurs during attack-free periods and causes amyloidosis. We suggest that the N/L ratio can be useful as a predictor of the development of amyloidosis.
Keywords: Familial Mediterranean Fever, Subclinical inflammation, Neutrophil/lymphocyte ratio (N/L ratio), Platelet/lymphocyte ratio (P/L ratio), Amyloidosis.
NZ J Med Lab Sci 2024; 78(2): 82-86
Familial Mediterranean Fever (FMF) is an autosomal recessive disorder primarily occurring in populations of the eastern Mediterranean region, especially the Turkish population, Jewish population, Arabic population, and Armenian population. It is the most common genetic autoinflammatory disease (1). The frequency of FMF in any location depends on the ethnic background of the population (2). In Armenian people (based on epidemiology among Armenian populations in Lebanon and southern California), the estimated prevalence of FMF is 1 case per 500 population, with a gene frequency of 1 per 7 (2). Turkish people may have a prevalence of approximately 1 case per 1000 population (3). Arabic people may have a prevalence of 1 case per 2600 population in children and a gene frequency of 1 per 50 (2). The disease is caused by a gain-of-function mutation in the MEFV gene, located on chromosome 16, which encodes a protein called pyrin. Pyrin is commonly expressed by neutrophils as well as other cells belonging to the innate immune system like monocytes, eosinophils and dendritic cells. FMF patients experience short and irregular recurrent episodes of fever, which may be accompanied by polyserositis, arthritis, vasculitis, dermal manifestations, and long-term complications, mainly renal. The episodes are self-limiting, lasting 12 to 72 hours, and the interval between the attacks is highly variable, ranging from weeks to years (1). The current management of the disease is based on colchicine. It has been demonstrated that its role in suppressing excessive monocyte activation is useful in reducing the severity and duration of symptoms as well as in preventing acute attacks and the development of complications, such as amyloidosis (4). Several studies have reported that clinical episodes of FMF can be triggered by infection, trauma, psychological stress, excessive physical activity, exposure to cold, and menstruation (5). The concentrations of several cytokines and acute phase proteins were measured in FMF patients and were believed to have a key role in the pathogenesis of FMF (6). Studies demonstrated an activation of the cytokine network during FMF. In different studies, the levels of interleukin-6 (IL-6), interleukin-10 (IL-10), serumsoluble interleukin-2 receptor (sIL-2r), and tumour necrosis factor alpha (TNF-a) have been shown to be increased during or between acute attacks of FMF. These cytokines are primarily
expressed by macrophages and monocytes at inflammatory sites.
Recent studies have shown that subclinical inflammation may continue in FMF, even during symptom-free periods (7). The values of erythrocyte sedimentation rate (ESR), acute-phase proteins such as C-reactive protein (CRP), serum amyloid A (SAA), and fibrinogen reactants increase during attack periods and usually return to normal during symptom-free periods (6). Amyloidosis can develop in patients during the subclinical inflammation phase of FMF (6). Mean platelet volume (MPV) may be an indicator of systemic subclinical inflammation (8). Red cell distribution width (RDW) was also shown to be a useful marker of systemic subclinical inflammation (9).
Platelet/lymphocyte ratio and neutrophil/lymphocyte ratio may be useful markers for the detection of systemic subclinical inflammation in Familial Mediterranean Fever (6). Recent studies have pointed out that the neutrophil/lymphocyte ratio and mean platelet volume are significantly higher in Familial Mediterranean Fever (FMF) patients than in normal individuals (6). The current study aimed to investigate the possible correlation of each of Neutrophil/lymphocyte ratio, Platelet/lymphocyte ratio and red cell distribution width with Familial Mediterranean Fever (FMF) and to determine which of these markers serves as the best indicator of subclinical inflammation in Familial Mediterranean Fever patients.
A case-control study included 63 individuals, aged between 20-47 years, distributed into two groups; a Control group that included 21 apparently normal individuals (11 males and 10 females) who did not suffer from Familial Mediterranean Fever, were not taking any medications, and did not suffer from any inflammatory condition. Their average age was 26 years and 4 months. And a Familial Mediterranean Fever (FMF) patient group that included 42 individuals infected with Familial Mediterranean Fever (16 males and 26 females) who were diagnosed with the disease based on a physical examination of the patient, a review of his family medical history, laboratory tests, and genetic testing, if available. All patients used colchicine one to three times daily to relieve symptoms and prevent attacks, and their average age
was 26 years and 9 months. Individuals with current infections, chronic inflammation, liver disease, chronic kidney disease, autoimmune diseases, diabetes, or hypertension were excluded from the study.
Written informed consent was obtained from all volunteers participating in the study. The research was approved by the National Committee for the Ethics of Scientific and Technological Knowledge.
The study samples were collected during the period extending from 1/1/2023 to 21/3/2023. Samples were collected from volunteers with Familial Mediterranean Fever during symptomfree periods. A 5 mL sample of venous blood was obtained from each volunteer, and the sample was divided into two portions of 2.5 mL each. The first portion of the sample was placed in a vacuum blood collection tube containing EDTA3K as an anticoagulant to perform a complete blood count (CBC), while the second portion of the sample was placed in a vacuum blood collection tube containing lithium heparin as an anticoagulant and centrifugated to obtain plasma in order to measure C-reactive protein (CRP). Complete blood count performed for each volunteer included white blood cell count (WBC) and red blood cell count (RBC), differential count of white blood cells (neutrophils, basophils, eosinophils, monocytes, and lymphocytes), haemoglobin titration and determination of haematocrit and red blood cell indexes (mean cell volume (MCV), mean corpuscular haemoglobin (MCH) and mean corpuscular haemoglobin concentration (MCHC), and red cell distribution width (RDW). Complete blood count was conducted using an automated haematology analyser BC-3000 Plus, from Mindray (China), following the manufacturer’s instructions. CRP was titrated using a Hipro Hurricane Immunoassay Analyzer, model HP-083/4-II, from Hipro Biotechnology (USA), according to the manufacturer’s instructions.
Statistics were conducted using SPSS Statistical Software (Version: 29.0.0.0; IBM Inc., Chicago, IL, USA). QuantileQuantile plots (Q-Q plots) were used to test whether the data obtained in each of the study groups were normally distributed. Quantitative variables were expressed as mean ± standard deviation (mean ± SD). To compare the means of two groups of data, Student’s t-test was used for quantitative variables that are normally distributed, while Mann-Whitney U test was used for quantitative variables that are not normally distributed. Pearson’s correlation analysis was used to evaluate correlations. A value of p < 0.05 was considered statistically significant.
Table 1 shows the results of descriptive statistics for the variables analysed in both the Familial Mediterranean Fever patient group and the control group. When applying Student’s t-test, the neutrophil/lymphocyte ratio (N/L ratio) in the Familial Mediterranean Fever patient group was significantly higher than in the control group (p<0.05) (Table 2) platelet/lymphocyte ratio (P/L ratio) in the Familial Mediterranean Fever patient group was higher than in the control group, but the difference was statistically insignificant (p = 0.123). When applying MannWhitney U test, there was no statistically significant difference between C-reactive protein values in the Familial Mediterranean Fever patient group and those in the control group (P = 0.960) (Table 3).
A statistically significant positive correlation (r = 0.498, p<0.001) was found between platelet/lymphocyte ratio and C-reactive protein in Familial Mediterranean Fever patients participating in our study (Table 4). There was also a statistically significant positive correlation (r=0.545, p<0.001) between neutrophil/ lymphocyte ratio and C-reactive protein in Familial Mediterranean Fever patients participating in our study (Table 5). There was also a weak and insignificant negative correlation (r = -0.063, p = 0.693) between red blood cell distribution width and C-reactive protein in Familial Mediterranean Fever patients participating in our study (Table 6).
Figure 1 shows The ROC (Receiver Operating Characteristic)
curve demonstrating the performance of neutrophil/lymphocyte ratio in Familial Mediterranean Fever patients. Neutrophil/ lymphocyte ratio showed an area under the curve (AUC) of 0.9497 (95% CI, 0.881–1.019) with an excellent accuracy of test and a cut-off value of 1.65 based on ROC analysis. This was found to be a reliable marker for subclinical inflammation.
Our results showed that the neutrophil/lymphocyte ratio (N/L ratio) in the Familial Mediterranean Fever patient group was significantly higher than in the control group. The platelet/lymphocyte ratio (P/L ratio) in the Familial Mediterranean Fever patients was higher than in the control group in our study, but the difference was not significant. No significant difference was found between C-reactive protein (CRP) values in the Familial Mediterranean Fever patient group and those in the control group in our study. There was a statistically significant positive correlation between the neutrophil/lymphocyte ratio and C-reactive protein in Familial Mediterranean Fever patients participating in our study. The neutrophil/lymphocyte ratio showed an area under the curve (AUC) of 0.9497 with an excellent accuracy of test and a cutoff value of 1.65 based on ROC analysis. Our results suggest that the neutrophil/lymphocyte ratio (N/L ratio) could be a reliable marker for subclinical inflammation in Familial Mediterranean Fever.
The neutrophil/lymphocyte ratio (N/L ratio) in the Familial Mediterranean Fever patients was significantly higher than in the controls in our study. This is consistent with most of the previously published results. A study conducted by Uslu et al. (10) in Turkey concluded that the neutrophil/lymphocyte ratio (N/L ratio) could be a useful marker of inflammation and is higher in patients with Familial Mediterranean Fever in attackfree periods. The researchers suggested that N/L ratio could be an important measure of systemic inflammation as it is costeffective, readily available and can be calculated easily (10). The neutrophil/lymphocyte ratio (N/L ratio) is a potential subclinical inflammation marker in patients with Familial Mediterranean Fever (FMF) according to a study conducted by Özer et al. (2014) in Turkey. The researchers found that the neutrophil/lymphocyte ratio (N/L ratio) was significantly higher in Familial Mediterranean Fever patients during the symptom-free period than in normal subjects. They also found that N/L ratio was the most reliable marker for subclinical inflammation when compared to platelet/ lympohcyte ratio (P/L ratio), MPV, and RDW (6). Ahsen et al. (2013) found that the NLR values of the Familial Mediterranean Fever patients were significantly higher than those of the control group. The researchers suggested that NLR might be used in the FMF patient as an indicator of subclinical inflammation (11). The N/L ratio of children with Familial Mediterranean Fever in the attack-free period was found to be significantly higher than that of healthy control children in the study of Duksal et al. (12). Dincer et al. (2021) found that N/L ratio was significantly increased in FMF patients with subclinical inflammation in comparison to the controls. The researchers concluded that N/L ratio may be used as an inflammatory indicator to distinguish between FMF patients with subclinical inflammation and patients without subclinical inflammation in the attack-free period (13).
The platelet/lymphocyte ratio (P/L ratio) in the Familial Mediterranean Fever patients was higher than in the control group in our study, but the difference was not significant. The P/L ratio was significantly increased in FMF patients with subclinical inflammation in comparison to the controls in the study of Dincer et al. (2021) (13). The platelet/lymphocyte ratio (P/L ratio) was also found to be a potential subclinical inflammation marker in patients with Familial Mediterranean Fever (FMF) according to the study of Özer et al. (2014). The researchers found that the platelet/lymphocyte ratio (P/L ratio) was significantly higher in Familial Mediterranean Fever patients during the symptom-free period than in normal subjects (6). The fact that our patient sample size was limited may explain the difference between our results and previously published results. Future research is needed on
Table 1. Results of descriptive statistics for the variables analysed in both the Familial Mediterranean Fever patient group and the control group.
RDW: Red cell distribution width, NLR: Neutrophil/lymphocyte ratio, PLR: Platelet/lymphocyte ratio, CRP: C-reactive protein.
Table 2. Results of comparison of mean, number of variables analysed in the two study groups using Student t-test
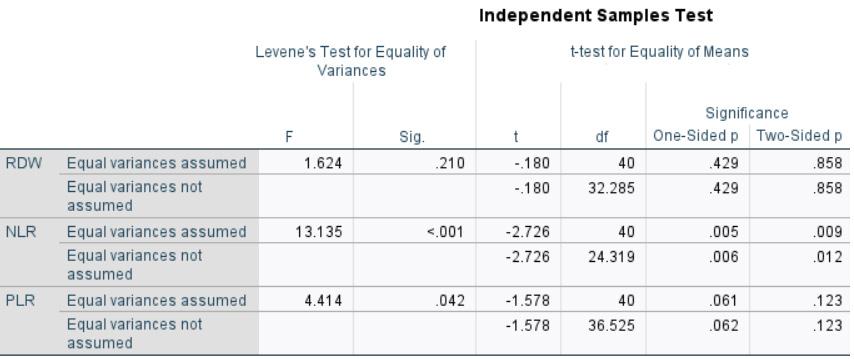
Table 3. The results of comparison of CRP values in the two groups using the U-test Ranks
Asymp. Sig. (2-tailed)
a.Grouping variable: Participant
larger numbers of Familial Mediterranean Fever patients to better assess the association of the platelet/lymphocyte ratio (P/L ratio) with subclinical inflammation in these patients.
No significant difference was found between C-reactive protein (CRP) values in the Familial Mediterranean Fever patient group and those in the control group in our study. In the study conducted by Özer et al. (2014) in Turkey C-reactive protein values in FMF patients were significantly higher than those in the control group (6). Our study patients were undergoing colchicine treatment, and this could effectively reduce CRP values in these patients.
A statistically significant positive correlation was found between the neutrophil/lymphocyte ratio values and C-reactive protein values in Familial Mediterranean Fever patients participating in our study.
This is consistent with the results of Özer et al. (6) and Ahsen et al. (11).
Our results also showed that the N/L ratio had the strongest correlation with subclinical inflammation and CRP in Familial Mediterranean Fever among the analysed markers. This is consistent with the results of Özer et al. (6) and Dincer et al. (13).
The neutrophil/lymphocyte ratio showed an excellent accuracy as a diagnostic test at a cut-off value of 1.65 based on ROC analysis.
It is preferable to conduct future large-scale studies with larger sample sizes to optimize the cut-off value of the N/L ratio used in the diagnosis of the subclinical inflammation in Familial Mediterranean Fever.
Table 4. Correlation between platelet/lymphocyte ratio values and C-reactive protein values in Familial Mediterranean Fever patients participating in our study using Pearson’s correlation coefficient
Correlations
Pearson Correlation .498** 1
Sig. (2-tailed) <.001 N 42 42
**Correlation is significant at the 0.01 level (2-tailed). PLR: Platelet/lymphocyte ratio, CRP: C-reactive protein.
Table 5. Correlation between neutrophil/lymphocyte ratio values and C-reactive protein values in Familial Mediterranean Fever patients participating in our study.
Correlations
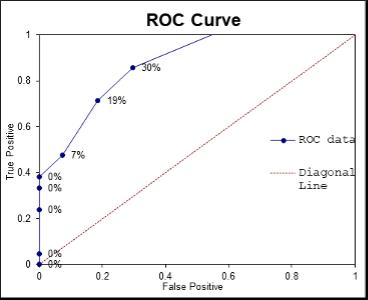
Figure 1. The ROC (Receiver Operating Characteristic) curve demonstrating the performance of N/L ratio in Familial Mediterranean Fever patients
The neutrophil/lymphocyte ratio (N/L ratio) can be a reliable inflammatory marker in Familial Mediterranean Fever. The neutrophil/lymphocyte ratio (N/L ratio) is furthermore a simple marker to determine subclinical inflammation because it can be obtained easily from a routine Complete blood count and does not require additional costs. Based on our results, an N/L ratio of 1.65 is considered diagnostic of subclinical inflammation. Subclinical inflammation occurs during attack-free periods and causes amyloidosis. We suggest that the N/L ratio can be useful as a predictor of the development of amyloidosis.
AUTHOR INFORMATION
Husam Khalil, PhD, Senior Lecturer1
Kinda Touban, BS PHARM1
Pearson Correlation .545** 1
**. Correlation is significant at the 0.01 level (2-tailed). NLR: Neutrophil/lymphocyte ratio, CRP: C-reactive protein.
Table 6. Correlation between red blood cell distribution width values and C-reactive protein values in Familial Mediterranean Fever patients participating in our study.
Correlations
Pearson Correlation 1 -.063
Sig. (2-tailed) .693
Pearson Correlation -.063 1
Sig. (2-tailed) .693
N 42 42
RDW: Red cell distribution width, CRP: C-reactive protein.
Raneem Mousa, BS PHARM1
1 Faculty of Pharmacy, Al Rasheed International Private University for Science & Technology (RU), Damascus, Syria
Correspondence: Husam Khalil
Email: husam.khalil86@gmail.com or Hossam-Khalil@ru.edu. sy
1. Mansueto P, Seidita A, Chiavetta M, et al. Familial Mediterranean fever and diet: A narrative review of the scientific literature. Nutrients 2022; 14(15): 3216.
2. Meyerhoff, J. Familial Mediterranean fever. 2021 Available from: Medscape.com. https://emedicine.medscape.com/ article/330284-overview?icd=login_success_email_match_ norm. [Internet]. [Accessed 16 Sep 2023].
3. Tunca M, Akar S, Onen F, et al. Familial Mediterranean fever (FMF) in Turkey: results of a nationwide multicenter study. Medicine (Baltimore) 2005; 84(1): 1–11.
4. Guler T, Garip Y, Dortbas F, Pekin Dogan Y. Quality of life in Turkish patients with familial Mediterranean fever: association with fatigue, psychological status, disease severity and other clinical parameters. Egypt Rheumatol 2018; 40(2): 117–121.
5. Sarı İ, Birlik M, Kasifoğlu T. Familial Mediterranean fever: An updated review. Eur J Rheumatol 2014; 1: 21–33. doi: 10.5152/eurjrheum.2014.006
6. Özer S, Yılmaz R, Sönmezgöz E, et al. Simple markers for subclinical inflammation in patients with familial
Mediterranean fever. Med Sci Monit 2015; 21: 298–303.
7. Yalçinkaya F, Cakar N, Acar B, et al. The value of the levels of acute phase reactants for the prediction of familial Mediterranean fever associated amyloidosis: a case control study. Rheumatol Int 2007; 27: 517–522.
8. Sakallı H, Kal O. Mean platelet volume as a potential predictor of proteinuria and amyloidosis in familial Mediterranean fever. Clin Rheumatol 2013; 32: 1185–1190.
9. Hu Z-D, Chen Y, Zhang L, et al. Red blood cell distribution width is a potential index to assess the disease activity of systemic lupus erythematosus. Clin Chim Acta 2013; 425: 202–205.
10. Uslu AU, Deveci K, Korkmaz S, Aydin B, Senel S, Sancakdar E, et al. Is neutrophil/lymphocyte ratio associated with subclinical inflammation and amyloidosis in patients with familial Mediterranean fever? Biomed Res Int 2013; 2013: 185317.
11. Ahsen A, Ulu MS, Yuksel S, et al. As a new inflammatory
marker for familial Mediterranean fever: neutrophil-tolymphocyte ratio. Inflammation 2013; 36: 1357–1362.
12. Duksal F, Alaygut D, Güven AS, Ekici M, Oflaz MB, Tuncer R, et al. Neutrophil-lymphocyte ratio in children with familial Mediterranean fever: Original article. Eur J Rheumatol 2015;2(1): 20-23.
13. Dinçer ABK, Gülöksüz EGA, Sezer S, Yılmaz R, Turgay TM, Ateş A, et al. Neutrophil/lymphocyte ratio but not platelet/ lymphocyte ratio and mean platelet volume can be an indicator of subclinical inflammation in patients with familial Mediterranean fever. Egypt Rheumatol 2022; 44(3): 215–218.
Copyright: © 2024 The author(s). This is an open-access article distributed under the terms of the Creative Commons Attribution License, which permits unrestricted use, distribution, and reproduction in any medium, provided the original author(s) and source are credited.


Holly E Perry and Selene S Mak
Objectives: Immunoassays suffer from false positives due to interference from non-specific antibodies, regardless of the target antigen or antibody under test. This research investigated the possibility that two human antibodies; anti-Gal and anti-Forsmann (Fs), were a cause of false positives in a syphilis immunoassay. A further aim was to establish the minimum concentration of synthetic antigens able to block activity of anti-Gal and anti-Fs in human plasma samples.
Methods: Twenty plasma donations which had tested false positive for syphilis in a blood donor screening assay were tested in a rapid immunoassay for syphilis. Subsequently, anti-Gal and anti-Fs activity was blocked in each sample with synthetic αGal and Fs antigens. Samples which tested positive in the rapid test were re-tested with plasma subjected to blocking. All 20 samples were studied for levels of anti-Gal and anti-Fs by agglutination with kodecytes. The minimum concentration of synthetic antigens able to block anti-Gal and anti-Fs was established using different concentrations of polyacrylamide conjugates of the corresponding antigens, with subsequent antibody reactivity tested with antigen-specific kodecytes.
Results: Three of the 20 samples which tested false positive in the blood donor screening assay tested positive with the rapid test for syphilis antibodies. None of the three samples yielded a negative rapid test result when blocked with synthetic αGal or Fs antigens. Levels of anti-Gal and anti-Fs showed no correlation with results of the rapid test for syphilis antibodies. The minimum concentration of synthetic antigens required to neutralise (block) antibody activity was 250 µM for anti-Gal, and 125 µM for anti-Fs.
Conclusions: Anti-Gal and anti-Fs are unlikely to the be a cause of false positive reactions in immunoassays.
Key words: Immunoassay, αGal, Forssman, kodecytes.
NZ J Med Lab Sci 2024; 78(2): 87-91
The term “immunoassay” describes any diagnostic test which includes binding and detection of antigens and antibodies. These assays are widely used in laboratory medicine. Results can be affected by interference from off-target antibodies which bind non-specifically to antigens or antibodies in human samples or laboratory reagents, and subsequently cause false positive or elevated results. Some of these off-target antibodies are well understood in the form of anti-murine antibodies and autoantibodies, and immunoassay kit manufacturers supply blocking solutions as part of the kit which reduce interference from these antibodies (1). However, most antibodies which interfere in immunoassays are of unknown cause and interference may occur despite the use of blocking solutions (2). False positive and falsely high results in immunoassays such as D-dimer, tumour markers, Troponin T and I, hormone levels, and infectious diseases including syphilis can cause clinical confusion and patient distress, and sometimes result in inappropriate treatment (2,3).
Antibodies to carbohydrate antigens form an important part of the innate immune response, binding to a large range of bacterial carbohydrate antigens to protect humans from pathogen invasion (4, 5). These “natural poly-specific antibodies” are known to cause false positives in immunoassays (1). Anti-Gal and anti-Forssman (Fs) are two natural poly-specific antibodies present in nearly all adult humans (4, 6, 7). The corresponding antigens αGal (Galα13Galβ1-4GlcNAc-R) and Fs (GalNAcα1-3GalNAcβ1-3Galα14Gal-R) are present in non-primate mammals. All humans lack the αGal antigen, and only a very small number of humans express the Fs antigen (7-9). Synthetic αGal and Fs antigens are available as polyacrylamide conjugates (Galili PA and Forssman PA).
KodeTM is a surface cell attachment technology which enables attachment of synthetic forms of αGal and Fs antigens in the form of function-spacer-lipids (FSLs). Once FSL attachment has taken place, the red blood cells (RBC) are called “kodecytes” (10) and can specifically bind Anti-Gal and anti-Fs antibodies. Both KodeTM FSL, and PA include an antigenic functional moiety. FSLs also contain an inert spacer to position an antigen on a cell surface with maximum antibody exposure, and a lipid tail for easy insertion to red cell membranes (11), whereas PA include the antigen linked to polyacrylamide groups. Using KodeTM technology and PA, this study aimed to investigate the
potential of PA Galili and Fs synthetic antigens to neutralise the activity of natural antibodies anti-Gal and anti-Fs in 20 human plasmas. These “blocked samples” were then tested alongside their native counterparts, to investigate if the blocking of anti-Gal or anti-Fs antibodies was able to negate false positive results in an immunoassay. A syphilis antibody test was selected for the purpose, as this is an example of an immunoassay which suffers from non-specific antibody interference in some patients (for example some individuals with autoimmune disorders) (12). Syphilis testing was selected as the immunoassay for this study, due to availability of samples which had tested false positive for antibody to the causative organism Treponema pallidum, and a rapid test within the resources of the study.
MATERIALS AND METHODS
Method principles and purpose were as follows:
• Syphilis testing to ascertain if biological false positives obtained by New Zealand Blood Service could be detected on a rapid test kit for antibody to T.pallidum.
• Establishing relative antibody levels of anti-Gal and anti-Fs with kodecytes in a red cell agglutination assay, to investigate any correlation between antibody level and interference with immunoassays.
• Investigating whether it was possible to block anti-Gal and anti-Fs with corresponding PA, and if so, to establish the minimum concentration of PA required.
• Investigating whether cohort samples which tested positive on the rapid syphilis antibody test produced a negative result following antibody blocking.
Ethical approval was granted by University of Otago (H22/142). The cohort consisted of 20 plasma donations from New Zealand blood donors, supplied by New Zealand Blood Service (NZBS) with permission (NZBS 2022/19). Donations were all from donors categorized as “biological false positives” for syphilis, as they tested positive in screening Architect Syphilis TP assay, but negative in confirmatory testing at LabPlus. LabPlus testing assayed treponemal serology (Roche Syphilis Screen, Rapid Plasma Reagin and Treponema Pallidum Hemagglutination Assay). Plasma samples were received frozen and stored at minus 20 degrees Celsius for up to seven months.
Syphilis testing
Samples were tested for presence of antibody to T.pallidum on a rapid test kit; iCARE Advanced (WF1003F, JAL Medical, Singapore). Thirty microlitres of sample plasma was dropped into the sample well on the card, followed by the addition of 1 mL of sample diluent. The card was left for 15 minutes, then examined for a coloured control line to validate the test. When the test line developed colour in addition to the control line, the sample was positive. Samples which tested positive in the syphilis assay were subsequently treated with PA antigens and tested in the same way, alongside dilution controls (see Methods: Antibody Blocking).
Kodecytes
Kodecytes were prepared with the addition of FSLs to fresh group O red blood cells (RBC). FSL-Galili (0070-SC2-L1, GlycoNZ, New Zealand) and FSL-Forssman-2 (0051-SA1-L1, GlycoNZ, New Zealand) were prepared at concentrations of 40, 10 and 2 µM, using ID-CellStab (005650, Bio-Rad, New Zealand) as the diluent. Equal volumes of FSL were added to aliquots of washed, group O rbc at 100% concentration and incubated for 2 hours at 37°C, with mixing at 1 hour. The resulting FSL labelled rbc are known as “kodecytes”, with the name including the relevant FSL concentration used for preparation. For example, kodecytes prepared with FSL Galili at 40 µM are referred to as Gal 40 kodecytes. After incubation, kodecytes were suspended in ID-CellStab at concentrations of 4% and 1%. Kodecytes were rested overnight at 4°C, and used for up to six weeks with storage at 4°C.
Red cell agglutination
Kodecytes were used in agglutination methods of direct saline testing (tube technique) for detection of IgM antibodies to αGal and Fs, and indirect antiglobulin testing by column agglutination for detection of IgM+IgG antibodies. Tube saline method consisted of incubation of 50 µL of plasma and 50 µL of 4% kodecytes in a tube for 1 hour at 37°C. After incubation, the tubes were centrifuged briefly, then the cell pellet examined for agglutination with a magnifying concave mirror. Column agglutination antiglobulin method consisted of incubation of 25 µL of plasma and 50 µL of 1% kodecytes in a card well containing anti-human globulin (729925, Grifols Australia) for 15 minutes at 37°C. Cards were centrifuged and examined macroscopically for agglutination.
Quantitation of antibodies to αGal and Forsman using kodecytes
Sample plasmas were tested in series with kodecytes prepared with three different concentrations of FSL-Galili and FSL-Forssman: 40, 10 and 2 µM. Where plasma agglutinated kodecytes prepared with all three FSL concentrations, antibody level was deemed high (H). Where plasma agglutinated kodecytes prepared with FSL at 40 and 10 µM, antibody level was medium (M) and where plasma agglutinated only kodecytes prepared with FSL at 40 µM, antibody level was low (L) (13) (Table 1). This is a determination of antibody level by titration of the antigen rather than antibody (13).
Table 1. Scheme for assigning antibody level as H, M, L with FSL at three different concentrations
FSL concentration used to prepare kodecytes
FSL concentration
40 µM 10 µM 2 µM Antibody level
Antibody blocking
Anti-Gal and Anti-Fs activity in plasma was blocked with addition of corresponding PA antigens in the form of Galili PA (0070-PA, GlycoNZ, New Zealand) and Forssman PA (0051-PA, GlycoNZ, New Zealand). PA at concentrations of 250, 125 and 63 µM was prepared in phosphate buffered saline (PBS) (18912014, Thermo Fisher Scientific, New Zealand) and mixed in equal volumes with plasma samples. Mixtures were incubated at 37°C for 1 hour, then centrifuged to sediment any particulate matter. To control for antibody reduction by dilution rather than blocking, equal volumes of plasma and PBS were also incubated.
Analysis of antibody blocking
Blocked plasma was analysed for antibody activity by agglutination with kodecyte methodology. Twenty-five µL of plasma and 50 µL of 1% kodecytes (Gal 40 or Fs 40 kodecytes) were incubated in a card well containing anti-human globulin (729925, Grifols Australia) for 15 minutes at 37°C. Cards were centrifuged and examined macroscopically for agglutination. Dilution controls were tested in parallel.
Statistical analysis
Using GraphPad software, two by two contingency tables were used to assess correlation between antibody level and positivity in the rapid syphilis test, with level of significance for p value set at 0.05. Medium and high antibody levels were combined and compared with low antibody level for each of anti-Gal and anti-Fs. Antibody at low level requires a much higher concentration of FSL Galili (40µM) to agglutinate with kodecytes, whereas the distinction between medium and high levels is less (13).
Syphilis Testing on native plasma samples (iCARE Advanced test)
The test was validated by the appearance of the control line in all 20 samples. Three of the 20 samples tested positive (iCARE Advanced test).
Quantitation of antibodies to αGal using FSL
The majority of the 20 samples showed a medium level of anti-αGal by both saline and IAT methods (Figure 1). In individual samples, antibody level was never higher in IAT than in saline, suggesting that anti-Gal was predominantly IgM in all individuals (Figure 2). Two samples showed a lower level of antibody in the IAT method than the saline method (Figure 2 samples 2 and 4), reflecting that column agglutination method is sometimes less sensitive than tube for the detection of carbohydrate antibodies (14).
Quantitation of antibodies to Fs using FSL
Fifty-five % of samples showed a medium level of anti-Fs by saline method, and 35% by IAT. A further 40% had a high level of anti-Fs by saline, and 60% by IAT. The remaining 5% had a low level (Figure 3). In individual samples, antibody level was higher in IAT than in saline in four samples, suggesting that anti-Fs occurs as both IgM and IgG (Figure 4 samples 9, 10, 15 and 19).
Correlation of anti-Gal and anti-Fs level with positivity in Syphilis rapid test
Plasma reactions
+ + + High (H)
+ + 0 Medium (M)
+ 0 0 Low (L)
+ indicates a positive reaction, agglutination. 0 indicates a negative reaction, no agglutination. (13)
Samples 1, 18 and 19 tested positive in the syphilis rapid test. Sample 1 had medium levels of anti-Gal and anti-Fs. Sample 18 had a low level of anti-Gal and a medium level of anti-Fs. Sample 19 had a medium level of anti-Gal, and a high level of anti-Fs (IgM+IgG) (Figure 5). There was no correlation between positivity in the syphilis test and anti-Gal or anti-Fs level as tested by 2x2 contingency tables using Fisher’s exact test. Samples testing positive or negative in the syphilis test were tested against antibody level; anti-Gal level by saline, and anti-Fs level by IAT. Both p values show there is no significant association between positivity in the rapid test and level of antibody (Table 2).
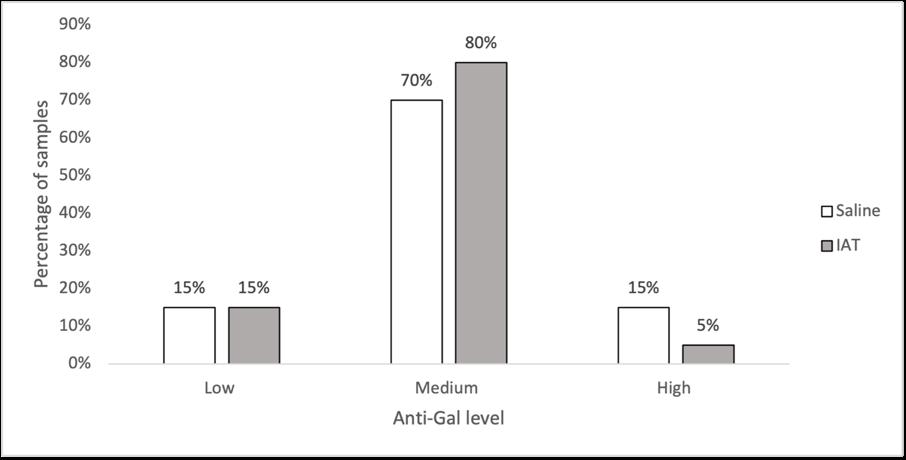
Figure 1. Distribution of antibody level of anti-Gal across 20 human plasma samples
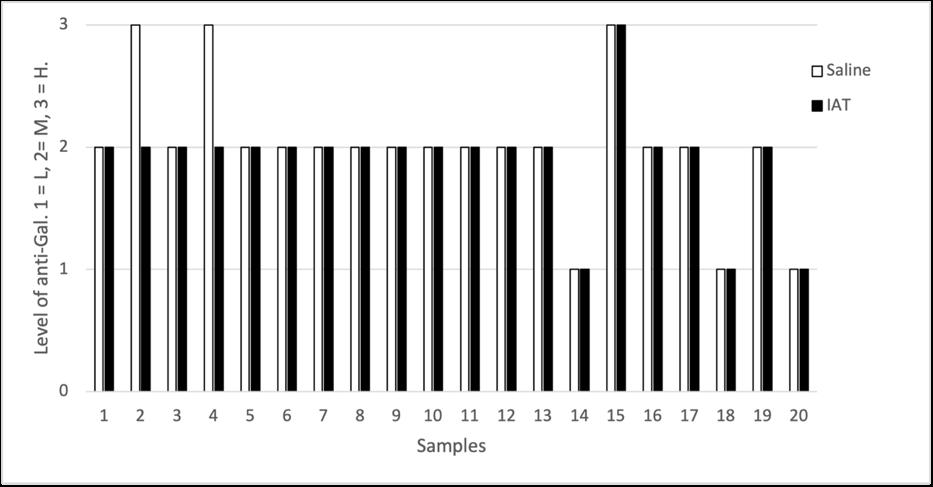
Figure 2. Levels of anti-Gal in saline and tube methods in 20 individual human plasma samples. L = low, M = medium, H = high.
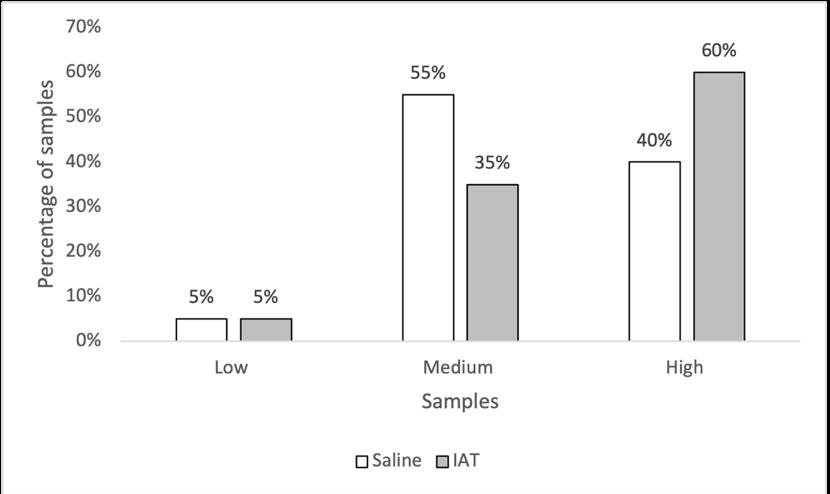
Figure 3. Distribution of antibody level of anti-Fs across 20 human plasma samples.

Figure 4. Levels of anti-Fs in saline and tube methods in 20 individual human plasma samples. L = low, M = medium, H = high
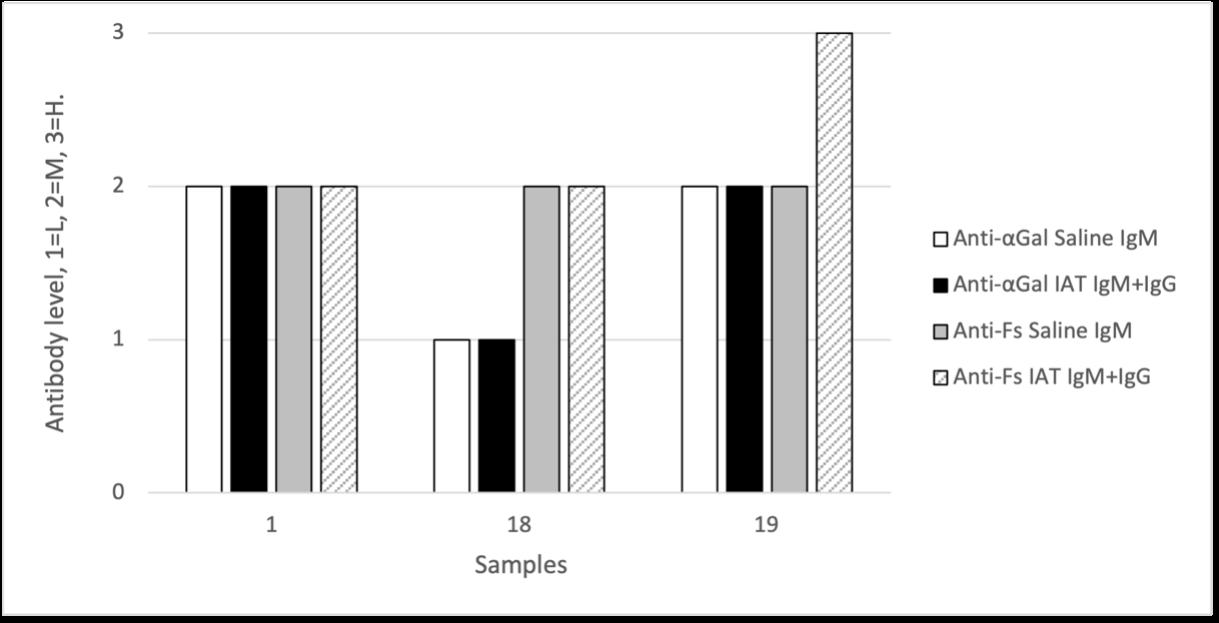
Figure 5. Antibody levels (anti-Gal and anti-Fs) in three samples testing positive in the rapid test for antibody to T. pallidum
Table 2. Results of 2x2 contingency tables to analyse statistical significance between anti-Gal and anti-Fs levels and positivity in syphilis rapid test.
Anti-Gal level (saline) Anti-Fs level (IAT)
Syphilis test L M+H L M+H
Syphilis Testing on blocked plasma samples
Samples 1, 18 and 19 which tested positive for syphilis antibody were subjected to blocking with Galili and Forssman PA at 1.5 mM and re-tested on rapid test. Dilution controls were also tested. Samples 1 and 19 remained positive on rapid test for syphilis. Sample 18 lost positivity on syphilis rapid test, however this was due to sample dilution, not to blocking, as shown by the negative result with the dilution control (Table 3).
Table 3. Results of three samples on Syphilis rapid test, in native state, and blocked with Galili and Forssman PA. Sample #
Antibody blocking
Galili PA
Successful blocking was defined as a negative reaction with Galili 40 kodecytes, and a positive reaction in the dilution control. Three samples with low levels of anti-Gal were unsuitable for analysis, as there was loss of antibody by dilution. The remaining 17 samples were effectively blocked with concentrations of Galili PA 250 µM. At 125 µM, one sample with a high level of anti-Gal (sample 15) failed to be blocked, as indicated by reactivity with Galili 40 kodecytes. At 63 µM, a further three samples failed to be blocked (sample 2 with a high level of anti-Gal (saline), and samples 5 and 19 with a medium level of anti-Gal). (Table 4).
Table 4. Blocking of anti-Gal with different concentrations of Galili PA in 17 samples.
Galili PA concentration (µM)
Anti-Gal level (saline) samples blocked samples not blocked samples blocked samples not blocked samples blocked
Table 5. Blocking of anti-Fs with different concentrations of Forssman PA in 20 samples. Forssman PA concentration (µM)
Anti-Fs level (IAT) samples blocked samples not blocked samples blocked samples not blocked
Forssman PA
All 20 samples were effectively blocked with concentrations of Forssman PA 125 µM. At 63µM, five samples, all with high level anti-Fs, were not blocked (Table 5. Blocking of anti-Fs with different concentrations of Forssman PA in 20 samples.).
This paper investigated the role of natural carbohydrate antibodies anti-Gal and anti-Fs as possible causes of interference in immunoassays, using a syphilis immunoassay for the purpose. The hypothesis that these antibodies might be the cause of false positive results was disproved.
The distribution of levels of anti-Gal and anti-Fs in the cohort samples was somewhat different to previous findings in larger cohorts (13, 15), however this is not unexpected in a small cohort of 20 samples.
All 20 cohort samples tested positive in the Architect Syphilis TP assay, but only three samples tested positive in the iCARE Advanced syphilis rapid test kit. Both kits have similar published data for specificity (≥99% for both assays) (16, 17). All 20 samples were confirmed negative for syphilis using the gold standard assays. Both assays rely on detection of antibody to T.pallidum The difference in positivity rate between the two kits may be due to two different interference mechanisms, both unelucidated. This work also reports on a technique to block activity of anti-Gal and anti-Fs in human plasma. Whilst this was ultimately not useful in stopping false positives in an immunoassay, the ability to block the activity of anti-Gal and anti-Fs in human sera may be a useful tool for diagnostic laboratory medicine and research in the fields of transfusion, transplantation and bacterial infectivity studies (7, 9, 18). Researchers have successfully blocked αGal antibodies with melibiose (19) and anti-Fs with sheep red blood cells, but the latter has the problem of haemoglobin staining (15). Here, blocking of anti-Gal and anti-Fs was successfully performed with the use of Galili PA and Forssman PA respectively without staining or sediments.
Using Galili PA at concentrations of 250 µM and higher rendered all samples unable to react with kodecytes expressing αGal Similarly, Forsmman PA at concentrations of 125 µM and higher rendered all samples unable to react with kodecytes expressing Fs at high levels.
Anti-Gal and anti-Fs are unlikely to be a cause of false positive reactions in immunoassays. Using synthetic α-Gal and Fs antigens, we report an effective technique for blocking Anti-Gal and anti-Fs activity in human plasma.
This study was funded by New Zealand Institute of Medical Laboratory Science, by a research grant.
Special thanks to Ricardo Van Wyk and the Donation Accreditation Auckland Team at New Zealand Blood Service for providing samples and information about donor screening.
Function-Spacer-Lipid (FSL). A construct produced by Kode™ Biotech consisting of a functional moiety (F), a spacer (S) and a lipid (L) (10). FSL are water-dispersible and amphipathic (having both hydrophilic and hydrophobic parts).
Kodecytes Any cell modified with FSL (10).
Galili FSL FSL with the functional moiety (F) Galα1-3Galβ14GlcNAcβ, representing the αGal antigen. Forssman FSL FSL with the disaccharide of functional moiety (F) GalNAcα1-3GalNAcβ, representing the Forssman antigen. Galili PA. As per Galili FSL, but without the spacer or lipid tail. Galα1-3Galβ1-4GlcNAcβ is linked to polyacrylamide. Forssman PA As per Forssman FSL, but without the spacer or lipid tail. GalNAcα1-3GalNAcβ is linked to polyacrylamide.
AUTHOR INFORMATION
Holly E Perry, PhD, Lecturer1
Selene S Mak, BMLSc, student 1
1 Department of Pathology, University of Otago
Correspondence: Holly Perry, PhD, Lecturer, Email: holly. perry@otago.ac.nz
CONFLICT OF INTEREST
Holly Perry is a shareholder of Kode Biotech. Selene Mak has nothing to declare.
1. Levinson SS, Miller JJ. Towards a better understanding of heterophile (and the like) antibody interference with modern immunoassays. Clin Chim Acta 2002; 325: 1-15.
2. Bolstad N, Warren DJ, Nustad K. Heterophilic antibody interference in immunometric assays. Best Pract Res Clin Endocrinol Metab 2013; 27: 647-61.
3. Morton A. When lab tests lie … heterophile antibodies. Aust J Gen Pract 2014; 43: 391-393.
4. Bovin NV. Natural antibodies to glycans. Biochemistry (Mosc). 2013; 78: 786-797.
5. Springer GF. Blood-group and Forssman antigenic determinants shared between microbes and mammalian cells. Prog Allergy 1971; 15: 9-77.
6. Jesus C, Hesse C, Rocha C, et al. Prevalence of antibodies to a new histo-blood system: the FORS system. Blood Transfus 2018; 16: 178-183.
7. Galili U. Antibody production and tolerance to the α-gal epitope as models for understanding and preventing the immune response to incompatible ABO carbohydrate antigens and for α-gal therapies. Front Mol Biosci 2023; 10: 1209974.
8. Reid ME, Lomas-Francis C, Olsson ML. The Blood Group Antigen FactsBook. 3rd Edition, London, U.K. Elsevier; 2012.
9. Svensson L, Hult AK, Stamps R, et al. Forssman expression on human erythrocytes: biochemical and genetic evidence of a new histo-blood group system. Blood. 2013; 121: 14591468.
10. Henry SM, Tuzikov A.B, Bovin NV. Kode Technology Illustrated Technical Manual: Kode Biotech; 2023. Available from: https://hdl.handle.net/2292/62953.
11. Henry SM, Bovin NV. Kode Technology – a universal cell surface glycan modification technology. J R Soc NZ 2019; 49: 100-113.
12. Matthias J, Klingler EJ, Schillinger JA, et al Frequency and
characteristics of biological false-positive test results for syphilis reported in Florida and New York City, USA, 2013 to 2017. J Clin Microbiol 2019; 57: e00898-19.
13. Perry HE, Ryzhov I, Galanina O, et al Incidence in plasma of low level antibodies against three xenotransplantation and immunotherapeutic glycan antigens. AIMS Allergy and Immunology 2020; 4: 75-87.
14. Kang SJ, Lim YA, Baik SY. Comparison of ABO antibody titers on the basis of the antibody detection method used. Ann Lab Med 2014; 34: 300-306.
15. Kijimoto-Ochiai S, Takahashi W, Makita A. Anti-Forssman antibody in human sera: properties and decreased level in cancer patients. Jpn J Exp Med 1981; 51: 149-155.
16. Abbott. Architect Syphilis TP kit package insert 8D06. 2023.
17. iCARE. Syphilis field use rapid test kit package insert. 2023.
18. Olivera-Ardid S, Bello-Gil D, Perez-Cruz M, et al. Removal of natural anti-αGal antibodies elicits protective immunity against gram-negative bacterial infections. Front Immunol 2023; 14: 1232924.
19. Zhan J, Xia Z, Xu L, et al A peptide mimetic of Gal-alpha 1,3-Gal is able to block human natural antibodies. Biochem Biophys Res Commun 2003; 308: 19-22.
Copyright: © 2024 The author(s). This is an open-access article distributed under the terms of the Creative Commons Attribution License, which permits unrestricted use, distribution, and reproduction in any medium, provided the original author(s) and source are credited.
In recognition of their late father’s passion for science, learning and capacity building for young people to live on through the NZIMLS, the family of Hugh Bloore gave a grant to the NZIMLS to go towards a Hugh Bloore Memorial Poster Prize.
This prize, to the value of $750 is awarded to the best poster provided by a NZIMLS member at the Annual Science Meeting.
The best poster award for non-member and student is $500


Author: Katalin Kariko, Crown, 2023
ISBN: 9780593443163
Who has heard of Katalin Kariko and why a book? Katalin Kariko along with her research colleague is the reason that vaccines to COVID-19 could be produced as quickly and as effectively as they were. The book describes the journey of an extraordinary female scientist from her early days growing up in communist controlled Hungary; her evolving love of science, and the pathways to get qualified in Hungary. Each step involved not only political consideration but also being a woman entering ‘serious’ science. After obtaining her PhD she moved to the USA with her husband with their entire savings (about US$1200) sewn into her daughter’s teddy bear to avoid Hungary’s currency restrictions.
By this stage Katalin was obsessed with working with mRNA and considered as a “crazy mRNA lady”. Her first USA position resulted in a threat to be deported by her Head of Department when she indicated she was applying for another position. Eventually moving to the University of Pennsylvania, she failed to obtain the necessary grants and was demoted, and all her laboratory equipment and belongings dumped in the hallway due to having no funding to lease floor and bench space.
Through various University traumas and with help from certain colleagues she maintained her mRNA research and was eventually employed by a German company BioNTech, developing an interest in mRNA for vaccines. Katalin’s belief in the therapeutic use of mRNA was unshakable and was her obsession all her life.
There were no mega-research teams and no spectacular funding during her career, but it is a remarkable story of her belief that one day mRNA would be a significant development in vaccines despite the continual undermining of her research and her academic prestige. The book draws the reader in on the obsession with bringing in research funding and numbers of publications, all of which dogged her during her career. Despite all this Katalin’s significant mRNA research and the rapid production of the COVID-19 vaccines were recognised with the awarding of the Nobel Prize for Medicine along with her co-researcher; Drew Weissman. This is an exceptional read about a female scientist who was totally focused on the idea that she could develop a useful mRNA vaccine when no-one else believed her.
Reviewed by: Michael Legge, PhD, NZIMLS
Master Builder: how the new science of the cell is rewriting the story of life
Author: Alfonso Martinez Arias, Hachette UK, 2023, ISBN: 9781399809955
Are all our biological answers residing in the genes? Increasingly questions are being posed as to whether all the information that makes a human (or any other animal) can solely reside in our genome, or are there other mechanisms that help build a complex organism.
The “Master Builder” written by a prominent developmental biologist considers this question. The author explores the domain of cells and cell communication and links various aspects of human development and growth not only to our genes but also to the way cells make their own decisions. Starting with
early embryogenesis he discusses how chemical signals from the cells make decisions of positional information and that the specific location helps organise not only normal body organs and limbs but also the geometrical symmetry of the body during development. This concept was first proposed in 1952 by Alan Turing (a computational biologist). The author progressively works through the interactions of cells and cell function that overlay genes. He uses excellent examples of how cellular decision making appears to reside outside of the genome but provides normal function.
The book raises questions about our current understanding of cellular biology and the interactions with genes and tests the dogma that all control is genetic. This is a well written book and an easy-to-read work to make the reader think.
Reviewed by Michael Legge, PhD, NZIMLS
Author: Walter Isaacson, Simon & Schuster, 2021, ISBN: 1982115858
Walter Isaacson is professor at Tulane University and the bestselling author of; “Leonardo da Vinci” and “Steve Jobs”. This book shares a highly enthralling story of Jennifer Doudna, Nobel Prize in Chemistry 2020 for the development of CRISPR/Cas9 method for genome editing.
Jennifer Doudna’s dictionary lacked the word “no.” Her career advisors at school told her that science wasn’t a field for girls and regularly suggested that she try something else. Growing up in Hilo, Hawaii, surround by nature and fuelled by her love of exploring and experimenting, she was determined to succeed in her chosen field. Doudna credits her passion for science to her father. After a regular sixth grade school day, Doudna came home to find a copy of Double Helix sitting on her bed; her father had left the book there for her, knowing that she would find it interesting. She instantly fell into a rabbit hole of mystery and wonder. Learning about DNA and the code that helps shape our very being, this book pushed her to work towards her dreams. Of course, none of that was made easy by the male-dominated world of science at the time.
After graduation in 1985, Jennifer Doudna went on to attend prestigious Harvard Medical School, leaving with a PhD. She worked as a professor at Berkeley University, where she developed the CRISPR-Cas 9 method to edit and programme genomes. The potential of CRISPR-Cas 9 is believed to be limitless and yet to be fully scoped. In Doudna’s words, “There was a sense that we have crossed the threshold into a whole new age, perhaps a brave new world, like when Adam and Eve bit into the apple or Prometheus stole fire from the gods”. This discovery has been used to develop testing and vaccines for COVID-19. It could cure genetic diseases and to have healthier (designer) babies and thus rewrite the story and future of our species – sounds like ethics dilemmas! Read the book to learn more about Jennifer Doudna and gene editing.
Reviewed by: Ehsan Ullah, Operations Manager, Anatomical Pathology, Health NZ, Te Toka Tumai Auckland.
These reviews can be accessed for their Abstracts and “Open Access” indicated where applicable. Unfortunately, the NZIMLS cannot provide full access to the articles due to copyright restrictions, but full access may be available through various institution arrangements. Any comments can be sent to: editor@nzimls.org.nz
1. Silkenstedt E, Salles G, Campo E, Dreyling M. B-cell non-Hodgkins lymphomas. Lancet 2024; 403(10438): 1791-1807. doi:10.1016/S0140-6736(23)02705-8. [OPEN ACCESS]
2. Burnd JC. The etiologies of Kawasaki disease. J Clin Invest 2024; 134(5): e176938. doi: 10.1172/JCI176938. [OPEN ACCESS]
3. Galgaiani JN, Kaufffman CA. Coccidioidomycosis and histoplasmosis in immunocompetent patients. N Eng J Med 2024; 390(6): 536-547.
4. Janssen H, Koekkoek L, Swirski FP. Effects of lifestyle on leukocytes in cardiovascular health and disease. Nat Rev Cardiol 2024; 21(3): 157-169.
5. Parisi X, Bledsoe JR. Discerning clinicopathological features of congenital neutropenia syndromes: an approach to diagnostically challenging differential diagnosis. J Clin Path 2024; jcp: 2022-208686. doi: 10.1136/jcp-2022-208686.
6. Al-Khatib SM. Cardiac implantable electronic devices. N Eng J Med 2024; 390(5): 442-454.
7. Ling X, Wang C, Li L, Pan L et al Third-generation sequencing for genetic disease. Clin Chim Acta 2023; 551: 117624. doi: 10.1016/j.cca.2023.117624.
8. Chonf YP, Lim SM, Loh TP, Mollee P et al. Screening for and diagnosis of monoclonal gammopathy. J Clin Path 2023; 76(11): 727-733. doi: 10.1136/jcp-2023-208774.

Wednesday 28 - Friday 30 August 2024 Te Pae Convention Centre, Christchurch

Conference Convenor: Vanessa Buchan Vanessa.Buchan@cdhb.health.nz

Management: Sharon Tozer sharon@nzimls.org.nz

PCO: Daniela Olphert daniela@hpce.co.nz
Come to the beautiful Garden City in Spring and see it at it’s best!
Registration will open early 2024 via www.nzimls.org.nz
Great opportunities to: y Present a paper y Present a poster y Network with colleagues y Learn and earn CPD points y Catch up with old friends y Make new friends
Are all D-dimer assays created equal?
Contributed by Michael Legge
D-dimer is an important laboratory test for suspected venous thromboembolism. Formed as degradation products of blood coagulation, by the dissolution of the fibrin mesh. In cases of venous thromboembolism, D-dimer results may be elevated up to 20 days following the event, with the most useful window being up to 11 days after the event. Laboratory reports of results must also consider that D-dimer results increase with age as an additional variable. D-dimer assay kits are available from several manufacturers which may result in variation in the end results. A recently published paper by investigators in New Zealand (1) demonstrated the importance of understanding the relationship for D-dimer reporting from different manufacturer’s assay kits. The authors undertook a retrospective analysis of two D-dimer assays (INNOVANCE® D-dimer and STA®-Liatest®) comparing the methods used by a community-based centre and a hospital laboratory setting respectively. A direct comparison of matched samples from 805 patients revealed that the INNOVANCE D-dimer test gave higher results than the Liatest and the former was suspected to have interference from heterophile antibodies. Result discrepancies occurred in 22% of the patients’ samples and the authors discussed that the lack of international standardisation compounds the problems of D-dimer result reporting with variation between commercial D-dimer assay kits.
A practical approach to peritoneal fluid analysis
Peritoneal fluid is an ultrafiltrate of blood plasma and is produced in small quantities (5 to 20mL). While not a common source for analysis in the pathology laboratory, peritoneal fluid can accumulate in several disease conditions causing ascites such as; liver cirrhosis, malignancy, heart failure, and nephrotic syndrome. At times up to 500mL may accumulate in the peritoneal cavity. In a recent publication the authors investigated what may be considered as ‘best practice’ by reviewing the relevant literature to provide the most appropriate evidencebased approach for peritoneal fluid analysis (2). Critical factors identified sample collection EDTA tubes for cell counts and plain tubes for biochemistry. A matched blood sample for biochemical analysis should be taken at the same time. Primary analysis was macroscopic inspection and noting the colour of the fluid and a cell count using an analyser that had a module for body fluid analysis. Biochemical analysis consisted of total protein and the concentration of albumin in the serum compared with that in the peritoneal fluid to calculate a diagnostic albumin gradient. Several other biochemical markers were discussed such as LDH, glucose, bilirubin, triglycerides, and creatinine. These additional tests help to build a picture of the origin of the ascites. The authors conclude that there are still several evidence gaps for peritoneal fluid analysis and that harmonising peritoneal protocols and analytes will result in improved diagnostic use of peritoneal fluid.
In the quest for cancer biomarkers, circulating tumour cells provide a unique opportunity not only to detect them but to identify the tumour type. These cells are detached from the tumour and can enter the circulatory system or other body fluids. An expectation is that by identifying such cells they can provide information relating to the tumour’s genetic and molecular identity and help guide treatment. In a recent publication from Poland the authors did a comparative analysis between cytology and flow cytometry using 119 pleural and peritoneal effusions, using the epithelial markers CD45, CD14 and EpCAM respectively (3). Based on the clinical and diagnostic evidence 37 of the fluids were from malignancies and 77 were from benign tumours. Five patients were excluded as their tumours were non-epithelial in
origin. Flow cytometry correctly identified no malignancy in 79 patients leaving 35 with neoplasms. Cytology identified 87 with no malignancy and 27 with neoplasm. Of these, flow cytometry correctly identified 34 specimens with one false positive and 3 false negatives. Cytology correctly identified 26 specimens correctly with one false positive and 11 false negatives. Flow cytometry correctly identified all those from cytology. The authors conclude that flow cytometry was more accurate in identifying epithelial malignancies with a higher specificity (98.7%) and a higher sensitivity than cytology (91.89% vs 70.29%) and could help ‘speed-up’ the diagnosis.
How accurate is a test for Alzheimer Disease?
Alzheimer disease is a progressive brain disorder leading to dementia and it is usually identified in people as they progressively get older. The primary cause is deposits of beta-amyloid plaques in the brain and the development of neurofibrillary tangles leading to the loss of synapses and neurons. These result in atrophy of the brain. While there is currently no cure for this disorder, there is considerable interest in identifying biomarkers for Alzheimer’s disease for clinical evaluation and disease monitoring. This would have the potential to provide early diagnosis and ultimately a way of monitoring any potential treatment which may emerge. Currently the protein phosphorylated tau (p-tau) is considered a significant blood biomarker for this disorder. Early trials indicated that it could detect Alzheimer disease. In the current publication from Sweden, the authors use a commercial test kit for p-tau217, which has a monoclonal antibody specifically against p-tau217 protein (4). This was compared with other commercially available immunoassays for other protein biomarkers and the data was assessed against internationally accepted criteria for clinical outcomes, and non-Alzheimer controls. In all the Alzheimer disease patients the ptau217 protein was raised and provided a correlation with disea-se outcomes. The authors conclude that at this stage the p-tau217 assay should be part of the diagnostic investigations and could reduce the number of interventions by providing a simple blood monitoring biomarker but considered that a wider investigation within other ethnic communities was necessary.
The sudden outbreak of syphilis in the late 15th century has led historians to conclude that it arrived in Europe following the expeditions of Columbus to the New World. However, there is an alternative concept that that syphilis had a worldwide distribution, but virulence developed over time after being present as a mild disease. Two diseases from subspecies of T. pallidium, bejel and yaws, both have distinct geographical distribution in eastern Mediterranean and western Asia, whereas yaws is associated with Africa and South America. Both seem to be distributed in relation to climatic conditions. This has led to a hypothesis that they are all the same disease but dependent on climatic and cultural conditions for manifestation. In a publication resulting from investigation by an international research team, they investigated 99 bones from a Brazilian archaeological site that were 2000-years old using paleopathology techniques (5). Previous osteological analysis of the bones had identified that they were from potential treponemal infections. Initial analysis using shotgun analysis identified 37 of the 99 as hits to the Treponema family. The investigator then went on to use high throughput Illumina sequencing using enriched DNA. Following additional analysis and molecular clock analysis the authors concluded that the ancient DNA corresponded to the Modernday Treponema pallidium endemicum the cause of modern day bejel. However, they calculated that there were emergence of modern clades significantly predating the Columbian journeys.
Additional evidence to support this has come from the discovery of T. pallidium bacteria in human remains in Finland, Estonia and the Netherlands from the early 1400s indicating some form of treponemal disease already predated Columbus. The authors proposed more research on ancient remains to try and identify the evolution of Trepomema.
Improving faecal immunological tests for stool-based colorectal cancer
Colorectal cancer is a severe worldwide health issue which has prompted the development of a rapid faecal immunological test (FIT) that has proven to be very effective as a first line screen procedure. The use of DNA analysis to improve detection and specificity has failed to provide the necessary success, primarily due to the sample type. FIT has been modified (mFIT) to include haemoglobin, calprotectin, and serpin family F member 2. This improvement has provided enhanced sensitivity for advanced neoplasms. A recent research publication from the Netherlands has evaluated the FIT and the mFIT in a population based paired design intervention study (6). A total of 15,283 paired samples were analysed from consenting participants. Overall mFIT identified more advanced neoplasia, colorectal cancer, and advanced serrated polyps than the FIT test alone. Data modelling demonstrated that mFIT could reduce colon cancer incidence mortality by 21% compared to 18% by the current Dutch colorectal cancer screening programme. The authors conclude that mFIT has potential to reductions in the long-term colorectal cancer incidence and associated mortality.
Porphyrins: what are the correct conditions for storage and handling?
The porphyria’s are a rare group of disorders resulting in a buildup of porphyrins in the body. Porphyrins are required to make haem in the biosynthesis of haemoglobin. The biosynthesis of porphyrins requires eight different enzymes to convert precursors to haem. The absence of, or a defective enzyme will result in the build-up of the porphyrin resulting in major problems in the nervous system and the skin. Virtually all cases of porphyria are inherited and the defective gene inheritance may be autosomal recessive dominant depending on the type of porphyria. As the initial diagnosis relies on demonstrating the presence of elevated porphyrins in the urine, the type of sample and storage is important as repeat investigations are uncommon. A study from Wales has investigated the sample handling and storage of samples for porphyrin investigations as published evidence was found to be limited (7). Pooled urine samples were aliquoted for seven specified time points (0 to 168 hours) and the porphyrin precursors porphobilinogen, aminolevulinic acid
and total porphyrin were measured using standard quantitative methods. Samples stored in the fridge lost 9% of the porphyrins, whereas those at room temperature lost 60% in the dark, and 90% in the light over the time period. Those left in the light lost 20% in the first 6 hours. The author’s demonstrated decreases were initiated at 4 hours when stored at room temperature and more significantly when expose to light and that degradation affected the porphyrin precursors at differing rates. Analysis of EDTA plasma porphyrins demonstrated a similar effect to that observed with urine. The authors concluded that a porphyrin loss of 15 to 20% may have a clinical impact and that all samples for porphyrin analysis should be transported and stored at +4ºC and preferably analysed with 24 hours of collection. They also recommended further work on stability when samples are frozen.
1. Adriaansen MJ, Morrison IM, Perry HE. Discrepancies between two D-dimer assays and impact of clinical decision; a retrospective analysis of sample tested in community and hospital-based laboratories in Auckland. NZ Med J 2024; 137(1589): 12-19. doi: 10.26635/6965.6302.
2. Colombo G, Aloisio E, Panteghini M. Laboratory investigation of peritoneal fluids: an updated practical approach based on available evidence. J Clin Path 2024; jpc: 2023-209282. doi:10.1136/jcp-2023-209282.
3. Gostomczyk K, Lukaszewska E, Borowczak J, Bator A et al. Flow cytometry in the detection of circulating tumor cells in neoplastic effusions. Clin Chim Acta 2024; 552: 117651. doi: 10.1016/j.cca.2023117651
4. Ashton NJ, Brum WS, Molfetta GD, Bebedet AL et al. Diagnostic accuracy of a plasma phosphorylated tau217 immunoassay for Alzheimer Disease pathology. JAMA Neurol 2024; 81(3): 255-263. doi:10.1001/jamaneurol.2023.5319.
5. Majander K, Pla-Diaz M, du Plessis L, Arora N et al. Redefining the treponemal history thorough pre-Columbian genomes from Brazil. Nature 2024; 627(8002): 182-188.
6. Wisse PH, de Klover W, vanWifferen F, van MaarenMeijer FG et al. The multitarget faecal immunochemical test for improving stool-base colorectal cancer screening programmes: a Dutch population-based, paired-design, interventions study. Lancet Oncol 2024; 25(3): 326-337. doi: 10.1016/S1470-2045(23)000651-4.
7. Gallagher CJ, Bentley L-A, Challger R et al. Stability of porphyrins and porphyrin precursors in urine and plasma samples: implications for sample handling and storage. J Clin Pathol 2024; jcp-2024-209553. doi:10.1136/jcp-2024209443.
Where did the term ‘botulism’ originate?
The Latin word for sausage is “botulus” which went into the English language as “botuliform” (sausage shaped) and “botulism”.
In the early nineteenth century a German doctor identified a new disease in some of his patients that slowly paralysed until the heart stopped. He realised that they all had eaten sausage made with cheap meat and called the disease “botulism” or “sausage disease”. He decided that the sausage must contain a form of poison and called it “botulism toxin”.
In 1885 three people at a funeral dropped dead after eating ham. The ham was examined at the hospital and a bacteria shaped like a sausage, (now described as rod-shaped) was identified and now called Clostridium botulinum.

The PPTC is committed to working alongside our neighbouring Pacific Island Ministries of Health and their National Laboratories to enable and strengthen their quest to achieve International Quality Standards of Practice, objectives and operational management. Ultimately, the PPTC is advancing and developing Pacific Island laboratories to be fully compliant to ISO15189 guidelines and therefore attain standards of practice consistent with International Accreditation status. Attaining to the requirements of ISO15189 guidelines is a globally recognised mark of efficiency and quality in the scientific profession.
In April of this year, the PPTC hosted a Laboratory Quality Management Symposium at its Centre in Wellington and invited Quality Managers (representatives from a selection of Pacific Island countries who we are closely working with for 2024 and beyond) to attend. Participants included:
1. Bineta Ruaia- Kiribati (Tungaru Central Hospital Laboratory)
2. Vandana Rajput- Fiji (Aspen Medical Laboratory)
3. Ravendra Prasad- Fiji (Colonial War Memorial Hospital Laboratory)
4. Majory Kwaina- Solomon Islands (National Referral Hospital Laboratory)
5. Senisaleti Pasikala- Tonga (Vaiola Hospital Laboratory)
6. Sandra Semi- Samoa (Tupua Tamasese Meaole Hospital Laboratory)
7. Makarita Baleinadogo- Fiji (Labasa Hospital Laboratory)
The Quality Symposium which was presented as a conference style forum provided an opportunity for Quality Managers to discuss and debate with PPTC consultants, their laboratory’s future plans and developments considering recent QMS influences, technology directives, and industry changes. This 2-week course gave excellent opportunities for Laboratory Managers/Quality Officers to enhance their skills and knowledge with reference to Laboratory Quality Management Systems and formulate workplans with the PPTC on their respective progressions towards ISO15189 accreditation requirements and the newly introduced clauses of the revised 2022 version of ISO15189.
The objectives of this Symposium are listed as follows:
1. To learn and enhance leadership management skills.
2. To be trained on the ISO15189:2022 standard (IANZ)/ SLIPTA revised documents.
3. To address new information regarding ISO 15189 (i.e.) Impartiality; Governance & Structural requirements; Greater detail needed for complaints; Corrective actions, Nonconformances; Action to address Risk opportunities; Greater
detail in sample collections and handling procedures; Information Management.
4. To draft annual/5-year plans for laboratory quality improvement – National Plans and Strategies.
5. To learn and work with PPTC’s workplan and expectations for the countries.
6. To develop ways to improve activities in the countries, specifically long-term issues.
7. To address Procurement, Personnel Management and CPD records, Internal Process Control and Quality Assurance Monitoring, Laboratory Health and Safety, Information Management and Laboratory Information Systems.
8. To develop country specific Quality Improvement projects.
9. To discuss and formulate Risk Management.
10. To identify documentation requirements including organisation policies, management responsibilities and operational processes.
11. To gain competence in service assessments and auditing practices for both internal and external expectations.
12. To acknowledge customer services including complaints, compliments, and incident reporting.
13. To gain competence in collection services and specimen reception procedures.
The PPTC wishes to acknowledge the following contributors to the Symposium: Medical Sciences Council of New Zealand, The New Zealand Blood Service, Sysmex Asia Pacific Pte Ltd., Awanui Labs, Wellington, ESR, Science and Research and International Accreditation New Zealand.

Centre based courses scheduled for the rest of 2024
• Blood Transfusion, 12th August - 6th September 2024 (4 weeks)
• FSM Quality Management Course, 24th June - 19th July 2024 (4 weeks)
• Foundations of Haematology, 23rd September - 1st November 2024 (6 Weeks)
The PPTC has now started concluding its previous Diploma cycle programme. The PPTC Diploma in Medical Laboratory Science programme is an invaluable programme to the Pacific as not only does it act as a qualifying credential to work in a medical laboratory, but it also prepares candidates as a steppingstone towards obtaining a university degree.
Two of our Consultants, Angela Lewis and Emmanuel Marshall recently made an in-country visit to the Kingdom of Tonga to carry out discipline-related training and also to celebrate the graduation of the PPTC’s 8 Tongan students who had completed the PPTC Diploma in Medical Laboratory Science. The graduation ceremony held at Vaiola Hospital involved the graduating students, laboratory management and Maryanne Saafi who is the Scholarships Officer at the New Zealand High Commission in Tonga.
The students who graduated from the Diploma programme included:
1. Muli Fe’ao Halapupuahi
2. Fe’ofa’aki ‘A Kakau Lao
3. Lutui Santa Lakiema
4. Palaki Luseane Manuiki
5. Polo Greylynn
6. Soakai Semisi
7. Tohi Laumaile
8. Vea Patelisio Kilifi

Notably, the highest achiever from the cycle was also from Tonga, and the PPTC wishes to acknowledge all students for their hard work, dedication and commitment to the programme. Students were each presented with their certificates, and speeches were given by those involved. These students will now proceed to gain permanent Laboratory Technician positions within the laboratory.
Microscopes for Haematology morphology and Gene Experts for molecular diagnostics
If any New Zealand medical laboratories have items of diagnostic instrumentation as mentioned above that have been recently upgraded or continue to be stored in the laboratory but are surplus to requirements, the PPTC would be most grateful if such items could be donated through its Centre to Pacific Island laboratories where there is an exceptional need. Pacific laboratories have very restricted budgets and often cannot afford to replace troublesome instrumentation that continues to break down, and which is often discontinued because it is so outdated.
Please contact:
Phil Wakem Chief Executive Officer Pacific Pathology Training Centre Wellington,
New Zealand
E-mail: pptc@pptc.org.nz or phil@ pptc.org.nz
Tel: 64-4-389 6294 or 027 2305483

Audit of the number of red cell units issued by Christchurch hospital blood bank to offsite private hospitals pre-operatively
Grace Adams1 and Nicola Crampton2
1University of Otago, Dunedin and 2New Zealand Blood Service, Christchurch Hospital, Christchurch
Objectives: To assess the issued to transfused ratio (I:T) of red cell units that are issued to St George’s and Southern Cross hospitals pre-operatively. To also evaluate the consumption of resources involved with the issuing of these units and asses if there any areas where there could be possible changes made to improve the preoperative blood ordering system for offsite institutions.
Methods: Information from the NZBS Christchurch hospital blood bank and e-Traceline was gathered for one month, and assessed for blood issue compared to actual usage. The blood bank has been monitoring the issuing of red cell units to private hospitals as well as the number of units returned for the past twenty-three years.
Results: There was a total of 196 units ordered preoperatively by St Georges and Southern Cross during the month of August. Of these 196 units, 169 units were returned. This in turn produced an issued to transfused ratio of 7:1.
Conclusion: The in-depth analysis of the data collected from August 2023, as well as the compiled overview from previous years, shows possible changes could be made to the issuing of blood to offsite private hospitals. Through further education and adherence to the ANZSBT guidelines, overall ordering could potentially be decreased without loss of patient welfare.
Swaleha Ali1 and Michael McCrae2
1University of Otago, Dunedin and 2Waikato Hospital, Hamilton
Objectives: Histology laboratories receive multiple tissue specimens throughout the day, including biopsies, which are small samples of tissue that have been taken from the body, for closer examination. These specimens are received in abundance and constitute a significant portion of the workload. Due to their smaller size, biopsies are prone to being misplaced or lost, especially during tissue processing. Currently, the Histology Department at Waikato Hospital uses Surgipath Haematoxylin dye to stain biopsy tissue prior to processing to facilitate macroscopic detection, post-processing. This dyeing process improves visibility and lowers the risk of accidental disposal of tissue. However, there is a current issue with the dye being washed out from the tissue during processing. This study aimed to determine a method and a dye that ensures post-processing retention without interference with any subsequent staining of the tissue or the pathologist’s ability to diagnose based on the cellular components.
Methods: A total of 60 specimens were tested over 3 runs. Multiple methods and dyes were trialled simultaneously to determine the best method and most robust dye.
Results: Across these runs, 1% Basic Fuchsin exhibited the highest durability, with a 75% retention rate. The dye bath technique emerged as the best method. Eighty per cent of all tissue subjected to this staining method retained its dye postprocessing.
Conclusion: Comparison of results across the three runs consistently indicated that 1% Basic Fuchsin and the dye bath technique proved to be the most effective in retaining tissue dye macroscopically, thus establishing the reliability of each. These findings demonstrate the potential adoption of this method and dye within the Waikato Hospital Histology Laboratory for preprocessing staining of biopsy tissue samples for enhanced macroscopic detection.
Sophia Barlow1
and Amanda Dixon-McIver2
1University
of Otago, Dunedin and 2IGENZ, Auckland
Objectives: The aim of this project was to investigate the possibility of applying human cell techniques and processes to bovine cells. The bovine cells were supplied by Opobio Aotearoa for this project. The cytogenetic techniques used in this study include adhesion culture harvest and G-banding. In a diagnostic laboratory, these cytogenetic techniques are utilized for visualising and analysing any genetic abnormalities in patient samples.
Methods: Cultured bovine cells were received at a concentration of 1 million cells/mL in a flask and were incubated overnight at 37°C with 50mL of Colcemid. Here, Colcemid binds to tubulin, obstructing the formation of spindle fibres or destroying those that have already formed, resulting in more cells at metaphase for harvest. Established solid tissue cytogenetic harvest techniques were used to harvest the cells the following day. This included the detachment of cells from the flask, using manual techniques and trypsin, and harvesting using Carnoy’s fixative. Once harvested, slides were made and aged on the same day. These slides were then banded using G-banding and viewed using a microscope. A few photos of the chromosomes were captured and manually paired, based on size and key banding hallmarks to produce several karyograms.
Results: Harvesting and banding of the bovine cells was successful. The resulting cells were analysed and four karyograms were produced. The number of chromosomes was examined, and analysis was performed for the presence of major structural anomalies, for example, translocations, duplications, or significant deletions.
Conclusion: The successful production of a G-banded karyotype from bovine cells has demonstrated that some of the techniques used on human cells also have other applications outside the human sphere and can be used across different industries.
Eva Bell1 and Gabriel Thalari2
1University of Otago, Dunedin and 2LabPLUS, Auckland
Objectives: Direct oral anticoagulants have continuously demonstrated interferences with clot-based assays. A charcoalbased reagent, DOAC-Stop, was manufactured by Haematex to eliminate direct oral anticoagulants from test plasma. LabPLUS Auckland has shown interest in incorporating this product into their laboratory. The aim of this experiment was to validate the use of DOAC-Stop at LabPLUS Auckland in removing the interference of direct oral anticoagulants in thrombophilia and lupus anticoagulant testing.
Methods: Thirty-nine samples of residual test plasma were used in this experiment. Direct oral anticoagulants were limited to dabigatran, rivaroxaban and bivalirudin. Validated protocols used at LabPLUS were implemented to obtain coagulation screen, thrombophilia screen and lupus anticoagulant screen results. Results were obtained for both pre, and post DOAC-Stop.
Results: Clear interferences were observed from all three direct oral anticoagulants, with DOAC-stop successfully removing them from the test plasma. Parameters in the thrombophilia screen demonstrated the potential for false negative results before the addition of DOAC-stop compared with the lupus anticoagulant screen that demonstrated the potential for false positive results prior to the addition of DOAC-stop.
Conclusion: DOAC-stop successfully eliminated the interferences caused by direct oral anticoagulants in both thrombophilia and Lupus anticoagulant screens. The addition of DOAC-stop into the routine procedures at LabPLUS will allow for accurate results for patients on direct oral anticoagulants.
Laura Bungard1 and YiiSen Wee2
University of Otago1, Dunedin and 2Awanui Labs, Dunedin
Objectives: The microscopic examination and cellular analysis of body fluids (BFs) is critical for accurately diagnosing many diseases. BF cell counts have previously been performed manually, but automation allows for faster and more accurate analysis. The BF mode on the haematology analyser, Sysmex XN-2000, differentiates cells into polymorphonuclear and mononuclear white blood cells (WBC) and high-fluorescent cells (HFC). The aim of this study is to evaluate the performance of HFC in the detection of malignant cells in pleural and ascites fluid, and to establish a cut-off value to aid in the early diagnosis of malignancy.
Methods: A total of 200 BF samples, including 42 malignant, from preceding years were reviewed to establish a cut-off value to investigate. Samples received during the permitted time frame were analysed on the Sysmex XN-2000, and if greater than the established cut-off of 4.2/100WBC, were sent to cytology for manual microscopy.
Results: In pleural and ascites fluids, malignant cells were not detected by cytological microscopic examination in all samples that were received over the data collection period.
Conclusion: In conclusion, the BF mode on the Sysmex XN could be an alternative method for BF cell counts, with the HFBF parameter acting as a screening tool to determine whether samples require further investigation by microscopy, but has its limitations. Therefore, in cases where the concentration of HFBF is greater than the cut-off, or there is clinical suspicion of malignancy, additional microscopic review will be required.
Acknowledgement: The authors thank Paul Spek (Cytology, Awanui Labs) for reviewing BF samples by microscopy.
Evaluation of Hgb-O and lipaemia adjustment calculations for the determination of haemoglobin in lipaemic samples
Abbey Burgess1 and Shannen Lim2
1University of Otago, Dunedin and 2Waikato Hospital Laboratory, Hamilton
Objectives: The importance of recognising and re-establishing haemoglobin values for lipaemic specimens cannot be overstated, as it is imperative to ensure the accuracy of released patient results. The objective of this study was to determine the level of correlation between Hgb-O and lipaemia adjustment calculation methods for the determination of haemoglobin in lipaemic samples when compared to the current gold standard, Hemocue.
Methods: Forty EDTA samples (MCHC <368) were randomly selected for analysis, including 25 for the creation of lipaemic samples (368<MCHC<440) using 3% Intralipid. All samples were tested in parallel with XN-20 and Hemocue201+ analysers and the lipaemia adjusted calculation was performed subsequently. The Royal College of Pathologists Australasia’s (RPCA) Analytical Performance Specifications for haemoglobin measurement (Hb ±5 ≤100 g/L, Hb ±5% >100 g/L) were used to determine the significance of results.
Results: Paired t-test derived p values for Hgb-O and lipaemia adjusted calculations were 0.027 and 2.12E-09 respectively, indicating a statistically significant difference. Bland-Altman plots demonstrated agreement of Hgb-O and Hemocue measurements with mean differences of 1.0 g/L (Hb ≤100 g/L) and -4.9% (Hb >100 g/L). Lipaemia adjusted calculations met only the upper limit with a mean difference of 2.9% (Hb >100 g/L). However, Passing Bablok regression analysis determined a strong agreement between Hemocue and Hgb-O (r=0.993) and lipaemia calculation (r=0.996) results.
Conclusion: Findings highlighted the inability to accurately determine the correlation between haemoglobin measurement methods in laboratory made lipaemic samples. To determine if a change should be implemented for the measurement of lipaemic patient samples, it is necessary to perform further studies with
a larger sample size including true lipaemic samples to remove extraneous variables.
Katelyn Carter1, Sian Horan2 and Christian Christian2 1University of Otago, Dunedin and 2Awanui Labs, Dunedin
Objectives: Soluble fms-like tyrosine kinase 1 (sFLT-1) is an anti-angiogenic protein secreted from the placenta which is elevated in pregnant people with pre-eclampsia. In combination with placental growth factor (PlGF), the sFLT-1/PlGF ratio can be used to predict pre-eclampsia in women when the syndrome is suspected clinically. The aim of this project was to evaluate the Roche Elecsys sFLT-1 immunoassay for use at Awanui Dunedin. Methods: Twenty specimens were selected from uric acid requests and run on the sFLT-1 assay onboard the Cobas 8000 e602 unit. Specimens were tested at both Middlemore Hospital and Awanui Dunedin after being frozen at -20 degrees Celsius. Between run data was generated by daily running of BioRad quality control material for 1 month. Statistical analysis was performed using the Bland-Altman plot, ordinary Deming regression and Student’s t-test via Analyse-it.
Results: Visual analysis of the results showed similar values between sites. Limits of agreement (95%) in the Bland Altman plot were -64.41 to 341.74 and ordinary Deming regression generated a slope equation (y= 88.4 + 1.011x) showing 1% difference in values between sites. A p value of <0.0001 was derived from the Student’s t-test. Between and within-run stability was within acceptable levels.
Conclusion: The difference between assay sites was deemed statistically significant by the p-value, however clinical significance is uncertain as there are no available allowable limits of performance for sFLT-1. Inter and intra run data showed good assay stability. sFLT-1 would be a beneficial addition to the laboratory based on performance data.
Megan Casey1 and Karen Murcott2
1University of Otago, Dunedin and 2Awanui Labs, Dunedin
Objectives: The grossing room receives a large variety of specimens which require certain guidelines to be followed for dictating a gross description and cutting the specimens. These guidelines will ensure that representative sections are taken for pathologists to confidently diagnose patients. Bowel cancer is one of New Zealand’s most commonly diagnosed cancers and the second most common cause of death caused by cancer, with around half of patients developing metastases. The case study followed a 59-year-old female who presented with a two month change in bowel habits. A biopsy and CT scan diagnosed stage IVa locally advanced oligometastatic rectosigmoid adenocarcinoma. A cycle of neoadjuvant treatment was given before a combined high anterior resection and left lateral segmentectomy was performed. A final grade based on WHO 5th edition and AJCC 8th edition of low grade metastatic colorectal adenocarcinoma was given.
Methods: The specimens were opened to allow proper formalin fixation. The following day, a pathologist registrar performed the grossing procedure where a dictation detailing the specimen information was made and specific sections were taken. There were 11 sections submitted from the high anterior resection and four liver sections.
Results: The results from the two specimens demonstrated low grade metastatic colorectal adenocarcinoma. The margins were clear and there was no nodal involvement for either specimen, which are good prognostic indicators for her being cured.
Conclusion: The case study explored a 59-year-old female patient’s specimen from its arrival to the grossing room through to the final diagnosis. The patients’ specimen demonstrated no residual tumour, clear margins, and no nodal involvement. Additionally, the case study explored the success of neoadjuvant treatment performed previously to surgical removal of the rectosigmoid and liver sections.
Jessie Chen1 and Wendy Shaddick2
1University of Otago, Dunedin and 2Middlemore Hospital Laboratory, Auckland
Objectives: To investigate the performance of the AST (aspartate aminotransferase) assay at Middlemore Hospital Laboratory (MMH) to validate the manufacturer’s claims.
Methods: A total of 80 patient samples were selected to make four patient pools: interference low, interference high, precision low and precision high. Both levels of the precision pool were aliquoted into 5 tubes respectively and were run in duplicate on the analyser for 5 days to give the intra-batch and interbatch results. Dilutions were made separately for both levels of interference pool to determine the haemolysis and lipaemic index. A high AST patient sample and a low AST patient sample in their gel heparin tubes were run on the analyser for 7 days to evaluate their stability. A serial dilution of a high AST sample with 4% albumin was performed to determine the linearity. A correlation study was performed by selecting 23 patient samples with AST results ranging from 10 to 862 U/L and the results were compared between Roche Cobas c702 analyser on Line 1 and Line 2.
Results: Both intra-batch and inter-batch precision showed results closer to the ideal value. The lipaemic index for high-level plasma had a cut-off value of 190. The AST assay was stable for 7 days at 3 °C. It had a good linearity with a correlation coefficient of 0.9999. An excellent correlation was shown between both lines.
Conclusion: Our study demonstrated that the AST assay at MMH performed well and it had validated the manufacturer’s claims. The performance of the AST assay on both lines of the analyzer also correlated well and showed similar results. Further investigation of the cut-off level for haemolysis (approximately between 28 to 66 for low-level and between 30 to 99 for highlevel) and lipaemic index for low-level plasma (approximately between 120 to 160) may need to be carried out.
Yi Xuan Chong1 and Charlotte Hughes2
1University of Otago, Dunedin and 2Middlemore Hospital Laboratory, Auckland
Objectives: The erythrocyte sedimentation rate (ESR) is a commonly used test to investigate or monitor inflammation in the body that is caused by infection or autoimmune disease. The automated Microsed-System ESR analyser by ELITechGroup is based on the modified Westergren ESR method. The aim was to evaluate and validate the analytical performance of the MicrosedSystem analyser and compare the results with the currently-inuse Mix-Rate Automated analyser by Vital Diagnostics.
Methods: One hundred EDTA whole blood patient samples were tested on both analysers and compared with Bland-Altman plots using 95% limits of agreement, and a linear regression plot. Quality control material was also used to test the precision of the new instrument.
Results: Bland-Altman analysis showed a small bias of 0.22mm with the Microsed generally giving slightly lower values. The Microsed had a coefficient of variation of 3.02 in the higher range compared to the Mix-Rate’s CV of 0.76.
Conclusion: The results showed the analytical validity of the Microsed with comparable results to the previous analyser. It improved test times due to the lack of an automated mixing phase, and improved audits of patient results and sample validation with the attached barcode reader.
Tiffany Gunn1, Catherine Cahill2 and Karen Elizabeth2
1University of Otago, Dunedin and 2Awanui Labs, Invercargill
Objectives: The HCG STAT kit was designed to measure hCG (human chorionic gonadotropin) in half the time of the older HCG+β kit. Validation & comparison studies have confirmed the reliability of the kit, leading to Awanui Labs Invercargill using the HCG STAT kit routinely. However, since changing the kit, hCG results for the Royal College of Pathologists of Australasia Quality Assurance Programme (RCPAQAP) endocrine samples have fallen outside of the RCPAQAP allowable limits of performance. This comparison aims to determine if the RCPAQAP allowable limits of performance should be revised for HCG STAT kits.
Methods: Quality controls and calibrations were done on the HCG+β kit for six weeks prior to beginning the comparison. Forty patient samples were then tested using both the HCG STAT kit and the HCG+β kit, on both the Cobas Pro and Pure analysers. This was to establish that the results were comparable between the kits, and between the analysers. Twenty RCPAQAP endocrine samples were then tested and compared using both kits on the Cobas Pure.
Results: Patient results were comparable between the two kits, and also between the two analysers. However, although the HCG+β kit results for the RCPAQAP endocrine samples were within the RCPAQAP allowable limits of performance, the results from the HCG STAT kit were not.
Conclusion: The HCG STAT kit is able to reliably be used on patient samples. However, the HCG STAT kit is not comparable to the HCG+β kit when testing RCPAQAP endocrine samples. This indicates that RCPA should revise the target means for laboratories using the HCG STAT kit, rather than derive the target mean using results from both the HCG+β kit and the HCG STAT kit.
Validation of a copy number variant calling pipeline developed at Canterbury Health Laboratories using digital droplet-PCR
Margaret Lilley1, Sabine Grey2 and Kylie Drake2
1University of Otago, Dunedin and 2Genetics, Canterbury Health Laboratories, Te Whatu Ora Waitaha, Canterbury
Objectives: Copy number variants (CNVs) are duplications or deletions that range from single exons to several megabases in size. The copy number changes can alter mRNA and protein expression levels, leading to a large range of phenotypes. Identifying disease-causing CNVs is crucial in diagnostics. As part of their whole exome sequencing efforts, CHL has developed a CNV calling pipeline for short-read sequencing data. This study aimed to validate the pipeline by confirming the CNV called by digital droplet-PCR (ddPCR), as part of a pilot study.
Methods: Three duplications of varying sizes and one deletion CNV were selected for validation (PCCA, BACH2, TMEM14A, and FAF1) EcoRI was used to digest DNA samples, and PCR was conducted inside oil-water emulsion droplets that were generated. Two primer sets (test and control) at different concentrations were used to manipulate the PCR efficiency between the test and control population. This allowed for multiplexing with EvaGreen dye, which binds non-specifically to dsDNA and emits a fluorescent signal. The fluorescence intensity ratio between the test and control population was calculated to determine the presence of a CNV.
Results: Only the PCCA variant called by the pipeline was confirmed by ddPCR. The BACH2 variant could not be confirmed due to limited DNA. The TMEM14A and FAF1 duplications were copy neutral and likely false positive calls.
Conclusion: The Genetics Department at CHL will need to make improvements to the pipeline to reduce the false positive calls, requiring ongoing ddPCR confirmation until the team is confident with the accuracy of the pipeline.
Celeste Linley1, Dave Coles2 and Dale Coburn2
1University of Otago, Dunedin and 2Medlab Central, Palmerston North
Objectives: Serum protein electrophoresis is a technique
which separates proteins based on how they move through an electric field. This technique is frequently used to identify and monitor monoclonal gammopathies such as myeloma as well as identifying polyclonal gammopathies which may be caused by a reactive or inflammatory process. The aim of this project was to compare gel and capillary based serum protein electrophoresis results for patients.
Methods: Twenty-three samples with a range of monoclonal immunoglobulins and other abnormal serum protein distributions were identified and were run on both gel and capillary electrophoresis.
Results: There was a significant difference when comparing the gel electrophoresis results with the capillary electrophoresis results in alpha 2, beta 1 and beta 2 groups. However, in the albumin, alpha 1, gamma regions the results were not significantly different. The measurements for monoclonal immunoglobulin bands were also not significantly different between the two methods. Interestingly some monoclonal bands were found in to be in different regions in the gel electrophoresis than the capillary.
Conclusion: Although there were differences between the two methods, the measurements for monoclonal immunoglobulin bands did not vary significantly. This is what is used to monitor myeloma patients’ progression and their response to treatment. Due to this, a significant difference in the monoclonal band measurements between the two methods could result in confusing results and potentially negatively impact patients if they are not recognised.
Abi McCullagh, Remeny Weber, Linda Horne and Benedict Seo Oral Pathology Centre, University of Otago, Dunedin
Objectives: To determine whether the process of surface decalcification compromises the antigenicity of Ki-67, CD34 or S100 in specimens obtained from fibroepithelial polyps and periapical granulomas.
Methods: Surface decalcification was performed using 8.5% formic acid on consented specimens (n=10) with a final diagnosis of either fibroepithelial polyp or periapical granuloma. Nine sections were cut from each block. Three sections from each block underwent no surface decalcification, three underwent surface decalcification for ten-minutes and the remaining three were decalcified for thirty minutes. Immunohistochemistry was performed on all slides using antibodies against Ki-67, CD34 and S100 on the Leica BOND III and Leica Bond RX.
Results: Staining intensity for each antibody was evaluated by qualitatively examining each section using the BX53 Olympus microscope. One photograph per section was taken using the inbuilt camera and associated cellSens software. Sections which contained a significant amount of artefact were excluded in analysis. A decrease in staining intensity was observed for Ki-67 at thirty-minutes but no change was observed for CD34 or S100. Conclusion: Thirty-minute surface decalcification caused a decrease in staining intensity for Ki-67. For CD34 and S100, intensity did not change. The number of positively stained cells for Ki-67, CD34 and S100 did not change after surface decalcification for thirty-minutes. However, a semi-quantitative analysis would be needed to further validate this finding.
Kyle McLean1 and Helen Vanderloo2
1University of Otago, Dunedin and 2Awanui Labs, Dunedin
Objectives: dsDNA antibodies are highly specific to systemic lupus erythroniums (SLE). The detection of dsDNA antibodies is used in the classification of SLE. The Farr assay is a radioimmunological assay used to detect high avidity IgG and IgM dsDNA antibodies and is considered the gold standard in dsDNA antibody detection. However, due to the radioactive component of the assay alternative assays have been considered, such as the Bio-Flash. The Bio-Flash assay detects only high avidity IgG
dsDNA antibodies. However, IgM dsDNA antibodies are less clinically significant in the diagnosis of SLE. The purpose of this study was to compare the Bio-Flash assay to the Farr assay for identification of dsDNA antibodies.
Methods: The dsDNA antibody test on the Bio-Flash is a chemiluminescent immunoassay. Calibration and quality control results were obtained prior to testing of patient samples. Sixtynine patient samples were tested using the Farr assay, these samples were frozen upon completion and put aside to be tested using the Bio-Flash assay. Forty-nine of these were previously positive and 20 were previously negative based on the Farr assay results. The Bio-Flash results were collected and compared against the Farr assay results.
Results: Of the 69 samples that were tested on the Bio-Flash a total of 20 discrepant results were collected. The correlation, frequency and inter-rater agreement of the results were compared.
Conclusion: Due to the Bio-Flash results not being fully concordant with the Farr assay results in combination with the moderate correlation and agreeability of the assays, the BioFlash assay was found to be unreliable for standalone use. The Farr assay would need to remain in use along with the Bio-Flash assay if the assay were to be integrated.
Comparison between immediate spin and room temperature incubation in tube and gel card techniques for ABO reverse grouping
Rei Miyamoto1 and Kate Anderson2
1University of Otago, Dunedin and 2NZBS Blood Bank, Dunedin
Objectives: ABO blood grouping is the most important pretransfusion test and requires both forward and reverse grouping. This project aimed to determine if 10 min room temperature incubation sufficiently enhances weak reverse groups in the card and tube techniques, based on the updated manufacturer’s guidelines.
Methods: Eleven patient samples with weak reverse groups on the Erytra Eflexis automated blood typing system (Grifols) were re-tested by immediate spin and with 10 min room temperature incubation, by manual card and tube techniques. The correct antisera (sample or reagent) were mixed with the corresponding red cells (sample or reagent). The additional incubation was done before centrifugation. Red cell agglutination was interpreted using the 0-4 grading scale in cards and the 0-12 grading scale in tubes. Results were recorded on Microsoft Excel and then analysed on RStudio.
Results: Of the samples, 36% (4/11) showed an enhanced reverse group in the card method with 10 min incubation. The tube method displayed an increased reaction in the reverse group in 80% (8/10) of the samples, with a statistically significant difference between the immediate spin and 10 min incubation (p=0.002).
Conclusion: Additional incubation at room temperature was found to enhance the reverse group reactions in some samples. However, the enhancement in the card method was not significant enough to implement the modification in New Zealand Blood Service laboratories. This study had insufficient sample numbers and low variability in patient demographics; therefore, further studies are required to draw a more reliable conclusion.
Nasrin Neyyan1 and Yii Sen Wee2 1University of Otago, Dunedin and 2Awanui Labs, Dunedin
Objectives: Sepsis can cause coagulopathy, which can progress to disseminated intravascular coagulation (DIC). The International Society of Thrombosis and Haemostasis proposed the sepsis-induced coagulopathy (SIC) score for early diagnosis of DIC. SIC signifies the compensated phase of DIC. The Awanui Haematology Labs in Dunedin does not have access to the cardiovascular SOFA score incorporated in the sequential organ failure assessment score. Therefore, the lab modified the SIC score and suggested a SIC of ≥4 to determine SIC. This study aimed to evaluate the modified SIC score efficiency for
screening sepsis-induced coagulopathy and determine whether the SIC score of ≥4 can be a reliable indicator of sepsis-induced coagulopathy.
Methods: A retrospective study was conducted on inpatients and outpatients. The study analysed patients with coagulation results indicating fibrinogen >4.5g/L and an International Normalized Ratio >1.2. The SIC score was calculated, and results were compared between patients with and without sepsis. Statistical analysis was performed using receiver operating curve analysis to obtain the area under curve (AUC), sensitivity, specificity, and negative predictive value for different cut-offs. The Youden index from the study was used to decide the optimal cut-off score.
Results: ROC analysis showed an AUC of 0.90. It was found that a SIC score of ≥ 3 had higher sensitivity, negative predictive values, and Youden index (0.971, 0.9, and 0.6637) than a SIC score of ≥4 (0.7714, 0.5789, and 0.6179).
Conclusion: The study suggests that the modified SIC score of ≥3 can be used for screening sepsis-induced coagulopathy. However, the analysis is inconclusive, and further investigation is required to validate the research as the study had a low prevalence of negative septic patients.
Annabel Parker1 and Aaron Keene2
1University of Otago, Dunedin and 2Awanui Labs Christchurch
Objectives: The aim of this study was to investigate antibiotic resistance in clinical isolates of Campylobacter jejuni and Campylobacter coli. As Campylobacter infections are treated empirically, resistance to current antibiotic treatment options is not closely monitored.
Additionally, no current MIC breakpoints exist for azithromycin, therefore this study also aimed to identify these values in parallel to the antibiotic susceptibility survey.
Methods: Thirty-one clinical isolates were obtained from patient samples and cultured following EUCAST standard protocols. Isolates were tested for erythromycin, tetracycline, and ciprofloxacin susceptibility using antibiotic diffusion discs. Azithromycin E-tests were additionally used to determine clinical MIC breakpoints. All results were referred to EUCAST guidelines for final interpretations, and azithromycin E-test results followed erythromycin E-test breakpoints.
Results: No Campylobacter isolates were resistant to erythromycin or azithromycin, 13% of C. jejuni isolates were resistant to tetracycline, and 21.7% of C. jejuni isolates were resistant to ciprofloxacin. C. coli isolates (100%) were susceptible to all tested antibiotics.
Azithromycin E-test and erythromycin disc susceptibility had a moderate correlation of 66.8%.
Conclusion: The lack of erythromycin resistance seen in this survey and low rate (0.19%) reported by EUCAST confirms the viability of erythromycin as an empiric first-line treatment. Ciprofloxacin and tetracycline appear non-preferential in-vitro as an empiric treatment due to the higher prevalence of resistance. The lack of erythromycin resistance also resulted in the inability to determine azithromycin E-test MIC breakpoints, and due to the low correlation value, this is unable to be inferred from erythromycin zone size breakpoints.
Verification of the Virclia® Covid-19 IgG Spike
Anjali Raju1 and Paul Tustin2
1University of Otago, Dunedin and 2Awanui Labs, Wellington
Objectives: The aim of this experimental study was to verify the applicability of the Virclia® Covid-19 Spike IgG assay for routine diagnostic Covid serology. The verification was conducted by comparing the assay’s performance with the established Abbott® Covid Spike IgG assay.
Methods: A total of 37 patient samples (plasma/serum) that were received at the laboratory for covid serology were tested. All samples were analysed using the Abbott® Covid Spike IgG assay to obtain a quantitative result for spike antibodies present
in the sample. Each sample was then tested using the Virclia® Covid Spike IgG assay. The quantitative results obtained from the two assays were statistically analysed to determine concordance and correlation.
Results: Among the 37 samples tested, only three showed discrepant results between the two assays. The Virclia® assay gave negative results for these 3 samples, whereas the Abbott® indicated positive results for each. This disparity is likely due to the differing sensitivity of each kit. The quantitative Abbott® result shows the results sit very close to the cut-off between negative and positive. Further statistical analysis using correlation graphs show a strong positive correlation between the two assays, supported by a Pearson’s r value of 0.730.
Conclusion: This study was able to verify the use of the Virclia® Covid-19 Spike IgG assay. Statistical analysis shows that the performance of the Virclia® assay is aligned comparably to the existing Abbott® serological assay. These findings support the Virclia® assay’s reliability for routine Covid-19 serological diagnostics.
Jacinta Richardson1 and Matthew Fawkner2
1University of Otago, Dunedin and 2Awanui Labs Taranaki
Objectives: Immunoglobulins are glycoproteins that initiate mechanisms to destroy foreign antigens. The levels of immunoglobins can give an insight into the condition affecting a patient. Awanui Labs in Taranaki are looking to start testing immunoglobulins instead of referring samples to Awanui Labs in Wellington. The purpose of this project was to evaluate the analytical performance of the immunoglobulin assays of the c503 module of the Cobas Pro analyser at the Taranaki laboratory.
Methods: A comparison study was performed using 40 patient samples that were tested for immunoglobulins (IgA, IgG, IgM) in both the Taranaki and the Wellington laboratories. The results from the two laboratories were then compared using the software Analyse-it to evaluate the agreement between the results. A precision test was also carried out on in the IgM reagent due to issues with aging reaction cells.
Results: The r values for IgA, IgG, and IgM were 0.997, 0.996, and 0.999 respectively. Many of the IgA and IgG results did not fall within the RCPAs allowable limits of difference between the two laboratories. The precision check for IgM demonstrated serious inconsistencies with the results as the reaction cells aged.
Conclusion: The immunoglobulin levels showed sufficient correlation with the Wellington results. However, despite this correlation, there was a significant number of results that were outside the limit of difference, particularly for IgA. This problem would need to be rectified before the Taranaki Laboratory would be able to test for immunoglobulins on patient samples.
Isobel Ross1, Naomi Lisboa2 and Alan Neal2
1University of Otago, Dunedin and 2Pathlab, Rotorua
Objectives: The aim of this investigation was to determine how VCS measurements on the Beckman Coulter DxH 900 analyser change during sepsis and if monocyte and neutrophil data can be used simultaneously to predict sepsis better than the data from one cell population alone.
Methods: The VCS measurements for monocytes and neutrophils from the white cell differential analysis on the Beckman Coulter DxH were recorded and compared between two groups. The first group was a healthy control group, and the second group was the sepsis group selected from patients with a positive blood culture. The VCS measurements for the groups were compared by a t-test and the parameters with the highest statistical difference from the monocyte and neutrophil populations were further analysed to determine their individual and joint sensitivity and specificity.
Results: Many of the VCS parameters showed a statistically significant change during sepsis. Standard deviation of volume
of monocyte population (SD-V-MO) and standard deviation of AL2 scatter of neutrophil population (SD-AL2-NE) showed the greatest difference between the sepsis and control groups. The sensitivity and specificity of the combined parameters was shown to be greater than using one parameter alone.
Conclusion: The use of multiple VCS parameters from both monocyte and neutrophil cell populations may provide more information about a patient’s condition and probability of sepsis than the use of a single parameter alone.
Johny Slade1, Philippa Holdaway2, Joanne Webb2 and Cassandra Muir2
1University of Otago, Dunedin and 2Awanui Labs, Wellington
Objectives: This project aimed to validate the performance of the CO2-L Cobas 500 series assay for the determination of bicarbonate in serum and plasma, replacing the currently used ABL800 blood gas analyser. This project was previously attempted using frozen samples with poor correlation, so was repeated using fresh patient samples.
Methods: Validation using patient samples (n=29) was done by comparing the bicarbonate results when tested on both analysers. Results from the ABL800 were used as the reference method for comparative analysis. Validation included statistical comparisons between methods using calculated mean difference, PassingBablok regression, and Bland-Altman analysis of levels of agreement.
Results: The mean difference between the two methods was -2.67, suggesting some negative bias in the Cobas assay. However, the Passing-Bablok equation for linear regression was y = -1.406 + 0.944x, which suggests no significant systemic or proportional bias is present. Bland-Altman analysis displayed >95% conformity to the limits of agreement, which also indicates an acceptable level of agreement between the methods is present.
Conclusion: Further validation is required to improve the statistical certainty of these findings before confidently utilising this method. This would require a larger sample set with the inclusion of RCPA samples. Current evidence of bias from the mean difference may be explained due to comparing a method of direct measurement to a calculated method of quantification that uses the Henderson-Hasselbalch equation.
Judea Smith1 and Koen Van Der Werff2
1University of Otago, Dunedin and 2Awanui Labs, Wellington
Objectives: In the clinical microbiology laboratory, faecal pathogens can be detected from faecal specimens through PCR. The objectives of this study were to investigate the resulting takeoff (T/O) values of the detected pathogens (Salmonella, Yersinia, and Campylobacter) and whether they would grow on a plate, to investigate the possibility of reducing the T/O value acceptance range.
Methods: Faecal specimens from 155 patients with gastrointestinal issues were used in this study; 50 were Salmonella positive, 50 were Yersinia positive, and 55 were Campylobacter positive To detect faecal pathogens, DNA must be extracted and amplified. Pathogen DNA from patient faecal specimens was processed and extracted using the MagNa Pure 96 instrument, followed by a pre-amplification reaction step performed on the High-Plex processor/robot, and an amplification step performed on the High-Plex analyser. If the specimen came back with a positive result (a T/O value) for the detection of a faecal pathogen, the faecal specimen was streaked out onto the appropriate agar and incubated for 24-48 hours under specific conditions (such as temperature and O2 and CO2 environments) depending on the pathogen’s requirements.
Results: Analysis showed that positive specimens with late T/O values (19 and over) do not tend to grow when isolated onto a plate, however, a few will. Majority of positive specimens within the acceptable range of T/O values will grow on a plate, but not
all.
Conclusion: This study demonstrated that the current T/O acceptance range remains optimal. Before any changes to current guidelines can be made, the T/O value acceptance range should be studied further.
Brandon Su University of Otago, Dunedin
Objectives: Quantification of rivaroxaban anticoagulants may be requested from clinicians to assess the bleeding risk of patients before surgery. The current assay, consisting of the Innovance Heparin reagent (Siemens) calibrated on Biophen rivaroxaban standards (Hyphen BioMed), is to be replaced by the new Innovance Anti-Xa assay (Siemens). This study aimed to evaluate the performance of the Innovance Anti-Xa assay compared to the current method to verify its use on the two CS2500 analysers at Medlab Central, Palmerston North.
Methods: Specimens consisted of citrated platelet-poor plasma of patient samples that had been tested for rivaroxaban. Samples were stored at -70°C and thawed at 37°C for 10 minutes before testing. Rivaroxaban levels for each specimen were tested on each of the two CS2500 analysers on both the Innovance AntiXa and In-house assay. The consistency of the results between analysers and methods was compared using statistical analysis. Results: Quantification of rivaroxaban in 32 samples were included in this study. Results showed a good agreement between results between CS2500 analysers, with a mean difference of -4.5ng/ml. A significant negative proportional bias with a mean difference of -37.7ng/ml was identified between the Innovance Anti-Xa and In-house assay.
Conclusion: Results of the Innovance Anti-Xa assay for rivaroxaban showed interchangeability between the two CS2500 analysers. High measurements of rivaroxaban were not interchangeable between the two methods. However, the clinical significance at clinically relevant levels of around 100ng/ml and below was unable to be determined due to insufficient data at these levels.
Acknowledgement: The author thanks staff at Medlab Central, Palmerston North for supervision of the project.
sarcoma: A brief overview and the role of CD68 and CD163 in immunohistochemistry diagnosis
Mosie Su’a1, Tania Slatter1 and Amanda Fisher2 1University of Otago, Dunedin and 2Awanui Labs, Dunedin
Objectives: Assess the reliability and effectiveness of CD68 and CD163 as biomarkers in the immunohistochemical diagnosis of histiocytic sarcoma and thereby determine which is the superior biomarker.
Methods: At Awanui’s histology department, CD68 at present is being used in immunohistochemistry (IHC) as the primary biomarker for identifying histiocytes. Given that CD163 is not currently employed by the histology department for histiocytic lineage identification, a new protocol was developed specifically for CD163 on the Ventana Benchmark Ultra (Roche) Autostainer. To evaluate their comparative utility, we selected six patient specimens, including three skin samples, one tonsil, one bone marrow trephine, and one lymph node sample. Each specimen underwent duplicate IHC tests, one using CD68 and the other using CD163.
Results: Both histiocytic markers CD68 and CD163 stained similar regions within the tissues, as anticipated. However, CD163 consistently provided superior results, including better contrast, darker staining, and a higher degree of staining intensity. Additionally, in both stains, the clarity of the background and counterstain were exceptional with very minimal background and non-specific staining.
Conclusion: Both CD68 and CD163 effectively identified and showcased histiocytes within the tissue samples, and the results generated by these two biomarkers were mostly congruent and in alignment with one another. Following a thorough review of the
findings with both my supervisor and a pathologist, we collectively agreed that CD163 proved to be a superior biomarker for the immunohistochemical detection of histiocytes, and ultimately the diagnosis of histiocytic sarcoma. This finalisation was based on CD163’s superior contrast, more prominent staining, and greater staining intensity compared to CD68.
Sathu Sugath1, Rebecca Dew2, Miek Dilcher2 and Rodger Linton2 1University of Otago, Dunedin and 2Canterbury Health Laboratories, Christchurch.
Objectives: At present, Canterbury Health Laboratories (CHL) tests for Varicella Zoster Virus (VZV) IgG using the EUROIMMUN assay on the TRITURUS. However, the manufacturer has decided to discontinue the production of materials needed to operate the TRITURUS. Due to the oncoming change and increased workload, CHL is looking to move VZV testing to another analyser, the LIAISON. The LIAISON uses the DiaSorin assay to test for VZV immunity. This study aimed to compare the two assays to see whether the results were significant enough to move VZV testing to the LIAISON.
Methods: For this study, 90 patient samples previously tested using the EUROIMMUN assay between July to August were used. An assortment of positive, negative, and equivocal samples were selected. The VZV quality controls and calibrators were run on the Liaison following the daily maintenance procedures. The samples were vortexed and spun down before being placed on the X-marked racks and loaded into the analyser. The tests were then manually selected on the screen.
Results: Log data from the DiaSorin assay was compared to the log EUROIMMUN results. Passing-Bablok analysis revealed no systemic bias and an R-value of 0.83, indicating a positive linear relationship between the two methods. The Bland-Altman scatter plot signifies a similar distribution between the two, accounting for a few outliers.
Conclusion: This study was able to validate the DiaSorin method to run the VZV IgG assay on the LIAISON. The results obtained through method comparison suggest that both assays have a positive correlation and did not vary significantly.
Analupe Utumoengalu1 and Regie Iñigo2
1University of Otago, Dunedin and 2LabPLUS, Auckland
Objectives: Immunohistochemical detection of pituitary adenomas includes a panel of hormonal antibodies, but studies have suggested targeting transcription factors in pituitary adenoma lineages for more specific and possibly more costeffective investigations. Of the three pituitary transcription factors, TPIT is currently not used at LabPLUS and is not available at any other laboratory in New Zealand. Therefore, optimizing the Abcam CL6251 TPIT antibody clone for immunohistochemistry in-house use will provide a holistic and specific approach to pituitary adenoma diagnosis.
Methods: Using a 1:1000 dilution of Abcam CL6251 TPIT antibody clone on three known positive control pituitary adenoma controls and two known negative pituitary controls on a set of different immunohistochemistry protocols in the BOND III machine
Results: Slides tested in low pH, high pH for 20 minutes and 30 minutes resulted in positive staining but with notable background staining and weak to no internal control staining on the normal pituitary tissue. Slides with low pH for 60 minutes had good positive staining but internal control failed in normal tissue whereas slides that were tested in high pH for 60 minutes resulted in crisp nuclear staining on all tissues tested with good internal control staining on the normal pituitary gland.
Conclusion: The clinical evaluation showed that the optimized immunohistochemistry protocol for Abcam CL6251 TPIT antibody clone is a 1:1000 dilution in 15-minute antibody retrieval incubation, high pH for 60 minutes.
Sanjana Vemula¹ and Sian Horan2 1University of Otago, Dunedin and 2Awanui Labs, Dunedin
Objectives: Canterbury Health Laboratories is the only laboratory in New Zealand that provides PLGF testing for suspected pre-eclampsia cases. Awanui labs Dunedin is now performing a method evaluation on COBAS e602 to implement PLGF testing in Dunedin.
Methods: For comparability testing, 20 suspected pre-eclamptic patient samples were split into 2 vials. One was sent to Middlemore Hospital, and the other was kept in Dunedin. Both sets of samples were tested on the COBAS e602 module to see if the results were consistent. Simultaneously, quality control on PLGF reagents was run once every day to record reagent stability. For in-batch testing, one sample was run ten times consecutively to determine its range of variation.
Results: The analysis of 20 patient samples showed a value of 341.015 from Middlemore and 339.001 from Dunedin with a difference of 2.014. The correlation coefficient was determined to be 0.995 (r) indicating a strong positive correlation between the results obtained from both locations. Furthermore, based on the Wilcoxon p-value (0.8659), it suggests that we should not reject the hypothesis at a significance level of 5%. The variation for in-batch testing was low, at ±1.28. While between batch quality control remained stable and consistent within 2 SD.
Conclusion: Once a patient has started showing symptoms of preeclampsia, they are required to stay in the hospital for further testing and monitoring in case of developing preeclampsia. By funding PLGF tests and implanting them in more hospitals, pregnant women can avoid the stress of traveling long distances while also saving the hospital’s limited beds. The method evaluation shows promising results for the test to be implemented in Dunedin.
Harry Ward-Hayes1, Dr Stephen du Toit2 and Greg Cupido2 1University of Otago, Dunedin and 2Te Whatu Ora, Waikato
Objectives: This research aimed to validate Roche’s Cobas CERU (ceruloplasmin) assay for clinical use. This is a result of the current Beckman Coulter IMMAGE analyser being >20 years old and becoming unreliable.
Methods: Thirty-nine previously tested samples were collated to run a comparison on the Cobas pro analyser. The data was then modified using Passing-Bablok regression analysis and compared to determine the accuracy of the Cobas assay. Additional tests were also run on random samples to confirm the claims about the assay interference, linearity, reproducibility, and sample stability. This data was then assessed using percent recovery and coefficient of variation.
Results: The raw comparison data was not concurrent between the two methods, with Cobas results ranging from 0.133 g/L to 0.452 g/L, while IMMAGE results ranged from 0.14 g/L to 0.72 g/L. However, this difference was also seen in the reference intervals for the assays. Therefore, after modification using the slope of the Passing-Bablok regression plot, the Cobas results were more concurrent with the IMMAGE results. Additionally, the other investigators found good recovery from the interference, linearity, carry over and precision checks, and sample stability all having difference <12%.
Conclusion: This investigation found the two assays are comparable and can be used interchangeably. However, it is important they use their respective reference intervals to prevent inaccurate interpretation. Additionally, the claims made by Roche in the assay’s packet insert were also verified and the assay was verified for clinical use.
Chloe Williams1 and Gareth Ashton2
University of Otago, Dunedin1 and Awanui Labs, Taranaki2
Objectives: The Leica HistoCore Pegasus had recently been installed to replace the Leica ASP200S for processing at Taranaki Pathology Services. This research assesses the analytical quality of tissue processed by HistoCore in comparison to the ASP200S using routine stains, immunohistochemistry, and light microscopy. By conducting this research, protocol and reagent modifications of processing can be made to meet the requirements of the histology laboratory at Awanui Labs, Taranaki.
Methods: Fourteen samples of recent histology specimens with remaining tissue were placed in labelled cassettes in duplicate and processed by either ASP200S or HistoCore. They were then embedded, sectioned, and stained. The stains involved were H&E, Periodic-Acid Schiff’s, cytokeratin and P63. Sections processed by HistoCore were compared with sections processed by ASP200S under light microscopy by pathologists.
Results: Amongst the H&E, Periodic-Acid Schiffs and immunohistochemistry sections, there was overall little difference in the quality of results between the HistoCore and ASP200S. A more concerning issue arose in the processing of fatty tissue, where adipocytes seemed more well preserved in tissue processed by the ASP200S than tissue processed by HistoCore.
Conclusion: Based on the results, HistoCore can adequately process the various specimens received without any protocol modifications. This is because there was little difference in analytical quality of tissue processed on HistoCore and ASP200S. For fatty tissue, however, the HistoCore processing protocol required modification to include a ‘de-fatting’ step, as it was not as well preserved in comparison to being processed by the ASP200S.
Copyright: © 2024 The author(s). This is an open-access article distributed under the terms of the Creative Commons Attribution License, which permits unrestricted use, distribution, and reproduction in any medium, provided the original author(s) and source are credited.
Read the articles carefully as most questions require more than one answer. Answers are to be submitted through the NZIMLS website. Make sure you supply your correct email address and membership number, It is recommended that you write your answers in a word document and then cut and paste your answers on the website. You are reminded that to claim valid CPD points for successfully completing the journal questionnaire you must submit an individual entry. It must not be part of a consultative or group process. In addition, members who have successfully completed the journal questionnaire cannot then claim additional CPD points for reading the articles from which the question were derived. The Editor sets the questions but the CPD Co-ordinator, Jillian Broadbent, marks the answers. Direct any queries to her at: cpd@nzimls.org.nz.
The site will remain open until Friday the 18th October 2024. You must get a minimum of eight question right per questionnaire to obtain 5 CPD points.
1. Electronic crossmatch (EXM) is an alternative to serological crossmatching methods, what does this alternative rely on to confirm ABO blood group compatibility between donor and recipient? What does EXM involve?
2. One of the advantages of EXM is the reduction in workload for the laboratory. Briefly list the types of activities that are reduced for the laboratory staff specifically?
3. What is Haemophilia A? What can patients develop when receiving therapy? And what can they become more susceptible to?
4. What are Factor VIII inhibitors? How do they inhibit?
5. What is the reference method for antinuclear antibody (ANA) detection for patients with suspected connective tissue disease, autoimmune hepatitis and juvenile idiopathic arthritis? What are the problems associated with this method?
6. What limitation was demonstrated in multiple Pathlab laboratories using NOVA View SWT? What is required for automated ANA readers to improve the assay?
7. Familial Mediterranean Fever (FMF) is an autosomal recessive disorder and the most common genetic autoinflammatory disease. What is used as the current management of this disease? What is its role in in treatment?
8. What did Khalil et al find to be a reliable inflammatory marker for FMF? And how could this help with the diagnosis of subclinical inflammation?
9. How do off-target antibodies interfere with immunoassay results? Provide two examples of immunoassay test and affect to patient.
10. What is Kode™ technology? And what are kodecytes?
1. Blood group antigens are inherited markers found on surfaces, including red blood cell membranes. What clinical effects do their corresponding antibodies have?
Haemolytic transfusion reactions (HTR), haemolytic disease of the fetus and newborn (HDFN) and autoimmune haemolytic anaemia (AIHA).
2. What does the International Society of Blood Transfusion (ISBT) define as a blood group system? And how do these systems arise?
A genetically discrete system of “one or more blood group antigens that are related by one gene, or one complex of two or more closely linked genes that are homologous”. Blood group systems arise from an ancestral gene coding for a protein on the red cell surface, and polymorphisms are the result of single nucleotide changes.
3. What are the major antigens of the MNS blood group system? How many antigens in the MNS blood group have been identified by the ISBT?
In the MNS blood group system, the major antigens are M, N, S, s, and U. According to the most recent classifications by the International Society of Blood Transfusion (ISBT), there are a total of 50 antigens in the MNS blood group system (ISBT 002).
4. What rare MNS hybrid variant is present in East African populations? What does this variant confer protection against and how?
A rare MNS hybrid variant called Dantu, is present in East African populations which also confers protection against severe malaria and reduced morbidity of infected individuals. This variant is thought to result in a hybrid between the extracellular domain of GPB and the transmembrane and intracellular domains of GPA, reducing the ability of P. falciparum to bind to band 3.
5. What causes Leptospirosis? How is it typically transmitted? What makes leptospirosis infection difficult to identify through clinical presentation alone? And what other conditions are similar in their presentation?
Infection with pathogenic spirochaetes of the Leptospira genus, typically zoonotic occurring through contact with infected farm animals, rats or through contact with water or soil contaminated with infected urine. Nonspecific and variable manifestations make infection difficult to identify by clinical presentation alone and presentations can be similar to other conditions such as viral hepatitis, influenza, toxoplasmosi, and septicaemia, other rural infections, such as rickettsiosis, or tropical diseases.
6. What are the drawbacks of using the gold standard serological test, microscopic agglutination test (MAT) in New Zealand?
The MAT method uses a panel of live Leptospira serovars and the 2 labs here use the 8 most common serovars known to cause infection in New Zealand and Australia. As there are over 250 pathogenic Leptospira serovars worldwide, leptospirosis acquired overseas may give false negatives if the causative serovar is not present in the panel. The need to maintain live Leptospira cultures presents a technical difficulty and a biosafety hazard, the test cannot be standardised and must be maintained as an in-house method and the interpretation is subject to reader variation
7. PCR can provide a more rapid “real-time laboratory diagnosis of leptospirosis using blood and urine samples, when are blood samples used and why? When is a urine sample recommended? And when can these samples be unreliable?
PCR on blood samples can detect leptospirosis during the first week of symptomatic illness, before antibodies are detectable by serological methods, but these antibodies can
be cleared efficiently during the immune phase so a urine sample is recommended for PCR during this immune phase. Blood samples are unreliable from the second week of illness. Leptospires are shed intermittently from the kidneys during infection, a negative urine PCR result does not exclude leptospirosis and must be repeated in cases where there is a high clinical suspicion of leptospirosis.
8. What significant changes in body composition does spinal cord injury (SCI) paralysis cause? What significant metabolic changes are considered contributing factors associated with the metabolic syndrome seen in SCI?
Loss of motor function leading to significant skeletal muscle wasting and increased fat mass above and below the lesion. SCI is strongly associated with the metabolic changes in the development of cardiovascular disease, glucose intolerance, hyperinsulinaemia and insulin resistance and dyslipidaemia.
9. What is the difference between complete and incomplete SCI? What differences were significant between complete and incomplete SCI in the presented study?
Complete SCI is considered to be where nerve damage is sufficiently severe that nerve impulses cannot be transmitted, whereas incomplete SCI does not have total nerve damage. Significant differences for TyG:G and TyG:HLD ratios between incomplete and complete SCI, indicating some retention of muscle innervation in the incomplete SCI that showed no difference with controls.
10. What should be considered in the placement of warning markings for equipment and instruments that incorporate laser products?
Ensure appropriate warning markings are appropriate to the laser class, durable permanently affixed and legible and are clearly visible to personnel during operation and maintenance of equipment.
At the age of 23, Josh Komen was one of the fastest 800m runners in New Zealand, then in a blink of an eye, he became one of the sickest. He then had to learn to run a new race, it was a race for his life. Josh was diagnosed with acute myeloid leukaemia, not once but twice. This diagnosis took him on a 10 year battle of deep depression, having an allogenic stem cell transplant, being put into a coma, developing graft vs host disease, pneumonia, multiple complications, treatment overseas in Australia for 5 years, plus having multiple heart attacks.
Today, 12 years after he received his deadly diagnosis, he is alive, strong, healthy and happy. Not only did he survive but he began to thrive. Josh reclaimed back his health, through patience, persistence and perseverance. Josh is now married and is a father to his first child. Life has taken Josh on an arduous path. Through his own suffering Josh has learnt so much. He understands how life can be so difficult for everyone. He shares his story and tools that have helped him through such adversity to encourage others to confront life’s challenges, to seize opportunities, build resilience, learn to be comfortable in the uncomfortable, and to continue courageously with life itself.