

a better future through youth empowerment and skills developed
through youth empowerment and skills development

64
71
teachers mentored and 3 300 grade 12 learners supported awarded in local communities
graduate interns hired youth participants in sport initiatives
97 bursaries and 144 learnerships + 7 000
We are committed to investing in young talent and nurturing future leaders.
OFFICE BEARERS AND COUNCIL FOR THE 2025/2026 SESSION
President G.R. Lane
President Elect
T.M. Mmola
Senior Vice President
M.H. Solomon
Junior Vice President
S.J. Ntsoelengoe
Incoming Junior Vice President
M.C. Munroe
Immediate Past President
E. Matinde
Honorary Treasurer
W.C. Joughin
Ordinary Members on Council
W. Broodryk M.A. Mello
A.D. Coetzee K. Mosebi
Z. Fakhraei M.J. Mothomogolo
B. Genc S.M. Naik
F. Lake G. Njowa
K.M. Letsoalo S.M. Rupprecht
S.B. Madolo A.T. van Zyl
Co-opted Council Members
K.W. Banda
M.L. Wertz
Past Presidents Serving on Council
N.A. Barcza W.C. Joughin
R.D. Beck C. Musingwini
Z. Botha J.L. Porter
V.G. Duke M.H. Rogers
I.J. Geldenhuys G.L. Smith
R.T. Jones
M.L. Wertz – TP Mining Chairperson
W. Broodryk – TP Metallurgy Chairperson
C.T. Chijara – YPC Chairperson
T.S. Ndlela – YPC Vice Chairperson
Branch Chairpersons
Botswana K. Mosebi
DRC Vacant
Johannesburg A. Hefer
Limpopo M.S. Zulu
Namibia T. Aipanda
Northern Cape Vacant
North West T. Nsimbi
Pretoria P.G.H. Pistorius
Western Cape M.H. Solomon
Zambia N.M. Kazembe
Zimbabwe L. Shamu
Zululand Vacant
*Deceased
* W. Bettel (1894–1895)
* A.F. Crosse (1895–1896)
* W.R. Feldtmann (1896–1897)
* C. Butters (1897–1898)
* J. Loevy (1898–1899)
* J.R. Williams (1899–1903)
* S.H. Pearce (1903–1904)
* W.A. Caldecott (1904–1905)
* W. Cullen (1905–1906)
* E.H. Johnson (1906–1907)
* J. Yates (1907–1908)
* R.G. Bevington (1908–1909)
* A. McA. Johnston (1909–1910)
* J. Moir (1910–1911)
* C.B. Saner (1911–1912)
* W.R. Dowling (1912–1913)
* A. Richardson (1913–1914)
* G.H. Stanley (1914–1915)
* J.E. Thomas (1915–1916)
* J.A. Wilkinson (1916–1917)
* G. Hildick-Smith (1917–1918)
* H.S. Meyer (1918–1919)
* J. Gray (1919–1920)
* J. Chilton (1920–1921)
* F. Wartenweiler (1921–1922)
* G.A. Watermeyer (1922–1923)
* F.W. Watson (1923–1924)
* C.J. Gray (1924–1925)
* H.A. White (1925–1926)
* H.R. Adam (1926–1927)
* Sir Robert Kotze (1927–1928)
* J.A. Woodburn (1928–1929)
* H. Pirow (1929–1930)
* J. Henderson (1930–1931)
* A. King (1931–1932)
* V. Nimmo-Dewar (1932–1933)
* P.N. Lategan (1933–1934)
* E.C. Ranson (1934–1935)
* R.A. Flugge-De-Smidt (1935–1936)
* T.K. Prentice (1936–1937)
* R.S.G. Stokes (1937–1938)
* P.E. Hall (1938–1939)
* E.H.A. Joseph (1939–1940)
* J.H. Dobson (1940–1941)
* Theo Meyer (1941–1942)
* John V. Muller (1942–1943)
* C. Biccard Jeppe (1943–1944)
* P.J. Louis Bok (1944–1945)
* J.T. McIntyre (1945–1946)
* M. Falcon (1946–1947)
* A. Clemens (1947–1948)
* F.G. Hill (1948–1949)
* O.A.E. Jackson (1949–1950)
* W.E. Gooday (1950–1951)
* C.J. Irving (1951–1952)
* D.D. Stitt (1952–1953)
* M.C.G. Meyer (1953–1954)
* L.A. Bushell (1954–1955)
* H. Britten (1955–1956)
* Wm. Bleloch (1956–1957)
* H. Simon (1957–1958)
* M. Barcza (1958–1959)
* R.J. Adamson (1959–1960)
* W.S. Findlay (1960–1961)
* D.G. Maxwell (1961–1962)
* J. de V. Lambrechts (1962–1963)
* J.F. Reid (1963–1964)
* D.M. Jamieson (1964–1965)
* H.E. Cross (1965–1966)
* D. Gordon Jones (1966–1967)
* P. Lambooy (1967–1968)
* R.C.J. Goode (1968–1969)
* J.K.E. Douglas (1969–1970)
* V.C. Robinson (1970–1971)
* D.D. Howat (1971–1972)
* J.P. Hugo (1972–1973)
* P.W.J. van Rensburg (1973–1974)
* R.P. Plewman (1974–1975)
* R.E. Robinson (1975–1976)
* M.D.G. Salamon (1976–1977)
* P.A. Von Wielligh (1977–1978)
* M.G. Atmore (1978–1979)
* D.A. Viljoen (1979–1980)
* P.R. Jochens (1980–1981)
* G.Y. Nisbet (1981–1982)
A.N. Brown (1982–1983)
* R.P. King (1983–1984)
J.D. Austin (1984–1985)
* H.E. James (1985–1986)
H. Wagner (1986–1987)
* B.C. Alberts (1987–1988)
* C.E. Fivaz (1988–1989)
* O.K.H. Steffen (1989–1990)
* H.G. Mosenthal (1990–1991)
R.D. Beck (1991–1992)
* J.P. Hoffman (1992–1993)
* H. Scott-Russell (1993–1994)
J.A. Cruise (1994–1995)
D.A.J. Ross-Watt (1995–1996)
N.A. Barcza (1996–1997)
* R.P. Mohring (1997–1998)
J.R. Dixon (1998–1999)
M.H. Rogers (1999–2000)
L.A. Cramer (2000–2001)
* A.A.B. Douglas (2001–2002)
* S.J. Ramokgopa (2002-2003)
T.R. Stacey (2003–2004)
F.M.G. Egerton (2004–2005)
W.H. van Niekerk (2005–2006)
R.P.H. Willis (2006–2007)
R.G.B. Pickering (2007–2008)
A.M. Garbers-Craig (2008–2009)
J.C. Ngoma (2009–2010)
G.V.R. Landman (2010–2011)
J.N. van der Merwe (2011–2012)
G.L. Smith (2012–2013)
M. Dworzanowski (2013–2014)
J.L. Porter (2014–2015)
R.T. Jones (2015–2016)
C. Musingwini (2016–2017)
S. Ndlovu (2017–2018)
A.S. Macfarlane (2018–2019)
M.I. Mthenjane (2019–2020)
V.G. Duke (2020–2021)
I.J. Geldenhuys (2021–2022)
Z. Botha (2022-2023)
W.C. Joughin (2023-2024)
E. Matinde (2024-2025)
Editorial Board
S.O. Bada
P. den Hoed
I.M. Dikgwatlhe
M. Erwee
B. Genc
A.J. Kinghorn
D.E.P. Klenam
D.F. Malan
D. Morris
P.N. Neingo
S.S. Nyoni
M. Onifade
M. Phasha
P. Pistorius
P. Radcliffe
N. Rampersad
Q.G. Reynolds
I. Robinson
S.M. Rupprecht
Past President’s serving on the Editorial Board
R.D. Beck
R.T. Jones
W.C. Joughin
C. Musingwini
T.R. Stacey
S. Ndlovu*
*International Advisory Board member International Advisory Board members
R. Dimitrakopolous
R. Mitra
A.J.S. Spearing
E. Topal
D. Tudor
F. Uahengo
D. Vogt
Editor/Chairperson of the Editorial Board
R.M.S. Falcon
Typeset and Published by
The Southern African Institute of Mining and Metallurgy
PostNet Suite #212 Private Bag X31 Saxonwold, 2132
E-mail: journal@saimm.co.za
Printed by Camera Press, Johannesburg
Advertising Representative
Barbara Spence
Avenue Advertising

Journal Comment: The art of rock engineering design and the need for research by F. Malan ....................................................................
President’s Corner: Our responsibility to develop future industry leaders by G.R. Lane ...................................................................
THE INSTITUTE, AS A BODY, IS NOT RESPONSIBLE FOR THE STATEMENTS AND OPINIONS ADVANCED IN ANY OF ITS PUBLICATIONS.
Copyright© 2025 by The Southern African Institute of Mining and Metallurgy. All rights reserved. Multiple copying of the contents of this publication or parts thereof without permission is in breach of copyright, but permission is hereby given for the copying of titles and abstracts of papers and names of authors. Permission to copy illustrations and short extracts from the text of individual contributions is usually given upon written application to the Institute, provided that the source (and where appropriate, the copyright) is acknowledged. Apart from any fair dealing for the purposes of review or criticism under The Copyright Act no. 98, 1978, Section 12, of the Republic of South Africa, a single copy of an article may be supplied by a library for the purposes of research or private study. No part of this publication may be reproduced, stored in a retrieval system, or transmitted in any form or by any means without the prior permission of the publishers. Multiple copying of the contents of the publication without permission is always illegal. U.S. Copyright Law applicable to users In the U.S.A. The appearance of the statement of copyright at the bottom of the first page of an article appearing in this journal indicates that the copyright holder consents to the making of copies of the article for personal or internal use. This consent is given on condition that the copier pays the stated fee for each copy of a paper beyond that permitted by Section 107 or 108 of the U.S. Copyright Law. The fee is to be paid through the Copyright Clearance Center, Inc., Operations Center, P.O. Box 765, Schenectady, New York 12301, U.S.A. This consent does not extend to other kinds of copying, such as copying for general distribution, for advertising or promotional purposes, for creating new collective works, or for resale.
Honorary Legal Advisers
M H Attorneys
Auditors
Genesis Chartered Accountants
Secretaries
The Southern African Institute of Mining and Metallurgy 7th Floor, Rosebank Towers, 19 Biermann Avenue, Rosebank, 2196
PostNet Suite #212, Private Bag X31, Saxonwold, 2132 E-mail: journal@saimm.co.za
Telephone (011) 463-7940 . E-mail: barbara@avenue.co.za ISSN 2225-6253 (print) . ISSN 2411-9717 (online)


Barriers and drivers towards the approval and implementation of new technology in mining: A dilemma and exit strategies framework by
B. Emwanu, R.A. Raju
The mining industry faces a persistent investment paradox wherein financiers demand feasibility studies grounded in conventional, validated methodologies, while emerging technologies require extended operational validation before being deemed bankable. This constraint inhibits capital flow into innovative mining solutions, perpetuating a cycle of underinvestment. As resource accessibility declines, technological innovation becomes increasingly critical for maintaining operational sustainability and competitiveness. Over the past decade, the sector has recognised the potential of advanced technologies to reduce costs, mitigate environmental impacts, enhance mineral recovery, and improve production efficiency. Addressing the techno-economic barriers and enablers of adoption is essential for successful implementation. This paper proposes a strategic framework to resolve the investment dilemma and facilitate the integration of novel technologies into mainstream mining operations, thereby supporting long-term industry resilience.
Development of mining industry in Tanzania: A review by B.F.
Giyani, A. Salama
...............................................................................................
Tanzania hosts diverse mineral resources, including metallic ores, gemstones, industrial minerals, mineral fuels, and critical minerals. This study presents a comprehensive overview of the country’s mining legal framework, mineral occurrences, production trends, sectoral challenges, and government interventions. Gold production, for instance, rose from 42 tonnes in 2018/2019 to approximately 50 tonnes in 2023/2024, reflecting positive growth. However, the sector faces persistent challenges such as limited geological data, inadequate infrastructure in remote regions, informal artisanal mining, and mineral smuggling. In response, the Tanzanian government has initiated high-resolution airborne geophysical surveys, formalised artisanal and small-scale mining operations, established mineral trading hubs, and promoted domestic mineral beneficiation. These measures aim to enhance resource governance, attract investment, and improve sectoral sustainability. The findings underscore Tanzania’s potential for expanded mining investment, contingent on continued regulatory rand infrastructural improvements.
Investigation of waveform construction and dynamic characteristics for mould non-sinusoidal oscillation by
K.H. Zhang, Q. Li, J.C. Ma, J.Q. Zhao, Y.P.
Gao 593
This study introduces a novel non-sinusoidal mould oscillation waveform for high-efficiency continuous casting, characterised by segments of straight lines and parabolas. Compared to traditional sinusoidal oscillation, the proposed waveform improves dynamic control and process adaptability. Quantitative analysis shows a 15.9% reduction in negative strip time, a 38.3% increase in maximum negative strip velocity difference, and a 27.8% decrease in maximum positive strip velocity difference. The oscillation process parameters are analytically derived, and isoplethic curves are constructed to evaluate multi-parameter interactions. Negative strip time decreases with increasing modification ratio, frequency, and casting speed, but increases with stroke. To stabilise negative strip time, an oscillation synchronous control model is developed for parameter optimisation. Practical implementation demonstrates improved surface quality, with oscillation mark depth reduced by 10.1 μm and flux consumption increased from 0.37 kg/t to 0.45 kg/t, meeting industrial production requirements.
Effects of acid and reductants on iron salt leaching of copper-cobalt oxide ore: A case study from Zebesha Mine, Zambia by F.D.L. Uahengo, Y.R.S. Hara, O. Bazhko
This study investigates the leaching behavior of copper (Cu) and cobalt (Co) from Zebesha Cu–Co oxide ore using ferrous sulphate heptahydrate (FeSO₄·7H₂O) and ferric sulphate (Fe₂(SO₄)₃) as lixiviants, with sodium metabisulphite (Na₂S₂O₅) and sulphuric acid (H₂SO₄) as additives. Leaching experiments conducted at ambient temperature revealed that Na₂S₂O₅ significantly enhances Co recovery in the FeSO₄·7H₂O system, reaching 80% at 150 kg/t, while Cu recovery remained below 5%. In contrast, Cu recovery peaked at 92% with 60 kg/t H₂SO₄ in the Fe₂(SO₄)₃ system, whereas Co, Ni, and Mn recoveries remained below 40%. The results demonstrate that Na₂S₂O₅ is more effective for selective Co extraction with FeSO₄·7H₂O, while H₂SO₄ improves Cu recovery in Fe₂(SO₄)₃. These findings provide insights into optimising reagent combinations for enhanced hydrometallurgical performance in Cu–Co oxide ore processing.
The practicality of using rock mass classification in a narrow tabular orebody at depth extracting the Ventersdorp Contact Reef by R. van Heerden, T.R. Stacey 609
In deep-level, narrow tabular gold mines of South Africa, rock mass classification offers a potential method for predicting geotechnical hazards and optimising support systems. This study assesses the applicability of existing classification methods, emphasising the Mining Rock Mass Rating (MRMR) system, which is adapted for high-stress conditions. Fieldwork at Kusasalethu Mine included underground mapping and analysis of the 2020/2021 fall-of-ground database. The modified MRMR system was tailored to site-specific geological and operational conditions, offering a simplified and practical tool for rock engineering personnel. Results demonstrate its effectiveness in quantifying rock mass conditions and guiding proactive mining decisions. The system enhances understanding of rock mass behaviour and significantly reduces rockfall and collapse risks. Continued refinement and broader application of the MRMR system are recommended to improve safety and operational efficiency in deep-level mining contexts


RThe art of rock engineering design and the need for research
ock Engineers and mine personnel frequently disagree on design aspects. These disagreements can lead to poor designs or failures. A number of large collapses have occurred in the bord and pillar mines and open cast mines in the Southern Africa region in the last two decades. Can we learn from the decision-making that led to these collapses and improve? Philosophy offers the opportunity to adopt a reflective learning approach.
ChatGPT gave an interesting insight into this aspect of mine design. Rock engineering is less of an exact science than other engineering disciplines and it is suggested that rock engineering design is best described as a “science-based art”.
The science provides the foundation and design is based on aspects such as rock mechanics principles (e.g., stress-strain behaviour, and failure criteria), empirical methods (e.g., Q-system, and RMR), numerical modelling (e.g., finite element, distinct element, and boundary element methods), monitoring and instrumentation (e.g., extensometers and stress cells) and geological and geotechnical data (e.g., boreholes, core logging, and lab tests). The designs are never purely scientific owing to reasons such as natural variability of the rock mass, the geology is complex and discontinuous, the uncertainty caused by incomplete or generalised data, decisions must often be made with partial information, when conditions change the designs must evolve, and balancing performance, cost, and safety is not purely technical.
Based on these considerations, it implies that “industry standard” criteria for design neither are always the best technical solutions, nor does it imply these criteria are correct. Davide Elmo and his co-workers explored this topic and examined rock engineering using a philosophical approach (Elmo et al., 2022) in Examining Rock Engineering Knowledge through a Philosophical Lens. Geosciences. They noted that rock engineering designs are shaped by cognitive biases, which over time have created a dogmatic barrier to innovation. Almost no attention has been given to the impact that subjectivity, human factors, and lack of scientific replicability have on the empirical design methods used in this field.
As a complicating factor, the modelling methodologies and constitutive codes typically used are difficult to calibrate and represent a universal challenge for the application of rock engineering models. As more complex numerical models are developed for the improved simulation of observed rock mass behaviour, more onerous requirements of model calibration and user expertise are required. This applies to boundary element models, finite element, and finite difference codes. Elmo et al. (2022) made the following important observation: “It is evident generally that if older and simpler solutions have a clear advantage in terms of durability and/or efficiency, even if this advantage is restricted to a limited purpose, they continue to exist and evolve.” In his 2003 Presidential Address: Rock engineering – good design or good judgement, T.R. Stacey recognised this problem and noted that rock masses are so complex that realistic modelling, even with sophisticated methods, is impossible. Simple elastic models with good engineering judgement may therefore continue to exist as one of the practical rock engineering tools.
As a first step to mitigate the uncertainty in rock engineering and the challenge described in this note, Elmo et al. (2022) emphasised that for research, critical thinking needs to be applied and the foundations of rock engineering as an empirical science should be questioned. Furthermore “replication” research should be conducted as a more rigorous form of review compared to the traditional peer review. A recent example of replication research is given by the Le Roux and Malan paper (2024). Researchers need to provide full information to allow others to replicate their work. Very often the assumptions used for numerical modelling of layout design are not given in design reports and these need to be included in the reports.
F. Malan


t a recent conference, a young professional asked me: “What do I do if my boss won’t give me the time to get involved in SAIMM Young Professionals Council activities and events?”
This question cuts to the heart of a broader issue: What is our responsibility as leaders to guide, coach, and prepare the next generation to take our place?
I remember being a young graduate, fresh out of university, unaware of what I did not yet know. It is easy to get consumed by the demands of a day job and neglect the time needed for personal and professional development.
Fortunately, I had the benefit of learning from some exceptional leaders in the industry who encouraged me to look beyond my immediate role. Their guidance helped me understand the importance of contributing to the broader mining community and part of my career and personal development.
While many companies offer formal management and leadership training, this is only one piece of the development journey. My own journey with the SAIMM began 20 years ago, when a respected industry leader encouraged me to join, get involved, and give back.
Over time, my involvement in the SAIMM has significantly contributed to my professional growth and confidence. I have learned how to present ideas clearly through technical papers and conference presentations, built skills through chairing conference organising committees, and gained insight into the value of collaboration across the industry. Serving as Chairperson of the Technical Programme for the past eight years has further strengthened my ability to lead, facilitate dialogue, and shape the Institute’s value proposition.
Now that I have taken on the role of the SAIMM President in 2026, I recognise how deeply this involvement has shaped my leadership capabilities—and how critical it is that we create the same opportunities for others.
Serving on the SAIMM Council provides professionals with exposure to governance responsibilities, often for the first time. It acts as a valuable stepping stone into board-level thinking and decision-making. The SAIMM is, without doubt, a vital platform for developing the future leaders of our industry.
But it only works if we, as the current leaders, support it. That means setting clear expectations for the professionals in our teams and explaining the value—to the company, the individual, and the industry—of dedicating time beyond day-to-day responsibilities.
In our company, every young professional is expected to become a SAIMM member, join the Young Professionals Council, and participate in conference organising committees. As they gain experience, they are encouraged to submit abstracts and contribute papers to conferences.
We have seen the results: Our Operations Director served as Chairperson of the Young Professionals Council, is now a member of the SAIMM Council, and has become a Certified Director. Connie Chijara— another one of our own—is now the chairperson of the Young Professionals Council, the first female to take on this role.
We give them the time because we have seen the benefit—not just to them, but to the industry and to our company. These young professionals are not just contributors today. They are the leaders of tomorrow.
G.R. Lane President,
SAIMM
INTERNATIONAL CONFERENCE 2026
Foundations of Competitiveness and Sustainability
The South African metallurgical industry is facing significant obstacles: Rising production costs, the closure of key service providers like refractory suppliers, and increasing pressure globally for the industry to transform. To face these challenges, it is important for different areas of the industry to work together.
26-28 MAY 2026
CSIR INTERNATIONAL CONVENTION CENTRE, PRETORIA, SOUTH AFRICA
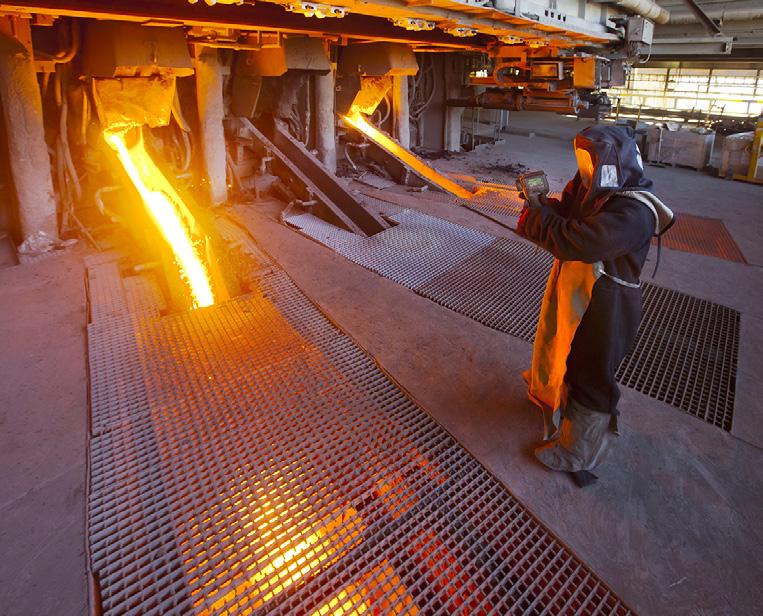
25 May 2026 – Workshops 26-28 May 2026 – Conference 29 May 2026 – Technical Visits
The Southern African Institute of Mining and Metallurgy (SAIMM) invites you to the 2026 Pyrometallurgy International Conference, taking place from 25 to 29 May 2026. The conference will bring together professionals and experts from the fields of pyrometallurgy, furnace tapping, and refractories under the theme: Foundations of Competitiveness and Sustainability. This theme challenges us to collaborate in finding answers to the difficult questions we are faced with and to develop sustainable solutions to safeguard the future of our industry. We are confident that through collaborative research, innovative technology development and operational excellence, we can transform the industry and secure a greener future for the next generation of pyrometallurgists.
By integrating these three key focus areas, we aim to create a platform for strategic thinkers, policymakers, researchers, and economic influencers to share insights, challenge assumptions, and collaborate on practical solutions for the future of the industry.
• Professionals and researchers focused on pyrometallurgy, furnace tapping and refractories
• Industry leaders
• Academics
• Students
DAY 1: WORKSHOPS
• The Future of Pyrometallurgy in South Africa
• Pyrometallurgy in SA Under Pressure – What Next?
• Tapped In – The Future of Sustainable Furnace Tapping
• Quo Vadis, Refractories?
• To Be Confirmed
CALL FOR PAPERS, PRESENTATIONS AND POSTERS
Papers, presentations or posters are invited on any topic related to the conference and can be submitted to any of the three Symposia.
Prospective authors are invited to submit titles and abstracts of their papers in English. The abstracts should be no longer than 500 words and submitted via the SAIMM Abstract Portal.
Acceptance of papers for publication in the SAIMM Journal will be subject to peer review by the Conference Committee and SAIMM Publications Committee pre-conference.
The conference will include a student poster session where students will be given an opportunity to prepare a poster and a 5 minute presentation on their research projects. Students are requested to indicate during the submission that their abstract is for the student poster session. The best student poster will be offered an award.
• Abstract submission deadline: 17 October 2025
• Paper submission deadline: 24 November 2025
• Workshops: 25 May 2026
• Conference: 26-28 May 2026
• Technical Visits: 29 May 2026
• Advanced Tapping and Refractories Gugu Charlie, Conferences and Events Coordinator FOR FURTHER INFORMATION, CONTACT: E-mail: gugu@saimm.co.za Tel: +27 11 530 0238 Web: www.saimm.co.za

Affiliation:
1School of Industrial Engineering, University of the Witwatersrand, South Africa
2Technology Development, Anglo American, South Africa
Correspondence to:
R.A. Raju
Email: ralph.raju@angloamerican.com
Dates:
Received: 14 Feb. 2024
Revised: 13 May 2025
Accepted: 11 Sept.2025
Published: October 2025
How to cite:
Emwanu, B., Raju, R.A. 2025.
Barriers and drivers towards the approval and implementation of new technology in mining: A dilemma and exit strategies framework.
Journal of the Southern African Institute of Mining and Metallurgy, vol. 125, no. 10, pp. 571–580
DOI ID:
https://doi.org/10.17159/2411-9717/3288/2025
ORCiD:
B. Emwanu
http://orcid.org/0000-0001-9906-7245
R.A. Raju
http://orcid.org/0000-0002-5440-556X
by B. Emwanu1, R.A. Raju1,2
Abstract
The implementation of new technology in mining can be likened to a paradoxical situation or dilemma, where, on one hand, major mining projects are not able to solicit investor funding unless it is proven that the business cases were developed using tried and tested mining methods. On the other hand, new and innovative mining technology and mining methods need first to demonstrate and prove themselves under real production conditions over a reasonable period before they can be considered bankable feasibility studies in the mining industry. This dilemma locks new mining technology investments in a continuous cycle of underinvestment. Technological innovations are particularly relevant to the mining industry, which deals with the challenges of depleting access to resources, requiring new solutions to remain sustainable and competitive. In the last decade, the mining industry has come to realise that technological innovations can directly contribute to its sustained competitive advantage (Sanchez, Hartlieb, 2020), helping to reduce costs, lessen environmental impact, increase production, and improve mineral recovery. While understanding barriers and drivers for technology adoption is important for the success of technology implementation efforts and the sustainability of the mining sector (Muduli et al., 2013), this paper suggests strategies to exit the dilemma, proposing a preliminary framework.
Keywords new technology development, hard rock cutting, barriers and drives for new technology adoption
Mining can be seen, from a basic perspective, as involving breaking in situ rock and hauling the broken rock out of the mine while ensuring the health and safety of all key stakeholders, profitability, and sustainability of the operation. Presently, mine operators are exploring ways to achieve both net zero and net profit to stay sustainable. Since the early 1900s, a relentless search has been underway for new and innovative mining technologies that can improve health, safety, environmental conditions, and productivity (Vogt, 2016). From a historical perspective, mining extraction technology has evolved over time and includes milestones such as the invention of the safety lamp, the safe use of explosives for fragmentation, the safe use of electrical energy, the development of continuous miners for cutting coal, the invention of rock bolts for primary and secondary support, open-pit mining technology for mining massive low-grade deposits, the introduction of longwall coal mining, and recently, in situ mining, automated mining, and robotic mining systems (General Kinematics, 2019). Through these achievements, it became apparent in the earlier years that integrating technological innovation into mining practices can result in reduced costs, increased productivity, and improved worker safety. It later became apparent that the mining sector needs to foster innovation to remain competitive.
New mining technology adoption barriers
Understanding barriers and drivers for technology adoption is important for the success of technology implementation efforts and the sustainability of the mining sector. Numerous past studies conducted on technology adoption have focused mainly on organisations in the manufacturing and service sectors. When companies in the mining industry identify new technologies that could make step changes in performance, these companies are often faced with organisational resistance because the organisational incentives set up for production output, work against them (Deloitte, 2016). One would expect operations to jump at the new technology, but if companies are incentivising operational personnel
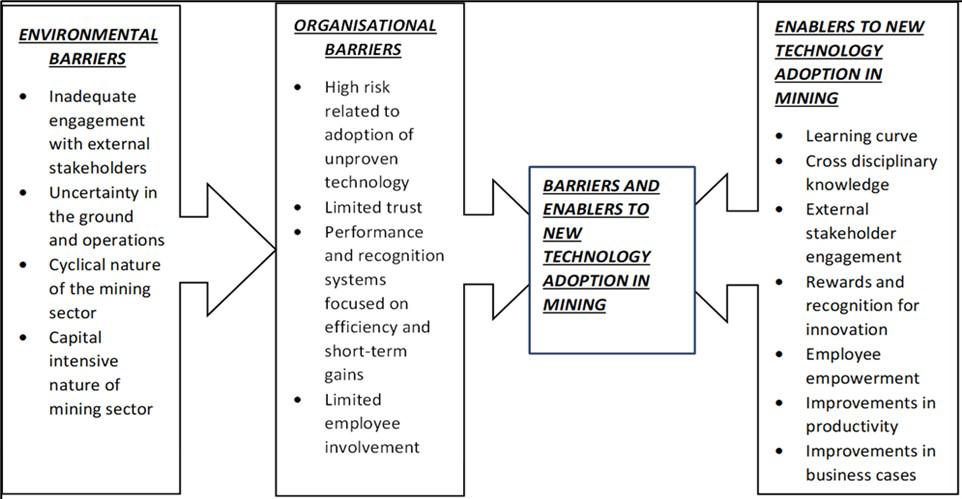
for short-term production performance (Deloitte Monitor,2016), the risk inherent in the technology adoption works against the industry (Deloitte, 2016). The mining industry, in general, relies on third parties to take the lead in the development of new mining technologies. These third parties, such as original equipment manufacturers (OEMs) of mining equipment, are very reluctant to change as this would impact their existing equipment offerings, such as drill rigs, bolters, load haul dumps (LHDs), and dump trucks, among others (Olvera, 2021). The study conducted by Ediriweera and Wiewiora (2021) on barriers and enablers of technology adoption in the mining industry, revealed the following findings, as shown in Figure 1.
Mining projects are very capital-intensive, and mining methodology is locked in once access excavations start (Nanda, Kumar, 2013). Operational procedures become entrenched, and it may be complex to implement new technologies when they involve disruption to these existing operational routines (Nuur et al., 2018). Additionally, and to a greater extent than in other industries, mining operations are often undertaken in geographically remote and isolated areas, adding further challenges (Hall, 2017). These mining operations have a tremendous direct and indirect effect on communities and the environment, posing specific requirements in terms of their operations and approach to climate and social responsibility matters (Fordham et al., 2017). These aspects are also reflected in the emergence of the concept of 'social licence to operate', describing the requirement for civil society to accept and approve mining projects (Prno, Slocombe, 2012). The more miningrelated drivers and barriers of innovation suggest that primitive models, or typical tried and proven methods of value-creating innovations, will deter the diffusion of innovation (Soderholm, Svahn, 2015). Successful demonstration projects help to make the benefits of an innovation visible and tangible, which can positively affect its diffusion (Stewart, Malatji, 2018).
This is significant given the large capital and operational investment costs associated with mining operations (Olvera, 2021). In addition, operational demands can present both drivers and barriers for the diffusion and adoption of innovation. If a technology that was previously used, like drill and blast, becomes obsolete or local conditions require other solutions, this may be a driving factor for the adoption of innovation (Amadi-Echendu et al., 2011). On the other hand, the complexity involved in
implementing an innovation at a potentially remote mine site may result in considerable barriers to its adoption (Nanda, Kumar, 2013). Corporate and social responsibility (CSR) motivates the implementation of new technology due to the imperatives mining companies face to create benefits in terms of safety, sustainability, or reduced emissions (Nasirov, Agostini, 2018).
One of the most dominant drivers for new technology development in the mining industry noted in the literature is employee health and safety (Deloitte, 2016). This includes the pursuit of safety goals, health concerns, and companies striving for environmental and social improvements, all of which may drive the adoption of innovations that have the potential to improve organisational health and safety standards. The second most common driver for the development of new technology noted in the literature is the aim to increase productivity (Olvera, 2021). Hard rock mining presently is a batched process, using drill and blast systems (Vogt, 2016), which leaves room for improvement such that any anticipated productivity improvements triggered by the adoption of new technology is an important motivator for fast-tracking new technology rollout. Thirdly, sustainability, mainly characterised by environmental concerns (Ediriweera, Wierwiora, 2021), has the potential to drive the adoption of innovation in the mining environment. Other frequently noted drivers include increasing efficiency (Gruenhagen, Parker, 2020), the availability of human capital (Macfarlane, 2001), cost reductions (Deloitte, 2016), collaboration (Ediriweera, Wiewiora, 2021), and market pressure (Gruenhagen, Parker, 2020).
Several major mining companies are aligned with global climate goals, which have been agreed upon in international pacts such as the Paris Agreement. A number of these significant mining companies that have committed to supplying the raw materials required to build the low-carbon future have declared their own targets to reduce carbon dioxide emissions by 30% to 40% by 2030 and net zero by 2050 (Lasley, 2022). This is because mining investors, manufacturers that buy metals to build their products, and the public that use those goods are increasingly demanding that minerals and metals be produced with the highest environmental, social, and governance standards (Lasley, 2022). This implies
that mining companies need to investigate innovative ways of maximising value and minimising waste. Moreover, it suggests that for a company striving towards zero-footprint mines, this should be a prerequisite embedded in its strategy. For instance, by electrifying the mobile fleet (IntelliSense.io, 2022), increasing remote operations (International Institute for Sustainable Development, 2021), smart tracking (Institute for Sustainable Development, 2021), and optimised extraction methods (Institute for Sustainable Development, 2021), much of the environmental degradation seen in mining operations could be avoided.
Mining depletes the natural mineral resources and in a strict sense is therefore inherently unsustainable. One can argue, for instance, that there is only a finite amount of copper in the Earth's crust, and each unit of copper extracted increases the fraction of the total copper depleted from the ground.
This reduction in rich mined ore grades means that more low-grade ore needs to be processed to produce the same amount of metal, leading to a rise in energy requirements and, thus, greenhouse gas emissions (Norgate, Haque, 2010). This implies that use of innovation in search for new minerals increases in importance over time as humanity demands for more materials to satisfy its growing needs and strategic minerals become increasingly exhausted, with ore grades rapidly declining.
Requirement for the increase in mining productivity
During the height of the mining boom (Eleven, 2021), recordbreaking commodity prices notionally supported the development of marginal, high-cost, low-productivity mineral deposits (Jacobs, 2016). As commodity prices dropped over the past few years, companies responded by slashing costs, a traditional response to this ever-shifting market cycle (Eleven, 2021).
Productivity is about maximising throughput per unit of time, per unit of quality, and per unit of cost (Macfarlane, 2001). Mining companies may wish to apply a better use of technology to achieve these goals. To do so, they need to seek out innovative technologies capable of unlocking deposits and improving productivity on the mine site.
Miners cannot control the vagaries of the world economy that shift currencies and commodity prices; however, they can control how they operate. As mining companies refocus on becoming lowest-quartile cost producers, they will need to move away from reactionary cost-cutting and towards sustainable cost management programmes. To prevent this constant cycle of cost reduction and high cost creep, miners must go beyond traditional cost-cutting measures. Labour productivity in mining is often measured by output per mining company employee over a given period, such as a year (Vogt, Hatting, 2016), where output typically is the content of the main metal product contained in the ore. Miners need to raise productivity before companies can reclaim shareholder support and deliver bottom line value. Mine operators could scale operations to suit individual projects. Furthermore, they could build stronger funding practices by better understanding the difference between a project's value and the price the market sets.
Energy efficiency improvement programmes in mining are widespread and target all aspects of mining. These include
capturing waste heat, managing electricity demand, mine drainage, ventilation, and generating energy from by-products (Levesque et al., 2014). Hence, opportunities for energy efficiency in mines can be explored in specific mines using innovative ways. However, comminution and material handling (including loading and hauling) operations have been identified to have the highest potential for energy efficiency improvements (BSC Incorporated, 2007). In a study by the Department of Energy in the United States, grinding and diesel equipment used in material handling were identified as the operations presenting the greatest energy savings potential (BSC Incorporated, 2007).
According to the 2022 Responsible Mining Index report, 94% of the mine sites assessed scored an average of less than 20% on the fifteen fundamental economic, environmental, social and governance or EESG issues (Responsible Mining Index, 2022). This demonstrates little evidence of companies translating their lofty corporate commitments into action plans by applying thorough due diligence processes and tracking the effectiveness of implementation. The result has been more verbal promises than action, if any, on responsible mining. However, mining has the potential to innovate and support a more sustainable future through responsible mining. Companies could do this through a range of deliberate actions to ensure that mines remain environmentally sustainable and provide social profitability to the local communities.
Part of responsible mining includes empowering and supporting communities in closing and reclaiming mine sites (Responsible Mining Index, 2022). Even after the closure of a mine, it can present significant harm to surrounding communities and the environment, as processing often uses harmful chemicals. It is apparent that opportunities exist for miners to innovate in this area. However, with the closure of the Responsible Mining Foundation (Responsible Mining Index, 2022) and reluctance by miners to act on these issues, it is doubtful that over the near term (five years ahead), there will be a marked improvement.
The Fourth Industrial Revolution (4IR) is characterised by technologies, and the combination of technologies, such as artificial intelligence, analytics, cloud computing, the internet of things, and other dynamic attributes (Ntsoelengoe, 2021), all of which have enormous potential to grow the industry while improving workplace safety. Modernisation of the mining industry can lead to the required transformation and return to productivity. In the context of 4IR, this should mean that the minerals and metals required to move the globe towards a circular economy can be extracted in less environmentally destructive ways. At the same time, some minerals, such as coal, and hydrocarbons should be left in the ground. The implication is that modernisation of the mining industry can lead to the required transformation and return to productivity.
If investment costs are high, it prevents an innovation from being adopted, as some mining companies lack the necessary financial resources. Many mining companies still struggle to embrace high-tech solutions, as discerned by Filippou and King (2011), who indicate that mining companies have spent, on average, a lower share of their operational expenditure in the development
of technologies compared to other sectors. Between the 1990s and 2000s, the research and development (R&D) intensity of mining companies, measured as R&D expenditure as a percentage of total revenues, was on average only approximately 0.5% (Filippou, King, 2011), significantly lower than sectors such as information and communication technology (ICT) or pharmaceuticals, where the level of R&D spending was 24.7% and 25.1%, respectively, in 2015 (Sanchez, Hartlieb, 2020).
The following are suggested strategies supported by literature for exiting the paradoxical trap, culminating in a preliminary conceptual framework.
Align technology roadmap with group strategy
A company’s success or failure is reliant on the development and adoption of a business strategy that provides guidelines on how it operates and the approved options available to exercise in reaching its long-term objectives (Jordaan, Hendricks, 2009). A technology roadmap is meant to be used as a strategic planning tool in the field of innovation and new technology development. It provides a visual representation and comprehensive plan for the development, adoption, and integration of technologies within an organisation or industry. The purpose of a company’s technology strategy is to gain a sustainable technological advantage that offers a competitive advantage (Du Plessis, 2017). A common problem in the mining division of companies is the lack of aligned business and technology strategies. Mining companies need clear mandates and objectives to guide them in selecting the technologies required for them to achieve their objectives. Khalil (2000) suggests that the first step in developing a business technology strategy is to establish the mining companies’ core competencies. The mining companies' portfolios must be strategically aligned; this would mean that all their projects are ‘‘on strategy’’ and that their breakdown of spending across projects, areas, markets, etc., must mirror their strategic priorities (Schilling, 2017).
Develop a robust business case
Mine development cannot progress without observing positive economic evaluation results, which are the potential profitability of a future mine. According to the discounted cash flow (DCF) method being the most widely used method in mining (Bhappu, Guzman, 1995), net present value is generally calculated as an indicator of project profitability. However, in the case of new technology mining projects, the information required for the economic calculations input data is problematic to generate (Raju, 2021). This is due to the specific features of these projects, which complicate their economic evaluation. The objective of any investment within a firm is to create value for its owners and shareholders. The purpose of allocating money to a division or project is to generate a cash flow substantially more significant than the amount invested in the future. Investors have alternative uses for their funds (Fagan, 2020), and they, therefore, have an opportunity cost if money is invested in a corporate project. The investor opportunity cost is the sacrifice of the return available on the foregone alternative.
Investors are comfortable investing their money in projects that will generate risk-free returns. In the mining sector, the project teams that are tasked to compile bankable feasibility studies are compelled to use tried and tested benchmarks to compile their business cases (Olvera, 2020). When confronted with the transition of new mining technology from demonstration to validation and then into a bankable production system, one needs to follow
a similar rigour as when compiling bankable mining business cases (Nel, Burks, 1999). The team needs to first ensure they have access to an orebody that has all the approved levels of geological, geotechnical, and mineral grade information to develop a bankable study (Nel, Burks,1999).
Find an interested client (site)
Mining used to be a business primarily focused on the technical aspects of getting value out of the ground and extracting the minerals in a metallurgically efficient way (Humphreys, 2020). Without denying the importance of these skills, a narrow focus on technical cases is no longer sufficient to guarantee success, even in rich orebodies. Skills in economics is an essential partner to technical skill in every step of the mining process (Runge, 2015).
While planning for the development, implementation and embedding of new technology within a mining operation, the organisation must have a quantifiable purpose and benefit to the business, whether in terms of economics, environment, or health and safety (Nicholas, Steyn, 2010). Moreover, this analysis must take account of the total value chain of the mining operation. Such a proposed techno-economic analysis should consider the holistic system in which the technology operates as opposed to the standalone benefits of the new device or process (Sanchez, Hartlieb, 2020), which addresses the holistic concerns of prospective clients.
From an overall stakeholder perspective, the optimum mining method will always be the one that maximises the economic returns (Mackenzie, Cusworth, 2007) while keeping the environmental impacts within acceptable levels (Bitarafan, Ataei, 2004), maintaining acceptable working conditions (especially regarding levels of safety risk) for employees (Lane, 2016), and statutory obligations (Bitarafan, Ataei, 2004) including resources recovery stipulations. Collectively, these goals will also satisfy the objectives of the use of these mineral resources and, hence, become attractive to potential clients.
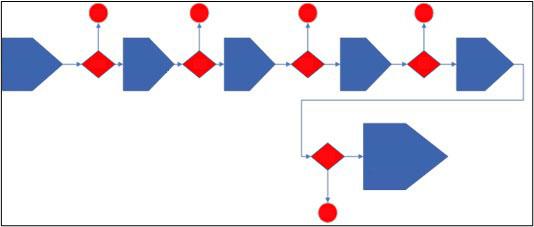
Mining companies usually adopt new technology development processes in-house, and although systematic, new technology development phases can typically be stopped at any time as the process progresses through the development stages, as depicted in Figure 2.
Borrowing from best practices in other industries, this paper proposes the use of a technology readiness levels (TRL) approach to guide the technology development process in mining companies. TRL is a type of measurement system used to assess the maturity level of a particular technology (Beck, 2013). The new mining technology development project (NMTDP) is evaluated against the parameters for each technology level and is then assigned a TRL rating based on the NMTDP progress (De Villiers, 2013). There are generally nine technology readiness levels. TRL 1 is the lowest, and TRL 9 is the highest, as illustrated in Figure 3.
When a technology is at TRL1, scientific research of a concept will begin, and those outcomes will be translated into future research and development. TRL2 occurs once the basic principles have been studied and practical applications can be applied to those initial findings. When active research and design begin, a technology is elevated to TRL3. Generally, both analytical and laboratory studies are required at this level to see if a new mining technology is viable and ready to proceed further through the development process. Often, during TRL3, a proof-of-concept
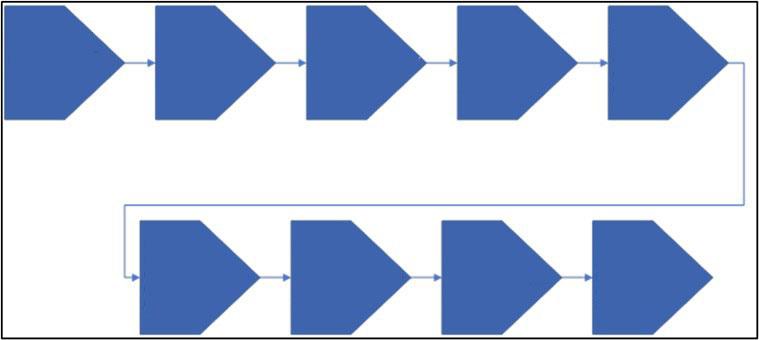
model is constructed. Once the proof-of-concept technology is ready, the technology advances to TRL4. During TRL4, multiple component pieces are tested with one another. Simulations should be run in environments that are as close to realistic as possible. Once the testing of TRL5 is complete, a technology may advance to TRL6. A TRL6 technology has a fully functional prototype or representational model. TRL7 technology requires that the working model or prototype be demonstrated in a mining environment. TRL8 technology has been tested and operationally qualified, and it is now ready for implementation in an already existing mining system. Once a technology has been operationally proven over an agreed time span, it can be called TRL9, or it is operational ready as a bankable technology or mining system.
Following this approach, a more progressive perspective is suggested, where companies need not stop and abandon their projects entirely every time there is a major challenge (see Figure 2). Rather, they should assess their level of readiness and the stage they are at in relation to the overall pathway and anticipate the next steps that need to be taken to eventually reach the final goal. Using this perspective, it should be possible for a given company to pause the progression of technology development at the current stage for a while without abandoning the project entirely and prepare for the next step in the technology development pathway.
Develop an executable technology implementation strategy
The technology implementation strategy should be developed for the specific mining operation and not be considered as one solution that fits all (Jacobs, 2016). For an appropriate technology implementation methodology, it is reasonable to consider the task as a project and draw from best practices in project management
and general management, as these are tried and tested management systems applied during the implementation of projects of all types. Following project management best practices (Nickolas, Steyn, 2010), when engaging with mining operations, one needs to compile a technology charter (Nel, Burks, 1999). When the technology charter is completed and agreed upon by the various key stakeholders, it must be signed off. This signed-off document will mandate that the technology implementation team have access to the target orebody and mining operation.
The team should then compile a detailed scope of work (Nickolas, Steyn, 2010) for the specific new mining technology execution. This detailed scope of work must also be signed off by the key stakeholders at the operations, stating what is in the new mining technology (NMT) implementation teams' scope and what would be in the scope of the operations and should also include the OEM's task assignments. The NMT target site must be considered a mining section, comprising an organisation's structure with names, titles, and legal appointments clearly stating reporting lines.
Once the detailed scope of work is approved by the technology development teams and the mining operational team, the tender process for the appointment of engineering, procurement, and construction management (EPCM) can begin; it must be clearly stated to the shortlisted EPCMs that this scope will undergo continuous development as the implementation progresses. The EPCM will develop a detailed project schedule and estimate to monitor and control the work packages and specific activities.
New mining technology case studies highlighting major challenges
Several mining companies, in joint agreements with original
equipment manufacturers, have funded large investments to develop new technology to excavate hard rock (Ridley, 2020). These investments mainly focused on developing mechanical complex rock-cutting machines to invent and implement continuous mining technologies (Macfarlane, 2001). One of the most dominant drivers in pursuing these investment programmes was the quest to achieve higher production rates, reduce operational costs, and transition away from the batch, unsafe aspects of drill and blast mining systems (Vogt, 2016).
Many of these joint development agreements (JDA) focused on adapting the existing dominant designs, such as tunnel boring machines, to develop mine access tunnels more quickly (Herrenknecht, 2011). Some companies have developed new cutting techniques, such as undercutting. These are improvements made to mechanical cutting techniques. This cutting system caused tensile rock failure to enhance production rates. While the art of mechanical cutting was optimised, engineers also investigated various material technologies to develop more efficient and wearresistant cutting tools for hard rock excavation (Herrenknecht, 2011).
Some of the outcomes of the early development of mechanical excavation technologies included the mobile miner, continuous miner, mini full-facer, disc boom miner, oscillating disc cutter, activated disc cutting, narrow reef miner, mini mole, mini-disc drum cutterhead, roadheader, tunnel boring machine (TBM) for underground mining, and the mechanical surface miner for surface mining (Hartman,1992; Luxner et al., 2013; Karas’, Wach, 2014). Some of these development efforts have been halted or entirely abandoned by the development teams, including the mobile miner, mini full-facer, the disc boom miner and the mini mole (Hassani, 2008).
Two cases are selected to illustrate typical challenges encountered when introducing new technology developments in mines where the technology is initially embraced with enthusiasm and even progresses to implementation but later gets abandoned. The first example involves one of the joint development agreements
(JDA), which included OEM mining equipment and a major platinum miner. These companies pulled all the stops to develop and test some of these technologies. This equipment aimed to achieve two objectives, namely, rapid access and rapid stoping. The JDA partners designed and developed a slot boring system, Figure 4, which adopted a raise boring technology that used TBM-styled steel discs as a cutting system, as stated by Janicijevic and Valicek (2015). The rock collection system was pneumatic rather than hydraulic to minimise water-related problems with the platinum ore.
The slot boring system was designed to cut slots of 1.5 m dia at a rate of 11.4 m/h. The machine would be set up in haulage, as shown in Figure 5. The haulage needed to be drilled and blasted as a shanty back layout, as shown, 4.5 m high x 5 m wide. The pipes were fed into the machine from the bottom, pushing the cutter head into the reef, and the extracted material would be vacuumed out of the stope via a pneumatic extraction system, as shown in Figure 6. The improvement and advantage expected in using this equipment compared with existing drill and blast have many advantages, such as continuous mining can be much faster if set up correctly, safer as operators can be moved away from the mining face, and excavations are much more stable in the stope as no blast-induced fracturing is propagated into the surrounding rock mass.
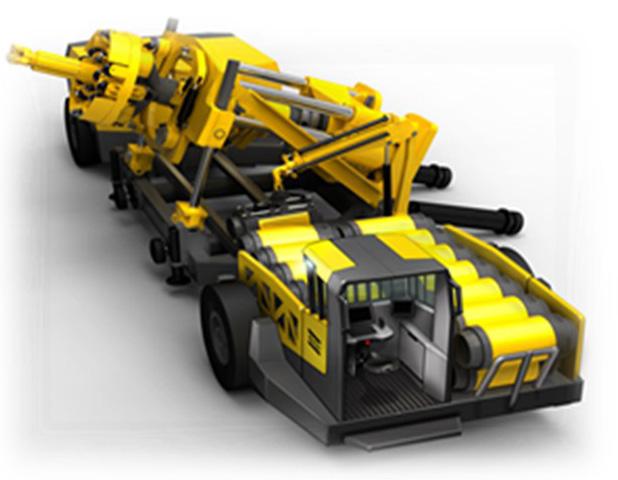
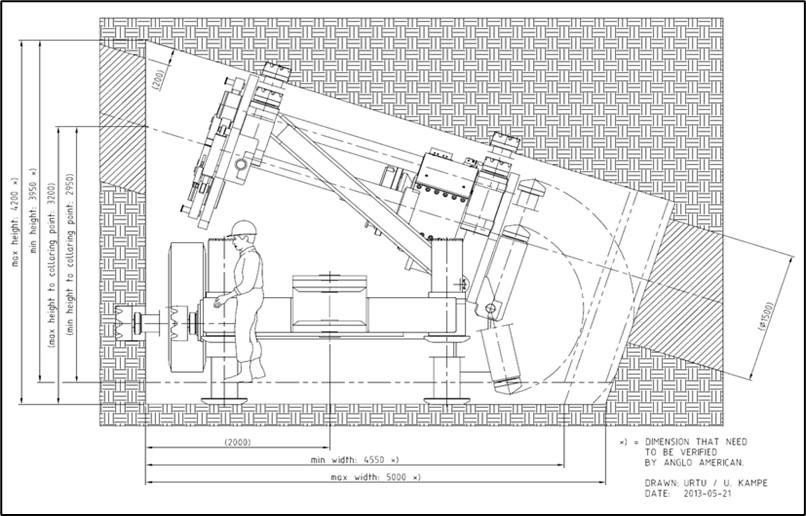
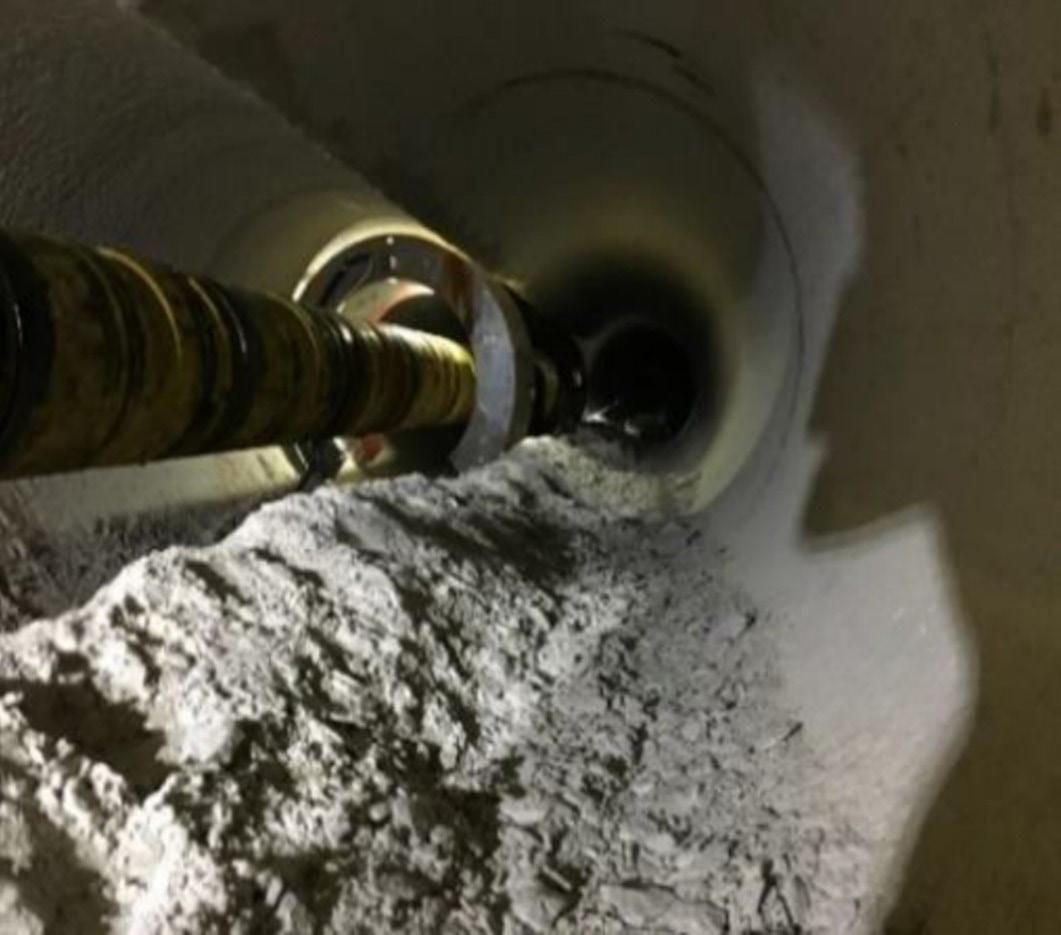
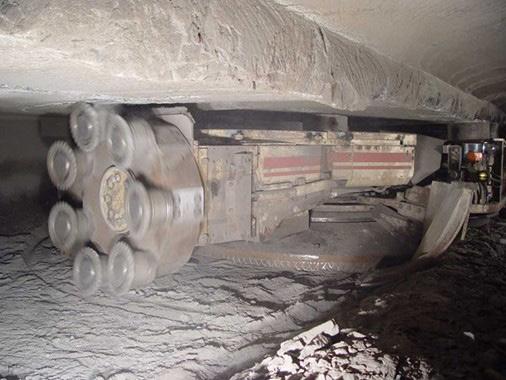
The system underwent a testing period but was later abandoned in 2018 after drilling six holes over a period of six months of testing. Some of the major shortfalls revealed from these tests were that the mine design and the drill and blast development were not considered a complete system, the machine experienced excessive vibration, excessive dust was experienced, the pneumatic system was under-designed, the extracted ore could not be loaded onto the strike belt system, material spill over into the adjacent slots occurred, and extreme flexing of push rods occurred. Due to the magnitude of the setup costs and the system not achieving its planned key performance indicators (KPIs), the project was abandoned, and the machine was scrapped.
The second case involves the voestalpine reef miner, the ARM 1100, illustrated by Figure 7, which was developed for the South African platinum mining industry in 2001. The project was a joint development between voestalpine and a consortium of South African platinum mining companies (Moxhan, 2004). The reef mining machine went through several iterations from its inception in 2001 up until 2018, when it was eventually abandoned due to the age of the machine and the added cost of rehabilitation.
During the period of 2001 up until 2018, the machine underwent several modifications and upgrades. The dominant design of this machine was based on undercutting technology but with many cutting tool developments. The other modifications included the ore handling system, machine tramming, bolting,
electrical cable handling system, and the steering system (Ramezanzadeh et al., 2010). These tests of the various systems were carried out as standalone tests as and when issues were noticed on these systems.
The final reef mining machine called the MN220, was abandoned in mid-2018 after the machine was tested using a pneumatic system for the extraction of the cut ore from the face to a test separator and filter system. Following this, a joint development agreement was initiated between an OEM and a major mining company to develop the next generation of this reef mining system. The lessons learnt over the almost twenty years of testing this machine were used as input to the new version of this stoping system, which not only considered the technical aspects of the stoping system but an entirely new mining layout to cater for this system. Although this system has been in development for over twenty years, it is still not regarded as a bankable technology or stoping system in the platinum mining industry. This is because the system can only be regarded as a bankable mining system once it has been vetted by a major mining company. These selected cases highlight the fact that major technology development in mining can take several years, involve major partnerships and protocols, and be costly to set up, and yet mining companies will be slow to adopt the new technology, or in the worst-case scenario, as often happens, it becomes abandoned.
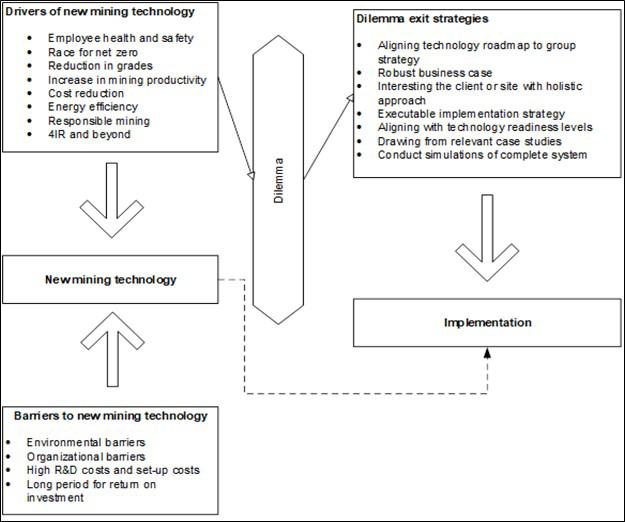
The drivers of new mining technology build on traditional ones, such as productivity and cost reduction, and feature both technological, social, and competitive related issues like net zero, responsible mining and 4IR, among others. Barriers to mining technology are largely those identified by Ediriweera and Wiewiora (2021), augmented by experience from case studies in South Africa that highlight high R&D and setup costs, and long periods of return on investments.
There is a dilemma in implementation, as mines are reluctant to adopt unproven mining technology until the technology is proven in an actual operation, where it can prove its planned KPIs over a set period. Nevertheless, a significantly small number of these technologies, which are either less costly to set up and implement or initially accompanied by high enthusiasm and substantial buy-in from stakeholders, are approved and implemented even if later abandoned. A substantial portion of the new mining technology, however, faces the dilemma of reluctance to be tried out and requires either robust return on investment or exit strategies, as shown in Figure 8, that can convince decision makers to take the risk of implementation. This hesitation is further compounded by operational inertia, regulatory uncertainty, and the high capital intensity of mining projects, which make experimentation on unproven technologies a costly option.
Additionally, the fragmented nature of mining operations often spread across geographies and governed by varying local policies creates inconsistencies in technology adoption. On the other hand, drivers such as increasing pressure for sustainability, digital transformation mandates, and competitive advantage through efficiency gains are beginning to shift the narrative. Technologies that align with ESG goals or demonstrate clear productivity enhancements are more likely to gain traction. Therefore, the dilemma is not merely technical but deeply strategic, requiring a framework that balances innovation with risk mitigation and provides clear exit pathways should the technology fail to deliver as expected.
Conclusion
This article notes key barriers and drivers for the implementation of new technology in the mining industry and proposes that a standardised technology development pathway applicable to other industries is adaptable to the mining sector. However, although lessons can be drawn by comparing the parallel features and similarity of pathways with other industries, the paper concludes that the mining industry has an outstanding characteristic to be confronted with, which may lead to a different outcome from others. Due to the capital-intensive nature and long periods before the return on investment (ROI) of mining investments can be realised, mining companies are reluctant to adopt new mining technology, as illustrated by the case studies discussed. The cost and time considerations, among others, are significant barriers to the adoption of new technology in mining. The article argues that for developers of new technology in mining, the approach used to present the business case to decision makers should incorporate both an economical and holistic perspective in addition to technical viability for a better chance of adoption. Such an approach is proposed in this paper as a preliminary conceptual framework to guide stakeholders on key areas to consider when presenting new technology to mining decision makers. As an initial framework, more work is required to test and pilot the concepts proposed.
Referencesw
Amadi-Echendu, J., Lephauphau, O., Maswanganyi, M., Mkhize, M. 2011. Case studies of technology road mapping in mining, Journal of engineering and technology management
Beck, D.F. 2013. Technology development life cycle processes, Fuzing and instrumentation technologies, Sandia national laboratories.
Bhappu, R.R., Guzman, J. 1995. Mineral investment decision making, Engineering and Mining Journal, vol. 7, pp. 36–38. Bitarafan, M.R., Ataei, M. 2004. Mining method selection by multiple criteria decision making tools, The Journal of The South African Institute of Mining and Metallurgy
BSC Incorporated. 2007. Mining Industry Energy Bandwidth Study, U.S. Department of Energy, Industrial technologies program Deloitte. 2016. Innovation mining Australia 2016, Monitor Deloitte. Available at: https://www.deloitte.com/content/dam/assetsshared/legacy/docs/gx-au-en-innovation-in-mining.pdf
De Villiers, R. 2013. Technology Development Handbook, Anglo American Plc.
Du Plessis M.J. 2017. Evaluation of Technology Strategy Application in the South African Mining Industry, researchgate.net/ publication/274364033
Ediriweera, A., Wiewiora, A. 2021. Barriers, and enablers of technology adoption in the mining industry. Resources Policy, vol. 73.
Eleven. 2021. Technological Innovation - A challenge worthy of the mining industry available at: https://eleven-strategy.com/ technological-innovation-a-challenge-worthy-of-the-miningindustry/
Fagan, D. 2020. Real life examples of opportunity costs. Open vault blogs. Available at: Stlouisfed.org/open-vault/202/january/reallife-exmples-opportunity-costs
Filippou, D., King, M.G. 2011. R&D Prospects in mining and metals industry, Resource Policy, vol. 36, no. 3, pp. 276–284.
Fordham, A.E, Robinson, G.M, Blackwell, B.D. 2017. Corporate social responsibility in resource companies – opportunities for developing positive benefits and lasting legacies. Resource Policy vol. 52, pp. 366–376.
General Kinematics. 2019. A brief history of mining: the advancement of mining techniques and technology. Available at: https://www.generalkinematics.com/blog/a-brief-history-ofmining-and-the-advancement-of-mining-technology/
Gruenhagen, J.H., Parker, R. 2020. Factors driving or impeding the diffusion and adoption of innovation in mining: A systematic review of the literature. Resources Policy, Elsevier.
Hall, H. 2017. Exploring innovation in Northern Canada with insights from mining innovation systems in greater Sudbury, Ontario. The Northern Review, vol. 45, pp. 33-56. Available at: https://doi.org/10.22584/nr45.2017.003
Hartman, H.L.1992. SME Mining Engineering Handbook, 2nd edition, vol 2.
Hassani, F. 2009. Review of explosive free rock breakage technologies and expertise, Final report submitted to: The technical committee of the explosive-free rock breakage initiative. Submitted by McGill University Department of Mining and Materials Engineering
Herrenknecht, A.G. 2011. Utility Tunneling, Traffic Tunneling, March.
Humphreys, D. 2020. Mining productivity and the fourth industrial revolution. Mineral Economics Journal
IntelliSense.io. 2022. An alternative approach to winning the race to net zero, available at: https://www.intellisense.io/2022/07/analternative-approach-to-winning-the-race-to-net-zero/ International Institute for Sustainable Development. 2021. New Tech, New Deal: Mining policy options in the face of new technology. The Intergovernmental Forum on Mining, Minerals, Metals and Sustainable Development (IGF), August.
Jacobs, J. 2016. Creating a technology map to facilitate the process of modernisation throughout the mining cycle. M.Eng (Mining Engineering) thesis, Department of Mining Engineering, University of Pretoria, South Africa.
Janicijevic, D., Valicek, P. 2015. A review of hard-rock cutting equipment technology development at Anglo American and Anglo Platinum. Proceedings of MPES 2015, Mine Planning and Equipment Selection, ‘Smart Innovation in Mining’, Sandton Convention Centre, Johannesburg, South Africa. Southern Institute of Mining and Metallurgy, Johannesburg.
Jordaan, J.T., Hendricks, C. 2009. The challenge of technology adoption and utilisation in the mining industry – A focus on open pit mining technologies. SAIMM, Base Metals Conference
Karas, H., Wach, M. 2014. New mechanization and automation roads in continuous mining – KGHM’s experience and future steps. Rapid Development Conference, Krakow, pp. 29–30 September.
Khalil, T. 2000. Management of Technology – The Key to Competitiveness and wealth creation, McGraw-Hill International Editions, pp 1–3; pp. 192 – 195; pp. 207–216.
Lane, A. 2016. Innovation state of play, Africa mining edition, Mining Indaba and Monitor Deloitte study
Lasley, S. 2022. Mining sector races to net zero by 2050. Available at: https://www.metaltechnews.com/story/2022/08/10/miningtech/mining-sector-races-to-net-zero-by-2050/1030.html
Levesque, M., Miller, D., Paraszczak, J. 2014. Energy and mining the home truths. Journal of Cleaner Production ,vol. 84, no. 1, pp. 233–255.
Luxner, T., Deen, J., Koske, M. 2013. Use of tunnel boring machines at the still water mining company’s underground PGM mines. Rapid Development Conference, Sydney.
Macfarlane, A.S. 2001. The implementation of new technology in southern African mines: Pain or panacea. Journal of the South African Institute of Mining and Metallurgy, vol. 101, no. 3, pp. 115–126
Mackenzie, W., Cusworth, N. 2007. The use and abuse of feasibility studies, Project evaluation conference, Melbourne Victoria. Enthalpy, available at: enthalphy.com.au
Moxam, K.A. 2004. A hard rock narrow reef mining machine— ARM 1100. International Platinum Conference ‘Platinum Adding Value’, The South African Institute of Mining and Metallurgy. Muduli, K., Govindan, K., Barve, A., Geng, Y. 2013. Barriers to green supply chain management in Indian mining industries: a graph theoretic approach, Journal of Cleaner Production, vol. 47, pp. 335-344.
Nanda, N.K., Kumar, S. 2013. Developments in mining machinery and systems, both surface and underground, for meeting the future challenges. Journal of Mines, Metals and Fuels, vol. 61, no. 7–8, pp. 163–169.
Nasirov, S., Agostini, C.A. 2018. Mining experts’ perspectives on the determinants of solar technologies adoption in the Chilean mining industry. Renewable and Sustainable Energy Reviews, vol. 95, pp. 194–202.
Nel, l., Burks, S. 1999. The bateman approach towards achieving economic and financial requirements for feasibility studies. Journal of the Southern African Institute of Mining and Metallurgy, pp. 303–315
Nicholas, J.M., Steyn, H. 2010. Project management for business, engineering, and technology principles and practices, 3rd edition, Butterworth-Heinemann.
Norgate, T., Haque, N. 2010. Energy and greenhouse gas impacts of mining and mineral processing operations. Journal of Cleaner Production.
Ntsoelengoe, B. 2021. Mining 4.0 – Modernization of mining in the fourth industrial revolution. Publication of CSIR Sciencescope, vol.17, no1.
Nuur, C., Gustavsson, L., Laestadius, S. 2018. Capability creation in the natural resource-based sector: experience from Swedish mining. Innovation and Development, vol.8, no. 1, pp. 103–123.
Olvera, B.C. 2021. Innovation in Mining: what are the challenges and opportunities along the value chain of Latin American suppliers, Mineral Economics, vol.3 5, pp. 35–51.
Prno, J., Slocombe S.D. 2012. Exploring the origins of ‘social license to operate’ in the mining sector: perspectives from government and sustainability theories Resources Policy, vol. 37, no. 3, pp. 346–357.
Raju, R.A. 2021. Comparison of the Business Case between Explosives and Non-Explosives Mining Methods for Underground Platinum Mining Projects, Research Gate, 2021.
Ramezanzadeh, A., Wood, M. 2010. A state of the art review of mechanical rock excavation technologies, International Journal of Mining and Environmental Issues, vol 1 no1.
Responsible Mining Index. 2022. RMI Report, available at: https://2022.responsibleminingindex.org/en
Ridley, M. 2020. How the innovation works, 4th Edition, Estate London.
Runge, P. 2015. Minimum Engineering Requirements, Minarco Perspectives, Issue 128.
Sanchez, F., Hartlieb, F. 2020. Innovation in mining industry: Technological trends and a case study of the challenges of disruptive innovation, Mining, Metallurgy and exploration.
Schilling, M.A. 2017. Strategic management of technological innovation, 5th Edition, McGraw Hill Education.
Soderholm, P., Svahn, N. 2015. Mining, regional development and benefit sharing in developed countries, Resources Policy, vol. 45, pp. 78–91.
Stewart, J.M., Malatji, S.M. 2018. Development of the MOSH leading practice adoption system – a science-based system for managing behaviour change, Journal of Southern African Institute of Mining and Metallurgy, vol. 118, no. 3, pp, 259–277.
Vogt, D. 2016. A review of rock cutting for underground mining: past, present, and future. Journal of The South African Institute of Mining and Metallurgy, vol. 116, no. 11, pp. 1011–1026.
Vogt, D., Hattingh, T. 2016. The importance of people in the process of converting a narrow tabular hard-rock mine to mechanization, Journal of The South African Institute of Mining and Metallurgy, vol. 116, no. 3, pp. 265–274. u
Introduce advanced solutions to improve thickener and filtration efficiencies amid changing ores
Date: 24-25 June 2026
Venue: Mintek, Johannesburg

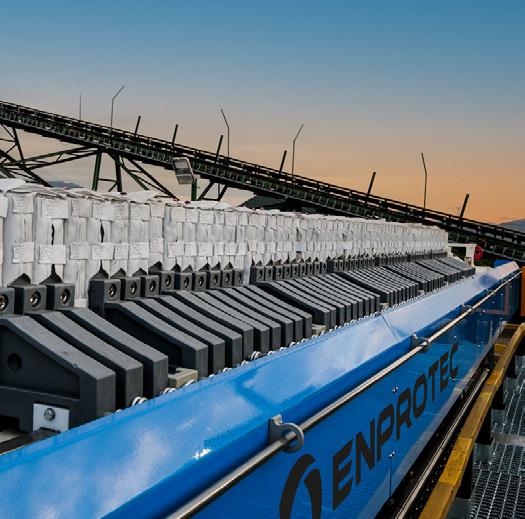
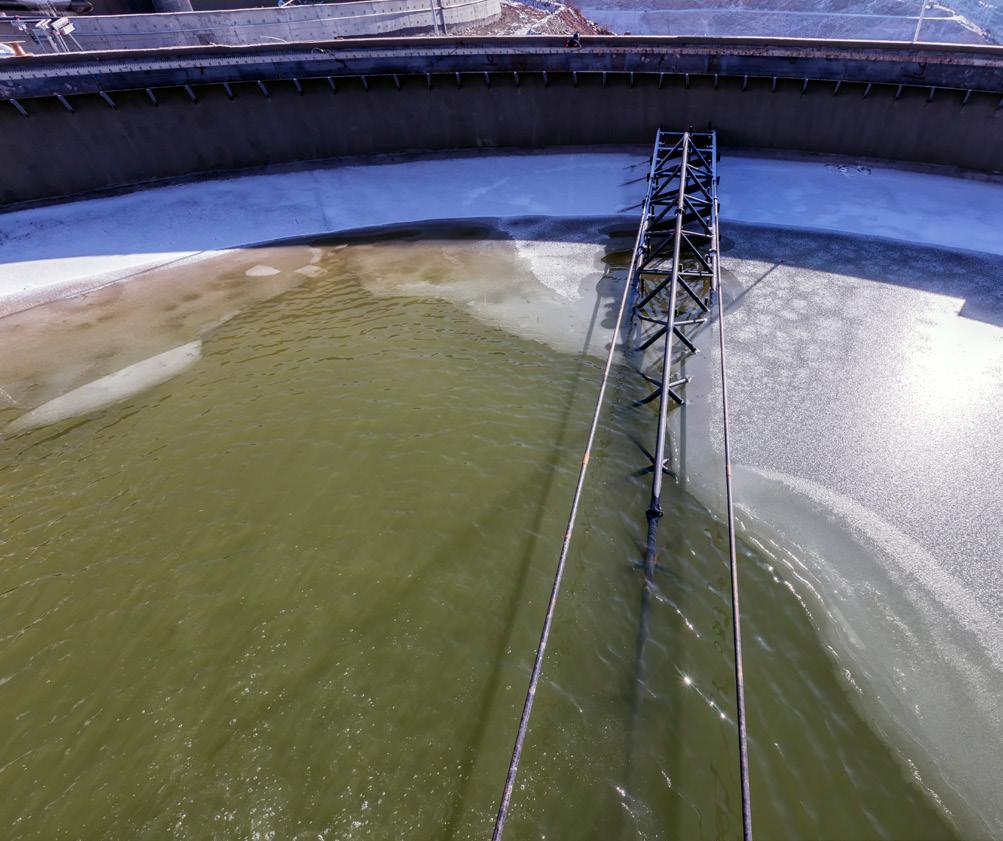
We are excited to invite you to an exclusive seminar collaboratively hosted by technical experts from Solenis, ENPROTEC and Mintek.. This seminar will focus on addressing key challenges in thickener and filtration operations operations, including optimising performance amid variable ore characteristics, enhancing water recovery through innovative dewatering techniques, implementing sustainable tailings management practices, and leveraging automation and advanced control systems to boost overall process efficiency.
As the mining industry embraces increasingly complex mineral deposits and adapts to evolving ore grades, there is a growing opportunity to leverage innovation and advanced technologies to boost efficiency and sustainability. Dewatering systems stand at the heart of this transformation, playing a crucial role in optimising dewatering processes and enabling responsible tailings management. By enhancing thickener and filtration performance, mining operations can achieve greater productivity while meeting their environmental stewardship commitments.
In recognition of these opportunities, this seminar will provide a comprehensive platform to explore cutting-edge technologies, share practical insights, and foster collaboration aimed at operational excellence and sustainability in mineral processing.
KEY TOPICS TO BE COVERED:
• Impact of ore variability on dewatering performance
• Innovative dewatering and water recovery technologies
• Sustainable tailings deposition practices
• Automation and advanced control systems to enhance thickener and filtration reliability and efficiency
Participants will gain valuable knowledge and actionable strategies to optimise thickener and filtration operations amid changing ore conditions.
Join us for an engaging, solutions-oriented workshop designed for professionals seeking to improve thickener and filtration reliability, maximize water reuse, and ensure responsible tailings management.
FOR FURTHER INFORMATION, CONTACT:
Gugu Charlie,
Conferences and Events Coordinator
E-mail: gugu@saimm.co.za
Tel:011 538 0238
Web: www.saimm.co.za

Affiliation:
1The University of Dar es Salaam, Mining and Mineral Processing Engineering, School of Mines and Geosciences, Tanzania
Correspondence to:
B.F. Giyani
Email: giyani.baker@udsm.ac.tz
Dates:
Received: 24 Dec. 2024
Revised: 14 Aug. 2025
Accepted: 27 Aug. 2025
Published: October 2025
How to cite:
Giyani, B.F., Salama, A. 2025. Development of mining industry in Tanzania: A review. Journal of the Southern African Institute of Mining and Metallurgy, vol. 125, no. 10, pp. 581–592
DOI ID:
https://doi.org/10.17159/2411-9717/3629/2025
ORCiD:
B.F. Giyani
http://orcid.org/0009-0009-3140-2380
A. Salama
http://orcid.org/:0000-0001-6210-978X
by B.F. Giyani1, A. Salama1
Abstract
Tanzania is a country with a variety of mineral deposits, including metallic minerals, gemstones, mineral fuels, industrial minerals, and critical minerals. This study provides an overview of mining legal framework, mineral occurrence and production, challenges in the mining sector, and government initiatives. The aim is to demonstrate the development of the mining sector in Tanzania and explore the potential for further mining investment in the country. The mineral production data showed generally increasing trends over the years, for example, gold production increased from 42 tonnes in 2018/2019 to around 50 tonnes in 2023/2024. Despite the growth, the mining sector encounters several challenges, including a lack of detailed geological information on mineral deposits, inadequate infrastructures in some remote mining sites, the existence of informal artisanal miners, and mineral smuggling. The Tanzanian government has introduced several initiatives to address these challenges, including carrying out the highresolution airborne geophysical survey to increase geological information in some areas, the formalisation of artisanal and small-scale mining, establishing mineral markets to combat mineral smuggling, and encouraging mineral value addition within the country.
Keywords mineral commodities, critical minerals, rare earth elements, mineral occurrence, artisanal and small-scale miners, mining legal framework
Introduction
The global demand for mineral commodities has increased rapidly in recent years due to technological advancement, industrial development, and a growing world population. Currently, mining operations worldwide extract about 70 billion tonnes of ore and waste materials from the ground each year (Vidal et al., 2021). The global decline of ore grades also accelerates the mineral demand as higher-grade deposits are mined and exhausted over time (Calvo et al., 2016). For instance, the global copper head grades dropped from about 4.0% in 1900 to around 0.65% in 2015 (Flores et al., 2020), and recently (2022), it has dropped to less than 0.52% (Holden, 2023). This means larger volumes of low-grade ores must be mined and processed to keep up with the increasing metal demand. In addition, mining companies are increasing their production in the existing deposits and searching for new mineral resources across the world, including Tanzania.
Tanzania is one of the countries with abundant mineral resources compared to Africa and the world (Weldegiorgis et al., 2023). The country has witnessed significant mineral exploration activities in recent years. As a result, new deposits have been discovered, such as those of rare earth and critical elements, the essential components in the development and advancement of modern technologies and future innovations, such as electric car batteries, smartphones, tablets, laptops, lasers, magnetic components (Haxel, 2002; Filho et al., 2023) and clean energy technologies (Agrawal, Sharma, 2021). In addition to the existing mineral deposits, more exploration projects are currently underway in different parts of the country in order to identify new mineral resources. The mineral deposits in Tanzania are associated with various geological systems, including the Nyanzian, Proterozoic, Ubendian, Craton, Usagaran, Bukoban, Karroo, Volcanics, and Cenozoic geological systems (GST, 2015; Kahyarara, 2024). The key mineral commodities found in these deposits can be categorised into five major groups: metallic minerals (e.g., gold, silver, and copper); gemstones (e.g., tanzanite and diamond); mineral fuels (e.g., coal and uranium); industrial minerals (e.g., bauxite, gypsum, limestone, phosphate, and soda ash); and critical minerals (e.g., nickel, graphite, lithium, and rare earth elements, also known as REE).
The contribution of the mining sector to the Tanzanian GDP has increased remarkably over the years, rising from 2.6% in 2008 to 5.1% in 2018, and is expected to reach 10% by 2025 (Ministry of Minerals, 2024). The growth of this sector is attributed to several factors, including improving the mining regulatory framework, bringing together foreign and local mining stakeholders for mutual benefits, enhancing peace and security, and promoting the formalisation of artisanal and small-scale miners (ASMs). Both large-scale mining companies and ASMs play critical roles in developing the mining sector in Tanzania. Large companies often bring major investment, advanced technology, and expertise, contributing to higher and more efficient production. Meanwhile, the artisanal and small-scale mining contributes to massive employment, promotes community involvement, and supports livelihoods. Currently, eight large-scale mines (six for gold and two for gemstones) and many medium and small-scale mines (primarily for gold, diamonds and coloured gemstones) operate in Tanzania. In addition, several mining projects are in the advanced stages, including Kabanga, Dutwa, and Ngwena (nickel projects), Mantra (uranium project), Liganga (iron ore project), Nyanzaga, Magambazi, Resolute-Nyakafuru (gold projects), Panda Hill (niobium project), Ngualla (rare earth elements), Uranex (graphite project), and Mchuchuma and Kiwira (coal projects).
Over the past thirty years, studies have reported several aspects of the Tanzanian mining industry, including ore geology, mineralisation, and occurrence (Van Campenhout, 2002; GST, 2015; Henckel et al., 2016; Dunn, Von der Heyden, 2022), economy (Jourdan, 1990; Mwalyosi, 2004; Kahyarara, 2024), as well as policy and legal (Chachage, 1995; Poncian, George, 2015; Huggins, Kinyondo, 2019). This study expands the knowledge by providing an overview of mining industry development in the country, including more recent information on mining legal framework, mineral occurrence and production, challenges, and government programmes, to demonstrate the development of Tanzania's mining sector and explore the potential for further mining investment in the country.
Since the 1980s, the government of Tanzania has implemented structural economic reforms in various sectors, including mining. Following these reforms, several policies, laws, and regulations were formulated to make provision for the control of mining operations in Tanzania and establish rules for the exploration and exploitation of mineral resources in the country. They are designed to attract investment, promote sustainable mining, increase government revenue, formalise artisanal miners, protect the environment in mining areas, and improve the well-being of local communities. Some key policies and laws governing the mining sector in Tanzania include the Mineral Policies of 1997 and 2009 (URT, 1997; 2009), and the Mining Acts of 1998 and 2010 (URT, 1998; 2010) , together with the Miscellaneous Amendments of 2017 (URT, 2017) and the Mining Act Revised Edition of 2019 - Chapter 123 (URT, 2019). In addition, several regulations have been formulated, covering various mining aspects such as, licensing, local content, and corporate social responsibility (CSR), environment and explosives, mineral trade, as well as dispute resolution.
The Mineral Policy of 1997 was the first mineral policy in Tanzania. This policy aimed to enhance the sustainable development of the mining sector while promoting private investment in the sector to increase contribution to the GDP. The Mining Act 1998 was enacted following the formulation of the 1997 Mineral Policy.
Some of the key aspects addressed in the 1998 Mining Act include attracting foreign investment, smoothening the progression from prospecting to mining rights, streamlining the procedure for obtaining mining rights, stabilising a fiscal package that includes basic rates for such items as royalties, and standardising the environmental protection and conservation guidelines (Butler, 2004; Lugoe, 2012).
By 2007, one of the key achievements witnessed since implementing the Mineral Policy of 1997 was the commissioning of six large-scale gold mines. These mines, and year of commissioning are as follow: Golden Pride Mine (1998), Geita Gold Mine (2000), Bulyanhulu Gold Mine (2001), North Mara Gold Mine (2002), Tulawaka Gold Mine - now Stamigold (2005), and Buzwagi Gold Mine (2007). As a result, the government revenue collected from the mining sector and the number of people employed in large-scale mines during that time increased substantially.
However, the mineral sector continued to face challenges, particularly low integration with other sectors of the economy, comparatively lower contribution to the GDP, low development of small-scale mining, and low technical expertise to administer the sector more effectively at that time. As a result, the Mineral Policy of 1997 was replaced by the Mineral Policy of 2009, following a ten-year evaluation since its implementation. The Mineral Policy of 2009 aimed at strengthening integration of the mineral sector with other sectors, improving the economic environment for investment, maximising benefits from mining, improving the legal environment, strengthening capacity for administration of the mineral sector, promoting and facilitating value addition of minerals, and strengthening environmental management. The formalisation of the ASM subsector was also emphasised in this policy, which facilitates the ASMs to access the market for minerals, geological information, and technical and financial services.
The Mining Act of 2010 (URT, 2010), which replaced the 1998 Mining Act (URT, 1998), is the primary legislation governing the mining activities in Tanzania. It makes provisions that regulate the law relating to prospecting for minerals, mining, processing, and dealing in minerals, as well as the granting, renewal, and termination of mineral rights, payment of royalties, fees, and other charges. Following the amendments to the 2010 Mining Act, some key features were pointed out in the Miscellaneous Amendments Act 2017 (URT, 2017) and the Mining Act Revised Edition of 2019 Chapter 123 (URT, 2019), including the establishment of the Mining Commission, increasing the royalty rate, increasing government shareholding in mineral right holders, and establishing mineral markets. The Mining Commission oversees the mining industry in Tanzania by supervising, monitoring, and regulating several aspects such as, exploration, mining, beneficiation, and mineral trading. The royalty rates on the gross value of minerals produced have been increased from 5% to 6% for diamonds and gemstones and from 4% to 5% for metallic minerals (e.g., gold, silver, copper, platinum, and others). Also, the government has the right to hold at least 16% free carried interest (FCI) in the share capital for medium and largescale mining companies operating in the country. Additionally, the mineral and gem houses were established in various places across the country, and the aim is to control mineral trading, reduce mineral smuggling from the country, and provide guaranteed mineral markets for ASM to increase government revenues from mineral trading in Tanzania. Furthermore, following the amendment of Section 59 of the Mining Act 2019 Chapter 123, the government has introduced the domestic gold purchase programme for local traders and miners; this programme is further discussed in the government initiatives section of this paper.
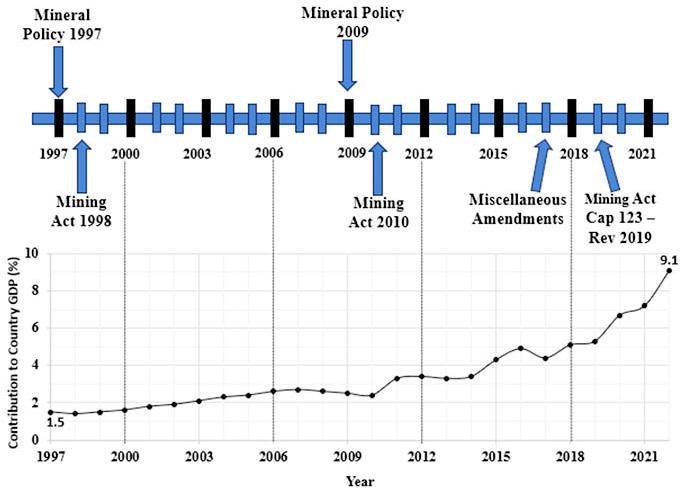
Figure 1 shows the mining sector legislation timelines and the corresponding GDP data. It can be seen that the mining sector's contribution to the country's GDP did not increase much between 1997 and 2009. However, a remarkable increase is observed from 2010 to date. For example, the government revenue from the mining sector increased from USD2 million in 1997 to USD78 million in 2007 (URT, 2009), then increased rapidly to about USD234million (2022), resulting in the GDP increase from 1.5% in 1997 to 9.1% in 2022. Such a remarkable increase can be attributed to several factors, such as increased foreign investment, increased royalty rates, formalisation of ASMs, and the establishment of mineral markets and buying centres. This trend suggests that mining legislation is one of the essential components influencing the growth of the mining sector in a country.
Mineral occurrences
The mineral resources of Tanzania are associated with a number of geological formations, and the ones with economic importance are the Nyanzian, Proterozoic, Ubendian, Craton, Usagaran, Bukoban, Karroo, Volcanics, and Cenozoic formations (GST, 2015; Kahyarara, 2024). The key mineral deposits found in these systems are presented in Figure 2. Based on the current study, this map shows that the country has a variety of mineral deposits, which can be categorised into five groups:
i. Metallic minerals: gold, silver, copper, and iron.
ii. Gemstones: tanzanite and diamond.
iii. Mineral fuels: coal and uranium.
iv. Industrial minerals: bauxite, gypsum, limestone, phosphate, and soda ash.
v. Critical minerals: nickel, graphite, lithium, and REE.
It should be noted that this study did not cover all the mineral commodities found in Tanzania, rather, the minerals listed here were selected to demonstrate the country's mineral wealth in order to explore more possibilities for mining investment in Tanzania. Generally, the map presented in Figure 2 indicates that the mineral deposits in Tanzania are primarily located in five key areas:
i. North and northwest: gold, silver, copper, diamond, and nickel.
ii. Northeast: tanzanite, phosphate, soda ash, and uranium.
iii. Central: gold, copper, graphite, uranium, and lithium.
iv. South and southwest: coal, uranium, graphite, gold, and REE.
v. East and along the coast: Limestone, gypsite, graphite, and heavy mineral sands.
Several metallic minerals are found in different parts of Tanzania. As shown in Figure 2, the majority of gold deposits in Tanzania are found in three main goldfields, which are Lake Victoria region (Geita, Nyamongo – Mara, Nzega – Tabora and Shinyanga); Mpanda and Lupa (Mpanda – Katavi, Chunya – Mbeya); and East and Central region (Sekenke – Singida, Sambaru, and Mananila) (Van Straaten, 1984; GST, 2015). In most of these deposits, gold mineralisation is found in quartz veins in shear zones and fractures or hosted by folded banded iron formation, and in other deposits gold is closely associated with porphyritic volcanic and sub-volcanic intrusive rocks (Henckel et al., 2016). Apart from gold, these deposits carry variable but significant amounts of other metals, e.g., copper and silver, which are extracted from metal sulphide and oxide minerals as concentrate, particularly copper. Currently, several large-scale companies are mining gold in Tanzania, including Geita Gold Mine (Geita), Barrick North Mara Mine (Mara), Barrick Bulyanhulu Mine (Shinyanga and Geita), New Luika Mine (Songwe), and Stamigold (Kagera). Other new gold projects are expected to start soon, including Nyanzaga (Mwanza), Shanta (Singida), Magambazi (Handeni Tanga), and Resolute-Nyakafuru. Gold mining and extraction activities are also performed by the medium-scale and small-scale miners in various parts of the country, particularly Geita, Chunya (Mbeya), Kahama (Shinyanga), Nzega (Tabora), Buhemba and Nyamongo (Mara).
In addition to gold, copper deposits are found in various locations in the country, including Lake Victoria region, Mpanda and Lupa goldfields, Malagarasi and near Lake Tanganyika (Kigoma), Pare mountains (Northeast) in Kilimanjaro region, and Uluguru mountains (Morogoro). Also, Tanzania has several iron deposits in various places, including Liganga and Mchuchuma (Njombe), Mvomero and Uluguru mountains (Morogoro), Karema and Hundusi (Katavi), Itewe (Chunya) (Jourdan, 1990; UNIDO, 1982). The Liganga iron ore mine holds the largest iron resources in Tanzania, with proven reserves of 126 million tonnes. In
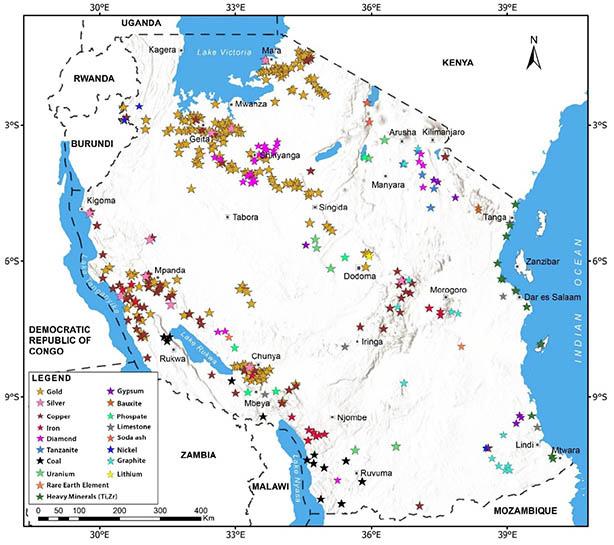
August 2024, the agreement to develop the Maganga Matitu iron project, worth USD77.4 million, was signed. It is jointly owned by Fujian Hexingwang Industrial Company from China (64%) and the Tanzanian government (36%). This project has an estimated iron reserve of 101 million tonnes. The project intends to utilise titaniferous magnetite deposits at Maganga Matitu and coal from Ketewaka to produce steel (Motisun Group, 2022). Currently, arrangements are made to compensate and relocate the residents for the project.
Gemstones
Tanzania has a variety of gemstones, such as diamonds, tanzanite, and others. Diamond and tanzanite account for a significant portion of the country’s economy from gemstone, therefore, these two gems are discussed in this study. Tanzanite is a blue vanadium-bearing variety of the sorosilicate zoisite, which is hosted in a complex region consisting of granulite facies metacarbonate and metasilicate rocks overprinted by amphibolite to greenschist facies retrogression (Olivier, 2006). It is commonly used in jewellery due to its rarity and trichroic beauty, displaying blue, red, and yellow-brown-green when viewed down at different crystallographic axes (Cairncross, 2019). Currently, tanzanite is only found in Tanzania at Mererani hills (Manyara), in the northeastern part of the country (see Figure 2). Tanzanite mineralisation at Mererani occurs within a series of graphite-kyanite gneiss units within the garnet sillimanite gneiss (Harris et al., 2014).
Diamonds commonly occur in two principal genetic deposit types: primary deposits (which are found in magmatic deposits of kimberlite and olivine lamproite) and secondary deposits (weathered from primary sources) (Kjarsgaard et al., 2022). The diamond deposits in Tanzania are genetically bound to kimberlitic extrusions, which are located in the north-central part of Archaean Craton near Shinyanga town (Stiefenhofer, Farrow, 2004). Tanzania has been a major diamond producer since 1940, with the bulk of production coming from the open pit Williamson mine in Mwadui
Shinyanga. Besides Williamson Diamonds Mine, diamonds are found in Mabuki, Maganzo (Shinyanga), and Nyang’wale (Geita). Currently, these mining sites are only operated by artisanal and small-scale miners. Limited diamondiferous kimberlites occur in the Western Rift valley (Rukwa and Nyasa) and southeast of Arusha in the Eastern Rift.
Coal and uranium
Tanzania has the largest coal resources in East Africa. This coal is mainly found along the Songea Karoo basins in the southern part of the country, particularly to the east and north-west of Lake Nyasa (Ruvuma and Kiwira), as well as in the north-west and south-east of Lake Rukwa. The total coal resource in the country is estimated to be more than 1.5 billion tonnes, but there could be up to five billion tonnes (Muhongo, 2013). Most coal is produced in the Ruvuma, Mbeya, Rukwa, and Songwe regions. Uranium is commercially extracted from uranium-bearing minerals such as uraninite. Uranium mineralisation has been identified in several areas in Tanzania, and the most potential deposits are located in Mkuju and Madaba (Ruvuma), Manyoni and Bahi Mbuga (Singida and Dodoma), as well as Minjingu (Manyara) and Monduli (Arusha). The Mkuju River mining project in the southwest of the Selous game reserve has more potential, with an estimated reserve of 182.1 million tonnes at a grade of 298 ppm U3O8 (O’Connor, Bertoli, 2012). However, the implementation of the project is waiting for the strategic environmental assessment (SEA) to evaluate the environmental impacts on the surrounding wildlife and ecosystems. This is because the deposit is located in the south-west of the Selous Game Reserve, home to a diverse range of wildlife, including elephants, lions, hippos, and numerous bird species.
Industrial minerals
Several industrial minerals are found in various places in Tanzania. The most common ones include limestone, gypsum, bauxite,
phosphate, and soda ash. Limestone is widely found in different parts of the country, particularly around the coastal regions or near rift valleys such as Tanga, Kilwa, Lindi, Dar es Salaam, Mbeya, and Iringa. These deposits are estimated to have over 300 million tonnes of limestone (Ministry of Minerals, 2021). It should be noted that some of the limestone deposits and other industrial minerals, particularly those in the coastal regions are not seen properly in Figure 2 because they are overlaid with a heavy minerals symbol, since both limestone and heavy minerals occur in the same locations. Both large-scale companies and small-scale miners perform limestone mining. For large scale, the production is performed to serve as the main raw material for manufacturing Portland cement in several factories such as Twiga cement, Simba cement, and Tembo cement. In the case of small-scale production, limestone is used in construction, lime manufacturing, agriculture (to reduce soil acidity), and small-scale cement production.
Gypsum deposits are found in many parts of Tanzania, such as Pindiro and Mandawa (Lindi), Msagali and Itigi (Singida), Mkomazi (Tanga), as well as Makanya (Kilimanjaro). The Pindiro and Mandawa deposit in Kilwa District is considered the largest deposit in the country. This deposit is dome-shaped, consisting of gypsum mineralisation at the top underlain by a zone of anhydrite sequences (up to 100 m in depth) followed by a sequence of rock salt (over 3000 m). Historical data over a small area of this deposit indicated that the deposit has over 5 million tonnes of 85% gypsum (Jourdan, 1990). Currently, gypsite mining is performed on a large scale at Kiranjeranje (in Kilwa District), and the ore is sent to a large factory at Mkuranga (Pwani) – Knauf Gypsum Tanzania Limited for further processing to make gypsum and other related products.
Bauxite is the most important ore of aluminium, composed primarily of one or more aluminum hydroxide minerals. In Tanzania, bauxite deposits are found in Usambara mountains (Kidundai-Magamba and Mabughai-Mlomboza) located in Lushoto in northern eastern part of the country. The MabughaiMlomboza and Kidundai-Magamba plateaus consist of high-grade metamorphic rocks of the Proterozoic Mozambique belt. Based on historical drilling data and surface geological mapping, bauxite mineralisation in this area is between 40%−60% Al2O3, and the total reserve of this deposit is estimated to be about 29 million tonnes (Mutakyahwa et al., 2003). Currently, mining activities in this area is performed by the small-scale mechanised miners, and the product is exported to a cement factory in Zambia. In addition, the Australian company Lindian Resources Ltd, is undertaking exploration works on two bauxite projects at Lushoto and Pare.
Phosphate deposits are found in various areas of Tanzania such as Minjingu (Manyara), Panda Hill, Mbalizi, Songwe, Ngualla Hill Carbonatite in Mbeya and Songwe regions, and Chali Hill in Bahi (Dodoma) (Msolla et al., 2005; Kalvig et al., 2012). Currently, phosphate is mined at the Minjingu deposit. The Minjingu phosphate has a reserve estimation of 10 million tonnes (MMFL, 2022), containing high to medium concentrations of naturally occurring P2O5 (20%−35%) (Haneklaus et al., 2024). Soda ash is mainly found around Lake Natron and the Engaruka basin. The mining proposal of soda ash ore (trona) from Lake Natron developed by the National Development Corporation (NDC) has generally met strong opposition from conservation agencies and local communities, citing the uniqueness of Lake Natron as an tourist attraction, a source of livelihood, and the only regular breeding site for the lesser flamingo (Phoenicopterus minor) in Eastern Africa (Kadigi et al., 2014). As a result, the Lake Natron project has been abandoned. In the case of Engaruka basin, drilling
exploration works have established the presence of large deposits of soda ash in terms of brine, which is estimated to be over 4.8 billion m3 (NDC, 2023). The government has already allocated funds to compensate the residents near the site to pave the way for this project.
Minerals containing critical elements have been found at various places in Tanzania. The most critical elements include graphite, nickel, lithium, titanium, and zirconium. Other important minerals found in the country carry rare earth elements and heavy minerals, e.g., ilmenite and zircon. The graphite deposits are located in the northeast, central, and southeast regions of the country, including Mererani (Manyara), Mpwapwa (Dodoma), Mahenge (Morogoro), and Nachingwea (Lindi). Several graphite projects are now active in the country, at various stages, including Bunyu (Mtwara), Epanko and Mahenge, Lindi Jumbo, and Chilalo (Lindi). The Jumbo project (located 200 km from Mtwara port) is one of the richest graphite reserves in Africa, containing high grade and coarse flake graphite with an estimated total mineral resource of 41.8 million tonnes at an average grade of 10.8% total graphitic carbon (Walkabout Resources, 2023). The first production in this project started in the first quarter of 2024.
Tanzania has several nickel deposits, and the most potential ones are located in the northwest at Kabanga (Kagera) and southeast at Ntaka hill (Nachingwea – Lindi) (Figure 2). At Kabanga, the mineralisation occurs as disseminated and massive sulphides, and the sulphide minerals present are pyrrhotite, pentlandite, chalcopyrite, cobaltite, and pyrite (GST, 2015). Historical data indicated that the Kabanga mineralisation contains a preliminary resource of over 20 23 million metric tonnes at 2.2 2.6% Ni, 0.27% Cu, and 0.16% Co (Evans et al., 2000; Maier et al., 2010). Similarly, in the case of the Ntaka project, mineralisation occurs as massive sulphide or disseminated sulphide grains, and pentlandite is the main nickel bearing mineral. Other sulphide minerals contained in this ore are chalcopyrite, pyrrhotite, and cobaltite. A preliminary resource of 12.8 million tonnes was reported for the Ntaka ore, at a grade of 1.21% Ni, 0.25% Cu, and 0.03% Co (Moore et al., 2012). It can be noted that in both deposits nickel occur together with cobalt and copper, which make these deposits more attractive.
Lithium occurrence has been reported in central Tanzania at Hombolo, approximately 40 km north-east of the Tanzanian capital Dodoma. The primary sources of lithium in this area, based on the preliminary analysis, are two minerals found within the pegmatites: lepidolite (a lithium-bearing mica), and spodumene (a lithium-bearing pyroxene). Hombolo has a history of hosting lithium-bearing pegmatites, which makes its vicinity one of the main attractions in the search for new lithium deposits in Tanzania (Metminec, 2023). Previous mapping efforts in the area have identified several occurrences of lithium, indicating the presence of valuable mineral resources with a maximum grade of up to 5.2% Li2O in pegmatites that intrude the regional metamorphic basement rocks of the exploration site (Cgrowth Capital, 2023). However, lower grades of 0.12%–1.34% Li2O have been reported by the Geological Survey of Tanzania (GST, 2015) using loose blocks of lepidolite collected the from pegmatite outcrop at Hombolo. More exploration works are being conducted at Hombolo and nearby areas, e.g., Kongwa, Chamwino, and Mohanga, to delineate potential lithium deposits in these areas.
Tanzania is reported to have considerable resources of REE, which are mostly hosted in carbonatite and phosphate minerals.
The most potential deposits are found in the southwest at Ngualla Hill (Mbeya), as well as in the eastern part of the country at Wigu Hill (Morogoro). The REE mineralisation at Ngualla is pipe-like in shape with a diameter of around 4 km and is hosted by an in situ iron oxide and baryte-rich weathering shell overlying fresh dolomite carbonatite (Harmer, Nex, 2016). Weathering depths are highly variable, but grades more than 3% total rare earth oxide (TREO) are common within the iron oxide-baryte-rich material over thicknesses of up to 140 metres and based on the high-grade core (central Bastnaesite zone). The Wigu Hill carbonatite complex is known to be an extensive occurrence of rare earth mineralisation, with bastnaesite-rich carbonatite dikes hosting high-grade TREO, dominated by the light REE including cerium, lanthanum, neodymium, praseodymium and samarium. The exploration work at Wigu identified at least five potential resources, and a total inferred resource of 3.3 million tonnes at 2.6% TREO has been defined in two resources, being Twiga and Tembo (Montero, 2015). Apart from REE, niobium is also found in Mbeya at Panda Hill, and an inferred mineral resource of 178 million tonnes at a grade of 0.5% Nb2O5 has been reported by Cradle Resources Limited (2015).
The occurrence of heavy mineral sands in Tanzania containing titanium and zirconium minerals has been reported since the 1990’s (Jourdan, 1990). These deposits are found in various locations along the coast, such as Tanga North, Tanga South (Tajiri Pangani), Bagamoyo, Fungoni (Kigamboni Dar es Salaam), Mafia Island West, Mteja (Lindi), Kiswere (Kilwa), and Madimba (Mtwara south) (Mangora et al., 2024). Currently, the most potential heavy mineral deposits are Tajiri and Fungoni. A scoping study reported by Strandline Resources Limited (2020) indicated that the Tajiri deposit has an estimated mineral resource of 268 million tonnes at an average grade of 3.3% total heavy mineral (THM), with about a 23-year mine life. The Fungoni deposit is relatively small, with a reserve of about 12.3 million tonnes and 6.2 years of mine life (Strandline Resources, 2022). In March 2024, the government issued a special mining licence (SML) for the Tajiri mineral sands project, and mining activities should commence within 18 months from the grant date.
Overall, this section demonstrates that Tanzania is rich in mineral resources. The availability of these minerals, an improved mining legal framework, and rising global mineral demand make the country attractive for mining investment and development.
Mineral production and
The mineral production and trends were analysed for the period between 2018 to 2024. This period was preferred due to data availability. Also, as mentioned before, significant changes in mining legislation occurred in Tanzania during this time. These changes have generally improved the mining sector in Tanzania, and they are likely to impact mineral production, so this study aims to capture that information.
The production trends for metallic minerals such as gold, silver, and copper are presented in Figure 3. As seen in this Figure, the gold production trend increased sharply from 42 tonnes in 2018/2019 to around 55 tonnes in 2021/2022 and then remained relatively constant to about 50−54 tonnes thereafter. The increase in gold production observed in 2019/2020 is attributed to the development of the small-scale mining sector in the country (e.g., formalising more ASMs), together with the establishment of mineral markets and buying centres across the country (between 2019 and 2021)
to prevent mineral smuggling so that actual production data are recorded. The proportion of gold produced by small-scale miners is seen in Table 1, rising from 12% (5,193.7 tonnes) in 2019/2020 to 29% (15,327.2 tonnes) in 2019/2020. Despite the low-technology employed by the ASMs, these results indicate that they can make a significant contribution to the mining sector, thus emphasising the importance of formalising and supporting the ASMs subsector.
Although the copper concentrate production data for 2018/2019 was unavailable when this study was conducted, the general trend showed a sharp decline in copper production in 2020/2021. This is attributed to the closure of the Buzwagi mine (2021) and the reduced production of copper concentrate from the Bulyanhulu mine (the largest copper producer in Tanzania) following the government's ban on exporting mineral concentrates and raw ores. The copper production increased sharply thereafter, rising from 11,636 tonnes (2020/2021) to around 31,800 tonnes (2022/2023). This is when the Bulyanhulu mine resumed operation at its full capacity, following the government approval to export copper concentrate after resolving disputes between Barrick Gold and the Tanzanian government. Silver production exhibited a similar trend to copper, which could be because silver is commonly associated with copper or other metallic sulphides.
Even though Tanzania is has varieties of gemstones, it has been noted that the gemstone industry is dominated by diamond and tanzanite, and the production data is presented in Figure 4. As seen in this Figure, the diamond production was high in 2018/2019 and then gradually decreased in the following year, and a sharp decline is observed in 2020/2021. This decline is attributed to the COVID-19 pandemic, whereby the Williamson diamond mine (the large diamond producer in Tanzania) suspended operations due to the world market diamond price drop during the pandemic. In 2021/2022, the production started to increase, but in the following year, the production dropped slightly. This is because, in November 2022, the Williamson mine suspended operations for several months due to a failure of the tailings storage facility (TSF), which halted production in 2022/2023. Thereafter, the operations were resumed in July 2023, which lead to the production increase to about 302 thousand carats in 2024.
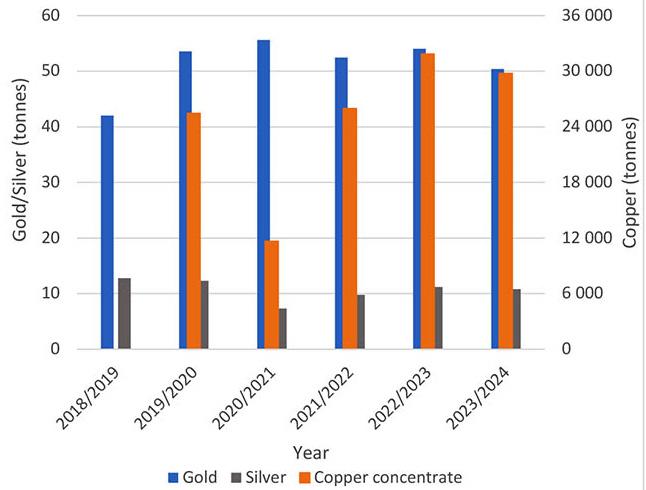
Table 1
Gold production based on the scale of mining operation (Source: Tanzania Mining Commission)
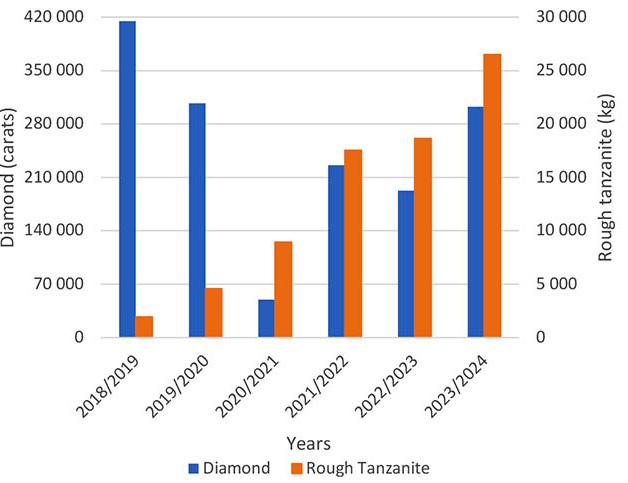
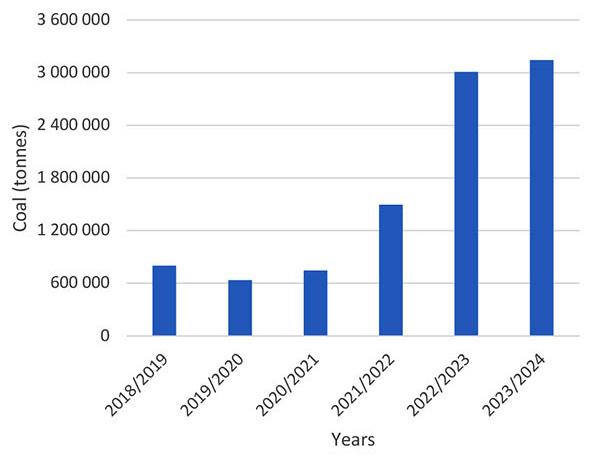
The rough tanzanite production showed an increased trend over the years, from about 1965 kg in 2018/2019 to 26,490 kilogrammes in 2023/2024, equivalent to an increased production of around 1250% in six years. This massive increase in tanzanite production is attributed to several initiatives introduced by the government during this period, such as the construction of a concrete wall surrounding the Mererani gemstone mines in 2018 to combat illegal tanzanite mining and the establishment of gem houses (e.g., Mererani mineral market – 2021).
Figure 5 shows the trend of coal production in the past six years. It can be seen that initially (2018-2020), the production was low, ranging between about 600,000 and 800,000 tonnes, which was mainly produced at Ngaka Coal Mine and some small-scale mines. In the last financial year (2023/2024), coal production approached 3.1 million tonnes (with a value of around TZS 917 billion), equivalent to an increase in coal production of over 290% in only six years. The higher increase in coal production seen from 2021/2022 was mainly attributed to establishing new large-scale mines, such as Ruvuma Coal Mine and Jitegemee Coal Mine, with a small proportion produced by several small-scale mines. To date, no uranium production has been reported in Tanzania.
A summary of selected production data for industrial minerals is presented in Table 2. The general trend indicates that the production of most minerals increased over the years, with high production dominated by limestone compared to gypsum, bauxite, and phosphate. The increasing trend of limestone production is mainly due to an increased demand for construction, lime manufacturing, agriculture, and cement Companies. Recent increases in the demand for cement for medium and large construction projects have further enhanced the economic merit of limestone production. As for gypsum, the increase in its production over the years has been attributed to the development of the Tanzania construction industry, which includes both commercial and residential buildings. Despite existing bauxite deposits in the country, bauxite production is relatively low. As mentioned before, bauxite production is only performed by small-scale mechanised miners in Lushoto. Future potential projects like those of Lindian Resources Ltd (located at Lushoto and Pare) are expected to significantly increase bauxite production.
Further, phosphate production is lower than that of other industrial minerals, though it has, in general, gradually increased over the years. Most of it is mined at Minjingu and then processed to make fertilisers, while a small portion is mined by the small-scale miners in other deposits. The Minjingu mine is in the final stages of expanding its factory to increase fertiliser production.
Table 2
Industrial minerals production (Source: Tanzania Mining Commission)
Note: (-) means the data is not available
The production data have generally indicated increased trends in most minerals for the selected period, except in a few cases, as pointed out in this section. The growth in mineral production is attributed to several factors, including improved mining legislation and the availability of rich mineral deposits, which encouraged more mining investment in the country. It is worth mentioning that Tanzania was one of the few countries that didn’t impose lockdowns in the fight against the COVID-19 pandemic. So, large mining companies (except Williamson diamond mine) and ASMs continued with operations, though extra health precautions were taken to prevent transmission. This explains why most of the trends in this study did not exhibit a significant reduction in mineral production between 2019/2020 and 2020/2021.
Challenges in the mining sector and government initiatives
Despite the country being a better place for mining investment, the mining sector in Tanzania encounters several challenges, including a lack of detailed geological information on mineral deposits, inadequate infrastructures in some remote mining sites (e.g., reliable electrical power supply, good roads, clean water access), environmental and land degradation concerns, the presence of informal artisanal miners, and mineral smuggling. Also, while Tanzania has a variety of minerals, it has been observed that the mining sector contribution is heavily dominated by fewer mineral types such as gold, diamond, gemstones, and coal, so utilising other minerals in addition to the dominant ones will boost the country’s economy even further. Another challenge that is being faced by the whole world is the decline of high-grade deposits in some places. Mining activities e.g., gold, have been conducted in Tanzania for over a hundred years. This leads to the depletion of high-grade and easily accessible deposits in some areas. Thus, requiring advanced technologies to extract the minerals profitably can be exceedingly costly and challenging. In addition, some of the key challenges facing the ASM subsector in Tanzania include limited use of mechanisation, low level of occupational safety and health care associated with rudimentary mining and mercury amalgamation, lack of a skilled workforce, a high level of environmental risks and poor waste management, poor links between ASM and financial institutions, lack of personal protective equipment, and tax avoidance.
The Tanzanian government intends to conduct geological surveys of rocks using modern technologies, which will aid in identifying new mineral deposits (Minister of Minerals of Tanzania, 2024a). To date, just 16% of the country’s land has been thoroughly
geologically surveyed, but the plan is to cover at least 50% by 2030. This initiative will provide a better understanding of mineral resources in the country and their location, thereby attracting more mining investors. In this financial year (2024/2025), the parliament has approved a project to conduct an in-depth geological survey in two blocks (covering a total of 165,574 km2) in the regions of Rukwa, Katavi, Mbeya, Songwe, and Kigoma. The government’s long-term plan is to purchase a helicopter for rapid measurements of high-resolution airborne geological surveys nationwide.
As mentioned before, the Tanzanian government constructed a concrete wall around the entire tanzanite mining area in Mererani. The construction of this wall was completed by February 2018, costing about USD 2.9–3.1 million (Huggins, Kinyondo, 2019). This decision was made to combat tanzanite smuggling because about 40% of all production was illegally traded and exported, resulting in a significant loss of government revenue collections from this precious gem. The wall is 24 km long and over 3 metres high, with a single exit and entry gate that is tightly controlled to prevent unauthorised access to mining areas. This government intervention resulted in a significant increase of reported rough tanzanite production of about 1160%, from 156 kg (2016/2017) to approximately 1,965 kg (2018/2019). As a result, the revenue collection from tanzanite increased by 1,520% from TZS 119 million (2016/2017) to TZS 1,928 million (2018/2019) (Mining Commision, 2022).
The Tanzanian government has increased infrastructure development, including electrification in rural areas (e.g., active mining sites) through the Rural Energy Agency (REA). For example, in April 2023, the Stamigold Biharamuro Mine project was connected to the national electricity grid. Also, TZS 7 billion has been allocated to provide electricity to 52 areas in Geita to support ASM operations (Minister of Minerals of Tanzania, 2024b). This follows the completion of the Julius Nyerere Hydropower Project (JNHPP), which can create up to 2,115 MW of electricity when fully operational, allowing more power distribution to remote areas, including mining sites. Furthermore, by December 2022, the government had constructed 36,760.29 km of roads connecting regions and districts across the country (Ministry of Works, 2022). These roads are crucial in the development of the industrial sector, including mining, because they are used to transport equipment and consumables to the mining sites and the extracted materials from the mining sites. However, more roads need to be constructed in remote areas to further facilitate the transportation process throughout the year, even during rainy seasons.
The value addition process of some minerals (e.g., copper concentrate) is performed abroad due to limited refinery technologies and capacities in Tanzania. Following the recent reforms of mining laws and regulations, particularly the Mining Value Addition Regulations and Amendments of 2020, mining companies are encouraged to establish smelting and refinery facilities within the country for mineral value addition rather than exporting raw minerals abroad. Adding mineral value within the country will stimulate local industrial development and provide employment opportunities to many Tanzanians. The government has offered tax exemptions on imported machinery and equipment to companies doing mineral refinery work in the country to achieve this goal. Hence, supporting the National Five-Year Development Plan, emphasises building human capacity, strengthening industrial productivity, and stimulating an inclusive and competitive economy (URT, 2021). For the first time in March 2024, the government
has offered a Multi-Metal Processing Facility licence to Lifezone Metals Limited to refine nickel, copper, and cobalt in-country. The facility will be located in the Buzwagi Special Economic Zone in the Kahama district.
In June 2024, the Mining Act, Chapter 123 (Section 59) was amended, requiring the mineral right holders and the mineral dealers to set aside at least 20% of gold produced/purchased within the country by selling their gold directly to the Bank of Tanzania (BOT) at competitive world market prices. This programme was officially initiated on 1st October 2024, aiming to enhance currency stability and foster economic confidence. It offers reduced fees such as a royalty of 4% instead of 6%, inspection fees of 0% instead of 1%, and 0% value-added tax. In this programme, the miners and traders are required to submit the reserved gold to any of the three mineral refineries: Geita Gold Refinery Ltd (Geita), Eye of Africa Ltd (Dodoma), and Metals Refinery Ltd (Mwanza). BOT has set aside TZS 1 trillion to purchase gold through this programme (President of the United Republic of Tanzania, 2024).
In recent years, the government has greatly facilitated the formalisation of ASM to reduce the number of informal miners by offering more primary mining licences (PML) to qualified applicants. For instance, between July 2023 and March 2024, the number of PML granted was 6,934. Regarding its formalisation efforts, the government, through the State Mining Corporation (STAMICO), has conducted training for over 10,000 ASMs (by 2023) on health and safety, environmental management, business management, and planning. Also, the government has purchased 15 drilling rigs to support ASM operations through STAMICO. Five drilling rigs are already being used to support ASM activities in various parts of the country. Once the rest of the rigs arrive, two will be dedicated to serve youth miners and one for women miners, to facilitate their operations (President of the United Republic of Tanzania, 2024).
In addition, the government has linked the ASM with financial institutions to acquire loans to purchase mining equipment and machinery. Several banks have offered loans to ASMs that amounts to TZS187 billion from July 2023 to March 2024 (Minister of Minerals of Tanzania, 2024a). These banks include: Cooperative Rural Development Bank (CRDB), National Microfinance Bank (NMB), AZANIA, and Kenya Commercial Bank (KCB). Also, the government has established mineral processing training facilities to serve ASMs. These facilities are located at Lwamgasa and Katente (Geita), and Itumbi (Mbeya). Furthermore, the government plans to construct a modern geoscience laboratory in Dodoma and establish small laboratory facilities at Chunya and Geita to serve ASMs.
To prevent mineral smuggling, the government has established mineral markets and mineral buying centres across the country, which were introduced to control mineral trading and ensure tax revenue collection, including in the ASM subsector. Mineral trading outside of the established markets is prohibited in Tanzania, so minerals must be traded at the market within the region where they are mined and extracted, and only licenced dealers are permitted to export minerals. A total of 42 mineral markets and 78 mineral buying centres were established across the country by June 2022 (Mining Commission, 2023). As a result, the government revenue collection from mineral markets and buying centres, in terms of royalty, clearance, and inspection fees, has increased from TZS8.37 billion (2018/19) to TZS157.44 billion (2022/23), equivalent to a 95% increase in five years. This amount was collected from purchasing gold, tanzanite, diamond, and other gemstones.
Tanzania has a wide range of mineral resources, including metallic minerals, gemstones, industrial minerals, coal, critical minerals, and rare earth elements. The availability of these minerals in the country, improved investment policies, and rising global mineral demand, make the country attractive for mining investment. Therefore, this study provides an overview of the country's mining industry, including more recent information on mining legislation, mineral occurrence and production, and government programmes, to demonstrate Tanzaniaww's mining sector growth and potential for further investment.
One of the key challenges facing the mining sector in Tanzania is the lack of detailed geological information on some potential mining areas, which limits the discovery and development of new mineral resources. Only 16% of the country’s land is surveyed using high-resolution airborne geophysical measurements. Other challenges encountered by the mining sector in Tanzania include a lack of adequate infrastructure in some remote mining sites, informal artisanal miners in some areas, environmental and land degradation, particularly in some ASM sites, lack of mineral refinery facilities in the country, and mineral smuggling.
The Tanzanian government has implemented several initiatives to address these challenges, including approving a budget to conduct an in-depth geological survey to improve geological information, constructing the great Mererani wall to prevent tanzanite smuggling, and continued to development of infrastructure including mining areas. Another key initiative implemented recently was the reform of mineral legislation, which helped to promote the development of the mining sector in the country, including the formalisation of ASMs by issuing more primary mining licences to qualified applicants, encouraging value addition of minerals within the country, such as offering an area for constructing refinery facilities, which is located in Kahama district; conducting training sessions for over 10,000 ASMs (by 2023) on various aspects, including health and safety, providing drilling services to ASMs, establishing 42 mineral markets and 100 mineral buying centres to combat mineral smuggling, and linking ASMs with financial institutions to improve mining and processing technologies.
Acknowledgements
The authors acknowledge the Department of Mining and Mineral Processing Engineering of the University of Dar Es Salaam for the financial support of this research.
Credit author statement
BG: conceptualisation, validation, writing, visualisation, investigation, original draft preparation.
AS: validation, supervision, review.
References
Agrawal, V., Sharma, S. 2021. Critical Minerals: Current Challenges and Future Strategies Critical Minerals: Current Challenges and Future Strategies. International Journal of Environmental Sciences & Natural Resources This, vol. 27, no. 3. https://doi.org/10.19080/IJESNR.2021.27.556215
Butler, P. 2004. Tanzania : Liberalisation of Investment and the Mining Sector Analysis of the Content and Certain Implications of the Tanzania 1998 Mining Act. Regulating Mining in Africa For Whose Benefit, pp. 67–80.
Cairncross, B. 2019. Connoisseur’s Choice: Tanzanite, Gem Variety of Zoisite, Merelani Hills, Simanjiro District, Manyara Region, Tanzania. Rocks and Minerals, vol. 94, no. 6, pp. 530–539. https://doi.org/10.1080/00357529.2019.1641023
Calvo, G., Mudd, G., Valero, A., Valero, A. 2016. Decreasing ore grades in global metallic mining: a theoretical issue or a global reality? Resources, vol. 5, no. 4, p. 36. https://doi.org/https://doi:10.3390/resources5040036
Cgrowth Capital. 2023. Nkole-Hombolo Lithium Project. Preliminary Report. Tanzania mining Project (Issue July).
Chachage, C. S. 1995. The meek shall Inherit the earth but not the mining Rights. Studies on Accumulation Processes and Local Institutions, pp. 37–108.
Cradle Resources Limited. 2015. Panda Hill Niobium - A Step Closer to Construction
Dunn, S. C., Von der Heyden, B.P. 2022. Proterozoic – Paleozoic orogenic gold mineralization along the southwestern margin of the Tanzania Craton: A review. Journal of African Earth Sciences, vol. 185 (November 2020), 104400. https://doi.org/10.1016/j.jafrearsci.2021.104400
Evans, D.M., Boadi, I., Byemelwa, L., Gilligan, J., Kabete, J., Marcet, P., Sy, A. 2000. Kabanga magmatic nickel sulphide deposits, Tanzania: morphology and geochemistry of associated intrusions. Journal of African Earth Sciences, vol. 30, no. 3, pp. 651–674.
Filho, W.L., Kotter, R., Özuyar, P.G., Abubakar, I.R., Eustachio, J.H.P.P., Matandirotya, N.R. 2023. Understanding Rare Earth Elements as Critical Raw Materials. Sustainability (Switzerland), vol. 15, no. 3. https://doi.org/10.3390/su15031919
Flores, G.A., Risopatron, C., Pease, J. 2020. Processing of Complex Materials in the Copper Industry: Challenges and Opportunities Ahead. Jom, vol. 72, no. 10, pp. 3447–3461. https://doi.org/10.1007/s11837-020-04255-9
GST. 2015. Explanatory notes for the minerogenic map of Tanzania. Geological Survey of Tanzania (GST).
Haneklaus, N.H., Mwalongo, D.A., Lisuma, J.B., Amasi, A.I., Mwimanzi, J., Bituh, T., Ćirić, J., Nowak, J., Ryszko, U., Rusek, P., Maged, A., Bilal, E., Bellefqih, H., Qamouche, K., Brahim, J.A., Beniazza, R., Mazouz, H., Van der Merwe, E.M., Truter, W., Wacławek, S. 2024. Rare earth elements and uranium in Minjingu phosphate fertilizer products: Plant food for thought. Resources, Conservation and Recycling, vol. 207 (April). https://doi.org/10.1016/j.resconrec.2024.107694
Harmer, R.E., Nex, P.A.M. 2016. Rare earth deposits of Africa. Episodes, vol. 39, no. 2, pp. 381–406. https://doi.org/10.18814/epiiugs/2016/v39i2/95784
Harris, C., Hlongwane, W., Gule, N., Scheepers, R. 2014. Origin of tanzanite and associated gemstone mineralization at Merelani, Tanzania. South African Journal of Geology, vol. 117, no. 1, pp. 15–30. https://doi.org/10.2113/gssajg.117.1.15
Haxel, G. 2002. Rare Earth Elements — Critical Resources for High Technology. U.S. Department of the Interior, U.S. Geological Survey, vol. 82, no. 2.
Henckel, J., Poulsen, K.H., Sharp, T., Spora, P. 2016. Lake Victoria goldfields. Episodes, vol. 39, no. 2, pp. 135–154. https://doi.org/10.18814/epiiugs/2016/v39i2/95772
Holden, J. 2023. Gold mine stripping ratios rise on high prices, grades continue declining | S&P Global Market Intelligence.
S&P Global Market Intelligence. https://www.spglobal.com/ marketintelligence/en/news-insights/research/gold-minestripping-ratios-rise-on-high-prices-grades-continue-declining
Huggins, C., Kinyondo, A. 2019. Resource nationalism and formalization of artisanal and small-scale mining in Tanzania: Evidence from the tanzanite sector. Resources Policy, vol. 63. https://doi.org/10.1016/j.resourpol.2019.101436
Jourdan, P. 1990. The Minerals Industry of Tanzania (Issue February). Institute of Mining Reasearch, University of Zimbabwe.
Kadigi, R.M.J., Mwathe, K., Dutton, A., Kashaigili, J., Kilima, F. 2014. Soda Ash Mining in Lake Natron: A Reap or Ruin for Tanzania? Journal of Environmental Conservation Research, vol. 2, no. 2, p. 37. https://doi.org/10.12966/jecr.05.01.2014
Kahyarara, G. 2024. Dynamics and Trends of Mining in Tanzania : A Cointegration. African Journal of Economic Review, vol. 12 (June), pp. 137–160.
Kalvig, P., Fold, N., Jonsson, J.B., Mshiu, E.E. 2012. Rock phosphate and lime for small-scale farming in Tanzania, East Africa. Geological Survey of Denmark and Greenland Bulletin, vol. 26, pp. 85–88. https://doi.org/10.34194/geusb.v26.4772
Kjarsgaard, B.A., Wit, M. De, Heaman, L.M., Pearson, D.G., Stiefenhofer, J., Janusczcak, N., Shirey, S.B., Dc, W. 2022. Global Diamond Mines and Deposits. vol. 88 (July).
Lugoe, F. 2012. Governance in Mining Areas in Tanzania with Special Reference to Land Use. The Economic and Social Research Foundation (ESRF), vol. 41, pp. 1–17.
Maier, W.D., Barnes, S.J., Sarkar, A., Ripley, E., Li, C., Livesey, T. 2010. The Kabanga Ni sulfide deposit, Tanzania: I. Geology, petrography, silicate rock geochemistry, and sulfur and oxygen isotopes. Mineralium Deposita, vol. 45, no. 5, pp. 419–441. https://doi.org/10.1007/s00126-010-0280-0
Mangora, M.M., Msangameno, D.J., Woiso, J.F., Shaghude, Y.W. 2024. State of the Coast for Mainland Tanzania. Chapter 15: Coastal Mining.
Metminec. 2023. Desktop Research & Reconnaissance Survey Report Lithium Exploration Project in the Hombolo Area in Tanzania (Issue September).
Mining Commision. 2022. Annual Report 2020-2021. www. tumemadini.go.tz
Mining Commision. 2023. Annual Report 2021-2022. www. tumemadini.go.tz
Minister of Minerals of Tanzania. 2024a. Budget Speech presented by the Minister of Minerals in the Tanzania National Assembly on 30th April 2024.
Minister of Minerals of Tanzania. 2024b. Speech by Honorable Antony Mavunde at the closure of the 7th Mining Technology Exhibition held in Geita on 13th October 2024.
Ministry of Finance. 2023. The Economic Survey 2022. Ministry of Finance, United Republic of Tanzania.
Ministry of Minerals. 2024. Investor’s Guide Tanzania Mining Sector Ministry of Minerals, United Republic of Tanzania.
Ministry of Minerals. 2021. Tanzania Mining Industry on the Verge of a New Era. Years of Tremendous Growth. International Mineral and Mining Investment, pp. 1–72.
Ministry of Works. 2022. Basic Statistics and Information in Construction Industry (2021). Ministry of works and Transport, United Republic of Tanzania.
MMFL. 2022. About Minjingu mines - Minjingu Phosphate Deposits. Minjingu Mines and Fertilizer Limited. https://minjingumines.com/about.html
Montero. 2015. Montero Mining and Exploration Ltd. Management’s Discussion and Analysis. Wigu hill REE Project in Tanzania.
Moore, C., Eng, P., Munro, P., Mcara, J., Eng, P., Schunke, N., Mining, B.E., Min, M.C.P. 2012. Technical Report on the Ntaka hill nickel sulphide project Lindi and Mtwara regions, Tanzania, Africa.
Motisun Group. 2022. Mining - Maganga Matitu Resources Development Ltd (MMRDL) https://doi.org/motisungroup.com/ services/mining/, accessed on 23rd October 2024.
Msolla, M.M., Semoka, J.M.R., Borggaard, O.K. 2005. Hard Minjingu phosphate rock: An alternative P source for maize production on acid soils in Tanzania. Nutrient Cycling in Agroecosystems, vol. 72, no. 3, pp. 299–308. https://doi.org/10.1007/s10705-005-6081-7
Muhongo, S. 2013. Tanzania as an Emerging Energy Producer. Chatham House. Africa Meeting Summary, pp. 1–10. www. chathamhouse.org
Mutakyahwa, M.K.D., Ikingura, J.R., Mruma, A.H. 2003. Geology and geochemistry of bauxite deposits in Lushoto District, Usambara Mountains, Tanzania. Journal of African Earth Sciences, vol. 36, no. (4), pp. 357–369. https://doi.org/10.1016/S0899-5362(03)00042-3
Mwalyosi, R.B. 2004. Impact Assessment and the Mining Industry: Pespectives from Tanzania. International Association for Impact Assessment (IAIA), p. 14.
NBS. 2016. National Accounts of Tanzania Mainland 2007-2015 National Bureau of Statistics. Ministry of Finance and Planning, United Republic of Tanzania.
NDC. 2023. Projects for Public Private Partnership, United Republic of Tanzania. Engaruka Basin Soda Ash Project. The National Development Corporation (NDC), United Republic of Tanzania.
O’Connor, M., Bertoli, O. 2012. Estimating Recoverable Resources using Uniform Conditioning – A Case Study at the Mkuju River Uranium Project, Tanzania. AusIMM Uranium, Adelaide, June. CSA Global Resource Industry Consultants.
Olivier, B. 2006. The Geology and Petrology of the Merelani Tanzanite Deposit NE Tanzania (Issue December). PhD Thesis, University of Stellenbosch.
Poncian, J., George, C. 2015. Mineral Extraction for SocioEconomic Transformation of Tanzania: The Need to Move from Papers to Implementation of Mining Policy and Law. Journal of Social Science Studies, vol. 2, no. 2, p. 160. https://doi.org/10.5296/jsss.v2i2.7450
President of the United Republic of Tanzania. 2024. Speech by Honorable Samia Suluhu Hassan at the closure of the 7th Mining Technology Exhibition held in Geita on 13th October 2024.
Stiefenhofer, J., Farrow, D.J. 2004. Geology of the Mwadui kimberlite, Shinyanga district, Tanzania. Lithos, vol. 76, (1-4 SPEC. ISS.), pp. 139–160. https://doi.org/10.1016/j. lithos.2004.04.017
Strandline Resources. 2022. Tajiri receives Environmental Certificate STA – Equity Report current as at –22/03/2022.
Strandline Resources limited. 2020. Scoping Study shows Tajiri mineral sands project will deliver strong financial returns over 23-year life (Issue October).
UNIDO. 1982. Pilot Study on Natural Resources in Tanzania. Final Project Report RP/URT/81/003. This publication has been made available to the public on the occasion of the 50th anniversary of the United Nations Industrial Development Organisation.
URT. 1997. The Mineral Policy of Tanzania. Ministry of Energy and Minerals, United Republic of Tanzania.
URT. 1998. The Mining Act of 1998 (No.5). United Republic of Tanzania.
URT. 2009. The Mineral Policy of Tanzania. Ministry of Energy and Minerals, United Republic of Tanzania.
URT. 2010. The Mining Act of 2010 (No.14). United Republic of Tanzania.
URT. 2017. The Written Laws (Miscellaneous Amendments) (No.4) Act, 2017. United Republic of Tanzania.
URT. 2019. The Tanzania Mining Act Revised Edition 2019 (Chapter 123). The United Republic of Tanzania.
URT. 2021. National Five Year Development Plan 2021/22-2025/26: Realising Competitiveness and Industrialisation for Human Development. In United Republic of Tanzania, Ministry of Finance and Planning (Issue June).
Van Campenhout, B. 2002. The Mining Industry and the Future Development of Tanzania. Workshop on Globalization and East Africa, April, 15.
Van Straaten, H. P. 1984. Gold mineralization in Tanzania-a review. Gold ’82. Proceedings of a Symposium, University of Harare, 1982, January 1984, 673–685.
Vidal, O., Le Boulzec, H., Andrieu, B., Verzier, F. 2021. Modelling the demand and access of mineral resources in a changing world. Sustainability, vol. 14, no. 1, p. 11. https://doi.org/https://doi.org/10.3390/su14010011
Walkabout Resources. 2023. Lindi Jumbo Graphite Project. https://doi.org/wkt.com.au/projects/lindi-jumbo-graphiteproject/, accessed on 23rd October 2024.
Weldegiorgis, F.S., Dietsche, E., Ahmad, S. 2023. Inter-Sectoral Economic Linkages in the Mining Industries of Botswana and Tanzania: Analysis Using Partial Hypothetical Extraction Method. Resources, vol. 12, no. 7. https://doi.org/10.3390/resources12070078 u
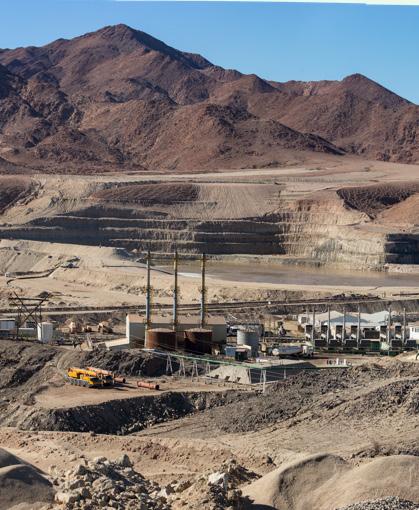
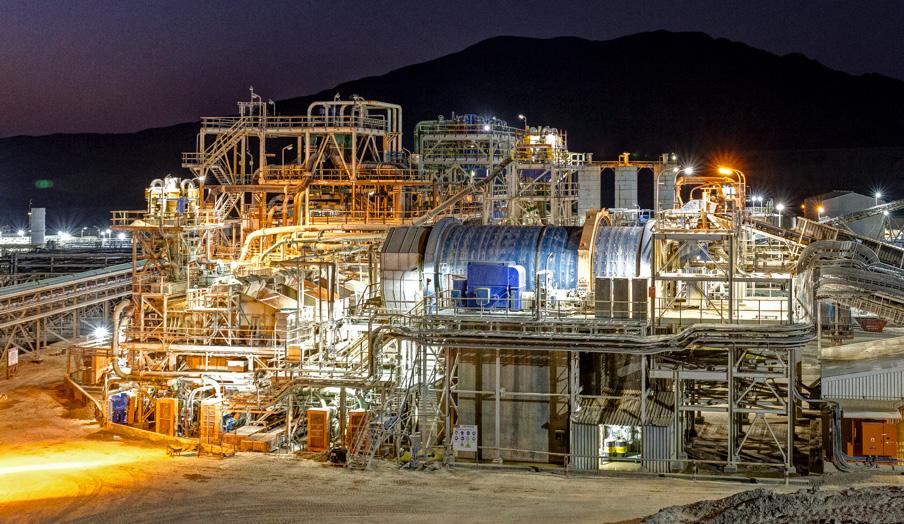
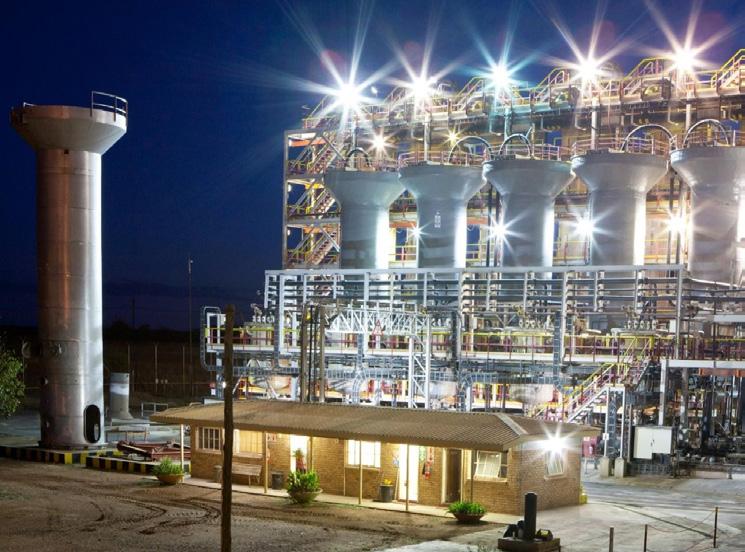
0ne kilogram of uranium can produce as much energy as 160 tons of coal. As the world transitions to sustainable, low-carbon energy solutions, uranium will play an increasingly critical role by enabling the generation of large amounts of electricity with minimal greenhouse gas emissions. Uranium already forms part of a reliable and low-emission energy mix in many countries, contributing significantly to global decarbonisation efforts.
Uranium and nuclear energy has had its fair share of negative publicity, due to associations with nuclear weapons and the risk of wide-scale harm to humans and nature in the event of an accident. Despite these concerns, the benefits of nuclear energy makes uranium a compelling energy source.
Nuclear energy’s increasing momentum could be seen at COP28, where the first Global Stocktake under the Paris Agreement called for the acceleration of nuclear and other low-emission technologies to help achieve deep decarbonization.
This conference aims to bring together professionals from across the uranium value chain.
Topics will span the entire spectrum, from geology, mining, processing, application as nuclear fuel, application in the medical field, to post-mining closure – offering a holistic view of the uranium sector.
The conference will take place in the town of Swakopmund, Namibia – the heart of Namibia’s uranium mining industry. Swakopmund is a scenic coastal town, nestled between the Atlantic Ocean and the Namib Desert. It has much to offer the tourist, including great local cuisine, desert excursions, ocean activities and serene beach relaxation.
We invite students, lecturers, engineers, operators, economists, research and development professionals and policy makers to join in the conversations. Participants will gain a holistic view of the uranium industry and its multifaceted role in modern society and the future of mankind.
FOR FURTHER INFORMATION, CONTACT:
Gugu
Charlie, Conferences and Events Coordinator
E-mail: gugu@saimm.co.za
Tel: +27 11 530 0238
Web: www.saimm.co.za
Papers are invited on the following topics:
• Uranium market trends
• Uranium resources, including exploration and new developments
• Mining
• Mineral and metallurgical processing
• Process control and optimization
• Analysis, including uranium and associated components
• Refining and value-added products
• Fuel cycle
• Recycling and reprocessing
• Nuclear/radioactive waste and site remediation
• Logistics of handling and transporting uranium in its various forms
• Medical applications
• Health and safety
• Environment, Social and Governance (ESG)
• Legislative and policy issues
• Economics
• 2 March 2026 - Submission of abstracts
• 13 April 2026 - Submission of papers
• 18 August 2026 – Technical workshop: Modelling with Cycad Process
• 19-20 August 2026 - Conference
• 21 August 2026 - Technical visit: Langer Heinrich Uranium
Prospective authors are invited to submit titles and abstracts of their papers in English. The abstracts should be no longer than 500 words.
Acceptance of papers for publication in the SAIMM Journal will be subject to peer review by the Conference Committee and SAIMM Publications Committee pre-conference.

Affiliation:
1Institute of Research of Iron and Steel, Shasteel, Jiangsu Province, China
2University of Science and Technology Beijing, China
Correspondence to: J.C. Ma
Email: majianchao78@126.com
Dates:
Received: 1 Aug.2023
Revised: 22 Feb. 2024
Accepted: 29 Feb.2025
Published: October 2025
How to cite:
Zhang, K.H., Li, Q., Ma, J.C., Zhao, J.Q., Gao, Y.P. 2025. Investigation of waveform construction and dynamic characteristics for mould non-sinusoidal oscillation. Journal of the Southern African Institute of Mining and Metallurgy, vol. 125, no. 10, pp. 593–598
DOI ID:
https://doi.org/10.17159/2411-9717/3207/2025
ORCiD:
K. Zhang
http://orcid.org/0000-0001-8995-6196
Q. Li
http://orcid.org/0009-0006-0275-9514
J. Ma
http://orcid.org/0000-0002-1256-3148
J. Zhao
http://orcid.org/0000-0002-1148-2653
Y. Gao
http://orcid.org/0009-0009-3515-6287
by K.H. Zhang1, Q. Li1, J.C. Ma1, J.Q. Zhao1, Y.P. Gao2
Abstract
Compared with sinusoidal oscillation, non-sinusoidal oscillation enhances the ability to control waveform and meets different oscillation requirements by adding an independent parameter, which is the key technology for high-efficiency continuous casting. A new waveform of mould non-sinusoidal oscillation is proposed in this paper, that is, a velocity waveform that is composed only of straight lines and parabolas, which not only has good dynamic characteristics, but also further enhances the feature of non-sinusoidal oscillation. Compared with sinusoidal oscillation, the negative strip time is reduced by 15.9%, the maximum negative strip velocity difference is increased by 38.3%, and the maximum positive strip velocity difference is decreased by 27.8%. The formulas of oscillation process parameters can be clearly deduced, and the isoplethic curves of oscillation process parameters when multi-parameter simultaneously changes are drawn. The negative strip time decreases as the modification ratio, frequency, and casting speed increase, but increases as stroke increases. In order to maintain the stability of negative strip time, an oscillation synchronous control model for optimising oscillation basic parameters was developed. Through practical application, the mean oscillation mark depths decreased by 10.1 μm and the flux consumption is increased from 0.37 kg/t to 0.45 kg/t in the non-sinusoidal oscillation model, which meets the requirements of normal production.
Keywords continuous casting mould, non-sinusoidal oscillation, oscillation parameter
Introduction
Mould oscillation is the key technology for high-efficiency continuous casting. Its main purpose is to prevent billet from sticking to the mould wall. With the acceleration of production rhythm and the expectance of higher quality, it is necessary to ensure that the billet possesses good surface quality while realising demoulding, which puts forward higher requirements for mould oscillation technology. The investigation of mould oscillation technology has practical significance (Zhang et al., 2013; Suzuki et al., 1991; Zuo et al., 2016; Lei et al., 2004; Tsuprun et al., 2012; Zhou et al., 2019).
There are mainly two kinds of mould oscillation modes in general, i.e., sinusoidal and non-sinusoidal oscillation. Sinusoidal oscillation completely depends on frequency and stroke and has limited ability to control the oscillation waveform. There are disadvantages, such as longer negative strip time and larger negative strip velocity difference, which could make the breakout and surface quality control contradict each other, especially under high casting speed conditions. Non-sinusoidal oscillation introduces the modification ratio to enhance the ability of controlling waveform, and has the following advantages: (i) shorter negative strip time, reduces the depth of oscillation mark, (ii) longer positive strip time, increases powder consumption and improves lubrication effect of mould, (iii) larger negative strip velocity difference, helps billet demoulding and crack welding, (iv) smaller positive strip velocity difference reduces friction force to prevent billet cracking and improve surface quality, (v) higher flexibility of oscillation waveforms, which meets different oscillation requirement (Zang et al., 2008; Wang et al., 2010).
The construction of waveform function is the key technology to realise mould oscillation. Continuous casting researchers have done lots of study for non-sinusoidal oscillation waveform (Ma, 2014; Long, et al., 2008). The DynFlex function is composed of trigonometric functions with different frequencies, in which the rising-section frequency is lower, and the falling-section frequency is higher (Ma, 2014). Although oscillation is easy to control, its velocity waveform is not smooth at the junction. There is a sudden change in acceleration waveform, which causes flexible impact during oscillation. Based on trigonometric functions, Mannesman Demag, WISDRI ,and CISDI proposed integral Demag
function, WIS function, and CIS function, respectively (Long et al., 2008), which are simple in form and easy to control. The velocity and acceleration waveforms are continuous and smooth, and there is no oscillation shock problem. However, when the modification ratio is greater than a certain value, the acceleration waveform will appear as an inflection point instead of being monotonous, which will cause trembling of the oscillation device.
In view of the problem of previous non-sinusoidal oscillation functions, this paper proposes and constructed a new kind of nonsinusoidal oscillation function in the five-section form, of which the velocity waveform is only composed of straight lines and parabolas. It not only boasts good dynamic characteristics but also exhibits a significant improvement on the oscillation effect. The isoplethic curves of oscillation process parameters when multi-parameter simultaneously changes are drawn, which provide the convenient reference for the formulation of synchronous control model.
Construction of non-sinusoidal oscillation waveform
Figure 1 shows the waveform of displacement and velocity for two kinds of oscillation models, and the functions of displacement and velocity for sinusoidal oscillation can be expressed as Equations 1 and 2 in the following (Meng et al., 2013):


Where v(t) is the mould velocity(mm/min), s(t) is the mould displacement(mm), t is time(min), h is the oscillation stroke(mm), v and f is the oscillation frequency (cpm, i.e., count per minute).
Non-sinusoidal oscillation waveform was improved on the basis of sinusoidal oscillation waveform in this paper. Its velocity waveform is only composed of straight lines and parabolas, otherwise expressed as SLP function. The ab and fg sections are horizontal straight lines, and the bc, cde, and ef sections are parabolas. The velocity function is shown in Equation 3:
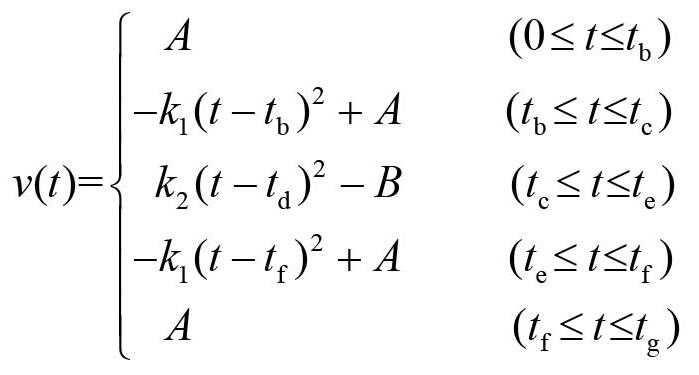
Where k1, k2 is the undetermined constant (mm/min3), A and B are also the undetermined constant (mm/min), tb, tc, td, te, tf, and tg are the different time of velocity waveform for non-sinusoidal oscillation, respectively (min).
Compared with sinusoidal oscillation, non-sinusoidal oscillation adds the modification ratio α:
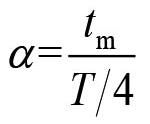
Where tm is lag time to reach maximum displacement for nonsinusoidal waveform relative to sinusoidal waveform (min), T is oscillation cycle (min), the relationship between oscillation cycle and frequency is T=1/f, and the value of α should be 0≤α<1.
By ensuring that the velocity waveform is continuous and smooth, and the ascending displacement and the descending displacement are equal, and the relationship between the openings of upward and downward parabola is k1=N´k2 , the following relationship can be obtained by the aforementioned constraints:


Taking the derivative of velocity function, the acceleration function a(t) in each oscillation cycle is shown as Equation 9:
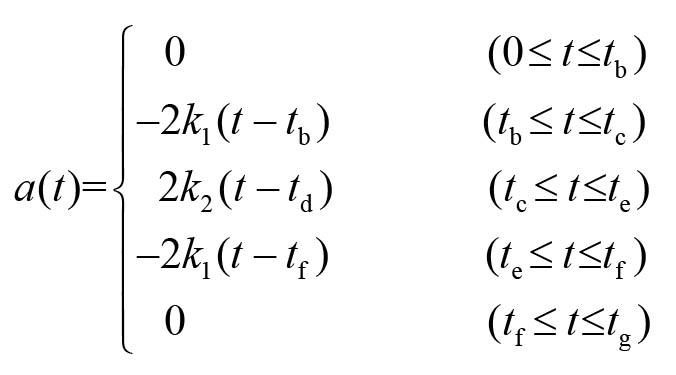
Integrating the velocity function, the displacement function s(t) in each oscillation cycle is shown as Equation 10:
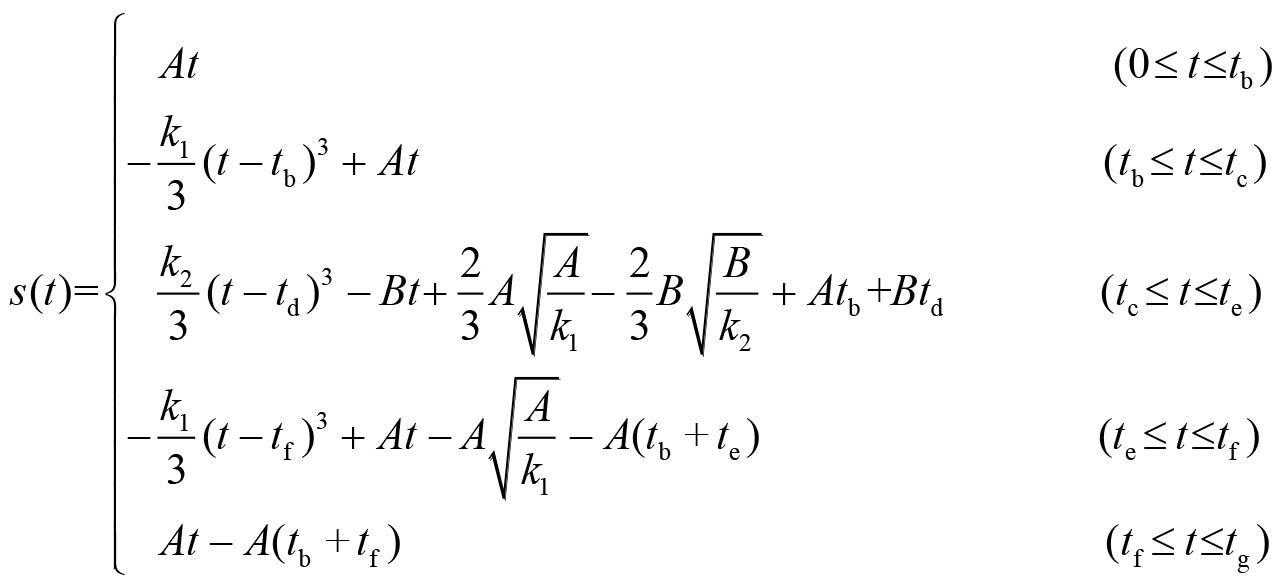
When stroke, frequency and modification ratio of oscillation are determined, N, k1, k2, A and B are all fixed values. The oscillation
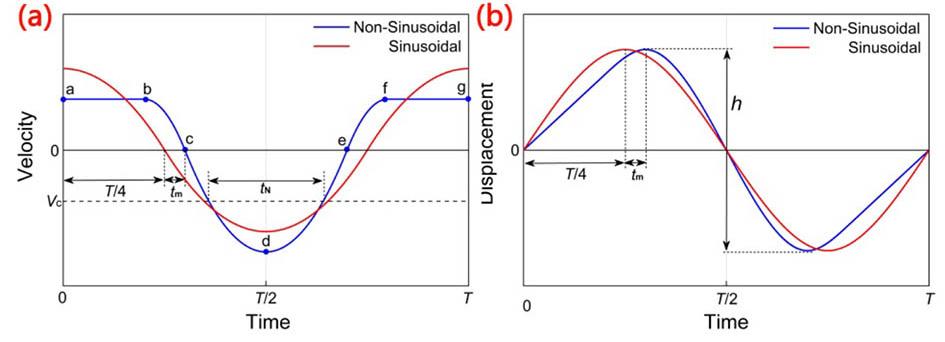
waveform is completely determined and generated by computer, and the driving device is controlled by the oscillation waveform to make mould move accordingly.
The oscillation waveform is required to have good dynamic characteristics because of large mass and high frequency of mould (Yang et al., 2014). When the stroke is 8 mm and frequency is 120 cpm, the displacement, velocity, and acceleration waveforms with different modification ratios are as shown in Figure 2. There is no sudden change in velocity waveform and no infinite value in acceleration waveform, so the oscillation device is not subject to rigid impact. The velocity waveform is continuous and smooth, and the acceleration waveform is continuous although it has sharp points, so the oscillation device is also free from flexible impact. Therefore, the non-sinusoidal oscillation waveform boasts good dynamic characteristics.
The waveform should have a better non-sinusoidal oscillation feature under the premise of good dynamic characteristics. When the stroke is 8 mm, frequency is 120 cpm, and modification ratio is 0.2, the velocity waveform is as illustrated in Figure 3. Compared with sinusoidal function, the negative strip time is reduced by 15.9%, the maximum negative strip velocity difference is increased by 38.3%, and the maximum positive strip velocity difference is decreased by 27.8% when the casting speed is 1.0 m/min in this paper. The non-sinusoidal oscillation feature of SLP function is significantly improved by adjusting the velocity distribution in the downward oscillation period. Compared with Demag function, the negative strip time is increased by 6.1%, and the maximum negative strip velocity difference is reduced by 13.7%, and the maximum positive strip velocity difference is decreased by 7.3% when the casting speed is 1.0 m/min in this paper. Although the lubrication and demoulding effect of billet is weakened, the resistance of billet in mould is also significantly reduced for SLP function compared with Demag function. The formulas of oscillation process parameters for Demag function cannot be deduced, and the numerical solution can only be obtained by computer.
The formulas of each oscillation process parameters can be clearly deduced to provide the convenient application of oscillation waveform in actual production. The oscillation process parameters mainly consider the negative strip time and the negative strip time ratio, which can better reflect the effect of oscillation basic parameters on the surface quality of billet. The negative strip time
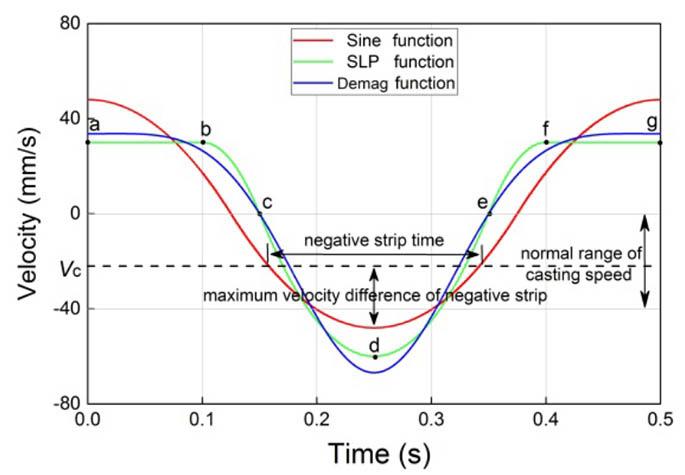
is the period during which the mould moves downward relative to billet in each oscillation cycle, and the negative strip time ratio is the ratio of the negative strip time to half cycle. When casting speed is given, the negative strip time and the negative strip time ratio of SLP function can be expressed as Equation 11:


Where VC is casting speed (mm/min), tN is the negative strip time (min), NSR is the negative strip time ratio, and ΔVmax is the maximum velocity difference between oscillator and billet. When casting speed, frequency, and stroke are constant, the negative strip time decreases and the negative strip velocity difference increases with the increase of the modification ratio, which significantly enhances the feature of non-sinusoidal oscillation and helps billet demoulding to improve surface quality, as shown in Figure 3 and Figure 4. The advantages of non-sinusoidal oscillation cannot be exerted with smaller modification ratio, but larger modification ratio would cause the significant increase in the maximum acceleration that determines the driving force and affects the oscillation stability of mould, as shown in Figure 4. The acceleration can take the maximum value at the point of c and e in Figure 1. According to previous studies, the modification ratio should be set to 0.1~0.4 (Meng et al., 2013). In order to control the maximum acceleration below 2 m/s2, the modification ratio can be set to 0.1~0.2 in this paper.

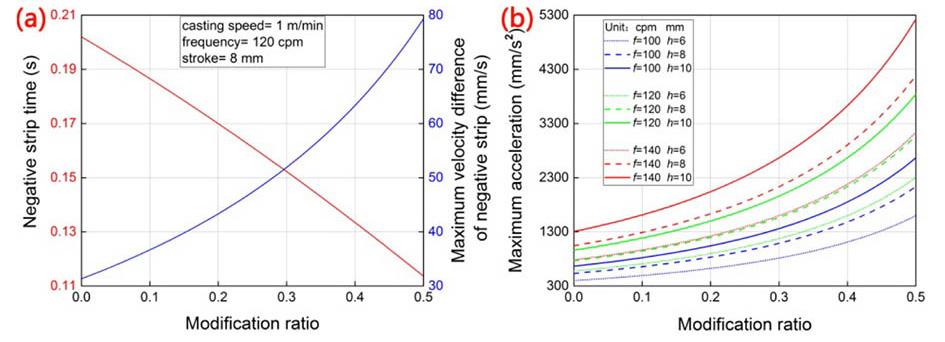

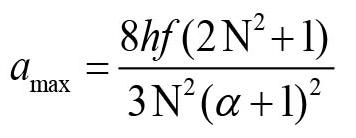
Where amax is the maximum acceleration of oscillation waveform(mm/min2).
Establishment of synchronous control model
[14]
During the process of production, casting speed usually varies with working conditions, such as casting temperature. If oscillation basic parameters remain unchanged, oscillation process parameters will inevitably be changed, which will affect the demoulding effect and surface quality of billet. After fixing two oscillation basic parameters, the isoplethic curves of the negative strip time and the negative strip time ratio when casting speed and the third oscillation basic parameter simultaneously change, are shown in Figure 5.
When casting speed is specified, the isoplethic curves of the negative strip time correspond to two frequencies in Figure 5(a). In the region near lower frequency, a small change of casting speed and frequency would lead to large fluctuation of the negative strip time. Therefore, the area of NSR below 50% is not the recommended area for modelling. In the region of NSR above 50%, the isoplethic curves of the negative strip time are approximately downward in Figure 5(a), upward in Figure 5(b), and downward in Figure 5(c), respectively. The negative strip time decreases as the modification ratio, frequency, and casting speed increase, but increases as stroke increases. If the casting speed is increased, in order to maintain the stability of the negative strip time, the modification ratio and frequency need to be decreased, and stroke needs to be increased properly. The following synchronous control model of oscillation basic parameters changing with casting speed can be established as shown in Equation 15:

Where m1 and n1 are the coefficients of the synchronous control model (i equals to 1, 2, and 3).
According to steel grade and section, the appropriate oscillation process parameters could be selected and the corresponding line segment in Figure 5 could be drawn to determine the coefficients of the synchronous control model. In an actual casting process, the modification ratio is often set directly, so the model can be simplified to a system containing two equations, as depicted by Equation 16:

In order to stabilise the negative strip time at 0.16 seconds when the modification ratio is 0.2, the conditions before and after optimisation are shown in Table 1. The synchronous control model can be established as shown in Figure 6. With the increase of casting speed, frequency decreases and stroke increases, which belong to the inverse synchronous control model (Spiess et al., 2005). The negative strip time basically remains unchanged and the positive strip time increases, which is conducive to stabilising the oscillation mark depth, enhancing the powder consumption and improving the demoulding effect of bloom. At the same time, the decrease of frequency is conducive to maintaining the oscillation stability of mould (Tsutsumi et al., 2007). Through the establishment of the synchronous control model, oscillation basic parameters such as the modification ratio, frequency, and stroke, could synergistically change with casting speed, so as to realise the stable metallurgical effect of mould oscillation.
According to the aforementioned analysis, this waveform of non-sinusoidal oscillation was applied on bloom continuous caster to evaluate the effect of non-sinusoidal oscillation on the lubrication of mould and the surface quality of bloom. The radius of the caster is 9 m, and the section is 180 mm×240 mm for casting C82DAD
Table 1
Technological parameters of sinusoidal and non-sinusoidal oscillation
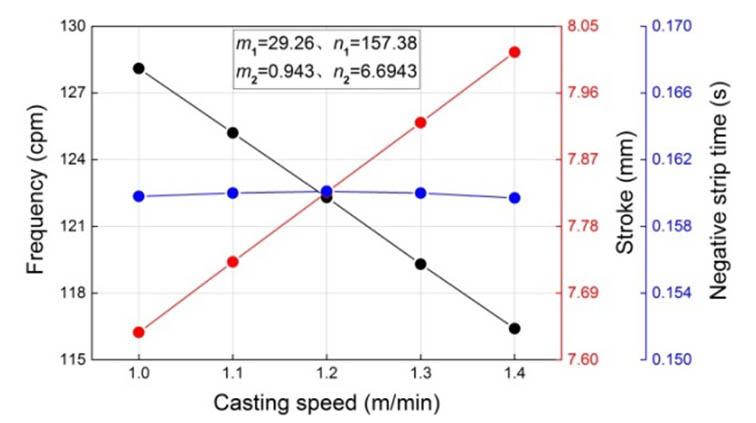
steel. The chemical compositions of steel and mould flux are shown in Table 2 and Table 3, respectively. The liquidus temperature is 1460°C for C82DAD steel, and the casting temperature is 1485°C.
The surface quality and the oscillation mark depths of bloom under the conditions of sinusoidal and non-sinusoidal oscillation model are shown in Figure 7. It can be seen that, compared with sinusoidal oscillation, the mean oscillation mark depths in non-sinusoidal oscillation mode decreased by 10.1 μm. The flux consumption is increased from 0.37 kg/t to 0.45 kg/t with the increase of the positive strip time. As shown in Figure 7(c), the surface temperature of bloom at the straightening position is 1103°C, which is conducive to avoiding the brittle transition temperature range and reducing the occurrence of surface cracks on
Table 2
the bloom. The effect of mould lubrication is improved significantly, and the possibility of surface defects is also controlled effectively. This waveform of non-sinusoidal oscillation meets the requirements of normal production and provides reference for the application of the oscillation mode
A new waveform of mould non-sinusoidal oscillation is proposed in this paper. Its velocity waveform is only composed of straight lines and parabolas, and has many advantages such as simple form, easy adjustment, and convenient calculation.
➤ The waveform of mould non-sinusoidal oscillation not only has good dynamic characteristics but also exhibits significant improvement on the feature of non-sinusoidal oscillation by adjusting the velocity distribution. Compared with sinusoidal oscillation, the negative strip time is reduced by 15.9%, the maximum negative strip velocity difference is increased by 38.3%, and the maximum positive strip velocity difference is decreased by 27.8%.
➤ The formulas of oscillation process parameters can be clearly deduced, and the isoplethic curves of oscillation process parameters when multi-parameter simultaneously change is drawn. The negative strip time decreases as the modification ratio, frequency, and casting speed increase, but increases as stroke increases.
Chemical compositions of steel(mass%)
Table 3
Chemical compositions of mould flux(mass%)

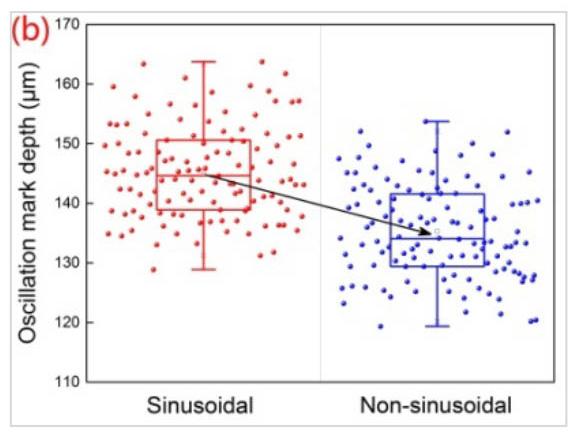
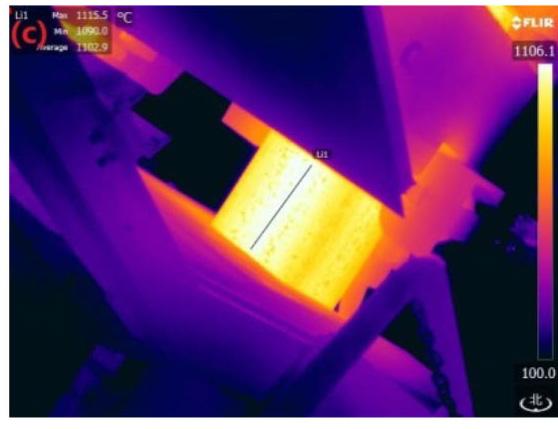
infrared temperature
➤ In order to maintain the stability of negative strip time, a synchronous control model for optimising oscillation basic parameters was developed. Through practical application, the mean oscillation mark depths decreased by 10.1 μm and the flux consumption is increased from 0.37 kg/t to 0.45 kg/t in the non-sinusoidal oscillation model, which meets the requirements of normal production.
Conflict of interest
The authors declare no conflict of interest.
Acknowledgments
The authors would like to acknowledge the National Natural Science Foundation of China (No. 51774031) for support.
References
Lei, Z., Ren, Z., Deng, K., Li, W., Wang, H. 2004. Experimental study on mould oscillation less continuous casting process under high frequency amplitude modulated magnetic field. ISIJ Int, vol. 44, no. 11, pp. 1842–1846.
Long, H., Tang, Y., Liu, J. 2008. Construction and parameter calculation of non-sinusoidal oscillation curve of mould. Metallurgical Industry Automation, no. S2, pp. 848–851.
Ma, C. 2014. Some discussions about several non-sinusoidal oscillation waveforms of mould. Continuous Casting, vol. 22, no. 1, pp. 22–28.
Meng, X., Zhu, M. 2013. Optimisation of non-sinusoidal oscillation parameters for slab continuous casting mould with high casting speed. Ironmak Steelmak, vol. 36, no. 4, pp. 300–310.
Suzuki, M., Mizukami, H., Kitagawa, T., Kawakami, K., Uchida, S., Komatsu, Y. 1991. Development of a new mould oscillation mode for high-speed continuous casting of steel slabs. ISIJ Int, vol. 31, no. 3, pp. 254–261.
Spiess, J., Lempradi, H., Staudinger, G., Zipp, P. 2005. Technological challenges in stainless steel production at outokumpu stainless Tornio. Metall Res Technol, vol. 102, no. 4, pp. 329–335.
Tsuprun, A.Y., Fedosov, A.V., Kislitsa, V.V., Pashchuk, D.V. 2012. Study of the effect of the characteristics of harmonic mouldoscillation regimes on the surface quality of continuous-cast ingots. Metallurgist, vol. 56, no. 7, pp. 498–503.
Tsutsumi, K., Ohtake, J., Hino, M. 2007. Inflow behavior observation of molten mould powder between mould and solidified shell by continuous casting simulator using Sn-Pb alloy and stearic acid. ISIJ Int, vol. 40, no. 6, pp. 601–608.
Wang, H.M., Li, G.R., Zhao, Y.T., Zhao, H. 2010. Dynamic pressure in mould flux channel during mould non-sinusoidal oscillation. Ironmak Steelmak, vol. 37, no. 6, pp. 464–470.
Yang, J., Meng, X., Zhu, M. 2014. Experimental study on mould flux lubrication for continuous casting. Steel Res Int, vol. 85, no. 4, pp. 710–717.
Zang, X., Wang, X., Ma, Y., Yao, M., Zhang, L. 2008. Investigation of friction force between mould and strand shell under sinusoidal and non-sinusoidal oscillation in continuous slab casting. Steel Res Int, vol. 79, no. 7, pp. 564–568.
Zhang, X.Z., Zheng, X.R., Liu, Q.G., Li, X.K., FANG, Y.M. 2013. Investigation and application of non-sinusoidal oscillation technique of mould. J. Iron Steel Res. Int, vol. 20, no. 12, pp. 19–24.
Zhou, C., Zhang, X., Wang, F., Fang, Y. 2019. Mould oscillating system with optimized non-sinusoidal oscillation profile. Metallurgist, vol. 63, no. 5, pp. 585–597.
Zuo, X.J., Lin, R.G., Wang, N., Yang, J., Meng, X.N., Zhu, M.Y. 2016. Formation of initial defects at meniscus in oscillating mould. Steel Res Int, vol. 87, no. 4, pp. 413–423. u


Affiliation:
1Department of Metallurgy, School of Mines and Mineral Sciences, The Copperbelt University, Zambia
2Hydrometallurgy Division, Mintek, South Africa
Correspondence to:
F.D.L. Uahengo
Email: dimbulukwa4@gmail.com
Dates:
Received: 8 Oct. 2024
Revised: 27 May. 2025
Accepted: 19 Aug. 2025
Published: October 2025
How to cite:
Uahengo, F.D.L., Hara, Y.R.S., Bazhko, O. 2025. Effects of acid and reductants on iron salt leaching of copper-cobalt oxide ore: A case study from Zebesha Mine, Zambia. Journal of the Southern African Institute of Mining and Metallurgy, vol. 125, no. 10, pp. 599–608
DOI ID:
https://doi.org/10.17159/2411-9717/3561/2025
ORCiD:
F.D.L. Uahengo
http://orcid.org/0000-0002-1389-8011
O. Bazhko
http://orcid.org/0000-0002-1598-0123
by F.D.L. Uahengo1, Y.R.S. Hara1, O. Bazhko2
Abstract
Although the conventional acid-reductive leaching method effectively extracts copper (Cu) and cobalt (Co) from Cu–Co oxide ores, efforts to enhance hydrometallurgical performance are ongoing. This study evaluates the influence of sulphuric acid (H2SO4) and sodium metabisulphite (Na2S2O5) on metal extraction from Zebesha Cu–Co oxide ore using ferrous sulphate heptahydrate (FeSO4·7H2O) and ferric sulphate (Fe2(SO4)3) as lixiviants. Ore samples (<150 µm) were leached at ambient temperature for two hours, and metal concentrations were determined via X-ray fluorescence analysis. In the FeSO4·7H2O system, Co, Mn, and Ni recoveries increased w=ith Na2S2O5 concentration, reaching a maximum of approximately 80% Co at 150 kg/t, while Cu recovery remained below 5%. Conversely, with Fe2(SO4)3, Cu recovery peaked at 88% at 50 kg/t Na2S2O5, then declined to 79% at 150 kg/t. The addition of H2SO4 improved metal recoveries in both systems. Notably, 60 kg/t H2SO4 yielded 92% Cu extraction in Fe2(SO4)3, while Co, Ni, and Mn remained below 40%. However, in FeSO4·7H2O, Co recovery improved from 40% to 84%. These findings suggest Na2S2O5 is more effective for cobalt extraction with FeSO4·7H2O, whereas H2SO4 enhances copper extraction in Fe2(SO4)3.
Keywords copper–cobalt oxide ore, heterogenite, sodium metabisulphite, copper-cobalt extraction, sulphuric acid
Introduction
In recent years, there has been growing interest in the hydrometallurgical extraction of copper-cobalt (Cu-Co) oxide ores from the Central African Copperbelt (CAC) (Crundwell et al., 2011, 2020; Dehaine et al., 2021; Fisher, 2011; Lutandula et al., 2020; Sole et al., 2018; Thabane, 2018; Welham et al., 2015). This surge in attention has been driven by the increasing demand for cobalt and related battery minerals, largely propelled by advancements in electronic technologies, including mobile phones and electric vehicles (Dehaine et al., 2020; Xu et al., 2021).
The primary Cu-Co oxide minerals in the CAC include malachite, the major copper oxide phase, and heterogenite, the dominant cobalt oxide phase, which also contains associated copper, manganese (Mn), nickel (Ni), and iron (Fe) (Crundwell et al., 2011; Sole et al., 2018; Uahengo et al., 2022). Table 1 lists representative Cu–Co oxide minerals from the region. Heterogenite often contains cobalt in both
Table 1
Representative minerals in Cu-Co oxide ore of the Central African Copperbelt Mineral Formula
Malachite
CuCo3Cu· (OH)2
Chrysocolla (Cu,Al)2H2Si2O5(OH)4· nH3O
Heterogenite
Siliceous dolomite
CoOOH / CoO· 2Co2O3· 6H2O
CaMg(CO3)2
Quartz SiO2
divalent (Co²+) and trivalent (Co³+) states (Mwema et al., 2002; Stuurman et al., 2014). The average copper content in CAC ores typically ranges between 2%–4% Cu, while cobalt grades range from 1%–3% Co (Annels, Simmonds, 1984; Seo et al., 2013; Slack et al., 2017; Sole, Tinkler, 2016), although local variability exists, for example, the Zebesha Mine in north-western Zambia contains approximately 3.5% Cu and 1.3% Co.
The conventional leaching approach for Cu-Co oxide ores involves the use of sulphuric acid (H2SO4) in the presence of a reductant. Trivalent cobalt (Co³+) exhibits low solubility in aqueous media, leading to poor leach efficiency from heterogenite (Crundwell et al., 2020). A suitable reductant is therefore required to reduce Co³+ to the more soluble Co²+ form. Commonly used reductants include sodium metabisulphite (Na2S2O5), sulphur dioxide (SO2), and ferrous sulphate (FeSO4) (Ferron, Henry, 2008; Kafumbila, 2018; Mwema et al., 2002; Ntakamutshi et al., 2017; Stuurman et al., 2014).
Of these, Na2S2O5 is widely favoured in the Copperbelt due to its efficacy in reducing Co³+ to Co²+, its environmental acceptability, ease of handling, and logistical suitability for remote sites (Abreu et al., 2012; Bwando, Kanz, 2018; Crundwell et al., 2011; Kafumbila, 2018; Mwema et al., 2002; Stuurman et al., 2014; Sutcliffe et al., 2011; Thabane, 2018; Tshipeng et al., 2017). Its reductive mechanism proceeds through hydrolysis and subsequent SO2 evolution, as shown in Equations 1 to 4:

Like Co³+, manganese in high oxidation states (e.g., Mn⁴+ in MnO2) also dissolves under acidic-reductive conditions (Ferron, 2006; Zheng et al., 2023), as shown in Equation 5. Additionally, iron oxides may be reduced to ferrous sulphate under similar conditions (Equation 6):
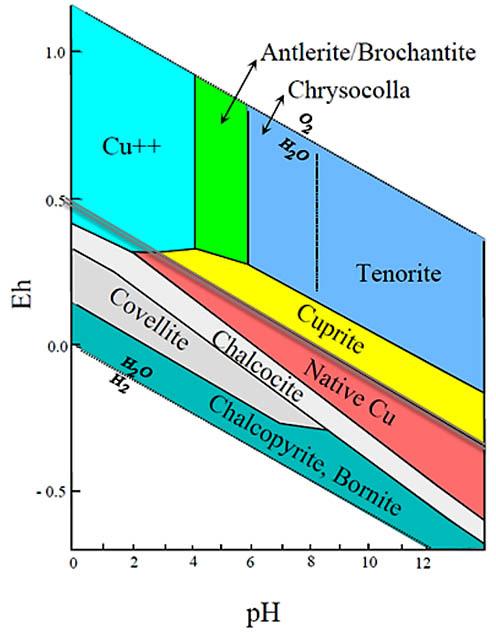
Copper minerals – including hydroxides, oxides, sulphides, sulphates, carbonates, and silicates – typically dissolve in acidicoxidative environments, albeit at variable rates depending on mineralogy (Dreier, 2012). Ferric sulphate, especially when combined with H2SO4, is often used to facilitate this dissolution.
Despite its effectiveness, Na2S2O5 has fallen out of favour due to its high consumption rates, which elevate operating costs (Mwema et al., 2002). Additionally, Na2SO4 build-up from Na2S2O5 degradation contributes to excess Na+accumulation in leach circuits. Environmental concerns are also raised by the release of SO2 gas, especially at higher concentrations (Asadi Dalini et al., 2020; Carvalho et al., 2011). As such, research efforts are increasingly focused on alternative reductants or ways to optimise Na2S2O5 usage.
Furthermore, sulphuric acid, though effective, is costly and corrosive. In the Copperbelt, challenges related to sourcing, transporting, and handling H2SO4 are exacerbated by inadequate infrastructure, particularly in remote mining areas of Zambia and the Democratic Republic of the Congo (Sole, Tinkler, 2016; Thabane, 2018).
The Cu-Co oxide ore sample used throughout the study was sourced from Zebesha Mine, a relatively new copper-cobalt mining operation located in Zambia’s North-Western Province. This region forms part of the southern extension of the Central African Copperbelt (CAC), extending from the Democratic Republic of Congo (DRC). To characterise the Zebesha ore, both X-ray fluorescence (XRF) and scanning electron microscopy (SEM) analyses were performed. XRF results revealed relatively high metal content, with average values of 3.69% Cu, 2.28% Co, 0.199% Ni, 0.138% Mn and 3.90% Fe. Figure 2 shows a full elemental distribution thereof.
Mineralogical analysis indicated that copper occurred mainly as malachite, while cobalt was hosted in heterogenite, alongside associated Ni, Mn, and Fe. Quartz, biotite, and talc were identified as the principal gangue minerals, with quartz comprising ~31 wt.%, suggesting a significant silica content (Figure 3). The mineralogy is comparable to other CAC oxide ore deposits (Decrée et al., 2015; Shengo et al., 2016; Stuurman et al., 2014). SEM micrographs in Figure 4 revealed the presence of heterogenite (Het), chrysocolla Fe (Chr Fe), quartz (Qz), biotite (Bi), and chlorite (Chl), among others.
As illustrated in Figure 5, a closer inspection of the mineral phase map reveals that Cu- and Co-bearing phases, such as malachite, heterogenite, and related oxides, are frequently embedded in or rimmed by silicate gangue minerals including quartz, muscovite, biotite, and chlorite. This spatial association suggests partial physical encapsulation of valuable metal phases within the gangue matrix. Such intergrowths may hinder reagent accessibility and contribute to the observed variability in extraction efficiency during leaching. These textural relationships are characteristic of supergene enrichment in deeply weathered oxide terrains typical of the Central African Copperbelt.
Methodology
Materials, reagents and chemicals
The same Cu-Co oxide ore used in the preliminary study was employed in this investigation. All reagents were of analytical grade. Sulphuric acid (98%, Primark Chemicals, South Africa), sodium metabisulphite (Na2S2O5), ferrous sulphate heptahydrate
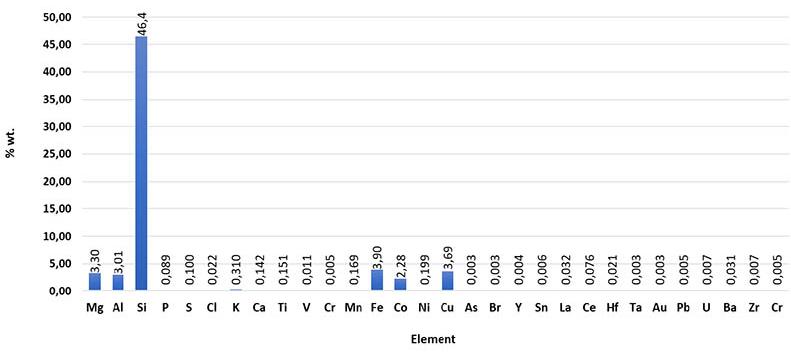

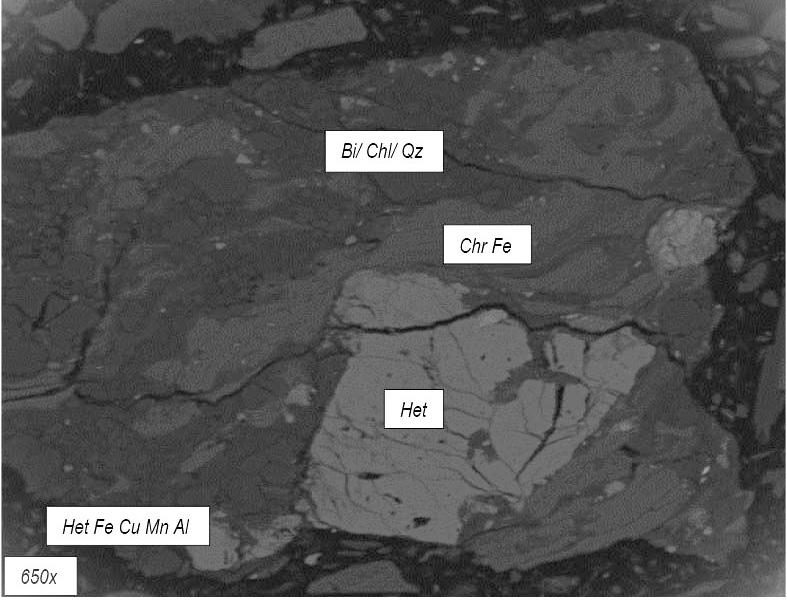
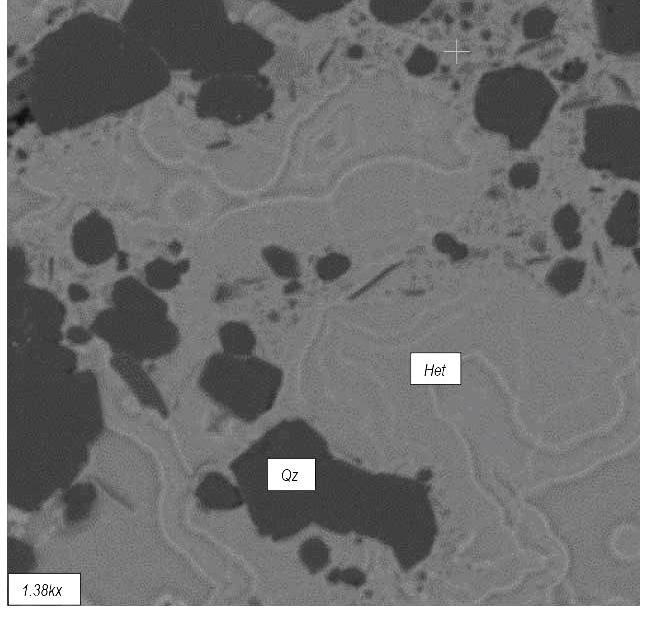
(FeSO4·7H2O), and ferric sulphate (Fe2(SO4)3) were sourced from Associated Chemical Enterprises, South Africa. Iron salt solutions were prepared in distilled water at a concentration of 400kg/t, as determined through preliminary optimisation. Sulphuric acid was added directly in its concentrated form, while Na2S2O5 was introduced as a solid.
All experiments were conducted at laboratory scale under ambient conditions (~25°C). The ore was oven-dried, homogenised, and ground to 100% passing 150µm. For feed elemental analysis, a 1kg bulk sample of the Zebesha Cu-Co oxide ore (<1mm) was
homogenised and reduced using coning and quartering, followed by rotary splitting to obtain representative subsamples for leaching tests. Initial grade determination was performed by analysing multiple samples using a NEXCG energy dispersive X-Ray fluorescence (EDXRF) instrument to characterise the full feed composition. Subsequently, a handheld X-ray fluorescence (XRF) analyser was used to scan ore samples directly from the sample bag prior to each leaching test.
Preliminary study
Prior to the current investigation, preliminary leaching tests were conducted to establish baseline behaviour and inform reagents
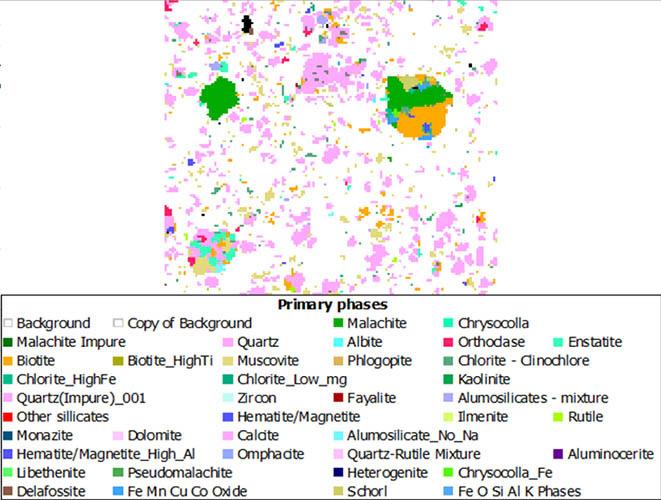
Figure 5—Mineral phase map of Zebesha Cu-Co oxide ore showing Cu- and Co-bearing phases (malachite, heterogenite, Fe-Mn-Cu-Co oxides) spatially associated with gangue minerals including quartz, muscovite, biotite, and chlorite
selection. The objective of the preliminary study was to evaluate the leachability of Zebesha Cu-Co oxide ore using alternative lixiviants to the conventional acid-reductive method. Specifically, iron-based reagents, that is, FeSO4·7H2O and Fe2(SO4)3, were investigated without the addition of sulphuric acid or other reductants/oxidants.
Ferrous and ferric iron salts are known to promote the leaching of certain metals: FeSO4 reduces Co3+ to the more soluble Co2+, whereas Fe2(SO4)3, acting as an oxidant, facilitates copper solubilisation. For example, CuS and Cu2S may be leached by Fe2(SO4)3 at ambient pressure, as shown in Equations 7 and 8 (Ferron, 2006):
Preliminary laboratory leaching tests were conducted using analytical-grade FeSO4·7H2O and Fe2(SO4)3 (Associated Chemical Enterprises, South Africa). These tests were performed at ambient temperature, with variations, initially in preliminary leaching time of 30, 60, 90, and 120 minutes, lixiviant concentrations of 200 kg/t and 400 kg/t, and particle sizes of 80% passing 75 µm, 106 µm, and 150 µm. However, the final preliminary leaching test conditions were fixed at the following parameters:
➤ 100% passing 150 µm
➤ 400 kg/t reagent concentration
➤ 120-minute leaching time
➤ 33% solids (based on Xu et al., 2023; Zheng et al., 2023).
Leaching tests
Leaching tests were carried out at 33% solids for a fixed duration of 120 minutes under continuous agitation using an overhead stirrer. Each test was conducted in triplicate to ensure reproducibility.
The study aimed to assess the individual effects of Na2S2O5 and H2SO4 on the leaching performance of FeSO4·7H2O and Fe2(SO4)3
Two separate test series were performed:
➤ Na2S2O5 series: Iron salt concentration fixed at 400kg/t; Na2S2O5 varied at 0kg/t, 50 kg/t, 100 kg/t, and 150kg/t.
➤ H2SO4 series: Iron salt concentration fixed at 400kg/t; H2SO4 varied at 0 kg/t, 30 kg/t, 40 kg/t, 50 kg/t, and 60kg/t.
FeSO4·7H2O and Fe2(SO4)3 were applied individually as lixiviants. While leach solutions were not actively pH- or ORP-
controlled, measurements of pH, oxidation-reduction potential (ORP), and temperature were recorded at 0, 30, 60, 90, and 120 minutes. Table 2 summarises the leaching conditions for the H2SO4assisted tests. The Na2S2O5 series followed a similar matrix. A schematic of the overall procedure is presented in Figure 6.
Analytical procedure and recovery calculations
Following leaching, each pulp was filtered, and the resulting leachates were analysed for Cu, Co, Ni, Mn, and Fe content using X-ray fluorescence (XRF). Each experiment was conducted in triplicate, to confirm the consistency and repeatability of the observed outcomes. The average metal extraction values are reported together with their respective standard errors (SE).
Metal recovery was calculated by mass balance, using Equation 11:
Leaching recovery [9]
Where:

%F = % metal content in the feed, mF = mass of feed (g),
%R = % metal content in residue, mR = mass of residue (g).
Results and discussion
This study investigated the extraction behaviour of Cu, Co, Ni, and Mn from Zebesha Cu-Co oxide ore using combinations of
Table 2
Leaching conditions for H2SO4-assisted tests
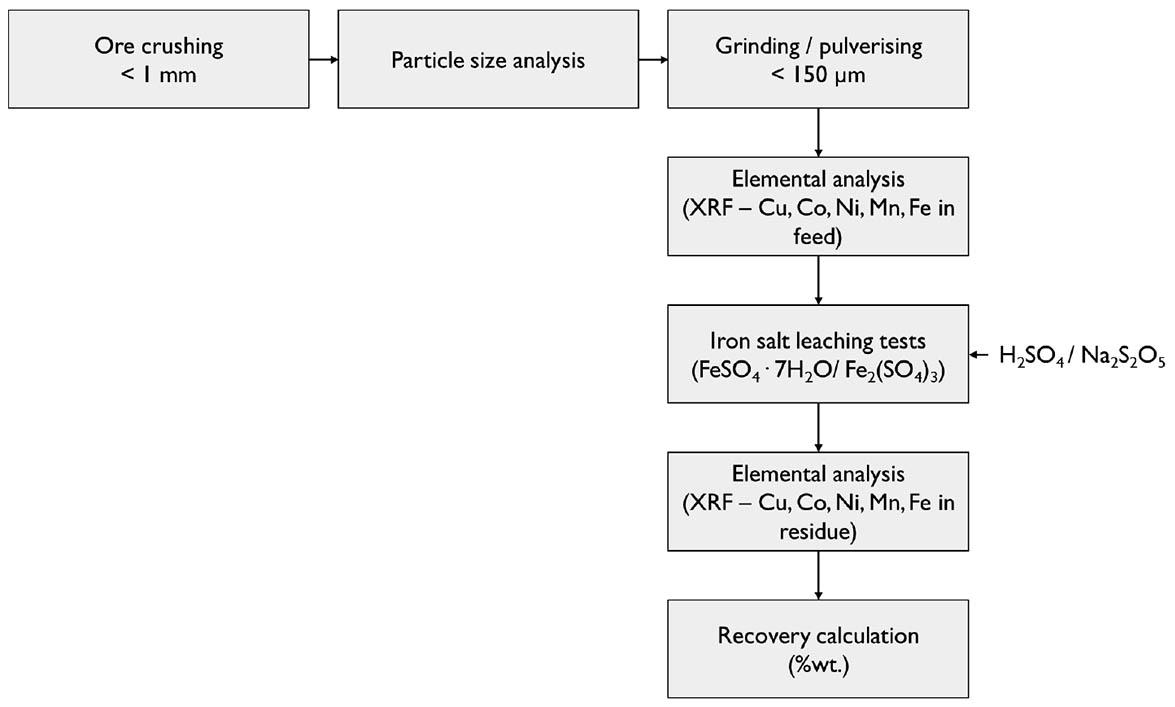
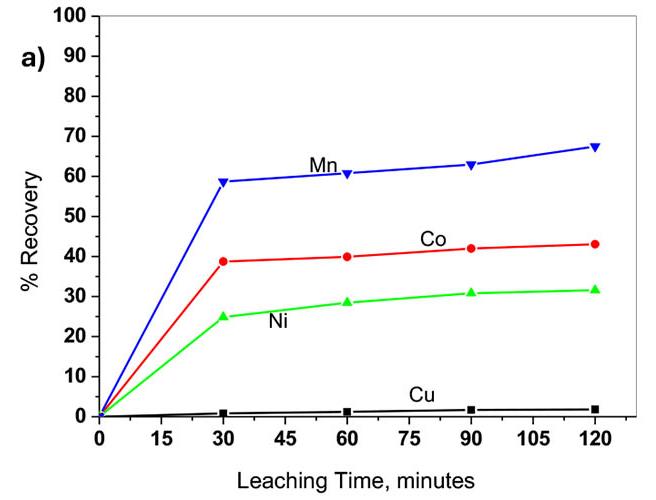
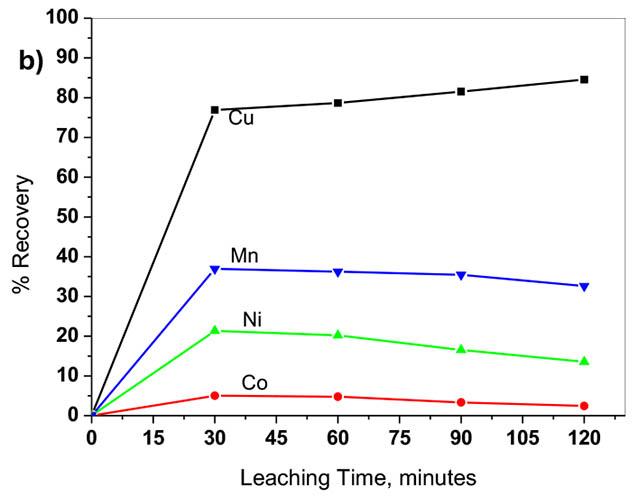
varying leaching times, and 400 kg/t lixiviant concentration
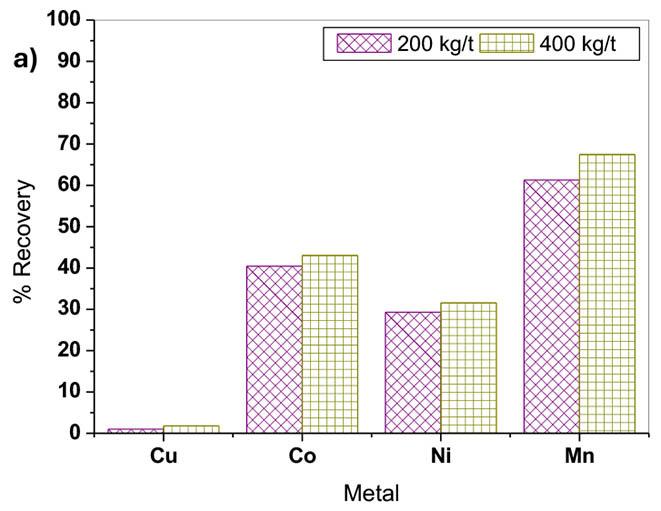
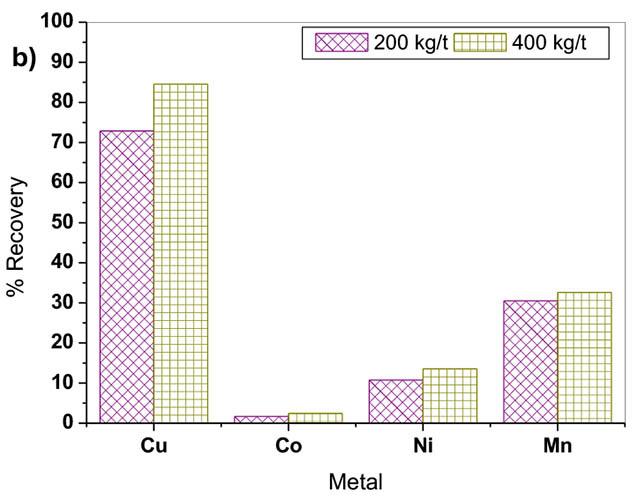
at 200 kg/t and 400 kg/t lixiviant concentration, respectively
iron-based salts, FeSO4·7H2O and Fe2(SO4)3, with either Na2S2O5 or H2SO4 at varying reagent concentrations. The data obtained revealed distinct trends in metal extraction efficiency depending on the lixiviant-reagent combination used. Results show that reagent selection critically influences metal selectivity and recovery.
The initial preliminary leaching results showed that most metals were leached within 60 minutes, with maximum recoveries observed at 120 minutes using a lixiviant concentration of 400 kg/t, (Figure 7 and Figure 8). Cu and Co extraction showed minimal sensitivity to particle size (Figure 9), and cobalt was hardly leached with Fe2(SO4)3.
Final preliminary leaching results shown in Figure 10 demonstrated that FeSO4·7H2O yielded promising recoveries for Co (43%),
Mn (68%), and Ni (35%), but only about 1% for Cu. Conversely, Fe2(SO4)3 resulted in high Cu recovery (80%), with substantially lower yields for Co (3%), Ni (13%), and Mn (33%).
Both iron salts hydrolyse to generate H2SO4, contributing to their leaching behaviour, as shown in Equations 9 and 10 (Ekmekyapar et al., 2015; Tyrocity, 2012; Welham et al., 2015): [10]
[11]
As FeSO4·7H2O acts as a reductant and Fe2(SO4)3 as an oxidant, their contrasting chemistry yields different extraction profiles. Co3+ is reduced to soluble Co2+ by FeSO4·7H2O, accounting for its superior cobalt recovery. Conversely, Fe2(SO4)3 facilitates copper extraction due to its lower pH (<3.0), whereas FeSO4·7H2O leaching
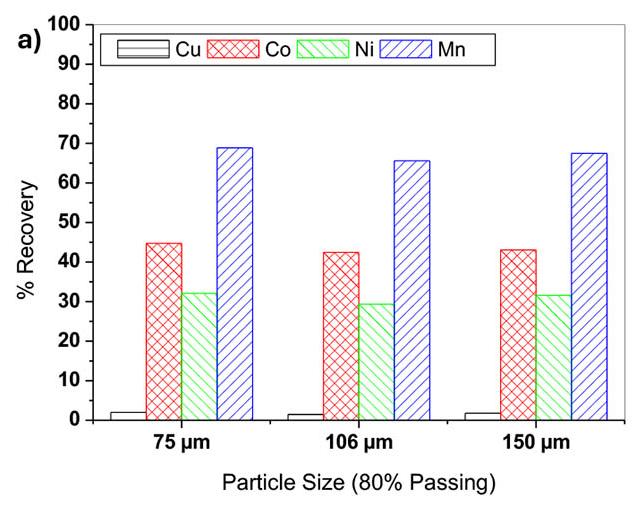
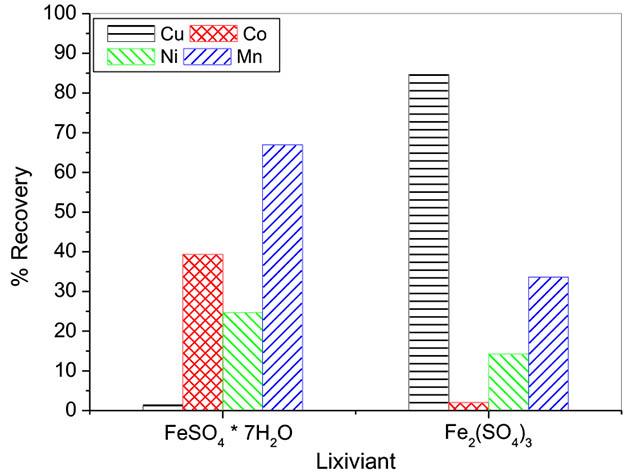
Figure 10—Leaching recoveries for Cu, Co, Ni, and Mn from Zebesha ore using: (a) FeSO4·7H2O and (b) Fe2(SO4)3 at 25 °C, over 120 minutes
pH exceeds 4.5, which is above the optimum range for Cu solubility, which is typically <3.5 (Meshram et al., 2020).
Wang et al. (2021) also demonstrated the effectiveness of Fe2(SO4)3 in extracting Cu from malachite, although their material did not include Co, Ni, or Mn.
These preliminary findings highlight the potential of FeSO4·7H2O for cobalt-selective leaching and Fe2(SO4)3 for copperselective leaching. The study concluded with the recommendation to further investigate ways to enhance overall leaching efficiency. Accordingly, the current study focuses on evaluating the individual effects of H2SO4 and Na2S2O5 on Cu-Co oxide ore leaching in the presence of iron sulphate salts at ambient conditions.
Effects of sodium metabisulphite addition on metal extraction
Figure 11 illustrates the effect of Na2S2O5 concentration on the dissolution of Cu-Co oxide ore using 400 kg/t of either FeSO4·7H2O or Fe2(SO4)3. For both lixiviants, cobalt, nickel, and manganese recoveries increased substantially with rising Na2S2O5 concentrations, while copper exhibited little to no improvement. In Fe2(SO4)3 systems, copper recovery showed a slight decline
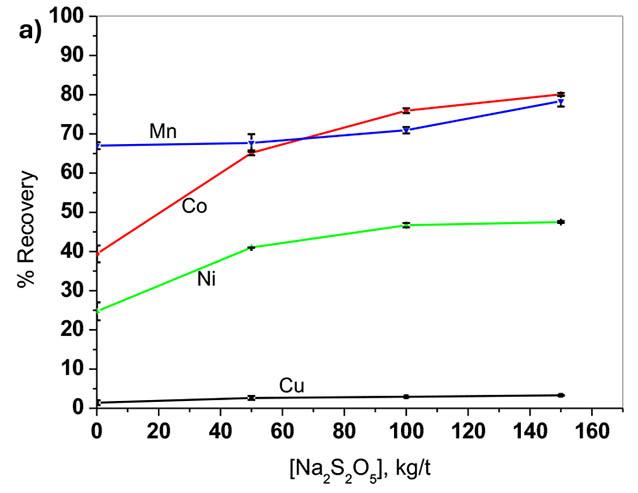
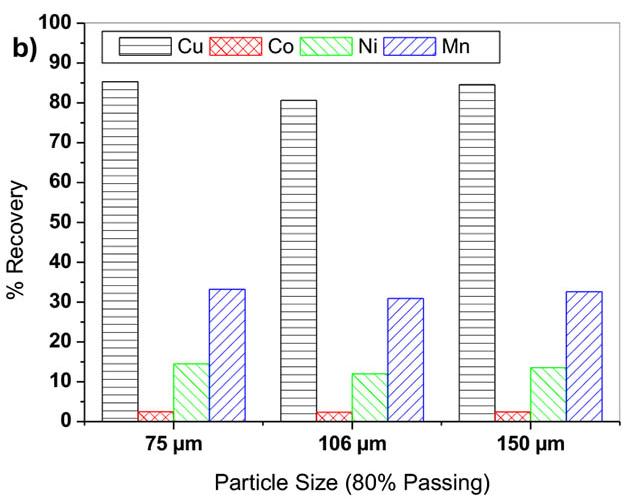
with higher Na2S2O5 levels, whereas in FeSO4·7H₂O, it consistently remained below 5%. The greatest gains in metal recovery from FeSO4·7H₂O leaching were observed for cobalt (~40 %pt.), followed by nickel (~23 %pt.), and manganese (~11 %pt.) over the tested concentration range.
When ferrous sulphate reacts with metal oxides in aqueous solution, it oxidises to ferric sulphate. However, in the presence of Na2S2O5, ferric ions are reduced back to ferrous, as illustrated by Equation 12 (Crundwell et al., 2020). This redox cycling effectively increases the concentration of active ferrous ions in solution, enhancing the dissolution of metals that are more readily leached under ferrous-acidic conditions. Additionally, Na2S2O5 reduces Co3+ and Mn4+ to their soluble divalent forms, promoting their extraction in Fe2(SO4)3 systems. These redox-mediated transformations account for the observed increase in Co, Ni, and Mn recoveries across both iron-based lixiviants. Thermodynamic support for these reductions is shown in the Gibbs free energy plots in Figure 12.
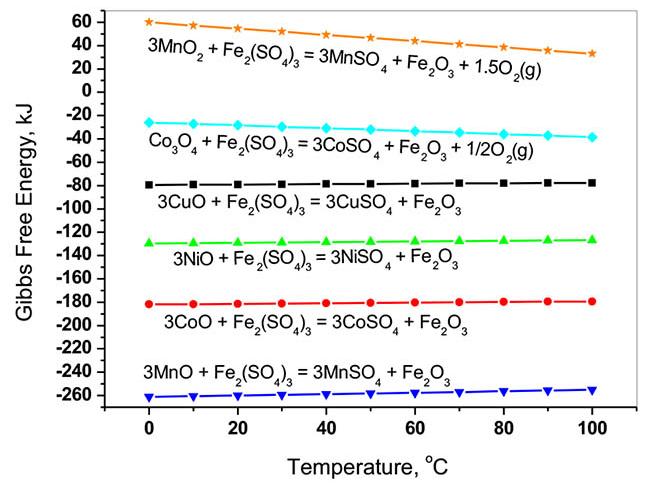
Figure 12—Gibbs free energy change (ΔG) versus temperature for redox reactions of MnO2, Co3O4, CuO, NiO, CoO, and MnO with Fe2(SO4)3, generated using HSC Chemistry 6.0 software data
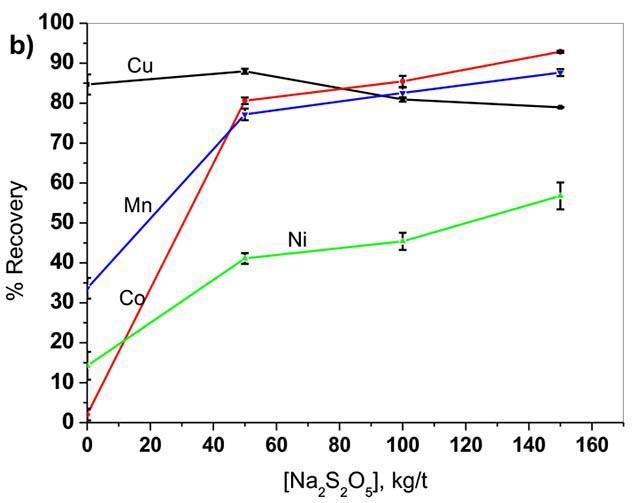
Increasing the Na2S2O5 concentration in the FeSO4·7H2O leaching system resulted in a marked improvement in cobalt recovery, rising from approximately 40% in the absence of Na2S2O5 to nearly 80% at 150 kg/t. Concurrently, manganese and nickel recoveries also increased, with Mn leaching improving from ~67% to 78% and Ni from ~25% to 48%, as shown in Figure 11a. The most significant gains were observed between 0 kg/t and 50 kg/t Na2S2O5, where cobalt and nickel recoveries rose by 25% and 15%pt., respectively. A further increase of 15%pt. Co and 5%pt. Ni was achieved by increasing Na2S2O5 to 150kg/t. In contrast, copper recovery remained consistently low, increasing only slightly from ~1% to below 5% across the tested Na2S2O5 range.
Conversely, the addition of 50kg/t Na2S2O5 to Fe2(SO4)3 leaching led to a modest increase in copper recovery from ~85% to 88%, after which it declined to ~79% at 150kg/t, as shown in Figure 11b. In contrast, Na2S2O5 addition substantially improved cobalt, nickel, and manganese recoveries. Cobalt extraction increased markedly from ~2% to ~80% with 50kg/t Na2S2O5, reaching a maximum of ~93% at 150 kg/t. Nickel and manganese recoveries followed similar trends, rising from ~14% to 57% Ni and 44% to 88% Mn, respectively, across the tested range. Notably, the greatest improvements in metal dissolution for Co, Ni, and Mn occurred between 0 kg/t and 50kg/t Na2S2O5, highlighting the strong initial reactivity of the reductant with Fe3+ species and metal oxides in this concentration interval.
As observed in the preliminary iron salt leaching tests, copper exhibited minimal solubility in FeSO4·7H2O but was readily extracted in Fe2(SO4)3 solutions. This discrepancy can be attributed in part to the reductive action of Na2S2O5, which converts ferric ions (Fe3+) to ferrous (Fe2+), thereby reducing the availability of ferric sulphate – a key oxidant for copper dissolution. Additionally, effective copper leaching typically occurs under acidic conditions (pH < 2). At higher pH values (e.g., >4), especially in the presence of excess Na2S2O5 or SO2, copper may precipitate as Le Chevreul’s salt (CuSO3·Cu2SO3·2H2O) according to Equation 13 (Crundwell et al., 2020; Ferron, 2006; Ntakamutshi et al., 2017). This precipitation mechanism likely contributed to the low copper recoveries observed in FeSO4·7H2O systems, even at elevated Na2S2O5 concentrations.
[13]
Varying concentrations of sulphuric acid were introduced into the leaching system, with both FeSO4·7H2O and Fe2(SO4)3 solutions maintained at 400kg/t to assess the effect of H2SO4 on metal extraction efficiencies. The results, presented in Figure 13, show that metal recoveries improved with increasing acid concentration across both systems. However, the enhancement was significantly more
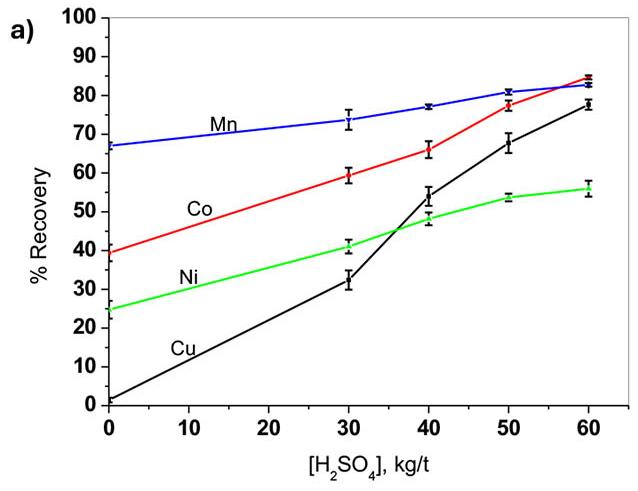
pronounced in the FeSO4·7H2O leaching system, while Fe2(SO4)3 exhibited a more subdued response.
The addition of H2SO4 to FeSO4·7H2O leaching significantly improved copper extraction, increasing from ~1% (in the absence of acid) to ~78% at a dosage of 60 kg/t. Concurrently, nickel, manganese, and cobalt recoveries also increased, with Ni rising from ~25% to 56%, Mn from ~67% to 83%, and Co from ~39% to 85%, as shown in Figure 13a. These results indicate that H2SO4 addition noticeably enhanced metal solubility in ferrous media, particularly for copper, which otherwise shows limited dissolution in FeSO4·7H2O alone. This enhancement effectively diminished the initial selectivity gap between Cu and Co under ferrous leaching conditions.
The observed increase in cobalt recovery may also be attributed to acid-driven regeneration of the lixiviant. Under acidic conditions, heterogenite reacts with ferrous sulphate via mechanisms such as shown in Equations 14 and 15:
These reactions suggest that both acid strength and lixiviant regeneration contribute to improved leaching performance. Despite the substantial gains in copper recovery, the highest recoveries were achieved for cobalt (85%) and manganese (83%) under these conditions.
In contrast, the effect of H2SO4 addition on Fe2(SO4)3 leaching was less pronounced than in the FeSO4·7H2O system. At 60 kg/t H2SO4, copper recovery peaked at ~92%, while cobalt, nickel, and manganese reached ~10%, 18%, and 36%, respectively, as shown in Figure 10b. Manganese recovery increased by only ~3 percentage points across the acid range, while Cu, Co, and Ni each rose by ~8 %pt.
The enhanced copper dissolution can be attributed in part to acid-driven pH reduction, from ~2.7 (without H2SO4) to below 2.0 at 60 kg/t, creating more favourable conditions for malachite dissolution. This is reflected in the acid-mediated reaction between malachite and ferric sulphate (Equation 16):
[16]
In contrast, cobalt, nickel, and manganese showed only modest improvements, likely due to their limited presence in readily soluble divalent forms under Fe2(SO4)3 leaching conditions. This highlights the relative selectivity of Fe2(SO4)3–H2SO4 systems for copper over other base metals.
The performance comparison of H2SO4 and Na2S2O5 reagents addition on leaching Zebesha Cu-Co oxide ore with iron sulphate salt showed that the acid performance was higher in most cases compared to sodium metabisulphite performance. As presented
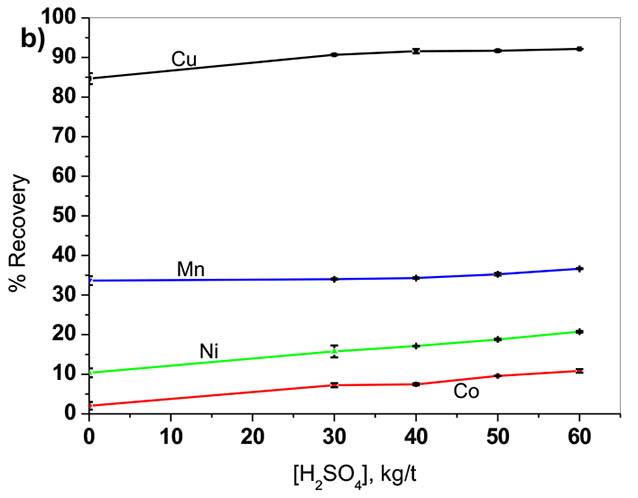
in Table 3, for instance, at a reagent concentration of 50 kg/t. Ferric-based leaching with H2SO4 achieved the highest copper recovery (91.70%), while ferrous-based leaching with Na2S2O5 favoured cobalt extraction (65.17%) with minimal copper dissolution (2.64%). H2SO4 addition generally improved extraction performance across all metals, with FeSO4·7H2O + H2SO4 yielding high recoveries for both Co and Mn. While the overall objective was to enhance recoveries, particularly for Cu and Co, the ability to selectively leach these elements remains equally important for potential process optimisation.
These findings underscore the synergistic effects of lixiviantreductant combinations on selective metal extraction. While H2SO4 consistently enhanced metal recovery, Na2S2O5 exhibited greater selectivity for cobalt relative to copper. Understanding these interactions is essential for optimising leaching conditions to achieve targeted metallurgical outcomes.
The low standard error values observed across most data points, such as 91.70% ± 0.20% Cu using Fe2(SO4)3 + H2SO4 and 77.37% ± 1.33% Co with FeSO4·7H2O + H2SO4 (Table 3), indicate high precision and reproducibility in the experimental procedures. Slightly higher variability in certain cases such as manganese extraction (67.69% ± 2.25% Mn), likely reflects intrinsic differences in leaching behaviour but remains within acceptable limits for laboratory-scale studies. Overall, the data affirm the reliability and repeatability of the extraction process under the tested conditions.
This study examined the selective leaching of copper and cobalt from Zebesha Cu-Co oxide ore using iron-based salts in combination with sodium metabisulfite (Na2S2O5) or sulphuric acid (H2SO4). The leaching behaviour differed depending on the oxidation state of the iron salt, that is, ferric iron promoted copper extraction, while ferrous iron favoured cobalt recovery, suggesting that a sequential leaching approach may be effective. The addition of Na2S2O5 significantly enhanced cobalt recovery, achieving up to 80%, whereas copper extraction remained limited. Introducing H2SO4 markedly improved the dissolution of Cu, Co, Ni, and Mn, with copper and cobalt recoveries reaching 78% and 84%, respectively, at 60 kg/t H2SO4. Ferrous sulphate combined with H2SO4 outperformed ferric solutions, particularly for cobalt, nickel, and manganese. The findings demonstrate the potential for environmentally and economically sustainable metal recovery through tailored reagent selection and process design. However, additional investigation is required to understand the leaching kinetics and validate the feasibility of sequential processing strategies. These insights offer a foundation for developing more efficient and environmentally responsible extraction techniques for Cu-Co ores.
Acknowledgments
We extend our gratitude to the Copperbelt University - Africa
Table 3
Centre of Excellence for Sustainable Mining (CBU-ACESM) for funding this project, and we thank all the staff members of Yotamu Consultation Service (YCS). Special thanks to the metallurgical laboratory staff in the Department of Civil, Mining and Metallurgy at the Namibia University of Science and Technology, the Hydrometallurgy Department at Mintek, South Africa, as well as the metallurgical staff at Alfred H Knight Kitwe for their technical and laboratory assistance. Mostly, all glory be to God for preserving us throughout this study.
Credit author statement
Foibe D.L. Uahengo: Experimental work and original draft (PhD student)
Yotamu R.S. Hara: Reviewing and editing (main supervisor)
Olga Bazhko: Reviewing and editing (co-supervisor).
Nomenclature
A list of abbreviations used in the manuscript, including mineral phases, units, and analytical terms
Abbreviation Definition
%pt.
°C
Bi
CAC
Chl
Chr Fe
DRC
EDXRF
Het
kg/t
mF / mR
ORP
pH
Qz
%F / %R
SE
SEM
wt.%
X
XRF
ΔG
References
Percent point
Degrees Celsius
Biotite (gangue mineral)
Central African Copperbelt
Chlorite (gangue mineral)
Chrysocolla with iron substitution
Democratic Republic of the Congo
Energy-dispersive X-ray fluorescence
Heterogenite (primary cobalt mineral)
Kilogrammes per tonne
Mass of feed / residue (g)
Oxidation-reduction potential
Measure of solution acidity
Quartz (gangue mineral)
Metal content in feed / residue (%)
Standard error
Scanning electron microscopy
Weight percent
Reacted fraction of metal (%)
X-ray fluorescence
Gibbs free energy change
Abreu, C.M.R., Mendonça, P.V., Serra, A.C., Coelho, J.F.J., Popov, A.V., Guliashvili, T. 2012. Inorganic sulfites: Efficient reducing agents and supplemental activators for atom transfer radical polymerization. ACS Macro Letters, vol. 1, no.11, pp. 1308–1311.
Annels, A.E., Simmonds, J.R. 1984. Cobalt in the Zambian Copperbelt. Precambrian Research, vol. 25, no. 1–3, pp. 75–98.
Average extraction performance (%) of metals using Na2S2O5 and H2SO4 at 50 kg/t concentration Lixiviant
Note: Values represent average metal extractions from replicate tests. Standard errors (SE) are shown to reflect variability across replicates.
Asadi Dalini, E., Karimi, G., Zandevakili, S., Goodarzi, M. 2020. A Review on Environmental, Economic and Hydrometallurgical Processes of Recycling Spent Lithium-ion Batteries. Mineral Processing and Extractive Metallurgy Review, vol. 42, no. 7, pp. 451–472. https://doi.org/10.1080/08827508.2020.1781628
Bwando, P., Kanz, T. 2018. Laboratory Column Leaching of Cobalt using Raffinate and Sodium Metabisulfite. In: Copper Cobalt Africa, incorporating the 9th Southern African Base Metals Conference, Livingstone, Zambia, 10–12 July 2018, Southern, Livingstone, 2018, pp. 263–272. Southern African Institute of Mining and Metallurgy. Available at: https://www.saimm.co.za/ Conferences/Copper-Cobalt-2018/27-Bwando-263-272.pdf
Crundwell, F.K., Moats, M.S., Ramachandran, V., Robinson, T.G., Davenport, W.G. 2011. Chapter 30 - Production of Cobalt from the Copper-Cobalt Ores of the Central African Copperbelt. In: Extractive Metallurgy of Nickel, Cobalt and Platinum Group Metals. Elsevier; pp. 377–391.
Crundwell, F.K., Du Preez, N.B., Knights, B.D.H. 2020. Production of cobalt from copper-cobalt ores on the African Copperbelt –An overview. Minerals Engineering, vol. 156 (May). Elsevier: p. 106450.
da Costa Machado Matos Carvalho, I,M,, Cavalcante, A.A., Dantas, A.F., Pereira, D.L., Rocha, F.C., Oliveira, F.M., Da Silva, J. 2011. Environmental mutagenicity and toxicity caused by sodium metabisulfite in sea shrimp harvesting in Piauí, Brazil. Chemosphere, vol. 82, no. 7, pp. 1056–1061. doi: 10.1016/j. chemosphere.2010.10.042. Epub 2010 Nov 5. PMID: 21056453
Decrée, S., Pourret, O., Baele, J-M. 2015. Rare earth element fractionation in heterogenite (CoOOH): implication for cobalt oxidized ore in the Katanga Copperbelt (Democratic Republic of Congo). Journal of Geochemical Exploration. vol. 159. Elsevier B.V.: pp. 290–301.
Dehaine, Q., Michaux, S., Pokki, J., Kivenin, M., Butcher, A.R. 2020. Battery minerals from Finland: Improving the supply chain for the EU battery industry using a geometallurgical approach. European Geologist, vol. 49, pp. 36–41. doi:10.5281/ zenodo.3938855
Dehaine, Q., Tijsseling, L.T., Glass, H.J., Törmänen, T., Butcher, A.R. 2021. Geometallurgy of cobalt ores: A review. Minerals Engineering, vol. 160, p. 106656. https://doi.org/10.1016/J. MINENG.2020.106656
Dreier, J.E. 2012. The Geochemistry of Copper Leaching. Available at: https://www.911metallurgist.com/wp-content/ uploads/2018/09/The-Geochemistry-Of-Copper-LeachingJdep3-12-2012.pdf (accessed 17 July 2024).
Ekmekyapar, A., Demirkıran, N., Künkül, A., Aktaş, E. 2015. Leaching of Malachite Ore in Ammonium Sulfate Solutions and Production of Copper Oxide. Brazilian Journal Of Chemical Engineering, vol. 32, no. 1, pp. 155–165. https://doi.org/10.1590/01046632.20150321s00003211
Ferron, C.J. 2006. Iron Control in Hydrometallurgy: The Positive Side of the Coin. Sgs Minerals Services Technical Bulletin: pp. 1–10.
Ferron, C.J., Henry, P. 2008. The use of ferrous sulphate to enhance the dissolution of cobaltic minerals. In: Hydrometallurgy 2008: Proceedings of the Sixth International Symposium (ed. CGA and YC Courtney A. Young, Patrick R. Taylor), Colorado, 2008, pp. 1088–1097. Society for Mining, Metallurgy and
Exploration, Inc. Available at: https://books.google.co.zm/ books?id=1etfSdk55SYC&printsec=frontcover (accessed 22 February 2020).
Fisher, K.G. 2011. Cobalt Processing Developments. In: The Southern African Institute of Mining and Metallurgy 6th Southern African Base Metals Conference 2011, Canada, 2011, pp. 237–258. 911metallurgist. Available at: chromeextension://efaidnbmnnnibpcajpcglclefindmkaj/https:// www.911metallurgist.com/blog/wp-content/uploads/2016/02/ Cobalt-processing-developments.pdf
Kafumbila, J. 2018. Dissolution of cobalt (III) using simultaneously ferrous and sulfur dioxide as reducing reagents performed in open agitated tank: Kinetic model. Available at: https://www. researchgate.net/publication/323028144_Dissolution_of_ cobalt_III_using_simultaneously_ferrous_and_sulfur_dioxide_ as_reducing_reagents_performed_in_open_agitated_tank_ Kinetic_model (accessed 14 February 2020).
Lutandula, M.S., Kitobo, W.S., Kime, M.-B., Mambwe, M.P., Nyembo, T. K. 2020. Mineralogical variations with the mining depth in the Congo Copperbelt: technical and environmental challenges in the hydrometallurgical processing of copper and cobalt ores. Journal of Sustainable Mining, vol. 19, no. 2, pp. 96–114.
Meshram, P., Prakash, U., Bhagat, L., Abhilash, Zhao, H., van Hullebusch, E.D. 2020. Processing of Waste Copper Converter Slag Using Organic Acids for Extraction of Copper, Nickel, and Cobalt. Minerals, vol. 10,, no. 3, p. 290.
Mwema, M.D., Mpoyo, M., Kafumbila, K. 2002. Use of sulphur dioxide as reducing agent in cobalt leaching at Shituru hydrometallurgical plant. Journal of The South African Institute of Mining and Metallurgy, vol. 102, no. 1, pp. 1–4.
Ntakamutshi, P.T., Kime, M.B., Mwema, M.E., Ngenda, B.R., Kaniki, T.A. 2017. Agitation and column leaching studies of oxidised copper-cobalt ores under reducing conditions. Minerals Engineering, vol. 111, pp. 47–54. doi:10.1016/j.mineng.2017.06.001
Seo, S.Y., Choi, W.S., Kim, M.J., Tran, T. 2013. Leaching of a CuCo ore from Congo using sulphuric acid–hydrogen peroxide leachants. Journal of Mining and Metallurgy, Section B: Metallurgy, vol. 49, no. 1, pp. 1–7. doiSerbia.
Shengo, L.M., Gaydardzhiev, S., Kalenga, N.M. 2016. Malachite and heterogenite behavior during the locked-cycle recycling of process water in flotation of copper-cobalt oxide ores. International Journal of Mineral Processing, vol. 157. Elsevier B.V.: pp. 152–162.
Slack, J.F., Kimball, B.E., Shedd, K.B. 2017. Cobalt. In: Critical Mineral Resources of the United States—Economic and Environmental Geology and Prospects for Future Supply. U.S. Geological Survey. Available at: https://doi.org/10.3133/ pp1802F. (accessed 14 December 2020).
Sole, K.C., Tinkler, O.S. 2016. Copper solvent extraction : status , operating practices , and challenges in the African Copperbelt. The Southern African Institute of Mining and Metallurgy, vol. 116, July 2015): pp. 6–8.
Sole, K.C., Parker, J, Cole, P, Mooiman, M.B. 2018. Flowsheet options for cobalt recovery in African copper–cobalt hydrometallurgy circuits. ALTA Nickel Cobalt Copper Conference, 1-21. This paper was also presented at the International Solvent Extraction Conference (ISEC) 2002 and was published in the proceedings, notes Google Scholar.
Stuurman, S., Ndlovu, S., Sibanda, V. 2014. Comparing the extent of the dissolution of copper-cobalt ores from the DRC region. Journal of the Southern African Institute of Mining and Metallurgy, vol. 114, no. 4, pp. 347–353.
Sutcliffe, M.L., Johnson, G.M., Welham, N.J. 2011. ‘Method For Leaching Cobalt from Oxidised Cobalt Ores’. Available at: https://patents.google.com/patent/WO2011014930A1
Thabane, S. 2018. Hydrometallurgical Extraction of Copper and Cobalt from Oxidised CopperCobalt Ore Using Ammonia Solution. University of Witwatersrand, South Africa. Available at: http://wiredspace.wits.ac.za/bitstream/handle/10539/26002/ Thabane Seliee Final Submission.pdf?sequence=2&isAllowed=y
Tshipeng, S.Y., TshamalaKaniki, A., Kime, M-B. 2017. Effects of the Addition Points of Reducing Agents on the Extraction of Copper and Cobalt from Oxidized Copper–Cobalt Ores. Journal of Sustainable Metallurgy, vol. 3, no. 4. Springer: pp. 823–828.
Tyrocity. 2012. Mohr’s Salt Or Ferrous Ammonium Sulphate FeSO4(NH4)2 SO4.6H2O). Available at: https://tyrocity.com/ chemistry-notes/mohrs-salt-or-ferrous-ammonium-sulphatefeso4nh42-so46h2o-1cnb (accessed 19 May 2022).
Uahengo, F.D.L., Hara, Y.R.S., Hara, R., Fumpa, N., Old, A., Kaluba, G. 2022. Leaching Cobalt from a Nickel-Containing CopperCobalt Zebesha Ore. In: Zhang, M., et al. Characterization of Minerals, Metals, and Materials 2022. The Minerals, Metals & Materials Series. Springer, Cham. https://doi.org/10.1007/978-3030-92373-0_13
Welham, N.J., Johnston, G.M., Sutcliffe, M.L. 2015. AmmLeach ® A New Paradigm in Copper-Cobalt Processing. In: Copper Cobalt Africa, incorporating the 8th Southern African Base Metals Conference, Livingstone, Zambia, 6-8 July 2015, pp. 207–216. Southern African institute of Mining and Metallurgy. Available at: https://www.saimm.co.za/Conferences/BM2015/207Welham.pdf (accessed 22 February 2020).
Xu, P., Tan, D.H.S., Chen, Z. 2021. Emerging trends in sustainable battery chemistries. Trends in Chemistry, vol. 3, no. 8. Elsevier Inc.: pp. 620–630.
Zheng, C., Jiang, K., Cao, Z. 2023. Agitation Leaching Behavior of Copper–Cobalt Oxide Ores from the Democratic Republic of the Congo. Minerals, vol. 13. no. 6, p. 743. u
Appendix: Data used for the graphs in the article, presented as average
Leaching results for the iron-containing salts leaching of Zebesha Cu-Co oxide ore with and without the addition of Na2S2O5
Lixiviant kg/t Final T. Final Final Leaching recoveries
Leaching results for the iron-containing salts leaching of Zebesha Cu-Co oxide ore with and without the addition of H2SO4
Lixiviant
Fe2(SO4)3

Affiliation:
1School of Mining Engineering, University of the Witwatersrand, South Africa
Correspondence to:
R. van Heerden
Email: ross.vanheerden@live.com
Dates:
Received: 4 Feb. 2025
Revised: 13 Apr. 2025
Accepted: 2 Sept. 2025
Published: October 2025
How to cite:
van Heerden, R., Stacey, T.R. 2025. The practicality of using rock mass classification in a narrow tabular orebody at depth extracting the Ventersdorp Contact Reef. Journal of the Southern African Institute of Mining and Metallurgy, vol. 125, no. 10, pp. 609–620
DOI ID:
https://doi.org/10.17159/2411-9717/3662/2025
ORCiD:
R. van Heerden
http://orcid.org/0009-0005-4584-317X
T.R. Stacey
http://orcid.org/0000-0003-3763-9193
by R. van Heerden1, T.R. Stacey1
Abstract
In the challenging environments of deep-level, narrow tabular orebody gold mines in South Africa, rock mass classification offers a potential method for predicting hazardous areas and optimising rock support systems. This study evaluates the applicability of various rock mass classification systems, with a focus on the Modified or Mining Rock Mass Rating system tailored for high-stress, deep-level mining conditions. Extensive data collection was conducted at Kusasalethu Mine, involving underground mapping and analysis of the 2020/2021 fall of ground database. The Mining Rock Mass Rating system was adapted to the unique geological and operational conditions, providing a simplified, user-friendly approach for rock engineering and geology personnel. Results indicate that this adapted Mining Rock Mass Rating system effectively quantifies rock mass conditions and influences proactive mining adjustments. The study’s findings highlight the system's capability to enhance understanding of rock mass behaviour and substantially mitigate the occurrence of rockfalls and ground collapses. Further application and refinement of the system are recommended to continuously improve mining safety and efficiency.
Keywords
Rock mass classification, Ventersdorp Contact Reef, deep-level narrow tabular mining, sequential grid mining method, stress fracturing, prominent jointing, blasting
Introduction
The gold mines in South Africa present an extremely challenging mining environment: narrow tabular reefs and hence narrow tabular stopes; very deep mining, now in the region of 3600 m below surface; correspondingly, very high stress, brittle rock environment, leading to induced fracturing and rockfalls, as well as seismicity and rock bursts. The combination of these conditions has resulted in hazardous mining, and the result has been a poor safety record, with many accidents and fatalities related to rock bursts and rockfalls. The safety record for the mining industry showed improvement over the past 10 years, but the 2020 statistics were worse than the previous year. The industry further regressed by 23% in 2021 compared to 2020, but an improvement of 34% was seen at the end of 2022. Unfortunately, by the end of 2023 a 65% regression was seen in rock burst and rockfall fatalities (Minerals Council South Africa, 2024), indicating that further improvement is warranted. To achieve this, a method is required that could provide advanced indications of locations that may be more hazardous than others, and where special precautions, such as additional or different rock support, may be advised and implemented. A method that may fulfil this requirement is Rock Mass Classification (RMC). This is a method that quantifies the quality of the rock mass, giving a numerical rock mass rating. It was considered that this approach might provide the required ‘‘warning’’ of potentially hazardous rock conditions, and therefore, research into the approach and its applicability in a narrow tabular reef gold mining environment was carried out.
Rock mass classification methods, in the forms that are commonly used all over the world, were introduced some 50 years ago. They have become an extremely popular and useful means of estimating rock mass stability, support requirements, and rock mass deformability and strength. They were developed initially for the tunnelling industry and are widely used in civil engineering and massive mining, but have rarely been used in the South African gold mining industry. Dunn and Hungwe (2004) applied rock mass classification on a gold mine, but the application proved unsatisfactory (Dunn, Stacey, 2006). Watson (2004) successfully applied a rock mass rating system to evaluate stope stability in platinum mines.
Rock mass classification methods
There are numerous rock mass classification methods available, the most common being the Q System (Barton, et al., 1974); (Barton, 2002), the Geomechanics Classification RMR System (Bieniawski, 1973); (Bieniawski, 1989) and the Geological Strength Index, GSI (Hoek, 1999) A brief review of these systems follows:
The Q System is based on three aspects:
➤ rock block size, represented by (RQD/Jn)
➤ joint shear strength, represented by (Jr/Ja)
➤ confining stress, represented by (Jw/SRF)
where: RQD is the rock quality designation (Deere, Deere, 1989)
Jn is the joint set number
Jr is the joint roughness number
Ja is the joint alteration number
Jw is the joint water reduction factor
SRF is the stress reduction factor.
The use of these parameters is very logical since the stability of an excavation in a rock mass is controlled by the size/number of blocks in the walls, the shear strength of the block surfaces, and the confining stress, which holds the rock blocks together, or maybe large enough to fracture/break the blocks. The Q value is calculated from the following Equation 1:
Q = (RQD/Jn).(Jr/Ja).(Jw/SRF) [1]
Q ranges on a log scale from 0.001 for extremely poor rock to 1000 for excellent rock. The Q system does not take the rock material strength into account explicitly, although it is implicitly included in the SRF. The orientation of joints is also not taken into account since it is considered that the number of joint sets, and hence the potential freedom of movement for rock blocks, is more important. The Q system has been modified slightly since its original publication (Barton, 2002).
In developing the Geomechanics Classification system, Bieniawski (1973) identified five parameters that he considered to be most important regarding the stability of excavations in a rock mass. These are the rock material strength, uniaxial compressive strength (UCS), rock quality designation (RQD), joint spacing, joint roughness and separation, and groundwater. Considerable weight is given to block size in the system since both RQD and joint spacing are classification parameters. Bieniawski (1973) judged the relative importance of the five parameters and allocated numerical values to each parameter such that the summed maximum rock mass rating (RMR) value would total 100. Finally, an adjustment was applied, considering the expected effect on the stability of the joint orientations. The initial parameter values in the system were reviewed, and some changed based on case study applications, and the final values appear in Bieniawski (1989). The standard geomechanics classification does not account for the stress present in the rock mass. However, an adjustment has subsequently been developed by Lowson and Bieniawski (2013).
Relationships have been found between RMR and Q as follows:
Bieniawski (1989): RMR = 9 ln Q + 44 [2]
Barton (2002): RMR = 15log Q + 50 [3]
Laubscher (Laubscher, Taylor, 1976) attempted to use the Geomechanics Classification System in a caving mining environment but found that it did not perform satisfactorily. He therefore developed a modified version of the system (the Mining Rock Mass Rating system, Laubscher, (1977); Laubscher, (1990)), using the same five parameters, but combining the joint condition
and groundwater parameters. He allocated parameter ratings that were different from the Geomechanics Classification System. Laubscher’s system gives a rock mass rating for the in-situ rock mass condition before it is influenced by mining. Four adjustments are then applied to downrate the RMR due to the effects of mining: a stress adjustment to take into account confining stress and stress changes due to mining; an adjustment for joint orientation to take into account adversely oriented joints; an adjustment to cater for the effects of blasting on the rock mass; and a weathering adjustment to account for deterioration of rock conditions after exposure, for example, slaking rocks. The result is the Modified Rock Mass Rating, or Mining Rock Mass Rating (MRMR). This system has been widely used in mining and is commonly used to estimate cavability and the determination of the size of the undercut necessary to initiate caving propagation. It was also used as a basis for the development of a method for the rapid assessment of the stability of rock slopes in open pit mines (Haines, et al., 1991).
Revision of the MRMR system was carried out, and the revised system introduced new factors to the system (Jakubec, Laubscher, 2000). The changes/additions to the MRMR system were the introduction of rock block strength; the introduction of ‘cemented’ joint adjustments; changes in the joint condition rating; and the expression of the water impact as an MRMR adjustment. Certain points were raised by Jakubec, Laubscher (2000) that are important to note. These observations apply to the MRMR system, but it can be argued that they are valid for other rating systems as well. Common mistakes in classifying rock masses highlighted by Jakubec and Laubscher (2000) are the following:
➤ Using ratings as an average across certain geological domains.
➤ Confusing mining-induced and naturally occurring defects such as joints and fractures.
➤ Ignoring variability of values of individual parameters.
➤ Averaging joint conditions for individual discontinuity sets.
➤ Wrongly adjusting for alteration and weathering.
It is important to ensure the correctness of collected data, and that strength anisotropy should not be ignored, since it can lead to an under or overestimation of the rock mass competency (Jakubec, Laubscher, 2000).
The Geological Strength Index (GSI) developed by Hoek (1999) is a very useful system owing to its visual format. The system was developed over several years and careful thought was given to the descriptions corresponding with the rock mass structure and the joint surface conditions. It provides a very rapid means of quantifying the rock mass, and correlates with the Geomechanics Classification RMR System:
GSI = RMR – 5 [4]
However, the approach does not take into account stress, or groundwater, and was therefore not considered to be satisfactory for application in deep-level gold mining.
In summary, rock mass classification is a useful tool for defining the quality of the rock mass. For application in deeplevel gold mines, a rock mass classification system suitable for a narrow reef tabular environment had to be chosen as the basis for building a rating system. The system considered to be best suited is the modified/mining rock mass rating system developed by Laubscher (1990), as it was designed for mining scenarios from the start. Although it was developed on data from cave mining, it is considered that it can be modified to suit narrow tabular reef mining at depth.
The basis of good rock mass classification is a good characterisation of the rock mass since this will provide good quality input data to the classification. The better the rock mass character is known, in quantifiable terms, the less variability that needs to be taken into account in the input parameters for the classification. When the number of planes of weakness becomes such that it is impossible or impractical to consider them individually, the most efficient way of handling this type of rock mass is to use rock mass classification.
Mining environment and data collection
Kusasalethu is situated approximately 90km to the west of Johannesburg in the West Witwatersrand Basin. The Ventersdorp Contact Reef (VCR), which is overlain by the Alberton Porphyry Formation (Roberts, Schweitzer, 1999), is extracted. The current mining takes place at depths of 2700 m–3388 m below the collar elevation and employs the sequential grid mining method (Jager, Ryder, 1999); (Handley, et al., 2000). The sequential grid method employs a series of raise lines spaced 200 m apart, separated by 30m wide dip stabilising pillars. The access/ventilation tunnels are placed ‘deep’ in the quartzite footwall, greater than 80m below the reef plane, and are excavated ahead of the mining operations. Long crosscuts every 200 m link the main haulages to the reef plane where raises are developed. The mining sequence followed helps to manage the stress levels and limit the incidence of seismicity.
Mining is focused on the Ventersdorp Contact Reef (VCR), which is a conglomerate reef band. In the mine, this reef has a strike of N65°E and a dip of 23° to the south. The reef consists of various terraces separated by slopes, all of which may be structurally deformed by duplicated reef zones. The grade is highly variable with unpay zones typically occupying sand-filled channels. The reef is characterised by a relatively large amount of faulting with throws of less than 10 metres and the mined stoping width ranges from 115 cm to 160 cm.
The hanging wall is Ventersdorp Lava, which has a UCS of the order of 300MPa. Conditions vary considerably across the VCR, caused by pilloids, inter-pilloid breccias and joints associated with slopes and duplicated reef zones. A further contributing factor is a relatively large amount of flat faulting, which extends into the hangingwall due to the brittle nature of the hangingwall lava. The footwall is competent quartzite, with a UCS of 180 to 250MPa, which extends to a depth of approximately 430 m below the reef on the eastern boundary of the mine and about 550 m below the reef on the western boundary. This enables haulages and most other primary related development to be sited deep in the footwall in competent rock. When a major geological feature is present, the dip stabilising pillars may be shifted to include the feature, which would then act as part of the regional stability design and will form part of the pillar system. Low-grade areas can be left unmined, which further improves the stabilising pillar system. Backfilling is practised to improve the overall stability, reduce closure rates,
Table 1
Prominent joint sets
improve regional support, and enhance local support provided by elongates or Rapid Yielding Hydraulic Props (RYHP) (Jager, Ryder, 1999); (Handley, et al., 2000). In this mining environment, to understand and develop a rock mass rating system that is simple and user-friendly, a set of data needed to be collected. Data was collected using two methods: underground mapping/observations, using a simplified version of scan line mapping; and analysis of the 2020/2021 fall of ground database. Furthermore, research carried out by Gumede (Stacey, Gumede, 2007) was also considered as it mapped prominent joint sets in neighbouring mines.
Underground mapping was based on the scan line system. In this system, the mining panel is divided into three distinct 5 m areas: the top, middle and bottom 5 m of the face, with observations being made within 2 m of the mining face. This method initially tended to have a bias towards at least two fracture sets. However, proximity to the topmost or bottommost portions of the panel could skew the results. Consequently, the portion of the hanging wall that was sampled was changed to every 5.0 m starting at least 3.0 m–5.0 m from the top of the panel. Practical mapping was difficult due to low stoping widths, to permanent in-stope netting obstructing the hanging wall, to low levels of illumination, and long travel times to working areas.
From the data collected, the following observations were made and recorded with regard to prominent joint set strike and dip, infilling, roughness and spacing. The joint length was most difficult to determine due to the limited space in a panel. On average, a joint trace length of approximately 2.0 m–2.5 m was observed. The true length could be greater than this, but could not be determined precisely.
The strike of an observed joint was measured in relation to the orientation of the panel face and captured upon returning to surface. Orientations of prominent joint sets identified at the mine are shown in Table 1. The last surveyed and measured face position was determined using the survey sheet (scale 1:200), with north = 0°, and the strike of the joint was determined with an allowance of ±5° and then captured in the database. The method described gives a good indication of the joint’s strike direction. The common practice at the mine with regard to face orientation is to lay out the panel’s strike gullies 5° above the reef strike direction to accommodate the egress of water from the panels and to assist in cleaning operations. The general face orientation for panels mining in the easterly direction is 150° from north, or 5° south of southeast, and for the western panels is 335° from north, or 25° west of north. The deviation associated with these orientations is normally 5° but could be as high as 7°.
The database obtained for implementation of the RMR consisted of data from 30 data collection points in various areas of the mine ranging in depth from 2800 m–3300 m below surface. The data was collected from different sources such as fall of ground investigations, ledging and regular breast mining operations.
Prominent joint set 1 Prominent joint set 2
Joint surface rough undulating/planar. rough planar.
Joint infilling tight no Infill/1 mm calcite. no infill/calcite infill 0 mm–2 mm.
Mean joint dip and direction
Joint
W or E
E
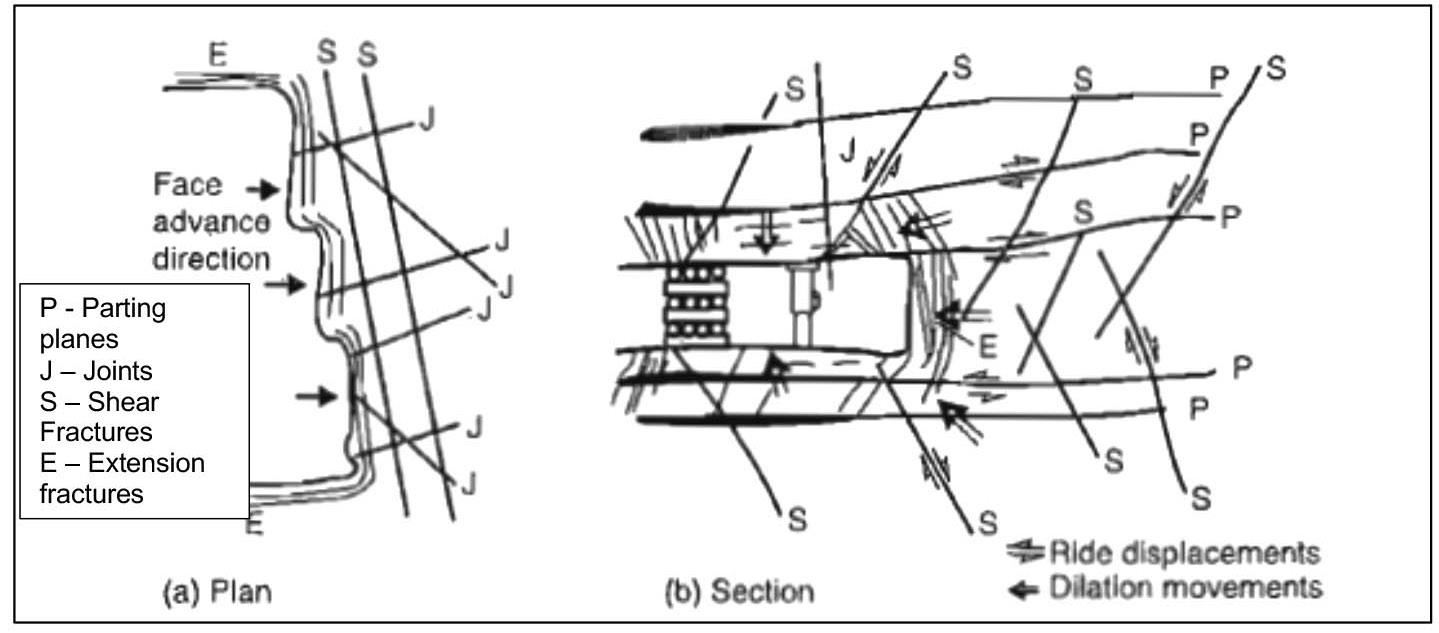
Fracture data was collected owing to the major influence of fractures on the rock mass surrounding the stopes at depth, and the inherent influence of a fracture as the boundary of a fall of ground. The approach used in capturing the fracture data was similar to that used for the joint data. Fracture orientation, fracture dip and direction, and fracture spacing were recorded. The fracture orientation generally conforms to the shape of the excavation, especially in terms of extension-type fractures, which can become the dominant set of discontinuities in a stope (Jager, Ryder, 1999).
Extension fractures, which are the most common type of fractures experienced in deep-level mining, form in induced tension, but in a wholly compressive stress field. They develop on a plane normal to the minor principal stress and are sensitive to changes in stress orientation. These types of fractures are planar and clean, and often start or stop against bedding planes and joints. Owing to the ubiquitous nature of the fractures around a stope, measurements were taken in three areas of the panel. The prominence of the fractures was captured, the general spacing between the fractures of each set, and the dip of the fractures. The fracture orientation as stated before conforms to the outline of the excavation and therefore does not have a uniform overall strike direction. The common fracture sets observed are summarised in Table 2 and illustrated in Figures 1 and 2.
The main types of fractures focused on are extension fractures. Although shear fractures are present, they are not as common as extension fracturing and have not been recorded as part of this study. Furthermore, at depth, tensile fracturing is not as common as in a low-stress mining environment (Jager, Ryder,
Table 2
Common fracture sets observed underground
Fracture set 1
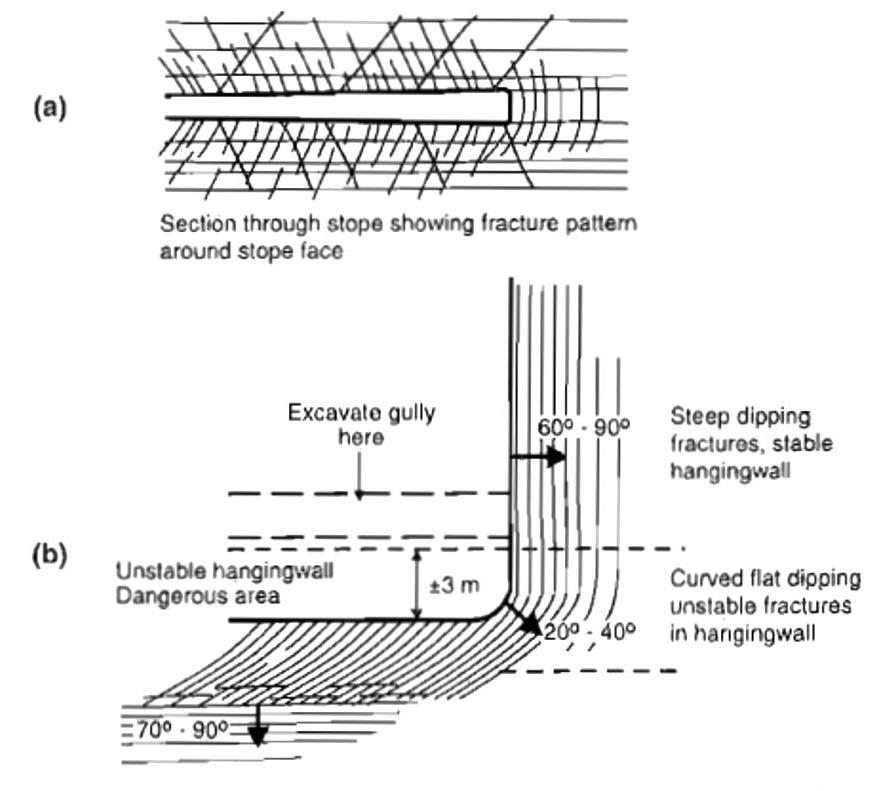
1999). Observations from underground visits indicated that stress fracturing and jointing have a major influence on the stability of the rock mass as can be seen in Figure 3.
The average fall-out thickness measured at the mine is 1.2m as recorded in the mine’s fall of ground database, upon which support designs were based. As can be seen in Figure 1, the breaks in the rock mass affect the overall stability and are taken into account and captured using the fracture frequency per metre system. This simplified system requires the measurement of all the
Fracture set 2
Fracture set 3
Prominence very (always observed). very (always observed). average (mostly observed along static abutments).
Dip and dip direction 60°–85° (mean = 68°) commonly dips away from the direction of mining).
Fracture orientation face parallel, greatly influenced by the overall panel face shape.
55°–85° (Mean = 80°) Dip is dependent on the direction of mining.
normally perpendicular to fracture set 1.
tend to curve with a flat dip of 20°–40°.
curved as it is found at the intersection of the abutment and advancing face.
Fracture spacing 0.05 m–0.4 m 0.02 m–0.3 m 0.02 m–0.4 m
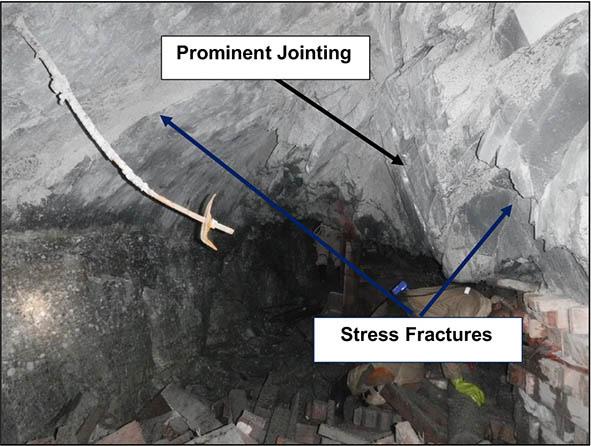
discontinuities that are intersected along the scan line (Laubscher, 1990), which is done at each point in the panel where the data is collected. The user should know whether it is a one, two or threejoint system being sampled. Measurements of fracture frequency are made along the hangingwall of the panel and, if necessary, the north or south sidewall of the panel, depending on the orientation of the features.
The rock mass rating method adopted
In applying the MRMR System, the mining method which is used at the mine required adjustments to Laubscher’s (1990) parameter ratings. The influence of various parameters had to be included, and those which are not relevant to be excluded, to create the most effective method for rock mass classification for the mine and mining method. Some of the parameter ratings needed to be adjusted to accommodate the specific influence of the parameter on the quality of the rock mass.
The Modified/Mining Rock Mass Rating (MRMR) described by Laubscher and Taylor (1976) and Laubscher (1977); (1984) uses the following parameters:
➤ RQD
➤ Intact Rock Strength,
➤ Spacing of Fractures and Joints (FF/m used in this case),
➤ Joint Condition and groundwater.
These parameters give the rating for the in-situ rock mass. Thereafter, adjustments for the following are applied to the RMR to take into account factors introduced by the mining process:
➤ Weathering
➤ Joint Orientation
➤ Mining Induced Stresses
➤ The Effects of Blasting.
The justification for using this method of rock mass classification at the mine is its simplicity, and that it takes into account the in situ rock mass rating and those factors influencing the rock mass by mining within it. The MRMR system as published is, however, not entirely compatible with the mining method used, the type of orebody and the mining depth, and modifications had to be made to the system, whilst keeping it simple and easy to use.
After analysing empirically what affects the rock mass conditions the most at the mine, the following parameters were considered.
➤ Intact rock strength remained in place even though the general UCS of the rock in which the Ventersdorp Contact Reef is situated is strong. If a low-strength rock is intersected, how it reacts to the high-stress levels may be somewhat different from that of a high-strength rock in terms of
fracturing and competence. The UCS parameter is selfexplanatory and the rating values were adjusted from those given by Laubscher (1990) to account for the higher rock strengths experienced at the mine. The overall contribution to the rock mass rating out of 100 was reduced from 20 to 10 as the Ventersdorp Contact Reef at the mine is overlain by the Alberton Porphyry Formation and has a quartzite conglomerate footwall below the reef, which remains relatively unaltered (Roberts, Schweitzer, 1999). The lava extrusion in this area ranges from 160 m to 400 m in thickness and is incorporated into a geotechnical area described by Roberts, Schweitzer (1999). It remains relatively unaltered unless it is close to a large fault or igneous intrusion.
➤ The joint condition is captured in the database. However, it has not been included in the RMR, since the observed joint and fracture conditions are similar throughout the mine. Groundwater was also not included as water is very seldom encountered during mining. If water is encountered in the future, its effect will be assessed specifically and recommendations given for the specific area. There are currently no such water conditions in the mine.
➤ Both joint and fracture data had to be collected, as, individually, and in combination, these two parameters have a large impact on the rock mass conditions. The numbers of joint and fracture sets found in a panel directly influence the rock mass conditions, i.e. the more weakness planes, the greater the likelihood of failure occurring in the hangingwall. Prominent jointing has therefore been retained as part of the RMR adopted, because it is commonly found in all the panels and is accounted for in the main rock mass classification systems in use today, as indicated by Rehman, et al., (2018) and Hoek (2006). Stress fracturing is very prominent at depth due to the high levels of stress, and directly affects the stability of the hanging wall. Stress fractures could become the dominant set of discontinuities (Jager, Ryder, 1999). A parameter for stress-induced fracturing was therefore added. As previously stated, prominent jointing and fracturing have been accounted for equivalently in the rock mass rating. Laubscher (1990) only accounted for the effect of fracturing under the FF/m portion of the MRMR system and emphasised the effect of jointing and joint condition. The parameters that have been included in the current system deal with the strike orientation of the features as well as the dip. These two factors, along with the fracture spacing, which is added later, encompass the joint and fracture parameters of the rating system. The jointing and fracture properties in terms of joint surface condition and infilling are captured separately, but not included in the rating, as it was found that the prominent joint sets have similar properties throughout the mine. Where anomalous properties are identified they are addressed with relevant remedial actions in terms of support and blasting techniques. Two prominent joint sets have been identified on the mine and when found in a stoping panel, influence falls of ground and ground conditions.
➤ Fracture frequency per metre is used in place of RQD and joint spacing, as it tends to be more sensitive (Laubscher, 1990) than RQD, which discounts weakness plane spacing of less than 100mm (Palmstrom, 2005), (Hoek, 2006), the explanation of which is well covered by Pells, et al (2017).
In terms of the mining adjustments, the following were considered:
➤ Mining-induced stress was assessed slightly differently from the published method and simplified. What has been included is the average face stress in place of mining-induced stresses. Laubscher (1990) indicated that the adjustment for mininginduced stresses can range from 60% to 120% but due to the high levels of stress at great depths, the consequence is that a highly fractured hanging wall is substantially more stable compared to shallower depths as the horizontal stresses tend to clamp the discontinuities (Jager, Ryder, 1999) resulting in a more stable hanging wall. Therefore, due to the high-stress regime at depth, the common adjustment would be 120%, indicating good confinement as described by Laubscher (1977). By using the adjustments described by Laubscher (1990) the rating would almost always increase positively, and taking cognisance of the aforementioned, it was decided best to use the average face stress, as it influences the occurrence of stress fracturing in the hangingwall of the panel, which is easily determined by numerical modelling and underground observations.
➤ The process of breaking the rock using conventional blasting methods also influences the rock mass conditions in a stoping panel and therefore, this parameter has been retained as an adjustment. Pre-conditioning blasting can also affect the condition of the rock mass either negatively or positively, and therefore had to be included, as the mine practices face perpendicular pre-conditioning. When done correctly, preconditioning can improve the overall hangingwall conditions and lead to improved face advances (Toper, et al., 2003). When done incorrectly, the pre-conditioning blast has a negative effect on the rock mass conditions and can result in poor panel face shapes and destabilisation of the hangingwall.
➤ Discontinuity orientation was retained as an adjustment, as adversely orientated weakness planes affect the stability of the rock mass. For example, if a discontinuity has a dip of 30° then the very same stress that enhances stability with a more steeply dipping feature, can promote instability, and cognisance must be taken of this factor.
Modified rock mass rating for the Ventersdorp contact Reef
Analysis of the data was conducted using the rock mass rating system developed for the VCR stope at the mine, which is the modified version of the MRMR system as described above. The system is simple and easy to use by rock engineering and geology personnel.
The MRMRVCR designed for use in stoping environments at the mine maintains the principles stated by Laubscher (1990), keeping it as straightforward and simple as possible. The uniaxial compressive strength of the rock was taken into consideration and is the strength of the rock between joints and fractures (Laubscher, 1990). The values of the uniaxial compressive strength were modified to cater for the higher host rock strengths found in the VCR stratigraphy. Rock strength values reported by Güler (1996) for the ‘hard-lava’ are around 250MPa, and 210−260MPa is indicated by Ryder and Jager (2002). The underlying quartzite-conglomerate can have UCS
Table 3
values of around 250MPa as well. However, the main focus is the classification of the hanging wall. The values and ratings for the UCS parameter in the system are indicated in Table 3
The influence of prominent jointing is the next parameter considered. From underground observations and experience, two influential joint sets were identified, with random joints being present as well. From knowledge of the two main contributors to hangingwall instability at the mine, the rating for prominent jointing was defined. This followed a similar process to that of Laubscher, with a cumulative percentage adjustment of a possible total value of 25, as shown in Table 4. The data input for this parameter is obtained from underground observations captured at various locations in the mine. The value adjustments were rated on the influence of the prominent joint set on the ground conditions.
Once the joint rating is complete for the specific panel, a fracture rating is allocated. The most common fractures observed were extension fractures generally with close spacing of approximately 15cm. A fracture rating with a total value of 25 is allocated, and cumulative adjustments are applied to obtain a final rating, similar to the process for prominent jointing (Table 4). The down-rating values become more significant when more fracture sets are present in the rock mass, as each breaks the rock mass further into smaller blocks that can dislodge see Table 5.
To incorporate the number of breaks in the rock mass, fracture frequency per metre is used. This technique requires the measurement of all breaks in the hangingwall (fractures and joints) along a scan line. The ratings originally adopted by Laubscher have been retained unchanged, Table 6.
Once the RMR value of the classification system is obtained, the adjustments to take into account the effects of mining are applied to obtain the final ‘modified’ rock mass rating. The adjustment values were based on parameters that affected the overall quality of the rock mass significantly and were kept to a total of 4. Average Face Stress (AFS) is the first adjustment, and the rationale behind this adjustment is the effect the face stress has on stress fracturing. As the levels of stress increase so does the intensity of stress fracturing, the occurrence of which is easily observed underground, as can be seen in Figure 4.
The average face stress is determined from routine numerical modelling, an example shown in Figure 5, and results are shown in Table 7.
The fracturing observed correlates with the high incidence of stress found at this specific raise line and in turn manifests as more intense stress fracturing as well as an increased occurrence of seismicity. It was therefore considered appropriate to add this adjustment. Adjustment values are shown in Table 8.
A slight downgrade is applied for values equal to the design since stress fracturing is still influential at these stress levels. The downgraded values could change with future calibration.
A direct contributor to poor and unstable ground conditions is the quality of the production blast and the pre-conditioning blast. The mine only uses conventional blasting methods, which involve the drilling of blast holes using handheld drilling machines, and holes are charged with an emulsion-type explosive.
Table 4
Prominent jointing and cumulative percentage adjustments
Cumulative percentage adjustment of a possible rating of 25
Jointing present Y N
Rating
Joint set 1 dip (JS1D)
Joint set 2 dip (JS2D)
Joint set 1 strike (JS1S)
Joint set 2 strike (JS2S)
25 x (joint dip 1,2,3) x (joint strike 1,2,3) x dip direction. No adjustment to the total rating.
(0.8)
Table 5
Stress fracturing and cumulative percentage adjustments
Cumulative percentage adjustment of a possible rating of 25
Fracturing present Y N
Rating
Fracture set 1 dip (FS1D)
Fracture set 2 dip (FS2D)
Fracture set 3 dip (FS3D)
Fracture set 1 strike (FS1S)
Fracture set 2 strike (FS2S)
Fracture set 3 strike (FS3S)
Dip direction
25 x (Fracture Dip 1,2,3) x Fracture Strike (1,2,3) x dip direction. no adjustment to the rating.
(0.87)
(1.0)
The preconditioning standard for the mine requires 2.4 m preconditioning holes to be drilled in the middle of the mining face and 2.4m apart along the length of the face. Two-thirds of the hole is charged with explosives and the remainder is filled with stemming material. The timing of the detonation of the pre-conditioning blast relative to the production blast is very important. Poor timing may lead to ineffective preconditioning and/or misfires, which may result in blast damage to the rock mass and negate the benefits that can be gained from preconditioning. The preconditioning holes should be detonated ahead of the production holes. When the hangingwall
beam is damaged by the blast, due to poor drilling and/or charging discipline, very poor and difficult-to-control ground conditions are created; and since blasting creates new fractures as well as loosening the rock mass, possibly causing movement along joint and fracture planes, poor discipline more often than not results in a fall of ground. Hence, the production blast adjustments adopted by Laubscher have been retained. A poor quality blast can be described by the presence of blast sockets, incorrect drilling angle/ direction, incorrect burden spacing, overcharging of the holes, lack of stemming and the instance of pre-conditioning timing as well.
Table 6
Fracture frequency per metre ratings, after Laubscher (1990)
Fracture frequency per metre FF/m (40 points allocated)
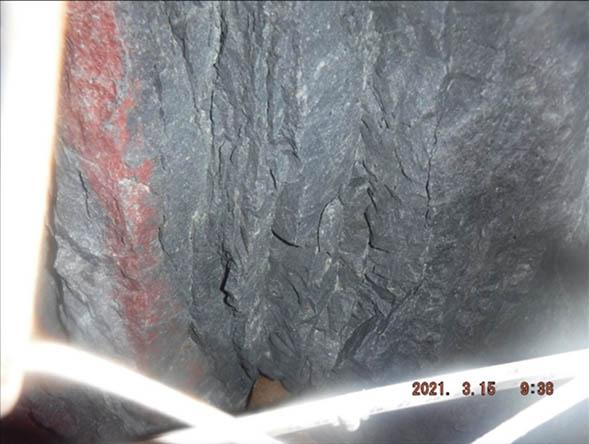
The blasting adjustments applied for the MRMRVCR are shown in Tables 9 and 10.
The last adjustment that has been used in the rock mass rating system for the mine is for joint orientation. As the size, shape and orientation of joints affect the behaviour of the rock mass, the orientations of the joint and fracture planes need to be taken into consideration, as well as the interaction of these planes. The attitudes of the joints and stress fractures, and whether the bases of the rock blocks are exposed, have a significant influence on the stability of the excavation, and the rating should be adjusted accordingly. The adjustment depends on the attitude of these breaks in the rock mass with respect to the vertical axis of the block. Laubscher considers gravity as the most influential force, and that the instability of the block depends on the number of the joints that dip away from the vertical axis. It is pertinent to note that hangingwall strata are clamped together by high horizontal stresses at great depth and can be self-supporting under static conditions. The presence of low-angle jointing and fracturing can nevertheless give rise to ground control problems (Jager and Ryder, 1999).
Table 7
Stress and ERR values from numerical modelling
Sigma 1 (MPa) – average face stress Panel
Table 8
Average face stress adjustment
Average face stress determined from numerical modelling (design = 250 MPa) adjustment
Less than the design value
Equal to the design value
(1.0)
(0.98) Greater than the design value
(0.9)
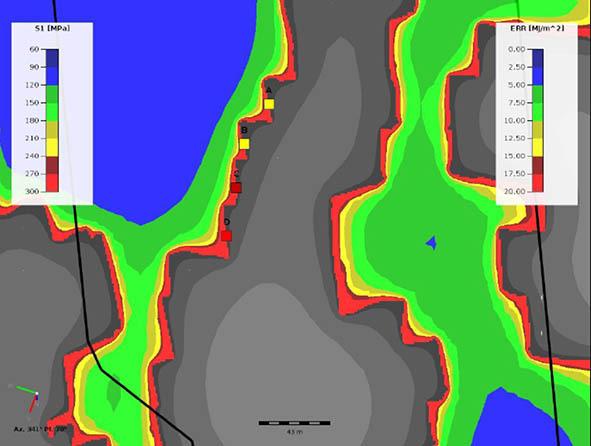
Gravity-related falls of ground contribute to more than 60% of the total falls of ground recorded annually at the mine. Laubscher’s values for the joint/fracture plane adjustments have been retained, as shown in Table 11.
The categories or classes in which the ratings fall are indicated in Table 12.
To obtain meaningful values from the classification system, a theoretical, but practical, baseline value had to be determined. The baseline value represents a panel with fair to good conditions, which will not require any changes with regard to support and/or mining techniques. The baseline panel characteristics are:
➤ The UCS value remains reasonably constant throughout the mine and ranges from 250MPa–300MPa for the Ventersdorp Lava hangingwall (Roberts, Schweitzer, 1999).
Table 9
Production blasting adjustment
Production blasting quality Adjustment
Good
Poor
Table 10
Preconditioning blasting adjustment
(0.97)
(0.9)
Preconditioning blasting quality Adjustment
Good
Poor
Table 11
(1.0)
(0.9)
Percentage adjustments for joint orientation (Laubscher, 1990)
No. of joints defining the block
No. of faces inclined away from the vertical Rating adjustment
Table 12
RMRVCR and MRMRVCR class ratings remain the same as the original (Laubscher, 1990)
RMRVCR & MRMRVCR value 0–20 21–40 41–60 61–80 81–100 Basic description poor pooraverage average average - good good
➤ One prominent joint set striking near-parallel to the face, indicating a strike of 300° from the north. This is the most common joint set found at the mine.
➤ Two fracture sets, the first of which is common extension fracturing, striking parallel to the face, with a dip of 60° away from the direction of mining. The extension fractures have a spacing of 10cm–40cm. The second fracture set is normally identified at the top or bottom of the panel, has a dip of approximately 70° over the excavation/panel, has a strike that conforms to the direction of mining, and is near perpendicular to the strike of the first fracture set.
➤ Lastly, the number of fractures per metre is included as 5–7, taking into account the joint set and two fracture sets.
The final baseline RMRVCR value is calculated as 65–70, which indicates an average to good rock mass before the mining adjustments are applied. The mining adjustments considered to apply to the baseline panel are:
➤ The average face stress is equal to the design, therefore an adjustment of 98% is allocated.
➤ The production and pre-conditioning blasting quality is considered to be good and a 97% adjustment is applied for the production blast, and a 100% adjustment for the preconditioning blast.
➤ Lastly, an adjustment is applied for the number of joint/ fracture planes that are orientated away from the vertical. Taking into consideration that at least 4 of the planes defining the block will have an attitude orientated away from the vertical, with the top and bottom contacts being horizontal, the values given are 4 joints/fractures defining the plane of which at last 4 are orientated away from the vertical. This gives an adjustment value of 70%. Note that one of the prominent joint sets has a dip ranging from 80°–90°, and this may change the value of the number of planes orientated from the vertical to 2 or 3.
The final adjusted rating, taking into account the effects of mining, will be in the range of 45–55 resulting in an average rock mass. This gives a good indication of the effects of mining on the rock mass as well as of the orientations of the weakness planes.
MRMRVCR jointing adjustment change
The initial joint rating values were harsh and skewed the RMRVCR value before the mining adjustments. Therefore, the jointing adjustments were equated to those of the fractures, since the jointing and fracturing affect the rock mass stability equally, as they both create breaks within the rock, along which failure can take place.
MRMRVCR Correlation with poor ground conditions and falls of ground
The initial data that was collected during underground visits consisted of 23 separate working panels and an additional 7 working places were added by the middle of 2023, including one raise inspection before the commencement of ledging. The types of visits that were conducted were normal panel audits, poor ground condition investigations, fall of ground investigations, pre-ledge inspections and fracture mapping. The different visits, RMRVCR values and MRMRVCR values are indicated in Table 13.
From Table 13 it can be seen that the average RMRVCR value for most panels where falls of ground occurred is 68, and the MRMRVCR is 42 after adjustments. This is an indication that, even though the RMRVCR value might fall in the average–good category, with the combination of weakness plane interaction, poor mining practices, and high stress levels, a rating downgrade of up to 26 can result. This places these panels into the average and average–poor categories, see Table 12. Even though the ground conditions may appear to be ‘good’, with incorrect mining practices, which are not limited to blasting alone, these values are detrimentally affected and result in poorer ground conditions, which become more difficult to control. Falls of ground occurred in working places that fall under the ‘good’ category and therefore, it must not be assumed that falls of ground occur only in those areas with poorer conditions. Complacency in terms of standard mining practices must be avoided.
The research carried out has shown that the MRMRVCR rock mass classification system is effective in quantifying the basic rock mass conditions in a deep-level mine. The system is robust and adequately quantifies the rock mass conditions within which mining takes place, giving the user and production personnel a better understanding of the rock mass quality, the effects of interacting weakness planes and their frequency of occurrence, and the effects of mining. The results of the research show that, from the data collected at the mine, the RMRVCR value range is 54–76 and the MRMRVCR value range is 32 – 57. This confirms that conditions
Table 13
Summary of the underground investigations
Workplace type Breast panel
throughout the mine vary, which is expected, due to the nature of deposition of the reef and extrusion of the lava hangingwall. The occurrence of natural and man-made factors substantially affects these values. A correlation can be drawn from the MRMRVCR values and FOGs where it is noted that in the dataset the values range from 46 (maximum) to 29 (minimum), further emphasising the effects of mining on the rock mass condition. Consideration should be given to the MRMRVCR system in proactively reacting to varying conditions in a working place to reduce the number of falls of ground that occur at the mine. Further research with the system could identify appropriate support regimes corresponding with the different conditions encountered, before they become worse or result in a fall of ground.
➤ The system remains simple, which Laubscher (1990) regarded as important. It is easy to use, with only a few important factors, which significantly influence the condition of the rock mass, to consider.
➤ The way in which the system has been set up allows for easy observational points in a mining panel with reference to the
panel face, from which basic joint and fracture parameters can be determined.
➤ This system can easily be used by members of rock mechanics and geology departments and helps with the understanding of the rock mass and its reaction to mining.
It is envisaged that this system will be in continuous use at the mine in the future, with additional data being added to the system. To further simplify the system for the user, an approach similar to that of the GSI system should be investigated to create a map or image of the different conditions which could be used when conducting underground mapping. This will allow the system to be refined further, confirming its applicability in the narrow tabular orebody mining environment.
References
Barton, N. 2002. Some
Barton, N., Lien, R., Lunde, J. 1974. Engineering Classification of Rock Masses for the Design of Tunnel Support. Rock Mechanics, vol. 6, no. 4, pp. 189–236.
Bieniawski, Z.T. 1973. Engineering Classification in Jointed Rock Masses. Civil Engineer in South Africa, vol. 15, no. 12, pp. 335–343.
Bieniawski, Z.T. 1989. Engineering Rock Mass Classifications: A Complete Manual for Engineers and Geologists in Mining, Civil, and Petroleum Engineering. New York: John Wiley & Sons.
Deere, D.U., Deere, D.W. 1989. Rock Quality Designation (RQD) after Twenty Years. Gainesville, Florida: Deere (DON U) Consultant.
Dunn, M.J., Hungwe, G. 2004. The application of a rock mass rating system at Tau Lekoa Mine. Pert: Australian Centre for Geomechanics.
Dunn, M.J., Stacey, T.R. 2006. Stable pillar spans at Tau Lekoa Mine. Proceedings of the 41st Rock Mechanics Symposium - "50 years of Rock Mechanics - Landmarks and Future Challenges". 06-1120 Golden, Colorado: American Society for Rock Mechanics, ARMA/USRMS 06-1120.
Güler, G. 1996. Measurement and Prediction of the Rockmass of the Ventersdorp Contact Reef Stopes. (pp. 1071-1078). Turin, Italy: ISRM International Symposium - EUROROCK 96
Haines, A., Terbrugge, P. J., Carrieri, G. 1991. Preliminary Estimation of Rock Slope Stability Using Rock Mass Classification Systems. (pp. 887-892). Proceedings of the 7th ISRM Conference, Aachen, Germany: ISRM
Handley, M.F., de Lange, J.A., Essrich, F., Banning, J. A. 2000. A Review of the Sequential Grid Mining Method Employed at Elandsrand Gold Mine. Journal of the Southern African Institute of Mining and Metallurgy, vol. 100, no. 3, pp. 157–168.
Harmony Gold Mining Company Limited. (2019). Mandatory Codes of Practice to Combat Rockfall and Rockburst Accidents for Harmony Gold Mine - Kusasalethu. Carletonville: Harmony Gold Mining Company Limited.
Hoek, E. 1999. Putting numbers to geology - an engineer's viewpoint. The Quarterly Journal of Engineering Geology, vol. 32, no. 1, pp. 1–19.
Hoek, E. 2006. Practical Rock Engineering. North Vancouver: Evert Hoek Consulting Engineer Inc.
Jager, A.J., Ryder, J.A. 1999. A Handbook On Rock Engineering Practice for Tabular Hard Rock Mines (1st ed.). Johannesburg: The Safety in Mines Research Advisory Committee.
Jakubec, J., Laubscher, D.H. 2000. The MRMR Rock Mass Rating Classification System in Mining Practice. (pp. 413–421). Proceedings of the 3rd International Conference and Exhibition on Mass Mining, Brisbane, Queensland: Australian Institute for Mining and Metallurgy.
Laubscher, D.H. 1977. Geomechanics Classification of Jointed Rock Masses: Mining Applications. Inst. Min. Metall., Trans., Sect. A, 86(Jan), A1-A8.
Laubscher, D.H. 1984. Design Aspects and Effectiveness of Support Systems in Different Mining Conditions. Trans. Inst. Min. Metall., Sect.A, 93 (Mar), pp. A70–A81.
Laubscher, D.H. 1990. A Geomechanics Classification System for the Rating of Rock Mass in Mine Design. Journal of the Southern African Institute for Mining and Metallurgy, vol. 90, no. 10, pp. 257–273.
Laubscher, D.H., Taylor, H.W. 1976. The Importance of Geomechanics Classification of Jointed Rock Masses in Mining Operations. Proceedings of the Symposium on exploration for Rock Engineering. vol. 1, pp. 119–128. Johannesburg: A.A. Balkema.
Lowson, A.R., Bieniawski, Z.T. 2013. Critical Assessment of RMR based Tunnel Design Practices: A Practical Engineers Approach. Washington DC: Society for Mining, Metallurgy & Exploration. Minerals Council South Africa. 2024. Minerals Council South Africa Retrieved 04 11, 2024, from https://www.mineralscouncil.org. za/industry-news/publications/fact-sheets
Palmstrom, A. 2005. Measurements of and correlations between block size and rock quality designation (RQD). Tunnelling and Underground Space Technology, 20 March, pp. 362–377.
Pells, P.J., Bieniawski, Z.T., Hencher, S.R., Pells, S.E. 2017. Rock Quality Designation (RQD): time to rest in peace. Canadian Geotechnical Journal, vol. 54, no. 6, pp. 825–834.
Rehman, H., Ali, W., Naji, A.M., Kim, J., Abdullah, R.A., Yoo, H. 2018. Review of Rock-Mass Rating and Tunneling Quality Index Systems for Tunnel Design: Development, Refinement, Application and Limitation. Applied Sciences, vol. 8, 1250, pp. 1–27.
Roberts, M.K., Schweitzer, J.K. 1999. Geotechnical Areas Associated With the Ventersdorp Contact Reef, Witwatersrand Basin, South Africa. Journal of the Southern African Institute for Mining and Metallurgy, vol. 99, no. 3, pp. 157–166.
Ryder, J.A., Jager, A.J. 2002. A Textbook on Rock Mechanics for Tabular Hard Rock Mines (1st ed.). Johannesburg: The Safety in Mines Research Advisory Committee.
Stacey, T.R., Gumede, H. 2007. Measurement of Typical Joint Characteristics in South African Gold Mines and the use of these Characteristics in the prediction of rock falls. Journal of the Southern African Institute of Mining and Metallurgy, vol. 107, no. 5, pp. 335–344.
Toper, A.Z., Janse van Rensburg, A.L., Milev, A.M., Noble, B.R. 2003. Criteria for Preconditioning at Varying Stoping Widths in Different Geotechnical Areas (GAP 811). Johannesburg: CSIR Division of Mining Technology.
Watson, B.P. 2004. A Rock Mass Rating System for Evaluating Stope Stability on the Bushveld Platinum Mines. Journal of the Southern African Institute of Mining and Metallurgy, vol. 104, no. 4, pp. 229–238. u

We are committed to supplying metals needed to develop, sustain and improve our world
27-29 October 2025 — 9TH International PGM Conference
2025
PGM - Enabling a cleaner world
Sun City, Rustenburg, South Africa
Contact: Gugu Charlie Tel: 011 538-0238
E-mail: gugu@saimm.co.za
Website: http://www.saimm.co.za
27-29 October 2025 — Fourth International Slope Stability in Mining Conference
Vancouver Convention Centre, Vancouver, Canada
Website: https://bit.ly/4n3BuMP
16-22 November 2025 — The 12TH International Copper Conference (Copper 2025)
Phoenix, Arizona, USA
Website: https://www.extractionmeeting.org/Extraction2025/ Extraction2025/Copper2025/default.aspx
19-21 November 2025 — MineSafe Hybrid Conference and Industry Awards Day 2025
Safe Mines, Healthy Lives, and Sustainable Futures Emperors Palace Convention Centre
Contact: Camielah Jardine
Tel: 011 538-0237
E-mail: camielah@saimm.co.za
Website: http://www.saimm.co.za
2026
3-4 March 2026 — Tailings 2026—Where to Now?
Indaba Hotel, Spa and Conference Centre, Fourways
Contact: Gugu Charlie Tel: 011 538-0238
E-mail: gugu@saimm.co.za
Website: http://www.saimm.co.za
13-14 April 2026 — SANCOT Symposium 2026
Unlocking Africa’s Potential: Advances in Tunnelling in Civil Engineering and Mining
Southern Sun Rosebank
Contact: Gugu Charlie Tel: 011 538-0238
E-mail: gugu@saimm.co.za
Website: http://www.saimm.co.za
12 May 2026 — Re-Imagining Diversity and Inclusion Showcase 2026
Southern Sun Rosebank
Contact: Gugu Charlie Tel: 011 538-0238
E-mail: gugu@saimm.co.za
Website: http://www.saimm.co.za
26-28 May 2026 — SAIMM Pyrometallurgy International Conference 2026
Foundation of Competitiveness and Sustainability
CSIR International Convention Centre, South Africa
Contact: Gugu Charlie
Tel: 011 538-0238
E-mail: gugu@saimm.co.za
Website: http://www.saimm.co.za
24-25 June 2026 — Global Best Practices in Thickener and Dewatering Operations for Low-Grade and Complex
Deposits Conference 2026
Mintek, Randburg, Johannesburg
Contact: Gugu Charlie Tel: 011 538-0238
E-mail: gugu@saimm.co.za
Website: http://www.saimm.co.za
18-20 August 2026 — CAVING 2026
Ulaanbaatar, Mongolia
Website: https://www.acgcaving.com/
18-21 August 2026 — SAIMM Uranium Conference 2026
Swakopmund Hotel and Entertainment Centre, Swakopmund, Namibia
Contact: Gugu Charlie
Tel: 011 538-0238
E-mail: gugu@saimm.co.za
Website: http://www.saimm.co.za
22-25 September 2026 — XIX International Society for Mine Surveying Congress 2026
Century City, Cape Town
Contact: Gugu Charlie
Tel: 011 538-0238
E-mail: gugu@saimm.co.za
Website: http://www.saimm.co.za
29-30 September 2026 — 7TH Young Professionals Conference 2026
Mintek, Randburg, Johannesburg
Contact: Gugu Charlie
Tel: 011 538-0238
E-mail: gugu@saimm.co.za
Website: http://www.saimm.co.za
18-22 October 2026 — XXXII International Mineral Processing Congress 2026
Cape Town, South Africa
Contact: Camielah Jardine
Tel: 011 538-0237
E-mail: camielah@saimm.co.za
Website: http://www.saimm.co.za
4-6 November 2026 — Southern African Mine Water Conference 2026
Let’s Connect
Mintek, Randburg, Johannesburg
Contact: Gugu Charlie
Tel: 011 538-0238
E-mail: gugu@saimm.co.za
Website: http://www.saimm.co.za
The following organizations have been admitted to the Institute as Company Affiliates
acQuire Technology Solutions
AECI Mining Chemicals, a division of AECI Mining Ltd
African Pegmatite
Allied Furnace Consultants
AMIRA International Africa (Pty) Ltd
Anglo American Platinum Corporation
Anglogold Ashanti Ltd
Anton Paar Southern Africa
Arcus Gibb (Pty) Ltd
Becker Mining (Pty) Ltd
Bluhm Burton Engineering Pty Ltd
BSI Group South Africa
Buraaq mining Services (Pty) Ltd
Caledonia Mining South Africa
Carbocraft (Pty) Ltd
Castle Lead Works
CIGroup ACE Pty Ltd
DDP Specialty Products South Africa (Pty) Ltd
Digby Wells and Associates
EHL Consulting Engineers (Pty) Ltd
EKATO South Africa
Elbroc Mining Products (Pty) Ltd
Elderberry Trading
Epiroc South Africa (Pty) Ltd
Ex Mente Technologies (Pty) Ltd
Exxaro Resources Limited
FLSmidth Minerals (Pty) Ltd
G H H Mining Machines (Pty) Ltd
Geobrugg Southern Africa (Pty) Ltd
Glencore
Gravitas Minerals (Pty) Ltd
Hatch (Pty) Ltd
Herrenknecht AG
Impala Platinum Holdings Limited
IMS Engineering (Pty) Ltd
Ingwenya Mineral Processing
Ivanhoe Mines SA
M84 Geotech Pty Ltd
Malvern Panalytical (Pty) Ltd
Maptek (Pty) Ltd
Mech-Industries (Pty) Ltd
Micromine Africa (Pty) Ltd
Minearc South Africa (Pty) Ltd
Minerals Council of South Africa
MineRP Holding (Pty) Ltd
Mining Projection Concepts (Pty) Ltd
Mintek
MLB Investments CC
Modular Mining Systems Africa (Pty) Ltd
Murray & Roberts Cementation (Pty) Ltd
Optron (Pty) Ltd
Paterson & Cooke Consulting Engineers (Pty) Ltd
Pump and Abrasion Technologies (Pty) Ltd
Redpath Mining (South Africa) (Pty) Ltd
Rosond (Pty) Ltd
Roytec Global (Pty) Ltd
Rustenburg Platinum Mines Limited - Union
Salene Mining (Pty) Ltd
Schauenburg (Pty) Ltd
Sebotka (Pty) Ltd
SENET (Pty) Ltd
Sibanye Gold Limited
Solenis
Sound Mining Solution (Pty) Ltd
SRK Consulting SA (Pty) Ltd
Sulzer Pumps (South Africa) (Pty) Ltd
Tomra (Pty) Ltd
Trans-Caledon Tunnel Authority
Ukwazi Mining Solutions (Pty) Ltd
VBKOM Consulting Engineers
Weir Minerals Africa
Zutari (Pty) Ltd

INTERNATIONAL MINERAL PROCESSING CONGRESS 18 - 22 OCTOBER 2026 CAPE TOWN SOUTH AFRICA
We would like to invite you to attend the XXXII International Mineral Processing Congress in Cape Town, South Africa from 18 - 22 October 2026
IMPC 2026 will be hosted by the Southern African Institute of Mining and Metallurgy (SAIMM)


IMPC 2026 will be hosted by the Southern African Institute of Mining and Metallurgy (SAIMM). The SAIMM has been in existence for 130 years, having been established in 1894 as a ‘learned society’ to support mining and metallurgical professionals during the emergence and growth of the early South African minerals industry.
Mining is of great importance to Africa in general, and particularly to Southern Africa. Africa accounts for a major portion of the world’s mineral reserves and more than half of gold, platinum group metals, cobalt and diamonds. Southern Africa produces over two-thirds of Africa’s mineral exports by value.
IMPC 2026 will be hosted at the Cape Town International Convention Centre (CTICC). Since the inception of the CTICC in 2003, Cape Town has been proudly the number one destination for conferences in Africa, according to the latest International Congress and Convention Association (ICCA) statistics.
Cape Town, the “Mother City”, is the oldest city in South Africa and has a cultural heritage spanning more than 300 years. Cape Town is a modern, cosmopolitan city and is often rated as one of the premier world holiday destinations. The city has a large range of hotels & guest houses and modern transport infrastructure. The city has numerous activities & attractions, including Table Mountain, Robben Island, Cape Point, the Castle, V&A Waterfront, world class beaches, wine farms, nature reserves, scenic drives, hiking, whale watching, shark cage diving and fine dining.
5-7 APRIL 2027 – CONFERENCE
8-9 APRIL 2027 – TECHNICAL VISIT



We are excited to be hosting Hoist & Haul 2027 in beautiful Cape town, South Africa. Mining is a global industry, with mining companies owning mines across the world. The large engineering companies and suppliers who provide design and equipment to the mines also operate internationally. So we hope to welcome delegates and accept technical papers from a wide spectrum of different countries.
As the conference is being held in South Africa, we will also aim to highlight South African achievements in mine shaft hoisting, and technical visits will showcase excellence in current South African mining operations.
Fifty years ago, the world, led by South Africa, was at the dawn of ultradeep mining. BMR hoists were being developed, accepted factors of safety were being challenged and updated on a more rational basis, much deeper single hoist shafts were replacing multiple shaft systems. These were exciting times for hoisting and gave birth to the Hoist and Haul series of conferences, in 1973 in Johannesburg, under the title “Hoisting: Men, Materials and Minerals”.
Similar challenges exist today. Exploration has proved significant ore bodies at depths exceeding 4000 m. However, the cost and time required for extraction using current hoisting technology makes their exploitation unattractive, emphasizing the need for faster, more costefficient hoisting systems.
But a whole new set of challenges has arisen from increasing societal demands for safety, sustainability, energy efficiency and environmental responsibility. And, whilst the world cannot develop and thrive without mining products, these demands are likely to escalate rapidly over the next fifty years.
Mines that have been in operation for fifty years must upgrade and retrofit hoisting system to adapt to changing demands, and planning for new mines must aim to anticipate what will be necessary if they are to be socially acceptable from inception to closure in fifty years’ time.
