
Presidential Address
Beyond effort-driven operations: Building people-centric operating models for mining’s future by
G.R. Lane


Beyond effort-driven operations: Building people-centric operating models for mining’s future by
G.R. Lane


Gary Lane was born in Queenstown in the Eastern Cape in 1968. He matriculated from Randpark High School in 1986, where he served as head boy. A talented sportsman, he played rugby and excelled in athletics, winning the victor ludorum in the 100-metre event on several occasions.
With the support of an Anglo American Scholarship, Gary studied Civil Engineering at the University of the Witwatersrand, graduating with a Bachelor of Science degree in 1990. After completing his compulsory national service, he began his professional career with Anglo American in projects, contributing to several major capital developments. These included serving as Resident Engineer for the construction of Namakwa Sands on South Africa’s West Coast, Project Engineer for the Sadiola Hill Gold Mine in Mali, Project Manager for the Bulk Acid Handling Facility at the Jwaneng Aquarium for Debswana in Botswana, and Project Engineer for the Combined Treatment Plant for De Beers in Kimberley.


After a decade in these technical roles, Gary broadened his expertise by completing a Master of Business Administration through Bond University in Australia in 2001. That same year, he transitioned into entrepreneurship and co-founded Cyest Corporation (now BSC Global), where he established and built the mining practice. His work focused on mine optimisation, scenario planning, techno-economic modelling, value driver trees, and software development. He also led a pioneering syndicate driven development programme to develop an innovative top-down mine planning solution.
In 2016, Gary co-founded the Vuuma Group of Companies with Harry Sinko. Guided by systems thinking and a people-centred philosophy, the group developed a comprehensive service offering encompassing business improvement skills and capability development using a physical mining value stream simulation, rapid operational improvement using Lean Six Sigma and theory of constraints, and the design of people-centric operating models across industries worldwide.


Throughout his career, Gary has drawn inspiration from industry leaders and diverse leadership styles, which have shaped his own approach. He is particularly passionate about developing young professionals and remains committed to mentorship and leadership development.
Gary has also provided significant service to the Southern African Institute of Mining and Metallurgy (SAIMM). He became a member in 2004, contributing actively to conference organising committees and presenting more than ten technical papers. In 2016, he was elected to the SAIMM Council, and the following year he was appointed Chairperson of the Technical Programmes Committee for Mining, a role he held until 2025.
Beyond his professional commitments, Gary is an enthusiastic mountain biker who has competed in stage races across South Africa.
He also enjoys road trips and outdoor adventures, with highlights including kayaking on Yellowstone Lake, exploring the swamplands of Louisiana in the United States and a 5-day unsupported rafting trip down the orange river with his daughter Chloe, who is currently training to become a field guide.

OFFICE BEARERS AND COUNCIL FOR THE 2025/2026 SESSION
President G.R. Lane
President Elect
T.M. Mmola
Senior Vice President
M.H. Solomon
Junior Vice President
S.J. Ntsoelengoe
Incoming Junior Vice President
M.C. Munroe
Immediate Past President
E. Matinde
Honorary Treasurer
W.C. Joughin
Ordinary Members on Council
W. Broodryk M.A. Mello
A.D. Coetzee K. Mosebi
Z. Fakhraei M.J. Mothomogolo
B. Genc S.M. Naik
F. Lake G. Njowa
K.M. Letsoalo S.M. Rupprecht
S.B. Madolo A.T. van Zyl
Co-opted Council Members
K.W. Banda
M.L. Wertz
Past Presidents Serving on Council
N.A. Barcza W.C. Joughin
R.D. Beck C. Musingwini
Z. Botha J.L. Porter
V.G. Duke M.H. Rogers
I.J. Geldenhuys G.L. Smith
R.T. Jones
M.L. Wertz – TP Mining Chairperson
W. Broodryk – TP Metallurgy Chairperson
C.T. Chijara – YPC Chairperson
T.S. Ndlela – YPC Vice Chairperson
Branch Chairpersons
Botswana K. Mosebi
DRC Vacant
Johannesburg A. Hefer
Limpopo M.S. Zulu
Namibia T. Aipanda
Northern Cape Vacant
North West T. Nsimbi
Pretoria P.G.H. Pistorius
Western Cape M.H. Solomon
Zambia N.M. Kazembe
Zimbabwe L. Shamu
Zululand Vacant
*Deceased
* W. Bettel (1894–1895)
* A.F. Crosse (1895–1896)
* W.R. Feldtmann (1896–1897)
* C. Butters (1897–1898)
* J. Loevy (1898–1899)
* J.R. Williams (1899–1903)
* S.H. Pearce (1903–1904)
* W.A. Caldecott (1904–1905)
* W. Cullen (1905–1906)
* E.H. Johnson (1906–1907)
* J. Yates (1907–1908)
* R.G. Bevington (1908–1909)
* A. McA. Johnston (1909–1910)
* J. Moir (1910–1911)
* C.B. Saner (1911–1912)
* W.R. Dowling (1912–1913)
* A. Richardson (1913–1914)
* G.H. Stanley (1914–1915)
* J.E. Thomas (1915–1916)
* J.A. Wilkinson (1916–1917)
* G. Hildick-Smith (1917–1918)
* H.S. Meyer (1918–1919)
* J. Gray (1919–1920)
* J. Chilton (1920–1921)
* F. Wartenweiler (1921–1922)
* G.A. Watermeyer (1922–1923)
* F.W. Watson (1923–1924)
* C.J. Gray (1924–1925)
* H.A. White (1925–1926)
* H.R. Adam (1926–1927)
* Sir Robert Kotze (1927–1928)
* J.A. Woodburn (1928–1929)
* H. Pirow (1929–1930)
* J. Henderson (1930–1931)
* A. King (1931–1932)
* V. Nimmo-Dewar (1932–1933)
* P.N. Lategan (1933–1934)
* E.C. Ranson (1934–1935)
* R.A. Flugge-De-Smidt (1935–1936)
* T.K. Prentice (1936–1937)
* R.S.G. Stokes (1937–1938)
* P.E. Hall (1938–1939)
* E.H.A. Joseph (1939–1940)
* J.H. Dobson (1940–1941)
* Theo Meyer (1941–1942)
* John V. Muller (1942–1943)
* C. Biccard Jeppe (1943–1944)
* P.J. Louis Bok (1944–1945)
* J.T. McIntyre (1945–1946)
* M. Falcon (1946–1947)
* A. Clemens (1947–1948)
* F.G. Hill (1948–1949)
* O.A.E. Jackson (1949–1950)
* W.E. Gooday (1950–1951)
* C.J. Irving (1951–1952)
* D.D. Stitt (1952–1953)
* M.C.G. Meyer (1953–1954)
* L.A. Bushell (1954–1955)
* H. Britten (1955–1956)
* Wm. Bleloch (1956–1957)
* H. Simon (1957–1958)
* M. Barcza (1958–1959)
* R.J. Adamson (1959–1960)
* W.S. Findlay (1960–1961)
* D.G. Maxwell (1961–1962)
* J. de V. Lambrechts (1962–1963)
* J.F. Reid (1963–1964)
* D.M. Jamieson (1964–1965)
* H.E. Cross (1965–1966)
* D. Gordon Jones (1966–1967)
* P. Lambooy (1967–1968)
* R.C.J. Goode (1968–1969)
* J.K.E. Douglas (1969–1970)
* V.C. Robinson (1970–1971)
* D.D. Howat (1971–1972)
* J.P. Hugo (1972–1973)
* P.W.J. van Rensburg (1973–1974)
* R.P. Plewman (1974–1975)
* R.E. Robinson (1975–1976)
* M.D.G. Salamon (1976–1977)
* P.A. Von Wielligh (1977–1978)
* M.G. Atmore (1978–1979)
* D.A. Viljoen (1979–1980)
* P.R. Jochens (1980–1981)
* G.Y. Nisbet (1981–1982)
A.N. Brown (1982–1983)
* R.P. King (1983–1984)
J.D. Austin (1984–1985)
* H.E. James (1985–1986)
H. Wagner (1986–1987)
* B.C. Alberts (1987–1988)
* C.E. Fivaz (1988–1989)
* O.K.H. Steffen (1989–1990)
* H.G. Mosenthal (1990–1991)
R.D. Beck (1991–1992)
* J.P. Hoffman (1992–1993)
* H. Scott-Russell (1993–1994)
J.A. Cruise (1994–1995)
D.A.J. Ross-Watt (1995–1996)
N.A. Barcza (1996–1997)
* R.P. Mohring (1997–1998)
J.R. Dixon (1998–1999)
M.H. Rogers (1999–2000)
L.A. Cramer (2000–2001)
* A.A.B. Douglas (2001–2002)
* S.J. Ramokgopa (2002-2003)
T.R. Stacey (2003–2004)
F.M.G. Egerton (2004–2005)
W.H. van Niekerk (2005–2006)
R.P.H. Willis (2006–2007)
R.G.B. Pickering (2007–2008)
A.M. Garbers-Craig (2008–2009)
J.C. Ngoma (2009–2010)
G.V.R. Landman (2010–2011)
J.N. van der Merwe (2011–2012)
G.L. Smith (2012–2013)
M. Dworzanowski (2013–2014)
J.L. Porter (2014–2015)
R.T. Jones (2015–2016)
C. Musingwini (2016–2017)
S. Ndlovu (2017–2018)
A.S. Macfarlane (2018–2019)
M.I. Mthenjane (2019–2020)
V.G. Duke (2020–2021)
I.J. Geldenhuys (2021–2022)
Z. Botha (2022-2023)
W.C. Joughin (2023-2024)
E. Matinde (2024-2025)
Editorial Board
S.O. Bada
P. den Hoed
I.M. Dikgwatlhe
M. Erwee
B. Genc
A.J. Kinghorn
D.E.P. Klenam
D.F. Malan
D. Morris
P.N. Neingo
S.S. Nyoni
M. Onifade
M. Phasha
P. Pistorius
P. Radcliffe
N. Rampersad
Q.G. Reynolds
I. Robinson
S.M. Rupprecht
Past President’s serving on the Editorial Board
R.D. Beck
R.T. Jones
W.C. Joughin
C. Musingwini
T.R. Stacey
S. Ndlovu*
*International Advisory Board member International Advisory Board members
R. Dimitrakopolous
R. Mitra
A.J.S. Spearing
E. Topal
D. Tudor
F. Uahengo
D. Vogt
Editor/Chairperson of the Editorial Board
R.M.S. Falcon
Typeset and Published by
The Southern African Institute of Mining and Metallurgy
PostNet Suite #212 Private Bag X31
Saxonwold, 2132
E-mail: journal@saimm.co.za
Printed by Camera Press, Johannesburg
Advertising Representative
Barbara Spence
Avenue Advertising

Journal Comment: Safety and the human dimension by M. Onifade ..................................................................
Profiles of the Branch Chairpersons
Presidential Address: Beyond effort-driven operations: Building people-centric operating models for mining’s future by G.R. Lane ...................................................................
THE INSTITUTE, AS A BODY, IS NOT RESPONSIBLE FOR THE STATEMENTS AND OPINIONS ADVANCED IN ANY OF ITS PUBLICATIONS.
Copyright© 2025 by The Southern African Institute of Mining and Metallurgy. All rights reserved. Multiple copying of the contents of this publication or parts thereof without permission is in breach of copyright, but permission is hereby given for the copying of titles and abstracts of papers and names of authors. Permission to copy illustrations and short extracts from the text of individual contributions is usually given upon written application to the Institute, provided that the source (and where appropriate, the copyright) is acknowledged. Apart from any fair dealing for the purposes of review or criticism under The Copyright Act no. 98, 1978, Section 12, of the Republic of South Africa, a single copy of an article may be supplied by a library for the purposes of research or private study. No part of this publication may be reproduced, stored in a retrieval system, or transmitted in any form or by any means without the prior permission of the publishers. Multiple copying of the contents of the publication without permission is always illegal. U.S. Copyright Law applicable to users In the U.S.A. The appearance of the statement of copyright at the bottom of the first page of an article appearing in this journal indicates that the copyright holder consents to the making of copies of the article for personal or internal use. This consent is given on condition that the copier pays the stated fee for each copy of a paper beyond that permitted by Section 107 or 108 of the U.S. Copyright Law. The fee is to be paid through the Copyright Clearance Center, Inc., Operations Center, P.O. Box 765, Schenectady, New York 12301, U.S.A. This consent does not extend to other kinds of copying, such as copying for general distribution, for advertising or promotional purposes, for creating new collective works, or for resale.
Honorary Legal Advisers
M H Attorneys
Auditors
Genesis Chartered Accountants Secretaries
The Southern African Institute of Mining and Metallurgy 7th Floor, Rosebank Towers, 19 Biermann Avenue, Rosebank, 2196
PostNet Suite #212, Private Bag X31, Saxonwold, 2132 E-mail: journal@saimm.co.za
Telephone (011) 463-7940 . E-mail: barbara@avenue.co.za ISSN 2225-6253 (print) . ISSN 2411-9717 (online)


Thermochemical evaluation of elemental phosphorus recovery from sewage sludge by A. Kotze, D. Messina, Y. Cryns, E. Nagels, S. Arnout ...................................................................
The FlashPhos process aims to recover white phosphorus (P4) from sewage sludge by drying, flash combustion/gasification, and carbothermic refining steps. This study evaluates the material behaviour of sewage sludge ash melting and reduction in a refining furnace for the novel FlashPhos process. A clean slag is produced in the process free of heavy metals making it suitable to be used as a cement-like binder material. The main heavy metals that co-evaporate with the phosphorus are Zn, Pb, As, Sb, and Sn. Additional processing steps will be required to remove these to produce a pure P4 product.
Testing sample representivity using particle size distribution by R.C.A. Minnitt, P. Minkkinen ......................................................................................
Sampling blasthole cuttings poses challenges due to large material volumes, segregation, and uneven settling of particles in dense gold bearing ores. Commonly used sampling methods, such as spear or sectoral sampling, may lack representativeness. A case study demonstrates this approach by using a 6.005 kg benchmark sample to assess two additional samples (1 kg and 5 kg), highlighting particle size distribution’s role in detecting sampling errors and refining protocols. An example of three test samples collected from reverse circulation drill cuttings compared to a standard reference sample is presented to illustrate a quality assurance/quality control procedure for reverse circulation drilling.
Novel integrated holistic healthy human framework: A special lens on the minerals industry by V. Morar, U. Govender, B. Genc, G.L. Smith ..........................................................................
This paper presents a novel holistic healthy human framework for C-suite executives and senior leaders in the minerals industry. The value-add of the framework centres around the integration of inner holistic health and interpersonal holistic health to support and enhance environment, social, and governance transformation, with a focus on the social enterprise. Insights were gleaned from interviews with 10 C-suite executives, each with over twenty years of experience in mining or business leadership.
Using the Aegis underground drill and blast analyser to optimise drill patterns: A case study by M.J. Nong, E. Uludag, P.J.K Leeuw
This study investigated persistent fragmentation problems at a longhole stoping operation that suffered from simultaneous oversized rock blockages in 300 mm × 300 mm grizzlies and excessive fines. Fifty-one muckpile images from five blasted stopes were analysed with Split-Desktop. Existing drill patterns were then evaluated with the Aegis underground software. The methodology illustrates how integrated image analysis and modelling software can effectively diagnose and address fragmentation issues, particularly in underground longhole mining where challenging blasting conditions require a balance between achieving optimal fragmentation and maintaining stope stability. This approach offers a cost-effective pathway to improving comminution performance in deep-level mines.
Enhancing performance metrics of an electrical-powered subsea robotic dredging crawler across varied inclination angles by M.O. Ojumu, A.K. Raji, E.F. Orumwense
This research paper introduces a novel passive method for ocean mining using an electric-powered robotic subsea dredging crawler designed to operate in various subsea conditions. The experiment aimed to determine the maximum velocity, torque, and efficiency of the crawler at different angles of inclination. The results of this study demonstrate a quadratic relationship between driving performance and inclination angle. This can be used to optimise the electric-powered robotic subsea dredging crawler’s performance for future ocean mining robot drive applications.
543
Minable coal reserve estimation by incorporating tonnage and calorific value uncertainties by suc-cessive multiple-point and two-point geostatistical simulation algorithms by F. Suparno, A. Paithankar, S. Chatterjee 555
This research delves into the domain of geological uncertainties, with a specific focus on calorific value, aiming to numerically characterise resources and reserves within an open-pit coal mine situated in Indonesia. To quantify resources, the coal seam geometry underwent simulation via a multi-point geostatistical technique. To simulate CV, 50 realisations were generated for each simulated coal seam. Within this final pit, the average stripping ratio was 1.62, coupled with a CV value of 6,019.66 kcal/kg. When juxtaposed with the deterministic model, the findings underscore that the stochastic ultimate pit delineates a more expansive excavation, accompanied by a heightened undiscounted cash flow.


ining has historically been one of the most hazardous industries, a reality that has shaped the sector’s reputation for high risks and low margins of safety. Despite decades of progress in mechanisation, automation, improved ventilation, and the widespread adoption of personal protective equipment, accidents and occupational diseases remain serious and persistent concerns. Underground mining poses unique challenges because workers are confined to narrow spaces where they are exposed to unpredictable geological conditions, poor visibility, high temperatures, and dangerous gases. Beyond these acute risks are chronic health conditions that develop over time, including silicosis from prolonged inhalation of respirable dust, occupational hearing loss from exposure to high levels of noise, and musculoskeletal disorders resulting from heavy manual handling. The persistence of these problems highlights the complexity of mining safety and health, showing that technological improvements alone cannot eliminate them.
What is particularly striking is that many of these hazards are not new. Historical records show that mine heat stress, for instance, was a well-recognised occupational hazard in South African gold mines by the mid-twentieth century, where deeplevel mining exposed workers to extreme geothermal heat. Decades later, despite significant research into mine cooling systems, refrigeration, and ventilation optimisation, heat stress remains a major challenge in ultra-deep mines worldwide. Likewise, dust-related diseases such as silicosis and pneumoconiosis were documented as early as the nineteenth century, yet miners in jurisdictions with strict regulation, including Australia and the United States, continue to suffer from such conditions. In some coal mining regions, cases of “black lung” have even re-emerged after being thought nearly eradicated. This persistence suggests that while engineering controls and medical surveillance programmes are critical, they cannot succeed without rigorous enforcement of standards, strong occupational health policies, and most importantly, a cultural commitment to safety.
Indeed, the evidence shows that accidents and diseases in mining often result from organisational and systemic failures as much as from technical limitations. For example, lapses in enforcement, inadequate training, or production pressures can undermine the effectiveness of safety measures. Worker participation is therefore vital; miners must not only be protected by technology but also empowered to identify risks, report unsafe practices, and influence decision-making without fear of reprisal. A culture of safety must be nurtured at every level, from corporate leadership down to the underground face worker. Without this cultural shift, even the most advanced safety systems risk becoming superficial or poorly implemented.
The rise of automation and digital technologies in mining presents a new chapter in this long struggle between hazard and safety. On one hand, the deployment of autonomous haulage systems, remote-controlled drilling equipment, and advanced real-time monitoring systems offers unprecedented opportunities to remove workers from high-risk zones. Technologies such as wearable sensors can track miner fatigue, monitor gas levels, and even detect hazardous movements, thereby reducing accidents. Drones and robotic inspection devices can be sent into dangerous areas before humans, minimising exposure to unknown risks. These developments, if integrated with strong safety systems, have the potential to revolutionise mining health and safety.
On the other hand, these same technologies introduce new challenges. Automation can displace traditional jobs, leading to unemployment or underemployment in mining-dependent communities. The shift toward digital mining requires new skill sets, including expertise in programming, data analysis, and systems management, which many mining regions, especially in developing countries, are not equipped to provide. Without adequate reskilling programmes and community investment, technological advances may exacerbate social inequality, leaving behind the very workers they were meant to protect. Furthermore, automation can introduce new categories of risks, such as cybersecurity vulnerabilities in mine control systems or over-reliance on complex technologies that can fail under certain conditions.
Safety in mining, therefore, cannot be considered in isolation from broader social justice concerns. Protecting workers underground must go hand-in-hand with protecting the wellbeing of mining communities on the surface.
Social sustainability to ensure that workers have meaningful employment, access to healthcare, education, and economic opportunities remains central to the true advancement of mining safety. Ultimately, while technology can reduce exposure to hazards, it is strong regulatory enforcement, cultural transformation, and inclusive community engagement that will determine whether the mining industry can overcome its long history of danger and fulfill its responsibility to both workers and society.
M. Onifade

Botswana Branch
K. Mosebi
Kabelo Mosebi is a Mining Engineer by profession, Managing Director of Blue Horizon Resources (Pty) Ltd., and Director of both Pineshare (Pty) Ltd and Broad Horizon Group. Mr. Mosebi is married to Mrs. Ludo Mosebi and the father of three daughters. He identifies his personal purpose as being a helper and possessing a very strong belief system. The person purpose forms part of a strong personal philosophy that has influenced Mr. Mosebi’s success in both professional and social aspects of life.
Mr. Mosebi holds a Bachelor of Applied Science (BASc) Degree in Mineral Engineering (Mining) from the University of Toronto, Canada, and graduated in 2010. He has more than thirteen years working experience in the mining industry. He previously worked for Debswana Diamond Company and AECI Mining at Jwaneng Mine from 2010 to 2021. During that time, he participated in the Final Wall Control Project, which improved the final wall compliance score from approximately 20% to 90%. He was appointed as a Mining Engineer at Debswana, Jwaneng Mine in 2015 and rose through the different ranks to the position of Mining Manager at the same time he left to establish his own firm. He was part of the execution of the Dip Slope Mining Project, which ensured the stability of the Cut 8 Slopes, which is viewed as one of the unique mining methods. He was part of the team that presented a technical paper for publication on Dip Slope Mining to a worldwide audience at the Slope Stability Symposium, which was held in Spain in April 2018. Preceding that, he was involved in a project to re-design Cut 8 and optimize the slopes, the results of which saved the Cut 8 business case at Jwaneng Mine.
While studying in Canada, thirteen years ago, Mr. Mosebi developed a deep desire to plough back into the community, following his involvement with community activities like several on-campus clubs. This involved being a Vice-President of the National Society of Black Engineers (NSBE) for the University of Toronto chapter in 2009 – 2010.
Back home in Botswana, he shared his vision with friends, and they founded a society called the Youth Empowerment Society (YES), which was registered with the Botswana Registrar of Societies in April 2008. YES targets youth (aged 13 to 35) in and outside of school communities to address the declining educational performance, a decline in employability skills, an increase in youth violence, and a concerning number of youth infected and affected by HIV and AIDS in Botswana.
Mr Mosebi has developed a great desire to address these issues and that is why he is here to speak up and make a difference in the lives of those who have potential to lead the nation, both today and tomorrow. He is Council member of The Southern African Institute of Mining and Metallurgy (SAIMM) and a member of the Australasian Institute of Mining and Metallurgy (AusIMM). u

Johannesburg Branch
A. Hefer
Amanda Hefer is a metallurgical engineer with over two decades of experience, particularly in metallurgical laboratories and refineries in precious metals. She currently serves as the Senior Manager of Metallurgical Services at Rand Refinery (Pty) Ltd, where she has held various positions since July 2008. Throughout her tenure, she has reached numerous milestones, including the establishment of a stateof-the-art metallurgical laboratory. She aimed to set up a comprehensive facility that encompasses all fields of metallurgy related to refining, fabrication and smelting processes. Her efforts in implementing cuttingedge equipment and technologies led to higher technical standards and accelerated understanding in these areas.
While continually contributing to the industry, Amanda is busy completing her MSc thesis at the University of Witwatersrand. Additionally, she actively participates in industry conferences and research, shares her knowledge and insights with peers, and mentors the next generation of engineers. Amanda is dedicated to fostering a technologically advanced and collaborative environment in the workplace and building relationships with tertiary institutions for technical and academic input within the metallurgy field. u

Limpopo Branch
M. S. Zulu
Steven Zulu is an accomplished Metallurgical Technical Manager with extensive expertise in extraction metallurgy and technology management. He holds a National Diploma and a B.Tech. in Extraction Metallurgy from the University of Johannesburg, BSc (Hons) and M.Sc. in Technology and Innovation Management from the University of Pretoria, B.Com Economics and B.Com Economics (Hons) from Unisa. Currently, he is pursuing a Ph.D. in Management of Technology & Innovation.
Steven’s career is marked by significant contributions to the mining and metallurgical sectors. As a legal appointee for Safety, Health, and Environmental compliance, he has overseen critical operations including production, metal accounting, budgeting, human capital, tailings dam management and cost reduction initiatives. His leadership in metallurgical optimisation and recovery improvement projects has yielded substantial results, including the successful design and commissioning of the MIG and Chrome Recovery Plants at Modikwa Concentrator.
In academia, Steven is deeply involved in mentoring and supervising graduate students, chairing career development panels, and collaborating with various academic institutions. He has organised multiple colloquia and symposia for professionals in the mining and metallurgy fields.
His research interests have culminated in several published papers, focusing on the strategic competitiveness of the South African mining industry in the context of the Fourth Industrial Revolution and digital transformation technological innovations. Steven’s publications highlight the importance of organisational capabilities in adopting new technologies and advancing the sector.
A member of multiple professional organisations, including the South African Institute of Mining and Metallurgy and the Mine Metallurgical Managers Association, he currently serves as the Chair of the SAIMM Limpopo Branch. Steven’s commitment to professional development is evident in his active participation in workshops, courses, and conferences.
With a strong foundation in metallurgy and a keen understanding of technology management, Steven Zulu continues to be a leading figure in his field, dedicated to innovation and excellence in metallurgical practices. u

T. Aipanda
Tomas boasts more than 12 years’ experience in open-pit hardrock mining. He has led in various capacities within mining, spanning areas such as drilling, blasting, planning (short and long term), and production management. He is currently serving as a production superintendent at Swakop Uranium, where he is responsible for leading and managing a sizable team comprising of various disciplines within the mining operation. u

T. Nsimbi
Thandekile Nsimbi is an accomplished Performance Improvement Manager at Impala Platinum’s PGM smelter with nearly two decades of experience in mining and metallurgy. She is a qualified Metallurgical Engineer with extensive expertise in production management, operational excellence, process optimisation, and continuous improvement.
Her career spans leadership roles across leading organisations such as Impala Platinum, Jubilee Metals, Afarak Mogale, Samancor, and Arcelor Mittal, where she has successfully driven strategic initiatives, resource optimisation, and efficiency improvements in smelter and plant operations.
She has served in committee and council roles including the Furnace Council Committee, FRCP Steering Committee (Hazardous Materials Champion), and the Process Improvement Council, reflecting her strong industry presence and contribution to advancing metallurgical practices.
Thandekile holds a BSc (Hons) Applied Science in Metallurgy (University of Pretoria), a BTech in Metallurgical Engineering (TUT), and a National Diploma in Extraction Metallurgy (UJ), complemented by executive training at GIBS and professional certifications such as Six Sigma Green Belt. She is currently studying towards a Postgraduate Diploma in Business Administration at GIBS, further strengthening her strategic management and leadership skills.
Recognised for her leadership, problem-solving ability, and technical expertise, she is passionate about fostering a culture of excellence, safety, and sustainability in metallurgical operations. Her vision is to drive innovation and deliver long-term value in the mining and metals sector.

Pretoria Branch
P.G.H. Pistorius
Pieter Pistorius was born in, what is now known as Modimolle, in the Limpopo Province. He studied at the University of Pretoria and at Sheffield University. He attained a PhD degree in Phase Transformation Behaviour of 12% Cr Steels at the University of Pretoria. He held various positions in the manufacturing industry before joining the Department of Materials Science and Metallurgical Engineering at the University of Pretoria for a second time in 2015. He is responsible for undergraduate, and postgraduate teaching and research in welding engineering. He is a Fellow of the SAIMM, a registered professional metallurgical engineer, and an international welding engineer. u

Zambia Branch
N.M. Kazembe
Nathan Mukulakasuba Kazembe is a seasoned Mining Engineer and senior executive with over 15 years of experience driving excellence in mining project engineering and operations management across Africa. He currently serves as the Country Manager for Zambia at Rolls-Royce Solutions Africa , leveraging his extensive industry background to deliver high-impact power solutions. Nathan is also a dynamic entrepreneur, acting as Director and Co-founder of K-Squared, a project engineering startup.
His professional stature is demonstrated by his fellowships and memberships, including being a Fellow of the Engineering Institute of Zambia (EIZ), a member of the Chartered Institute of Arbitrators (CIArb), and current Branch Chair for Zambia for the Southern African Institute of Mining and Metallurgy (SAIMM) .
Nathan holds a BEng in Mining Engineering and an MBA from the University of Zambia (UNZA), complemented by a Postgraduate Diploma in Project Management from the University of Stellenbosch Business School. He is currently advancing his expertise through a Doctor of Business Administration (DBA) program. u

Zimbabwe Branch
L. Shamu
Lloys is a professionally qualified Process Engineer with over 30 years’ experience in Mineral Processing, Pyrometallurgy, and Hydrometallurgy. He is currently employed as Head Processing at Mimosa Platinum Mine in Zimbabwe. His experience spans across project management, metallurgical testing, flowsheet/ process development, plant design, starting up of new mining projects, expanding and commissioning of new mining operations, and managing existing ones. Lloyd has occupied different operational and technical roles, from plant/concentrator/projects/process leadership, up to executive roles.
He has gained excellent experience in the extraction of precious metals, base metals, and chrome smelting from working at mines, smelters, and being part of new projects. His management skills have been enhanced by having to manage across disciplines and in multicultural environments, both locally and regionally.
Lloyd serves on a few industrial boards for tertiary institutions in Zimbabwe, and is currently the Board Chairperson for the National University of Science and Technology (NUST) Zimbabwe, Department of Chemical Engineering.
He is a member of the Zimbabwe Institution of Engineers, member of SAIMM, and a registered professional engineer with the Engineering Council of Zimbabwe.
Lloyd is married to Tracy, and they have three boys, Leon Nicholas, Lennon Takudzwa and Ryan Kudzaiishe. u

by G.R. Lane
Affiliation:
1Vuuma Collaborations, South Africa
Correspondence to:
G.R. Lane
Email: glane@vuuma.com
Dates:
Received: 31 Oct. 2024
Revised: 8 May 2025
Accepted: 21 Jul. 2025
Published: September 2025
How to cite:
Lane, G.R. 2025. Presidential Address: Beyond effort-driven operations: Building people-centric operating models for mining’s future. Journal of the Southern African Institute of Mining and Metallurgy, vol. 125, no. 9, pp. 495–500
DOI ID: https://doi.org/10.17159/2411-9717/2025/2025
My opportunity to serve as President of the prestigious Southern African Institute of Mining and Metallurgy (SAIMM) was made possible by an Anglo American scholarship 39 years ago—a pivotal moment that set me on a career path spanning various roles and start-up ventures in the mining industry. Over the past decade, I have been privileged to broaden my experience by consulting across diverse industries globally. This exposure revealed something profound: what I had previously considered mining-specific challenges are, in fact, universal across many sectors. At its core, a mining operation is a complex system of interconnected activities—from exploration through mining operations like drill and blast, load and haul, to beneficiation, and outbound logistics. My cross-industry work has clearly shown that diverse sectors, such as chocolate manufacturing, tissue paper production, toilet paper converting facilities, labgrown diamonds, or high-tech equipment lifecycle management, all rely on value streams of interconnected activities to transform products. The objective is to maximise throughput while effectively managing performance variability. The primary difference lies solely in the specific technical expertise required for each industry, such as chemical, mining, processing, or metallurgical engineering.
Across all these industries, I have observed a consistent pattern, that is, performance is primarily driven by individual efforts, where people react and work diligently as situations unfold in real-time. General managers and their teams often operate tactically, focusing on explaining yesterday’s poor performance rather than proactively setting up operations for success. This often resembles an ‘‘under-7s soccer match’’, with everyone chasing the ball. The common response to issues is to add more ad hoc meetings. This effort-driven organisational behaviour persists regardless of whether operations are greenfield digital manufacturing facilities, advanced digital mines with advanced process control, or operations run on paper and Excel spreadsheets for data acquisition. Paradoxically, more real-time data can lead to increased data noise, greater indecision, and sometimes, lower performance. Despite value streams often operating significantly below capacity, organisations continue to invest heavily in additional equipment or in ‘‘glossy brochure promises’’ of Industry 4.0 digital technology and real-time data solutions, which frequently fail to deliver value.
This leads to a critical question: Have we underinvested in our most valuable resource— people? Even Tesla faced this challenge with their underperforming fully automated Model X facility. We must shift our focus to designing the ecosystem, or operating model, of our organisations. This extends beyond the traditional triad of people, process, and technology, and moves beyond simplistic views of change management. Artificial Intelligence (AI) has the potential to add significant value, but it also introduces another layer of complexity into designing the organisation of the future.
My full presidential address below at the SAIMM AGM discussed the symptoms of an effort-driven organisation and covered the fundamental building blocks and requirements of an operating model, including recommendations on implementing a people-centric approach.
Keywords
people-centric, operating model, value stream optimisation, mining, technology, change management, Mine4Future
Introduction
My journey to this perspective
I share this perspective as it is important to our young professionals as they are the future leaders and their career journey and choices along the way shape their experience and capabilities.
My career in mining began with an Anglo American scholarship in 1985, leading to a BSc in Civil Engineering in 1990. I started as a bright-eyed, bushy-tailed engineer with plenty of theory but
little practical experience. For 10 years at Anglo American, I was fortunate to be involved in project management of multiple new mine developments across Africa, even building a multi-million dollar mine in Mali with only satellite phones and fax machines and no email. After a decade, I pursued an MBA, which broadened my understanding beyond engineering and led me to co-found a mining consulting start-up. This venture grew to over one hundred people and focused on mine optimisation, techno-economic modelling, BI dashboarding, and software development, aiming to add value through top-down and advanced scenario planning and economic modelling. However, I reached a point where I questioned if we were truly adding sustainable value. We saw value while our consultants were on site when we directly used the technology, but it was not sustainable. This prompted a critical question: ‘‘What am I missing and what are other industries doing that we can learn from?’’
My research in 2016 revealed that despite sophisticated solutions, global mining productivity (multi-factor productivity, or MFP) had declined by as much as 50% over the preceding decade, even with innovative technologies and sophisticated software systems. In contrast, the motor industry saw a 300% increase in MFP, with Toyota leading the way through its Total Productive Maintenance (TPM) methodology, which emphasises systems thinking and an integrated understanding of the value stream. This stark contrast was a pivotal point for me, leading me to delve deeper into skills development, systems thinking, Lean Six Sigma, Theory of Constraints, and the concept of integrated operating models.
Over the past decade, I have had the privilege to work across multiple industries globally, gaining insights into challenges that are not unique to mining.
The pervasive challenge: The effort-driven organisation At its core, a mining operation, much like any other industry, is a value stream of interconnected activities, such as drill, blast, load, haul, crush, screen, and process. The goal is to maximise
the flow of material through that value stream at the minimum cost. Despite the availability of vast amounts of data, advanced business improvement tools to identify the value stream constraint and improve performance, and sophisticated decision-making technologies, including AI, we often fail to achieve sustainable performance improvements. In fact, more real-time data can sometimes lead to increased data noise, greater indecision, and even lower performance. This is because technology alone cannot solve the fundamental challenges rooted in how people interact within the system (Figure 1).
Despite all this data, business improvement tools and sophisticated decision-making technology, we often find ourselves in what I call an ‘‘effort-driven organisation’’.
Common characteristics of an effort-driven organisation include:
➤ People working below their pay grade, where individuals across all levels of the operation are working tactically.
➤ General managers focusing on explaining yesterday’s poor performance rather than looking forward to setting up the operation for success.
➤ Too many meetings that add no value, becoming a curse in all our organisations, with no clear purpose or outcomes.
➤ Initiative overload, where organisations pursue numerous projects and initiatives without prioritising those that address the true constraints of the system.
➤ A prevalent reactive/firefighting/tactical approach to managing daily operations with poor or no rigorous forwardlooking planning.
➤ Unclear roles and responsibilities, often leading to duplication of efforts and a lack of clarity.
➤ Key performance indicators (KPIs) not linked to business outcomes.
➤ A lack of accountability management, which results in fingerpointing and obfuscation.
➤ Burnout, low morale, and high staff turnover.

My experience while consulting across various global industries over the past 10 years has revealed that these challenges are not unique to mining. They are identical across sectors like:
➤ Chocolate manufacturing: A connected set of activities where teams aim to maximise chocolate flow through the system.
➤ Tissue and toilet paper production: Similar interconnected activities with engineering and production efforts to maximise flow.
➤ High-tech equipment lifecycle management: From research and development through manufacture and support, often characterised by throwing prototypes directly into production without effective stage-gate reviews and pre-production processes.
➤ IT function of a multinational: Like an engineering function dealing with service requests, planned maintenance and capital project pipeline to improve capability.
While each industry demands unique technical/engineering expertise—be it metallurgical, mining, chemical, processing, or mechanical engineering—the process of managing these interconnected activities and the human challenges faced by engineers and production teams are remarkably similar. The maturity of digitisation, automation and robotics, and advanced process control does not change these fundamental people challenges; in some digital operations, they are even exacerbated by data overload.
The solution: A people-centric operating model
Since technology, data, and capital investment alone are not delivering sustainable value, we must recognise that people are at the heart of the system. It is people who make decisions and act on insights. Therefore, the focus must shift to building a people-centric operating model. An operating model is not just about the typical triad of people, process, and technology; it is about designing the entire organisational ecosystem so that all work is orchestrated to deliver the outcome consistently and confidently. Here are the fundamental building blocks and requirements of such a model (Figure 2):
➤ Strategic direction and sense of purpose: Leaders must clearly and consistently communicate the business objectives.
➤ Create psychological safety for the teams: This is most critical for fostering an environment where individuals can speak up, take accountability, continually learn, and perform without fear of blame. It is about clear ‘rules of the game’ where an individual can thrive and perform with a clear understanding of roles and responsibilities, and accountability.
➤ Ask questions that focus the team on what is important: Directing efforts toward the most impactful areas, such as the system’s constraint.
➤ Drive the development, adoption, and continual improvement of an operating model: Co-creation and continual improvement of the operating model with the teams in the business drive the change management required.
➤ Drive accountability management
➤ Coaching and development of the teams.
➤ Leaders in the organisation break operating models: By asking the wrong questions of teams breaks the consistent and deliberate ways of work in an operating model.
➤ A structured business-level information model: Linked directly to what is required for effective decision-making, owned by the business, not filled with IM jargon.
➤ Value driver trees: The organisation must develop a mental model of metrics and leading indicators that influence outcomes in their respective areas.
➤ Unambiguous definitions and a glossary of terms: Essential to prevent confusion and ensure data credibility.
➤ Credible and accessible data: Data easily accessible by business users and not IM only.
Skills and capability
➤ Effective meeting planning and leadership: This is a critical skill often overlooked and is why we all sit in many hours of

meetings each week that add no value. Meetings must have a clear purpose, defined outcomes, and planned steps to achieve the outcomes.
➤ Data skills: Even in this digital age, with access to terabytes of data, the most basic data skills are lacking, and the ability to use data to ‘tell a story’ for decision-making is limited.
➤ System flow and impact of variability: Understanding system flow and the impact of variability is crucial, drawing from methodologies like Theory of Constraints, Lean Six Sigma, and systems thinking.
➤ Graphical tools for decision-making: Using tools like capability histograms and control charts, which simplify complex data and aid effective decisions, rather than basic bar or line charts.
➤ Decision-making tools: Employing structured tools within meetings to drive to a decision.
➤ Levels of work linked to cascading performance measures: This defines who is responsible for what, from strategic (years ahead) down to tactical (hourly achievement), with KPIs and leading indicators mapped to each level.
➤ Structured management routines: An effectively designed meeting system is the tool for leaders to manage the system and drive continuous improvement.
➤ Functional processes:
- Strategic planning: An annual drumbeat and defined process for setting expectations and targets for the business.
- Operational planning (capability management):
Focusing on what is required to deliver on expectations, understanding current performance versus target, and driving improvement projects using a structured BI approach and tools. This includes critical aspects
like asset maintenance strategy to ensure equipment availability meets the required targets for net operating hours.
- Work management (stability management): A confident system for planning, scheduling, resourcing, and executing work with low variability and a feedback loop for improvement.
➤ Real-time escalation process and criteria: Clear processes for managing real-time emergent events and schedule adherence.
➤ Standard work procedures (SWP): Visual and easily accessible work procedures to ensure work is done consistently to the same quality, regardless of the team member.
➤ Tools and software: Effective design, implementation and adoption of technology aligned to the people-centric operating model requirements and business objectives.
➤ Feedback loops: A structured and deliberate process for continuous improvement of the operating model and processes (Figure 3).
A compelling example from an international manufacturing facility demonstrates the power of a people-centric approach. A manufacturing facility had invested millions in a full manufacturing execution system (MES) implementation, digitising the shop floor to get all equipment data into a production database with Power BI dashboards. Management had access to all dashboard metrics and held daily stand-up meetings, yet there was no improvement in total lead time (the time from when an order enters production until it leaves) over a two-year period. Sales orders that needed to be delivered in three days were taking 12 to 14 days. By adopting a people-centric approach, engaging shop floor personnel, identifying the value stream constraint, understanding the value stream

capacity, and implementing a very simple work management system—including shift planning, capacity planning, simple production work order scheduling, and a performance review feedback loop—they achieved a significant improvement. Crucially, the management dashboards were rebuilt to measure leading indicators directly impactful to shop floor personnel. This resulted in average lead times dropping from 12 days to 2.8 days, a sustained improvement over a year with a simple, yet effective, people-centric work management process.
Walking our talk: Building the SAIMM operating model
The SAIMM is committed to practising what we preach. Our management team is actively building the SAIMM operating model. With numerous volunteers on our council and committees, and a secretariat handling events, membership, marketing, journal, and finance, it is vital to effectively integrate all these elements and roles, to deliver repeatable and reliable service to our members, our corporate partners, and the industry. This is not a one-year focus but will be a continuous process of improvement of our operating model as we learn and the needs of our members and industry change into the future. When issues arise, the focus shifts from ‘‘who messed up’’ to ‘‘what in our system has resulted in this unwanted outcome,’’ fostering a culture of learning.
Where to start: Reviewing your meetings
For any leader managing teams, businesses, or functions, the most impactful place to start is by reviewing all your meetings. Your meeting system is your primary management tool to effectively manage and continuously improve the performance of your operating model. The key is to:
➤ Define the purpose: Clearly state why the meeting is being held.
➤ Define the outcomes: What tangible results do you want to achieve from this meeting? This also helps determine who truly needs to attend.
➤ Define the results: What individual steps or items need to be covered to achieve the stated outcomes.
➤ Plan the approach: How will the meeting achieve its results (e.g., brainstorming, specific decision tools, presentations)?
➤ Incorporate ‘‘plus delta’’ feedback at the end of each meeting: This involves each participant briefly stating one positive aspect (‘‘plus’’) and one area for improvement
(‘‘delta’’). This non-judgemental feedback mechanism allows both the meeting facilitator and participants to learn and improve for future meetings.
Planning an agenda effectively can take as much time as the meeting itself. This systematic approach to meetings, driving clear agendas with purpose, outcomes, results, and performance metrics, is a foundational step toward repeatable and reliable execution, supported by an appropriate technology stack and a capable workforce. This journey of continual learning and the systematic development of a people-centric operating model is how we will truly maximise the performance of our value streams in mining and beyond.
To effectively transition from ‘‘effort-driven’’ operations to sustainable performance, organisations must prioritise the deliberate design and continuous improvement of a peoplecentric operating model. This model should be built upon four fundamental pillars, which are, empowering leadership to define business expectation and foster psychological safety, a structured information model that provides credible and accessible data for rigorous decision-making, robust skills and capability development (especially in data literacy, business improvement tools, and meeting effectiveness), and a clearly defined operating model framework with levels of work, cascading performance measures, structured management routines, and functional work processes with the supporting digital architecture and systems.
The most impactful starting point for any leader is to systematically review and reform the overload of existing meetings to free up leadership time through the organisation. This involves defining the purpose, desired outcomes, agenda results and approach for each meeting, and eliminating meetings that do not add value. Concurrently, invest in developing the human skills essential for optimising and managing complex value stream systems and interpreting data effectively for effective decision making, and cultivate an environment of psychological safety where teams are empowered to identify and resolve systemic issues without fear of blame. This foundational shift in how work is managed and decisions are made, rooted in a ‘‘system-first’’ rather than ‘‘people-blaming’’ mindset, will unlock sustained improvements in productivity and overall performance. u
13 October 2025 Technical Workshops
14-15 October 2025 Conference
16 October 2025 Technical Visits
Venue: Glenburn Lodge and Spa, Muldersdrift
(1-hour drive from O.R. Tambo International Airport, Johannesburg, South Africa)

ECSA and SACNASP Validated CPD ActivityCredits = 0.1 per hour attended


Ore heterogeneity and metallurgical complexity continue to rise, while sustainability occupies an ever-prominent role. Geometallurgy offers a refined, multidisciplinary pathway to improve the value of ore deposits.
Future-Ready Geometallurgy examines strategies to generate trustworthy data through the steady application of machine learning, novel sensors, digital twins, and Industry 4.0 technologies in mining. Reliance on dependable data and innovative tools empowers the industry to make more timely and discerning decisions for mine planning and metallurgical plant optimisation.
Following the success of past SAIMM Geometallurgy conferences, the third conference in this series provides a platform to explore the latest progress in geometallurgy and to celebrate the success of its integration into the mining value chain.
• Sampling and sensor-based core logging
• Practical tools and methodologies for ore characterisation and testing
• Standardised methods for reporting to generate trusted data
• Geostatistics, data integration, smart workflows, and modelling
• Incorporation of predictive mining, processing, and environmental models into resource modelling
• Project and operational geometallurgy case studies
• 17 June 2025 - Submission of short abstracts
• 29 July 2025 - Submission of extended abstracts for peer review
• 13 October 2025 – Technical workshops
• 14-15 October 2025 - Conference
• 16 October 2025 - Technical visits
FOR FURTHER INFORMATION CONTACT: Gugu Charlie, Conferences and Events Coordinator E-mail: gugu@saimm.co.za | Tel: +27 11


Geomet Advisor & Business Development Manager, Datarock, Australia
Wendy Ware
Chief Metallurgist, Transmin Metallurgical Consultants, United Kingdom
Adam Johnston
Prospective authors are invited to submit short abstracts of not more than 500 words to: Conferences and Events Co-ordinator, Gugu Charlie, e-mail: gugu@saimm.co.za Authors of accepted abstracts will be required to submit extended abstracts for peer review and publication in the conference proceedings. Following the conference, full papers can be submitted to the journal for peer review and publication in an SAIMM Journal Special Issue.

Affiliation:
1InsPyro NV, Belgium
Correspondence to: A. Kotze
Email: andrea.kotze@inspyro.be
Dates:
Received: 2 Sept. 2024
Revised: 9 Jun. 2025
Accepted: 8 Jul. 2025
Published: September 2025
How to cite: Kotze, A., Messina, D., Cryns, Y., Nagels, E., Arnout, S. 2025. Thermochemical evaluation of elemental phosphorus recovery from sewage sludge. Journal of the Southern African Institute of Mining and Metallurgy, vol. 125, no. 9, pp. 501–508
DOI ID: https://doi.org/10.17159/2411-9717/3556/2025
by A. Kotze1, D. Messina1, Y. Cryns1, E. Nagels1, S. Arnout1
Abstract
The FlashPhos process aims to recover white phosphorus (P4) from sewage sludge by drying, flash combustion/gasification, and carbothermic refining steps. This study evaluates the material behaviour of sewage sludge ash melting and reduction in a refining furnace for the novel FlashPhos process. Thermodynamic modelling in FactSage 8.2 is combined with experiments from a tube furnace to determine the possible phosphorus recovery and minor element behaviour. For the two studied sludges, a yield of 40% and 75% white phosphorus is achieved after 1 hour at 1600°C, corresponding with a 60% and 25% loss to the metal phase. This is slightly above the calculated equilibrium yield of 28%–73%, which depends mainly on the Fe/P ratio of the sludge. Temperature is found to have a significant influence on the final phosphorus yield when leading to incomplete melting of the ash. A clean slag is produced in the process free of heavy metals making it suitable to be used as a cement-like binder material. The main heavy metals that co-evaporate with the phosphorus are Zn, Pb, As, Sb, and Sn. Additional processing steps will be required to remove these to produce a pure P4 product. The metal alloy consists of mostly Fe and P with smaller amounts of other components such as Mo, Cr, Cu, Mn, Sn, Sb, and V. The final slag consists of CaO, SiO2, MgO, and Al2O3 with virtually complete removal of P and heavy metals.
Keywords sewage sludge, phosphorus recovery, sustainability, refining process
Introduction
Phosphorus is classified as a critical raw material by the European Commission due to its importance in the agricultural, pharmaceutical, and electronic sector. The current and expected increased demand for phosphorus far exceeds the phosphorus reserves available (Salkunić, et al., 2022). Europe is currently fully dependent on imports for elemental phosphorus (European Commission, 2022). Currently, the main source of phosphorus is primary phosphate rock. Alternative secondary phosphorus sources are therefore critical to ensure the sustainable supply of this resource. Sewage sludge is one potential resource of phosphorus, which is currently only exploited to a limited extent. A country loses approximately 50% of its phosphorus through wastewater (Salkunić et al., 2022). It is estimated that 323 kt/a phosphorus can be recovered from sewage sludge in the EU (Nättorp, et al., 2015). This is enough phosphorus to meet the entire EU demand for elemental phosphorus, which is estimated to be around 100–130 ktP/y (European Sustainable Phosphorus Platform, 2020).
Typically, municipal wastewater is treated to remove particles and precipitate out phosphates and other harmful components from the water before returning it to the environment as clean water (Prasad, Smol, 2023). The solids produced in the treatment process are referred to as sewage sludge. Apart from organic matter, sewage sludge also contains heavy metals and other unwanted components such as pathogens and bacteria from the wastewater (Boniardi, 2018). There are various ways in which the sewage sludge is disposed of or re-used, such as landfill, landscaping, or incineration. The sludge is a sink for most of the impurities and contaminants, such as heavy metals and micropollutants (e.g., pharmaceuticals) in the wastewater (Košnář et al., 2023), which are harmful to the environment. Historically, the primary method of sewage sludge disposal has been landfilling (Inglezakis et al., 2014), which leads to the loss of valuable phosphorus resources and poses environmental risks, such as heavy metal contamination of soil and water. In the EU, landfilling of sewage sludge is no longer permitted under EU Directive 86/278/EEC (Council Directive, 1986). Beyond landfilling, other common sludge management practices include incineration and land application, each presenting its own challenges. Incineration destroys organic matter and limits the options for phosphorus recovery, while land
application risks introducing heavy metals and excess nutrients into water systems, exacerbating eutrophication. Given that sewage sludge can contain significant phosphorus concentrations, its management is critical for both environmental protection and resource recovery. It is therefore expected that landfilling or soil applications of this material will soon be more restricted across the world (Inglezakis et al., 2014). This means that most of the material will be incinerated (Cohen et al., 2019). Although costly, this provides the opportunity to recover energy from the combustion of the sludge and produce an inorganic ash. The produced ash will still require further processing for nutrient recovery and safe disposal, as it contains a significant amount of phosphorus along with other contaminants, such as heavy metals.
Sewage sludge is therefore a crucial waste stream that could aid significantly in the phosphorus supply and global sustainability goals. In line with the importance of phosphorus and the high losses in wastewater sludge, some EU countries are implementing limits on wastewater treatment plants to ensure the recovery of phosphorus. Germany is enforcing mandatory phosphorus recovery from 2029 for sewage sludges containing more than 20 g P/ kg dry sludge. In Switzerland, phosphorus recovery from sewage sludge is mandatory from 2026 (Sichler et al., 2022). Furthermore, limits are placed on using sewage sludge directly as fertiliser without further treatment due to the high heavy metal content and pathogens present. Table 1 provides the limits being implemented in Germany and Switzerland (Hermann, Schaaf, 2019). The main focus of these regulations is to ensure phosphorus recovery and removal of heavy metals from the material. If used directly in agriculture without purification, there is a high risk of contamination with heavy metals.
The phosphorus can be recovered at various points in the whole wastewater treatment cycle, each with its advantages and disadvantages. From the wastewater itself, roughly 50% phosphorus removal is possible through a precipitation process. The pH is typically increased to between 8–10 and the phosphorus can be precipitated from the water. Depending on the conditions and reagents used, different phosphorus precipitates are formed. In most precipitation treatment routes, the main product is struvite, which can be used as a fertiliser to some extent. Some heavy metals or other contaminants present in the water are precipitated along with the struvite (Salkunić et al., 2022).
During the production of sludge in the wastewater treatment process, using biological or chemical processes to precipitate phosphorus, the removal can be up to 90%–95% (Salkunić et al., 2022). Typically, the chemicals added are Fe and to a lesser extent Al chloride salts, which increase the metals present in the sewage sludge and the chloride content in the wastewater. To bring the phosphorus in the resulting sewage sludge (or ash after its incineration) to use, a separation process is necessary. Currently, a number of processes are being developed to recover phosphorus from sewage sludge and ash. The two main strategies are wetchemical and thermochemical (Canziani et al., 2023).
Table 1
The wet-chemical methods involve leaching the phosphorus from the sludge/ash using an acid or alkaline solution (Egle et al., 2015). Phosphorus can then be precipitated out or concentrated in different forms. In some cases, the phosphorus is kept in solution to produce phosphoric acid. Purification steps are often included to separate contaminants from the product. The wet-chemical process has a higher cost compared to the thermochemical process as well as other challenges to ensure efficient separation of heavy metals and other contaminants (Canziani et al., 2023).
Thermochemical processes involve heating the sludge or ash to higher temperatures (1000 °C–1600°C). In some cases, Cl or S is added to aid in separating the heavy metals from the phosphorus. In these processes, the phosphorus is kept in the slag to produce a fertiliser product (Canziani et al., 2023). Typically, some of the heavy metals (As, Pb, and Zn) will be found in the gas phase due to their high volatility. Others, such as Ni, Cr, Cu, etc., remain in the slag product. As a consequence, these processes cannot completely remove the heavy metals from the final P-product.
A limit in many of the processes (precipitation of e.g., struvite, thermochemical and wet-chemical) is the removal of heavy metals. As the heavy metals content in the wastewater is highly variable, the final phosphorus product may not always meet the criteria to be used directly as fertiliser, or for other purposes such as phosphoric acid (Egle et al., 2015). This makes the processes less robust towards different feed compositions. Nevertheless, these routes allow to recover P in a fertiliser or as phosphoric acid and may cover parts of the largest P applications. However, no route is available for high purity phosphorus products, which typically rely on thermal white phosphorus.
FlashPhos is a novel thermochemical process being developed to recover phosphorus from dried sewage sludge. Unlike the mentioned processes, this process is designed to recover highquality white phosphorus from sewage sludge. While the FlashPhos process also recovers some phosphorus in a ferrophosphorus alloy, its primary output is high-value P4. A pilot plant is currently being developed by an international consortium in the FlashPhos project (Flashphos, 2024). Figure 1 provides the flowsheet of the process.
Sewage sludge is first dried and ground to a fine powder. The material is then fed into a flash furnace to gasify and partially combust the material. The combustion energy is used to melt the material in the furnace. Municipal sludge contains between 23%–60% organic material, which can generate an amount of energy of between 8–21 MJ/kg through combustion (Prasad, Smol, 2023), which could significantly contribute to the energy required for the process. The molten material is then reduced with carbon in a refiner furnace to produce phosphorus gas, slag, and a ferrophosphorus alloy. The iron present in the sewage sludge is partly from the wastewater itself as well as from the chemicals (typically, FeCl3) added to precipitate out the phosphate in the water treatment process. White phosphorus is recovered from the gas phase by condensation. The process achieves a better separation of
Heavy metal limits for (recycled) fertiliser in Germany and Switzerland (Hermann, Schaaf, 2019)

heavy metals compared to other processes, as many metals remain in the alloy or slag material. Volatile metals, such as arsenic and zinc, that report to the gas phase along with P4 can be efficiently removed before P4 condensation, due to their higher condensation points, and different reactivities.
Arnout and others (2023) previously discussed the material behaviour in the flash furnace. Based on this work, a detailed CFD model could be developed to simulate the process discussed by Ortner et al. (2023). Another important aspect is the design and operation of the refiner process. For this reduction process, it is important to understand the chemical behaviour of phosphorus and the relevant impurity elements in sewage sludge, in order to determine the expected phosphorus yield as well as the quality of phosphorus, slag, and alloy. The current work aims to improve this knowledge using a combination of thermodynamic modelling and lab-scale experiments. This work builds on the previous work, which focused on phosphorus behaviour with limited experimental work (Arnout, Nagels, 2016).
Approach and methodology
This study aims to provide insight into the expected efficiency of the refining process, specifically reaction equilibria, component distribution, and product yields. The material reduction behaviour is first studied using thermodynamic calculations. This enables an understanding of the carbon requirement of the process to achieve maximum phosphorus recovery. In addition, the theoretical phosphorus yield and component distribution, including heavy metals, are determined and can be compared with experimental results. For experimental verification of the potential phosphorus yield, 40 g scale experiments are conducted in a tube furnace.
The raw materials used in the study are two types of dry sewage sludge (sourced from Germany and Belgium), which are comprised of organic material, volatiles, and 50% ash. The exact composition is a result of the wastewater characteristics and the nature and efficiency of the treatment operations, as well as the geology of the area. Ash is produced from the sludge by heating the sludge at 1000°C for 24 h in an air atmosphere during which all the organic material is combusted. Table 2 provides the ash composition quantified as oxides analysed with XRF. It is expected that these oxides will be present in combined compounds such as phosphates, however, in the thermochemical calculations the mineralogy of the feed material has no effect on the equilibrium phases.
Thermodynamic calculations
Thermodynamic calculations are carried out with FactSage 8.2 (Bale et al., 2016) using the FactPS, FToxid, FSsteel databases for the gas, slag, and metal phases. The FactPS database is included as it contains all the pure compounds. The FToxid data base is selected to represent the oxide phases and the FSsteel to represent the iron phosphate phase in the process.
Table 3
Tube furnace experiments
In the thermodynamic assessment, the reduction progress is evaluated as a function of reductant addition. It also allows the study of the phosphorus yield and the component distribution over the different phases formed. A further parameter considered is the temperature of the process. This provides a better understanding of the expected onset temperature of the reduction process. The calculated results are compared with experimental findings to understand kinetic limitations.
Tube furnace experiments
A set of experiments is completed in a vertical tube furnace (GERO HTRV, model 100-250/18) using graphite crucibles of 45 mm inner diameter. This setup allows for a 40 g sample size. It enables the analysis of the final products and to determine the product yield. The influence of basicity and temperature as process parameters are experimentally evaluated. The formed products are analysed with XRF (Malvern – PANanalytical with OMNIAN software), XRD (Bruker D2 phaser), and ICP-MS (iCAP RQ IFC from Thermo Scientific).
Samples are heated at 5°C/min and kept at high temperature for 60 min, then cooled at 5°C/min. All steps are conducted in an inert Ar atmosphere. Table 3 provides a summary of the samples prepared for evaluation. To increase the basicity, samples 2–7 are prepared by mixing the ash with CaO.
Results and discussion
Thermodynamic calculations
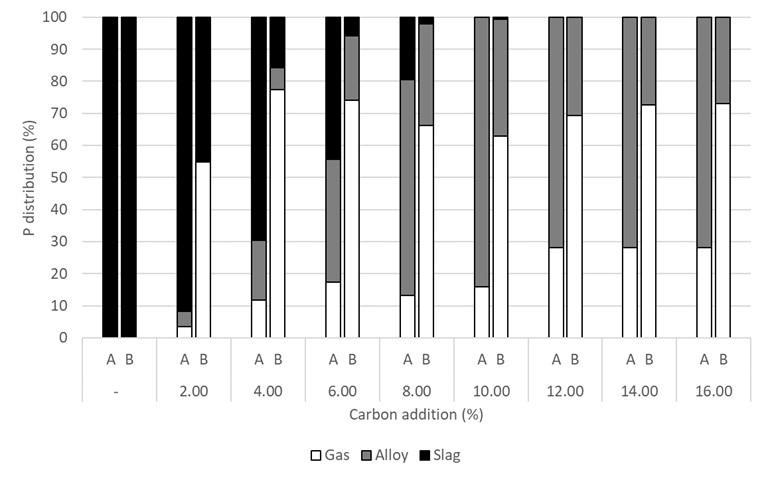
Figure 2 shows the calculated phosphorus distribution as a function of carbon addition for ash A and B at 1600°C. This will allow determination of the required amount of carbon to ensure maximum recovery of phosphorus. As expected, with a higher carbon addition, more phosphorus can be reduced and subsequently evaporated. With 12% carbon addition, 28% and 69% phosphorus yields are theoretically possible for ash A and B, respectively. Increasing the carbon addition further does not improve the phosphorous recovery. The remainder of the P forms a metal alloy with Fe, and only a very small amount of phosphorous is expected to remain in the slag. For ash B the losses to metal are expected to be smaller, this is investigated in more detail in the following section. These results are in line with previously reported calculation results (Arnout, Nagels, 2016).
The maximum phosphorus yield for ash A is achieved at 12% carbon addition, which is defined as the carbon saturation point. Adding additional carbon does not improve the recovery. Figure 3 gives the full elemental distribution at 1600°C with 12% carbon addition for ash A. The following can be concluded: Pb, As, and Zn report to the gas phase (depicted by the white bars). Elements
such as Co, Cr, Cu, Fe, Ni, Sn, and V report to the metal phase (grey bars). Al, Ba, Ca, Mg, and Sr remain in the oxidic slag phase (black bars). K, Na, S, and P distribute over metal and gas phase, and Mn, Ti, and Si distribute over slag and metal.
Thus, the main contaminants expected in the final phosphoruscontaining gas stream are As, Zn, and Pb. These are all components with high volatility and will evaporate at these temperatures into the gas phase once reduced. To obtain a clean end product, these elements are to be removed from the gas phase before the final condensation of phosphorus. The final slag contains mainly SiO2, CaO, and Al2O3 and is expected to have a low remainder of heavy metals (only barium tends to remain in slag). Potential for the use of this material as a cement-type binder has been shown in experiments (Arnout et al., 2023).
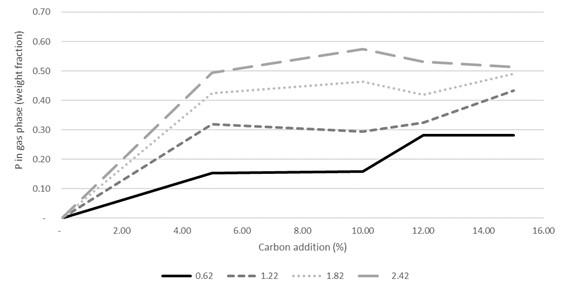
Based on the results it could be seen that the formation of a ferrophosphorus metal alloy limits the potential yield of the process. The formation of the metal alloy consumes reductant, and it captures a substantial amount of P, which can no longer be evaporated. This phenomenon is observed for both Ash A and Ash B. A much higher P recovery is achieved with Ash B due to a higher P2O5:Fe2O3 ratio compared to Ash A. The influence of the P2O5:Fe2O3 ratio was further evaluated in Figure 4. It can be seen that the P2O5:Fe2O3 weight ratio of a sludge or ash is an important parameter for the P-recovery potential (Arnout, Nagels, 2016). As shown in Figure 4, a higher iron content in the ash increases the phosphorus remaining in the metal and subsequently limits the amount of recovered phosphorus. From a P recovery standpoint, it could therefore be beneficial to use biological processes or aluminium salts for P removal from the wastewater (ESPP, 2025).

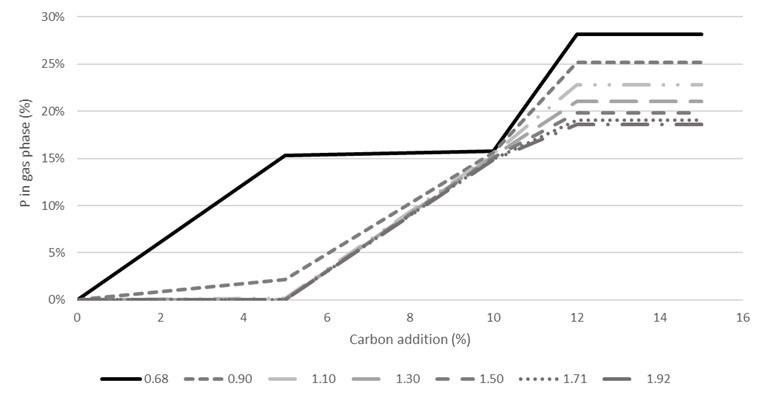
Liquid slags are often characterised by their basicity (CaO/ SiO2 ratio) as this has a large influence on the properties of this slag (e.g., melting point, viscosity, activity coefficient) (Verein Deutscher Eisenhüttenleute, 1995). As these properties may influence the reaction extents and kinetics, an experimental validation is needed. In light of this, the influence of basicity on the phosphorus recovery is evaluated in Figure 5 with thermochemical calculations. This is verified experimentally and reported in the next section. The basicity was adjusted by addition of CaO to the feed material in increasing amounts. Based on the calculated theoretical value, a lower basicity achieves the highest phosphorus recovery. However, this is in contrast to experimental work where the recovery is largely independent of the basicity.
The tube furnace experiments allow a better understanding of the material behaviour and final product quality. Experiments were run with both types of ashes: Ash A, which had a low P₂O₅:Fe₂O₃ ratio of 0.4, and Ash B, which had a higher and more favourable ratio of 1. As the output gas composition was not measured, the amount of phosphorus that evaporated (as product) is obtained from the difference between the phosphorus in the input and the phosphorus remaining in the slag and alloy at the end of the experiment. A yellow residue was formed at the bottom of the tube furnace. The collected quantity was insufficient for detailed evaluation, but a qualitative evaluation with XRF indicated that it was phosphorusrich with minor amounts of volatile elements Na, K, Zn, Sn, and S. This corroborates that phosphorus evaporated during the experiment and then condensed at the cold surface in the furnace
together with the other volatile components. More details on the phosphorus product can be expected when larger amounts are produced in the pilot plant.
Table 4 and Table 5 show the comparison between the experimental analysis and the calculation results (FactSage) at carbon saturation (12% C) of Sample 2. Sample 2 is close to the expected operating parameters of the FlashPhos process and therefore provides insight into the suitability of the industrial scale application. Good alignment is found between the analysis and the calculation results. The Si and P calculated percentage differ from the measured results by +4.2% and -6.3%, respectively. This is due to excess carbon present reducing more Si and increasing the P activity. It is clear that this point is not reached in the experiment despite the abundance of carbon from the crucible. This could be due to basicity or incomplete melting.
A mass balance was conducted for the various experiments, calculating the weight of metal and slag based on the Fe and Ca input and their respective fractions. The phosphorus balance, presented in Table 6 suggests that phosphorus recovery and evaporation into the gas phase remain unaffected by basicity, regardless of the ash type. However, this contradicts the calculated results. Experimental data indicate that temperature plays a significant role in phosphorus recovery, with higher temperatures enhancing the process. Ash B demonstrated greater phosphorus recovery, primarily due to its higher P₂O₅:Fe₂O₃ ratio—an observation that aligns with thermodynamic simulations (Table 5). Furthermore, the findings suggest that this ratio has a more substantial impact on efficiency than an increase in operational temperature.
Table 4
ICP-MS and FactSage comparison of metal and slag phase at 1600 °C with basicity of 1 (Sample 2)
From these lab-scale experiments, an analysis of the minor elements’ distribution was also conducted. Due to the low concentration of the elements present and the quantification of volatilisation by difference in the mass balance, these results are considered to be qualitative only. Larger samples in the pilot scale plant will enable better evaluation of the minor elements. At this stage it can be confirmed that the Cd, As, Sn, and Zn vaporise along with the P, in line with the thermodynamic calculations. The
Table 5
Mass balance of phosphorus recovery from tube furnace experiments
conclusions made on the elemental distribution remain similar as in the calculation section (Figure 6 and Figure 7). Differences are seen for Co, As, and Sn, but as their mass balance does not match (more output than input) further analysis and experiments on a larger scale are needed.
The study confirmed the feasibility of producing a phosphorus product with the FlashPhos process. For two selected sludges, a phosphorus recovery of 28% and 73% can be achieved. based on thermodynamic calculations corresponding with a 72% and 27% of the phosphorus to the metal phase. The main parameter influencing this recovery is the P2O5:Fe2O3 ratio in the sludge. Tube furnace experiments achieved a phosphorus recovery of 40% and 75% for these sludges, slightly higher than predicted by the thermodynamic assessment. Good alignment is found between the alloy and slag composition of the tube furnace experiments and FactSage calculations. The primary heavy metals that co-evaporate with phosphorus include Zn, Pb, As, Sb, and Sn. Additional processing steps are necessary to remove these impurities and obtain a pure P4 product. The metal alloy consists of mostly Fe and P with smaller amounts of other components such as Mo, Cr, Cu, Mn, Sn, Sb, and V. The final slag consists of CaO, SiO2, MgO, and Al2O3 with virtually complete removal of P and heavy metals.
CRediT author statement
AK: Conceptualisation, methodology, investigation, validation, formal analysis, visualisation, writing – original draft preparation, writing – review and editing preparation.
DM: Methodology, investigation, validation, formal analysis, visualisation.
YC: Methodology, investigation, validation, formal analysis, visualisation.
EN: Conceptualisation, writing – review and editing preparation, supervision
SA: Conceptualisation, writing – review and editing preparation, supervision, project administration.
References
Arnout, S., Nagels, E. 2016. Modelling thermal phosphorus recovery from sewage sludge ash. CALPHAD: Computer Coupling of Phase Diagrams and Thermochemistry, 26-31. doi:10.1016/j.calphad.2016.06.008

Figure 6—Comparison between FactSage calculations and ICP-MS analysis of the distribution of the minor elements for the ash A
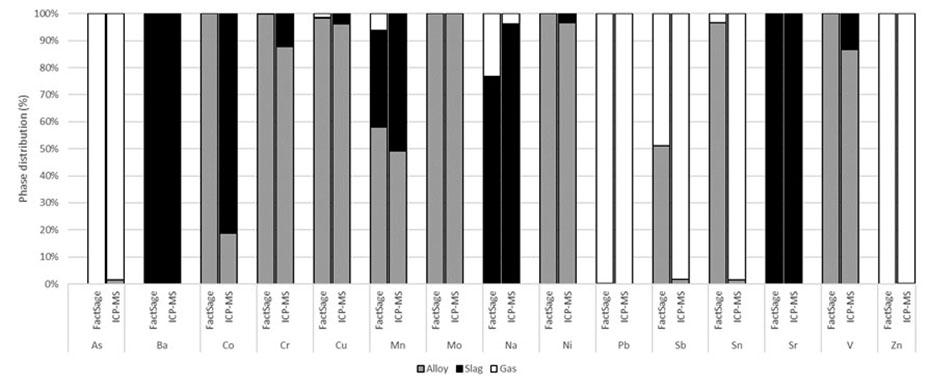
Figure 7—Comparison between FactSage calculations and ICP-MS analysis of the distribution of the minor elements for the ash B
Arnout, S., Francois, E., Kotze, A., Messina, D., Nagels, E., Cryns, Y., Lapauw, T. 2023. FlashPhos: recovery of elemental phosphorus and synthesis of latent-hydraulic slag from sewage sludge. 8th International Slag Valorisation Symposium
Arnout, S., Kotze, A., Nagels, E., Cryns, Y., Messina, D. 2023. FlashPhos: Elemental phosphorus recovery from sewage sludge - Raw material thermal behaviour. European Metallurgical Conference. Dusseldorf: GDMB.
Bale, C.W., Bélisle, E., Chartrand, P., Decterov, S., Eriksson, G., Gheribi, A., Van Ende, M. 2016. FactSage Thermochemical Software and Databases. Calphad doi:https://doi.org/10.1016/j. calphad.2016.05.002
Boniardi, R. 2018. Phosphorus recovery from sewage sludge ashes via wet chemical leaching. Politecnico di Milano. Canziani, R., Boniardi, G., Turolla, A. 2023. Phosphorus recovery— recent developments and case studies. In M. Prasad, & M. Smol, Sustainable and circular management of resources and waste towards a green deal (pp. 269-281). Elsevier. doi:10.1016/B9780-323-95278-1.00007-3
Cohen, Y., Enfält, P., Kabbe, C. 2019. Production of clean phosphorus products from swage sludge ash using the Ash2Phos Process. International Fertiliser Society. Retrieved from https://fertiliser-society.org/store/production-of-cleanphosphorus-products-from-sewage-sludge-ash-using-theash2phos-process/
Council Directive 86/278/EEC, 1986. On the protection of the environment, and in particular of the soil, when sewage sludge is used in agriculture. Official Journal L 181: 6-12 (4 July 1986). Available at: https://eur-lex.europa.eu/eli/dir/1986/278/oj/eng
Egle, L., Rechberger, H., Zessner, M. 2015. Overview and description of technologies for recvoering phosphorus from municipal wastewater. Resources, Conservation and Recycling doi:https://doi.org/10.1016/j.resconrec.2015.09.016
European Commission. 2022. Ensuring availability and affordability of fertilisers. Retrieved from Agriculture European Comission: https://agriculture.ec.europa.eu/common-agricultural-policy/ agri-food-supply-chain/ensuring-availability-and-affordabilityfertilisers_en
European Sustainable Phosphorus Platform. 2020. Summary of joint European Commission – ESPP webinar on P4 (phosphorus_ Critical Raw Material. Retrieved from https://www. phosphorusplatform.eu/images/scope/ScopeNewsletter136.pdf
Flashphos. 2024. Flashphos. Retrieved from Flashphos: https:// flashphos-project/eu/
Hermann, L., Schaaf, T. 2019. Chapter 15: Outotec (AshDec®) Phosphate Fertilizers from Sludge Ash. In H. Ohtake, & S. Tsuneda, Phosphorus Recovery and Recycling. Singapore: Springer. doi:https://link.springer.com/ chapter/10.1007/978-981-10-8031-9_15
Inglezakis, V. J., Zorpsa, A. A., Karagiannidis, A., Samaras, P., Voukkali, I., Sklari, S. 2014. European Union Legislation
on Sewage Sludge Management. Fresenius Environmental Bullitin. Retrieved from https://www.researchgate.net/ publication/261365754_European_Union_legislation_on_ sewage_sludge_management
Košnář, Z., Mercl, F., Pierdonà, Chane, A.D., Míchal, P., Tlustoš, P. 2023. Concentration of the main persistent organic pollutants in sewage sludge in relation to wastewater treatment plant parameters and sludge stabilisation. Environmental Pollution doi:https://doi.org/10.1016/j.envpol.2023.122060
Nättorp, A., Stemann, J., Remy, C., Kabbe, C., Wilken, V. 2015. Performance of nine technologies for phosphorus recvoery from wastewater - Overview of European P-REX project. P-rex. Retrieved from https://d1pdf7a38rpjk8.cloudfront.net/ fileadmin/user_upload/1000_Anders_Naettorp_Malmoe_ v2.pdf
Ortner, B., Schmidberger, C., Gerhardter, H., Prieler, R., Schröttner, H., Hochenauer, C. 2023. Computationally Inexpensive CFD Approach for the Combustion of Sewage Sludge Powder, Including the Consideration of Water Content and Limestone

Additive Variations. Energies, 1798. doi:https://doi.org/10.3390/ en16041798
Prasad, M., Smol, M. 2023. Sustainable and Circular Management of Resources and Waste Towards a Green Deal. Elsevier. Retrieved from https://shop.elsevier.com/books/sustainable-and-circularmanagement-of-resources-and-waste-towards-a-green-deal/ prasad/978-0-323-95278-1
Salkunić, A., Vuković, J., Smiljanićb, S. 2022. Review of Technologies for the Recovery of Phosphorus from Waste Streams. Chemical and Biochemical Engineering Quarterly, pp. 91−116. doi:http://dx.doi.org/10.15255/CABEQ.2022.2066
Sichler, T. C., Montag, D., Barjenbruch, M., Mauch, T., Sommerfeld, T., Ehm, J., Adam, C. 2022. Variation of the element composition of municipal sewage sludges in the context of new regulations on phosphorus recovery in Germany. Environmental Sciences Europe, 1-12. doi:https://doi.org/10.1186/s12302-02200658-4
Verein Deutscher Eisenhüttenleute. 1995. Slag Atlas. Veralg Stahleisen GmbH. u

Anyone interested in shaping the future of the PGM industry such as:
• Academics and Researchers
• Academics and Researchers
• Business Development Managers
• Concentrator Managers
• Consultants
• Engineers (Mining, Mechanical, Process, Ventilation)
• Exploration and Geology
• Professionals
• Fund and Investment Managers
• Innovation and Technology
• Managers
• Market Researchers and Strategy
• Analysts
• Metallurgists and Pyrometallurgists
• Planning Managers
• Production Managers (Mining and Metallurgy)
• Project Managers
• Scientists
gugu@saimm.co.za Tel: +27 011 538 0238 Web: www.saimm.co.za


Affiliation:
1School of Mining Engineering, University of the Witwatersrand, Johannesburg, South Africa
2Lappeenranta University of Technology, Finland
Correspondence to:
R.C.A. Minnitt
Email:
Richard.Minnitt@wits.ac.za
Dates:
Received: 10 Feb. 2025
Revised: 21 Jul. 2025
Accepted: 25 Aug. 2025
Published: September 2025
How to cite:
Minnitt, R.C.A., Minkkinen, P. 2025. Testing sample representivity using particle size distribution. Journal of the Southern African Institute of Mining and Metallurgy, vol. 125, no. 9, pp. 509–516
DOI ID:
https://doi.org/10.17159/2411-9717/3667/2025
ORCiD:
R.C.A. Minnitt
http://orcid.org/0000-0002-0267-8152
by R.C.A. Minnitt1, P. Minkkinen2
Abstract
Particle size distribution analysis is important to many industries for assessing product quality, process efficiency, and compliance with contractual standards, while ensuring sample accuracy, and representativeness. Inaccurate particle size distribution results, arising from fines due to excessive handling can lead to penalties and buyer-seller disputes. A non-representative particle size distribution means samples will not accurately represent the chemical components either. Sampling blasthole cuttings poses challenges due to large material volumes, segregation, and uneven settling of particles in dense gold bearing ores. Commonly used sampling methods, such as spear or sectoral sampling, may lack representativeness. Particle size distribution analysis is crucial for evaluating sampling methods by comparing test sample representativeness against a reference standard derived from multiple particle size distribution analyses. Acceptable samples must fall within the 97.5% confidence intervals of the standard; deviations analyses lying outside these boundaries indicate a strong likelihood of segregation errors. A case study demonstrates this approach by using a 6.005 kg benchmark sample to assess two additional samples (1 kg and 5 kg), highlighting particle size distribution’s role in detecting sampling errors and refining protocols. An example of three test samples collected from reverse circulation drill cuttings compared to a standard reference sample is presented to illustrate a quality assurance/quality control procedure for reverse circulation drilling.
Keywords
particle size distribution, mass fraction, sample representivity, relative difference, reverse circulation drilling
Analysis of particle size distribution (PSD) is essential in industries for evaluating product quality, assessing process efficiency, ensuring compliance with contractual terms, validating sampling system accuracy, and confirming sample representativeness (Pitard, 2019). Accurate PSD results are critical for decision-making in industries reliant on granular material processing. Contracts may impose penalties on specific granulometric classes that could disrupt process operations. For instance, penalties for fines necessitate avoiding breakage during sample extraction, as this can artificially produce fines and introduce a positive bias in PSD analysis. Excessive handling operations, such as loading, unloading, and sampling, further exacerbate biases in commodities like coal, coke, iron ore, manganese ore, bauxite, and alumina, creating conflicting perspectives between sellers and buyers regarding material quality.
Ensuring a representative sample of the size distribution in a lot is paramount. According to Pitard (2019), if a sample is not representative of the size distribution, it cannot accurately represent any other characteristic. A fundamental rule is that “a sample mass that is too small to justly represent all size fractions cannot provide a sample representative of anything else” (Pitard, 1993; 2019). Segregation, inherent in lots with significant size variation, must be minimised through unbiased sampling methods that yield replicate samples closely aligned with the standard PSD. Proper sampling processes are essential to mitigate segregation and delimitation errors, especially in a case such as sampling blasthole cuttings.
Sampling blasthole cuttings involves unique challenges due to the high mass of material, which can reach several tonnes, and the effects of segregation and delimitation errors. In vein-type ores with high density mineralisation, such as gold and base metal sulphides, these challenges are pronounced as cuttings settle unevenly around the drill string. Sampling methods like spear or sectoral sampling, although commonly used, often fail to ensure representativeness. Accurate sampling requires attention to the depth and uniformity of material collection, particularly in the first few metres of drilling, where cuttings are minimal and often contaminated with sub-drill material.
A typical procedure for sampling drill cuttings involves laying a tarpaulin around the hole to prevent ground contamination and using triangular sectoral trays to collect samples continuously over a 3-metre drill depth. For a 200 mm drill hole, this depth produces approximately 270–300 kg of cuttings, from which 35–40 kg is collected and split into two 5 kg samples for PSD and chemical analysis. These samples are compared to ensure consistency and representativeness. A typical PSD for two samples of drill cuttings 0.02-17000 microns showing maximum volume for fragments of 2466 microns (2.47 cm) is shown in Figure 1.
Accurate representation of particle size distribution in sampling
An accurate particle size distribution (PSD) measurement ensures that the sample truly reflects the bulk material’s size characteristics—critical because if PSD does not accurately represent the size distribution, it cannot accurately represent anything else. In pharmaceuticals, incorrect PSD alters drug performance; in mining, it reduces recovery rates. However, achieving accuracy is challenging due to grouping and segregation, where particles separate by size during handling.
Proper sampling techniques are essential to minimise bias. Incremental sampling collects material from multiple locations, while coning and quartering homogenises samples. Analytical methods must match material properties: Laser diffraction suits high-throughput analysis, dynamic image analysis captures particle shape, and sieving remains reliable for coarse fractions. Statistical validation, including confidence intervals and percentile metrics (D10/D50/D90), confirms whether results align with reference standards.
The financial liabilities and compromised operational efficiency arise due to non-representative sampling, and inaccurate PSD analysis. For example, contractual penalties may be imposed if product specifications (e.g., fines content <10%) are violated due to biased sampling. In iron ore trading, a 1% deviation from contracted PSD can trigger penalties exceeding USD1 million per shipment (Pitard, 2019). Under-sampling of coarse gold bearing particles because of incorrect PSD data leads to suboptimal grinding or inadequate liberation, reducing recovery rates by 5%–15% (Minkkinen et al., 2015). In 2018, losses of USD2.5 million, attributed to misrepresentation of PSD from spear sampling, led to costly arbitration regarding bauxite shipment quality (Pitard, 2019). Non-compliance with airborne coal dust standards may incur fines if PSD underestimates fines generation.
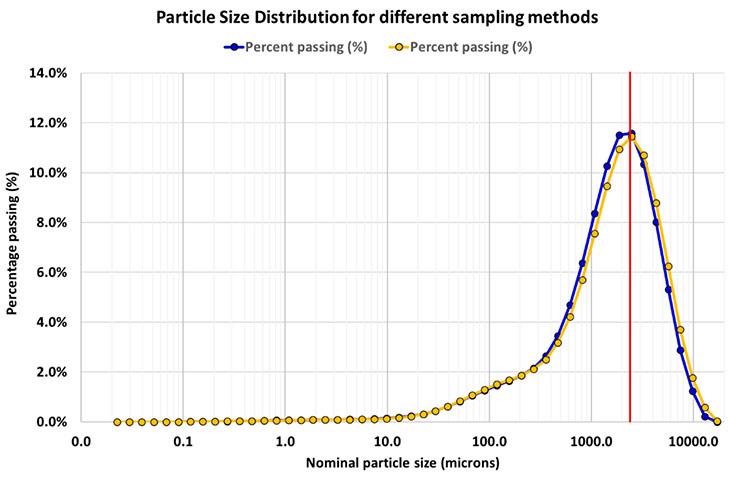
PSD analysis is instrumental in evaluating sampling methods. For instance, the representativeness of spear and sectoral sampling can be tested against a reference standard compiled from PSD analyses of ten or more samples collected from multiple cones around geologically similar blast holes. Upper and lower 97.5% confidence intervals (CIs) for the reference standard establish a framework for comparison. A sample’s mass fractions must fall within these CIs to be deemed acceptable. Significant deviations indicate that segregation errors affect the representativeness of the sampling method (Pitard, 1993; 2019). Reliable PSD demands unbiased sampling, appropriate instrumentation, and statistical rigor. By adhering to best practices, industries can avoid financial losses, ensure compliance, and maintain quality control, underscoring PSD’s vital role in material science and industrial applications.
A case study by Minkkinen et al. (2015) highlights the application of PSD analysis in assessing sampling methods. A 6005 g standard sample taken with a new device served as the benchmark. Two additional samples, weighing 1 kg and 5 kg, respectively, were compared to the standard. This comparative analysis demonstrated the utility of PSD in identifying sampling errors and improving sampling protocols.
of constitutional heterogeneity and related equations
A variety of methods exists by which the relative sampling variance may be derived, including the approach provided by Gy (2004), which reflects real-world complexity. This derivation quantifies the heterogeneity contribution (hi) of every fragment i in the lot to the variance based on the deviation of grades (ai aL), and the mass ratio (Mi/(Mi), as shown in Equation 1:

While the mean of all hi is zero, the variance is:

[1]
The dimensionless number hi with a mean of zero, was central to Gy’s (2004) first “equiprobable” model for the sampling variance as early as 1950, and led to the definition of the constitutional heterogeneity CHL of the lot, defined as the variance of hi in the population of NF fragments comprising the lot:

This parameter can only be rarely estimated so it is replaced by using the idea of fragment heterogeneity via the heterogeneity invariant (HIL) or intrinsic heterogeneity (IHL), which is far easier to define (Gy, 2004; Pitard, 2019). This accounts for the intrinsic fragment variability and quantifies the relative sampling variance, which sums the squared deviations of individual fragment grades (ai) and masses (Mi) from the lot average:

[3]
[4]
Where aL and ML are the grade of the lot and the mass of the lot, respectively. This approach addresses non-uniform, real-world ores, for complex lots affected by clustering and variable liberation and which leads to Gy’s formula, σR 2 (aS) ≈

In many industries, analysing the particle size distribution of a material is a critical factor because it helps evaluate product quality, measure process effectiveness, ensure compliance with contractual agreements, verify sampling system precision, and confirm that collected samples accurately represent the material (Pitard, 2019). Pierre Gy (1992; 1998) derived an equation, which can be used to estimate the relative variance of the fundamental sampling error (FSE) from the mass fractions of each size fraction, as determined by PSD analysis. The heterogeneity invariant (HI) represents the relative variance of the FSE for a unit mass sample, typically 1 gram. A full derivation of the formula for HIL provided by Pitard (2019), is not repeated here, but his formula is shown in Equation 5: [5]

Minkkinen et al. (2015) modified this formula, as shown in Equation 6, to provide an acceptable estimate of HI by a standard sieve analysis for each size class i

where
i = the size class
ai = mass fraction of size class i
vi = average particle size in class I (this should be di) is estimated from the sieve openings; f is the particle shape factor (default is 0.5 for irregular particles)
ri = density of particles in size class i
Given HIi, s2FSE can be estimated for different sample sizes to be sieved from the test material using Equation 7:

where
ms = sample mass to be sieved
mL = mass of the lot from which the sample is taken.
If the sampling method is unbiased and effectively minimises segregation effects, the FSE error variance (s2FSE) of replicate samples should be close to that obtained for the standard by using the above equations. It is also possible to calculate a confidence interval for a given size distribution; the relative difference for each mass fraction (ai) for each size fraction of the test sample should lie within the confidence limits of a standard sample. If the PSD sample is supported by determination of silicate or elemental composition, the correlation between size classes can be investigated using principal components analysis (PCA). These methods provide a way of determining if a given sampling method or technology is extracting a correct, and therefore representative sample. Where it can be shown that the samples taken are representative of the original lot, and the method can be applied in practice and confidence intervals can be calculated for a given size distribution.
The average volume of fragments between two screens is given by Equation 8:

where fi is the shape factor; a default value of 0.52 should be used; the average fragment mass per class interval is the product of the density and vi
The nominal fragment size is calculated slightly differently using Equation 9.

It is important to note how heterogeneity invariant (HIi), the constitution heterogeneity (CHi), and the variance of the FSE (s2FSE) are related, as shown in Equations 1, 2 and 3; when ms is much less than mL:

[10]
If the sample forms a significant part of the lot from which it is taken, then a correction must be made in estimating the sample variance.

[11]
If the primary sample ms1 is taken from a lot of size mL, and sample ms2 is taken from the primary sample, and sample ms3 is taken from the secondary sample and then sieved, the variance of this three-step process, if the size distribution is not changed, is:

[12]
The constitution heterogeneity (CHi) is the relative variance of the sampling error, scaled by sample and lot sizes, and the relative standard deviation (sri) converts CHi to standard deviation for size classes, sr as follows:

If the relative standard deviation is given in percentages, sri should be multiplied by 100. The fundamental sampling variance s2FSE gives the variance of an ideal sampling process, i.e., the material of the lot is a random mixture of its constituents, and the sampling process is correct. If there is segregation in the lot or sampling devices are not correctly designed or operated, experimental variances will be larger than those calculated from the equation for HIi and relative difference of ai will be evident.
[13]
Practical applications allow the uncertainty in the results to be estimated using the absolute standard deviation to calculate and plot confidence intervals for different size fractions. Approximate confidence intervals CI for the size fractions is shown in Equation 14.

[14]
Where ai is the mass fraction, k is the coverage factor of 1.96, giving 95% and 3.0, giving 97.5% confidence intervals and sr is the standard deviation.
The confidence intervals for mass fractions are derived from the relative standard deviation (sr), which is itself a function of the constitution heterogeneity (CH) and heterogeneity invariant (HI). Beginning with Equation 1, CH is defined as the scaled sampling error variance (Equation 6). For a 97.5% CI, the interval width is k × sr, where k = 1.96 (or 3.0 for 99.7% CI, Figure 2). Here, sr = CHi (Equation 13), directly linking HI (Equation 5) to the practical uncertainty bounds. This chain of dependencies ensures that the CIs reflect both the intrinsic heterogeneity (HI) and sampling process (CH).
Multivariate analysis via principal components analysis (PCA)
Where PSD data are supplemented by compositional assays (e.g., SiO₂ or Au content), principal components analysis (PCA)
can identify correlations between size classes and chemical heterogeneity. For example, in gold ores, PCA might reveal that +2 cm fragments correlate with nuggety gold, while fines dominate silicate-rich fractions. Such analysis helps validate whether PSD representativeness extends to compositional representativeness. A case study by Pitard (2019) demonstrated that PCA of paired PSD and assay data reduced sampling bias by 30% in iron ore processing.
The efficiency of two different sampling methods was tested by Minkkinen et al. (2015), the results of which are shown in Table 1.
Table 1 provides a linear sequence of calculations, including the nominal fragment size, the mass fraction (ai), the heterogeneity invariant (HI, Equation 5), and the fundamental sampling error (CH, Equation 11), the standard deviation (sr %, Equation 9), and the lower and upper confidence limit calculations for the reference standard. The average fragment mass per size fraction (vi*density), total mass of fragments, and the average number of fragments in each of the six size classes sieved from the 6005 g standard sample are shown in Table 2.
The sampling variance of a particle mixture is a function of the number of the analyte particles in the sample. When the particle size is reduced, the number of fragments rapidly increases and, as a result, HI decreases (Table 2). If a reliable result for the coarsest fraction in the sample is necessary, then the number of the analyte particles determines the minimum sample size that should be used.
intervals and their significance in mass fraction analysis
A confidence interval (CI) is a range of values, derived from a dataset, that is likely to contain the true value of the mean with a
Table 1
specified level of confidence and provides a measure of uncertainty associated with a sample estimate. The 95% confidence interval used here means that for multiple repetition of sample analyses, 95% of the calculated means would contain the true value. In the context of PSD, which measures the proportion of a specific size fraction in a sample, confidence intervals are used to estimate precision by determining how accurately the measured mass fraction represents the true value in the standard sample. Confidence limits provide a framework in which reliability and repeatability of sampling methods can be determined and provide a visual means of identifying statistically significant differences between sampling methods.
In quality assurance and quality control (QA/QC), confidence intervals can highlight whether the variation in measured mass fractions is within acceptable limits. CIs provide a quantitative way to quantify the uncertainty in mass fraction estimates. Narrow intervals indicate high precision, while wide intervals suggest greater uncertainty. Confidence intervals support informed decisions about material quality, compliance with specifications, and production adjustments. Where relative differences between mass fractions lie within the limits for the standard, there is no significant difference between sampling methods, whereas points lying outside the limits indicate a statistically significant difference. Wider confidence intervals often result from small sample sizes (Table 1) and this insight can guide the requirements of minimum sample mass and the design of sampling protocols to improve accuracy. CIs can reveal systematic biases in measurements, especially when comparing duplicate samples or different sampling methods. In summary, confidence intervals are critical in mass fraction analysis for understanding the precision, reliability, and statistical significance of analytical results of different sampling methods.
Results from calculating the heterogeneity invariant (HI), constitution heterogeneity (CH), and relative standard deviation (sr) from sieving results of the standard 6005 g sample from a 50 kg lot. Shape factor f = 0.5 and density 3.2 g/cm3 were assumed (after Minkkinen et al., 2015)

Table 2
Average fragment mass, total mass, and number of fragments in each size class in the 6005 g sample that is used as a reference standard (after Minkkinen et al., 2015)

The 99.75% upper and lower confidence limits for the mass fraction (ai) in Table 3 for the 1 kg and 5 kg samples are calculated using Equation 15:

Table 3 shows the confidence intervals for the mass fractions (ai) in each size fraction for the reference standard as well as for 1 kg and 5 kg tests samples, calculated using the experimental HI values (Equation 1). Confidence intervals of the 1 kg and 5 kg samples can now be placed in the framework for the standard sample, as shown in Figure 2.
The 3 upper and 3 lower confidence intervals for the reference standard (Table 3, columns 4 and 5), calculated using Equation 12 are plotted against the nominal fragments size (mm) as shown in Figure 2 and form an important starting point for the Minkkinen et al. (2015) analysis.
The upper and lower confidence intervals for the 1 kg and 5 kg test samples are plotted as points which all lie between the CIs of the reference standard, indicating that they are acceptable and thus representative of the PSD derived by the test methods.
The calculated confidence intervals for the replicate samples lie well within the limits for the standard sample, indicating that despite the significant size distribution between the samples and the reference standard, the sampling method tested for sample masses of different sizes is correct and unbiased, and therefore able to minimise segregation.
Minimum sample size for a given precision requirement
The minimum sample size for precision to achieve a desired relative standard deviation sr (for an ideal mixture and sampling system) is given by Equation 17.
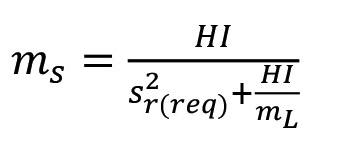
The calculations assume ideal conditions. Factors like segregation, incorrect sampling equipment, and approximation of particle properties can introduce errors. Results outside confidence intervals suggest sampling or material issues. If fewer than 16 fragments from the coarsest fraction are included, symmetric confidence intervals are invalid. To account for uncertainties, double the theoretical minimum sample size and reducing sample size requires combining multiple increments to minimise errors.
Table 3

By applying these principles, one can evaluate and improve the reliability of sampling processes for size distribution and compositional analyses. Table 4 shows the sieve results obtained from one of the experimental drill holes.
Table 4 shows how the theoretical minimum sample size depends on the required uncertainty of sampling given as the relative standard deviation: 1%, 5%, and 10%. It quantifies the precision-cost trade-off by demonstrating how the minimum sample mass (ms) scales nonlinearly with the desired precision (sr(req)). For instance, reducing sr from 10% to 1% requires a 100fold increase in ms (Equation 13). This sensitivity is critical for costbenefit decisions. Sample sizes were calculated for two different lot sizes: 200 kg (sample taken from a pile) and from a lot much larger, about 20 t, than the sample (primary sample taken from a large target). Where high precision is required, as in compliance testing, a 147 kg sample is required for 1% sr in the coarsest fraction (Table 4). For less demanding precision such as exploration sampling a 10% sr may suffice, allowing smaller samples (1.47 kg). The exponential relationship (Figure 3) underscores the trade-off between precision and operational feasibility. The changes in sample mass for a change in nominal fragment size are shown in Figure 3.
A set of PSD data was obtained as a standard bulk composite sample from cuttings in a cone around a blast hole, as shown in Table 5. The performance of another three samples SAMPLE 1, SAMPLE 2, and SAMPLE 3, collected in adjacent blast holes was compared against this standard.
Nominal top size (di), mass fraction (ai), and the upper and lower 3s confidence intervals for the reference standard, the 1 kg test sample, and the 5 kg test sample

Table 4
Sensitivity of sample mass to precision requirements; lot sizes are mL >> ms and mL = 200 kg. All masses are in grams

Table 5
Calculated values for nominal fragment size, mass fraction (ai), s2FSE, and 99% confidence intervals for a reference standard PSD

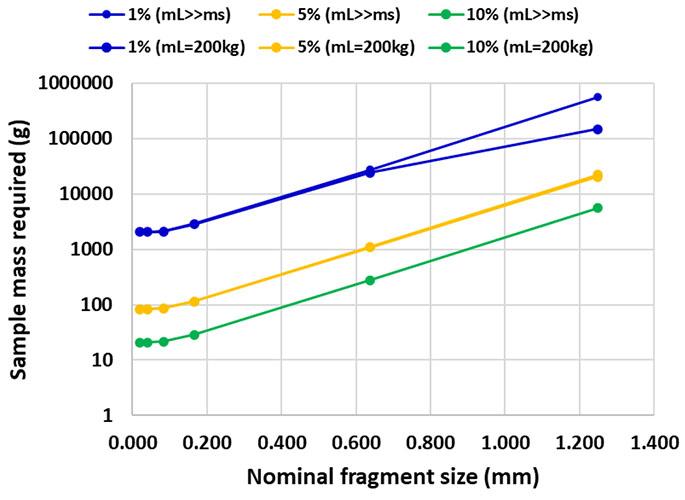
The data in Table 5, columns 1, 2, and 4, the two screen sizes, and the sieved mass (g) are typical results for a reference standard PSD analysis. The primary data are the upper and lower screen sizes used (columns 1 and 2), and the sieved mass is that retained on top of each screen. The nominal top size (column 3) for each
size fraction is calculated using Equation 9, and the volume of each size fraction vi (column 6) is calculated using Equation 8. The mass fraction, ai is the proportion of the mass of the size fraction relative to the total sieved mass (295.83 g). The sum of the product density, nominal size, and mass fraction for each mass fraction is calculated (10.03 g), a value that is substituted into Equation 1 to give the HI for each size fraction, and from which the constitution heterogeneity (CH), and the relative variance of the sampling error (s2FSE) is calculated, using Equation 11. The relative standard deviation sr (%) is then calculated using Equation 9 and the upper 99.7% and lower 99.7% confidence intervals (columns 11 and 12) can be calculated, and are plotted as the upper and lower 99.7% confidence intervals forming the framework against which any samples can be tested. The data for the three test samples, SAMPLE 1, SAMPLE 2, and SAMPLE 3, are listed in Table 6.
The relative difference between the mass fractions of the reference standard (Table 5) and the three test samples, is calculated using Equation 16 and is shown for SAMPLE 1, SAMPLE 2, and SAMPLE 3, in column 8 of Table 6. These values are plotted against the confidence intervals of the standard, as shown in Figure 4.
Comparison of the mass fraction at different size fractions of the sample against the 3 times confidence intervals for the standard indicates that these lie well within the limits of the standard and suggests that the PSD of the test samples is acceptable, with the
Table 6
Calculated values for nominal fragment size, mass fraction (ai), s2FSE, the standard deviation sri (%), and the relative difference of mass fractions for the three tests samples SAMPLE 1, SAMPLE 2, and SAMPLE 3
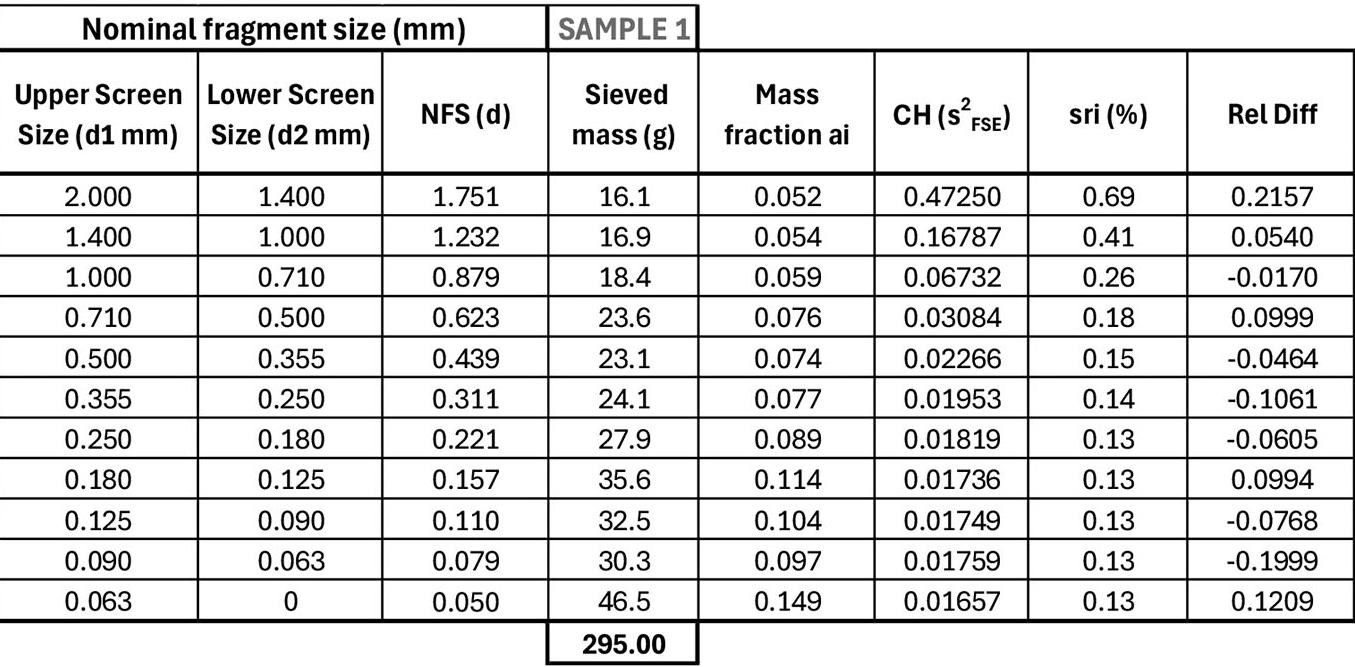
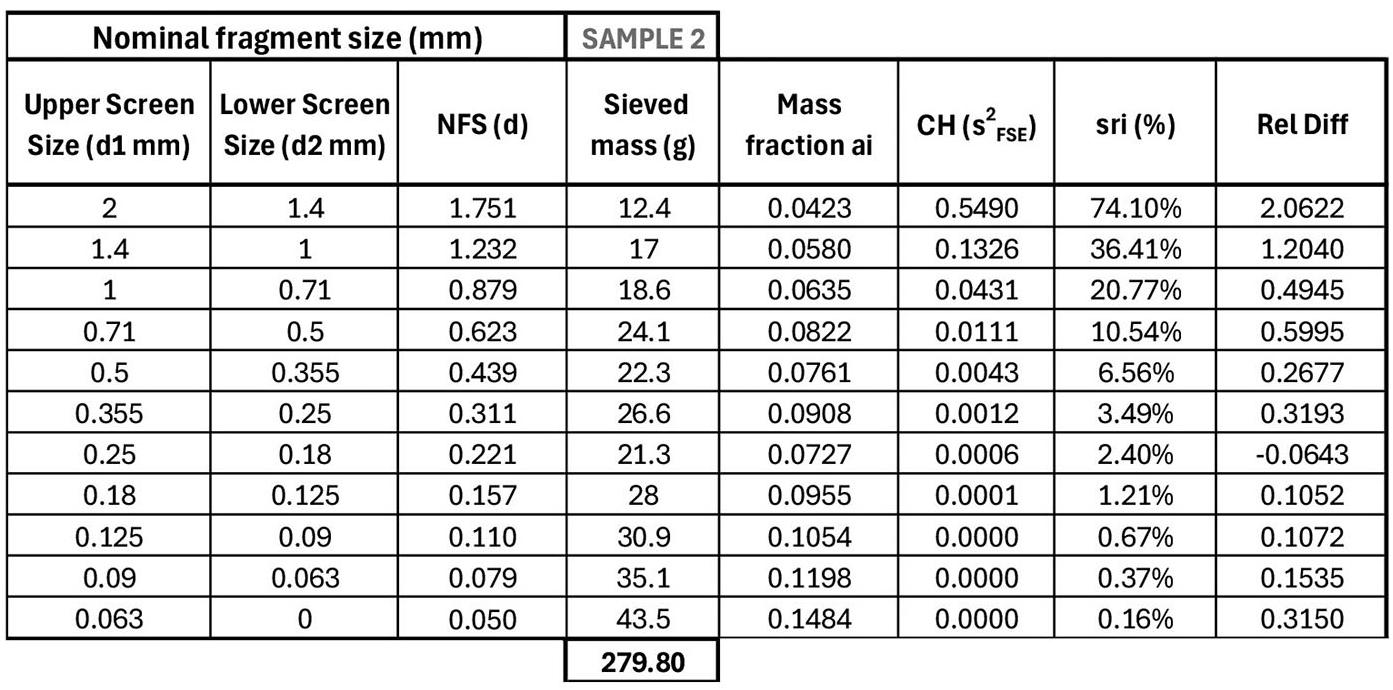


Figure 4—Relative difference of the three test samples SAMPLE 1 (red circles), SAMPLE 2 (yellow triangles), and SAMPLE 3 (green diamonds), compared to the upper and lower 99% confidence intervals for the standard (blue lines) showing the test samples have a slight overall positive bias relative to the standard and greater variability in the smaller fragment sizes
conclusion that the three test samples of blast hole cuttings may be considered representative of the lot. It should be noted that the CIs widen considerably for size fractions over 1.75 cm (Table 6, columns 11 and 12 for size fractions > 1.75 cm), so data from this section of the analyses have not been plotted in Figure 4.
Best practices for field sampling
To ensure representative PSD analysis while minimising financial and operational risks, the field sampling protocol should minimise excessive handling and transfers to avoid generating fines and a biased PSD. The use of conveyor belt samplers or automated dividers (e.g., rotary splitters) instead of spears or grab sampling is recommended (Minnitt, 2024; Trottier, Dhodapkar, 2012). For blasthole cuttings, one should collect increments directly from the drill stream to avoid segregation (Dominy et al., 2018). In terms of the number of increments and the sample mass, Gy (1992) recommends ≥30 increments per lot to mitigate segregation and grouping errors, while for highly heterogeneous gold ores it is recommended to use Equation 13 to calculate minimum sample mass (see Table 4). The use of crushers and splitters should be calibrated and validated for consistency using certified reference materials, while field samples should be compared against a conequartered bulk standard to detect segregation. Paired PSD and assay checks using PCA for size and chemical correlations should be used to validate representativeness, monitor confidence intervals (Figure 2), and flag outliers (>97.5% CI) for re-sampling.
Confidence intervals (CIs) are essential for evaluating the precision and reliability of PSD analyses in sampling methods. Upper and lower 99% CIs mean that repeated analyses would capture the true mean 99% of the time and provide the framework to compare test samples against a reference standard. The PSD-derived CIs indicate whether mass fractions of test samples fall within acceptable limits, identifying potential segregation errors.
The study by Minkkinen et al. (2015) applies PSD analysis to assess sampling methods, using a 6005 g standard sample as a benchmark. Two test samples of 1 kg and 5 kg were compared within the standard framework, and their confidence intervals fell within the reference standard’s limits, confirming their representativeness.
A minimum sample size calculation ensures precision, with larger samples required for lower uncertainty. Systematic biases and variability in test samples can be identified by comparing their relative differences against the reference standard’s CIs. The final analysis of blast hole cuttings showed that the test samples were within acceptable limits, except for larger size fractions (>1.75 cm), where the widening of the CIs reduces the reliability. These findings highlight the importance of PSD-based CIs in ensuring sample representivity for blast hole and RC drill cuttings, to improve sampling protocols where necessary and ensure reliable material characterisation.
The authors express their gratitude to Maunu Mänttäri of RTD Department Sandvik Mining and Rock Technology Oy, Tampere, Finland for his kind permission to use the PSD data presented in Samples 1, 2, and 3.
References
Dominy, S.C., Glass, H.J., O’Connor, L., Lam, C.K., Purevgerel, S., Minnitt, RCA. 2018. Integrating the Theory of Sampling into Underground Mine Grade Control Strategies. Minerals, vol. 8, no. 6, p. 232. https://doi.org/10.3390/min8060232
Gy, P. M. 1992. Sampling of Heterogeneous and Dynamic Material Systems. Elsevier, Amsterdam.
Gy, P.M. 1998. Sampling for Analytical Purposes. John Wiley & Sons Ltd, Chichester.
Minkkinen, P., Auranen, I., Ruotsalainen, L., Auranen, J. 2015. Comparison of sampling methods by using size distribution analysis. Proceedings of the World Conference on Sampling and Blending 2015, WCSB7. TOS forum Issue 5, 2015. www.impublications.com/wcsb7. doi: 10.1255/tosf.63. 175-185
Minnitt, R.C.A. 2024. Mid-Boyd crusher and sample divider test results. Scott | Mid-Boyd Crusher and Sample Divider Test Results
Pitard, F. F. 2019. Theory of Sampling and Sampling Practice. Third Edition. Boca Raton: Taylor & Francis, 2019. 693 p.
Pitard, F. F. 1993. Pierre Gy’s sampling theory and sampling practice: Heterogeneity, sampling correctness, and statistical process control. Second Edition. CRC Press, Taylor & Francis Group, 2nd ed. c1993. 488p.
Trottier, R., Dhodapkar, S. 2012. Sampling Particulate Materials the Right Way April 1, 2012, The Dow Chemical Company. Sampling Particulate Materials the Right Way - Chemical Engineering | Page 1 u

Affiliation:
1Human Capital Future of Work VMHC
Advisory, South Africa
2School of Mining Engineering, University of the Witwatersrand, South Africa
3Harmony Gold, South Africa
Correspondence to: B. Genc
Email: bekir.genc@wits.ac.za
Dates:
Received: 24 Mar. 2025
Revised: 27 Jul. 2025
Accepted: 29 Aug. 2025
Published: September 2025
How to cite:
Morar, V., Govender, U., Genc, B., Smith, G.L. 2025. Novel integrated holistic healthy human framework: A Special lens on the minerals industry. Journal of the Southern African Institute of Mining and Metallurgy, vol. 125, no. 9, pp. 517–532
DOI ID:
https://doi.org/10.17159/2411-9717/3701/2025
ORCiD:
B. Genc
http://orcid.org/0000-0002-3943-5103
by V. Morar1, U. Govender2,3, B. Genc2, G.L. Smith2
Abstract
This paper presents a novel holistic healthy human framework for C-suite executives and senior leaders in the minerals industry. The value-add of the framework centres around the integration of inner holistic health and interpersonal holistic health to support and enhance environment, social, and governance transformation, with a focus on the social enterprise. The framework unpacks key components of holistic health and their interlinkages to environment, social, governance, and stakeholder engagement. Insights were gleaned from interviews with 10 C-suite executives, each with over twenty years of experience in mining or business leadership. By applying the holistic healthy human framework, industry leaders can strengthen the social licence to operate and positively transform the industry's public image. Broader application to other sectors is underway.
Keywords
holistic health, human transformation, social enterprise, environment, social and governance transformation, systemic approach, minerals industry
Introduction
In today’s interconnected world, businesses are increasingly adopting environmental, social, and governance (ESG) principles to achieve sustainability (World Economic Forum, 2022a). Influenced by various stakeholders, organisations are aligning their strategies to operate with a higher purpose beyond financial gains (NJCPA, 2021; World Economic Forum, 2022a).
Significant advancements in ESG have been made, but a systemic approach is essential in order to deliver a robust transformational impact on broader organisations, homes, societies, and the environment at large due to interconnected societal and economic systems (Jackson, 2022). The environmental (E) and governance (G) components have gained traction and are considered critical by organisations in ensuring regulatory compliance and delivering tangible positive impact around managing environmental risks on organisations and economies worldwide (HSBC, 2023). However, the social (S) component has lagged, posing risks not only at the organisational level, but equally at the individual, family, community, and environmental levels (Jackson, 2022; Hunt, 2022; Pelosi, Adamson, 2016; Becchetti et al., 2022; Dewhurst, 2022; Morar, 2023). This is vital, as, for individuals to thrive in their context, they need to foster interconnectedness within their wider ecosystem, which includes their family, organisation, community, and ultimately, the planet. The ‘S’ component in ESG focuses on social conscience and enterprise, including wellbeing, justice, human rights, diversity, equity, inclusion, belonging (DEIB), and community engagement with a view to forging healthy, sustainable, equitable, and trusting relations with key stakeholders for the wellbeing of people and the planet (Hunt, 2022; World Economic Forum, 2022a). Establishing such strong, healthy and trusting relationships with multiple stakeholders does not happen in a vacuum (Sornett, Wu, 2023). The development of such healthy relationships to effect sustainable transformation at the family, organisational, community, and environmental levels begins at the individual human level, hence the focus on the human being as the conduit to transformation becomes vital (Morar, 2023; Sornette, Wu, 2023; Boaz, Fox, 2014). The World Health Organisation (WHO) defines health as a state of complete physical, mental, and social wellbeing and not merely the absence of disease or infirmity (WHO, 1948). A healthy human, with holistic physical, mental, and spiritual health coupled with dimensions of health and wellbeing that enable healthy, trusting, authentic, and equitable relationships is the foundation of the ‘social’ in ESG that underpins sustainable stakeholder engagement (Morar, 2023). Moreover, the key areas that encompass the social component of ESG signal a movement towards the whole and away from the single unit, thus raising the profile on a need for a holistic healthy human (HHH) (Morar, 2022; 2023). As such, elevating
the social enterprise and integrating the ‘S’ in ESG strengthens the social licence to operate through a holistic healthy human (HHH) at the individual human level and fosters healthy, trusting, and equitable stakeholder relationships (Morar, 2022; Dikgwatlhe, Mulenga, 2023).
The research proposes an integrated framework to understand the holistic elements of a healthy human and the resulting ESG value-add, aiming to help industry leaders build healthy, trusting, and equitable stakeholder relations.
Based on two research questions: “What are the components of a novel integrated HHH framework?” and “What is the value-add of this framework to the minerals industry?”, the objectives of this research are to:
1. Define a healthy human: Identify the key elements that embody a holistic healthy human (HHH).
2. Explore linkages: Understand the systemic interconnections between an HHH at the individual level, and the family, organisation, community, and planetary levels.
3. Propose a framework: Develop a novel integrated HHH framework.
4. Recommend actions: Provide a call to action with special considerations for the minerals industry.
Unlocking the social enterprise: A movement towards an HHH
The need to balance human aspects with technology, coupled with the impact of the COVID-19 pandemic, along with trends like The Great Resignation, quiet quitting, burnout and the rise and recent scrutiny around diversity, equity, inclusion, and belonging (DEIB), highlights the need for an elevated, integrated, and comprehensive approach to the holistic health and sustainability of human beings (Dewhurst, 2022; Ferrazi, Clementi, 2022; Huffington, Coe, 2022; Morar, 2022; World Economic Forum, 2022a; Morar, 2023). Compartmentalising health aspects is no longer viable (Brassey et al., 2023; Carvalho, 2023; Morar, 2023; Yam et al., 2024).
The movement towards holistic health and wellness in the minerals industry is gaining momentum (Yam et al., 2024). Yam and others (2024), highlighted the mining industry’s shift from revenue and safety to include human wellbeing, considering
mental health, bullying, and harassment. Sustainable solutions must support holistic health behaviours, positioning the minerals industry to manage opportunities and threats effectively. As such, while the industry may have had a greater focus on the physical side of health and safety, based on the literature, there is an argument that one should look at more dimensions of health, inclusive of the emotional and spiritual elements. The ‘S’ elements of the holistic human, such as psychological safety, DEIB, authenticity, social health and justice as well as physical, mental and spiritual health, are foundational to sustainability. This is because they cultivate trusting, inclusive, resilient, and ethically grounded human systems that foster long-term wellbeing, social cohesion, and collaborative action across families, organisations, communities, and the planet (Becchetti et al., 2022; Morar, 2023). In 2022, the top 40 global mining companies reported revenue of USD943 billion (Statista, 2024). By 2029, a 78% increase in market value for sustainable solutions for mineral products is projected (Statista, 2024). As such, by integrating sustainable solutions thinking and practices, companies stand to increase their market value significantly, based on these projections.
Safety is the top value in the minerals industry (Govender et al., 2022). Organisations have embedded safety, health, and wellbeing through initiatives, campaigns, and training (Govender et al., 2022). Post-COVID-19, the focus has expanded to a holistic approach, including mental health, psychological safety, and DEIB, addressing bullying and harassment (Yam et al., 2024).
The COVID-19 pandemic highlighted the importance of mental and emotional health, which remain a top priority (Greenwood, Anas, 2021; Dewhurst, 2022; Morar, 2022; World Economic Forum, 2022a; Morar, 2023; Wong, Greenwood, 2023). The WHO (2023), defines mental health as the state of wellbeing in which an individual realises his or her abilities, can cope with the normal stressors of life, can work productively and fruitfully, and can contribute to his or her community. Furthermore, the NIH defines emotional wellness as handling stress and adapting to change (Carvalho, 2023). Stressors like burnout and depression, exacerbated by toxic workplace behaviours, demand a holistic health approach (Carvalho, 2023).

A 2023 McKinsey survey identified job demands and lack of DEIB as key stressors. Enablers of holistic health include psychological safety, meaningful work, self-efficacy, adaptability, belonging, and authenticity, supporting positive development and the need to transform to a new world of work (Burns, Coe, 2022; Dewhurst, 2022; Allamano, 2023; Brassey et al., 2023).
The pandemic and The Great Resignation heightened the focus on spiritual health, as many individuals experienced an epiphany and sought meaning and purpose (Coleman, 2022; Morar, 2022, 2023; Brassey et al., 2023). Spiritual health, encompassing integrating meaning and purpose in life and work and connecting to something greater, reduces burnout by fostering hope, honesty, trust, organisational commitment, creativity, and productivity (Akbari, Hossaini, 2018). Moreover, it supports mental, physical, and social health, and helps regulate emotions (Akbari, Hossaini, 2018, Coppola et al., 2021; Coleman, 2022; Morar, 2022, 2023; Brassey et al., 2023).
Trust and sustainable relationships
Sustainable transformation through the ‘S’ component of ESG relies on trust, built on transparency, honesty, ethics, and integrity. Trustworthiness and a good reputation are earned by treating stakeholders well, delivering quality products or services, and engaging authentically with stakeholders (Deloitte, 2020b). This is essential for healthy, strong, and equitable relationships (Deloitte, 2020a).
Reference to the ‘trust deficit’ in the mining industry has been made by Rohitesh Dhawan, CEO and President of the International Council on Mining and Metals (ICMM) in an online podcast (Dhawan, Sutton, 2025). This reference is being made in relation to a survey and report carried out on business and society across 32 markets by GlobeScan in 2023, which included customised questions for the ICMM. The survey sought to glean insights into how people feel about the contributions of mining and metals and whether they believe the industry fulfils its responsibility to society. Functioning as a close proxy to perceptions of trust in the sector, the research highlighted that, while there is year-on-year improvement and progress of these perceptions in mining over the past few years, this progress is not fast enough, with the mining industry still at the bottom of the 18 sectors that were assessed on this metric. This highlights that poor perceptions of the mining industry insofar as fulfilling its responsibilities to society still prevail (GlobeScan, 2023).
An individual’s social health and wellbeing is crucial for building trusting relationships with others and supports better mental and emotional health (Sinclair, 2021; Brassey et al., 2023). It also enhances connection, collaboration, and co-creation at the organisational, societal, and community levels (Sinclair, 2021). In the minerals industry, building transparent, authentic, equitable, and trusting relationships with stakeholders, especially indigenous communities, is key to social health and gaining a social license to operate, a material ESG risk (Leonida, 2022). The COVID-19 pandemic highlighted social inequalities, pressuring organisations to drive social equality. Trusting relationships are built on reciprocity, teamwork, collaboration, and bridging (Sinclair, 2021; Brassey et al., 2023; Leonida, 2022; Becchetti et al., 2022).
An HHH fosters strong, healthy and equitable relationships based on trust and integrity when one feels comfortable and secure to be one’s authentic self (Collard, 2022; Zivkovic, 2022; Morar,
2023). Authenticity nurtures psychological safety, encouraging vulnerability and open communication (Edmondson, 2022; CecchiDimeglio, 2023; Gallo, 2023). This positively impacts stakeholder perceptions of sustainability and corporate social responsibility (CSR) initiatives, enhancing emotional commitment, trust, employer attractiveness, and employee engagement (Kim, Lee, 2022).
Psychological safety, as defined by Edmondson (1999), is the belief that one can speak up without fear of punishment or humiliation. It fosters an environment of low interpersonal fear, encouraging candour and vulnerability, especially when admitting mistakes (Edmondson, 2022). This promotes learning, innovation, and inclusion (Edmondson, 2022). Coetzee et al. (2023) add that psychological safety allows individuals to share improvement ideas without fear of negative repercussions. In healthcare, it influences patient safety, collaboration, and quality improvement (Ito et al., 2022). Overall, psychological safety enhances holistic health and wellbeing through open communication, trust, inclusion, engagement, and stress reduction.
Embracing diversity, equity, inclusion, and belonging (DEIB) moves beyond valuing uniform ideas and demographics (Dillon, Bourke, 2016; Bourke, Dillon, 2018). DEIB enables families, organisations, communities, and environments to embrace diverse, equitable, and inclusive perspectives, talents, markets, and customers (Dillon, Bourke, 2016; Bourke, Dillon, 2018; Korn Ferry, 2021). At the core of DEIB is promoting respectful, fair, and ethical practices and protecting individual rights (Financial Times, 2022; Livingston et al., 2022). Studies show the link between DEIB and holistic health, where discrimination, exclusion, bullying, and harassment lead to stress and illness (Livingston et al., 2022; Davis, 2024; Kocher et al., 2024). Integrating DEIB with health strategies can unlock holistic health, enhancing wellbeing and performance (Livingston et al., 2022; Maese, Lloyd, 2022; Kocher et al., 2024).
The systemic relationship between holistic healthy humans (HHH) and a healthy family, organisation, community, and planet
Fundamental shifts in sustainability at all levels require an appreciation of the systemic interconnectedness of components at an individual level (Mato-Juhas et al., 2016; Jackson, 2022; Allamano, 2023; Sornette, Wu, 2023). Deeper insight into the interconnectedness of HHH at the organisational and societal level (‘S’) and the health of the environment (‘E’) with governance principles (‘G’) is needed.
Coetzee et al. (2023) proposed a Safety Framework for the Namibian Mining Industry that integrates critical building blocks such as leadership commitment, worker participation, risk management, communication, continuous improvement, and training. While this framework is designed primarily for industrial safety, its principles align well with the concept of an HHH, particularly in small group conversations where personal wellbeing, interpersonal dynamics, and group cohesion are at play.
The holistic health of humans and the planet is inseparable –humans cannot be healthy on an unhealthy planet (Allamano, 2023; Morar, 2023; Sornette, Wu, 2023). A salutogenic approach views health as a result of interactions with various stressors (Allamano, 2023). Antonovsky’s (1979) salutogenic model shifts the focus from preventing disease to promoting resilience and wellbeing through a strong sense of coherence, including comprehensibility, manageability, and meaningfulness. Applied to ESG, it reinforces that sustainable human and planetary health are co-dependent,
where individuals who find meaning and agency are more likely to engage in regenerative, socially just, and environmentally responsible actions. The positive impact of HHH in an economic system that acknowledges that systemic interdependence is crucial (Dewhurst, 2022; Allamano, 2023).
The concept of HHH has neither been sufficiently explored in general nor its role in enhancing ESG transformation. Identified gaps include:
➤ The need for change at the individual level;
➤ The absence of an integrated HHH framework;
➤ Specific focus on the minerals industry;
➤ Links to authentic human elements, DEIB, psychological safety, and spiritual and social health;
➤ Interface and value-add of ESG;
➤ Connection between HHH and multiple stakeholders’ health.
Table 1 highlights various dimensions of holistic health. The table shows that there is a lack of a systemic, integrated framework articulating what constitutes an HHH and the inter-linkages between HHH components with family, organisation, community, and planet. Specific research on the benefits and value-add of HHH in the mining industry is also missing. These gaps support the need for a novel integrated HHH framework to advance systemic ESG transformation. The building blocks towards this framework are shown in Table 1.
The research employed a targeted sampling method, also known as purposive or judgemental sampling (Merriam, 2009). Data were gathered via semi-structured individual interviews (Box 1),
exploring participants’ understanding of an HHH. The WHO’s definition of health guided questions on physical, mental, and social health, expanded to include spiritual health. Participants were also queried on the relationship between an HHH and social health, psychological safety, authenticity, and DEIB. Interviews were recorded, and narratives were captured, forming the basis for qualitative data analysis.
The data were analysed using thematic analysis. Merriam (2009) recommended that credibility in qualitative research requires two researchers to read and evaluate interview outcomes. Two researchers conducted and analysed the interviews for emerging themes. Validity (trustworthiness) was ensured through member checking (Merriam, 2009). Themes were reviewed by a third researcher, confirming that the data interpretation reflected the interviewees’ shared perspective.
Specific individuals with relevant characteristics or knowledge were selected, focusing on those with over 20 years of experience in director, executive (C-Suite), or senior leadership roles in the minerals industry. Out of 20 invited participants, 10 were interviewed (Table 2). The cohort included 50% men and 50% women, with a mean age of 54 years, ranging from 43 to 64 years, and tenure in the minerals industry from 21 to 43 years. Interviews took place between 15 April 2024 and 6 June 2024.
Given the exploratory nature of this research and the limited prior integration of the HHH construct within ESG discourse, particularly in the minerals industry, no rigid conceptualised hypotheses were imposed. However, the study was guided by an informed expectation that elements such as authenticity, psychological safety, DEIB, and spiritual health would emerge as
The following semi-structured interview questions were used to facilitate one-on-one individual interviews with each C-Suite and Senior leader:
Questions related to inner holistic health:
1.1.1 What in your view constitutes a healthy human from the perspective of physical health and safety?
1.1.2 What in your view constitutes a healthy human from the perspective of mental health?
1.1.3 What in your view constitutes a healthy human from the perspective of spiritual health?
Questions related to interpersonal holistic health
1.1 What in your view constitutes a healthy human from the perspective of social health?
1.2 How does showing up at your authentic and real self contribute (if at all) to being a holistically healthy human?
1.3 What in your view constitutes a healthy human from the perspective of psychological safety?
1.4 How does showing up as your diverse (race, gender, people with disability, cultural ethnicity, sexual orientation, age, generation, etc.), equitable (human rights and justice), and inclusive self, contribute (if at all) to being a holistic healthy human?
Questions related to a holistic healthy human (HHH), trust and the ESG interface
2. What is your view around the relationship between a holistic healthy human and the ESG interface?
3. Within ESG, the ‘social’ component focuses on establishing trust through healthy, sustainable, and equitable relations with multiple stakeholders for the wellbeing of people and the planet. What in your view are the key ingredients to establishing and maintaining trust with these multiple stakeholders?
Questions related to a holistic healthy human (HHH) and the health and resilience of the family, organisation, community and planet
4.1 Describe your views around the link between a holistic healthy human and the health of the family?
4.2 Describe your views around the link between a holistic healthy human and the health of the organisation?
4.3 Describe your views around the link between a holistic healthy human and the health of the community?
4.4 Describe your views around the link between a holistic healthy human and the health of the planet?
Questions related to a holistic healthy human (HHH) and the minerals industry
5.1 In your view, what are the unique benefits to being a holistic healthy human within the context of the minerals industry?
5.2 In your view, what are the unique challenges to being a holistic healthy human within the context of the minerals industry?
Table 1
Building blocks that informed the novel integrated HHH framework
Name of Article Novel or supported by other literature Contributions to the research on HHH
1) Accelerating the rise of the Holistic Human.
Morar (2023).
Novel
2) Coupled system approach to healthy earth environments and individual human resilience.
(Sornette et al., 2023).
Key Words: COVID-19, resilience, system, public health, holistic system approach, individual responsibility.
3) Holistic health model of sustainable development.
(Mato-Juhas et al., 2016).
Key Words: sustainable development, health consciousness, holistic health, corporate social responsibility.
Novel
Supported by article: Accelerating the rise of the Holistic Human. Morar (2023).
- Concept of the holistic human
- Positioning within the ‘social’ of ESG coupled with its value proposition to the health of the community, organisation and planetary levels.
- Article utilised as the key foundation upon which the current research is based.
Alignment and value-add to the novel integrated HHH framework
- Concept of HHH.
- Positioning within the ‘social’ component of ESG as ‘S’ lags behind ‘E’ and ‘G’.
- Change begins at the individual human level through a holistic human and supports systemic ESG transformation.
- Building blocks of HHH include physical health and safety, psychological safety, mental health, social health, spiritual health, authenticity and DEIB.
- HHH supports the health and establishment of trusting, equitable relations at the community, organisation and planetary levels.
- Global decay in individual health resilience making populations susceptible to COVID-19.
- Global system view of stressors impacting earth health.
- Diagram of key pillars of human-environment health and resilience
- Impact of holistic health on multiple stakeholders re: Family, State, NGO’s. Media, Church, Local authority. Civil sphere.
- Modified model of holistic health consciousness
- Link between human wellbeing and earth health.
- Individual health resilience, decay and build up.
- Need for holistic medical systems thinking versus a reductionist approach.
Gaps in current literature
- Integrated novel HHH framework.
- Lens on the minerals industry.
4) Going deeper into the S of ESG: a relational approach to the definition of sustainability.
(Becchetti et al., 2022).
Keywords: corporate social responsibility, ESG, social capital, gift exchange, multidimensional well-being, sustainable development.
Supported by article: Managing the “S” in ESG: the case of indigenous peoples and extractive industries.
Pelosi and Adamson (2016).
Supported by article: Building better mining companies through ESG Leonida (2022).
- ‘S’ in ESG integrated in business slower than ‘E’ and ‘G’ and important in minerals industry re: social licence to operate.
- ‘Old school’ (compliance and regulation) versus ‘new school’ (engagement and relationship building) in shaping mining culture
- Focus on social metrics (governance) and self -evaluation of ESG scores
- Identifies gap value of relationships re: relational goods produced through meetings/encounters, friendships and associations
- Link between healthy trusting relationships & overall improved well-being of multiple stakeholders.
- Focus on holistic health and wellbeing (physical, psychological, spiritual health).
- Holistic health consciousness starting point of sustainable development.
- Link to holistic health and improved ESG.
- link between individual holistic health and impact on family, society/community.
- Context of ‘S’ of ESG (macro-economic context 4 crises incl. pandemic).
- Social pillar less advanced and lagging.
- Relational and systemic rather than ‘minimalist’.
- Link between individual health and organisational health
- Development of trusting relationships based on reciprocity, gift-giving, collaboration, cooperation, teamwork and bonding versus competing
- Link to DEIB
- Link healthy trusting relations on health of the organisation, community and environment.
- Change begins at the individual human level through an HHH.
- Link to mental health, spiritual health, social health, authenticity, psychological safety and DEIB.
- Integrated novel HHH Framework.
- Lens on the minerals industry.
- Link to authenticity, DEIB.
- Link to holistic health and development of healthy trusting, equitable relations with multiple stakeholders.
- Lens on the minerals industry.
- Change begins at the individual level through an HHH.
- Link to physical health and safety, mental health, spiritual health, psychological safety and authenticity.
- Integrated novel HHH framework.
- Lens on the minerals industry.
Table 1 (continued)
Name of Article Novel or supported by other literature Contributions to the research on HHH
5) Employee perception of corporate social responsibility authenticity: a multilevel approach.
(Kim, Lee, 2022).
Keywords: corporate social responsibility, CSR authenticity, employee perception, multilevel approach, organisational commitment, construal level theory.
Supported by article: Sustainability leadership and boards: a conceptual framework.
Zivkovic (2022).
- Alignment of individual and organisational purpose is a reflection of leader’s authenticity.
- Sustainability offers an opportunity for authentic leadership.
- Authentic and responsible leadership builds and cultivates ethically sound relationships with multiple stakeholders based on justice and care and commitment to accomplishing positive social and environmental impact.
- Multiple stakeholders (especially employees) judge / perceive the authenticity of an organisation’s ‘S’ or external CSR initiatives through observation or participation.
- When external CSR increases, employee perceptions of CSR authenticity and sincerity increase, improving emotional commitment, attachment, and employee experience.
- Negative perceptions of CSR authenticity re: perception of greenwashing negatively influences the employee’s emotional commitment and impact of the CSR initiative.
- Model showing link between external CRS authenticity and employee emotional commitment.
Alignment and value-add to the novel integrated HHH framework
- When individuals bring their ‘whole’ authentic selves to work, they engage with others in the social enterprise in a more sincere and real manner, and this influences stakeholder perceptions of CSR (social) initiatives positively strengthening emotional commitment and the development of healthy, trusting relationships with multiple stakeholders.
Gaps in current literature
- Change begins at the individual level through a HHH
- Link to physical health and safety, mental health, spiritual health, social health, psychological safety and DEIB
- Integrated novel HHH Framework
- Lens on the minerals industry.
6) The relationship of spiritual health with quality of life, mental health, and burnout: the mediating role of emotional regulation.
(Akbari, Hossaini, 2018).
Keywords: burnout, emotional regulation, mental health, Qquality of life, spiritual health. Novel
7) Social, cultural, and economic determinants of well-being.
(Livingston et al., 2022).
Keywords: wellbeing, racial trauma, discrimination, social relationships, socioeconomic status, mental and physical health, poverty.
- Strong link between spiritual health and emotional regulation vital for quality of life, mental health and job burnout.
- Religious, spiritual beliefs and activities are supporting and mediating agents that can reduce life stress and promote quality of life by giving hope and making life meaningful.
- Spiritual health was more effective on mental health (through emotional regulation) than physical health.
- Strong correlation and mediating effect of spiritual health on burnout, i.e., spiritual health decreases job burnout by creating hope, honesty and trust, promotes org. commitment, increases creativity and productivity.
- Individual, physical, mental and social health influenced by economic diversity of countries
- Poverty and low SES linked to adverse health outcomes and concerns.
- Gender discrimination key social justice issue for woman, woman of colour, and woman in low wage roles, and negatively impacts their health and wellbeing.
- Women who choose to challenge such norms may be exposed to social disapproval impacting their health and wellbeing negatively.
- Spiritual health and wellbeing (purpose, meaning, spiritual and religious beliefs) is a key component of an HHH.
- Spiritual health supports mental, physical and social health.
- Those with spiritual health will experience better mental health, adapt to stress more successfully, mitigate burnout and develop healthy, trusting relationships with multiple stakeholders.
- Change begins at the individual level through an HHH.
- Link to physical health and safety, authenticity, psychological safety and DEIB.
- Integrated novel HHH framework.
- Lens on the minerals industry.
- HHH supports the health and establishment of trusting, equitable relations at the community, organisation, and planetary levels.
- Lack of DEIB causing trauma and negatively affecting holistic health re: activating physiological, social and psychological stress responses through mental and physical bodily harm.
- COVID-19 led to global GDP shrinking impacted mental health. Increase in depression, anxiety, loneliness, suicide due to employees losing jobs, losing loved ones, searching for purpose and meaning.
- Negative impacts on employee satisfaction, leadership styles, sense of purpose and discrimination.
- Change begins at the individual level through an HHH.
- Link to spiritual health, authenticity, psychological safety.
- Integrated novel HHH Framework.
- Lens on the minerals industry.
- HHH supports the health and establishment of trusting, equitable relations at the community, organisation and planetary levels.
Table 2
Demographics of research participants
Participant 1
2
3
Participant 4
Participant 5
Participant 6
Participant 7
8
9
10
important contributors to holistic health and stakeholder trust. The research aimed to explore how senior leaders conceptualise an HHH and its value in advancing ESG outcomes, allowing themes to emerge inductively while being theoretically sensitised by existing literature.
Results and discussion
Through a thematic synopsis of collective participant responses, this section outlines the key results and findings obtained from the research.
Change begins at the individual human level
The majority of participants (80%) commented that change begins at the individual human level, “all humans are an integral part of environment and societies that we live in” and “company culture with the human first”. In support of Boaz and Fox (2014) and Sornette and Wu (2023), participants stress that this change is enabled through the ‘social’ component of ESG, “we all come together as humans and good stuff happens when ‘S’ is in place”.
Inner holistic health
Participants emphasised the elements of a physically healthy and safe human, a mentally healthy human, and a spiritually healthy human as key components constituting the inner holistic health of a holistic healthy human.
Physically healthy and safe human (1.1.1 in Figure 2)
Of the participants, 80% highlighted regular physical exercise, and 70% mentioned a balanced diet and drinking eight glasses of water as vital for a healthy lifestyle. Only 20% identified regular sleep (6−8 hours) as important, indicating that it may not be a priority for senior leaders in the industry. While various studies cite inadequate sleep in the mining sector and the impact of this on multiple dimensions of health (Maisey et. al, 2021a; Maisey et. al, 2021b), specific studies around sleep deprivation experienced by senior leaders in the mining sector is sparse, highlighting that effective and targeted fatigue management plans at this level are vital insofar as supporting the overall wellbeing of such leaders. Only 60% mentioned physical safety and working in safe conditions, despite safety being a primary value in the industry. This may be attributed to the heavier focus of the interview on various dimensions of
health, which may have led some interviewees to focus more on physical health in their response.
Mentally healthy human (1.1.2 in Figure 2)
All participants highlighted the elevation of mental health post COVID-19: “COVID-19 allowed for a mental reset.” This is in support of previous findings by Greenwood and Anas (2021), Dewhurst (2022), Morar (2022), World Economic Forum (2022), Morar (2023), and Wong and Greenwood (2023).
Reaching out to family, social, and professional networks during stressful times, was raised by all participants. While this is positive, 30% still cited compartmentalising stressors as a coping mechanism, with only 30% engaging in physical activity to cope mentally, and only 40% using breathing and mindfulness exercises, journaling, and spending time in nature to manage stress and promote balance. The implications of these findings are in support of a gradual movement towards salutogenesis with greater room for improvement in this area as regards healthier mechanisms of coping (Antonovsky, 1979).
Participants also share that: “most people are in denial when it comes to mental health – courage is often required” and “based on our backgrounds, we don’t talk to mental health issues – still a stigma that needs to be overcome”. In support of Yam et al. (2024), breaking the stigma of mental health in the minerals industry and the usage of healthy coping mechanisms for both genders at the senior leadership levels emerged as key findings that require systemic intervention. Further insights are noted in the research findings around DEIB.
(1.1.3 in Figure 2)
In support of Akbari and Hossaini (2018), Coleman, (2022), Brassey et al. (2023), and Morar (2022; 2023), as many as 90% of participants saw spiritual health as pivotal to an HHH, anchoring meaning and purpose amidst challenging times. Participants shared: “a holistic healthy human cares for his/her soul and the souls of others, has an anchor in life and is active in his/her spiritual community.” Belief in a higher force and religious practices were highlighted by 90% of participants: “there is something greater than yourself that you are a part of” and “when we decide that this is not our making alone”.
Cited as an underrated health dimension, more effort is needed in inclusively elevating spiritual health in all contexts: “one needs more of this than there currently is”. This is in support of Akbari and Hossaini’s (2018) research underscoring spiritual health as a key mediating agent in emotional regulation, by reducing stress and burnout as well as promoting quality of life through trust, hope, meaning, and productivity. The interface between spiritual health and DEIB is highlighted: “spiritual practices may be exclusive and sometimes disrespectful falling into the trap of only a Christian Way. There should be an appreciation for different cultural beliefs”.
Interpersonal holistic health
Participants emphasised the elements of a socially healthy human; an authentic human; a diverse, equitable, inclusive and belonging human; and a psychologically safe human as key components constituting the interpersonal holistic health of a holistic healthy human.
Socially healthy human (1.1.4 in Figure 2)
In support of Sinclair (2021) and Brassey et al. (2023), 90% of participants see social health as the ability to form and maintain trusting, equitable relationships through connection, collaboration and teamwork: “good social health builds trust with others” and “no man is an island - people want to connect”.
Participants described social health most often in the context of community relationships where mines are remote, followed by a description of trusting and engaging relationships with colleagues, and lastly, family relationships. This is in support of previous research by Leonida (2022) who closely aligns social health in the minerals industry as being contextualised within community relationships as well as through gaining and maintaining one’s social licence to operate.
The link between social health and DEIB was elucidated: “people need to have a sense of acceptance to have social health. When people feel a sense of belonging, it leads to a healthy and fulfilling life”. Only 50% of participants described reciprocity to be important for social health highlighting that ‘giving back’ is a key gap that requires deeper intervention, especially at the community level where healthy, trusting, and equitable relationships are necessary versus those that are one-sided.
Authentic human (1.2 in Figure 2)
All participants highlighted authenticity as central to being an HHH by strengthening healthy relationships: “being myself adds to being healthy and feeling safe, it takes away inner stress and makes me feel good - everything is aligned”. This is in support of Collard (2022), Zivkovic (2022), and Morar (2023).
Participants associated authenticity with showing up without a mask: “wearing different masks all the time is exhausting”, and “it is important for me to be sincere in my dealings with others, you don’t need a mask”. At least 40% of participants highlight the need to be measured in displaying authenticity in order to align with prescribed social norms: “need to have self-editing and be careful of the dissenting voice. Power dynamics limit how much of yourself you can bring to the job”. Such findings highlight the intricate link between showing up authentically and feeling psychologically safe to do so, in support of Edmondson (2022), Cecchi-Dimeglio (2023), and Gallo (2023).
Diversity, equity, inclusion and belonging (DEIB) human (1.3 in Figure 2)
DEIB emerged as a foundational component of an HHH,
influencing other components of holistic health (Livingston et al., 2022; Maese, Lloyd, 2022; Davis, 2024; Kocher et al., 2024). Of the participants 90% associated holistic health with fairness, dignity, respect, inclusion, belonging, and feeling valued: “I respect and value others and expect them to respect and value me - if we respect each other’s view, we will all be holistic healthy humans”, and “D&I contributes significantly to being a holistic healthy human”.
The findings show that the absence of DEIB, (namely the experience of discrimination, unfair treatment, exclusion, and the absence of belonging, and when human, social, and economic rights were infringed upon) negatively impacted mental health, physical health and safety, spiritual health, psychological safety, authenticity, and social health. Only 60% mentioned upholding basic human, social, and economic rights, with few discussing bullying, harassment, and gender-based violence. Diversity of thinking and its role in driving innovation was highlighted by only 60%, with 30% linking it to a growth and lifelong learning mindset.
Women’s holistic health and wellbeing
In support of Livingston et al. (2022), participants shared that discrimination, exclusion, and unfair practices negatively impacted women’s holistic health, leading to stress, burnout, and exiting the industry. Managing self-limiting beliefs shaped by societal narratives emerged as core to supporting their mental health: “as women, we have self-limiting beliefs – it is a tall wall to climb to overcome this and reach a point of acceptance”.
Men’s holistic health and wellbeing
A key barrier to men’s holistic health was the display of vulnerability, negatively impacting mental health and psychological safety (Sherwani, Syed, 2024). Emotional release through crying and high suicide rates among men were highlighted, in support of Flood (2021) and Peter (2023). Participants shared: “with 90% males in the room, men are not used to sharing their vulnerability. That is the measure, getting men to open up”.
Psychologically safe human (1.4 in Figure 2)
Psychological safety is a foundational enabler of the HHH framework. Participants highlighted its critical role: “feel free to deliver bad news and know that your job is not on the line” and “stopping unsafe work”. In support of Edmondson (2022) and Yam et al. (2024), 40% highlighted its link to mental health by reducing anxiety: “need to have psychological safety to address any mental health issue”.
While psychological safety was seen as an enabler of innovation: “psychological safety enables innovation, encourages creativity, and leads to better outcomes”, only 50% felt safe to make mistakes and fail, and 40% felt safe admitting they did not know all the answers. Participants noted that role modelling psychological safety is challenging, as barriers still exist preventing failure from being viewed as a learning opportunity. Intentional leader-led interventions are needed to unlock a growth and lifelong learning mindset.
Half (50%) of the participants (comprising 80% women) did not feel that mining was ready for the integration of HHH with mining practices. The reasons relate to the propensity of the minerals industry to resist change, especially when this change requires its onset at the individual human level. This lack of readiness may also relate to retaining the status quo with a focus solely on the bottom
line versus operating with a higher purpose: “mining in its entirety will never be ready” and “lots of ignorance - happy with status quo and don’t want change”.
On matters relating to silo versus holistic and systemic approaches, as many as 40% of participants believe that this resistance may be attributed to the minerals industry being ‘rough and tough’ with an ‘old school mentality’ where holistic and systemic approaches are not well regarded. This is supported by the following sentiments: “people are old school and don’t believe in the holistic view on the world...lots of scepticism around mindful meditation” and “I think it’s a hard area to get aroundour disciplines are very divided. We rarely have multi-disciplinary groups working on thing”.
While 30% of participants cited that while they supported the idea of the HHH, time, resources, and productivity pressures are possible obstacles that would need to be overcome in order to adopt and embed HHH. They further state that in order for the value-add of HHH to be felt at the family, organisation, community, and environmental levels, a strong value proposition, value-add quantification, and education are necessary.
Participants discussed the importance of bold, leader-led approaches in sponsoring the HHH. They emphasised the need for leaders to “think holistically about mining, not just focusing on the bottom line” and to be “more human leaders”.
Unique benefits of HHH to the minerals industry
Participants highlighted that despite the challenges associated with adopting and embedding HHH, the benefits it offers to the minerals industry outweighed these obstacles. This is qualified in the following.
The benefits of HHH to improved ESG transformation and performance
As many as 90% of participants commented on the value-add of HHH to improved ESG performance (2. in Figure 3): “unless you are an HHH and value all the components, you won’t be able to manage the ESG interfaces” and “HHH will support the organisation’s reputation, risk and policies and how these are implemented”. All participants commented that an HHH is most closely linked to the ‘social’ component of ESG.
Efforts to integrate HHH into ESG interventions were seen as crucial, highlighting the need for multidisciplinary collaboration to foster systemic ESG transformation. Participants emphasised deeper engagement, noting: “there is a big relationship between HHH and ESG but requires deeper thinking of the working environment, a lot of it is limited and superficial” and “there is a limit of fear from corporate to dig deeper…too much for comfort”.
Participants welcomed discussions on HHH, sharing: “it gives people an opportunity to have deep conversations, and deep thinking around the environmental impact of mines, honest discussion of what this means going forward”. Half (50%) of the participants highlighted HHH’s role in improving physical health, fitness, and safe mining practices, which is in support of the work of Govender et al. (2022) on organisation safety maturity that highlighted the social benefits to the family, community, and organisational levels.
The benefits of an HHH to improved holistic health and healthy, trusting, and equitable relationships at the family, organisational, community and planetary levels (3. in Figure 4)
Participants highlighted the positive impact of HHH on the holistic
health of multiple stakeholders and the establishment of healthy, trusting, and equitable relationships. Trust was seen as central to these relationships, involving dignity, respect, transparency, honesty, ethics, and integrity. As many as 70% of participants noted that trust was strengthened by consistent and reliable behaviour, with quotes like: “people believe you more when you have the right intention…when you are sincere” and “trust is not there when there is a disconnect between expectations, communication, and action”. Only 10% mentioned accountability as a key component of trust.
Family (4.1 in Figure 4)
In support of Mato-Juhas et al. (2016), all participants noted that being an HHH helps build and maintain strong family bonds through care, love, and support. They stated: “holistic healthy humans contribute to every family member being healthier and feeling safer. Holistic healthy humans support, teach, learn from, care for, love, protect, and respect each other”. As many as 90% of participants, highlighted the positive effects of HHH on family health and resilience, such as: “If you are not in a good place mentally and spiritually, it impacts your family dynamics... If you are an HHH, you show up better for your family”. HHH’s can also mitigate criminality and gender-based violence, creating psychological safety at home.
Organisation (4.2 in Figure 4)
Participants emphasised the importance of HHH in organisational ecosystems, stating: “the synchronised energy that flows from the drivers of holistic healthy human is undeniable” and “organisation ecosystem - organisation is nothing without holistic healthy humans”. HHHs positively affect organisational culture by creating a caring, supportive environment where people can be authentic, make mistakes, and learn. This is in support of Becchetti et al. (2022), Kim and Lee (2022), Leonida (2022), Morar (2023), and Deloitte (2024). Participants noted that: “moving towards an HHH means moving towards a human that cares”, and that authenticity and psychological safety are crucial, with quotes like “authentic self leads to authentic culture”.
As many as 90% of participants spoke about HHH enabling a health, safety, and wellbeing culture integrated into work. They stressed the need for intentional integration of HHH components with ESG values, stating: “once we work on a holistic healthy human, we get the culture right...it will become the way we do work”. The role of leaders in promoting HHH was highlighted, with participants saying: “leaders (what they say) must be in congruence with what they do (actions)”. In support of Leonida (2022) and Deloitte (2024), 70% of participants linked HHH to improved organisational performance, stakeholder engagement, and decisionmaking.
Community (4.3 in Figure 4)
All participants acknowledged the positive effect of HHH on social cohesion, collaboration, and bonding at the community level, in support of Becchetti et al. (2022), Leonida (2022), and Morar (2023). They shared that: “when we embrace a holistic healthy human, we have healthy communities and social cohesion” and “holistic healthy humans…you have a role to play to uplift others and create a better society”. However, only 40% mentioned HHH’s role in community health and resilience, and just 10% noted its contribution to environmental stewardship.
Planet (4.4 in Figure 4)
In support of Allamano (2023), Morar (2023), and Sornette and Wu
(2023), 90% of participants said HHHs care for the environment and collaborate to transform the planet for good. They commented that: “a healthy planet/environment is critical for healthy and safe individuals, families, and communities” and “our holistic healthy human behaviours help to preserve and protect the planet”. The reciprocal relationship between a healthy planet and healthy humans was emphasised, with participants noting that change begins at the individual human level through HHH efforts to reduce the carbon footprint, improve water quality, reduce food wastage, recycle, and reduce air pollution. This is particularly relevant in the minerals industry, where there are increasing expectations for responsible practices.
Novel integrated HHH framework
Based on the building blocks of an HHH as shown in Table 1, coupled with the insights gleaned from the aforementioned interview findings of this research, a key output of the research is the co-creation and development of a novel integrated framework,
which supports the conceptualisation and understanding of an HHH. The novel integrated HHH framework constitutes two key components influencing an HHH response, based on the principle that change begins at the individual human level. These components are inner holistic health (health components that are internal to the individual) and interpersonal holistic health (health components relating to an individual’s engagement with others). The interplay of these components is fluid and dynamic, as illustrated in Figure 2.
The relationship between HHH and the ESG interface highlighting the ‘S’ (social component) is shown in Figure 3. Figure 4 represents the novel integrated HHH framework, highlighting the positive effect of HHH on healthy, trusting relationships with multiple stakeholders in the context of the minerals industry.
Conclusion and recommendations
Rich insights that were gleaned from the research interviews through deep thematic analysis are summarised in Table 3. Most of the participants, i.e., greater than 80% were aligned on the key dimension that constituted an HHH.

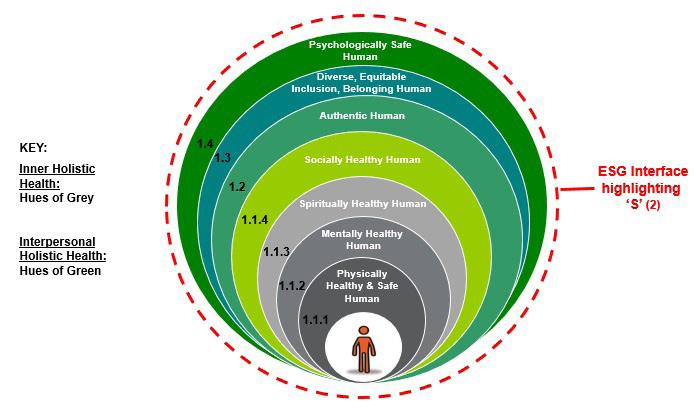
Table 3
Summary of thematic findings and participant responses
Thematic category Key finding
Change begins at the individual human level
Physical health and safety
Mental health
Spiritual health
Social health (relationships and community)
Emphasised personal responsibility as the catalyst for systemic change.
Identified exercise and diet as core; sleep and workplace safety were less prioritised.
Acknowledged increased awareness postCOVID-19 and use of healthy coping mechanisms.
Recognised meaning, purpose, and faith as under-addressed but vital.
Valued building trust, connection, and collaboration with all stakeholders, especially with remote communities. Giving back through reciprocity requires greater focus.
Exercise: 80%
Diet: 70%
Sleep: 20%
Safety: 60
Authenticity
Diversity, equity, inclusion and belonging
Psychological safety
Trust
Family health link
Organisation health link
Community health link
Planetary health link
Readiness of minerals industry for HHH
Barriers to HHH
Link between HHH and ESG interface (highlighting ‘S’)
Gendered differences
Call for leadership action
Valued authenticity but highlighted the need for balance due to power dynamics.
Viewed as foundational to holistic health and human dignity and respect. Link between diversity of thought and innovation and growth mindset requires greater focus.
Seen as essential for innovation, mental health, and mistake tolerance.
Seen as central to stakeholder relationships; linked to sincerity, reliability, and respect.
Healthy humans strengthen family resilience and safety.
HHHs contribute to caring culture, alignment, and safe performance environments.
HHHs foster cohesion and upliftment; giving back noted as underdeveloped.
Recognised interdependence between planetary and human health.
Expressed scepticism and cultural resistance to adopting HHH fully.
Maintaining industry status quo (‘old school’, ‘rough and tough’), silo thinking, resource constraints, and time pressure.
Viewed as critical to improving ESG integration, particularly in the ‘social’ component.
Women cited stress from discrimination; men highlighted barriers to vulnerability.
Need for bold and courageous, human-centric leadership to adopt and embed HHH principles.
General importance: 90%.
Reciprocal relationships importance: 50%.
100% (with 40% noting self-editing is necessary).
DEIB importance to holistic health and dignity: 90%.
Link diversity of thought to innovation: 60%, to growth mindset: 30%.
General importance: 100%.
Feel safe to fail: 50%.
Feel safe to admit not knowing: 40%.
Community benefit: 100%. Giving back: 50%.
Not ready: 50% (80% of this subgroup were women).
Maintaining status quo and silo thinking: 40%. Resource constraints, time and productivity pressure: 30%.
Not quantified, but highlighted as significant.
Qualitative emphasis across interviews.

Advancements in ESG transformation are most impactful when the components transition systemically and in unison. Currently, the ‘E’ and ‘G’ components are progressing faster than the ‘S’ component, which may limit the full potential of ESG transformation in bringing a part solution to how sustainability is enhanced. This is significant for the minerals industry in its quest to address the current ‘trust deficit’ and in securing and maintaining a social licence to operate through the development of healthy, trusting, and equitable relationships with multiple stakeholders.
In closing this gap, this study introduces a novel integrated framework for industry leaders, with a focus on change beginning at the individual human level through a holistic healthy human (HHH). The framework is a co-creation of the building blocks of an HHH as noted in Table 1, coupled with the rich insights gleaned from this study. Through the focus on inner and interpersonal holistic health components, the framework aims to enable holistic health at the family, organisation, community, and ultimately planetary levels as well as support the social cohesion and establishment of healthy, trusting, and equitable stakeholder relationships, thereby enhancing ESG transformation.
Despite some participants raising challenges around the readiness of the minerals industry in embracing an HHH, the majority expressed positive sentiments about its value. Challenges related to the minerals industry’s perceived ‘rough and tough’ and ‘old school’ nature are natural outcomes of the dissonance individuals may experience when faced with revolutionary change. However, the excitement among participants about the value-add of HHH indicates leaders’ resilience and courage to overcome this discomfort in favour of holistic health for the benefit of people and the planet. The value-add includes:
➤ Leaders of multidisciplinary functions should display systemic thinking and systemic action by connecting, collaborating, and co-creating strategic culture pillars of behaviours, mindsets, and practices that elevate the social component and lead to systemic and integrated ESG transformation with an HHH framework at the helm. At the organisational level, these functions may include business,
people and human capital, ESG, sustainability, environment, safety and health (ESH), commercial, financial, corporate social transformation, exploration, and corporate affairs. At the family, community, and planetary levels, this involves building awareness through education and practices around embracing all components of HHH and monitoring their impact on overall health.
➤ Showing up authentically is not only central to an HHH - the holistic health, safety and wellbeing of an individual, but crucial to the establishment of healthy, trusting, and equitable social relationships with multiple stakeholders. This underscores the importance of sincerity and being genuine in one’s dealing with others, despite the need to at times be measured in showing up authentically. Moreover, such authenticity will go a long way in positively impacting stakeholder perceptions of sustainability initiatives, thus building trust, employee emotional commitment, engagement, and employer attractiveness.
5➤ DEIB has emerged as a foundational component of the HHH framework, impacting multiple dimensions of holistic health, including mental, physical, psychological, spiritual, and social health. The research findings encourage accelerating DEIB transformation despite the latent resistance to the history of mankind and the current backlash around the relevance and progress of DEIB in parts of the world. Linking the value-add of DEIB with holistic health efforts as well as to a growth lifelong learning mindset and culture across multiple contexts also need to be considered in alignment with the future of work. The minerals industry should continue to uphold fair, equitable practices and integrate basic human, social, and economic rights into the value chain of business, communities, and environments.
➤ Regarding gender diversity, equity, and inclusion, intentional efforts and policy changes are needed beyond creating awareness of holistic health. Interventions should foster deeper conversations about systemic ramifications and re-authoring traditional gender narratives. These
conversations should be supported by a strong value proposition around the benefits of men and women displaying vulnerability and opening up, experiencing psychological safety in speaking up and empowerment, and showing up as their authentic selves.
➤ Holistic, inclusive, and innovative methods should raise the profile of mental and spiritual health, promoting quality of life, reducing stress and burnout, and anchoring greater purpose and meaning. These methods should be integrated into organisational culture and engagement at the family, community, and environmental levels.
Applying this novel integrated HHH framework can strengthen the social licence to operate and positively transform the minerals industry’s image and reputation.
Limitations of the research
Due to the small sample size and the purposive sampling technique used in this qualitative study, the findings cannot be generalised to a broad population of C-suite and senior leaders in mining.
The researchers acknowledge that there may be other dimensions of health that could be included in the novel integrated HHH framework. Example: the inclusion of financial health, management of debt and garnishee orders as applied specifically within the South African context was raised by at least 20% of participants. In addition, targeted fatigue management plans need to feature in executive wellbeing programmes. These components can form part of future studies on holistic healthy humans.
While the focus of this research has been on the minerals industry, and while it cannot therefore be generalised to other industries, the novel integrated holistic healthy human framework does provide a robust framework and rich insights that future studies may take up and further investigate.
Data availability
The authors do not have permission to share the data.
Acknowledgements
Acknowledgements are given with gratitude to the participants of this research for their valuable insights and contributions. VMHC Advisory is acknowledged for the time availed in leading the work presented in this paper. The work presented in this paper is part of a postdoctoral research study in the School of Mining Engineering at the University of Witwatersrand, Johannesburg, South Africa.
CRediT author contributions
Conceptualization: Varsha Morar
Data curation: Varsha Morar and Urishanie Govender
Formal analysis: Varsha Morar and Urishanie Govender
Investigation: Gordon Leslie Smith
Project administration: Varsha Morar
Supervision: Bekir Genc (Overall Paper Quality)
Writing – original draft: Varsha Morar
Writing – review and editing: Varsha Morar, Urishanie Govender, Gordon Leslie Smith, Bekir Genc
References
Akbari, M., Hossaini, S. 2018. The relationship of spiritual health with quality of life, mental health, and burnout: the mediating role of emotional regulation. Iranian Journal of Psychiatry, vol. 13, no. 1, pp. 22–3.
Allamano, C.B. 2023. What the workplace needs right now: a paradigm shift in thinking around wellbeing and sustainability. https://www.forbes.com/sites/ carabrennanallamano/2023/04/24/what-the-workplace-needsright-now-a-paradigm-shift-in-thinking-about-wellbeing-andsustainability/. (Accessed 8 November 2023).
Antonovsky, A. 1979. Health, Stress, and Coping. San Francisco: Jossey-Bass.
Becchetti, L., Bobbio, E., Prizia, F., Semplici, L. 2022. Going deeper into the S of ESG: a relational approach to the definition of social responsibility. Sustainability, vol. 14, p. 9668.
Boaz, B., Fox, E.A. 2014. Change leader, change thyself. McKinsey Quarterly. https://www.mckinsey.com/featured-insights/ leadership/change-leader-change-thyself (Accessed 2 December 2023).
Brassey, J., Herbig, B., Ungerman, D. 2023. Reframing employee health: moving beyond burnout to holistic health. McKinsey Health Institute. https://www.mckinsey.com/mhi/our-insights/ reframing-employee-health-moving-beyond-burnout-toholistic-health. (Accessed 7 November 2023).
Bourke, J., Dillon, B. 2018. The diversity and inclusion revolution: eight powerful truths. Deloitte Review https://www2.deloitte. com/content/dam/insights/us/articles/4209_Diversity-andinclusion-revolution/DI_Diversity-and-inclusion-revolution. pdf. (Accessed 6 December 2023).
Burns, T., Coe, E. 2022. Beyond Burnout: what helps – and what doesn’t. https://www.mckinsey.com/mhi/our-insights/beyondburnout-what-helps-and-what-doesnt. (Accessed 28 November 2023).
Carvalho, C. 2023. How employers can make emotional wellbeing a top priority. World Economic Forum https://www.weforum. org/agenda/2023/10/emotional-well-being-at-work. (Accessed 7 November 2023).
Cecchi-Dimeglio, P. 2023. Leadership insights: navigating the science of failing well, from psychological safety to “the right kind of wrong”. https://www.forbes.com/sites/paolacecchidimeglio/2023/08/28/leadership-insights-navigating-thescience-of-failing-well-from-psychological-safety-to-the-rightkind-of-wrong/?sh=5dffdcf04516. (Accessed 6 December 2023).
Coetzee, E., Govender, U., Ndeunyema, P., Genc, B., Mare, Y., Roux, J., Nel, J., Van Eck, G. 2023. An Integrated Safety Framework for the Diamond Mines: A Case Study from Namibia. Resources Policy, vol. 82, p. 103564.
Coleman, J. 2022. Redefining your purpose in the wake of the pandemic. Harvard Business Review. https://hbr.org/2022/03/ redefining-your-purpose-in-the-wake-of-the-pandemic. (Accessed 11 December 2023).
Collard, M. 2022. Bring your whole self: the value of authenticity. Forbes. https://www.forbes.com/sites/ forbeshumanresourcescouncil/2022/11/23/bring-your-wholeself-the-value-of-authenticity/ (Accessed 7 November 2023).
Coppola, I., Rania, N., Parisi, R., Lagomarsino, F. 2021. Spiritual well-being and mental health during the COVID-19 pandemic in Italy. Frontiers in Psychiatry. https://www.frontiersin.org/ articles/10.3389/fpsyt.2021.626944/full. (Accessed 11 December 2023).
Davis, R. 2024. Diversity, equity & inclusion initiative 2024 trends. Global Wellness Institute. https://globalwellnessinstitute.org/ global-wellness-institute-blog/2024/07/11/39100/ (Accessed: 26 July 2024).
Deloitte. 2020a. The chemistry of trust – part 1: the future of trust. https://www2.deloitte.com/content/dam/Deloitte/ca/ Documents/deloitte-analytics/ca-chemistry-of-trust-pov-aodaen.pdf. (Accessed 1 December 2023).
Deloitte. 2020b. The chemistry of trust – part 2: navigating consumer trust. https://www2.deloitte.com/content/dam/ Deloitte/global/Documents/ca-consumer-trust-pov-aoda-enpart-2.pdf (Accessed 1 December 2023).
Deloitte. 2020c. 2020 The social enterprise at work: paradox as a path forward. 2020 Global Human Capital Trends Report. https://www2.deloitte.com/cn/en/pages/human-capital/ articles/global-human-capital-trends-2020.html (Accessed: 30 November 2023).
Deloitte. 2024. When people thrive, business thrives: the case for human sustainability. https://www2.deloitte.com/us/en/ insights/focus/human-capital-trends/2024/focusing-on-humansustainability-and-employee-wellbeing.html (Accessed: 30 November 2023).
Dewhurst, M. 2022. Leading with compassion: prioritising workplace mental health. McKinsey Health Institute https:// www.mckinsey.com/mhi/our-insights/leading-withcompassion-prioritizing-workplace-mental-health? (Accessed 7 December 2023).
Dhawan, R., Sutton, C. 2025. Metals and mining: shedding light on a sustainable future. BMO. https://podcasts.apple.com/za/ podcast/metals-mining-shedding-light-on-a-sustainable-future/ id1460595264?i=1000695965681. (Accessed 15 May 2025).
Dikgwatlhe, P., Mulenga, F. 2023. Perceptions of local communities regarding the impacts of mining on employment and economic activities in South Africa. Resources Policy, vol. 80, p 103138.
Dillon, B., Bourke, J. 2016. The six signature traits of inclusive leadership. Deloitte University Press. https://www2.deloitte. com/content/dam/insights/us/articles/six-signature-traits-ofinclusive-leadership/DUP-3046_Inclusive-leader_vFINAL.pdf (Accessed 6 December 2023).
Edmondson, A. 1999. Psychological safety and learning behavior in work teams. Administrative Science Quarterly, vol. 44, no. 2, pp. 350–383.
Edmondson, A. 2022. Leading in touch times: HBS faculty member Amy C. Edmondson on psychological safety. Harvard Business Review. https://www.hbs.edu/recruiting/insights-and-advice/ blog/post/leading-in-tough-times. (Accessed 6 December 2023).
Emerick, D. 2023. The ‘E’ in ESG – Environmental Risk and Protection in 2023. https://www.esgthereport.com/what-is-esg/ the-e-in-esg/. ESG The Report. (Accessed 30 November 2023).
Ferrazzi, K., Clementi, M. 2022. The Great Resignation stems from a Great Exploration. Harvard Business Review. https://hbr.org/2022/06/the-great-resignation-stems-from-agreat-exploration. (Accessed 6 October 2023).
Financial Times. 2022. Why the ‘S’ in ESG is starting to matter (again). https://www.ft.com/partnercontent/societe-generale/ why-the-s-in-esg-is-starting-to-matter-again.html. (Accessed 30 November 2023).
Flood, M. 2021. Masculinities, emotions and men’s suicide. Sociology of Health and Illness https://onlinelibrary.wiley.com/ doi/abs/10.1111/1467-9566.13257. (Accessed 01 August 2024).
Gallo, A. 2023. What is psychological safety? Harvard Business Review https://hbr.org/2023/02/what-is-psychological-safety (Accessed 6 December 2023).
Gavin, M. 2019. Authentic Leadership: What it is and why it’s important. Harvard Business School Online. https://online.hbs. edu/blog/post/authentic-leadership. (Accessed 6 December 2023).
GlobeScan. 2023. Understanding Perceptions of Mining: Insights from general public respondents. Survey commissioned by International Council on Mining and Metals (ICMM), December 2023.
Govender, U., Van Eck, G., Genc, B. 2022. An integrated 4Cs safety framework for the diamond industry of Southern Africa. Resource Policy, vol. 77, p.102774.
Greenwood, K., Anas, J. 2021. It’s a new era for mental health at work. Harvard Business Review https://hbr.org/2021/10/its-anew-era-for-mental-health-at-work. (Accessed 11 December 2023).
Grensing-Pophal, L. 2024. 2023 Labor Trend – the shift from the Great Resignation to Quiet Quitting. https://hrdailyadvisor.blr. com/2024/02/16/2023-labor-trend-the-shift-from-the-greatresignation-to-quiet-quitting/ (Accessed 25 July 2024).
HSBC. 2023. What is ESG? (Environmental Factors) [Series 2 of 4]. https://www.businessgo.hsbc.com/en/article/what-is-the-e-inesg-. (Accessed 30 November 2023).
Huffinton, A., Coe, E. 2022. COVID-19: a catalyst to cancel burnout culture. McKinsey Health Institute. https://www.mckinsey. com/mhi/our-insights/covid-19-a-catalyst-to-cancel-burnoutculture. (Accessed 11 December 2023).
Hunt, D.V. 2022. Emphasizing the ‘S’ in ESG. McKinsey & Company. https://www.mckinsey.com/capabilities/strategyand-corporate-finance/our-insights/emphasizing-the-s-in-esg. (Accessed 4 December 2023).
Ito, A., Sato, K., Yumoto, Y., Sasaki, M., Yasuko, O. 2022. A concept analysis of psychological safety: further understanding for application to healthcare. NursingOpen, vol. 9, no. 1, pp. 467–489.
Jackson, F. 2022. Why systems thinking is the next step to sustainable growth. https://www.sgvoice.net/strategy/951/ systems-approach-to-esg-sustainability/. (Accessed 30 November 2023).
Kim, H., Lee, M. 2022. Employee perception of corporate social responsibility: a multi-level approach. Frontiers in Psychology https://doi.org/10.3389/fpsyg.2022.948363
Kocher, E., Pepe, J., Tuma, M., Natrins, I., Romanski, B., BenArzi, S., Gisbert-Tay, K., Rogers, D., Cosgrove, F. 2024. Global perspectives on inclusive well-being: the role of health and wellness coaching in fostering diversity, equity, inclusion and belonging. Global Wellness Institute https:// globalwellnessinstitute.org/wp-content/uploads/2024/02/GWIPAPER-Feb-20.pdf (Accessed 26 July 2024).
Korn Ferry. 2021. 4 steps to a more diverse, equitable and inclusive organisation. https://focus.kornferry.com/4-steps-to-a-morediverse-equitable-and-inclusive-organisation/. (Accessed 7 December 2023).
Leonida, C. 2022. Building better mining companies through ESG. Engineering and Mining Journal, vol. 223, no. 6, pp. 34–39.
Livingston, V., Jackson-Nevels, B., Reddy, V. 2022. Social, cultural, and economic determinants of well-being. Encyclopedia, vol. 2, pp. 1183–1199.
Maese, E., Lloyd, C. 2022. It’s time to synchronise your DEI and wellbeing strategies. https://www.gallup.com/workplace/389957/ time-synchronize-dei-wellbeing-strategies.aspx (Accessed: 26 July 2024).
Maisey, G., Cattani, M., Devine, A., Lo, J., Dunican, I. C. 2021a. The sleep of remote workers in a remote mining operation: methodology for a randomised control trial to determine evidence-based intervention. Frontiers in Neuroscience https:// pmc.ncbi.nlm.nih.gov/articles/PMC7817759/ (Accessed 4 August 2025).
Maisey, G., Cattani, M., Devine, A., Fu, S.C., Dunican, I.C. 2021b. Digging for data: how sleep is losing out to roster design, sleep disorders, and lifestyle factors. Applied Ergonomics, vol. 99, (2022) p. 103617.
Mato-Juhas, A., Kiss-Toth, E., Szegedi, K. 2016. Holistic health model of sustainable development. European Scientific Journal, vol. 12, p. 21.
Merriam S.B. 2009. Qualitative research: A guide to design and implementation. San Francisco, CA: Jossey-Bass.
Morar, V. 2022. Post-pandemic chronicles: the transformative power of the epiphany. Business Brief Magazine. https:// www.bbrief.co.za/2023/01/03/post-pandemic-chronicles-thetransformative-power-of-the-epiphany/. (Accessed 3 November 2023).
Morar, V. 2023. Accelerating the rise of the holistic human. Mail & Guardian https://mg.co.za/thought-leader/opinion/2023-1115-accelerating-the-rise-of-the-holistic-human/. (Accessed 15 November 2023).
Moss, J. 2021. Beyond burned out. Harvard Business Review. https://hbr.org/2021/02/beyond-burned-out. (Accessed 30 November 2023).
NJCPA. 2021. ESG 101: The Benefits and Why It is Growing in Importance. Available from https://www.njcpa.org/ stayinformed/news/blog/post/njcpa-focus/2024/01/26/ what-cpas-need-to-know-about-esg-reporting (Accessed 01 September 2024).
Pelosi, N., Adamson, R. 2016. Managing the S in ESG: the case of indigenous peoples and extractive industries. Journal of Applied Corporate Finance, vol. 28, no. 2, pp. 87–95.
Peter, G. 2023. End the stigma to deal effectively with mining’s silent killer. https://www.miningreview.com/health-and-safety/ end-the-stigma-to-deal-effectively-with-minings-silent-killer/ (Accessed 01 August 2024).
Sherwani, M., Syed, A. 2024. 5 ways to support men’s mental health and raise awareness. World Economic Forum. https://www. weforum.org/agenda/2024/03/5-ways-to-support-mens-mentalhealth-and-raise-awareness/ (Accessed 01 August 2024).
Sornette, D., Wu, K. 2023. Coupled system approach to healthy earth environments and individual human resilience. Sustainable Horizons, vol. 5, p. 100050.
Sinclair, J. 2021. What is social well-being? Definition, types, and how to achieve it. BetterUp. https://www.betterup.com/blog/ what-is-social-well-being-definition-types-and-how-to-achieveit. (Accessed 11 December 2023).
Statista. 2024. Market value of green mining worldwide in 2021 and 2022, with a forecast for 2029. Green mining global market value 2029 | Statista. (Accessed 24 July 2024).
Wong, B., Greenwood, K. 2023. The future of mental health at work is safety, community, and a healthy organisational culture. Harvard Business Review. https://hbr.org/2023/10/the-futureof-mental-health-at-work-is-safety-community-and-a-healthyorganizational-culture. (Accessed 11 December 2023).
World Economic Forum. 2022a. The Good Work Framework: A new business agenda for the future of work. https://www. weforum.org/publications/the-good-work-framework-a-newbusiness-agenda-for-the-future-of-work/. (Accessed 10 October 2023).
World Economic Forum. 2022b. The Great Resignation is not over: A fifth of workers plan to quit in 2022. https://www.weforum. org/agenda/2022/06/the-great-resignation-is-not-over/ (Accessed 28 November 2023).
World Economic Forum. 2022c. Defining the ‘G’ in ESG –Governance factors at the heart of sustainable business. https://www3.weforum.org/docs/WEF_Defining_the_G_in_ ESG_2022.pdf. (Accessed 8 November 2023).
World Health Organisation. 1948. Constitution of the World Health Organization. https://www.who.int/about/governance/ constitution
World Health Organisation. 2023. Health and wellbeing. https:// www.who.int/data/gho/data/major-themes/health-and-wellbeing. (Accessed 11 December 2023).
Yam, C., Curtin, J., Parker, S. 2024. A more holistic approach to mining safety and wellbeing. https://miningmagazine.com. au/a-more-holistic-approach-to-mining-safety-and-wellbeing/ (Accessed: 26 July 2024).
Zivkovic, S. 2022. Sustainability leadership boards: A conceptual framework. Proceedings of the 18th European Conference on Management Leadership and Governance. Link: https://papers. academic-conferences.org/index.php/ecmlg/article/view/587 (Accessed: 25 September 2024). u
19-20 NOVEMBER 2025 — CONFERENCE 21 NOVEMBER 2025— INDUSTRY AWARDS DAY EMPERORS PALACE CONVENTION CENTRE 30 JUNE 2025— ABSTRACT SUBMISSION


We are excited to announce the 2025 MineSafe Conference and Industry Awards Day a key event dedicated to enhancing safety, health, and environmental practices within the mining and metallurgical industry. This conference will serve as a vital platform for knowledge-sharing and idea exchange among key stakeholders, including mining companies, the Department of Mineral Resources and Energy (DMRE), the Minerals Council South Africa, labour unions, and health and safety practitioners at all levels in the minerals industry. The Industry Awards Day on 21 November 2025, serves as a platform to recognise individuals and organisations who achieve and portray high standards of safety, health and sustainability practices.
Promoting Learning: Facilitating the exchange of experiences and best practices to enhance safety, health, and environmental standards in the mining and metallurgical sector.
Addressing Safety, Health, and Environment: Discussing critical safety and health concerns for employees, contractors, and local communities while emphasising sustainable environmental practices.
Enhancing Relationships with Local Communities: Addressing the environmental, social, and economic impacts of mining operations to foster stronger community engagement.
Zero Harm Approach: Promoting a commitment to a workplace free from injuries and accidents, reinforcing the industry’s dedication to safety.
Value-Based Approach: Encouraging a culture where health and safety go beyond compliance and become core organisational values.
Tackling Industry Challenges: Exploring solutions to pressing industry issues such as logistics, energy consumption, and workforce safety. By bringing together a diverse group of stakeholders, this conference aims to drive meaningful collaboration


and collective action towards a safer, healthier, and more sustainable future for the mining and metallurgical industry.
Join us as we work together towards Safe Mines, Healthy Lives, and Sustainable Futures!
Sponsorship opportunities are available. Companies wishing To partner on this event should contact the Conference Coordinator.
The conference should be of value to:
• Safety practitioners
• Mine management
• Mine health and safety officials
• Engineering managers
• Underground production supervisors
• Surface production supervisors
• Environmental scientists
• Minimizing of waste
• Operations manager
• Processing manager
• Contractors (mining)
• Including mining consultants, suppliers and manufacturers
• Education and training
• Energy solving projects
• Water solving projects
• Unions
• Academics and students
• DMRE
• Occupational health practitioners
Call for papers on the topics of safety, health and environment
Prospective authors are invited to submit titles and abstracts of their presentations in English and not longer than 500 words. Abstracts should be submitted to:
For
information

Affiliation:
1School of Mining Engineering, University of the Witwatersrand, South Africa
Correspondence to: M.J. Nong
Email: Matsobane.Nong@wits.ac.za
Dates:
Received: 26 Nov. 2024
Revised: 3 Jul. 2025
Accepted: 21 Jul. 2025
Published: September 2025
How to cite:
Nong, M.J., Uludag, E., Leeuw, P.J.K. 2025.
Using the Aegis underground drill and blast analyser to optimise drill patterns: A case study. Journal of the Southern African Institute of Mining and Metallurgy, vol. 125, no. 9, pp. 533–542
DOI ID:
https://doi.org/10.17159/2411-9717/3612/2025
ORCiD:
M.J. Nong
http://orcid.org/0000-0001-7885-8785
P.J.K. Leeuw
http://orcid.org/0000-0001-5205-6127
by M.J. Nong1, E. Uludag1, P.J.K Leeuw1
Abstract
Efficient drill-and-blast performance is pivotal to the profitability of deep-level mines, where high operating costs and declining grades demand maximum throughput. This study investigated persistent fragmentation problems at a longhole stoping operation that suffered from simultaneous oversized rock blockages in 300 mm × 300 mm grizzlies and excessive fines. Fifty-one muckpile images from five blasted stopes were analysed with Split-Desktop. Although the overall F₈₀ was 287 mm, nominally suitable for the grizzly aperture, the RosinRammler uniformity index of 0.80 revealed a highly inconsistent size distribution containing both boulders and fines. Existing drill patterns were then evaluated with the Aegis underground software, which showed negligible crack overlap at the toe owing to inadequate spacing and burden. Insufficient energy overlap between blastholes, particularly at the toe, was found to contribute to the coarse fragmentation, while excessive fines were attributed to the crushing and severely fractured zones of blastholes. Optimisation simulations demonstrated that an 89 mm blasthole diameter on a 2 m × 2 m pattern would overlap, aligning with Aegis requirements of balancing powder factor, break angle, and energy distribution. Implementing this revised pattern is expected to reduce secondary breaking, prevent ore-pass blockages, lower fines, and ultimately improve overall production efficiency. The methodology illustrates how integrated image analysis and modelling software can effectively diagnose and address fragmentation issues, particularly in underground longhole mining, where challenging blasting conditions require a balance between achieving optimal fragmentation and maintaining stope stability. This approach offers a cost-effective pathway to improving comminution performance in deeplevel mines.
Keywords slope failure, risk, geotechnical controls, drilling patterns, longhole stoping, ring blasting, fragmentation, optimisation, Rossin-Rammler, Aegis
Introduction
The mining of gold in the Witwatersrand Basin in South Africa began over a century ago. The shallow high-grade gold deposits are depleted and, as a result, mines now exploit lower grade ore at deep to ultra-deep depths (Neingo, Tholana, 2016), which necessitates the optimisation of all mining processes to derive maximum value and consequently high profits from the operation.
Improving the flow of ore from the stopes to the stockpile/crusher was identified as one area of interest to improve margins. According to Shelswell and Labrecque (2014), “a fundamental aspect of an efficient mining operation is the steady movement of material throughout the mine system; particularly the flow of ore from the upstream excavation point to the downstream processing or stockpile site(s)”. Thus, a mine’s efficiency and subsequent throughput can be achieved by attaining an optimal fragmentation size from drilling and blasting activities.
Multiple fragmentation optimisation studies, such as those by Afum and Temeng (2015), Cebrian et al. (2017), Duranovic et al. (2018), Marton and Cookes (2000), Ninepence et al. (2016), Preston et al. (2019), and Strelec et al. (2011), have highlighted the importance of achieving the correct fragmentation profile in all mining operations to match downstream activities to improve the overall efficiency and reduce operational costs.
The project discussed in this paper was conducted at an underground gold mine in South Africa. The mine uses ring blasting to extract gold from the Ventersdorp Contact Reef (VCR) and the Upper Elsburg Reef in the Witwatersrand Basin. Access to the stopes is through the main access drive (MAD), which leads the development advance. The stope access drives (SADs) break away from the MAD and extend up to the regional pillars at the limit of the orebody.
To exploit the massive orebody and achieve production targets safely and economically, while controlling the behaviour of the rock mass, a series of primary and secondary longhole stopes are excavated in sequence using the checkerboard technique (Villaescusa, 2003). The technique entails the extraction of primary stopes while advancing, followed by backfilling. Once the backfill cures, stopes adjacent to the previously backfilled primary stopes (referred to as secondary stopes) are extracted on retreat and subsequently backfilled (Villaescusa, 2003). Thus, care is exercised in secondary stopes to prevent dilution of ore by over-drilling into the backfilled primary stopes. Duranovic et al. (2018) and Preston et al. (2020) highlighted challenges experienced in underground ring blasting as:
➤ Complex pattern designs because of complex orebody shapes.
➤ The concentration of energy distribution at the collar regions because of obliquely drilled blastholes.
➤ Inaccessibility and invisible open face.
➤ Requirement for perimeter control to prevent dilution.
The optimisation of fragmentation has a direct impact on the ore flow system efficiencies. When the fragmentation size is optimal for all infrastructure and transportation equipment, ore pass blockages are reduced, and ore flow efficiencies improve.
Dislodging an ore pass is a dangerous activity, which, when avoided, can drastically improve safety and minimise stoppages. Avoiding blockages can improve the probability of achieving production targets and simultaneously reduce operating losses. The research discussed in this paper was thus aimed at enabling the mine to achieve a steady state production target of 254 kt/month.
The objectives of the research were to analyse the flow of ore from the stopes to the stockpile to determine bottlenecks and inefficiencies in the system; analyse the current blast design patterns and resulting fragmentation size using the Aegis drill and blast software; and conduct software simulations to determine the correct drill and blast patterns that would provide optimal fragmentation size distribution.
The baseline mapping of the flow of ore from the stopes to the stockpile was conducted to gain an understanding of the background of the project and the processes involved. Various sources of literature and data collection methods, such as a review of company internal documents and records were consulted to add to the knowledge and build a research case. The insights gathered from this exercise were used to identify the possible bottlenecks in the system.
As mentioned, ring blasting presents unique drilling and blasting challenges compared to surface blasting. Thus, peerreviewed journal articles were surveyed to understand the factors and important considerations unique to designing ring blasts to achieve optimal fragmentation.
A Ricoh WG digital compact camera was used to capture 51 images of fragmented rock resulting from five separate blasts. The selection of stopes was guided by operational availability, focusing on those that had been recently blasted and were accessible during underground site visits. Although this approach introduces an element of convenience sampling, measures were implemented to minimise potential bias. To account for variability within each muckpile, images were taken at different loading intervals within each stope. Figure 1 shows an image of a loaded load haul dump (LHD) scoop with a spherical ball for fragmentation analysis.

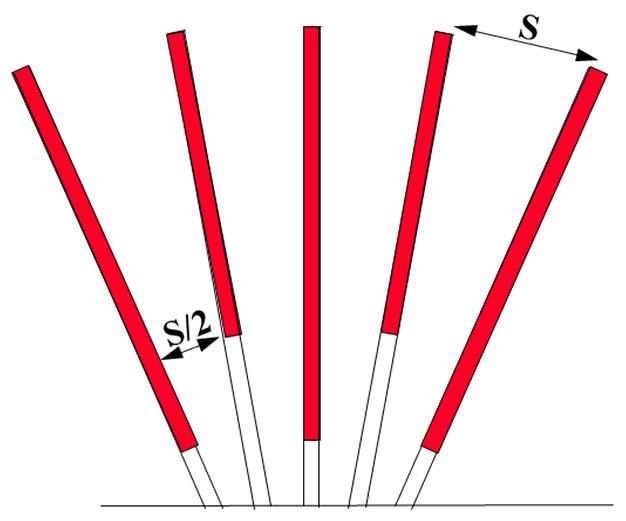
A light source was used to illuminate the muckpile, considering the dark underground working conditions, to obtain clearer pictures. A soccer ball with a diameter of 15 cm was used as a scaling object, and the Split-Desktop software was used to analyse the images to gain an understanding of the fragmentation distribution size based on the work of Bobo (2009) and Kansake et al. (2016).
The Aegis drill and blast software were used to evaluate the impact of the drill and blast patterns used by the mine at the time. Furthermore, a simulation was conducted with the software for optimal drill and blast patterns to yield an optimal fragmentation distribution size.
Literature review
Ring blasting
Ring blasting is a complex technique for rock breaking due to its geometry and requirements for stope perimeter control, and blastholes are drilled radially from a central point to the limit of a block. This results in the convergence of blastholes at the collar while they are further apart at the toes. As a result, the distribution of explosive energy is often inconsistent. Without proper planning and design, higher powder factors will be experienced at the collar as opposed to the toe. As a result, finer fragmentation will emanate from the collar region while coarser fragmentation and possibly boulders will come from the toe region. Cunningham (1992) in Figure 2 suggested the AEL method of charging blastholes in an attempt to distribute the explosive energy for optimal fragmentation.
The method in Figure 2 is based on using various charge lengths at the collar of the blastholes to distribute explosives energy (Cunningham, 1992; Onederra, Chitombo, 2007).
Mechanism of rock breakage
Drill-and-blast is the primary rock-breaking technique in hard rock mines. Although rock breakage is mainly attributed to blasting with
explosives, drilling also plays a role in rock breakage. According to Rossmanith et al. (1997), micro-cracks formed by drilling may extend radially and join preexisting cracks occupying a layer of about 2 mm around the blasthole. The creation and interaction of the cracks from adjacent blastholes result in rock fragmentation. Figure 3 illustrates the mechanism of rock breakage by explosives.
Following the detonation of an explosive, a transition from micro-cracking to macro-cracking and fracturing of the rock is observed and can be described using the zones of damage as illustrated in Figure 3. During the detonation of an explosive, a compressive shockwave and high-pressure gases are generated and at the same time, exert intense stresses on the surrounding rock mass while moving radially outward from the centre of the blasthole (Jimeno et al., 1995; Zolezzi, 1961). While the compressive shock wave induces tensile stresses in the tangential plane of the shock front and consequently creates new cracks, the high-pressure gases penetrate and expand new and preexisting cracks in the rock. The combination of the interaction of the compressive shock wave, the high-pressure gases within the rock, and the free face to allow for rock movement or heave, result in rock fragmentation. Further, when the compressive shockwave reaches a free face, it is reflected as a tensile shock wave with an associated shear failure, developing more cracks that result in rock fragmentation (Zolezzi, 1961).
The degree of fragmentation can be controlled by designing blast patterns that take into consideration the optimal interaction of controllable and uncontrollable factors. Uncontrollable rock parameters are characterised by two main geological properties of rock, namely, mechanical properties and physical properties while controllable parameters are divided into three groups, namely the geometric group, the physicochemical group, and the time group (Jimeno et al.,1995).
Given the complexity of ring blasting designs and all the factors that contribute to a successful blast, manual designs of blast patterns are often time consuming and tedious. Thus, a ring blast design computer software and good engineering judgement are necessities for an efficient mining operation (Cunningham, 1992; Chitombo, Onederra, 2007).
There are various underground drill and blast models embedded in software that enable the evaluation and design of ring blasts. The Aegis underground drill and blast software is one such software. This mechanistic model considers the mechanism of rock breakage while considering uncontrollable and controllable factors, and it uses mathematical models in its design and analysis.
The software uses four model components as discussed in Preston et al. (2019) to estimate optimal pattern designs that result in desired results such as optimal fragmentation and the minimisation of dilution. These models are the unit charge model
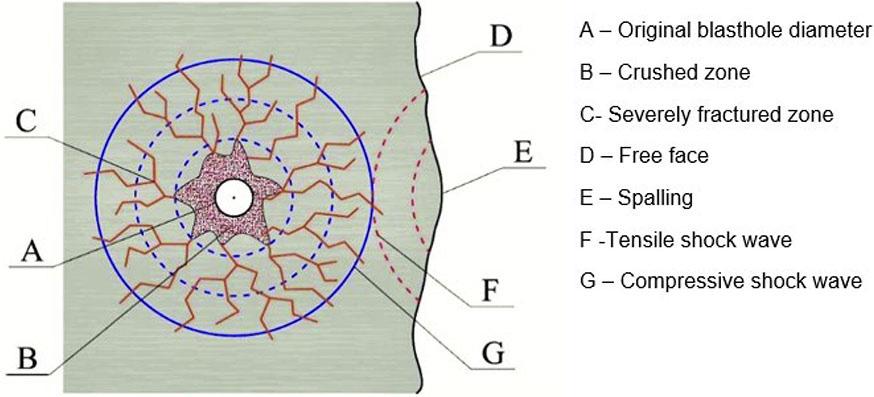
that links together the rock properties, explosive properties, and the blast pattern model; the thermodynamic energy model used in the calculation of the available energy to break the rock at a specific charge diameter; the stress reflection model used to estimate the strength of the shock wave when it is reflected as a tensile wave at the free face; and the radial break model to determine the break radius of the blasthole. Preston et al. (2019) successfully optimised ring blasts pattern designs, perimeter control, and minimisation of dilution at the Eleonore mine in northern Quebec and a mine in northern Ontario using the Aegis software.
After blasting the rings in the stopes, LHDs load and dump the fragmented rock into mine trucks, which in turn tip the rock into the ore pass tips fitted with 300 mm by 300 mm aperture grizzlies. The track bound locomotives then tram the ore from ore passes underneath the tips to the main level station tip. The ore goes through a series of ore passes to the shaft bottom, where a jaw crusher crushes the rock down to −185 mm. A series of belt conveyors then feed the crushed rock into the skips via measuring flasks for hoisting to the surface. The skips, via the head gear bin, feed the rock into another series of belt conveyors for transportation to either the stockpile or semi-autogenous grinding (SAG) mill. The analysis of the ore flow revealed that delays occurred mostly in the stopes and at the tips due to coarse and inconsistent fragmentation, which is unable to pass through the grizzlies. Sometimes secondary blasting in the stopes is required to reduce the size of the resulting boulders, and rock breakers at the tips are used to break boulders trammed by LHDs, which often results in production delays.
Achieving the correct fragmentation size has a major influence on the ore recovery, ore transportation efficiency, and crusher performance. Therefore, the size of the rock fragmented in the stopes must be below 300 mm, but at the same time not too fine to avoid gold losses in the stopes. An analysis of the fragmentation size distribution achieved by the mine based on the five blasts from five different stopes is shown in Figure 4.
The average F20, F50, F80, and maximum fragment size achieved were 24.64 mm, 124.35 mm, 287.48 mm, and 1 288.40 mm, respectively. This means that cumulatively, 20% of the fragmented rock was smaller than 24.64 mm, while 80% was smaller than 287.48 mm. The mean fragment size (F50) was 124.35

mm. These values clearly illustrate the wide variation in the size distribution of the muckpile; from very fine particles to extremely coarse fragments. The presence of a significant proportion of fines (F20 = 24.64 mm) alongside boulders exceeding 1 200 mm in size points to a highly inconsistent fragmentation outcome. Such a distribution can negatively affect both ore transportation efficiency and gold recovery, reinforcing the need for a more uniform fragmentation profile through improved drill and blast design.
Although the F80 value of 287 mm suggests that 80% of the muckpile fragments were smaller than the 300 mm × 300 mm grizzly aperture, implying that the average fragmentation was acceptable, this concealed the inherent problem in the blasted muckpile. The muckpile contained fragments of up to 1 288 mm in size, well over four times that of the grizzly opening. Combined with a Rosin-Rammler uniformity index of 0.8, this indicates a fragmentation size distribution of low uniformity with substantial deviation between fines and coarse fragments (Onederra, 2005; Singh et al., 2016; Vesilind, 1980; Wimmer et al., 2015). The low uniformity index observed in this study explains the dual fragmentation problem: The processing plant received excessive fines in the ROM feed, while significant time was also spent on secondary blasting of large rocks in the stopes and on mechanical breaking at the grizzly tips. As a result, although the bulk of material may pass through the grizzly, the remaining oversized boulders cause frequent blockages and delays. This highlights a critical limitation of relying solely on the F80 value to assess fragmentation quality. Operationally disruptive outliers can still occur in a poorly controlled size distribution. To understand the cause of the presence of fines and coarse fragmentation size distribution, an analysis of the drill patterns was done.
Table 1 shows the blast design and explosive parameters that yielded the fragmentation distribution size shown in Figure 4
A 2 m burden between rings was maintained for all blasts with the spacing between toes planned to vary between 2 m and 2.4 m. The toe spacing is determined as the perpendicular distance from the end of a blasthole to the next adjacent blasthole in the same ring as stipulated by the Julius Kruttschnitt Mineral Research Centre (JKRMC) method of measuring toe spacing (Onederra, Chitombo, 2007; Williams, 2019).
The toe spacing in ring blasting is generally based on spacing to burden (S/B) values depicted in Table 2. Although the exact ratio of S/B is not critical in ring blasting, it is generally accepted that the ratio must be greater than 1 but not more than 2, as shown in Table 2. This is due to the understanding that in ring blasting, the correct drilling pattern is one that delivers the appropriate energy at the toes of the blastholes.
Rock strength and related mechanical properties were determined through laboratory testing conducted at the University of the Witwatersrand's Gold Fields Laboratory. Tests included uniaxial compressive strength (UCS), uniaxial tensile strength (UTS), density, primary and secondary wave velocities, Young’s Modulus, and strain measurements, using core samples obtained from the mine. Additional geological and structural rock mass parameters such as joint plane orientation, joint spacing, and rock mass rating (RMR) were sourced from Joughin et al. (2006) and SRK Consulting (2006). Where necessary, standard empirical values from Onederra (2005) were used to supplement the dataset. The Holmberg-Persson attenuation constants (K and α) are incorporated into the software to predict the extent of blasthole fracturing. This
Table 1
Blast design parameters used at the mine
Table 2
Generally accepted S/B ratio for calculating the toe spacing in ring blasting (Onederra, Chitombo, 2007)
Spacing to burden ratio (S/B) Authors
1.1 – 1.4 (for blasthole diameter
76 – 115 mm)
Julius Kruttschnitt Mineral Research Centre (1996,1999)
1.5 – 2.0 Rustan (1990)
1.4 – 2.0 Myers et al. (1990)
1.3 – 1.5 Cunningham (2005)
prediction is based on the understanding that rock damage (or breakage) is related to the peak particle velocity (PPV) generated by blast-induced seismic waves (Onederra, 2005). These parameters are presented in Table 3.
The Aegis drill and blast analyser was calibrated using these site specific parameters. To reflect the influence of natural fracturing, the rock strength was conservatively set to “medium-high strength,” and the attenuation rate was assigned an “average” value. With these settings, the software was used to evaluate the performance of the mine’s existing drill patterns. An analysis of the blast patterns using the Aegis drill and blast analyser was conducted using the blast parameters in Table 1 and the rock parameters in Table 3 as input for the software. The blast patterns supplied by the mine for the research showed that the S/B ratio varied from 1 to 1.2. Crack extension analyses were also conducted for the 2 m × 2 m and 2.4 m × 2 m patterns, as presented in Figures 5(a) and 5(b), respectively. As both patterns produced similar break overlap results, the findings were consolidated and summarised in Table 4.
The crack extension analysis shows that there is no break radius and pattern overlap for all toe spacing and burden of blastholes in Figures 5(a) and 5(b). Further, the blast patterns depicted in Figures 5(a) and 5(b) show identical crack extension results for the different zones in the stated UTS range of −30% to +30%. The analysis of UTS range considers the variation in the rock strength and properties across the orebody. For example, the pattern extent radius is expected to reduce to 0.83 m when the tensile strength is 30% stronger than the static UTS but increase to 1.14 m when the UTS is 30% weaker than predicted/measured. Similarly, other extent radii of the two patterns in Figures 5(a) and 5(b) show the values of the −30% to +30% range.
The mean pattern extent radius of 0.95 m, as shown in Table
Table 3

4, indicates that for both analysed patterns, the cracks generated by adjacent blastholes would result in minimal interaction. This marginal interaction suggests that there is insufficient overlap of the fracture zones to ensure complete breakage between blastholes. As a result, the rock between blastholes is likely to rely on natural failure mechanisms, which often lead to the formation of oversized boulders in the muckpile.
Radial break model
An analysis of both patterns using the radial break model is shown in Table 5. The Aegis software has pre-determined ranges within which the various parameters of a pattern, such as the burden and spacing break overlap, reflection point, break angle, etc., should fall to yield optimal results. The burden and spacing break overlap should fall between 2% and 12%, the reflection point between 23.42 MPa and 280.63 MPa for the rock properties’ core samples analysed for this paper.
In Table 5, most parameters of the pattern fell within the required range except for the burden and spacing break overlap. Although this design may yield desired results, it is preferable to have all the parameters fall within the determined range for optimal results.

The second component of the Aegis analyser is the stress reflection model that illustrates the propagation and attenuation of the compressive shock wave through the rock mass, and the eventual reflection at the free face as a tensile wave. The Y-intercept line represents the blasthole wall and magnitude of the detonation stresses (Zone 1 of rock breakage), while the vertical faint purple line represents the free face of the blasthole. This model is highly dependent on the explosive and the rock attenuation properties. Figure 6 shows the stress reflection model for Figures 5(a) and 5(b). As shown in Figure 6, the dynamic compressive shock wave generated during detonation reaches a peak magnitude of over 8000 MPa and attenuates as it propagates radially outward from the blasthole. By the time the compressive shock wave reaches the free face, its strength is reduced to around 153 MPa, however, it is over six times greater than the dynamic UTS of the rock. When the compressive shock wave reaches the free face, it is reflected back towards the blasthole as a tensile stress wave of significant magnitude. This reflection can induce multiple spalling events, leading to coarse fragmentation, a condition further exacerbated in zones where interaction between adjacent blastholes is minimal. According to Preston et al. (2019), to minimise spalling, and
Table 4
Calculated break values for the 2 m-by-2 m pattern and the 2.4 m-by-2 m pattern
Table 5
Radial break parameter analysis for the 2 m-by-2 m and 2.4 m-by-2 m patterns
Parameter


Figure 6—The stress reflection model for the 2 m-by-2 m and 2.4 m-by-2 m patterns
consequently achieve favourable fragmentation size distribution, the stress at the reflection point should ideally lie between the dynamic UCS and the UTS of the rock. As a result, the stress at the reflection point for this pattern is acceptable.


Multiple simulations of drill patterns were conducted using the Aegis analyser to identify optimal configurations that would yield improved fragmentation and enhance ore transportation. As the
mine was trialling 89 mm blasthole diameters, simulations were carried out for both 76 mm and 89 mm holes. In addition to the blasthole diameter, the simulated variables included burden and spacing, as presented in Tables 6 and 7. Due to contractual obligations, the explosive type remained constant across all simulations. The timing configuration, comprising 10 ms intra-row and 30 ms inter-row delays, was also kept unchanged throughout the analysis. The overlap results for 76 mm blastholes achieved with various drill patterns are shown in Table 6.
The results in Table 6 were based on S/B ratios ranging from 1 to 2, in line with the recommended guidelines in Table 2. Among the 76 mm blasthole configurations, only the 1 m × 1 m pattern produced a burden and spacing overlap of 22.1%, suggesting strong crack interaction based on the radial break model. The analysis shown in Table 7 indicates that this overlap significantly exceeds the acceptable range of 2% to 12% prescribed by the Aegis software for optimal performance. An overlap of 22.1% would result in an excessively high powder factor and, consequently, a high energy concentration in the blast, increasing the likelihood of overbreak, excessive fines, and unnecessary energy wastage.
Furthermore, the extremely tight spacing in the 1 m × 1 m pattern introduces a high risk of blasthole convergence at the collars, which poses practical challenges during drilling and charging. Such a design would require highly accurate drilling practices and continuous supervision. Table 8 presents the overlap results for various drill patterns when an 89 mm blasthole diameter is used. The results indicate that overlap occurred primarily at an S/B ratio of 1. Among all the simulated configurations, only the 2 m × 2 m drill pattern achieved a burden and spacing overlap within the optimal range of 2% to 12% recommended by the Aegis software.
This pattern not only ensured sufficient crack interaction between adjacent blastholes but also maintained powder factor and energy factor values within the optimal range (see Table 9). This balance is critical in avoiding both underbreak and overbreak, while minimising the risk of generating excessive fines. Therefore, the 2 m × 2 m pattern is considered the most practical and effective design for achieving consistent fragmentation under the given site conditions.
At the time this study was conducted, the fragmentation model of the Aegis software had not been launched. However, there
Pattern simulations to determine overlap with the 76 mm diameter blasthole
Table 8
Pattern simulations to determine overlap with 89 mm diameter blastholes
is high confidence that the fragmentation size distribution will be acceptable when the statistics are within the required range. Thus, a 2 m × 2 m pattern with a blasthole diameter of 89 mm is recommended. The mine currently uses 4G electronic delay detonators with 10 ms intra-row delay timing and 30 ms inter-row


Table 9
Radial break parameter analysis for the 2 m-by-2 m patterns with 89 blasthole diameter
delay timing. Given the strength of the rock and the proposed drill pattern, it is further recommended that the mine maintains the timing plan as they are within the limits as determined by Langerfors and Kihlstrom (1963), and Grant (1990).
The objective of this study was to diagnose the underlying causes of poor fragmentation in a deep-level underground gold mine and to recommend an improved drill and blast design that simultaneously mitigates oversized boulders and excessive fines. The discussion is organised around four themes: (i) the impact of fragmentation on the ore-flow circuit, (ii) diagnostic insights from the size-distribution analysis, (iii) mechanistic interpretation of the Aegis modelling results, and (iv) operational implications of the recommended 89 mm diameter blasthole with a 2 m × 2 m pattern.
At the time this study was undertaken, there were blockages in the underground ore transportation in the stopes where oversized material required secondary blasting, and at the ore-pass tips where large boulders had to be broken using mechanical hammers. The Split-Desktop image analysis yielded an F80 of 287 mm, acceptable for a 300 mm grizzly, yet the maximum fragment size reached 1288 mm, with the Rosin-Rammler uniformity index of above 0.8. Notably, 20% of the material measured less than 24.64 mm, highlighting the prevalence of excessive fines. This combination of very fine and extremely coarse fragments reflects a poorly controlled blast outcome. It is important, however, to note that fine material will always be present in the fragmentation size distribution due to the formation of the crushed zone and the severely fractured zone, as illustrated in Figure 3. The objective is to minimise these zones while ensuring sufficient energy transfer between blastholes to promote effective crack interaction.
The baseline blast design, using a blasthole diameter of 76 mm, employed a burden of 2 m and a toe spacing ranging between 2 and 2.4 m (S/B = 1–1.2). AEGIS crack-extension analysis indicated negligible crack interaction, with a mean pattern-extent radius of only 0.95 m from each blasthole, leaving zones of minimal energy that could result in coarse fragmentation. Meanwhile, energy concentration at the collars produced excessive fines. Thus, minimal toe interaction explains the observed phenomenon of the creation of fines and boulders within the muckpile. As a result, relying solely on F80 as an indicator of fragmentation quality concealed the operational consequences of these outliers. The simultaneous occurrence of fine ROM reported by the processing plant and oversized problems underground are two symptoms of the same


underlying issue: inconsistent and suboptimal fragmentation distribution.
To overcome this problem, an exercise to optimise the blast pattern design was undertaken, with the explosives type being a constant. The 1 m × 1 m simulation of various blast patterns (combinations burden and spacing) using 76 mm blastholes achieved 22.1 % blasthole overlap at the toe, but all other combinations fell outside the recommended Aegis ranges, potentially resulting in the risk of an inflated powder factor and overbreak due to high blasting energy, potential collar convergence, and impractical drilling tolerances.
With respect to the 89 mm blasthole diameter, a 2 m × 2 m drill pattern satisfied every Aegis criterion simultaneously (all metrics fall in the green “acceptable” bands of the radial-break model), notably with the following technical aspects:
➤ A 2.26 % burden and spacing, which fell within the 2% – 12 % optimum range recommended by Aegis, would ensure controlled crack coalescence while avoiding over-break.
➤ The powder and energy factors, which fell within recommended Aegis limits, would prevent both under-break (coarse) and over-break (fines).
➤ The break angle and the stress at the reflection point, which fell within recommended Aegis limits (lies between dynamic UTS and UCS), would minimise spalling at the free face minimising coarse fragmentation.
Crucially, the larger blasthole diameter shortens the relative crack path, a benefit in the mine’s high UCS rock mass. The tighter 2 m spacing (S/B = 1) is at the lower limit of JKMRC guidance but necessary to guarantee toe interaction.
Switching from 76 mm to 89 mm blastholes presents both practical and economic implications that must be carefully considered. From a practical standpoint, the proposed 89 mm, 2 m × 2 m drill pattern offers significantly improved fragmentation control, effectively reducing both oversized boulders that require secondary blasting and excessive fines that affect recovery. Improved fragmentation is expected to enhance underground ore transportation, resulting in increased mine throughput. Additionally, the larger diameter blasthole will reduce the total number of blastholes drilled per stope, thereby increasing blasthole drilling productivity and potentially improving drilling accuracy, and consequently, fragmentation size distribution. Economically, while 89 mm consumables may be more expensive than 76 mm consumables, the overall cost may be offset by savings from reduced
Using the Aegis underground drill and blast analyser to optimise drill patterns: A case study
secondary breakage, fewer ore-pass blockages, improved drilling productivity, and gains in plant throughput and energy efficiency. The drills currently used at the mine are compatible with the 89 mm blasthole diameter drill steels, therefore the additional investment is minimal. A phased implementation, supported by a cost-benefit analysis and pilot trials in selected stopes is recommended to manage risks and ensure a successful transition.
The optimisation of drill-and-blast designs is critical to achieving consistent fragmentation, reducing ore-handling bottlenecks, and enhancing overall mine efficiency, particularly in deep-level underground gold mines in South Africa, where cost pressures and low grades demand high throughput. This study uncovered that poor fragmentation, characterised by both coarse fragmentation and excessive fines, could lead to operational inefficiencies. At the mine in which this was conducted, a Split-Desktop image analysis of underground blasted muckpiles confirmed a low uniformity index of 0.8, indicating a wide-ranging fragmentation distribution, while Aegis simulations revealed a lack of energy overlap between blastholes, contributing to the significant presence of fines and large boulders in the muckpiles. The simulation of various drill patterns demonstrated that an 89 mm blasthole diameter with a 2 m × 2 m spacing and burden configuration meets all fragmentation criteria, including controlled crack interaction, optimal energy distribution, and reduced risk of both under- and over-break. This recommended design offers a practical solution to improving fragmentation, minimising secondary breakage, and supporting efficient underground ore transportation, which could ultimately increase mine throughput.
Limitations and future work
Future research should explore the impact of varying timing layouts, including electronic detonation schemes, to further optimise energy distribution and minimise undesirable fragmentation extremes. Additionally, newer Aegis versions incorporating in situ fragmentation modules should be used to validate predicted size distributions against actual muckpile sampling, further improving the predictive accuracy of blast performance models.
Acknowledgements
This paper is based on the MSc Project Report submitted to the University of the Witwatersrand, Johannesburg. The authors would like to express their sincere gratitude to the mine and Split-Desktop for their support and for availing resources during the research. Special thanks are extended to Blast Management and Consulting for generously providing access to the Aegis software.
CRediT author statement
MJN: Conceptualisation, methodology, investigation, formal analysis, writing − original draft and editing; EU: Supervision, writing − review and editing; PJKL: Writing − review and editing (technical review).
References
Afum, B.O., Temeng, V.A. 2015. Reducing Drill and Blast Cost through Blast Optimisation - A Case Study. Ghana Mining Journal, vol. 15, no. 2. pp. 50–57.
Bobo, T. 2009. What’s new with the digital image analysis software split-desktop? Mining and Blasting, September 2009 [Online].
Available at: https://miningandblasting.files.wordpress. com/2009/09/whats_new_with_split-desktop.pdf (Accessed: 16.05.2024)
Cebrian, B., Laredo, R., Chipana, J. 2017. Ring blasting mine to mill optimization. International Society of Explosives Engineers
Cunningham C.V.B. 1992. The design of ring blasting in the 1990’s. MASSMIN 92. South African Institute of Mining and Metallurgy. pp. 263–267.
Duranovic, M., Dokic, N., Lapcevic, V., Torbica, S., Petrovic, M., Savic, L. 2018. Optimisation of ring blasting in sublevel stoping gold mine. Underground Mining Engineering. vol. 33, pp. 61–68.
Grant, J R.1990. Initiation Systems – What does the Future Hold? Third International Symposium on Rock Fragmentation by Blasting. The Australasian Institute of Mining and Metallurgy Brisbane, Queensland.
Jimeno, C.L., Jimeno, E.L., Carcedo, F.J.A. 1995. Drilling and blasting of rocks. Brookefield; A.A Balkema Publishers.
Joughin, W.C., Armstrong, R., Petho, S.Z., SRK Consulting and South Deep. 2006. Assessment of the stability of Longhole Stope backs at South Deep. The 3rd Southern African Rock Engineering Symposium. The South African Institute of Mining and Metallurgy.
Kansake, B.A., Temeng, V.A., Afum, V.A. 2016. Comparative analysis of rock fragmentation models: A case study. ResearchGate. [Online]. DOI: 10.13140/RG.2.2.10655.82081 (Accessed: 19.04.2019).
Langerfors, U., Kihlstrom, B.1963. The modern technique of rock blasting. Detroit; Wiley.
Marton, A., Crookes, R. 2000. A case study in optimising fragmentation. The AusIMM Proceedings. The Australasian Institute of Mining and Metallurgy.
Neingo, P.N., Tholana, T. 2016. Trends in productivity in the South African gold mining industry. Journal of the Southern African Institute of Mining and Metallurgy, vol. 116, no. 3, pp. 283–290. https://dx.doi.org/10.17159/2411-9717/2016/v116n3a10
Onederra, I. 2005. A fragmentation model for underground production blasting. Doctor of Philosophy degree. The University of Queensland.
Onederra, I., Chitombo, G. 2007. Design methodology for underground ring blasting. Mining Technology, vol. 116, no. 4, pp. 180–195. https://doi.org/10.1179/174328607X282244 (Accessed 06.12.2018)
Preston C, J., Williams T., Roy D. 2019. Transforming underground blasting operations into primary crushing operations. iRing INC. [Online]. Available at: https://iring.ca/articles/ISEE_ Transforming%20Underground%20Blasting%20Operations%20 into%20Primary%20Crushing%20Operations_2019.pdf (Accessed on 15 May 2024).
Rossmanith, H.P., Daehnke, A., Knasmillner, N., Kouzniak, M., Ohtsu, M., Uenishi, K. 1997. Fracture mechanics applications to drilling and blasting. Fatigue and fracture of engineering materials and structures Ltd, vol. 20, no. 11, pp. 1617–1636.
Shelswell, K., Labrecque, P. 2014. Discrete Simulations Quantifying the Effects of Material Handling Conveyors in Series or Parallel Ore flow Streams. 2014 SME Annual Meeting & Exhibit (SME
2014). 23-26 February. Salt Lake City, Utah, USA. Available at: https://0-www-onemine-org.innopac.wits.ac.za/documents/ discrete-simulations-quantifying-the-effects-of-materialhandling-conveyors-in-series-or-parallel-oreflow-streams (Accessed 15.05.2024).
Singh, P.K., Roy, M.P., Paswan, R.K., Sarim, M.D., Kumar, S., Jha, R.R. 2016. Rock Fragmentation control in opencast blasting. Journal of Rock Mechanics and Geotechnical Engineering, vol. 8, pp. 225–237.
Skrlec, V., Dobrilovic, M., Bohanek, V. 2014. Theories of rock breakage with explosives. Rudarsko Geolosko Naftni Zbornik. 29. 57-68.[Online]. Available at: https://www.researchgate.net/ publication/288310628_Theories_of_rock_breakage_with_ explosives (Accessed 16.05.2024).
SRK Consulting. 2006. Evaluation of the critical mining span based on the hydraulic radius concept and evaluation of the mining sequence for 95 1W longhole stopes. Unpublished.

Strelec, S., Gazdek, M., Mesec, J. 2011. Blasting Design for Obtaining Desired Fragmentation. Tehniki vjesnik, no. 18, no. 1. pp. 79–86.
Vesilind, P, A. 1980. The Rossin-Rammler Particle size distribution. Resource Recovery and Conservation. Elsevier Scientific publishing company, Amsterdam. pp. 275–277.
Villaescusa, E. 2003. Global extraction sequences in sublevel stoping. MPES 2003 conference. April 2003. Kalgoorlie.
Wimmer, M., Nordqvist, A., Righetti, E., Petropoulos, N., Thurley, M.J. 2015. Analysis of rock fragmentation and its effect on gravity flow at the Kiruna Sublevel Caving Mine. 11th International Symposium on rock fragmentation by blasting, 24–25 August 2015. Sydney.
Zolezzi, N. 1961. Breaking ground with explosives: a review of the theory and practice and an experimental study of blasting parameters based on single-hole blasts. MSc thesis. University of the Witwatersrand. u

Future Proofing African Mining, Today!

BACKGROUND AROUND THE THEME
• Focus on sustainability and innovation
BACKGROUND AROUND THE THEME
• Inclusivity and job creation
• Aligns to the Mining Indaba theme
• Focus on sustainability and innovation
Package 1:
• Beyond mining
• Inclusivity and job creation

Career and Leadership Conference: 18 October 2025, University of Johannesburg.
Topic: Future proofing African Mining, Today as a young professional!
Package 2:
Student Colloquium: 21 october 2025 Mintek, Randburg, Johannesburg.
THE EVENTS FOR THE MONTH:
• Aligns to the Mining Indaba theme
Naming Right (P1) (Limited to 1 Sponsor)
YPC Student Debate presented by the SAIMM Johannesburg Branch: 9 October 2025, DRA head offices.
Delegate Bags (P2) (Limited to 1 Sponsor)
Topic: Adapting the African Mining industry to changing global trends to ensure long term sustainability.
Topic: Does mining provide additional value apart from only extracting resources within communities.
• Beyond mining THE EVENTS FOR THE MONTH:
YPC Student Debate presented by the SAIMM Johannesburg Branch: 9 October 2025, DRA head offices.
FOR FURTHER INFORMATION CONTACT: Gugu Charlie, Conference and Events Coordinator E-mail: gugu@saimm.co.za Tel: +27 11 538-0238 Web: www.saimm.co.za
Topic: Does mining provide additional value apart from only extracting resources within communities. Debate Topics: Fostering innovation, infrastructure development and economic growth across various sectors.
The Johannesburg Branch in partnership with the Young Professionals Council is proud to present the Student Debate featuring The University of Johannesburg and University of the Witwatersrand. This event will provide a stage for students from The University of Johannesburg and University of the

Affiliation:
1Mechanical and Mechatronic Engineering
Faculty of Engineering and the Built Environment, Cape Peninsula University of Technology, South Africa
2Electrical, Electronic, and Computer Engineering Department, Cape Peninsula University of Technology, South Africa
Correspondence to: M.O. Ojumu
Email: mikeoluwaseunojumu@gmail.com
Dates:
Received: 23 Apr. 2024
Revised: 13 Jun. 2025
Accepted: 13 Jun. 2025
Published: September 2025
How to cite:
Ojumu, M.O., Kamoru, R.A., Orumwense, E.F. 2025. Enhancing performance metrics of an electrical-powered subsea robotic dredging crawler across varied inclination angles.
Journal of the Southern African Institute of Mining and Metallurgy, vol. 125, no. 9, pp. 543–554
DOI ID:
https://doi.org/10.17159/2411-9717/3380/2025
by M.O. Ojumu1, A.K. Raji2, E.F. Orumwense1
Abstract
This research paper introduces a novel passive method for ocean mining using an electricpowered robotic subsea dredging crawler designed to operate in various subsea conditions, including unstructured and rough terrain. The electric-powered robotic subsea dredging crawler is equipped with two driving tracks and features a complex assembly of tank tread chain link, tank tread idler wheels, tank tread sprockets, bronze bushings, motor hub, motor mount, and a 12-volt direct current motor. To evaluate the performance of the electric-powered robotic subsea dredging crawler, it was compared with existing ocean hydraulic exploration crawlers, such as MK3 ROST, in terms of drive performance on an inclined ramp with five angles of inclination (0°, 15°, 20°, 25°, 30°). The experiment aimed to determine the maximum velocity, torque, and efficiency of the crawler at different angles of inclination. The collected data were analysed and plotted using Python, and the effect of the electric-powered robotic subsea dredging crawler’s weight on its driving performance was also considered. The results of this study demonstrate a quadratic relationship between driving performance and inclination angle, which can be used to optimise the electric-powered robotic subsea dredging crawler’s performance for future ocean mining robot drive applications.
Keywords subsea crawler, angle of inclination, driving units, and dredging
Introduction
The subsea ocean dredging crawler is a crucial exploration and recovery machine utilised in the mining industry for the excavation and recovery of minerals and associated waste rocks, commonly referred to as undersea gravels, found on the ocean floor. This machine is capable of sinking to the bottom of a body of water and moving about using traction against the seabed with the aid of wheels or tracks. Tethered to a surface ship by cables providing power, control, video, and lifting capabilities, the subsea crawler is an effective tool for deep-sea exploration and mining. The process of ocean excavation involves several fundamental techniques, including ocean floor mapping, mineral location, sampling, sinking of the crawler/piloting, and dredging of the resources. However, traditional hydraulic crawlers like the MK3 ROST have been known to cause ocean pollution and consume high amounts of energy, prompting the development of a scaled-down prototype of an electric-powered robotic subsea dredging crawler (EPRSDC) that is comparable to the MK3 ROST. In this research, we aim to focus on the driving performance of the crawler and how it reacts to different elevational terrains. To achieve this, we will design the EPRSDC and ramp using SOLIDWORKS and assemble the hardware component using the Tetrix max robotics kit. The ramp was manufactured and assembled, and the findings contribute to the advancement of ocean excavation technology.
The image in Figure 1 showcases the integration of components from the Tetrix Max robotics kits in the construction of the educational prototype robot for scientific and developmental challenges (EPRSDC). This innovative assembly utilises a variety of components primarily crafted from 1050 aircraft-grade aluminum structural pieces, ensuring durability and reliability in the robot’s construction. The structural components feature meticulously machined channels with trademark patterns, incorporating 3 mm and 8 mm holes. This design allows for versatile connectivity, with holes strategically positioned at multiples of 90° and 450°, offering a high angular attachment, and flexibility during the assembly process. The ability to connect components at these specific intervals enhances the
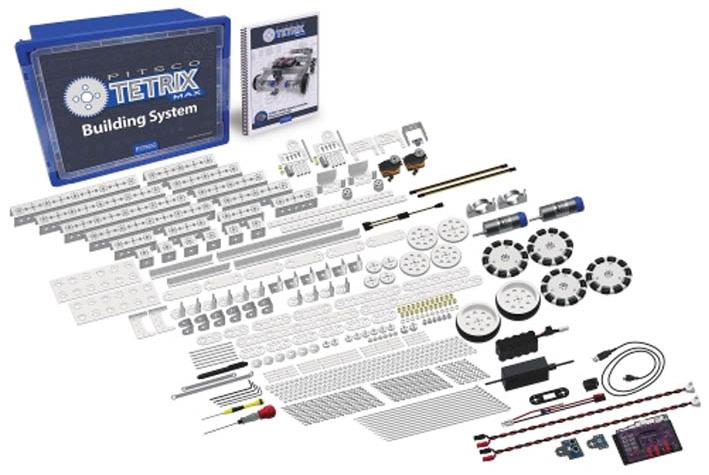
adaptability of the robot, accommodating diverse configurations to meet the unique requirements of different applications both for land and ocean robotic design prototyping.
The Tetrix Max robotics kits, responsible for the creation of these advanced components, were developed by Pitsco Education. These kits serve a multifaceted purpose, aiming to facilitate both mechanical and electrical design aspects of robotics. Beyond educational applications, they are instrumental in providing training for a wide range of robot types. Moreover, the Tetrix Max kits find application in the creation of research test benching and development purposes, demonstrating their versatility, and contribution to advancing robotic technologies into industrial based solution.
In conclusion, the Figure 1 image offers a glimpse into the sophisticated construction of the EPRSDC, highlighting the utilisation of Tetrix Max robotics kits and their meticulously designed aluminum components. This not only underscores the importance of materials like aircraft-grade aluminum but also emphasises the broader educational and developmental goals achieved through the integration of these cutting-edge robotic components.
Literature review
In the work in Van Bloois et al. (2009) the historical development of dredging and mining technology was critically discussed in the aforementioned. It was noted that the increase in dredging activities in recent years has led to significant improvements in the technology used for seafloor extraction. Compared to several decades ago when technology was limited, conventional dredging equipment can now excavate up to a depth of 300 m towards the ocean floor. The hydraulically powered ocean dredging crawlers currently in use have unique fundamental features, parts, and functions that enable effective deep-sea mining. In a seminal work by Naidoo (2013), he underscored the pivotal role that the mining of natural resources has played in the economic development of South Africa. The evolution of South Africa's mining industry is steeped in a history of apartheid, a system that perpetuated the exploitation of migrant labour and shaped the country’s mineral resources within the confines of political, social, and economic paradigms for over 140 years. The authors of this paper provide a critical analysis of the historical changes that have occurred in the country's mining industry, with particular emphasis on the impact of apartheid on the exploitation and extraction of mineral resources. This work serves as an important reference for understanding the complex relationship between the mining industry and the economic development of South Africa.
In the field of hydraulic systems, the occurrence of leaks is a well-known problem that can cause significant hydraulic pollution (Tondolo, 2012). Such leaks can originate both internally and externally to the system and can result in a decrease in its overall drive efficiency. Particularly, external leaks can be hard to detect due to the absence of visual indicators underwater until the system’s performance has been compromised substantially. It is worth noting that hydraulic ocean crawlers are prone to internal leakages as a result of wear and tear during operation, which contributes to ocean pollution and cavitation. The formation of cavities in hydraulic ocean mining crawlers is mainly attributed to the collapse of hydraulic oil bubbles resulting from soluble gas solutions, fluid dips, and rapid pressure increase.
According to Haga et al. (2001), the hydraulic ROST excavator comprises three main components, which include the undercarriage, upper structure, and front attachment. The upper structure is responsible for rotating the undercarriage, while the backhoe front attachment consists of three major components, namely the boom, arm, and bucket. The boom is the part of the front attachment that provides the lifting force, while the arm is responsible for the movement of the bucket. The bucket is designed to scoop up the material to be excavated and transfer it to the hopper for transportation. These components work together to enable the hydraulic ROST excavator to efficiently excavate mineral resources from the ocean floor. Nazaruddin and Gunawan (2015) provided an in-depth discussion on the importance of the undercarriage drive system in heavy-duty equipment, particularly in ocean dredging crawlers. The undercarriage is composed of several components that are responsible for the autonomous movement of the excavator, including the sprocket, final drive unit, track shoe, carrier roller, track frame, track chains, and front idler. Of these, the final drive unit plays a crucial role in transmitting power from the geared motor and increasing the torque for the entire track automation. further highlighted that the transmission for the arrangement is powered with a low speed of 3.6 km/h and a maximum speed of 5.5 km/h as a result of a generated motor-driven rotation of 2000 rpm. These findings demonstrate the significant role played by the undercarriage in ensuring effective movement and maneuverability of hydraulic ocean dredging crawlers. According to Daanen (2017), the development of a model that characterises the interaction between track drive systems and seabed soil was examined. The study utilised an analytical tool to assess the impact of aerometer sensors. Tracked vehicles, also known as tracked equipment, were propelled by electric motors producing rotational motion for forward thrust. The analysis distinguished between two types of track drives, namely flexible and rigid track belts. Flexible tracks were comprised of rubber belts or specific types of steel linked tracks, whereas rigid track belts utilised steel linked tracks. The operational behaviour of both types of track drives was reported to be dissimilar, with the key identifier being the ratio between road wheel spacing and track link length. Track driven vehicles can either have or lack suspension, with the suspension being a single unit for the entire track frame or a distinct unit for each road wheel. The presence of suspension was found to have an impact on the interaction between the track and the soil, which depended on various parameters. Mooney and Johnson (2014) discussed a method for solving the problem of loop closure efficiency in harsh environments using RFID technology for slippage-sensitivities in odometry 2D pose dynamic drive tracking. The proposed approach allows a robot to continuously climb rough terrain, even in unfavourable weather conditions. The
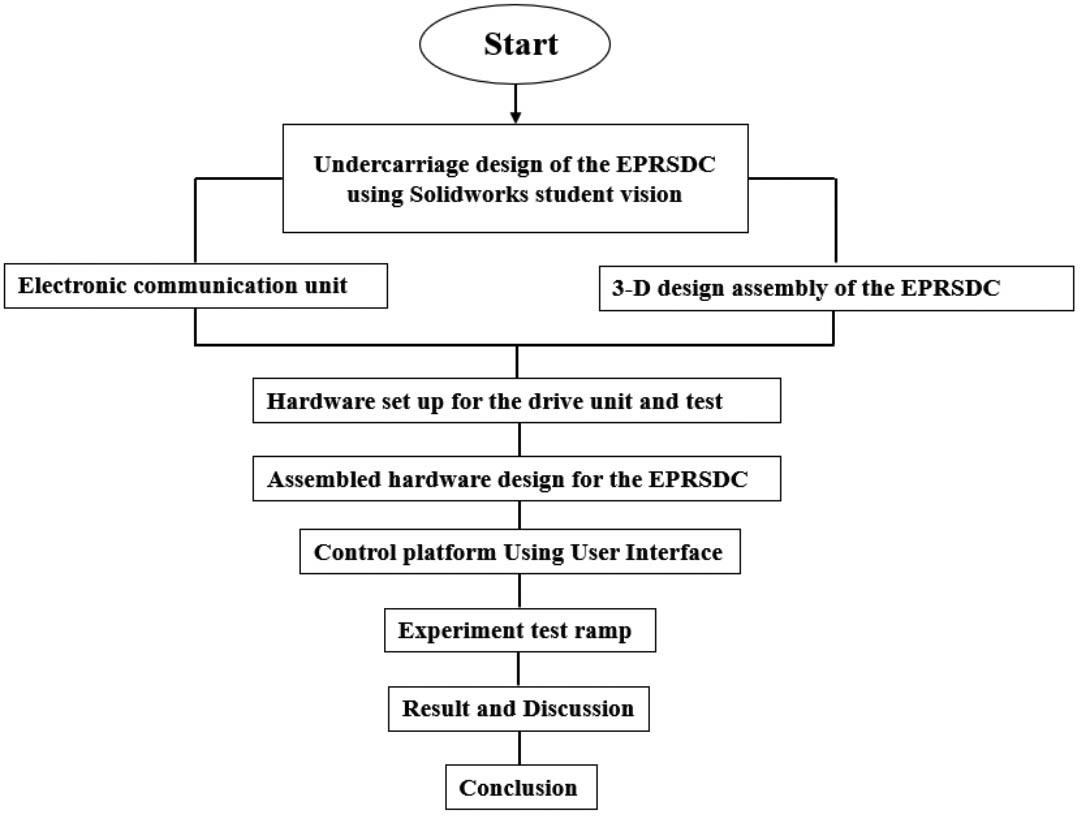
angle of elevation was evaluated on a ground driving motor such as the Lurker robot, which is capable of navigating autonomously on rough terrain with ramps and rolls. In the context of ocean exploration, robotic crawler machines are used in areas where the evaluated elevation for their driving unit is coded to its highest estimate. However, in unpredictable environments, these methods may lead to less efficient torque for climbing an open ramp elevation.
In this work, a flowchart is used to present the overall study and the methodology employed to achieve the research objectives, as illustrated in Figure 2. The study involved several steps, including 3D design structural modelling of the crawler, hardware assembly, drive test, control system, angular test inclination, data collection, and results analysis.
The first step Involves the 3D design of the EPRSDC hardware, which was assembled into three fundamental parts before the final hardware preliminary design assembly was made using Tetrix max robotics kits. The undercarriage system was subdivided into three components, namely the venturi dredging arm, the driving base, and the internal frame. The total length diameter of the design was 450 mm x 412 mm. The second step involved the hardware assembly, which entailed the fabrication of the components and their assembly into the final design. The third step involved drive test and optimisation, which involved testing the system under different conditions to optimise its performance. The fourth step involved the development of the control system, which enabled the crawler to operate autonomously. The fifth step involved the angular test inclination, which involved testing the crawler’s ability to climb and manoeuvre through challenging terrains. The sixth step involved data collection, which was carried out during the drive test and angular test inclination. Finally, the results obtained from the analysed data were used to evaluate the performance of the EPRSDC crawler.
EPRSDC’s framework undercarriage design
The undercarriage system’s primary dimension was determined by utilising a range of standardised channel sizes including 32 mm,

96 mm, 160 mm, and 288 mm, as well as various angle, flat, and connector brackets such as 144 mm, 288 mm, L bracket, inside corner bracket, inside C connector, and adjustable angle corner bracket. Additionally, 64 x 16 mm, 69 x 16 mm, 160 x 16 mm, and 288 x 16 mm flats were incorporated into the layout design to produce the final undercarriage configuration.
Figure 3 depicts the primary structural composition of the design consisting of three sections: The undercarriage, the drive system, and the arm. The frame is constructed using an assortment of materials, including channels, bars, angles, plates, brackets, flats, axles, hubs, spacers, posts, stand-offs, nuts, screws, and fasteners. The 1050 series aircraft grade aluminum was selected as the material for the fabrication of these parts.
The ocean dredging machine incorporates a boom arm with specific degrees of freedom. The arm is equipped with an end effector manipulator that enables the dredging and pressure pump nozzles to operate within fixed parameters. To enhance the performance of the machine, a venturi nozzle was developed using 1050 aircraft grade aluminum and was subsequently connected to the 12-volt dredging pump.
Figure 4 depicts a two-degree-of-freedom (2-DOF) boom arm featuring a venturi dredging nozzle. The 2-DOF is regulated by a 6.7-volt DC servo motor that receives control signals from an NI myRIO to the servo control. The purpose of the boom arm’s design


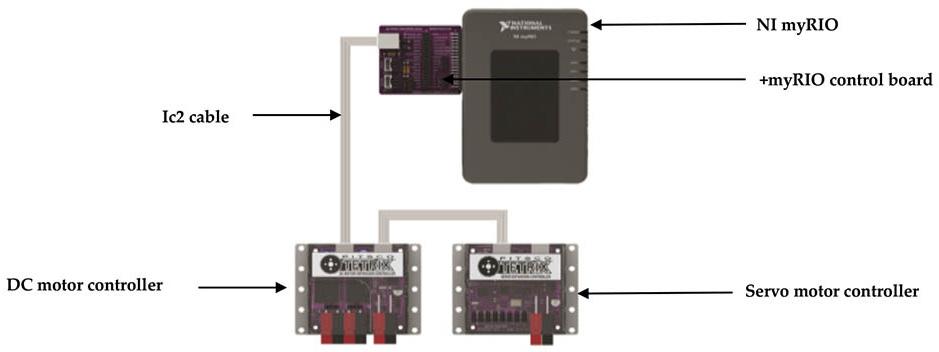
is to facilitate the extraction of materials. Both the boom arm and venturi dredging nozzle were constructed from 1050 series aircraftgrade aluminum. The servo motors were affixed using a servo motor single standard-scale bracket and standard-scale pivot arm with bearings. A 180-degree Dsservo Ds3225 25kg metal gear high torque waterproof digital servo was employed to control the boom arm.
EPRSDC with undercarriage tank tread chain idler drive base
Figure 5 illustrates the structural composition of the electricpowered robotic subsea crawler undercarriage drive system. A 288 mm x 160 mm x 96 mm stand-up pulls boxed frame was specifically designed with a total tank tread chain link of 406 mm in length. The tank tread sprocket was attached to a motor hub, which, in turn was connected to a 12-volt torquenado motor shaft, enabling the track to rotate both clockwise and counterclockwise. Tank tread idle wheels were employed to facilitate parallel drive for the chain link and to design the shape of the crawler drive system. The electronic motor controller was utilised to regulate the 12-volt torquenado motor.
Electronic communication unit
The power system was sourced from a 12-volt 3000 mAh rechargeable NiMH battery pack comprising ten cells. The power supply is directed through an emergency switch to the servo motor controllers, with a wire being looped to the DC motor controllers. Subsequently, a wire was connected from the motor controller to the NI myRIO. Communication between the NI myRIO, motor
controller, and servo motor controllers was established via the iC2 cable.
Figure 7 displays the utilisation of SolidWorks for modelling the EPRSDC. This software facilitates the adjustment of individual parts, including the drive units, internal frame, and dredging arm, thereby streamlining the final design assembly process. The scalability of this design renders it suitable for large-scale industrial manufacturing of the EPRSDC. In the case of the scaled-down prototype, all electronic components were precisely positioned using Solidworks mates to achieve a realistic 3D visualisation of the model. The software was instrumental in assembling the three undercarriage systems of the EPRSDC. 3D software is essential for designing the robot’s structural and hardware components as it affords complete freedom and flexibility in the development process, from conceptualisation of the design to hardware manufacturing.
As depicted in Figure 8, the test bench connection of the driving system for the EPRSDC is displayed. The driving system comprises of two DC motors utilised by the vehicle. These DC motors enable the turning of the sprocket, rotating the chain link, and the idle wheels in the same direction, either clockwise or counterclockwise. Consequently, the robot turns in the corresponding direction while navigating towards the dredging unit.
Assembled hardware for the EPRSDC
Figure 9 showcases the fully assembled hardware design of the EPRSDC. The robot’s drive system comprises of two-way units, each with 110 tank tread chain links measuring 450 mm x 412 mm. The tank tread idle wheels were positioned at an angle of 45° to enable the crawler to drive on inclined surfaces. The tank tread sprockets were designed with a like-type chain to enable drive rotation for the crawler with a shaft still torque of 9.88Nm at 100% power.


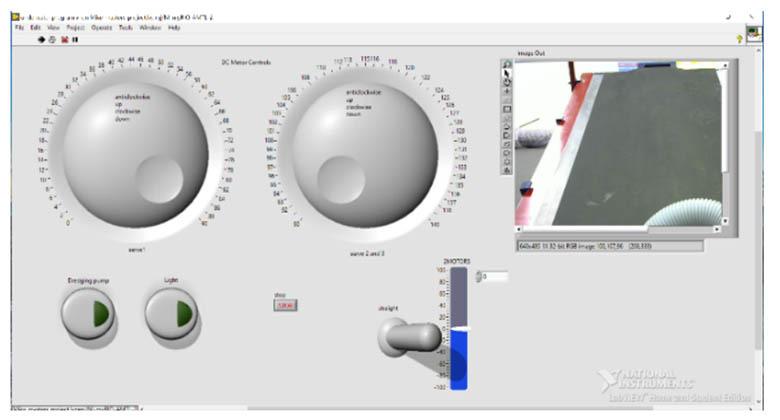
To control the robot, NI-myRIO 1900 was used as a controller, and a Logitech c110 webcam was connected to the NI-myRIO for environment visual signal. A laptop was used to communicate with the NI-myRIO via an IP address. The LabVIEW algorithms software was used to operate and control the crawler. The dredging and seabed jetting system pumps were mounted on the crawler arm and back pump base, respectively, using two 12-volt SAIFLO pumps. A two-way relay module, 30A 5–12-volt high low-level trigger relay system was used to control these units. The relay system was connected to a DIP from the NI-myRIO, and a block software was used to connect to the user interface for operation.
Figure 10 displays the controller unit (CU), also known as the user interface, which serves as the software platform for transmitting instructions from the computer to the NI myRIO, enabling the crawler to execute various functions. The knob servo controllers (1, 2, and 3) were utilised to regulate the first and second joints of the two-degree-of-freedom (2-DOF) boom arm. The servo motor was duplicated at the second joint (2 x 25 kgcm) due to the weight of the boom arm (0.548 kg), which gave sufficient torque to lift its weight. The moment of the force acting on the arm was determined by multiplying the total arm length by the weight (0.54 x 15.5 kg), which equalled 8.494kg/cm for the arm with a uniformly distributed load of (0.548 kg). The two-motor control knobs were calibrated from 0% to 100% to lift the arm on the first or second joint, and from -0% to 100% to return the boom arm to its initial position. The slider was used to move the EPRSDC forward from +0% to 100%, and backward from -0% to -100%. The motor controller switch button (straight) enabled the change of the drive system direction (clockwise and counterclockwise). The emergency button was designed to halt the entire control system during operation in the event of software malfunction. The camera system was utilised to send real-time videos and images to the control room, enabling the
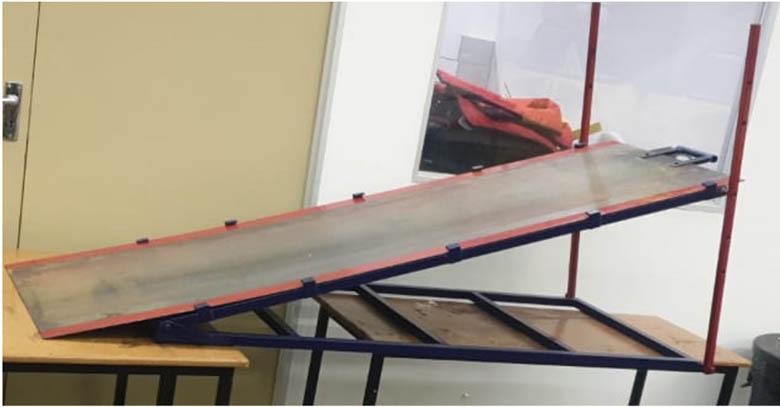
crawler operator to view the operational environment. The pump and light switches were used to turn the dredging pump on or off.
As depicted in Figure 11, the experimental setup involved adjusting the ramp to five distinct angles using the two arms, which had holes designed to act as stoppers for the various degrees of inclination (0°, 15°, 20°, 25°, and 30°). After the height adjustment, the crawler was operated to climb the ramp and drive a distance of 1.8 metres. The ramp was fabricated using 25 mm x 25 mm steel tube pipes with a 3 mm thick surface drive sheet. The experimental procedure was conducted three times for each inclination category, and the results were recorded.
The obtained outcome presents an experimental evaluation of the EPRSDC's drive performance across a range of ramp inclinations.
Recording the maximum velocity at various angles of inclination for the EPRSDC is crucial for optimising its performance and ensuring drive safety, as shown in Table 1. Different angles of inclination simulate diverse terrains and challenges the EPRSDC might encounter. By systematically measuring the maximum velocity at each angle, engineers can determine the crawler’s capability to navigate slopes and uneven surfaces.
This data is essential for designing efficient control algorithms, as the crawler’s performance can vary significantly based on the incline. Understanding the limitations and capabilities at different angles helps fine-tune the crawler’s control systems, allowing for better responsiveness and stability during real-world operations.
Moreover, recording maximum velocities provides insights into the crawler’s overall efficiency and power distribution across varying terrains. It aids in the development of predictive models to anticipate performance under different conditions, contributing to the crawler’s reliability and adaptability in practical applications in subsea mining activities.
Figure 12 provides a visual representation of the evaluation of the EPRSDC performance. The evaluation specifically focuses on measuring the time it takes for the crawler to cover a ramp distance of 1.8 metres at a 0° angle of inclination. The experiment was carried out under the condition that the crawler was operating at its maximum capacity, which is specified as 100%.
The experiment was conducted three times, for the purpose of ensuring consistency and reliability of the results. After each trial, the time taken for the crawler to cover the specified ramp distance was recorded. The average time taken from these three trials was calculated to be 5.9 seconds.
This information suggests that under the described conditions, the EPRSDC is capable of covering a ramp distance of 1.8 metres
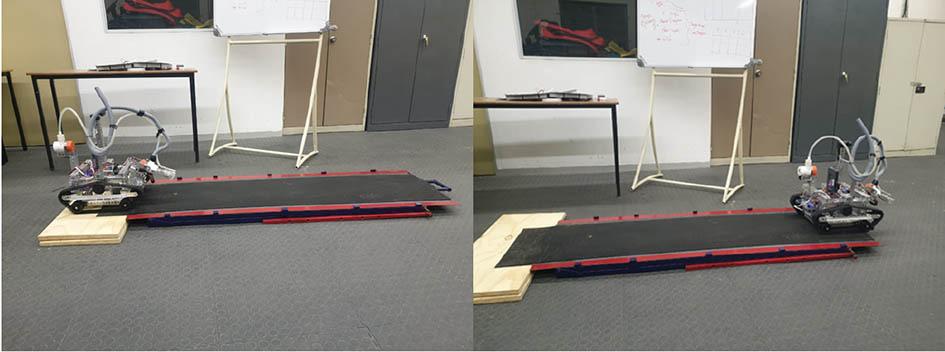

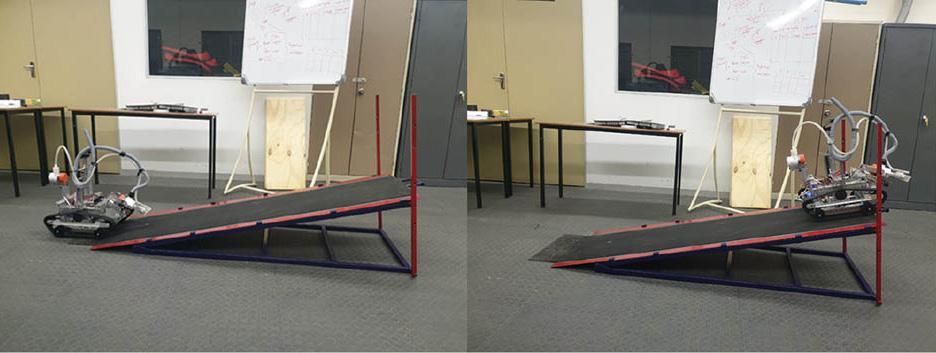
at a 0° angle of inclination, in an average time of 5.9 seconds when operating at its maximum capacity. This data provide insights into the speed and efficiency of the crawler under these specific conditions, offering valuable information for assessing its performance in real-world applications. Table 1 shows all the drive test result at 0 angle of inclination.
Figure 13 depicts the outcome of a drive test experiment conducted on the EPRSDC with a ramp angle of 150. During this experiment, the crawler was operated at its maximum power output, set at 100%, while covering a distance of 1.8 metres.
The primary parameter measured in this experiment was the time taken to complete the specified task. To ensure reliability, the experiment was conducted three times, and the obtained results were averaged. The average time recorded for the crawler to cover the 1.8-metre distance under the specified conditions was 9.0 seconds.
This information provides insights into the performance of the crawler under specific conditions, particularly at a ramp angle of 15 and operating at maximum power output. The recorded average time can be considered as an indicator of the efficiency and speed of the crawler in completing the assigned task within the given parameters. Table 1 shows the result for the data collected for the test at 15° inclinations.
As seen in Figure 14, the results of a drive test experiment conducted on the EPRSDC over a ramp inclination of 20°. In this experiment, the crawler was operated at its maximum power level, set at 100%. The primary metric measured was the time taken by the crawler to cover a distance of 1.8 metres on the inclined ramp, and three consecutive trials were performed to evaluate the average time taken, as seen in Table 1.
After conducting these trials, the average time taken by the crawler to cover the 1.8-metre distance was calculated. The average time, as stated, was recorded to be 7.2 seconds.
The results suggest that, on average, it took the EPRSDC 7.2 seconds to traverse the specified distance over the 20 inclined ramp when operating at maximum power (100%). This average provides a summary measure of the crawler’s performance under these specific conditions.
The results obtained from the drive test experiment on the crawler provide valuable insights into its performance under maximum power conditions and at a specific inclination angle of 25 degrees. The distance covered by the crawler, which was 1.8 metres on the ramp, serves as a critical metric for evaluating its mobility and efficiency in traversing inclined surfaces. By conducting the experiment three times and calculating the average time taken (8.5 seconds), a robust methodology was employed to mitigate potential variability and enhance the reliability of the findings. This repetition not only ensures consistency but also contributes to the overall accuracy of the observed performance metrics, as seen in Table 1.
The scientific significance of these results lies in their applicability to real-world scenarios where crawlers may need to navigate challenging terrains with varying degrees of inclination. The combination of distance covered, and time taken to complete the task provides a comprehensive understanding of the crawler’s capabilities, aiding in the optimisation of its design and functionality for specific applications. The experiment’s controlled conditions and systematic approach enhance the validity of the outcomes, making them a valuable reference for further research and development in the field of crawler technology and robotics.
The experimental setup depicted in Figure 16 aimed to assess the performance of the crawler under specific conditions, namely at an inclined angle of 30. This angle was chosen to simulate a scenario where the crawler encounters an inclined surface, requiring it to traverse the incline. The crawler was operated at its maximum power level of 100%, providing a standardised condition for the assessment. The primary metric for performance evaluation was the time taken by the crawler to traverse a predefined distance of 1.8 metres on the inclined ramp. To ensure reliability and minimise variability, the experiment was replicated three times, and the average time taken over these repetitions was determined to be 9.9
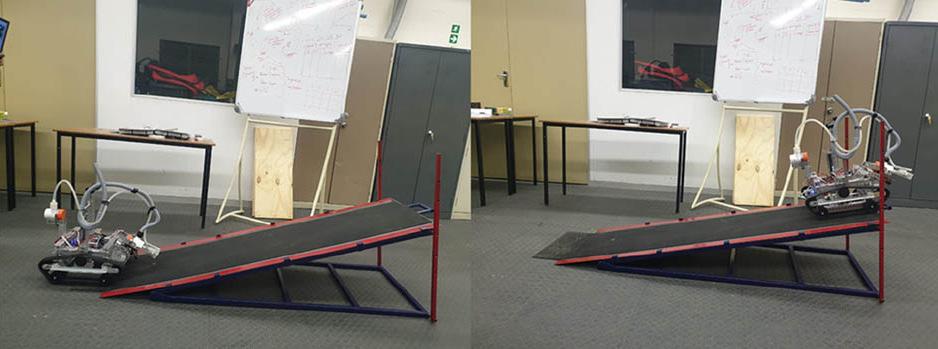
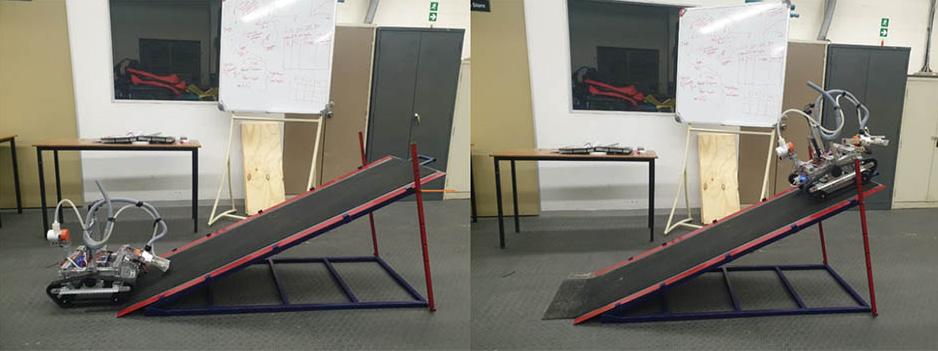
seconds. This averaging approach helps mitigate potential outliers or random fluctuations, providing a more representative measure of the crawler’s performance under the specified inclined conditions.
The utilisation of an inclined angle in the experiment is crucial as it introduces an additional challenge to the crawler’s locomotion system, simulating real-world scenarios where environmental conditions may not be entirely flat. The choice of maximum power level ensures that the crawler is operating at its peak capacity, allowing for a comprehensive assessment of its capabilities. The repetition of the experiment and subsequent calculation of the average time taken enhance the robustness of the results, contributing to a more reliable evaluation of the crawler’s performance under the specified conditions. These methodological considerations contribute to the scientific rigor of the experiment as seen in Table 1, enabling meaningful insights into the crawler’s behaviour on inclined surfaces.
The relationship between torque and velocity at a 0° angle of inclination is crucial for the study of EPRSDC due to its impacts on their ability to move effectively on the seabed as recorded in Table 2. At this angle, which represents a flat surface, torque becomes more critical for overcoming resistance and obstacles, allowing the robot to generate sufficient force to traverse uneven terrains. In contrast, velocity (speed) may be less important in such scenarios, as the emphasis lies on the robot’s ability to exert the necessary torque for efficient movement in a challenging subsea environment.
Figure 17 depicts the relationship between the torque and velocity of the crawler at an angle of inclination of 0°. The experiment involved recording the time taken to cover a distance of 1.8 metres at different torque values. The motor power was varied at five levels using the user interface as follows:
➤ At 20% maximum power, the crawler did not exhibit any forward movement. This indicates that within the power range of 1% to 19%, the crawler weighing 8.173 kg failed to initiate motion.
➤ At 40% maximum power, the crawler took 25.7 seconds to complete the 1.8 m drive task.
➤ At 60% maximum power, the crawler took 12 seconds to complete the 1.8 m drive task.
➤ At 80% maximum power, the crawler took 7 seconds to complete the 1.8 m drive task.
➤ At 100% maximum power, the crawler took 6 seconds to complete the 1.8 m drive task.
Torque versus velocity at 20° angles of inclination
Figure 18 displays the correlation between torque and velocity at an inclination angle of 20. The experiment involved recording the time taken for the crawler to cover a distance of 1.8 metres at various torque values, as presented in Table 3. Motor power was increased to five different levels as follows:

➤ At 20% of maximum power, the crawler did not exhibit any forward motion. This indicates that within the power range of 1% to 19%, the 8.173 kg crawler was unable to move.
➤ At 40% of maximum power, the crawler completed the 1.8 m drive task in 41 seconds.
➤ At 60% of maximum power, the crawler completed the 1.8 m drive task in 15 seconds.
➤ At 80% of maximum power, the crawler completed the 1.8 m drive task in 9.9 seconds.
➤ At 100% of maximum power, the crawler completed the 1.8 m drive task in 7 seconds.
Minimum torque versus different angles inclination
Figure 19 and Table 4 collectively demonstrate the minimum torque values corresponding to different inclination angles, as detailed below:
➤ EPRSDC at 0° inclination with a minimum torque of 30% of the maximum torque.
➤ EPRSDC at 15° inclination with a minimum torque of 32.6% of the maximum torque.
➤ EPRSDC at 20° inclination with a minimum torque of 34.3% of the maximum torque.
➤ EPRSDC at 25° inclination with a minimum torque of 35.6% of the maximum torque.
➤ EPRSDC at 30° inclination with a minimum torque of 37.3% of the maximum torque.
Result discussion
Ocean driving technology is a complex field that requires a thorough understanding of the relationship between driving efficiency and torque at various angles of inclination. To evaluate the effectiveness of the EPRSDC in driving under different ocean terrains, a series of tests were conducted and the data were recorded in a table. By plotting the data into graphs, it was possible to analyse the results and determine if the EPRSDC is capable of efficiently driving at certain angles of inclinations in different ocean environments.
The following conditions were assumed for EPRSDC:
➤ There is no slippage between the tank tread chain link and the rubber surface of the ramp.
➤ The system is considered ideal, meaning that there are no losses and all energy generated by the motor is converted entirely into the translational motion of the driving base.
The rotational torque of the 12-V DC torquenado motor, denoted as N, is calculated based on a rotational speed of 100 RPM, resulting in an angular speed (ω) of 10.47 rad/s. The maximum torque produced by a single motor is 4.94 N/m (700 ozin). Two motors were used for propelling the crawler with a total torque of 9.88 Nm. The power input is determined by multiplying the torque (9.88 Nm) by the angular speed (10.47 rad/s), resulting in a

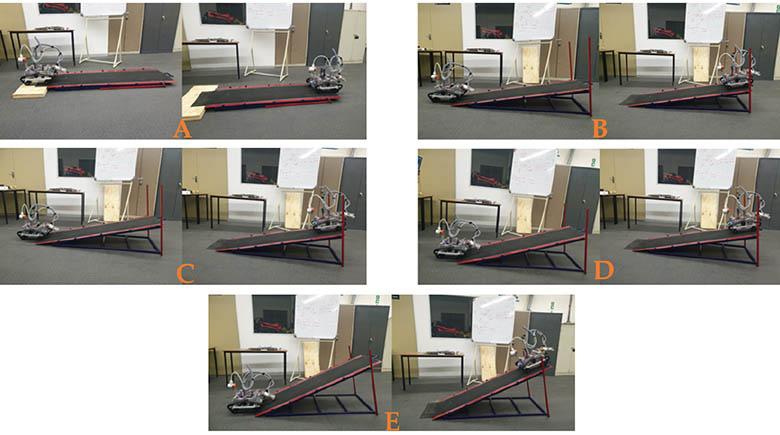
Table 1
Maximum velocity versus different angles of inclination

20—Graph of maximum velocity versus different angles of inclination
Table 2
Torque versus velocity at 0° angles of inclination

maximum power of 103.44 watts for the two motors. The efficiency of the system is then calculated as the ratio of power output to power input, where the power output is determined by multiplying the weight (81.73 N) by the velocity.
As shown in Figure 20, the experiment aimed at determining the maximum velocity of the EPRSDC at different angles of inclination. The resulting graph shows a quadratic relationship between the maximum velocity and angle of inclination, with Equation 1:
-8.94714809e-05x2-1.39638932e-03x+ 3.04207745e-01=0 [1]
The data presented in Table 1 shows that the maximum velocity of the crawler decreases as the angle of inclination increases, following a roughly quadratic pattern. For instance, at an inclination angle of 0, the maximum velocity was 0.305 (high), while at an angle of 30, it was 0.181 (low). Python was employed to generate a model graph representing the experimental formulas used to solve the quadratic equation.
Figure 21 shows the torque-velocity relationship at a 0 angle of inclination. At maximum power (100%), the crawler achieves
its highest torque and velocity of 0.300 m/s. The minimum power required for the crawler, weighing 8.73N, to move forward is 20%. Thus, the crawler’s speed can range from 0 to 0.300 m/s, depending on the motor power applied. The torque-velocity graph can be mathematically expressed as a quadratic equation, i.e., Equation 2:
-8.93975716 x2+266.77666129x+ 20.44560365=0 [2]
Figure 22 depicts the correlation between torque and maximum velocity for the subsea crawler at 20 angles of inclination. The graph indicates that the crawler’s highest velocity is achieved at 100% full power (torque), with a value of 0.257 m/s. At 20% torque, the minimum velocity is 0 m/s. To overcome the weight of the crawler, which is 8.73N, more than 20% of the maximum motor capacity is required to initiate movement.
The quadratic equation that represents the relationship between torque and maximum velocity at an inclination angle of 200 is shown in Equation 3:
-299.07208471x2+380.67631735x+ 21.49772579=0 [3]
The graph depicted in Figure 23 displays the minimum percentage torque required to move the crawler from its stationary
Torque versus velocity at 20° angles of inclination

position under various angles of inclination. The experiment indicates that a minimum of 30% torque is required to set the crawler in motion at 0° angle of inclination. At 30° inclinations, the minimum torque required is 37.3%. The results demonstrate that the minimum torque required to move the crawler varies from 30% to 37.3% of its total torque at different angles of inclination. Thus, a minimum of 30% torque is necessary to overcome the weight of the crawler at different angles of inclination.
The quadratic equation that establishes the relationship between the angle of inclination in degrees and the minimum torque required can be expressed as:
3.93720565e-03 x2+1.27095761e-01x+ 2.99792779e+01=0 [4]
The graph depicted in Figure 24 displays the correlation between the efficiency and torque at 0° and 20° angles of inclination. The results indicate that the efficiencies were relatively low at 20% torque and peaked at 100% torque. The crawler had superior efficiency at 0° compared to the efficiency at 20°, indicating that
driving the crawler at an angle of inclination of 20° resulted in higher energy losses than at 0. Moreover, the efficiency curve reached its maximum at 80% torque at 0, beyond which it began to decline. This implies that increasing the power input (torque) from 80% to 100% does not lead to a further increase in efficiency. The efficiency can only increase from 20% to 80% power on different angles of inclination before it starts to decline.
The quadratic equations for the relationship between efficiency and torque at 0° and 20° angles of inclination are represented by the following formulas:
5.03571429e-05 x2 - 8.84285714e-03 x - 1.49800000e-01 = 0 (for 0° inclination) [5]
2.82142857e-05 x2 + 5.88571429e-03 x - 1.05600000e-01 = 0 (for 20°inclination) [6]
Conclusion
This research involves the development and assembly of a scaled-
down electric-powered subsea robotic crawler using Tetrix Max robotics kits, with the aim of assessing its potential for underwater mining/dredging applications. The performance of the crawler was evaluated using a test ramp that allowed for adjustment of inclination angles ranging from 0° to 30°. Three consecutive tests were carried out for each angle, with the crawler covering a
Table 4
distance of 1.8 metres. The tests were conducted to investigate the crawling characteristics of the system under uneven and sloppy environments. The results of the experiments were recorded, tabulated, and graphically illustrated. The experiments conducted included determining the maximum velocity versus different angles of inclination, the torque versus velocity at 0° and 20°
Minimum torque versus different angle of inclination

Figure 23—Minimum torque in percentage versus different angle of inclination
Table 5
Graph of efficiency versus torque at 0° angle of inclination
Table 6
Graph
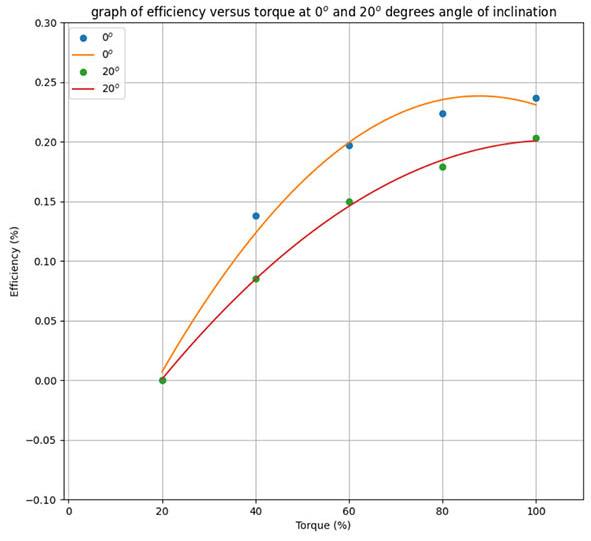
and 20° angles of inclination
angle of inclination, drive minimum torque versus different angles of inclination, and efficiency versus torque at 00 and 200 angle of inclination. The results show that increasing the angle of inclination decreases the maximum velocity of the crawler, and that more powerful motors are required to overcome steeper angles. The minimum power required to move the crawler was 20% of maximum power at 0° inclination, while at 20° inclinations, at least 34.3% of maximum power was required to overcome the weight of the crawler. The minimum torque required to move the crawler at a 30° inclination was 37.3%. The efficiency of the drive system was higher at a 0° inclination compared to 20° inclinations. These findings provide valuable information for the future development of the electric-powered subsea robotic crawler for underwater mining/ dredging applications.
Acknowledgements
We would like to express our sincere gratitude to Cape Peninsula University of Technology for their valuable support and contribution, which played a crucial role in the successful completion of this research. Additionally, we would like to extend our special thanks to Prof. Atanda K. Raji, Dr Efe Orumwense, and
other individuals who have provided their valuable guidance and support towards this paper.
Author contributions
Mike Oluwaseun Ojumu: Formulated the design concept, integrated hardware, developed architectural software for the driving system, and wrote the original draft.
Atanda Kamoru Raji: Conducted final data validation, managed project administration, contributed to project conceptualisation, provided supervision, and performed writing review and editing.
Efe Orumwense: Verified the methodology, validated data, visualised the research concept, and conducted writing review and editing.
References
Daanen, H. 2017. Mobility of Subsea Tracked Equipment. delf. Available at: http://repository.tudelft.nl/
Haga, M., Hiroshi, W.,Fujishima, K. 2001. “Digging control system for hydraulic excavator”. Mechatronics, vol. 11, no. 6, pp. 665–676, 2001, doi: 10.1016/S0957-4158(00)00043-X
Mooney, J.G., Johnson, E.N. 2014. “A Comparison of Automatic Nap-of-the-earth Guidance Strategies for Helicopters,” J.F. Robot., vol. 33, no. 1, pp. 1–17, 2014, doi: 10.1002/rob
Naidoo, R.N. 2013. “Global Health Action Mining: South Africa’s legacy and burden in the context of occupational respiratory diseases”. Glob. Health Action, pp. 1–4, Feb. 2013, doi: 10.3402/gha.v6i0.20512
Nazaruddin, Gunawan, 2015. “(PDF) Undercarriage Design of Excavator Model in Application of Various Track Drive,” Researchgate, pp. 1–7, Dec. 2015, Accessed: Jul. 30, 2021. [Online]. Available: https://www.researchgate.net/ publication/320557845_Undercarriage_Design_of_Excavator_ Model_in_Application_of_Various_Track_Drive
Tondolo, N.L. 2012. “Quantitative investigation of hydraulic equipment failures within the original equipment manufacturer standard,” Creat. common, pp. 1–75.
Van Bloois, J. Willem, J. Frumau, S.S. 2009. Ocean Mining: Deep Sea Mining: A New Horizon for Dredging Technology,” OTC Offshore Technol. Conf., pp. 1–1, May 2009, doi: 10.4043/20047-MS u

Affiliation:
1Department of Geological and Mining Engineering and Sciences, Michigan Technological University, USA
2Mining Engineering Study Program, University of Jember, Indonesia
Correspondence to: S. Chatterjee
Email: schatte1@mtu.edu
Dates:
Received: 4 Dec. 2024
Revised: 7 Mar. 2025
Accepted: 31 Jul. 2025
Published: September 2025
How to cite:
Suparno, F., Paithankar, A., Chatterjee, S. 2025. Minable coal reserve estimation by incorporating tonnage and calorific value uncertainties by successive multiple-point and two-point geostatical simulation algorithms. Journal of the Southern African Institute of Mining and Metallurgy, vol. 125, no. 9, pp. 555–570
DOI ID: https://doi.org/10.17159/2411-9717/3448/2025
estimation by incorporating tonnage and calorific value uncertainties by successive multiple-point and two-point geostatistical
by F. Suparno1,2, A. Paithankar1, S. Chatterjee1
Abstract
Estimating reserves and quantifying resources stand as pivotal and intricate endeavours within the realm of coal mining operations. Intricate geological formations compound the challenges in resource estimation, thereby complicating reserve calculations. The uncertainties tied to geological attributes of coal, encompassing parameters like tonnage and coal quality, wield significant sway over resource and reserve computations within coal mines. This research delves into the domain of geological uncertainties, with a specific focus on calorific value, aiming to numerically characterise resources and reserves within an open-pit coal mine situated in Indonesia. To quantify resources, the coal seam geometry underwent simulation via a multipoint geostatistical technique known as single normal equation simulation. A geologically established coal seam served as the training image for generating 20 equiprobable coal models. To simulate CV, 50 realisations were generated for each simulated coal seam, utilising sequential Gaussian simulation. Deviations of the simulated coal seams ranged from -0.07% to 5.48% in comparison to the training image. The CV simulation yielded an average value of 5,920.29 kcal/ kg, accompanied by a standard deviation of 586.54 kcal/kg. However, the average CV spanned from 5,305.26 kcal/kg to 6,526.55 kcal/kg across diverse simulations. For reserve calculation within the context of geological uncertainties, an algorithm rooted in maximum flow graph theory was employed to construct the ultimate pit for the coal mine. Within this final pit, the average stripping ratio was 1.62, coupled with a CV value of 6,019.66 kcal/kg. When juxtaposed with the deterministic model, the findings underscore that the stochastic ultimate pit delineates a more expansive excavation, accompanied by a heightened undiscounted cash flow.
Keywords mineral resource, coal, open-pit, geostatistics, calorific value, uncertainty
Introduction
A mining operation constitutes a substantial investment commitment aimed at extracting valuable materials, such as coal, from the subsurface using either open-pit or underground methods. Within the coal industry, like other sectors encompassing metal and non-metal mining, investment decisions are grounded in meticulous assessments of economic coal reserves. Prior exploration drilling and consequent geological analyses determine key physical attributes, encompassing size, shape, and grade (such as calorific value) of a coal deposit. This process yields distinct units of established size, each possessing specific properties, such as tonnage and calorific value, known as mining blocks. These mining blocks exhibit economic value if deemed ore, while those without such value are categorised as waste (Asad, Dimitrakopoulos, 2013). In the coal realm, ore equates to coal seams, and waste corresponds to overburden (OB). The intricate nature of coal seams, marked by heterogeneous calorific values and other geological factors, exacerbates the challenges in resource estimation (Heriawan, Koike, 2008). Notably, uncertainties tied to resource estimation resonate with unpredictable raw material supply from mining operations (Tercan et al., 2013).
The assumption of constant economic values for mining blocks, neglecting the uncertainties in resource estimation (termed geological risk), can spawn impractical mine designs and financial losses (Dimitrakopoulos et al., 2002; Godoy, Dimitrakopoulos, 2011). This geological risk stands as a primary reason for falling short of production targets. The consequences of disparities between plans and actual outcomes have been explored by Dimitrakopoulos and Godoy (2014). Technical risks in coal mining predominantly arise from uncertainties in calorific value (CV), tonnage, and geo-mechanical aspects
(Tercan, Sohrabian, 2013; Zhang et al., 2018). Addressing these uncertainties and integrating them into the optimisation process is pivotal for establishing resilient coal mine plans and designs.
The characteristics of coal deposits, including size, calorific value, and shape, remain latent until extraction commences (Camus, 2002). Conventional methods often generate inaccurate solutions by disregarding uncertainties, potentially leading to future complications during mining operations. These methods rely on a singular coal resource model, estimating CV through kriging (Siddiqui et al., 2015) and tonnage through geologist-developed solid coal seam models or wireframes. Yet, a single resource model realisation from a geologist may inadequately estimate the true deposit volume (Heriawan, Koike, 2008). Tonnage uncertainty can result in discrepancies between planned and actual production in mines (Goodfellow, 2012). Goodfellow (2012) asserts that incorporating tonnage and grade uncertainties into mine planning markedly enhances resource and reserve estimation. To address tonnage uncertainty, approaches like indicator-based two-point variogram-based geostatistics (Heriawan, Koike, 2008) or multiplepoint statistics (Abulkhair, Madani, 2022) are employed. However, limitations of the two-point variogram-based geostatistics are welldocumented, particularly for categorical data simulation (Journel, Zhang, 2006).
Multi-point statistics (MPS) have limited application in the mining industry, especially for simulating sedimentary deposits like coal. Nevertheless, MPS has found success in modelling other commodities. Osterholt and Dimitrakopoulos (2007) utilised the single normal equation simulation (SNESIM) algorithm to capture lithological model uncertainties in the Yandi channel iron ore deposit. Chatterjee et al. (2012) employed wavelet-based methods to simulate rock types in the Olympic Dam deposit. Goodfellow et al. (2012) combined multi-point and two-point simulations for orebody models and grade uncertainty. Paithankar and Chatterjee (2018) used multi-point statistic simulations to model volume uncertainty and sequential Gaussian simulation for grade uncertainty in a copper deposit. MPS’s application to coal mine tonnage uncertainty analysis has been documented only by Abulkhair and Madani (2022). Bastante et al. (2008) conducted a comparative study of indicator kriging (IK), sequential indicator simulation (SISIM), and single normal equation simulation (SNESIM) for uncertainty analysis of slate resource estimation.
Another paramount uncertainty, especially in resource modelling, stems from mineral grade. In the mining industry, grade elucidates the quality of mining commodities. For coal mining, coal quality is characterised by parameters like CV, ash content, volatile matters, and sulfur content. Traditional methods have often been employed for coal resource estimation (Saikia, Sarkar, 2013; Afzal, 2018), but these overlook uncertainty factors, potentially leading to discrepancies between plans and actual production (Rendu, 2002). Commonly used methods like kriging exhibit limitations, overestimating low-value samples and underestimating high-value ones, thereby making them unsuitable for quantifying uncertainty (Goovaerts, 1997). Conditional simulation (CS), a Monte Carlobased method, addresses kriging’s drawbacks (Pyrcz, Deutsch, 2014). CS, particularly sequential Gaussian simulation (SGS), is employed to model uncertainties, particularly spatial attributes like CV (Heriawan, Koike, 2008). In conditional simulation, the existence of a geological unit at any coal body location is modelled as a discrete random variable. Heriawan and Koike (2008) employed sequential Gaussian simulation to assess risks tied to coal quality parameters. Tercan and Sohrabian (2013) used
independent component analysis and Gaussian simulation to explore uncertainties in multiple coal quality parameters. Yüksel et al. (2017) combined geostatistical simulation and Kalman filtering to update coal resource models and quantify uncertainty. Sohrabian et al. (2023) utilised a simulated annealing-based approach for multivariate coal quality parameter simulation.
Reserve estimation is a pivotal step in assessing the economic viability of mining operations. The Canadian Institute of Mining, Metallurgy, and Petroleum (CIM) defines mineral reserves as economically mineable portions of measured or indicated mineral resources substantiated by preliminary feasibility studies (CIM, 2014). In open-pit mining, calculating mineable reserves hinges on appropriately designing the ultimate pit for production planning (Kumar, Chatterjee, 2017). Various researchers have applied geostatistical and optimisation methods to estimate minable coal reserves for both open-pit and underground mines (Moore, Friederich, 2021; Dimitrakopoulos, Li, 2010). Amini et al. (2022) applied a stochastic optimisation algorithm for coal blending to reduce supply chain risk. Stevanovic et al. (2014) utilised stochastic programming to ensure a consistent coal supply from the mine to the power plant, aiming to minimise sulfur emissions and maximise calorific value. Wang et al. (2025) considered uncertainties in coal quality parameters to determine coal mine production capacity. Although many studies have incorporated coal quality uncertainties, to the best of our knowledge, none have integrated both volume and coal quality uncertainties for minable coal reserve estimation. In this study, two major geological uncertainties – coal volume and calorific values – were integrated to quantify resources and reserves in an Indonesian coal mine. The single normal equation simulation (SNESIM), a multi-point geostatistical approach, was employed to capture volume uncertainty, while sequential Gaussian simulation (SGS) was used to quantify uncertainty associated with calorific value. A stochastic graph-cut method was implemented, incorporating both uncertainties to quantify coal reserves for the studied mine. The innovative aspect of this research lies in the integration of MPS with two-point geostatistics, which can significantly enhance resource quantification, and the stochastic graph-cut algorithm, which can generate robust reserves under multiple geological uncertainty conditions.
Multiple-point geostatistical simulation and two-point conditional simulation were used to quantify the volume and calorific value uncertainty, respectively. The multi-point simulation, (MPS) (Strébelle, 2002), was utilised to generate the coal body model’s resulting volume uncertainty. After generating the shapes of the coal body, the two-point conditional simulation for the calorific value uncertainty started through sequential Gaussian simulation (Deutsch, Journel, 1998). Figure 1 shows the flowchart of the successive simulations adopted in this research. After quantifying the resource model, the reserve was calculated by using the maximum flow minimum cut algorithm (Chatterjee et al. 2016; Asad, Dimitrakopoulos, 2013). The methodology of the proposed research is presented in three different sub-sections: (a) quantification of volume uncertainty; (b) quantification of calorific value uncertainty; and (c) reserve quantification under volume and calorific value uncertainties.
For quantifying volume uncertainty, the SNESIM algorithm was implemented. Initially introduced and formulated by Strébelle
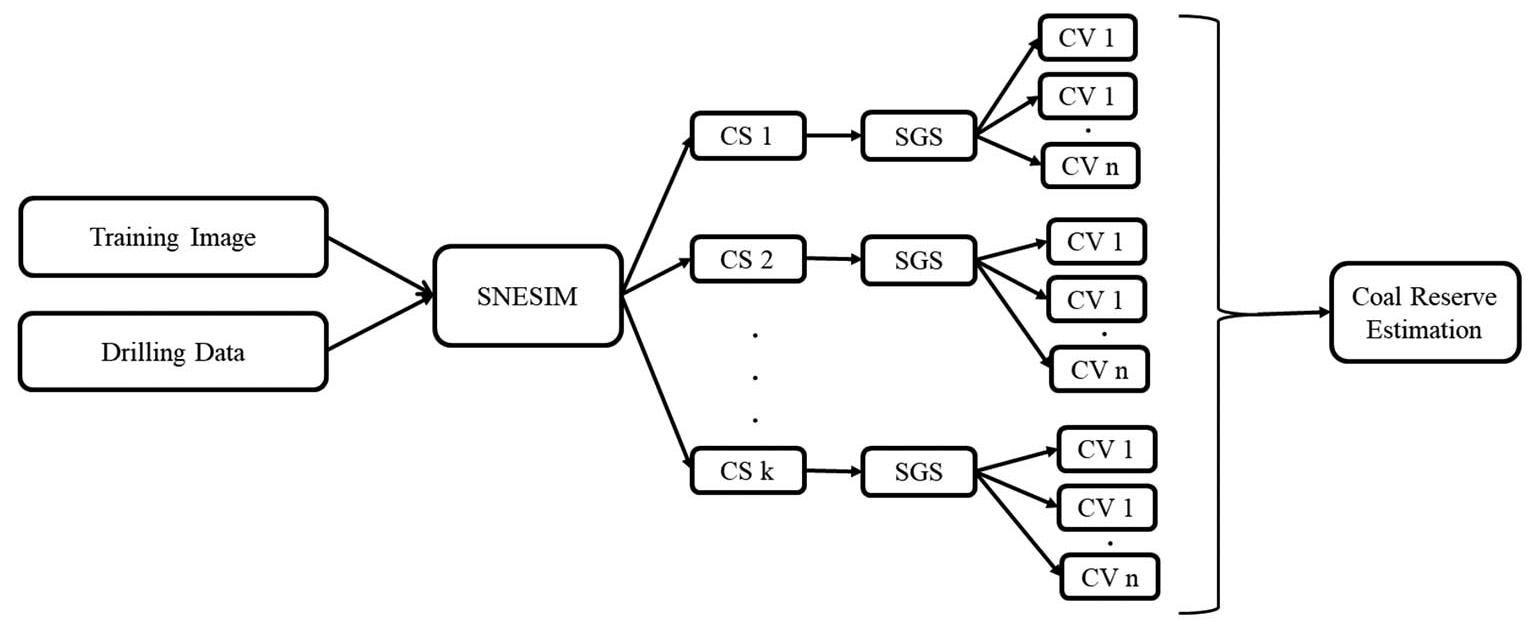
(2002), the SNESIM algorithm utilises a training image to establish probability patterns for the simulation process. A training image can be perceived as a representation of the spatial distribution of the deposit. Although a training image might not encompass exhaustive precision regarding deposit information, it does encapsulate the underlying geological context, thereby depicting the intricate complexity and heterogeneity that the deposit exhibits. In certain scenarios, a limited number of training images exist, with each individual image portraying differing levels of complexity and heterogeneity in geological interpretations. Consequently, during the simulation process, conditioning data are employed to regenerate the original data’s values at their respective locations, thus fostering the creation of spatial continuity.
Assuming a categorical property S, having K possible states, {s(k),k = 1,…,K}. A data event dn of length n at centre location of u has a geometric pattern of the vector {hα,α = 1,…, n} and the values of the data {s(u + hα ), α=1,…,n}. The geometric template τα is correlated to the data template τn that saves the previous data geometry and data event dn. In this paper, K = 2 because there are only 2 states, either coal or overburden.
SNESIM operates by sequentially simulating grids along a randomised pathway, originating from a random node during a single iteration (Huang et al., 2013; Strébelle, Journel, 2001). The node previously visited and simulated assumes the role of hard data and serves as the foundation for the conditional simulation of the following node in the subsequent sequence. The probability of data events, denoted as dn, is determined by the multi-point statistics. The expression for the conditional probability of state sk at location u is formulated as follows:
[1]
where dn indicates the conditioning data event constructed by the n closest data, (u + hα ), α = 1, … , n. The training image can infer the probability of occurrence of data event dn with data template τn. By utilising Bayes’s relation, the probability distribution conditional to dn, which is the category proportions gained from the central values of the training dn, can be calculated using Equation 2:

where Prob{dn } is estimated by combining the scanned training image and the number c (dn) of training images, which reproduce the same properties of the conditioning data event dn, and Prob{S(u)=sk and dn } can be estimated by calculating the number
ck (dn) of those which reproduce the same properties among the previous c(dn ), related to a central value S(u) equal to sk. The concept of a search tree in SNESIM can be helpful to calculate directly the conditional probability in Equation 2. A 4x4 binary training image is shown in Figure 2(a). Figure 2(b) represents a template τn, with n = 4 for conditioning data. Then, a search tree, as illustrated in Figure 2(c), can be constructed by searching for the data template in the training image. In the search tree, the root node (level 0) displays the frequency of coal (7) and OB (9) in the training image. At level 1 of the search tree, the left-hand branch shows that the frequency of the central node (u) being OB and the top node (u1) being coal is 2, while the frequency of the central node being coal and the top node being OB is 3. These values are used to calculate the conditional probability of the central node given that the value of the u1 node is coal. In this case, the conditional probability of the central node being coal, given that u1 is coal, is 0.6 (3 out of 5), and the probability of it being OB is 0.4 (2 out of 5). As one moves further down the search tree, more conditioning data become available, allowing for the calculation of increasingly specific conditional probabilities for the simulation. From Equation 2, the conditional probability can be directly retrieved from various levels of the search tree, relying on the number of the conditional data.
The SNESIM algorithm strategically relies on a single normal equation (SNE) (Equation 2) during the computation of coal and overburden probabilities at specific grid nodes, contributing to its expedited execution. In SNESIM, the SNE is a conceptual term that refers to how the conditional probability distribution of categorical variables is calculated, as shown in Figure 2. Unlike a comprehensive kriging system, SNESIM’s internal method enables the direct calculation of probabilities using a single normal equation, determining proportions between relevant variables without calculating a variogram and solving a kriging system of equations (Arpat, Caers, 2007; Strébelle, Journel, 2001). For a specified data template τn, the central values ck (dn) over the training image and number of occurrences c(dn) of the data events dn are saved in a search tree, where the training proportions can be identified.
A scenario arises when the proportion of simulated coal and overburden in the target deposit deviates from that of the training image. To address this, Strébelle (2002) and Liu (2006) employed a servosystem control mechanism aimed at aligning the proportion of simulated categories as closely as feasible to the target category proportion during the simulation of specific nodes, for example, considering the proportion of the training image as P(A), where A
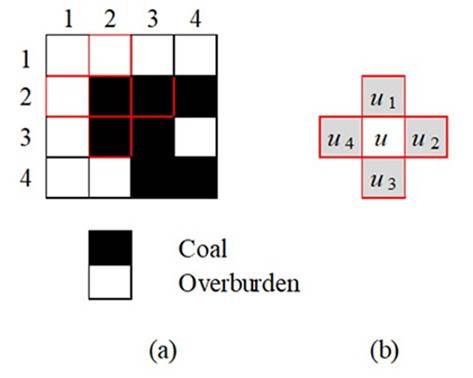
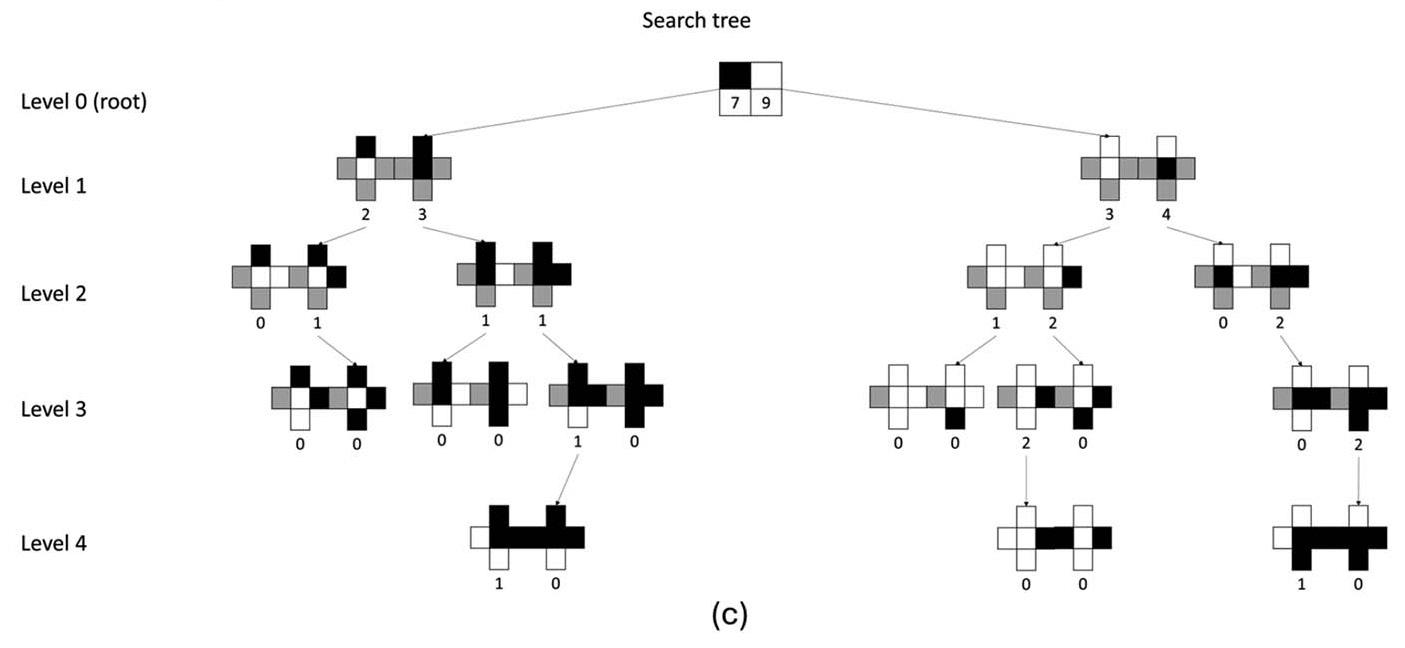
indicates lithology indicators and the target lithology proportion is represented as P(A*). After simulations, P(A) and P(A*) hold very dissimilar lithology proportions, and the target lithology proportion P(A*) cannot be properly reproduced, so a servosystem control is then applied to fix the problem.
Assume P c (A) is the current probability distribution function before taking a simulation of the unknown node u. To achieve the goal of the target lithology proportion P(A), a conditional probability P(A|B) is adjusted to:
[3]
where μ is obtained by using the servosystem control λ, as stated in the following:

The value of λis directly proportional to μ.
The work flows of the SNESIM algorithm are stated as follow:
➤ Use data template to scan the training image.
[4]
➤ Collect the occurrences of all data events dn and save them in the search tree.
➤ Define a random path to visit all the nodes to be simulated.
➤ Simulate each node by following these steps:
• Take the data events dn from the search tree subject to hard condition data.
• Given surrounding data events dn, compute the occurrence probability of the data event using Equation 2.
• Update the conditioning data by adding the previously simulated node to the grid.
➤ Run for a select number of simulations.
Calorific value uncertainty
Subsequent to coal volume simulation, the simulation of calorific
value was conducted for each of the simulated coal body models. The SGS was the method employed for the simulation of calorific value. Initially introduced by Deutsch and Journel (1998), SGS has demonstrated effectiveness in reproducing structured statistics on a global scale, notably variograms. In contrast, the kriging method is recognised for providing locally accurate estimates at each specific location. The formula of variogram as a vector γ (h) calculation is given in Equation 5:
where N(h) is the number of points separated by distance vector h, and Z(uα ), Z(uα+h) are calorific values at location uα and uα+h, respectively.
SGS achieves the replication of spatial attributes by utilising conditional distribution functions. During each iteration where N nodes are randomly traversed, a conditional cumulative distribution function (CCDF) is established and subsequently sampled. Assuming a set of N random variables Z(uα), α = 1, …, N specified at N locations uα the multivariate N point CDF of stationary random fields can be formulated as an output of N univariate CCDFS:
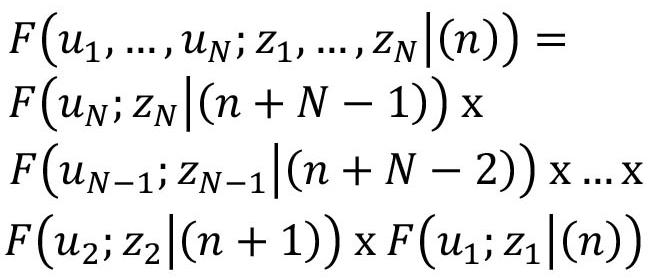
where F(uN;zN|(n + N – 1) )=Prob {Z(un )≤zN |(n + N – 1)} represents the conditional distribution function of Z(uN) for the group of n original data values and (N – 1) represents the prior simulated values.
The reproduction of the variogram model is achieved by constructing each CCDF using both n data and previously simulated values. Within the context of SGS, an assumption is made that the local CCDF follows a standard normal distribution;
otherwise, the initial z data must be transformed into y-values conforming to a standard normal distribution. This transformation, known as the normal score transformation, is executed by associating the corresponding percentiles of the cumulative distribution of Z with those of the standard normal distribution. Importantly, this transformation preserves the rank order of the original data. Fundamentally, the SGS approach leverages simple kriging to perform simulation within the normal score space, where deviations from the random normal score are expressed as follows:


where µSK represents the kriging mean, σSK represents the kriging variance, r represents the random number [0,1], and Z * (u) represents the estimated value. The final step is back-transforming the realisations/result (Deutsch, Journel, 1998; Goovaerts 1997).
The workflow of the SGS is stated below:
➤ Transform into normal score Z (u) from the original data Y (u).
➤ Use a defined random path to visit each node and simulate.
➤ For each node uα, α = 1, …, N:
• Model the conditional distribution F(uα;zα|(n + α – 1) ) of Z(uα), provided the n original data values and α – 1 prior to simulated values.
• Plot the simulated value from F(uα ; zα|(n + α – 1) ).
➤ After visiting all the nodes, do back transformation of the simulated nodes into the original variables.
Coal reserve calculation under uncertainties
The Canadian Institute of Mining, Metallurgy, and Petroleum (CIM) defines mineral reserves as the economically viable portion of a mineral resource, substantiated through a feasibility study (CIM, 2014). Within the context of open-pit mining, the mineable reserve encompasses a subset of the mineral resource situated within the ultimate pit boundary (Chatterjee et al., 2016; Kumar, Chatterjee, 2017). For calculation of the ultimate pit, the maximum flow minimum cut algorithm is employed. This algorithm tackles the challenge of identifying the most extensive closure within a mine graph, where the minimum cut delineates an optimal pit contour (Hochbaum, 2001). The subsequent mathematical formulation was adopted for the calculation of the minable reserve:
Objective function:


where vγb is the economic value of a coal mining block b from simulation, xb is the binary decision variable, which takes value 1 if mining block b is inside the pit and 0 otherwise, b’ is the block that needs to be mined before mining block b to satisfy slope constraints, Γ is the number of simulated coal models incorporating both volume and CV uncertainties, and B is the number of mining blocks
present in the coal model. The objective function of Equation 10 aims to maximise the total cash flow from the coal mine, whereas Equation 11 is precedence constraints, which ensure respecting the slope of the ultimate pit. For solving the optimisation formulation, the approach proposed by Asad and Dimitrakopoulos (2013) and Chatterjee et al. (2016) was used in this research to determine the mineable reserve.
The research was conducted within a temporarily closed open pit situated in Indonesia. The study site is positioned approximately 150 kilometres to the north of Samarinda in East Kalimantan province and about 300 kilometres north of Balikpapan. To preserve confidentiality, the specific mine’s name is withheld and will be referred to as the ‘case study mine’ throughout the paper. The geological characteristics of the research area, encompassing morphology, stratigraphy, geological structure, and history, define the context of the case study mine. Morphologically, the study area exhibits undulating terrain. The highest elevation reaches 325 metres above mean sea level (AMSL), while the narrow plains vary in height from 20 to 50 metres AMSL.
The study area’s stratigraphy comprises the Pamaluan Formation, Balang Island Formation, and Balikpapan Formation (Figure 3). These formations harbour a substantial reserve of coal. The coal deposits took shape during the Tertiary Period within the Kutai Basin. This basin’s formation is attributed to five distinct geological formations: Alluvial, Kampungbaru, Balikpapan, Pulau Balang, and Bebulu – Pamaluan. A comprehensive breakdown of each formation is depicted in Figure 3.
The predominant overburden materials encompass siltstone, mudstone, and sandstone. The thickness of the interburden remains relatively consistent. Typically, mudstone and, on occasion, carbonaceous layers are situated immediately adjacent to the coal seams. In contrast, sandstone appears discontinuously laterally, assuming a lens-shaped configuration across various dimensions. Uniaxial compressive strength (UCS) testing reveals notable discrepancies among the three materials: sandstone (19 MPa), siltstone (18.4 MPa), and mudstone (2 MPa). The average density values for sandstone, siltstone, and mudstone stand at 2.18 tonne/ m3, 2.11 tonne/m3, and 2.07 tonne/m3, respectively. In terms of the coal itself, its density falls within the range of approximately 1.28 to 1.32 tonne/m3
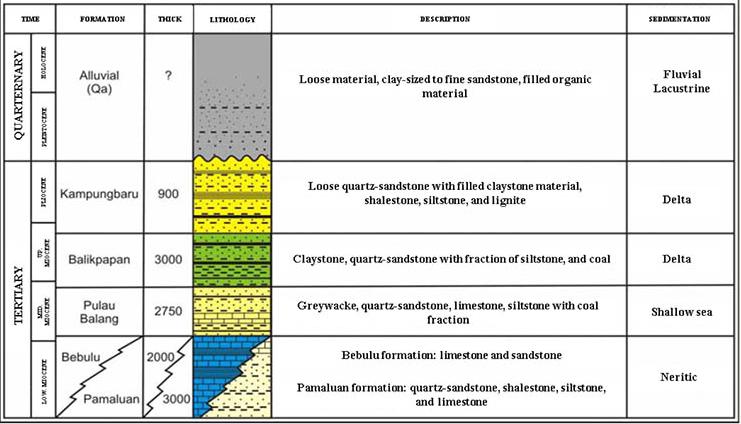
Figure 3—The stratigraphic column of the research area
Table 1
Table 2
The average coal quality parameters from different coal seams from the study area No.
1
2
3
4
5
6
7
8
11
12
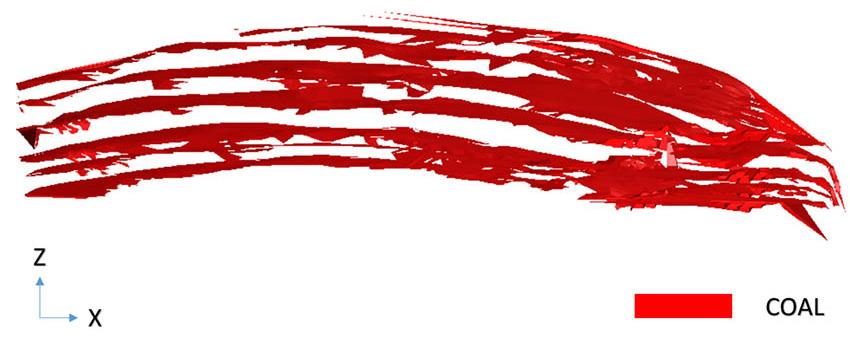
The coal quality within the study area can be categorised into three distinct groups: Prima quality, boasting a calorific value exceeding 6700 kcal/kg; Pinang quality, characterised by a calorific value ranging from 6050 kcal/kg to 6250 kcal/kg; and Melawan quality, featuring a calorific value less than 5450 kcal/kg. This classification considers both the CV and inherent moisture (IM). Conforming to the American Society for Testing and Materials (ASTM) classification, the coal found within the study area falls under the classification of ‘high volatile C bituminous coal,’ encompassing an average calorific value of 5960 kcal/kg and a density of 1.3 gr/cm3
Table 1 provides an overview of the detailed properties of the coal extracted from the study area. Prima and Pinang coals are globally renowned for their high-quality attributes, showcasing elevated calorific values, minimal ash and sulfur content, and low water content. Prima coal is characterised by a glossy, black appearance and a notably high calorific value. Coal Pinang shares similar characteristics with Prima coal but exhibits a somewhat higher moisture content. Within the mining lease area, a total of 12 mineable coal seams are identified (PRLR, PR, PRUR, B2, DU, NL NU, P1, P2, P3, P4, and P5), and their coal properties vary reasonably within these coal seams (Table 2). The average dip of these coal seams ranges from 13.3º to 14.9º
The simulation procedure employs a conventional deterministic coal seam model (depicted in Figure 4) as the designated training image. Geologists have meticulously crafted several strata to represent the coal deposit. The drill hole data encompasses 28 distinct lithological codes; 4 of these codes pertain to the coal zone, while the remaining 24 codes correspond to the areas outside the coal zone. A block model was formulated based on the geologist’s conceptualisation. Each block within the multiple layers is either assigned as coal (1) or categorised as overburden or waste (0) for blocks located outside these layers.
The data conditioning required for simulations is sourced from 268 drill holes located within the mine lease area. The training image spans 95 x 70 x 165 blocks, each measuring 20 m³ x 20 m³ x 10 m³. Referencing Figure 5, both the training image and hard data can be observed. Table 3 outlines the technical and economic parameters endorsed by the company, crucial for the reserve calculation conducted in this study. The coal reference price from the Ministry of Energy and Mineral Resources (MEMR) Indonesia has been adopted for the reserve calculation process. The MEMR


Table 3
Block

uses 6322 kcal/kg GAR (gross as received) CV for a reference coal price. The price for coal with a different CV was calculated using the calorific value adjustment formula, where P is the price of coal for 6322 kcal/kg GAR CV coal set by MEMR, CV is the calorific value of a given coal, and PCV is the calculated coal price for coal with a calorific value of CV.
Results and discussion
Volume simulation
The SNESIM algorithm was employed to simulate the coal seams model using both the training image and the hard conditioning data (depicted in Figure 5). To accurately reproduce the coal seams’ connectivity, the multi-grid method was harnessed within this study. This approach entails simulating the coarsest scale first,
Table 4
followed by the intermediary scale, and ultimately the finest scale. In this research, a multi-grid value of 3 was adopted, drawing from Strébelle’s work in 2002 (Strebelle, 2002). A total of 20 realisations of the coal body model were generated through the SNESIM algorithm. The choice of this number was influenced by recommendations from previous researchers, as indicated by Paithankar and Chatterjee (2018). All these realisations collectively serve the purpose of quantifying geological uncertainties related to tonnage and volume.
Incorporating the entropy calculation method, as proposed by Honarkhah and Caers (2010), facilitated the optimal selection of the template size. A larger template size is intended to augment the number of nodes utilised for simulation, thereby furnishing more information to the simulated node. This strategic approach ensures that the connectivity and orientation of the geological features are accurately simulated with the available data. A sensitivity analysis of the template size calculation is provided in Table 4. In this context, the values of X and Y remain constant, while only Z varies, ranging from 3 to 13. Notably, the highest mean entropy value was observed for the 23 x 23 template size, gradually diminishing as Z increased. A marginal upswing is discerned from z = 3 to z = 5, followed by negligible increments from z = 5 to z = 13. Consequently, for the z direction, the value of 5 was chosen. Accordingly, the template size for SNESIM was established as 23 x 23 x 5.
The servo system plays a pivotal role within the SNESIM algorithm. A lower value for the servo system parameter yields a heightened proportion of the simulated primary category (coal in this instance), all while preserving the model’s structure (Liu, 2006). Setting the servo system parameter to 0 signifies an absence of adjustment during simulation. As the servo number escalates, the coherence of the coal’s structure diminishes, resulting in a more block-like appearance. A servo number of 1 indicates sole reliance on the training image. A sensitivity analysis of the servo number is presented in Table 5, where values indicate the coal proportion in the simulation. The coal-to-overburden (OB) ratio in the training image is approximately 0.0785, indicating about 7.8% coal and
Table 5
Sensitivity analysis of servonumber
92.2% overburden. The table illustrates that when the servo control parameter is set to 1, the simulation proportion mirrors the training image’s proportion accurately. However, this comes at the expense of sacrificing the spatial structure of the coal seams when the servo control parameter value is large. Hence, in this study, a servo control parameter of 0.5 is adopted to preserve the coal seams’ spatial structure and strike a balance between the information gleaned from the training image and hard conditioning data. Figure 6 showcases realisations of maximum, median, and minimum coal seam simulations. These images effectively capture the large-scale structures of the coal seams as depicted in the training image. Moreover, it is evident from Figure 6 (a, b, and c) that due to the inherent stochastic nature of the model, localised variations across different simulations are observable. This variability is attributed to geological uncertainty away from observation locations. It was also observed that in the central part of the deposit, there is strong agreement between the geologists’ model (Figure 5) and the simulation results (Figure 6), likely due to the high density of exploration drillholes in this area. On the east and west flanks of the deposit, where drillhole density is lower, variability between the models increases. Interestingly, the western portion still shows reasonable consistency between the geological interpretation and simulations, possibly because the coal seams in this area are more continuous and clearly identifiable in the drilling records. In contrast, the eastern section exhibits the greatest discrepancies, as ambiguous seam geometry and limited data increase uncertainty in both geological interpretation and simulation outputs.
The validation of the SNESIM outcomes encompassed the calculation of overburden and coal proportions, along with experimental variograms in the X, Y, and Z directions. The
proportions of simulated overburden within the models exhibited a variation ranging from 90.12% to 90.43%, considering the 20 realisations. It is noteworthy that the training image displayed an overburden proportion of 90.4%, whereas the hard data derived from drill holes featured an overburden proportion of 53.72%. Illustrated in Figure 7, the box plot depicts a minor dispersion due to the closely aligned proportions of overburden and coal among the realisations. This proximity may stem from the sedimentary deposits, which are relatively discernible through an ample volume of drilling data. The substantial similarity between the simulation and training image underscores the geologists’ adeptness in interpreting coal seams with notable precision.
The variogram maps, showcased in Figure 8, affirm that the simulated coal seam effectively reproduces the spatial continuity evident in the training image across all three directions. When comparing variability, the observed disparity between the realisations and training image proves lesser than that between the realisations and hard data. This outcome was expected, as the SNESIM algorithm draws upon the patterns ingrained within the training image. It further substantiates that the algorithm does not simply generate a coal seam model that adheres to the drill hole; rather, it crafts a cohesive, interconnected, and smooth model (Goodfellow et al., 2012; Osterholt, Dimitrakopoulos, 2007; Chatterjee et al., 2012).
The realisations produced by SNESIM were harnessed to quantify the volume uncertainty within the coal deposit. The average volume for the coal seams stands at 42,505,970 m³, accompanied by a standard deviation of 596,615.74 m³. It is noteworthy that the average volume derived from the SNESIM algorithm surpasses (by 3.35%) that of the deterministic model


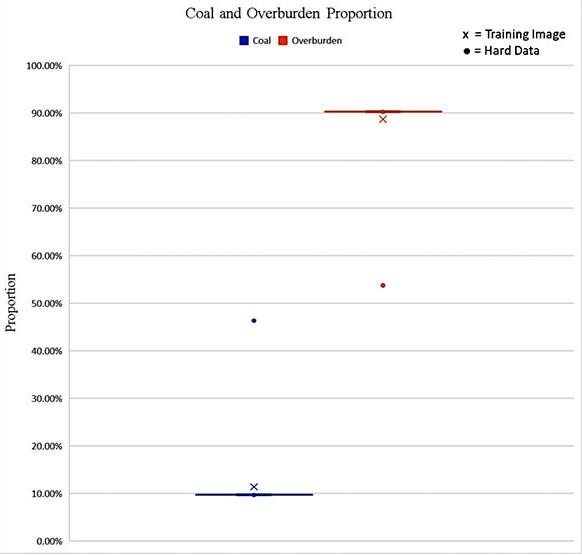
formulated by the geologists (41,130,000 m³). This divergence might be attributed to the geologists’ approach of simplifying the coal boundary through interpolation between drill holes, which potentially results in certain areas falling outside the delineation of coal seams. Evidently visible in Figure 5 (c), the red spot between coal layers exemplifies the geologists' attempt at achieving smooth modelling, leading to some sections at the extremities that are not adequately modelled, consequently giving rise to uncertainty.
However, it is important to note that this observation is not consistent across all 20 simulations. Among them, two instances exhibit lower volumes compared with the model devised by the
geologists, with differences amounting to approximately 0.07% and 0.31%. Ultimately, the pivotal significance of these findings lies in the fact that generating multiple coal seam realisations facilitates a quantifiable assessment of volume uncertainty risk within the coal deposit. The subsequent phase involves translating this volume uncertainty into the realm of calorific value (CV) uncertainty within the coal deposit, enabling a comprehensive evaluation of both these uncertainty factors in tandem.
To quantify calorific value (CV) uncertainty within the coal seam model, each individual SNESIM realisation is treated as a distinct coal seam model. The SGS is then employed to estimate coal CV values based on the drill hole data. Prior to delving into variogram modelling and SGS, the composited CV data undergo a transformation into normal scores, resulting in the establishment of a Gaussian distribution characterised by a mean of zero and unit variance. Subsequently, variogram models are developed for SGS, employing a lag distance of 20 m, tolerance of 10 m, angular tolerance of 45º, and bandwidth of 22.5 m.
In the pursuit of accurate modelling, experimental variograms are calculated across three directions and juxtaposed with fitting theoretical models. Figure 9 graphically portrays these experimental variograms and the corresponding fitted theoretical models along the three distinct directions. The fitted model notably indicates that the coal deposit exhibits geometrical anisotropy, as described in the work of Isaaks and Srivastava (1989). This insight informs the development of a combined variogram model, which is subsequently employed for the CV simulation. Detailed specifications of this combined variogram model can be found in Table 6.
Within each SNESIM realisation of coal seams, a total of fifty simulations were conducted to determine coal CV values. Notably,
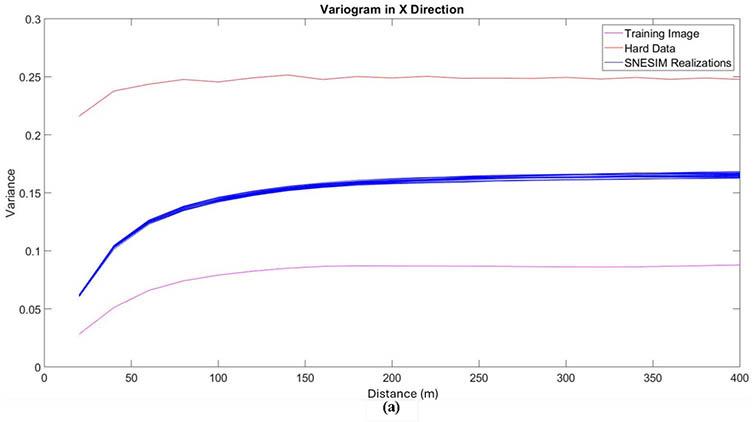

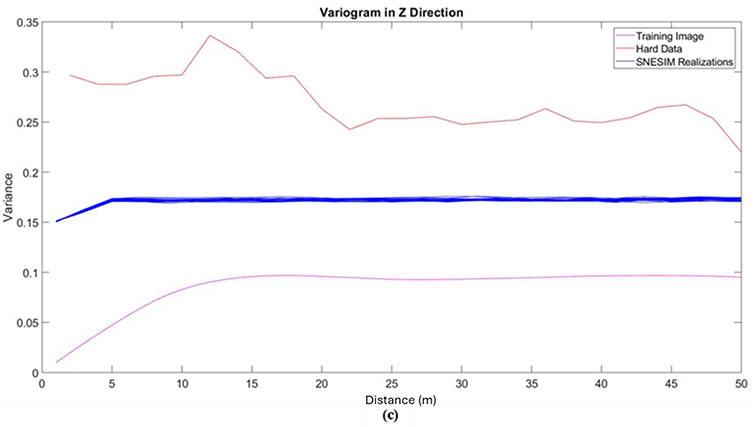
these simulations were performed independently for each distinct coal seams model. Once the CV simulation phase concluded, the resulting realisations underwent a back transformation process to revert to the original data space. As depicted in Figure 10, a topview representation illustrates two coal CV realisations across three distinct volume simulations. An overarching observation gleaned from all realisations is the notable contrast between the southern and northern sides of the deposit in terms of CV values. Further insights are gleaned from Figure 11, which provides a north-east
Table 6


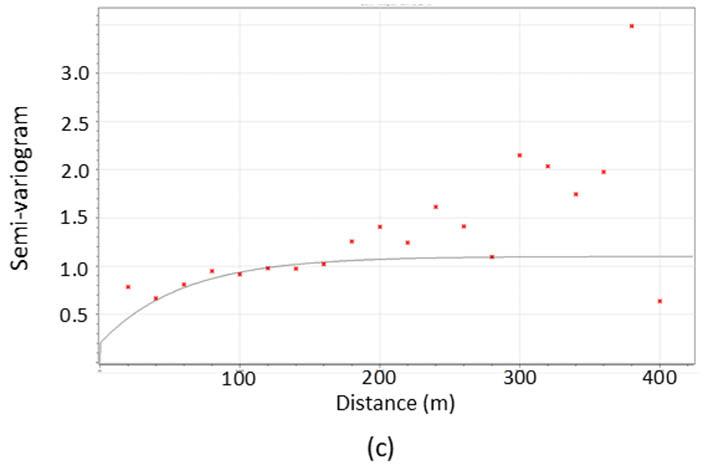
section view of the coal seams simulations. Here, it becomes evident that the deeper coal seams exhibit higher CV values relative to their shallower counterparts.
The spatial simulation of CV reveals consistent spatial patterns across the three coal volume models (maximum, median, and minimum). As shown in top-view (Figure 10), higher CVs are consistently observed in the southern part of the study area, whereas the eastern region shows lower CVs across all simulations. However, the central portion exhibits greater variability in calorific value, indicating higher uncertainty in this zone. This is consistent with the statistics observed from the exploration
Combined variogram model of the normal score CV data
Variogram model Major (x) Minor (z) Azimuth Dip Azimuth Dip

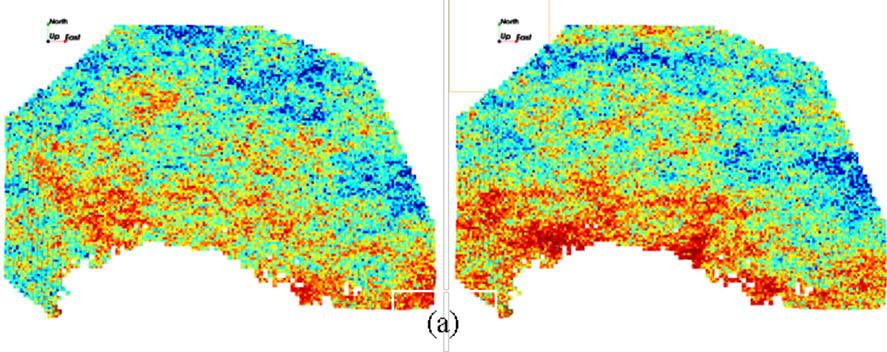
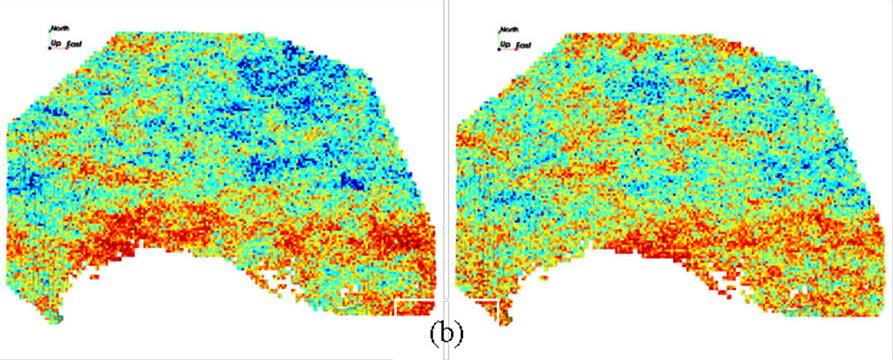

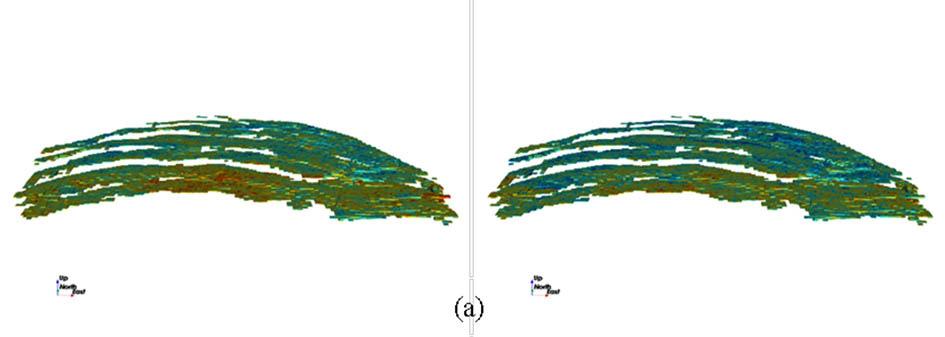


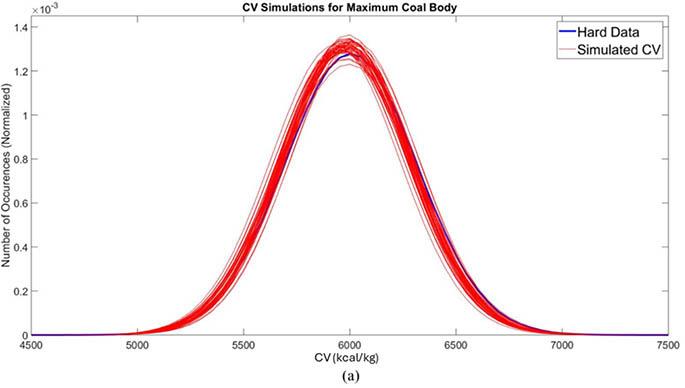
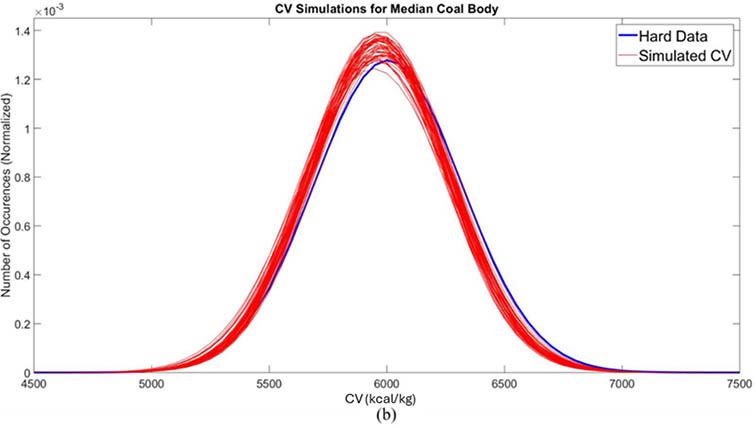
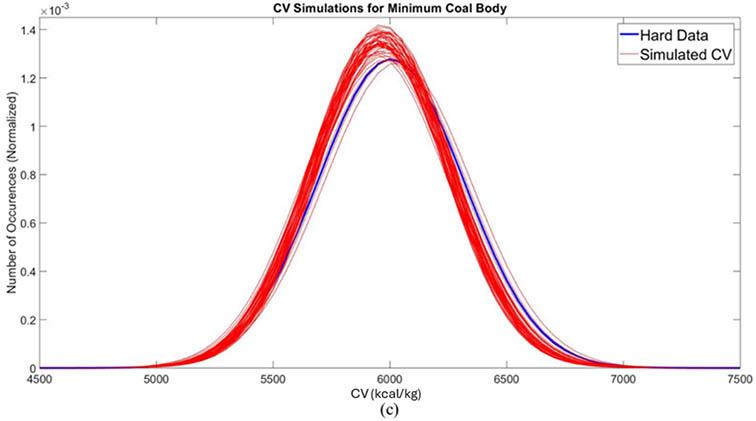
drilling data: although the central part has a higher density of drillholes, the variance among samples is also higher due to the presence of multiple overlapping seams with distinct calorific value characteristics. From the side-view simulations (Figure 11), it is evident that the deeper seams generally exhibit higher calorific values. Specifically, seams B2, PRUP, PR, and PRLR, located near the bottom of the stratigraphic sequence, show elevated average CVs, as also reflected in Table 1. These seams register average calorific values of 6,366.48 kcal/kg, 6,367.12 kcal/kg, 6,300.41 kcal/kg, and 6,628.91 kcal/kg, respectively, the highest among all seams analysed. Additionally, increased variability in CV is observed in the western region, primarily attributed to the sparse distribution of exploration samples in that area, which limits confidence in the simulation outputs.
To validate the coal CV simulations, histograms and experimental variograms of the realisations were generated, thereby affirming the accurate reproduction of both first- and secondorder statistical characteristics. Illustrated in Figure 12, histograms provide a visual comparison between the drill hole data and the coal CV simulations for coal seams. Figure 13 presents the variograms
in Y Direction
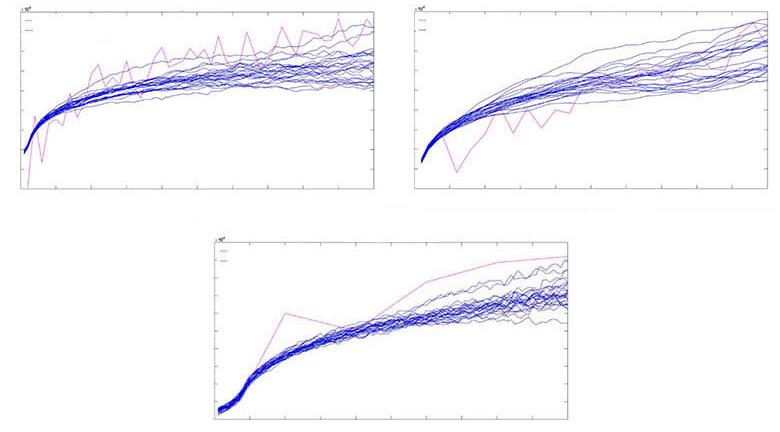
in Y Direction
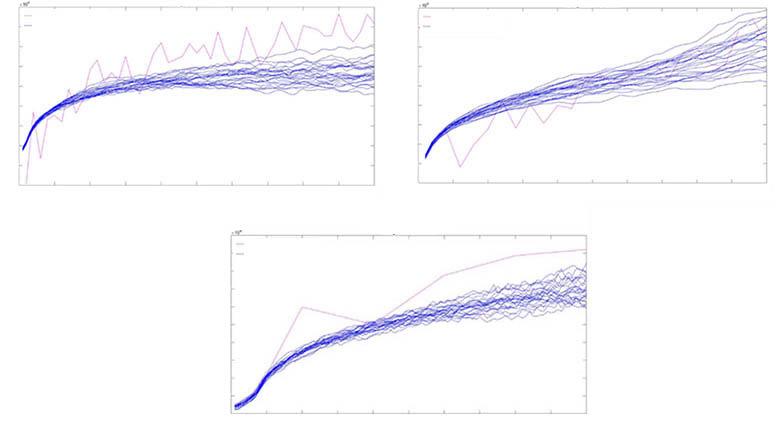
in Y Direction
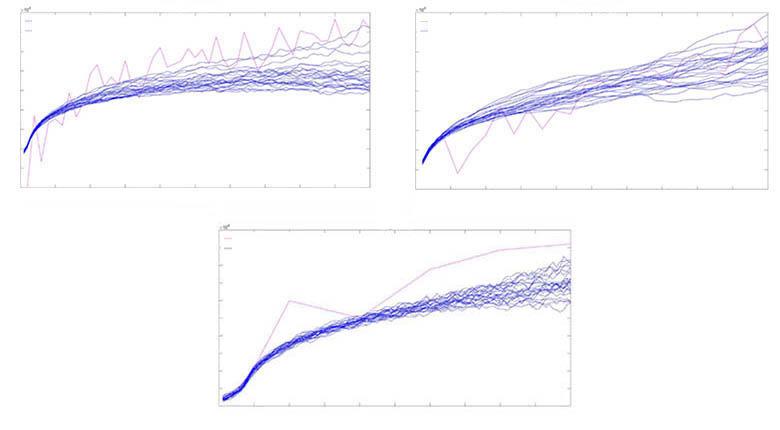
Variogram in Z Direction
Table 7
corresponding to the coal CV simulations and the drill hole data. In all instances, the outcomes effectively capture the spatial attributes inherent in the original data, further consolidating the reliability of the coal CV simulations.
Table 7 succinctly presents the synthesised outcomes of volume and CV uncertainties. The tabulated information encompasses 20 simulated coal body models, delineating the range between minimum and maximum averaged simulated CV values within the coal seams. To ascertain this range, the minimum and maximum averages of CV are deduced from the culmination of 50 Gaussian simulations within each coal seam simulation, followed by an averaging process specific to each simulation. This collective data portray an average CV fluctuating between 5,305 kcal/kg and 6,526 kcal/kg. In juxtaposition, the deterministic scenario hinges upon a single geologist-derived model, relying on ordinary kriging for single-grade estimation. This deterministic perspective, as depicted in Table 8, facilitates an overarching estimation for mean CV and standard deviation within the blocks constituting the coal geobody. While contrasting the standard deviation, Table 8 underscores the reference standards of the conventional coal seams model, prepared by geologists. The application of ordinary kriging, known for its status as the best linear unbiased estimator (BLUE), underpins this reference. The results gleaned from Table 8 show a standard deviation of 222.78 for the conventional model, whereas the simulated volume and CV model manifest a standard deviation of 586.54. The disparity in standard deviations can be attributed to the integration of hard data (drill hole) projections within the coarsest grid during simulation. This amalgamation leads to the compromise of local accuracy, a phenomenon acknowledged in the work of Painthankar and Chatterjee (2017), who encountered analogous findings during simulations for a copper deposit. Coincidentally, Bastante et al. (2008) also corroborated these
Table 8
The statistics of the two estimation methods
observations, mirroring the results reported by Painthankar and Chatterjee (2017), although their study involved the utilisation of SNESIM, indicator kriging, and sequential indicator simulation for a slate deposit.
Illustrated in Figure 14 is the distribution function of the two models under consideration. Notably, the ordinary kriging model with the geologist-prepared coal seams model exhibits a propensity for greater clustering around the mean, effectively reducing the variability of the CV. This observation aligns with expectations, given the inherent smoothing nature of kriging, which serves to mitigate error variance. In contrast, the distribution function emanating from the SNESIM and SGS models portrays a more consolidated tendency towards the upper limit of CV values. This effect, likely, is a result of the conditional independence intrinsic to both the SNESIM and SGS approaches, thereby fostering a more pronounced concentration of CV values at the higher end of the spectrum.
Following the quantification of resources involving volume and CV uncertainties, the derivation of the ultimate pit limit was undertaken to compute the mineable reserve. In this stochastic model, all pertinent uncertainty factors, encompassing volume
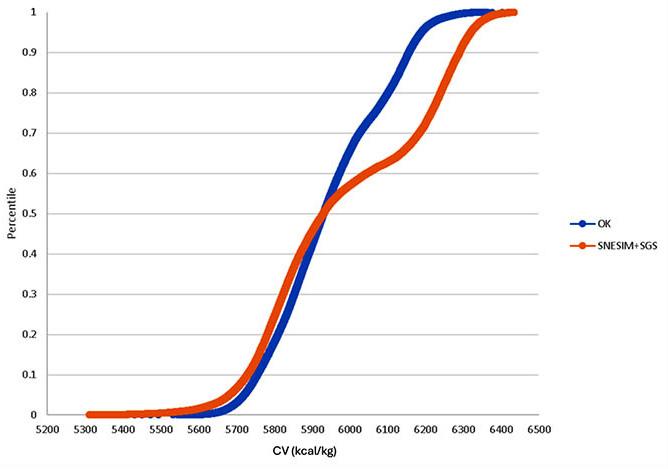
Table 9
and CV, were meticulously accounted for. The coal seams model (volume) was subjected to simulation across 20 realisations, and each of these simulated coal seams models were further imbued with 50 realisations of calorific value simulations, culminating in a total ensemble of 1,000 combinations (50 x 20 = 1,000). Employing the stochastic maximum-flow minimum-cut approach, the calculation of the ultimate pit limit was executed.
This modelling strategy coherently integrates the diverse realisations of coal volume and the estimated CV of mining blocks, enabling the generation of block economic values (BEVs). Subsequently, a singular graph was constructed employing the procedural methodology outlined in Chatterjee et al. (2016) and Asad and Dimitrakopoulos (2013). The ultimate pit limit determination abides by the stipulations of Equations 10 and 11 to furnish a solution. Within this purview, the total number of blocks encompassed by the ultimate pit limit amounted to 67,026.
For the computation of coal reserves, the focus was directed towards the 67,026 blocks situated within the confines of the ultimate pit. A risk analysis of coal tonnage and calorific value across 1,000 realisations was carried out, and the results are summarised in Table 9. The stochastic reserve model estimates the minimum, median, and maximum coal tonnage as 175.4 MT, 182.7 MT, and 185.6 MT, respectively. The corresponding CV ranges from a minimum of 5,150.34 kcal/kg to a median of 6,019.66 kcal/ kg and a maximum of 6,766.98 kcal/kg. The tonnage stripping ratio (waste to ore) calculated using the specific gravity of coal and overburden (as shown in Table 3) ranges from 1.41 to 1.59 (minimum: 1.41, median: 1.46, maximum: 1.59). A comparative analysis was executed between the conventional (deterministic) and stochastic methodologies for ultimate pit limit generation. In the
stochastic paradigm, multiple realisations of coal volume and CV are synergistically combined, contrasting with the deterministic approach that exclusively relies upon a solitary model of volume and CV. The distinct coal volume model was procured from the geologist-designed coal seams model, while the CV was ascertained via kriging algorithm (Goovaerts, 1997). Uniform parameterisation was maintained across both approaches.
Table 9 additionally encapsulates the outcomes of the ultimate pit limit for the deterministic model. The results show that the tally of blocks (coal + overburden) is marginally lower in the deterministic model compared with the stochastic model. Specifically, the block count within the deterministic model accounts for 66,946, constituting a diminutive 0.2% disparity in relation to the stochastic model. However, the tonnage stripping ratio in the deterministic model is very similar to the median value of the stochastic counterpart, quantifying at 1.46. An intriguing observation that can be made from the data is that the average CV yielded by the stochastic model (6,019.66 kcal/kg) reasonably surpasses the average CV value arising from the deterministic model (5,913.7 kcal/kg).
For the computation of undiscounted cash flow across the mine’s operational lifespan, the BEV for each block situated within the ultimate pit was aggregated. The risk profile encompassing the undiscounted cash flow arising from the stochastic model of the mineable reserve is outlined in Table 10. An examination of the data reveals that, on average, the case study mine possesses the potential to generate approximately USD47,141.2 million, utilising the stochastic model that incorporates both volume and CV uncertainties. A comparative analysis against the deterministic model exposes a significant finding: the stochastic model yields
Table 10
Risk profile of undiscounted cash flow within ultimate pit Method Undiscounted cash
a 12% increment in undiscounted cash flow extracted from the mineable reserve of the deposit. This augmentation can be attributed to the stochastic model’s inclination towards the extraction of mining blocks characterised by higher CV values (as depicted in Table 9) throughout the mine’s operational tenure. As a natural consequence, this propensity culminates in the generation of a heightened economic value (as detailed in Table 10) when juxtaposed with the deterministic model.
Conclusions, limitations, and future research
For any coal mining project, the primary objective is to design a mine that optimises revenue generation. Accurate estimation of coal volume and CV is paramount, as over- or underestimations of these factors can significantly impact the project’s feasibility and success. Therefore, incorporating these uncertainties into the reserve calculation can allow coal mine planners to strategically devise a mining plan. This paper introduces a systematic approach to assess the uncertainties related to coal volume and calorific value using a case study of a coal mine in Indonesia. The methodology employs geostatistical techniques to assess volume and CV uncertainties within coal seams. This involves creating a series of equiprobable coal seam models through simulation. SNESIM’s flexibility in data conditioning and its ability to mimic common shapes found in coal geological formations make it an ideal choice. The uncertainty pertaining to CV is evaluated through SGS. The process involves generating 20 SNESIM realisations to account for coal volume uncertainty. Within each of these realisations, 50 SGS instances are generated to capture the variability in CV. The validity of these realisations is confirmed by their ability to replicate relevant statistical parameters. The reserve estimation using these simulation models by the stochastic model shows the average stripping ratio is 1.46 and the average calorific value is 6019.66 kcal/ kg. In comparison to the deterministic model, the stochastic reserve model generates an average of 10% more undiscounted cashflow. Nonetheless, a risk assessment reveals that the optimistic solution yields 29% more undiscounted cashflow, whereas the pessimistic solution generates 12% less from the mineable coal reserve compared with the deterministic estimate. Hence, a meticulous analysis of uncertainties associated with estimating mineable reserves offers enhanced decision-making insights for coal mining projects.
One of the key limitations of this study is that it considers only geological uncertainty in the coal reserve estimation process. In practice, several other variables, such as coal price, mining costs, coal washing costs, and pit slope angle, also exhibit significant uncertainty and can substantially impact reserve estimates and economic outcomes. Apart from geological uncertainties (coal volume and calorific value), this study assumes that all other parameters remain constant throughout the mine’s life
cycle. Future research will aim to incorporate these additional sources of uncertainty into the reserve estimation framework. Furthermore, production scheduling, which sequences mining activities and enables the calculation of year-by-year cash flows, will also be developed to account for these uncertainties, thereby providing a more comprehensive and realistic evaluation of project performance.
References
Abulkhair, S., Madani, N. 2022. Stochastic modeling of iron in coal seams using two-point and multiple-point geostatistics: A case study. Mining, Metallurgy & Exploration, vol. 39, no. 3, pp.1313–1331.
Afzal, P. 2018. Comparing ordinary kriging and advanced inverse distance squared methods based on estimating coal deposits; case study: East-Parvadeh deposit, central Iran. Journal of Mining and Environment, vol. 9, no. 3, pp.753−760.
Amini, S.H., Vass, C., Shahabi, M. Noble, A. 2022. Optimization of coal blending operations under uncertainty–robust optimization approach. International Journal of Coal Preparation and Utilization, vol. 42, no. 1, pp. 30–50.
Arpat, G.B., Caers, J. 2007. Conditional simulation with patterns. Mathematical Geology, vol. 39, pp.177–203.
Asad, M.W.A., Dimitrakopoulos, R. 2013. Implementing a parametric maximum flow algorithm for optimal open pit mine design under uncertain supply and demand. Journal of the Operational Research Society, vol. 64, no. 2, pp. 185–197.
Bastante, F.G., Ordóñez, C., Taboada, J., Matías, J.M. 2008. Comparison of indicator kriging, conditional indicator simulation and multiple-point statistics used to model slate deposits. Engineering Geology, vol. 98, no. 1–2, pp. 50–59.
Camus, J.P. 2002. Management of mineral resources: creating value in the mining business. SME.
Chatterjee, S., Dimitrakopoulos, R., Mustapha, H. 2012. Dimensional reduction of pattern-based simulation using wavelet analysis. Mathematical Geosciences, vol. 44, pp. 343–374.
Chatterjee, S., Sethi, M.R., Asad, M.W.A. 2016. Production phase and ultimate pit limit design under commodity price uncertainty. European Journal of Operational Research, vol. 248, no. 2, pp. 658–667.
CIM. 2014. Nobody likes surprises: The role of the Certified Cost Professional. CIM Magazine. November, 2014. http://www.cim.org/en/Publications-and-Technical-Resources/ Publications/CIM-Magazine/2014/November/columns/Finance. aspx(last access on August 23, 2023).
Deutsch, C.V., Journel, A.G. 1992. Geostatistical software library and user’s guide. New York, vol. 119, no. 147, p. 578.
Dimitrakopoulos, R., Godoy, M. 2014. Grade control based on economic ore/waste classification functions and stochastic simulations: examples, comparisons and applications. Mining Technology, vol. 123, no. 2, pp. 90–106.
Dimitrakopoulos, R., Li, S.X. 2010. Quantification of fault uncertainty and risk assessment in longwall coal mining: stochastic simulation, back analysis, longwall design and reserve risk assessment. Mining Technology, vol. 119, no. 2, pp. 59–67.
Dimitrakopoulos, R., Farrelly, C.T., Godoy, M. 2002. Moving forward from traditional optimization: grade uncertainty and risk effects in open-pit design. Mining Technology, vol. 111, no. 1, pp. 82–88.
Godoy, M., Dimitrakopoulos, R. 2011. A risk quantification framework for strategic mine planning: Method and application. Journal of Mining Science, vol. 47, pp. 235–246.
Goodfellow, R., Consuegra, F.A., Dimitrakopoulos, R., Lloyd, T. 2012. Quantifying multi-element and volumetric uncertainty, Coleman McCreedy deposit, Ontario, Canada. Computers & Geosciences, vol. 42, pp. 71–78.
Goovaerts, P. 1997. Geostatistics for natural resources evaluation Oxford University Press, USA.
Heriawan, M.N., Koike, K. 2008. Uncertainty assessment of coal tonnage by spatial modeling of seam distribution and coal quality. International Journal of Coal Geology, vol. 76, no. 3, pp. 217–226.
Hochbaum, D.S. 2001. A new—old algorithm for minimum‐cut and maximum‐flow in closure graphs. Networks: An International Journal, vol. 37, no. 4, pp. 171–193.
Honarkhah, M., Caers, J. 2010. Stochastic simulation of patterns using distance-based pattern modeling. Mathematical Geosciences, vol. 42, pp. 487–517.
Huang, T., Lu, D.T., Li, X., Wang, L. 2013. GPU-based SNESIM implementation for multiple-point statistical simulation. Computers & geosciences, vol. 54, pp. 75–87.
Journel, A., Zhang, T. 2006. The necessity of a multiple-point prior model. Mathematical geology, vol. 38, pp. 591–610.
Kumar, A., Chatterjee, S. 2017. Open-pit coal mine production sequencing incorporating grade blending and stockpiling options: An application from an Indian mine. Engineering optimization, vol. 49, no. 5, pp. 762–776.
Liu, Y. 2006. Using the Snesim program for multiple-point statistical simulation. Computers & geosciences, vol. 32, no. 10, pp. 1544–1563.
Moore, T.A., Friederich, M.C. 2021. Defining uncertainty: Comparing resource/reserve classification systems for coal and coal seam gas. Energies, vol. 14, no. 19, p. 6245.
Osterholt, V., Dimitrakopoulos, R. 2007. Simulation of wireframes and geometric features with multiple-point techniques: application at Yandi iron ore deposit. Orebody modelling and strategic mine planning, 2nd edn. AusIMM, Spectrum Series, 14, pp. 95–124.
Paithankar, A., Chatterjee, S. 2018. Grade and tonnage uncertainty analysis of an African copper deposit using multiple-point geostatistics and sequential Gaussian simulation. Natural Resources Research, vol. 27, pp. 419–436.
Pyrcz, M.J., Deutsch, C.V. 2014. Geostatistical reservoir modeling Oxford University Press, USA.
Rendu, J.M. 2002. Geostatistical simulations for risk assessment and decision making: the mining industry perspective. International Journal of Surface Mining, Reclamation and Environment, vol. 16, no. 2, pp. 122–133.
Saikia, K., Sarkar, B.C. 2013. Coal exploration modelling using geostatistics in Jharia coalfield, India. International Journal of Coal Geology, vol. 112, pp. 36–52.
Siddiqui, F.I., Pathan, A.G., Ünver, B., Tercan, A.E., Hindistan, M.A., Ertunç, G., Atalay, F., Ünal, S., Kıllıoğlu, Y. 2015. Lignite resource estimations and seam modeling of Thar Field, Pakistan. International Journal of Coal Geology, vol. 140, pp. 84–96.
Sohrabian, B., Soltani-Mohammadi, S., Tercan, A.E. 2023. Joint simulation of coal quality attributes using a new simulated annealing-based method of diagonalisation. International Journal of Mining, Reclamation and Environment, vol. 37, no. 3, pp. 216–242.
Stevanović, D.R., Kolonja, B.M., Stanković, R.M., Knežević, D.N., Banković, M.V. 2014. Application of stochastic models for mine planning and coal quality control. Thermal Science, vol. 18, no. 4, pp. 1361–1372.
Strebelle, S. 2002. Conditional simulation of complex geological structures using multiple-point statistics. Mathematical geology, vol. 34, pp. 1–21.
Strebelle, S.B., Journel, A.G. 2001, September. Reservoir modeling using multiple-point statistics. In SPE Annual Technical Conference and Exhibition? (pp. SPE-71324). SPE.
Tercan, A.E., Sohrabian, B. 2013. Multivariate geostatistical simulation of coal quality data by independent components. International Journal of Coal Geology, vol. 112, pp. 53–66.
Tercan, A.E., Ünver, B., Hindistan, M.A., Ertunç, G., Atalay, F., Ünal, S., Kıllıoğlu, Y. 2013. Seam modeling and resource estimation in the coalfields of western Anatolia. International Journal of Coal Geology, vol. 112, pp. 94–106.
Wang, S., Cao, B., Bai, R. Liu, G. 2025. Determination of production capacity for open-pit coal mines under uncertainty: A model based on economies of scale. PloS one, vol. 20, no. 1, e0312130.
Yüksel, C., Benndorf, J., Lindig, M., Lohsträter, O. 2017. Updating the coal quality parameters in multiple production benches based on combined material measurement: a full case study. International Journal of Coal Science & Technology, vol. 4, pp. 159–171.
Zhang, Y., Underschultz, J., Langhi, L., Mallants, D., Strand, J. 2018. Numerical modelling of coal seam depressurization during coal seam gas production and its effect on the geomechanical stability of faults and coal beds. International Journal of Coal Geology, vol. 195, pp. 1–13. u
1-3 October 2025 — International Mineral Asset Valuation Conference 2025
Navigating Mineral Asset Valuations in an Uncertain Future
The Maslow Hotel, Sandton
Contact: Gugu Charlie Tel: 011 538-0238
E-mail: gugu@saimm.co.za
Website: http://www.saimm.co.za
13-16 October 2025 — Geometallurgy Conference 2025 Future-Ready Geometallurgy: Trusted Data, Advanced Tools, Smarter Decisions
Glenburn Lodge and Spa, Muldersdrift
Contact: Gugu Charlie Tel: 011 538-0238
E-mail: gugu@saimm.co.za
Website: http://www.saimm.co.za
13-16 October 2025 — International Coal Preparation Congress
Sun City, Convention Centre, Website: https://icpc2025.com/
21 October 2025 — 21ST Annual Student Colloquium 2025
Adapting the African Mining industry to changing global trends to ensure long term sustainability Mintek, Randburg, Johannesburg
Contact: Gugu Charlie Tel: 011 538-0238
E-mail: gugu@saimm.co.za
Website: http://www.saimm.co.za
27-29 October 2025 — 9TH International PGM Conference 2025
PGM - Enabling a cleaner world Sun City, Rustenburg, South Africa
Contact: Gugu Charlie Tel: 011 538-0238
E-mail: gugu@saimm.co.za
Website: http://www.saimm.co.za
27-29 October 2025 — Fourth International Slope Stability in Mining Conference
Vancouver Convention Centre, Vancouver, Canada
Website: https://bit.ly/4n3BuMP
30-31 October 2025 — 8TH Young Professionals Conference 2025
Mintek, Randburg, Johannesburg
Contact: Gugu Charlie Tel: 011 538-0238
E-mail: gugu@saimm.co.za
Website: http://www.saimm.co.za
16-22 November 2025 — The 12TH International Copper Conference (Copper 2025) Phoenix, Arizona, USA
Website: https://www.extractionmeeting.org/Extraction2025/ Extraction2025/Copper2025/default.aspx
19-21 November 2025 — MineSafe Hybrid Conference 2025 Safe Mines, Healthy Lives, and Sustainable Futures
Emperors Palace Convention Centre
Contact: Camielah Jardine
Tel: 011 538-0237
E-mail: camielah@saimm.co.za
Website: http://www.saimm.co.za
3-4 March 2026 — Tailings 2026—Where to Now?
Indaba Hotel, Spa and Conference Centre, Fourways
Contact: Gugu Charlie Tel: 011 538-0238
E-mail: gugu@saimm.co.za
Website: http://www.saimm.co.za
13-14 April 2026 — SANCOT Symposium 2026
Unlocking Africa’s Potential: Advances in Tunnelling in Civil Engineering and Mining
Southern Sun Rosebank
Contact: Gugu Charlie Tel: 011 538-0238
E-mail: gugu@saimm.co.za
Website: http://www.saimm.co.za
12 May 2026 — Re-Imagining Diversity and Inclusion Showcase 2026
Southern Sun Rosebank
Contact: Gugu Charlie Tel: 011 538-0238
E-mail: gugu@saimm.co.za
Website: http://www.saimm.co.za
26-28 May 2026 — SAIMM Pyrometallurgy International Conference 2026
Foundation of Competitiveness and Sustainability
CSIR International Convention Centre, South Africa
Contact: Gugu Charlie
Tel: 011 538-0238
E-mail: gugu@saimm.co.za
Website: http://www.saimm.co.za
24-25 June 2026 — Mine-Impacted Water Conference 2026
Mintek, Randburg, Johannesburg
Contact: Gugu Charlie
Tel: 011 538-0238
E-mail: gugu@saimm.co.za
Website: http://www.saimm.co.za
18-20 August 2026 — CAVING 2026
Ulaanbaatar, Mongolia
Website: https://www.acgcaving.com/
19-20 August 2026 — SAIMM Uranium Conference 2026
Swakopmund Hotel and Entertainment Centre, Swakopmund, Namibia
Contact: Gugu Charlie Tel: 011 538-0238
E-mail: gugu@saimm.co.za
Website: http://www.saimm.co.za
22-25 September 2026 — XIX International Society for Mine Surveying Congress 2026
Century City, Cape Town
Contact: Gugu Charlie
Tel: 011 538-0238
E-mail: gugu@saimm.co.za
Website: http://www.saimm.co.za
29-30 September 2026 — 7TH Young Professionals Conference 2026
Mintek, Randburg, Johannesburg
Contact: Gugu Charlie
Tel: 011 538-0238
E-mail: gugu@saimm.co.za
Website: http://www.saimm.co.za
18-22 October 2026 — XXXII International Mineral Processing Congress 2026
Cape Town, South Africa
Contact: Camielah Jardine
Tel: 011 538-0237
E-mail: camielah@saimm.co.za
Website: http://www.saimm.co.za
The following organizations have been admitted to the Institute as Company Affiliates
acQuire Technology Solutions
African Pegmatite
Allied Furnace Consultants
AMIRA International Africa (Pty) Ltd
Anglogold Ashanti Ltd
Anton Paar Southern Africa
Arcus Gibb (Pty) Ltd
Becker Mining (Pty) Ltd
Bluhm Burton Engineering Pty Ltd
BSI Group South Africa
Buraaq mining Services (Pty) Ltd
Caledonia Mining South Africa
Carbocraft
Castle Lead Works
CIGroup ACE Pty Ltd
DDP Specialty Products South Africa (Pty) Ltd
De-Tect Unit Inspection (Pty) Ltd
Digby Wells and Associates
EHL Consulting Engineers (Pty) Ltd
EKATO South Africa
Elbroc Mining Products (Pty) Ltd
Epiroc South Africa (Pty) Ltd
Ex Mente Technologies (Pty) Ltd
Exxaro Resources Limited
FLSmidth Minerals (Pty) Ltd
G H H Mining Machines (Pty) Ltd
Geobrugg Southern Africa (Pty) Ltd
Glencore
Gravitas Minerals (Pty) Ltd
Hatch (Pty) Ltd
Herrenknecht AG
Impala Platinum Holdings Limited
IMS Engineering (Pty) Ltd
Ingwenya Mineral Processing
Ivanhoe Mines SA
Longyear South Africa (Pty) Ltd
Malvern Panalytical (Pty) Ltd
Maptek (Pty) Ltd
Mech-Industries
Micromine Africa (Pty) Ltd
Minearc South Africa (Pty) Ltd
Minerals Council of South Africa
MineRP Holding (Pty) Ltd
Mining Projection Concepts (Pty) Ltd
Mintek
MLB Investments CC
Modular Mining Systems Africa (Pty) Ltd
Murray & Roberts Cementation (Pty) Ltd
M84 Geotech
Paterson & Cooke Consulting Engineers (Pty) Ltd
Pump and Abrasion Technologies (Pty) Ltd
Redpath Mining (South Africa) (Pty) Ltd
Rosond (Pty) Ltd
Roytec Global (Pty) Ltd
Rustenburg Platinum Mines Limited - Union
Schauenburg (Pty) Ltd
Sebotka (Pty) Ltd
SENET (Pty) Ltd
Sibanye Gold Limited
Solenis
Sound Mining Solution (Pty) Ltd
SRK Consulting SA (Pty) Ltd
Tomra (Pty) Ltd
Trans-Caledon Tunnel Authority
Ukwazi Mining Solutions (Pty) Ltd
VBKOM Consulting Engineers
Weir Minerals Africa
Zutari (Pty) Ltd

INTERNATIONAL CONFERENCE 2026
Foundations of Competitiveness and Sustainability
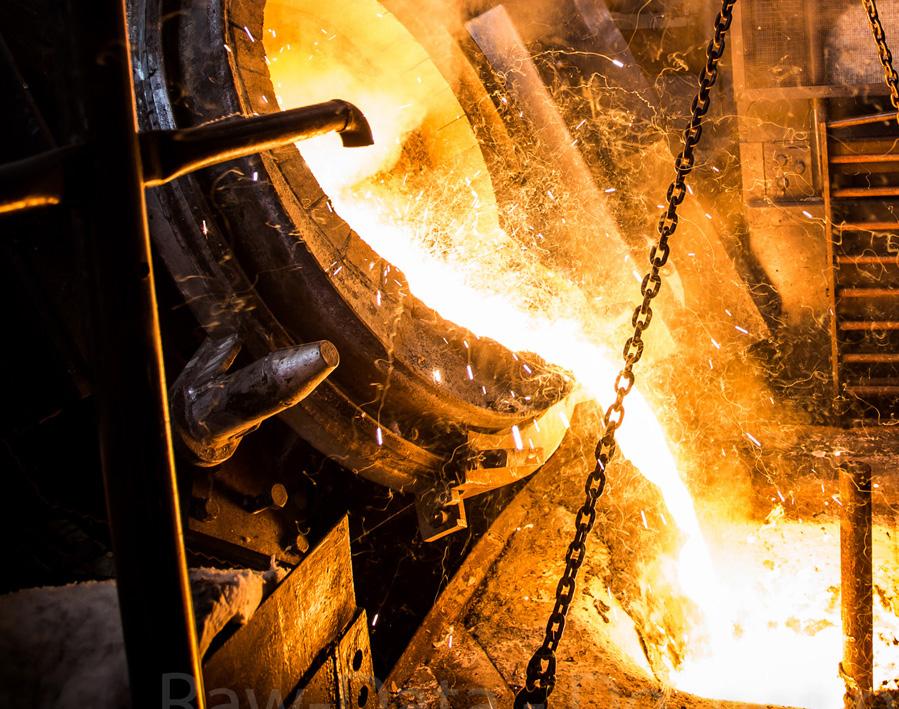
CONVENTION CENTRE, PRETORIA, SOUTH AFRICA

25 May 2026 – Workshops 26-28 May 2026 – Conference 29 May 2026 – Technical Visits
The South African metallurgical industry is facing significant obstacles: Rising production costs, the closure of key service providers like refractory suppliers, and increasing pressure globally for the industry to transform. To face these challenges, it is important for different areas of the industry to work together. The Southern African Institute of Mining and Metallurgy (SAIMM) invites you to the 2026 Pyrometallurgy International Conference, taking place from 25 to 29 May 2026. The conference will bring together professionals and experts from the fields of pyrometallurgy, furnace tapping, and refractories under the theme: Foundations of Competitiveness and Sustainability. This theme challenges us to collaborate in finding answers to the difficult questions we are faced with and to develop sustainable solutions to safeguard the future of our industry. We are confident that through collaborative research, innovative technology development and operational excellence, we can transform the industry and secure a greener future for the next generation of pyrometallurgists.
By integrating these three key focus areas, we aim to create a platform for strategic thinkers, policymakers, researchers, and economic influencers to share insights, challenge assumptions, and collaborate on practical solutions for the future of the industry.
• Professionals and researchers focused on pyrometallurgy, furnace tapping and refractories
• Industry leaders
• Academics
• Students
• The Future of Pyrometallurgy in South Africa
• Advanced Tapping and Refractories
• Pyrometallurgy in SA Under Pressure – What Next?
• Tapped In – The Future of Sustainable Furnace Tapping
• Quo Vadis, Refractories?
DAY
TECHNICAL SITE VISITS
• To Be Confirmed
CALL FOR PAPERS, PRESENTATIONS AND POSTERS
Papers, presentations or posters are invited on any topic related to the conference and can be submitted to any of the three Symposia.
Prospective authors are invited to submit titles and abstracts of their papers in English. The abstracts should be no longer than 500 words and submitted via the SAIMM Abstract Portal.
Acceptance of papers for publication in the SAIMM Journal will be subject to peer review by the Conference Committee and SAIMM Publications Committee pre-conference.
• Abstract submission deadline: 29 September 2025
• Paper submission deadline: 10 November 2025
• Workshops: 25 May 2026
• Conference: 26-28 May 2026
• Technical Visits: 29 May 2026
MARCH 2026 CONFERENCE
3-4 MARCH 2026 – CONFERENCE | 5 MARCH 2026 – TECHNICAL VISIT
Indaba Hotel, Spa and Conference Centre, Fourways
ECSA and SACNASP Validated CPD
ActivityCredits = 0.1 per hour attended
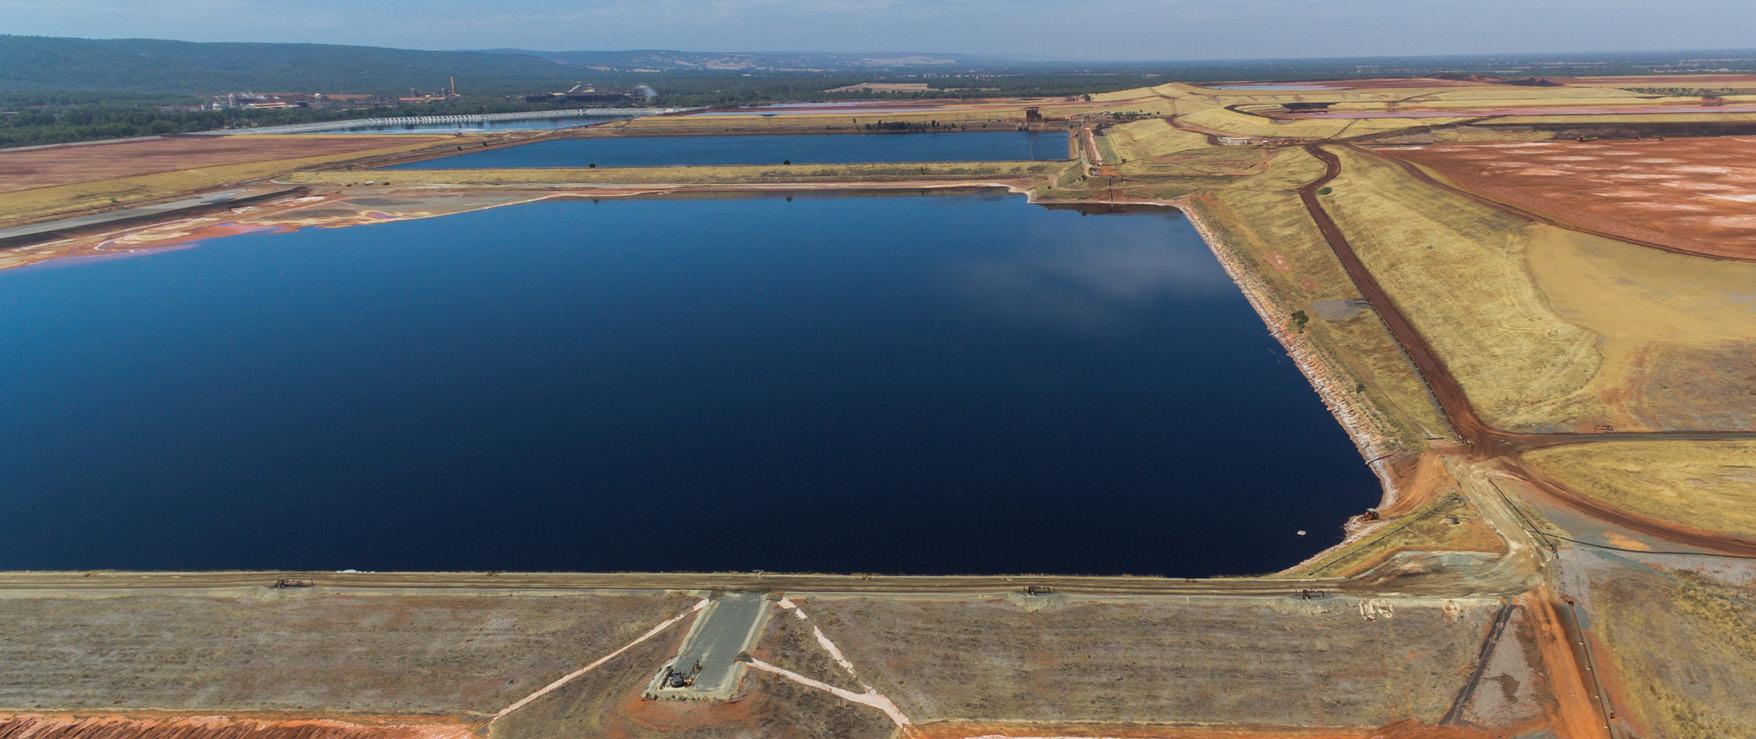
Supported by SAIEG In partnership with MMMA and SAICE


The SAIMM is proud to announce its upcoming 2026 conference on Tailings. Since the inaugural event, which raised the profile of tailings management and fostered collaboration among industry stakeholders, and the subsequent conference that focused on embracing the Global Industry Standard on Tailings Management (GISTM), the field has seen significant progress. We’ve deepened our understanding of GISTM requirements, advanced geotechnical knowledge of tailings dams, engaged more stakeholders, and made strides toward improved safety through GISTM compliance.
However, despite these achievements, tailings dam failures persist, signalling that there is still much work to be done and lessons to learn. As we look to the future, the 2026 conference will ask: Where to now? In a world of new standards, evolving expectations, and emerging possibilities, what opportunities lie ahead? What residual risks need addressing? How can we further reduce, reclaim, or reuse tailings? How can we accelerate the adoption of new technologies and set a new benchmark for the industry? What impacts, once considered acceptable, are no longer tolerable, and how can we best manage them?
Join us in 2026 to explore these critical questions and engage in meaningful discussions with key role players in the tailings industry.
For further information contact:
Gugu Charlie, Conferences and Events Co-ordinator

