





OFFICE BEARERS AND COUNCIL FOR THE 2024/2025 SESSION
President E. Matinde
President Elect
G.R. Lane
Senior Vice President
T.M. Mmola
Junior Vice President
M.H. Solomon
Incoming Junior Vice President
S.J. Ntsoelengoe
Immediate Past President
W.C. Joughin
Honorary Treasurer
W.C. Joughin
Ordinary Members on Council
W. Broodryk M.C. Munroe
Z. Fakhraei S.M. Naik
B. Genc G. Njowa
K.M. Letsoalo S.M. Rupprecht
S.B. Madolo A.T. van Zyl
M.A. Mello E.J. Walls
K. Mosebi
Co-opted Council Members
A.D. Coetzee
L.T. Masutha
Past Presidents Serving on Council
N.A. Barcza C. Musingwini
R.D. Beck S. Ndlovu
Z. Botha J.L. Porter
V.G. Duke M.H. Rogers
I.J. Geldenhuys G.L. Smith
R.T. Jones
G.R. Lane – TP Mining Chairperson
Z. Botha – TP Metallurgy Chairperson
K.W. Banda – YPC Chairperson
C.T. Chijara – YPC Vice Chairperson
Branch Chairpersons
Botswana K. Mosebi
DRC K.T. Kekana (Interim Chairperson)
Johannesburg N. Rampersad
Limpopo M.S. Zulu
Namibia T. Aipanda
Northern Cape Vacant
North West Vacant
Pretoria P.G.H. Pistorius
Western Cape Vacant
Zambia N.M. Kazembe
Zimbabwe L. Shamu
Zululand Vacant
*Deceased
* W. Bettel (1894–1895)
* A.F. Crosse (1895–1896)
* W.R. Feldtmann (1896–1897)
* C. Butters (1897–1898)
* J. Loevy (1898–1899)
* J.R. Williams (1899–1903)
* S.H. Pearce (1903–1904)
* W.A. Caldecott (1904–1905)
* W. Cullen (1905–1906)
* E.H. Johnson (1906–1907)
* J. Yates (1907–1908)
* R.G. Bevington (1908–1909)
* A. McA. Johnston (1909–1910)
* J. Moir (1910–1911)
* C.B. Saner (1911–1912)
* W.R. Dowling (1912–1913)
* A. Richardson (1913–1914)
* G.H. Stanley (1914–1915)
* J.E. Thomas (1915–1916)
* J.A. Wilkinson (1916–1917)
* G. Hildick-Smith (1917–1918)
* H.S. Meyer (1918–1919)
* J. Gray (1919–1920)
* J. Chilton (1920–1921)
* F. Wartenweiler (1921–1922)
* G.A. Watermeyer (1922–1923)
* F.W. Watson (1923–1924)
* C.J. Gray (1924–1925)
* H.A. White (1925–1926)
* H.R. Adam (1926–1927)
* Sir Robert Kotze (1927–1928)
* J.A. Woodburn (1928–1929)
* H. Pirow (1929–1930)
* J. Henderson (1930–1931)
* A. King (1931–1932)
* V. Nimmo-Dewar (1932–1933)
* P.N. Lategan (1933–1934)
* E.C. Ranson (1934–1935)
* R.A. Flugge-De-Smidt (1935–1936)
* T.K. Prentice (1936–1937)
* R.S.G. Stokes (1937–1938)
* P.E. Hall (1938–1939)
* E.H.A. Joseph (1939–1940)
* J.H. Dobson (1940–1941)
* Theo Meyer (1941–1942)
* John V. Muller (1942–1943)
* C. Biccard Jeppe (1943–1944)
* P.J. Louis Bok (1944–1945)
* J.T. McIntyre (1945–1946)
* M. Falcon (1946–1947)
* A. Clemens (1947–1948)
* F.G. Hill (1948–1949)
* O.A.E. Jackson (1949–1950)
* W.E. Gooday (1950–1951)
* C.J. Irving (1951–1952)
* D.D. Stitt (1952–1953)
* M.C.G. Meyer (1953–1954)
* L.A. Bushell (1954–1955)
* H. Britten (1955–1956)
* Wm. Bleloch (1956–1957)
* H. Simon (1957–1958)
* M. Barcza (1958–1959)
* R.J. Adamson (1959–1960)
* W.S. Findlay (1960–1961)
* D.G. Maxwell (1961–1962)
* J. de V. Lambrechts (1962–1963)
* J.F. Reid (1963–1964)
* D.M. Jamieson (1964–1965)
* H.E. Cross (1965–1966)
* D. Gordon Jones (1966–1967)
* P. Lambooy (1967–1968)
* R.C.J. Goode (1968–1969)
* J.K.E. Douglas (1969–1970)
* V.C. Robinson (1970–1971)
* D.D. Howat (1971–1972)
* J.P. Hugo (1972–1973)
* P.W.J. van Rensburg (1973–1974)
* R.P. Plewman (1974–1975)
* R.E. Robinson (1975–1976)
* M.D.G. Salamon (1976–1977)
* P.A. Von Wielligh (1977–1978)
* M.G. Atmore (1978–1979)
* D.A. Viljoen (1979–1980)
* P.R. Jochens (1980–1981)
* G.Y. Nisbet (1981–1982)
A.N. Brown (1982–1983)
* R.P. King (1983–1984)
J.D. Austin (1984–1985)
* H.E. James (1985–1986)
H. Wagner (1986–1987)
* B.C. Alberts (1987–1988)
* C.E. Fivaz (1988–1989)
* O.K.H. Steffen (1989–1990)
* H.G. Mosenthal (1990–1991)
R.D. Beck (1991–1992)
* J.P. Hoffman (1992–1993)
* H. Scott-Russell (1993–1994)
J.A. Cruise (1994–1995)
D.A.J. Ross-Watt (1995–1996)
N.A. Barcza (1996–1997)
* R.P. Mohring (1997–1998)
J.R. Dixon (1998–1999)
M.H. Rogers (1999–2000)
L.A. Cramer (2000–2001)
* A.A.B. Douglas (2001–2002)
* S.J. Ramokgopa (2002-2003)
T.R. Stacey (2003–2004)
F.M.G. Egerton (2004–2005)
W.H. van Niekerk (2005–2006)
R.P.H. Willis (2006–2007)
R.G.B. Pickering (2007–2008)
A.M. Garbers-Craig (2008–2009)
J.C. Ngoma (2009–2010)
G.V.R. Landman (2010–2011)
J.N. van der Merwe (2011–2012)
G.L. Smith (2012–2013)
M. Dworzanowski (2013–2014)
J.L. Porter (2014–2015)
R.T. Jones (2015–2016)
C. Musingwini (2016–2017)
S. Ndlovu (2017–2018)
A.S. Macfarlane (2018–2019)
M.I. Mthenjane (2019–2020)
V.G. Duke (2020–2021)
I.J. Geldenhuys (2021–2022)
Z. Botha (2022-2023)
W.C. Joughin (2023-2024)
Editorial Board
S.O. Bada
R.D. Beck
P. den Hoed
I.M. Dikgwatlhe
M. Erwee
B. Genc
R.T. Jones
W.C. Joughin
A.J. Kinghorn
D.E.P. Klenam
D.F. Malan
D. Morris
C. Musingwini
P.N. Neingo
S.S. Nyoni
M. Onifade
M. Phasha
P. Pistorius
P. Radcliffe
N. Rampersad
Q.G. Reynolds
I. Robinson
S.M. Rupprecht
T.R. Stacey
International Advisory Board members
R. Dimitrakopolous
R. Mitra
S. Ndlovu
A.J.S. Spearing
E. Topal
D. Tudor
F. Uahengo
D. Vogt
Editor /Chairperson of the Editorial Board
R.M.S. Falcon
Typeset and Published by
The Southern African Institute of Mining and Metallurgy
PostNet Suite #212 Private Bag X31 Saxonwold, 2132
E-mail: journal@saimm.co.za
Printed by Camera Press, Johannesburg
Advertising Representative
Barbara Spence
Avenue Advertising

Journal Comment: Complexity of Slope Stability by R. Armstrong ................................................................
President’s Corner: Final reflections and future considerations by E. Matinde ..................................................................
THE INSTITUTE, AS A BODY, IS NOT RESPONSIBLE FOR THE STATEMENTS AND OPINIONS ADVANCED IN ANY OF ITS PUBLICATIONS.
Copyright© 2025 by The Southern African Institute of Mining and Metallurgy. All rights reserved. Multiple copying of the contents of this publication or parts thereof without permission is in breach of copyright, but permission is hereby given for the copying of titles and abstracts of papers and names of authors. Permission to copy illustrations and short extracts from the text of individual contributions is usually given upon written application to the Institute, provided that the source (and where appropriate, the copyright) is acknowledged. Apart from any fair dealing for the purposes of review or criticism under The Copyright Act no. 98, 1978, Section 12, of the Republic of South Africa, a single copy of an article may be supplied by a library for the purposes of research or private study. No part of this publication may be reproduced, stored in a retrieval system, or transmitted in any form or by any means without the prior permission of the publishers. Multiple copying of the contents of the publication without permission is always illegal. U.S. Copyright Law applicable to users In the U.S.A. The appearance of the statement of copyright at the bottom of the first page of an article appearing in this journal indicates that the copyright holder consents to the making of copies of the article for personal or internal use. This consent is given on condition that the copier pays the stated fee for each copy of a paper beyond that permitted by Section 107 or 108 of the U.S. Copyright Law. The fee is to be paid through the Copyright Clearance Center, Inc., Operations Center, P.O. Box 765, Schenectady, New York 12301, U.S.A. This consent does not extend to other kinds of copying, such as copying for general distribution, for advertising or promotional purposes, for creating new collective works, or for resale.
Honorary Legal Advisers
M H Attorneys
Auditors
Genesis Chartered Accountants
Secretaries
The Southern African Institute of Mining and Metallurgy 7th Floor, Rosebank Towers, 19 Biermann Avenue, Rosebank, 2196
PostNet Suite #212, Private Bag X31, Saxonwold, 2132 E-mail: journal@saimm.co.za
Telephone (011) 463-7940 . E-mail: barbara@avenue.co.za
ISSN 2225-6253 (print) . ISSN 2411-9717 (online)


Stability design of slopes in carbonatite complexes characterised by brecciation by D. Moses, J.A. Onyango ......................................................................................... 401
In this contribution, a numerical simulation using phase2 v 7.0 was carried out to investigate the influence of in situ rock damage on the stability of mine pit walls. The results reveal that the existence of breccia in the competent rock mass has the capability to reduce the slope stability performance. From a series of analyses, the ratio of 1:5 between the breccia distance from slope toe and pit depth should be implemented to counter its impact. If the breccia is within or close to the pit limit, it should be mined out.
Evaluating the triaxial strength of Misis fault breccia using artificial neural networks analysis by S. Kahraman, M. Alber, O. Gunaydin, M. Fener..................................................................... 413
The purpose of this study is to develop some predictive models for the differential stress (Δσ) based on physical and textural properties of fault breccias. Artificial neural networks were used to analyse data related to Misis fault breccia. It can be concluded that artificial neuron networks analysis provides a reliable indirect method for predicting the differential stress of Misis fault breccia.
Risk-based slope design: Insights from the Thabazimbi failure by M. Bester, T. Dlokweni, I. Basson, C. Koegelenberg
This contribution presents the slope failure in Thabazimbi Mine’s Kumba pit as a case study in the context of a risk-based approach to slope design as well as the importance of implementing geotechnical controls to effectively manage slope instability risk. A comprehensive back-analysis was performed to gain insights into the failure mechanism. Lessons learnt demonstrated the importance of following a risk-based approach in slope design to effectively manage safety and financial risk in open pit mines.
Slope stability evaluation of Gneiss rock slopes using slope mass rating (SMR) and QSlope by E. Kalhan, C. Kincal
In this research, the slope stability of rock slopes in a mine opened in a gneiss geological unit was studied. To assess slope stability, detailed discontinuity surveys were carried out on bench faces. Subsequently, kinematic and numerical analyses were employed to identify geometries that are expected to maintain stability. Based on these classification systems, potential unstable rock slopes were identified, and thematic maps were created using geographic information systems.
Learnings from development of an underground sub-level open stope mine below an open pit by K.B. Le Bron, M.C. van Eeden, R. Vermeulen
This paper presents the lessons learnt during the transition from an open pit method to a sub-level open stoping method at the Koidu Limited kimberlite pipe. Predictive geotechnical stability modelling was successfully applied to highlight potential failure zones, which allowed modification and enhancement of the mining layouts and quantification of the potential dilution of the kimberlite from indicative instabilities.
Guide to using gravity in the detection of underground voids by L.M. Linzer, P. Linzer
This paper aims to explain how to apply the gravity method correctly to mining and geotechnical problems, specifically in the detection of subsurface cavities. It discusses various factors to assist with optimising the acquisition of gravity data and its processing in order to maximise the practical value of gravity surveys. The gravity surveying specifications prescribed in SANS 1936 omit some key requirements for optimal survey outcomes, and this paper is intended to fill those gaps.
Calibrate rock mass shear strength for open pit slopes by J. Venter, C. Banff, E.C.F. Hamman.
This paper investigates the differences between limit equilibrium and elastic linearly plastic slope stability analysis based on the Hoek-Brown failure criterion for open pit slope stability analyses. The investigation consisted of a comparison of 3840 RS2 finite element analysis models completed with strain softening, and 216 Slide2 limit equilibrium models. The results compare well with older empirical shear strength estimates, however, a detailed calibration of the results against case studies will need to be carried out.
Development of a filtered inverse velocity method analyser: A comparative study of smoothing filters in surface mines for optimisation of slope failure predictions by M.M. Masood, T. Verma, G.Y. Raju ...............................................................................
This study applies and evaluates three filtering techniques to velocity time series data to enhance predictive accuracy to improve slope failure forecasting in surface mining operations. A refined prediction framework is proposed. The results demonstrate that filter selection plays a crucial role in optimising failure time predictions, offering valuable insights for geotechnical monitoring and early warning systems in surface mines.
Rock mass damage and induced passive depressurisation around open pits by A. Bloem, M. Royle, R. Uken
Rock mass damage induced by mining increases the fracture frequency and joint aperture width in pit walls and rock mass behind open pit mine slopes. This investigation has resulted in the development of a method to adjust initial hydraulic conductivity values used to estimate transient pore pressure conditions found in rock masses exposed in different pit morphologies within the open pit mine. The changes in K values and pore pressures can be used to determine hydrogeological influence more accurately on future pit slope stability.


he South African mining industry is well known for the advancements in underground, especially ultra-deep, mines. But it has also made significant contributions to open pit mining and the stability of slopes. The SAIMM hosted a symposium on slope stability as early as 1970 (book S2 in the symposium series), which was conceptualised by the SAIMM because open pit mines were getting bigger and deeper, and the sharing of knowledge and experience from the industry was required. Over 300 local and international delegates attended the symposium, including technical, industry, and academic leaders in open pit mining and rock mechanics. Incidentally, two of the speakers would go on to found two international mining consulting firms. Again, recognising that pits were being planned much deeper than ever before, The SAIMM planned the first International Symposium on Stability of Rock Slopes in Open Pit Mining and Civil Engineering in 2006, which has since been held 10 times in 8 different countries (now informally referred to as simply The Slopes Conference). This symposium was again organised by the SAIMM in 2015. This special edition of the journal serves as a further commitment to the development of the science and engineering of rock slopes, with the very high response of papers dealing with some interesting and pertinent developments. Topics covered include: slope stability analyses, groundwater interactions with slopes, forecasting of failure, detection of underground cavities, and the back analysis of a very large slope failure.
Significant developments have taken place in the last two decades in monitoring and numerical modelling of rock slopes. These often overshadow the importance of understanding the actual mechanics of big slopes, and how to reliably design them. Many advances in technology have provided the tools to aid in this, but there is a long way to go in understanding the complex interplay of the geological complexity (including varying rock types, geological structure, alteration, and weathering), complex groundwater systems (often grossly over simplified), strength properties, appropriate failure criteria, slope geometries, blasting, et al. These complexities are impossible to include in any single analysis or model, so the design and understanding of large slope behaviour still require contextualising multiple over-simplified models and determining how their interaction results in the limitation of slope equilibrium. Furthermore, how to manage all of that in the implementation of big slopes. This complexity means that slopes require the inputs from many specialists and an understanding of the limitations of their science and models. So much more is needed in the development of rock slope engineering.
R. Armstrong


his month’s article will be my last contribution to the SAIMM President’s Corner. It has been a very interesting and rewarding twelve months as President of the SAIMM and I am thrilled to hand over the baton to my colleague Gary Lane as the newly inaugurated SAIMM President. As part of my communication strategy during the last twelve months, I deliberately selected a few, but very critical, areas of engagement affecting our mining industry. I also chose to structure my article contributions through the lens of a Socratic approach. Of course, any reasonable mind is bound to ask: Why the Socratic approach?
Originally attributed to the ancient Greek philosopher Socrates (c.a. 470-399 BCE), the Socratic method is a form of logical argumentation used to uncover hidden assumptions, challenge beliefs, and achieve deeper understanding of complex and contentious issues through a set of continual probing questions. As opposed to the conventional didactic, and often positional discussions based on perceived factual knowledge, the Socratic approach is a self-discovery method that encourages participants to explore complexities and plurality around sensitive topics by forcing them to evaluate issues from multiple perspectives. In my view, the challenges affecting our industry are way too complex, and indeed too complicated, to solve them through a positional and/or zero sum mindset. Case in point is the discussions around retrenchments and layoffs amid market disruptions precipitated by the turbulent global geopolitical environment.
In my first article I made a bold proposition that, with the right technological, economic, and policy conditions, critical minerals and metals can act as key levers for industrial development, leading to sustained technological and economic catch-up. My hypothesis still remains unchanged, particularly in the context of astronomical demand for critical raw materials that are needed to drive the clean energy transition. In essence, the clean energy economic epoch naturally presents windows of opportunity for technological upgrading and industrialisation through value-added manufacturing and localisation of value-added manufacturing activities. Although the role of mineral endowment in the technological and economic catch-up framework is still poorly understood, I support the urgent calls to increase the level of beneficiation of mineral resources in host communities. In my view, this call to action should be universal if we are to address the extractivist curse that has epitomised the mineral resources sector in the global south for centuries.
Obviously, I am not naive to the fact that developing and sustaining manufacturing capabilities is not a trivial endeavour. However, I remain convinced that, with the right economic incentives and policy enablers, such capabilities and competencies can be developed and nurtured for the long-term benefits of our industry and members. If value-addition and beneficiation is a mission, then all that we need are mission-oriented industrial policies and corporate strategies to drive the innovation and technological upgrading in our industry. As an avid reader on this subject, I would like to refer our readers to explore the interesting dimensions of mission-oriented policies presented in the work published by Prof. Mariana Mazzucato (open access article is available here: https://academic.oup.com/icc/article/27/5/803/5127692).
I also made reference in one of my articles to China’s deliberate efforts to industrialise its economy through strategic support of SMEs and SMMEs (they call them little giants due to their unique capabilities and positioning to grow into national champions) in critical industries. Despite the global contestations on the perceived methods used, the Made in China 2025 policy framework is a noteworthy sovereign strategy that provided the driving force required to catalyse innovation and drive the competitiveness of the value addition and beneficiation supply chains for Chinese enterprises. Germany’s SME-centric Industrie 4.0 strategic initiative, supported by a strong vocational education and training system, also provides a comprehensive template for the global south to learn from. Obviously, there are insurmountable challenges and complexities that we have to overcome before we can achieve some of these desired outcomes. I am looking forward to opportunities to engage further on this complex subject beyond my tenure as President of the SAIMM.
It was an honour that my tenure as SAIMM President coincided with the publication of the Critical Minerals and Metals Strategy for South Africa. The timing of the strategy document is profound in that it comes at a time when we have strong convergence on the need to intensify the local beneficiation of our minerals. The bold declarations to improve the regulatory stability and regulatory flexibility, including deliberate efforts to address other critical bottlenecks, are well received and appreciated. Once again, I would like to reiterate the importance of alignment of the strategy to the broader socio-political economy for us to achieve meaningful economic transformation.
The contribution of mining to the fiscuses and economic development of host countries should never be questioned. However, it would be folly to ignore the negative externalities our industry presents to host communities in the form of potential environmental damage from mine residues, mine impacted water, and airborne emissions. In one of my monthly articles, I highlighted the challenges of legacy mine residues emanating from the historical closure of mining sites and smelters long before the nascent environmental practices came into effect. The environmental potency is obviously exacerbated by the fact that these mine residues are formed ex situ with the potential to undergo physical, chemical, and/or thermal alteration over a period of time, making their long-term geochemical behaviour unpredictable. Additionally, the absence of real-time monitoring data, including limited availability of historical data sets in open access platforms, complicates our understanding of the long-term environmental impact of these legacy challenges. Despite our best efforts, the production and accumulation of mine residues is unfortunately inevitable if humanity is to continue enjoying the same level of affluence and economic development. However, I am convinced that our technical programmes will continue to provide non-zero sum platforms designed to share knowledge and best practices that are required to minimise the environmental footprint of mining activities.
Finally, I would like to take this opportunity to emphasise the need for homegrown technological solutions to transform our industry. With collective effort to develop endogenous technological capabilities, I strongly believe that we can achieve technology sovereignty and mitigate against external technological dependency. To achieve this, we need to strengthen collaborations while continuously investing in building and sustaining multidisciplinary engineering and vocational skills to drive innovation and upgrade productivity and industrial competitiveness. I am optimistic about the future impact from the industry drive to fund artisanal, enterprise, and postgraduate qualifications in the mining industry through the various public and private sector initiatives. In particular, I would like to encourage our young professionals to aggressively pursue any self-learning opportunities available to them, which includes exploring the pursuance of postgraduate qualifications through the various platforms available to support personal growth in the industry.
In conclusion, I would like to thank all those who took their time to read my articles over the past year. I acknowledge the fact that it takes an insurmountable amount of patience to read articles on Greek mythologies, but at this juncture our industry needs to demonstrate hope, resurrection, and renewal, similar to the immortal phoenix bird that cyclically regenerates itself by rising from the ashes of its predecessor.
Capaci occasio.
E. Matinde President, SAIMM

Affiliation:
1Department of Geography and Earth Sciences, School of Applied Science, University of Malawi, Malawi
2Department of Mining, Materials and Petroleum Engineering, Jomo Kenyatta University of Agriculture and Technology, Kenya
Correspondence to: D. Moses
Email: dmoses@unima.ac.mw
Dates:
Received: 3 Jan. 2022
Revised: 7 Mar. 2022
Accepted: 10 Jul. 2025
Published: August 2025
How to cite:
Moses, D., Onyango, J.A. 2025. Stability design of slopes in carbonatite complexes characterised by brecciation. Journal of the Southern African Institute of Mining and Metallurgy, vol. 125, no. 8, pp. 401–412
DOI ID:
https://doi.org/10.17159/2411-9717/1972/2025
ORCiD:
D. Moses
http://orcid.org/0000-0002-9387-4094
J.A. Onyango
http://orcid.org/0000-0002-5558-4125
by D. Moses1, J.A. Onyango2
Abstract
Carbonatites are generally competent rock masses with rock mass rating class II rating 60–74. In spite of their competency, they tend to be affected by weak features like manganese-iron veins and/or in situ rock damage due to brecciation associated with carbonatite complexes. Rock slope failure in such hard rocks is complex since such structures within the rock mass form weak links that could potentially control slope instability. In this contribution, a numerical simulation using phase2 v 7.0 was carried out to investigate the influence of in situ rock damage on the stability of mine pit walls. The outcome reveals that, the existence of breccia in the competent rock mass has the capability to reduce the slope stability performance particularly at gentle dipping angles of emplacement in close range to the slope toe. However, as the emplacement position of breccia moves away from the pit wall, the stability performance increases at gentle dipping angle <50º. On the contrary, at the dipping angle of 50° the performance of slope reduced, and at steeper angles >50° the impact becomes negligible. Thus, from a series of analyses, mine design in brecciated rock masses, the ratio of 1:5 between the breccia distance from slope toe and pit depth should be implemented to counter its impact, and if the breccia is within or close to the pit limit, a deliberate effort must be made to mine it out.
Keywords Songwe Hill, carbonatite, finite element method, in situ rock damage, breccia
Introduction
In recent years, the significance and applications of the rare earth elements (REE) for modern technologies, particularly for the permanent magnets used in the generators of wind turbines and the motors of electric vehicles, have led to an increased research focus on alkaline rocks and carbonatites (Goodenough et al., 2021). Carbonatites, which are igneous rocks containing more than 50% modal primary carbonates and less than 20 wt. % SiO2 (Simandl, Paradis, 2018; Woolley, Church, 2005; Xu et al., 2015), are generally competent rock masses with rock mass rating class II rating 60-74 (Moses et al., 2020). However, carbonatite complexes are highly affected by the later stage hydrothermal and carbo-hydrothermal phases where expelled fluids in fissures lead to the formation of new weak features like manganese-iron (Mn-Fe) veins and/or damage of the rock. Thus, rock slope failure in these hard rocks is complex since structures within the rock mass form weak links that could potentially control slope instability. Stead and Wolter (2015) highlighted instances of the significant impacts of sheeting, exfoliation, and joints on slope stability. Generally, when considering structurally controlled stability in hard rocks, emphasis is given to the role of discontinuity persistence, orientation, and intensity. But the complexity of failure mechanisms in rock slopes is when a combination of pre-existing geological weak planes and failure of intact rock induce instability. Intact rock can be subjected to physical damage of different forms as discussed by Brideau et al. (2009) presented in a summarised form in Table 1.
The concept of damage of intact rock and rock mass relates to the degradation of their strength properties. The physical damage usually takes place in planes of weakness ranging in scale from microcracks to faults. Atkinson (1987) articulates that the formation of planes of weaknesses occurs through three basic modes of fracture: opening, sliding, and tearing.The ultimate effect of the damage processes is the degradation of the intact rock properties towards damaged rock mass and the rupture in intact rock is regarded as the accumulation of the damage (Brideau et al., 2009).
The determination of the rock damage condition has mostly been made possible through rock mass classification systems. Among sundry classification schemes, Geological Strength Index (GSI) has proven to be pivotal in the rock damage characterisation process with respect to stability analysis. A number of
Table 1
Types of rock slopes damage (Brideau et al., 2009)
Type of damage Process
Brittle Initiation, comminution
Ductile Rigid block overlying soft rocks.
Creep Sub-critical crack growth.
Fatigue Low/high frequency loading/unloading cycles (glaciation, isostasy, pore water pressure fluctuation, freeze–thaw, wet/dry, seismicity).
Thermal Heating and cooling cycles.
Tectonic Preconditioned damage due to faults, folds and in situ stress.
Anthropogenic Excavation, blasting.
Physio-chemical Hydrothermal alteration, weathering, corrosion.
Geomorphic Stress induced damage associated with valley formation, cambering, erosion, thermal cycling.
studies have investigated the control of folds and faults, shearing, and clay-infill of joints on the stability of rock slopes. A study by Bye and Bell (2001) revealed that steep dipping and persistency of the joints at Sandsloot open pit in South Africa were principal causes of the slope instability at the mine, triggering failure.
Faults and fault damage have also been recognised to compromise the performance of the slopes by affecting the regional geology, rock mass, and stress conditions in large open pits. The impact of fault characteristics are directly linked to stress heterogeneities created by the interaction between the faults and the mining induced stresses generated during excavation, leading to localised high plastic shear strain and high extensional strain around the fault (Severin, 2017; Stead, Wolter, 2015). Additionally, Stead and Wolter (2015) demonstrated that structural features, such as folds, bedding planes, faults, and discontinuities commonly affect hydrogeological conditions, a crucial factor in slope stability, acting as either water conduits or aquitards. Simulated models that incorporated groundwater showed a tremendous slope instability due to groundwater pressures.
Bachmann et al. (2004) also examined the influence on slope stability of both damage due to weathering and the presence of large-scale fractures using three-dimensional scaled analogue physical models. The experimental results demonstrated that the introduction of a weathered material on the surface of the rock mass controlled the ease, depth, and extent of the slope failure. However, the presence of large scale fractures had little effect on slope stability. Based on the findings by Bachmann et al. (2004), the fractures controlled the lateral extent of the slope failures. Recently, Qian et al. (2017) investigated the influence of rock mass disturbance caused by blasting on rock slope stabilty and found that the thickness of blasting damage zone substantially lowers the rock slope stability. A similar study was conducted by Zheng, et al. (2018) but the focus was on comparing limit equilibrium (LE) approach against numerical approach. Further from confirming findings by Qian et al. (2017), the results revealed only 5.6% discrepancy between the LE and numerical analyses results. In this contribution,
a consideration is given to in situ rock damage in a brittle form as a result of a unique phenomenon of brecciation associated with carbonatite complexes and its role in preconditioning instability on mine pit walls.
Location and geology of the study area
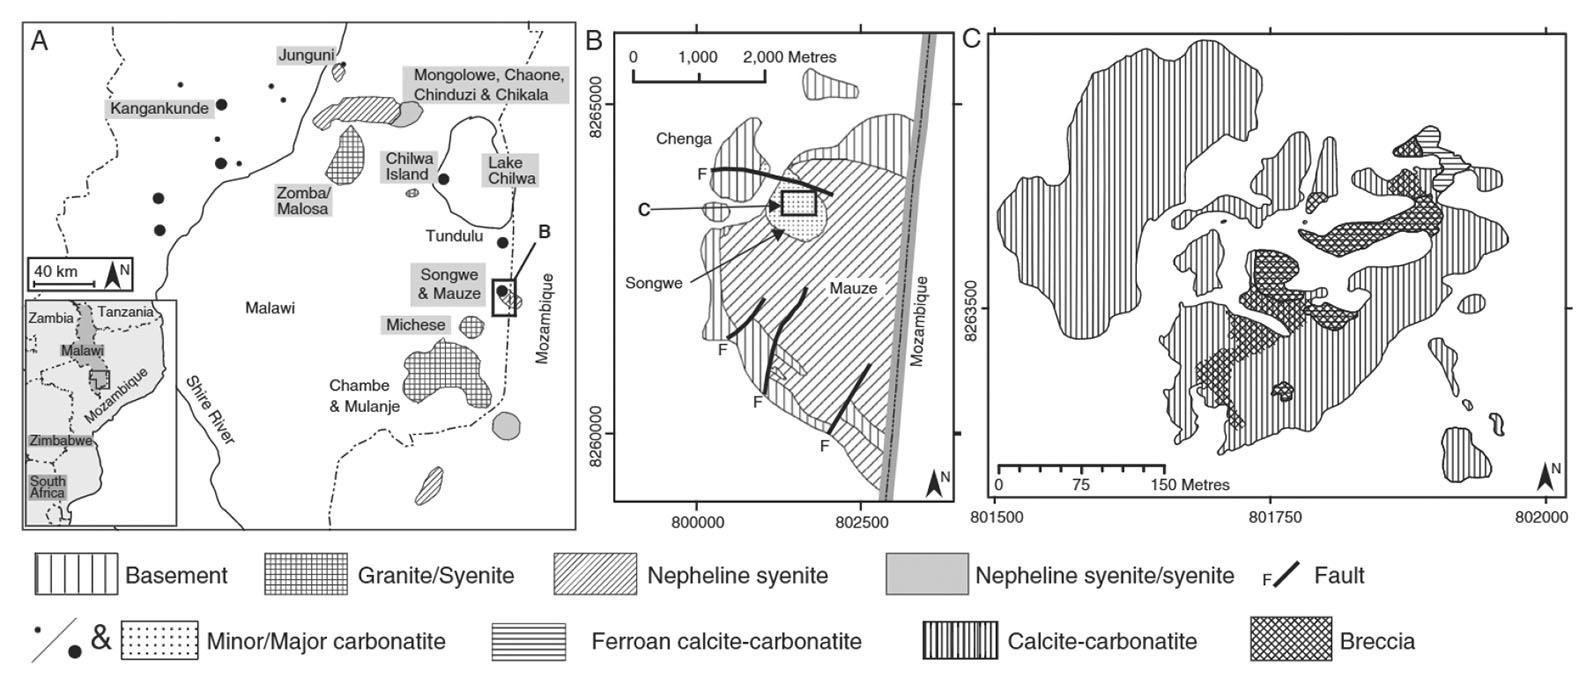
Songwe Hill is situated in Phalombe district in the South-eastern region of Malawi. On international borders, Malawi shares boundaries with Tanzania to the north, Zambia to the west and Mozambique surrounds the country from east to west. The study area of Songwe Hill is adjacent to Mozambique separated by the syenitic intrusion of Mauze Mountain (Figure 1a). In terms of regional geology, the area is underlain by crystalline rocks of Precambrian to lower Palaeozoic age referred to as the Malawi Basement Complex, which is intruded by alkaline intrusive bodies (Garson, Smith, 1965; British Geological Survey, 2009). The emplacement of these alkaline intrusions occurred during the Late Jurassic – Early Cretaceous Period, which affected an area approximately 300-400 km in diameter in the south of Malawi and in Mozambique. At various localities, the basement complex is overlain by a sequence of Permo-Carboniferous to lower Jurassic sedimentary rocks of the Karoo super-group and superficial Tertiary to recent Karoo sediments. The local geology of the study area is principally composed of carbonatite and fenite surrounded by a massive intrusion of syenite.
Carbonatite, which is the ore hosting rock, occurs in three categories namely: coarse-grained calcite carbonatite (sovite); fine-grained carbonatite (alvikite); and Fe-rich ferroan calcite carbonatite. Fenites form an aureole around the carbonatite intrusion. It is postulated that the carbonatite intrusion never reached the surface since the fenite is continuous with only rare carbonatite veinlets (Broom-Fendley, et al., 2017). In terms of the texture, the fenites are of a coarse-grained equigranular igneous texture, strongly suggesting an igneous protolith. Structurally, Songwe Hill lies within the active tectonic environment of the Malawi Rift System (MRS), which is part of the main East African Rift System (EARS). Thus, faulting and development of joints may not be an uncommon phenomenon but the structural disruptions at the site are not reflected on a macro scale, except for a mappable fault at the foot of the hill as shown in Figure 1b.
Witley et al.(2019) attempted to present subtle evidence of structural deformation, which they argued to be reflected in sharp lithological breaks across the area. They concluded that the lithological breaks that corresponded to the faults were interpreted from the ground magnetic fields. However, it must be admitted that the fault traces were considered as an approximation, given that the resolution of the magnetic image was low at the scale of the geological map. One exceptional phenomenal feature of interest is the in situ damage of the rock mass due to brecciation (Figure 1c) revealed from the geological and geotechnical logging of the diamond drill core.
Brecciation mechanism
Breccia (Bx) is a term commonly used for an enigmatic rock group that comprises a variety of discrete broken fragments of rocks, every so often angular and bound together by a fine grained matrix and occasionally vitreous matrix, which may or may not resemble the composition of rock fragments (Shukla, Sharma, 2018). Woodcock and Mort (2008) made an effort to classify breccias using a criterion that can easily be applied in the field. These rock masses can be identified in different geological settings mostly associated with
various ore types. In carbonatite complexes, breccia is a common structural feature. Shukla and Sharma (2018), Sibson (1986), and many other authors have discussed mechanisms of brecciation in different geological environments, including the volcanic setting. Among many mechanisms of brecciation, this study reveals two phenomena that can be attributed to be the occurrence of the breccia at the study site of Songwe Hill, namely: hydro-fracturing and tectonic forces along a pre-existing plane of weakness. The hydro-fracturing process for brecciation involves highpressure fluids. This hydrothermal process readily affects carbonaterich rocks. In this process, the pre-existing rock interacts with water-rich hydrothermal solutions that increase the fluid pressure within a fissure, and the effective pressure decreases leading to fracture propagation (see Figure 2a). Elliott et al. (2018) explain that the occurrence of breccias at several carbonatite complexes corroborates the explosive release of fluids and volatiles from an evolving magma underneath. For Songwe carbonatite, BroomFendley, et al. (2021) stress that based on the angular nature of the clasts and the comminuted groundmass, the breccia formed by in situ rapid volume expansion, most likely as a result of subsurface explosive release of volatiles from the proposed underlying carbonatite bodies. Thus, the explosive hydrothermal brecciation and the metasomatic action of hydrothermal fluids can indeed be considered to be responsible for the generation of the breccia. On the other hand, tectonic disturbances resulting from fault movements can also account for the brecciation as the area is located in a rifting setting with potentially high stresses acting along the weak plane causing rock comminution but the certainty of it is not fully verified at the study site. Accordingly, the brecciation associated with the fault system forms due to the grinding action of rock blocks along a plane of weakness.
Methods and model construction
For decades, most slope stability analyses have been performed using limit equilibrium methods (LEM). The underlying concept of the LEM is that the rock mass behaves as a rigid material and that the shear strength is mobilised at the same time along the entire failure surface (Brideau et al., 2009). Based on this assumption, LEM can only be adequate for analysing simple failure modes and small-scale analyses. However, demand for mineral resources has seen surface mining operations expanding to greater depths in order to meet the needs of growing industries. This trend requires modelling that covers complex conditions found in rock masses

like nonlinear stress-strain behaviour, anisotropy, and changes in geometry. Thus, the development of numerical codes over the last decades has revolutionised rock mass modelling, thereby superseding the traditional methods. Numerical modelling has now been described as a valuable tool to enhance the understanding of the response of rock masses to excavation (Hart, 2003). Currently, there are numerous methods; continuum, discontinuum, and hybrid continuum/discrete methods that have been developed in an effort to represent the characteristics and behaviour of rock masses. Regardless of the method selected based on the nature of the problem to be addressed, parameters like material properties, intact rock discontinuities, boundary conditions, hydrogeological regime, and permeability are considered in evaluating the stability of the excavations. In this study numerical method of continuum is applied in simulating the rock slope stability using finite element method (FEM) codes.
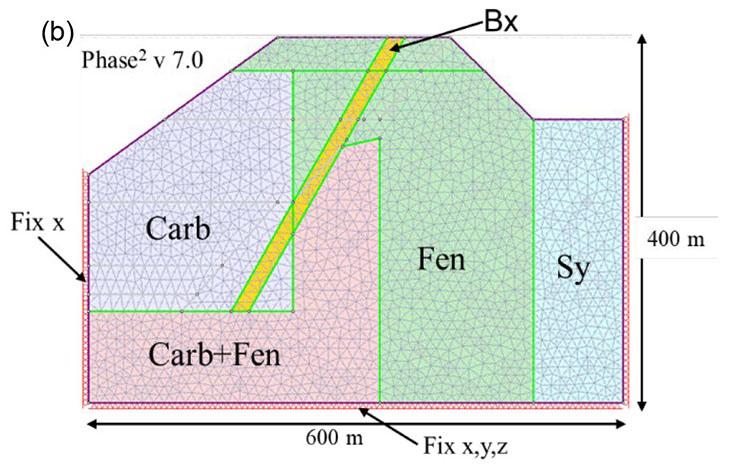
To carry out the analysis, conceptual models were built in Phase2 v 7.0. The dimensions of the model measured 600 m in length and 400 m vertical extent from the highest reduced level (RL) mimicking the hill. Two main conceptual cases were generated with respect to pit height. In the first scenario, shear strain behaviour on the pit-slope was investigated at the current planned depth of 250 m, which is the depth within the bounds of the proven ore reserve, hence the geological confidence is high. The second scenario is for the global slope height (GSH) of 300 m. At this depth, the geological confidence is relatively low since less than 10% of the drilled holes reached 300 m. In both cases, the analysis was conducted at different pilot overall slope angles (OSA) that could be practical in the design. Thus, OSA was varied from 45° to 40°. The excavation of the stack benches (dimension 15 m height and 7.5 m width) was carried out in three sequential stages as depicted in Figure 3.

Three cases were generated with respect to the conceptual extent of the brecciated rock section. In the first case, shear strain behaviour on the pit slope was investigated without including the brecciated section. The second scenario incorporates the 10 m brecciated rock section and the last case having a 20 m thickness of brecciation (Figure 4). According to the field survey, the 10 m brecciation thickness is considered the closer representation of the brecciated zone for the study site. The emplacement of the breccia is estimated to be dipping at ≥ 50° and as Broom-Fendley, et al. (2021) established, the breccia grades down into an underlying carbonatite body at great depth. To cater for uncertainties, the emplacement angle was varied for parametric analysis from 30° to 70° at an equal interval of 10°.
In carrying out the study, the material properties were obtained from uniaxial compressive strength (UCS) tests, triaxial compressive strength tests (TCS), and literature.

Mechanical properties of the rock units
*Based on empirical values (Katz et al., 2000; Croll, et al., 2014)
The material properties used in this simulation are given in Table 2
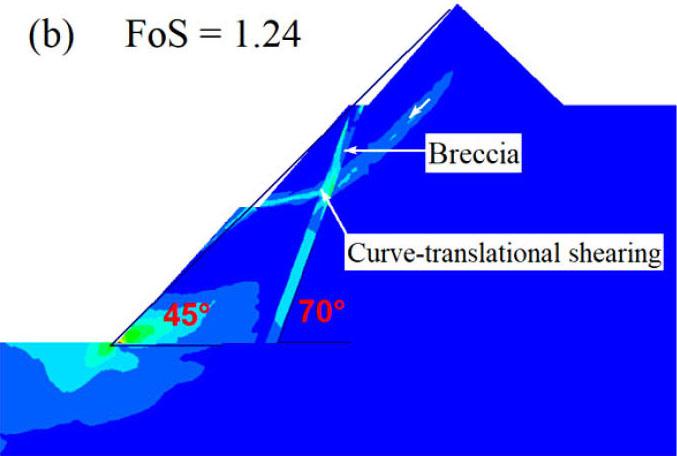
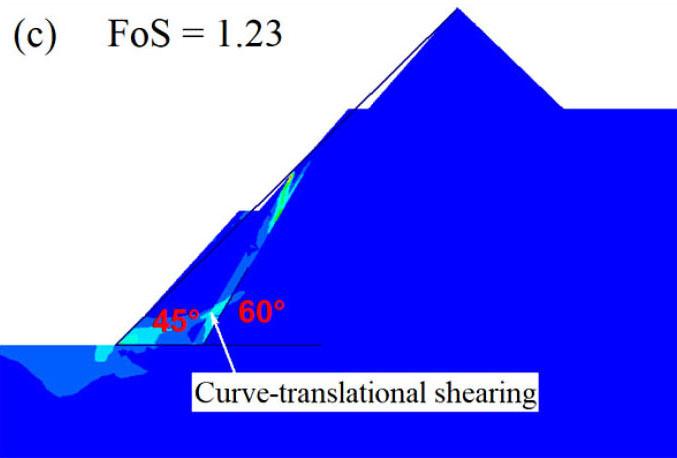
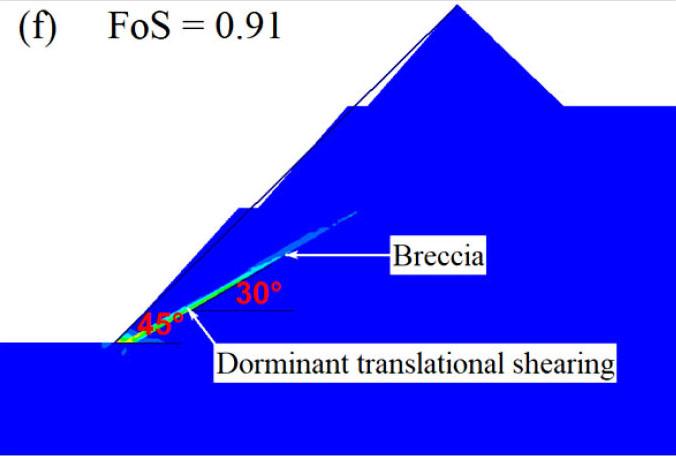
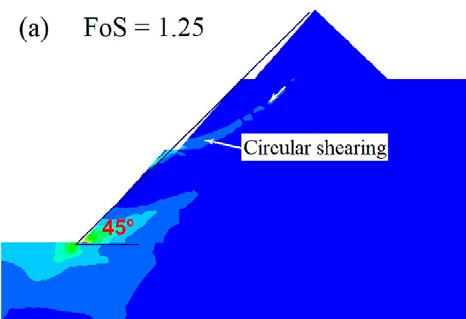
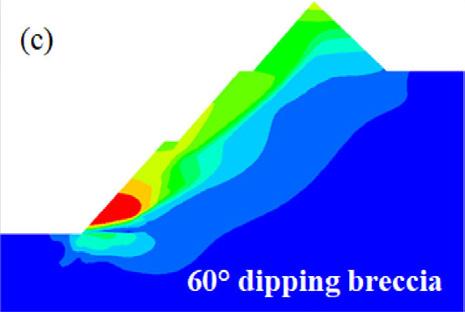
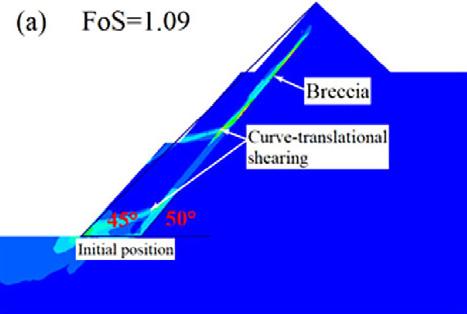
The principal objectives of the open pit slope stability analyses are: to investigate the pit slope stability conditions, probable failure mechanism, slope sensitivity or vulnerability, and to design optimum pit slope angles in terms of safety, reliability, and economic lucrativeness. Generally, stability of open pit slopes depends on geometry of slope, rock mass characteristics, and shear strength behaviour of the joints (Soren et al., 2014). In slope stability analysis, factor of safety (FoS) is used as an index to determine the stability conditions. The factor of safety is a ratio between shear strength and shear stress to determine the stability of excavated sections. The basic minimum requirement for stability assurance when assessing the performance of excavated sections is that FoS should be equal to 1, which is a state of plastic equilibrium. However, in mines, the minimum requirement is > 1. Generally, the benchmark value varies by region and mining guidelines enforced by different countries. After a compilation of data from numerous open pit mines (OPM), Adams (2015), Read and Stacey (2009) and Sullivan (2013) established that the minimum criterion for safety assurance in OPM is for FoS to be ≥ 1.2. In this work, since the results are based on a 2-D numerical modelling in an out of the plane mode, the benchmark FoS tolerable has been pegged at 1.3. To vividly comprehend the influence of brecciation, the research object of the qualitative analysis presented only covers the GSH of 300 m at a slope angle of 45°. On the other hand, the quantitative analysis caters for all the pit heights and slope angles. From Figure 5, one notices a significant change in the shear failure path prior to and after the inclusion of breccia, in which case there is a rotational/ circular and translational potential failure respectively. The circular
failure path prior to the inclusion of brecciated rock develops at inter-ramp level in the second excavation, and then the shearing strain concentrates at the slope toe.
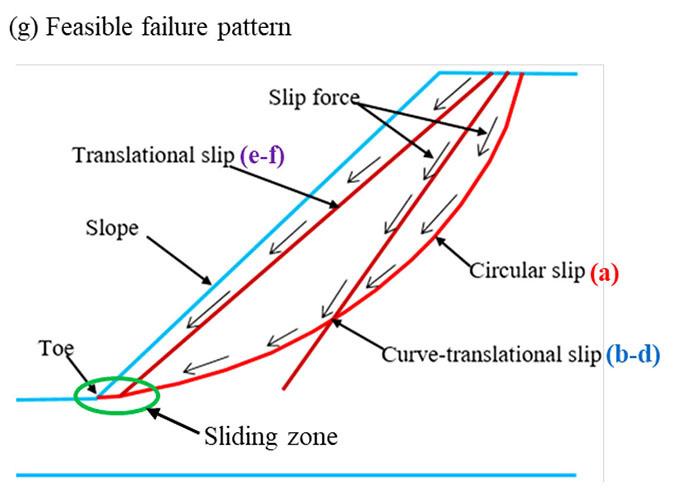
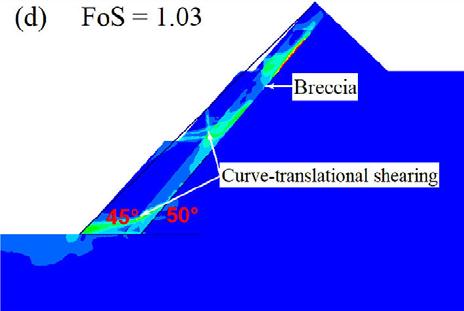
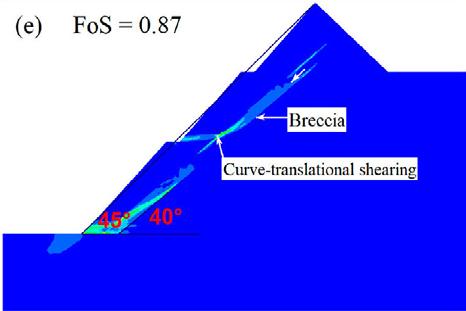
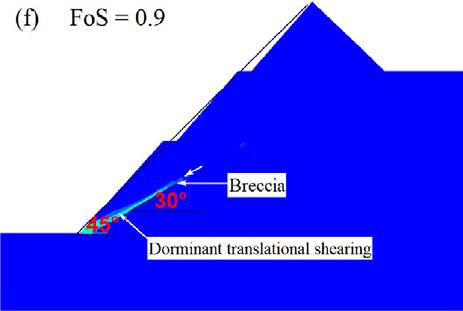
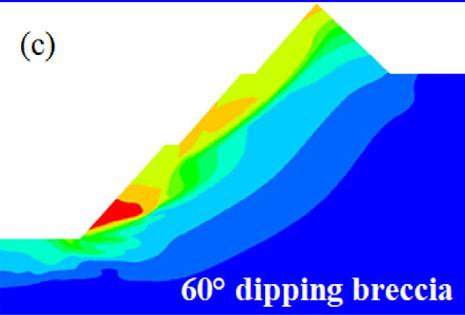
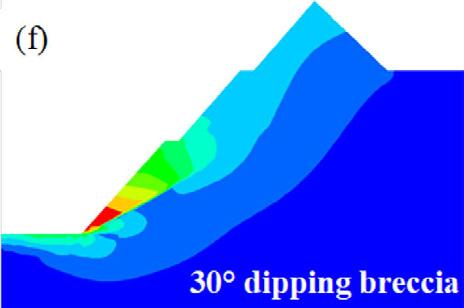
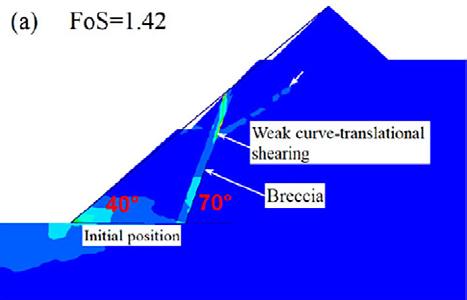
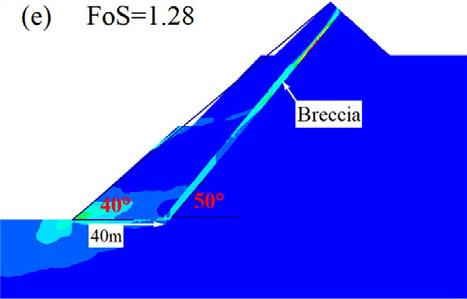
On the other hand, the translational failure path is well developed at gentle angles of emplacement of the breccia, especially at 40° and 30°. The performance of the slope at these angles is critically low since the overlying block is supplied with a failure plane characterised by low cohesion and friction resistance along the in situ damage section. At a relatively steep emplacement angle of the brecciated rock, that is, 50° and 60°, the failure plane is characterised by a combination of circular and translational shearing. That is, the circular shearing failure plane joins the translational shearing failure plane induced in the breccia. At a much steeper angle of say 70°, the failure path is almost identical to the condition prior to inclusion of brecciated rock, implying a negligible influence, which is reflected in the FoS being almost equal.
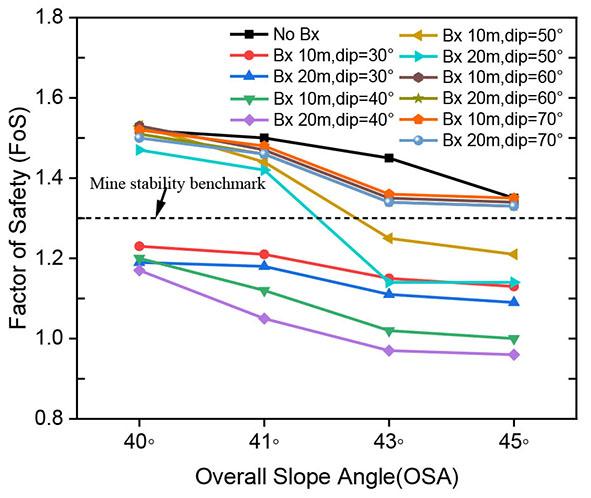
The emplacement of the breccia into the carbonatite complexes is of interest to understand how it would have a bearing on the stability of the pit wall. From the quantitative analysis results, regardless of the angle at which the breccia is orientated, its mere existence reduces the stability performance of the pit wall but as the dip angle of the breccia gets gentler, the impact becomes enormous. At the dip angles of 70°, 60° and, 50° the FoS slightly reduces at OSA of 40° and 41° with the 70° orientation having almost the same FoS value as prior to the inclusion of the brecciated rock section (see Figure 6). However, at steep slope angles, that is to say 43° and 45°, the stability performance of the pit-wall significantly reduces with the 50° orientation registering a sharper drop, and the FoS values fall


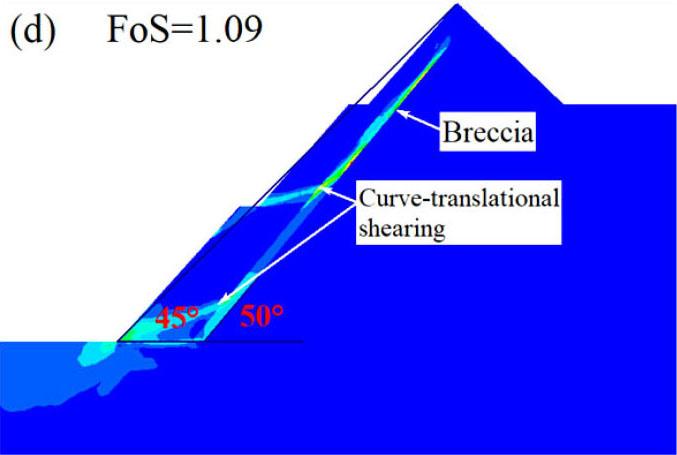
further below the threshold at all simulated pit heights. When the breccia is emplaced at gentler angles, i.e., 30° and 40°, the stability of the pit-wall falls below the benchmark value of mine stability at all slope angles (40°– 45°). Thus, to attain a good performance of the slope in this condition it would require safeguarding the slope toe against the breccia position by ensuring that there is an optimal buffer zone.
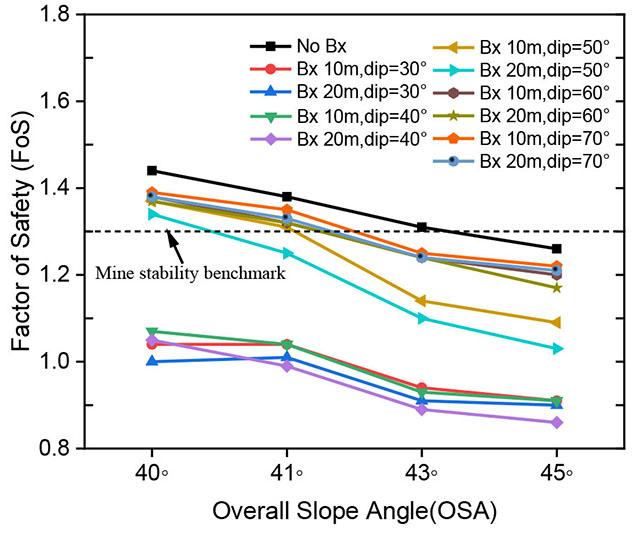
The thickness of the brecciated rock appears to have an equivocal influence. On a steep slope angle (45°), at breccia dipping angles of 60°, 70° and 30°, the thickness has a fair influence because the slope stability value reduces, though not quite prominent. However, at dip angles between 50° - 40°, the impact on the pit slope performance becomes significant (see Figure 7). This can be ascribed to the increased weak surface area within the translational failure plane trajectory, which adjoins the nascent circular shearing trajectory. However, on gentle slope angles, that is to say 40° and 41°, the impact of breccia is negligible at all dipping angles of the breccia as shown in Figure 7. We can thus deduce that thickness of the brecciated rock has a considerable impact at moderately gentle angles of the emplaced breccia with steep angles, in this case study at 43° and 45°, otherwise it would not have a significant influence on the stability performance of the appropriately optimised gentle slopes, that is, 41° for this study case.
Displacement pattern
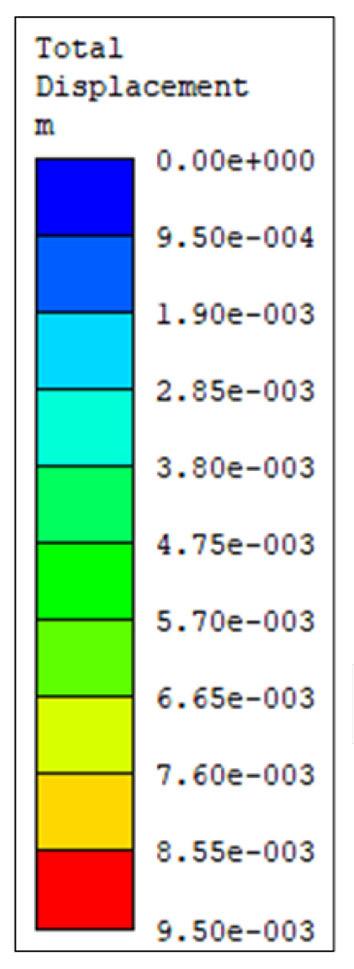
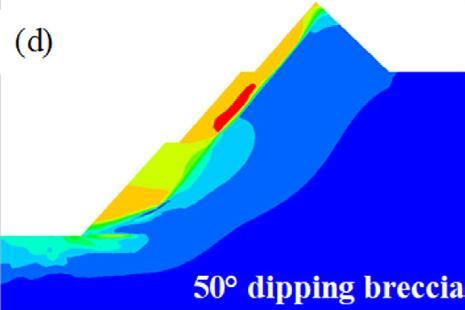
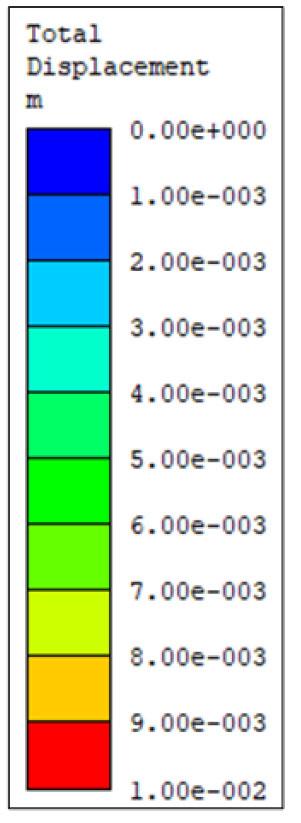
The study also assessed the influence of brecciation on pit wall displacement. In this case, the 45° OSA at 300 m was used as a research case study. The trend of total displacement is presented in Figure 8 and Figure 9.




It can be seen from the Figures 8 and 9 that the orientation of the breccia has an apparent control on the movement of the geological materials on the slopes. Prior to the introduction of the breccia, the peak displacement is in the last excavation phase close to the toe of the slope where the shearing stress and strain is concentrated. When the breccia is introduced, the peak displacement at steep dipping angle of breccia locates in the upper section of the slope where the brecciated section is emplaced. This phenomenon can be identified at 50°, and 70° but in the case of 60° the peak displacement is down to the slope toe due to minimal impact of the breccia at an intersection with the slope face. At gentle dip angles of the breccia where translational shearing strain is predominant, the peak displacement is at the slope toe with an evident trajectory provided by the brecciated zone. With respect to brecciation extent, the change in the thickness of the breccia to 20 m (Figure 9) slightly changes the impact area but the section of the peak displacement remains the same with 10 m breccia thickness (Figure 8). From the analysis, it can be deduced that the displacement trajectory of materials on the pit walls is controlled by the orientation of the brecciated section in the rock mass rather than the thickness.
As a parametric analysis, the study evaluated the impact of the position of the breccia and the pit wall with reference to the slope toe. In this regard, the position of the breccia was changed from the initial position by a factor of 10 from 10 m to 50 m. The initial positions of the breccia with respect to the angle of orientation were 10 m at the most gentle dip angle and 90 m at steeper dip angles, respectively.
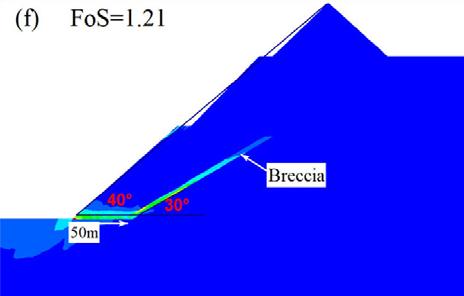
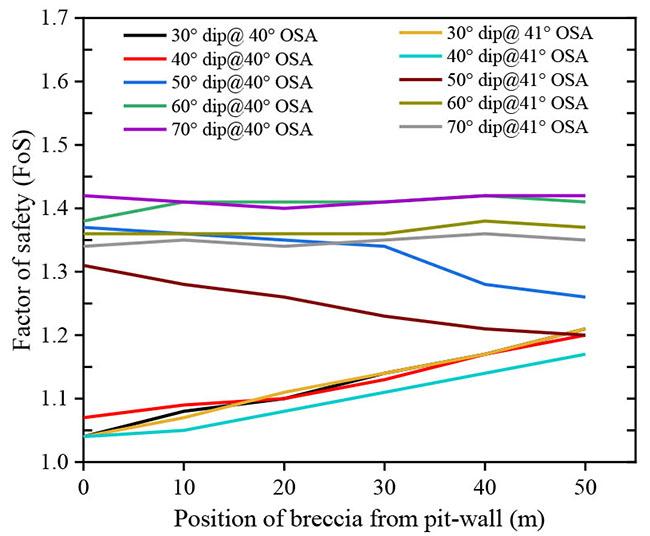
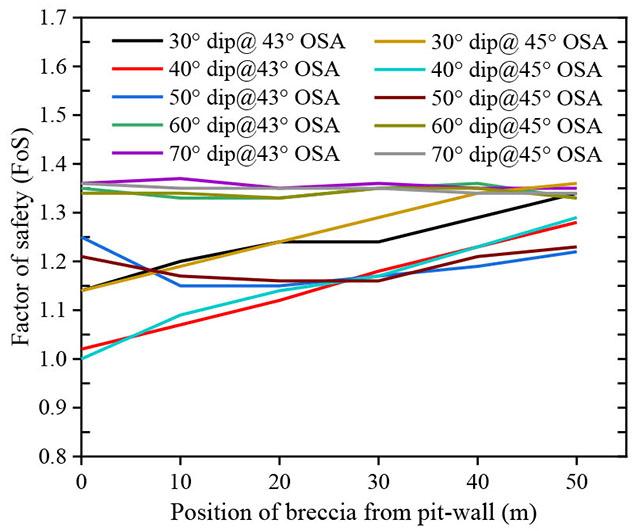
For qualitative analysis, four scenarios were identified when the position of the breccia was changed. The first scenario is when the dip of the breccia is at an angle of 30° as presented in Figure 10. As would be anticipated, as the emplacement position of breccia is increased away from the pit wall, the stability performance of the slope increases. At an increase of 10 m, the FoS was observed to be 1.08 and at 50 m increase the FoS improved to 1.21 representing a 12% change in FoS. Basically, moving the dipping brecciated section minimises the effect of translational shearing strain within the breccia because the buffer zone between slope toe and breccia increases. This trend was similar to the 40° dip angle of the breccia. On the contrary, in the second case where the dip angle of breccia is 50°, the stability trend is dissimilar.
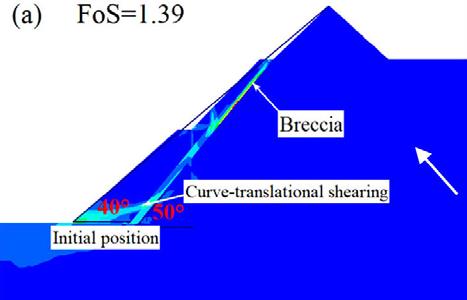
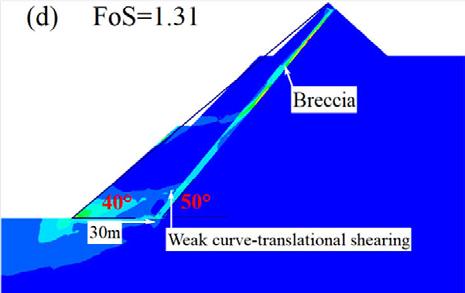
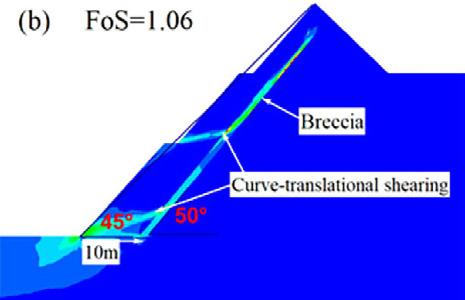
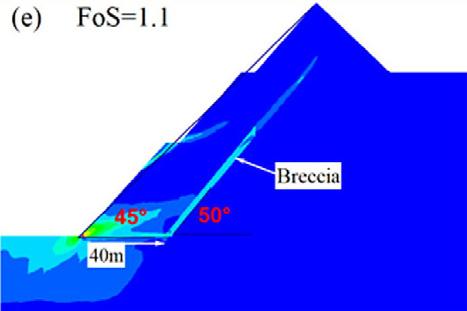
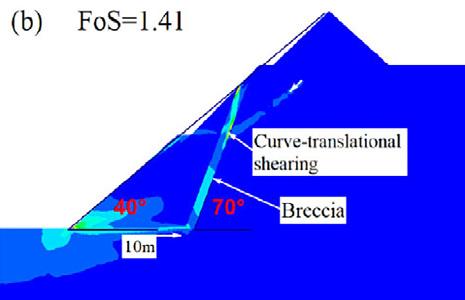
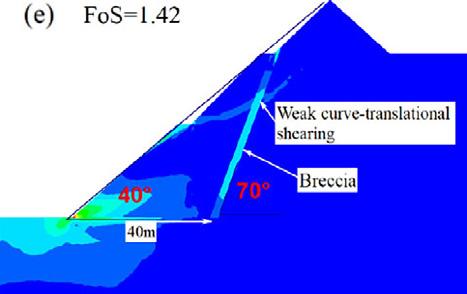
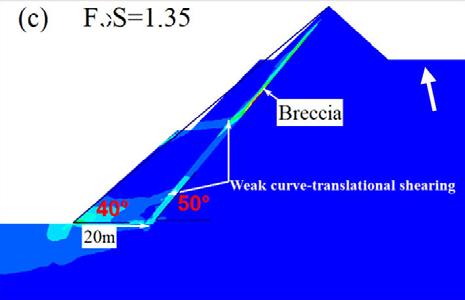
As shown in Figure 11, when the position of the breccia is moved 10 m away from the slope, the performance of the slope begins to decline and at 50 m increase, the stability further declines. The FoS after a 10 m increase is 1.36 from the initial 1.39, and at 50 m the FoS reduced to 1.26. The reason for this trend is that the breccia wholly locates immediately behind the pit wall, thereby creating an extended plane of translational shear failure plane, which weakly joins up with the circular shear failure plane. This was observed only for gentle slope angles of 40° and 41°. However, at relatively steep slope angles, i.e., 43° and 45°, the pit wall stability performance improved as the position of breccia increases away from the pit wall.
In this third scenario, it can be observed that when the slope angle is steepened, the breccia locates closer to the pit wall. This provides the conditions for the curve-translational potential slip as the circular shearing failure path combines with the translational shearing failure path. When the breccia is moved further away from



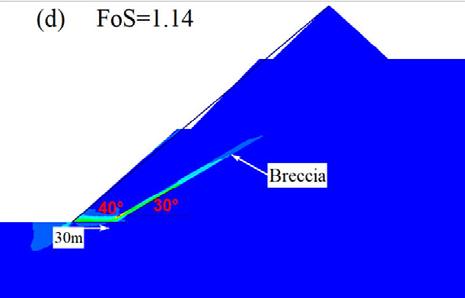


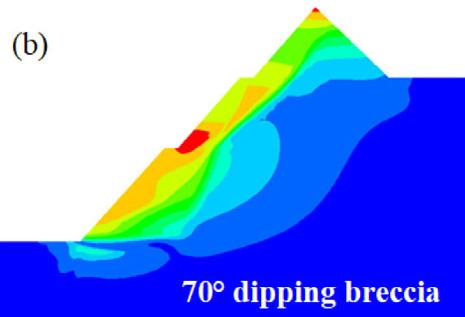
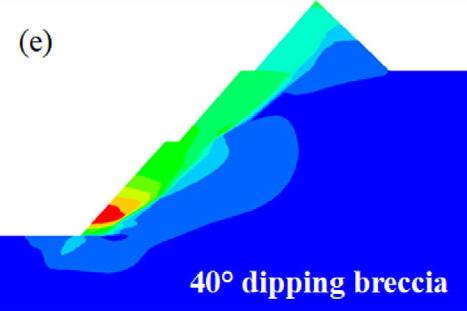


the initial position, especially at ≥ 30 m, the circular shearing failure path and the translational shearing failure path become disjointed, as shown in Figure 12.
This phenomenon reduces the combined circular and translational shearing impact in the pit wall, which implies a discrete influence of the shear paths and the stability performance of the slope is enhanced.
In the fourth scenario, which is shown in Figure 13, it can be noted that a steep dip angle of the breccia at 70° barely has an effect on the stability of the pit wall when the position of the breccia is


changed. Quantitative results presented as a summary in Figure 14 show a similar pattern at 60° dip angle of the breccia. In both cases, the safety factor remained almost the same. Thus, it can be deduced that in steeply dipping breccia, the translational shear impact within the damaged rock section is minimal and also at the designed slope angle part of the breccia is truncated.
In situ stress regimes and brecciation Rock masses are inherently inhomogeneous and geological features such as breccias can greatly change the stress field, which can have






a bearing on the stability of the excavation. To comprehend the impact of the interactions between the stress regimes and breccia, simulations were undertaken at different stress ratios. The analyses involved scenarios of high horizontal and vertical stress regimes. The research case studies for analyses were selected at slope angles of 40° and 45° with the dip of the breccia at 50° at a GSH of 300 m. The results of high horizontal stress ratio are presented in Figure 15 and Figure 16. It would be anticipated that high horizontal stress could lower the performance of the pit wall as the induced stress gets redistributed to the excavated section. However, the existence of the breccia close to the slope appears to increase the performance of the slope. As shown in Figure 15 and Figure 16, stress magnitudes


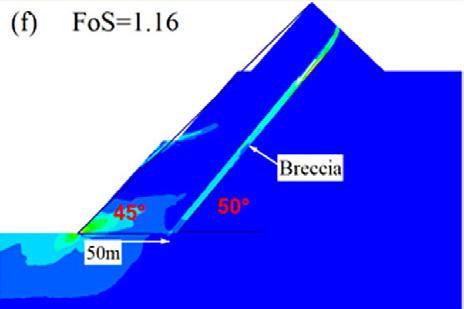
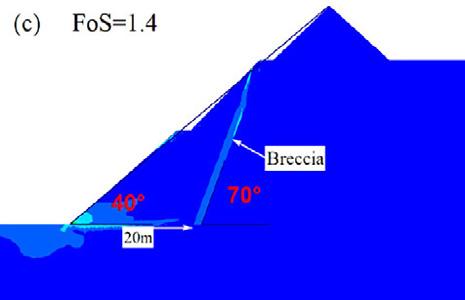

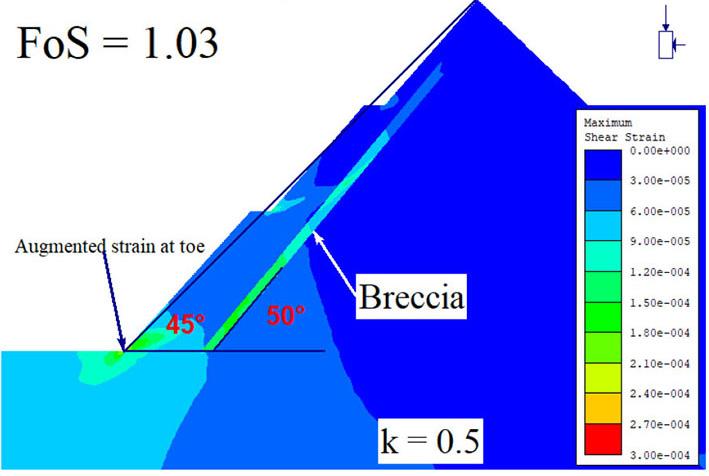
tend to be greatly dissipated, and stress orientations rotate as much as the dip angle of the breccia on crossing it. The changing of the direction of stress is manifested in the shear strain failure path along the breccia. At a stress ratio of k=1, the shear strain is concentrated at the toe of the slope and there is a weak adjoining of circular and transformational shear path. This combination evidently lowers the stability performance of the pit slope. However, when the vertical stress is reduced as horizontal stress increases, the horizontal stress gets redistributed and changes its orientation and aligns with the breccia dip. Thus, the breccia acts as a buffer to the slope and the shear strain at the slope toe is dissipated rendering the slope performance enhanced.


14—Summary of stability conditions of the pit wall with respect to the position of the breccia
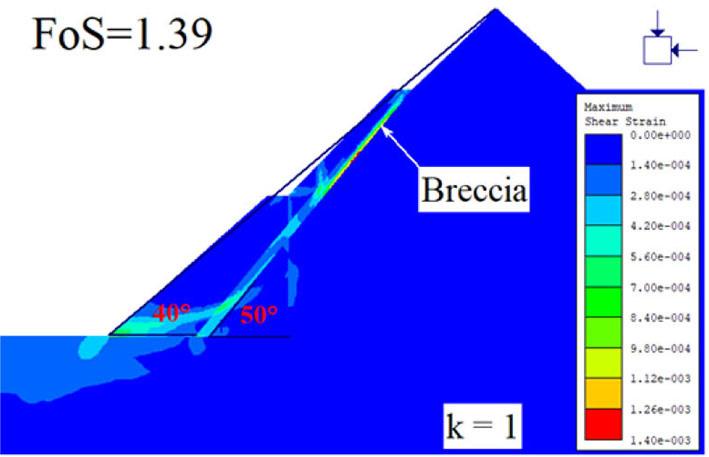


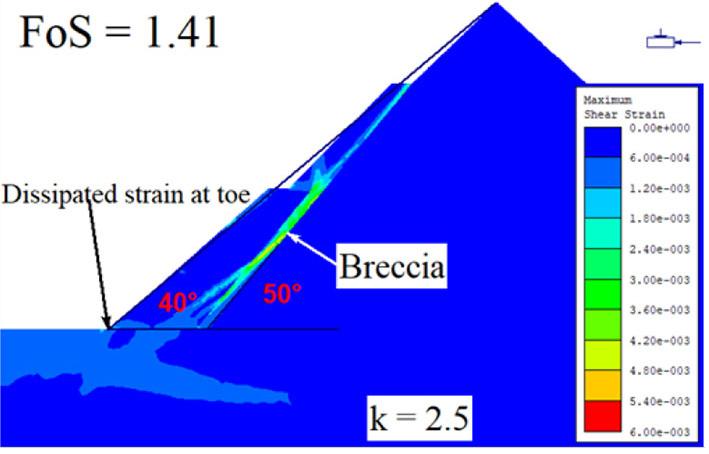


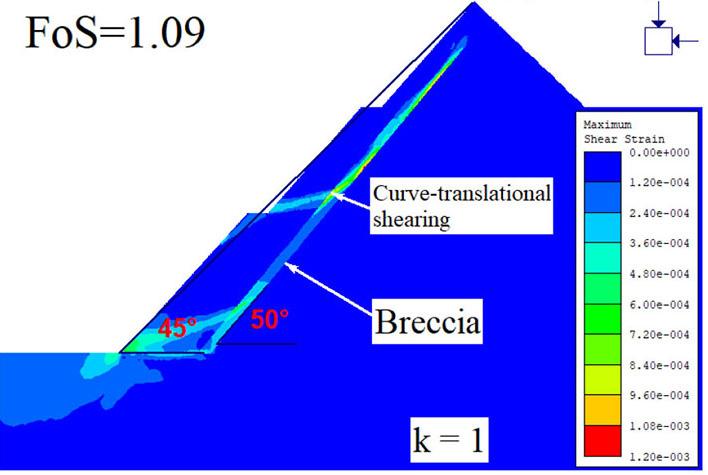
On the contrary, a high vertical stress regime slightly reduces the slope stability performance as shown in Figure 16. The FoS at a gentle slope angle of 40° reduced from 1.39 to 1.38 and at a steep angle of 45° the FoS decreased from 1.09 to 1.03. However, it must be noted that the mechanisms leading to low stability performance of the pit slopes is different at gentle and steep angles. On gentle slopes, it can be observed that the mechanism involves adjoining of the circular and translational shear failure paths, which causes potential curve-translational failure. On the other hand, at steep slope angles, the mechanism does not involve adjoining of circular and translational shearing failure path but rather distinct translational failure path and the intensification of shear strain at the toe of the pit slope. The concentration of the strain at the toe basically minimises the bearing capacity of the toe to the overlying burden, hence reduced stability performance. Although, the African average regional stress is determined to be at k = 1.5 as presented in the work of (Stacey, Wesseloo, 1998), the regional tectonic stresses may vary from one area to another depending on structural setting. Thus, the results of k = 0.5 are significant to anticipate this phenomenon in normal faulting predominated areas.
Countermeasures
In general, it is noted that the existence of the breccia poses a threat to the stability of the pit slope and an intervention is necessary to counter its impact. A range of innovative and effective methods of rock reinforcement and artificial support have been widely used in civil engineering and underground mining applications but hardly in open pit mines (Martin, 1987). The stabilisation of slopes in mining presents a distinct range of issues and challenges from those in civil engineering. Read and Stacey (2009) articulate that in mining, the economics and practicality of artificial support are affected by the larger volumes of rock to be supported. Generally, the length and height of slopes in mining are often much greater, and the service life of artificial support is often short, especially where a number of different cutbacks are to be undertaken. Experience from different projects (Martin, 1987) has demonstrated that slopes approximately 100 m high were the maximum that could be artificially supported with 30 m long cable bolts but reported subsequent failure of a large number of anchors due to tension. Beyond the 100 m height, failure occurs behind the supported volume, creating larger, deeper seated masses, which are more difficult to control (Read, Stacey, 2009). From this background,

in large open pits, for global wall reinforcement to attain stable slopes with aggressive wall angles could be challenging, if not unachievable.
Thus, from a series of analyses executed and presented in a summarised graph in Figure 14, a pattern of failure with respect to the slope toe was observed and an approach is suggested to deal with the breccia in slope design. The proposal is based on the relationship of FoS, excavation depth, and the position of the in situ damaged rock. In this proposition, it is recommended that for OPM design in brecciated rock masses, the ratio of at least 1:5 between the breccia distance from slope toe of the pit limit and pit depth should be adopted to counter the impact of the breccia. For instance, at the pit depth of 100 m, a distance of 20 m between the slope toe and breccia should be left as a buffer, while at 250 m, the pit limit should be designed such that the slope toe is 50 m from the breccia and at 300 m pit depth the slope toe should be at 60 m.
If the brecciated unit is within or close to the pit limit, a deliberate effort must be made to mine out or truncate the breccia because it has the capability to cause instability when there is a load above it. The ultimate intention is to increase the resisting forces along the translational shear plane generated within the damaged rock section. Furthermore, the traditional approach of making the slope gentle could be a more pragmatic remediation that could be applied in the event of the shallow angle emplaced breccia in the rock mass. Based on this case study, the stable performance of the pit slopes at the GSH of 300 m would be assured at 38° and 36° OSA for a breccia emplaced in the pit wall at 40° and 30°, respectively. The intervention obviously implies an increase in the stripping ratio for the mine, but it can prove a necessary step if undesirable risks, which could render operations utterly uneconomical, were to be sidestepped.
Conclusion
In this study, the stability conditions and deformation behaviour of the geological units on the pit slopes were evaluated by considering the existence of breccia. This was achieved by numerical methods carried out with a finite element code using Phase2 v 7.0 software. The analyses were performed in elasto-plastic state with a MohrCoulomb constitutive model and failure criterion. The analysis shows that the competency of the carbonatites can permit the overall slope designs to be developed at steep angles, 45º - 50° at shallow depth ≤ 250 m, but caution has to be taken at greater depth
and when weak rock sections due to brecciation are considered. Basically, as observed, the existence of breccia in carbonatite complexes has the capability to reduce the stability performance of the excavated pit wall and the enormity of the impact increases at the gentle dip emplacement angle in close proximity to the slope toe, hence, slope angle optimisation could aid in finding a poise between safety and mining economic benefits. In the case of the study area, the OSA of 41° is recommended as an optimal design at a GSH of 300 m. Regarding the breccia, the ratio of 1:5 between the breccia distance from slope toe of the pit limit and pit depth is advocated to counter the impact of breccia and if breccia is within or close to the pit limit, a deliberate effort must be made to mine out or truncate it. However, this conservative design could be adjusted to a flexible design in the course of operations as more geotechnical and geological data regarding the breccia is collected. Furthermore, the traditional approach of making the slope gentler could be a more pragmatic remediation that could be applied in the event of the gentle dip angle of emplaced breccia in the rock mass.
Conflict of interest
The authors declare no conflict of interest regarding the publication of this paper.
Acknowledgement
The authors express their sincere gratitude to Mkango Resources Company for providing the data for the study to materialise.
References
Adams, B.M. 2015. Slope Stability Acceptance Criteria for Opencast Mine Design. New Zealand: Golder Associates (NZ) Limited. Atkinson, B.K. 1987. Fracture mechanics of rock. London: Academic Press.
Bachmann, D., Bouissou, S., Chemenda, A. 2004. Influence of weathering and pre-existing large scale fractures on gravitational slope failure: insights from 3-D physical modelling. Natural Hazards and Earth System Sciences, vol. 4, pp. 711–717.
Brideau, M.-A., Yan, M., Stead, D. 2009. The role of tectonic damage and brittle rock fracture in the development of large rock slope failures. Geomorphology, vol. 103, pp. 30–49. doi:10.1016/j.geomorph.2008.04.010
British Geological Survey. 2009. Malawi Potential of Malawi Zomba: Malawi Government.
Broom-Fendley, S., Brady, A.E., Horstwood, M.S., Woolley, A.R., Mtegha, J., Wall, F., Gunn, G. 2017. Geology, geoche mistry and geoch ronology of the Songwe Hill carbonatite, Malawi. Journal of African Earth Sciences, pp. 11–23.
Broom-Fendley, S., Elliott, H.A., Beard, C.D., Wall, F., Armitage, P.E., Brady, A.E., Dawes, W. 2021. Enrichment of heavy REE and Th in carbonatite-derived fenite breccia. Geological Magazine, pp. 2025–2041. doi:https://doi.org/10.1017/S0016756821000601
Bye, A.R., Bell, F.G. 2001. Stability assessment and slope design at Sandsloot open pit, South Africa. International Journal of Rock Mechanics & Mining Sciences, vol. 38, pp. 449–466. doi:10.1016/S1365-1609(01)00014-4
Croll, R., Swinden, S., Hall, M., Brown, C., Beer, G., Scheepers, J., Trusler, G.E. 2014. NI 43-101 Pre-feasibility Report. Johannesburg, South Africa: MSA Group (Pty) Ltd.
Elliott, H.A., Wall, F., Chakhmouradian, A.R., Siegfried, P.R., Dahlgren, S., Weatherley, S., Deady, E. 2018. Fenites associated with carbonatite complexes: A review. Ore Geology Reviews, pp. 38–59. doi:https://doi.org/10.1016/j.oregeorev.2017.12.003
Garson, M.S., Smith, C.W. 1965. Carbonatite and Agglomeratic Vents in the Western Shire Valley. Zomba: Geological Survey Department.
Goodenough, K.M., Deady, E.A., Beard, C.D., Broom-Fendley, S., Elliott, H.A., Van den Berg, F., Öztürk, H. 2021. Carbonatites and Alkaline Igneous Rocks in Post-Collisional Settings: Storehouses of Rare Earth Elements. Journal of Earth Science, pp. 1–27. doi:https://doi.org/10.1007/s12583-021-1500-5
Hart, R. 2003. Enhancing rock stress understanding through numerical analysis. International Journal of Rock Mechanics and Mining Sciences, vol. 40, pp. 1089–1097. doi:10.1016/S1365-1609(03)00116-3
Katz, O., Reches, Z., Roegiers, J.C. 2000. Evaluation of mechanical rock properties using a Schmidt Hammer. International Journal of rock Mechanics and Mining sciences, vol. 37, no. 4, pp. 723–728.
Martin, D.C. 1987. Application of Rock Reinforcement and Artificial Support in Surface Mines. 6th ISRM Congress. Montreal, Canada: ISRM.
Moses, D., Shimada, H., Sasaoka, T., Hamanaka, A., Dintwe, T.K., Wahyudi, S. 2020. Rock Slope Stability Analysis by Using Integrated Approach. World Journal of Engineering and Technology, vol. 8, pp. 405–428. doi:https://doi.org/10.4236/ wjet.2020.83031
Qian, Z.G., Li, A.J., Lyamin , A.V., Wang, C.C. 2017. Parametric studies of disturbed rock slope stability based on finite element limit analysis methods. Computers and Geotechnics, vol. 81, pp. 155–166. doi:10.1016/j.compgeo.2016.08.012
Read, J., Stacey, P. 2009. Guidelines for open pit slope design Australia: SCIRO Publishing.
Severin, J.M. 2017. Impact of Faults and Fault Damage in Large Open Pit Slopes. University of British Columbia: Doctor Thesis, 1-168.
Shukla, M.K., Sharma, A. 2018. A brief review on breccia: it's contrasting origin and diagnostic signatures. Solid Earth Sciences, vol. 3, pp. 50–59. doi:10.1016/j.sesci.2018.03.001
Sibson, R.H. 1986. Brecciation processes in fault zones: Inferences from earthquake rupturing. PAGEOPH, vol. 124, pp. 159–175. doi:https://doi.org/10.1007/BF00875724
Simandl, G.J., Paradis, S. 2018. Carbonatites: Related Ore Deposits, Resources, Footprint, and Exploration Methods. Applied Earth Science, vol. 127, no. 4, pp. 123–152. doi:10.1080/25726838.201 8.1516935
Soren, K., Budi, G., \Sen, P. 2014. Stability Analysis of Open Pit Slope by Finite Difference. International Journal of Research in Engineering and Technology, pp. 326–334.
Stacey, T. R., Wesseloo, J. 1998. In situ stresses in mining areas in South Africa. The South African Institute of Mining and Metallurgy, pp. 365–368.
Stead, D., Wolter, A. 2015. A critical review of rock slope failure mechanisms: The importance of structural geology. Journal of Structural Geology, vol. 74, pp. 1-23. doi:10.1016/j.jsg.2015.02.002
Sullivan, T. D. 2013. Pit Slope Design and Risk – A View of the Current State of the Art. The South African Institute of Mining and Metallurgy, pp. 51–80.
Witley, J.C., Swinden, S., Trusler, G., Dempers, N. 2019. Songwe Hill Rare Earth Elements (REE) Project, Phalombe District, Malawi. South Africa: MSA Group.
Woodcock, N.H., Mort, K. 2008. Classification of fault breccias and related fault rocks. Geol. Mag, vol. 145, no. 3, pp. 435–440. doi:10.1017/S0016756808004883
Woolley, A.R., Church, A.A. 2005. Extrusive Carbonatites: A brief review. Lithos, vol. 85, pp. 1–14. doi:10.1016/j.lithos.2005.03.018
Xu, C., Wang, L., Song, W., Wu, M. 2015. Carbonatites in China: A Review for Genesis and Mineralization. Geoscience Frontiers, vol. 1, pp. 105–114. doi:10.1016/j.gsf.2010.09.001
Zheng, H., Li, T., Shen, J., Xu, C., Sun, H., Lu, Q. 2018. The effects of blast damage zone thickness on rock slope stability. Engineering Geology, pp. 1–25. u
13 October 2025 Technical Workshops
14-15 October 2025 Conference
16 October 2025 Technical Visits
Venue: Glenburn Lodge and Spa, Muldersdrift
(1-hour drive from O.R. Tambo International Airport, Johannesburg, South Africa)

ECSA and SACNASP Validated CPD ActivityCredits = 0.1 per hour attended


Ore heterogeneity and metallurgical complexity continue to rise, while sustainability occupies an ever-prominent role. Geometallurgy offers a refined, multidisciplinary pathway to improve the value of ore deposits.
Future-Ready Geometallurgy examines strategies to generate trustworthy data through the steady application of machine learning, novel sensors, digital twins, and Industry 4.0 technologies in mining. Reliance on dependable data and innovative tools empowers the industry to make more timely and discerning decisions for mine planning and metallurgical plant optimisation.
Following the success of past SAIMM Geometallurgy conferences, the third conference in this series provides a platform to explore the latest progress in geometallurgy and to celebrate the success of its integration into the mining value chain.
• Sampling and sensor-based core logging
• Practical tools and methodologies for ore characterisation and testing
• Standardised methods for reporting to generate trusted data
• Geostatistics, data integration, smart workflows, and modelling
• Incorporation of predictive mining, processing, and environmental models into resource modelling
• Project and operational geometallurgy case studies
• 17 June 2025 - Submission of short abstracts
• 29 July 2025 - Submission of extended abstracts for peer review
• 13 October 2025 – Technical workshops
• 14-15 October 2025 - Conference
• 16 October 2025 - Technical visits
FOR FURTHER INFORMATION CONTACT: Gugu Charlie, Conferences and Events Coordinator E-mail: gugu@saimm.co.za | Tel: +27 11


Geomet Advisor & Business Development Manager, Datarock, Australia
Wendy Ware
Chief Metallurgist, Transmin Metallurgical Consultants, United Kingdom
Adam Johnston
Prospective authors are invited to submit short abstracts of not more than 500 words to: Conferences and Events Co-ordinator, Gugu Charlie, e-mail: gugu@saimm.co.za Authors of accepted abstracts will be required to submit extended abstracts for peer review and publication in the conference proceedings. Following the conference, full papers can be submitted to the journal for peer review and publication in an SAIMM Journal Special Issue.

Affiliation:
1Hacettepe University, Mining Engineering Department, Ankara, Türkiye
2Ruhr University-Bochum , Applied Geology Department, Bochum, Germany
3Adiyaman University, Civil Engineering Department, Adiyaman, Türkiye
4Ankara University, Geological Engineering Department, Ankara, Türkiye
Correspondence to: S. Kahraman
Email: sairkahraman@yahoo.com
Dates:
Received: 24 Mar. 2024
Revised: 19 May 2025
Accepted: 16 July 2025
Published: August 2025
How to cite:
Kahraman, S., Alber, M., Gunaydin, O., Fener, M. 2025. Evaluating the triaxial strength of Misis fault breccia using artifical neural networks analysis. Journal of the Southern African Institute of Mining and Metallurgy, vol. 125, no. 8, pp. 413–420
DOI ID:
https://doi.org/10.17159/2411-9717/3337/2025
ORCiD:
S. Kahraman
http://orcid.org/0000-0001-7903-143X
M. Alber
http://orcid.org/0000-0003-2488-7817
M. Fener
http://orcid.org/0000-0002-0464-5194
O. Gunaydin
http://orcid.org/0000-0001-7559-5684
by S. Kahraman1, M. Alber2, O. Gunaydin3, M. Fener4
Abstract
Falling into the weak rocks category, fault breccias have extremely poor engineering properties. These pebbles typically cause issues with slopes, subterranean construction, and building projects. Professionals will benefit from the creation of some predictive models for fault breccia triaxial strength, as smooth specimen preparation is typically challenging and timeconsuming. The purpose of this study is to develop some predictive models for the differential stress (Δσ) based on physical and textural properties. Artificial neural networks were used to analyse data related to Misis fault breccia. Initially, models with moderate (noticeable, but not good) correlation coefficients were created using multiple regression analysis. After that, the regression models and three distinct artificial neuron network models were contrasted. Regression models are weaker and less trustworthy than artificial neuron network models, as demonstrated by this comparison. Pointed out is the practicality and ease of use of the artificial neuron network model with S-wave velocity and volumetric block proportion. Ultimately, it can be concluded that artificial neuron networks analysis provides a reliable indirect method for predicting the differential stress of Misis fault breccia.
Keywords Misis fault breccia, triaxial strength, ultrasonic velocity, artificial neural networks
Introduction
Non-linear multivariable problems are typical in the geosciences. Regression analysis and conventional expert systems can occasionally fail to provide satisfactory solutions for such issues. Artificial neural networks (ANNs) are therefore frequently employed in the geosciences (Yuanyou et al., 1997; Yang, Zhang, 1998; Singh et al., 2001; Kahraman et al., 2005; Sonmez et al., 2006; Zorlu et al., 2008; Gunaydin et al., 2010, Dagdelenler et al., Marais, Aldrich, 2011, Sayadi et al., 2013; Khoshjavan et al., 2013; Basarir et al., Kahraman, 2016, etc.). Numerous geoscience studies have used ANNs, and the results have shown that ANN models perform well when solving multivariable problems. Typically, fault breccias cause issues in applications involving rock engineering since they belong to a weak rock group. In order to solve the issues that arise when carrying out projects, it is crucial to understand or estimate the geomechanical properties of fault breccias. To prepare smooth specimens for standard tests, on the other hand, requires a lot of time, effort, and money, and fault breccias are typically not suitable for this. Deriving a few predictive models for the geomechanical characteristics of fault breccias will be beneficial because of this. Many researchers (Chester, Logan, 1986; Medley, 1994; Medley, Goodman 1994; Lindquist, Goodman, 1994; Ehrbar, Pfenniger, 1999; Goodman, Ahlgren, 2000; Buergi et al., 1999; Medley, 2001; Medley, 2002; Habimana et al., 2002; Laws et al., 2003; Sonmez et al., 2004; Sonmez et al., 2006; Coli, 2011; Afifipour, Moaref, 2014; Mahdevari, Maarefvand, 2017; Lu et al., 2019; Festa et al., 2019; Avsar, 2020; Caselle et al., 2024; Gayathridevi, Ray, 2025) have studied the characteristics of geologically complex rocks such as melanges and fault rocks. On the Ahauser fault breccia (Germany), Kahraman and Alber (2006; 2008) as well as Alber and Kahraman (2009) conducted the first study on the geomechanical properties of fault breccias. Later on, Kahraman et al. (2008) and Slatalla et al. (2010) assessed the geomechanical characteristics of the breccia from the Misis fault. Kahraman et al. (2010) examined how well the Cerchar abrasivity index worked in predicting the uniaxial compressive strength (UCS) and Young’s modulus € of the Misis fault breccia.
Kahraman et al. (2008), investigated the triaxial strength of Misis fault breccia and developed an estimation equation for the differential stress (Δσ) using multiple regression analysis. However, the
correlation coefficient for this relationship was weak. In this work, artificial neural networks (ANNs) were utilised to analyse the triaxial strength of Misis fault breccia with the goal of creating more robust models. Fifty specimens were added to this study in addition to the eighteen from the previous investigation.
For the experimental investigations, large blocks were taken from the Misis fault breccia (Ceyhan-Adana, Türkiye). The Misis fault's location map is displayed in Figure 1. Dolomitic limestone blocks embedded in a finely grained matrix of red claystone containing clay rich in iron make up the Misis fault breccia. From the large blocks in the lab, 68 test samples in total were cored. The test samples have a 61 mm diameter and a 2-2.5 length-to-diameter ratio (Figure 2).
Determination of textural properties
Each core sample's circumferential surface was scanned with the DMT CoreScan II to produce digital images. Using image analysis software, the volumetric block proportion (VBP), average block diameter (ABD), aspect ratio, and roundness of the blocks were calculated from the scanned images of the cores.
Estimation of volumetric block proportion
The volume of block partition (VBP) is calculated by dividing the volume of blocks or grains by the volume of rock mass. A few researchers have explained the VBP prediction methods and the uncertainties in predicting three-dimensional block size distributions from one- or two-dimensional measurements (Medley, Goodman, 1994; Goodman, Ahlgren, 2000; Medley, 1997; Medley, 2002; Haneberg, 2004). Blocks from the matrix are typically very difficult to separate, even though sieve analysis is the best technique. This is why it is common practice to estimate VBP using one- or


two-dimensional methods like scanlines, geological mapping, and image analysis, or drill core/block intersection lengths. The circumferential surface scan images of the cores were processed and used to estimate VBP in this study. Figure 3 displays a sample's raw and processed images.
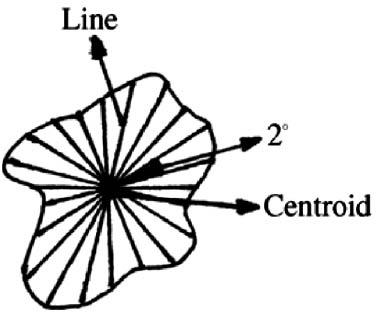
The length of the line that passes through each block's 2° centroid was used to estimate the two-dimensional diameter, which was assumed to be the same as the three-dimensional diameter (Figure 4). ABD values were then calculated by averaging these lines.
Aspect ratio of blocks
The length of the major and minor axes of an ellipse with an area equal to that of the block is called the aspect ratio, which characterises the elongation of blocks. Every block in the sample had its aspect ratio measured, and the average value was determined.
Form factor is another way to define roundness. For a perfect circle, roundness equals 1. The roundness decreases as the shape moves away from circularity. Each block's roundness value in the sample was found, and the average value was computed. This is the roundness formula.

where R is roundness, A is the area of shape (mm2), and p is the perimeter of shape (mm).
Table 1
Descriptive statistics of textural properties
Table 2
Descriptive statistics of test results
Experimental studies
Prior to conducting triaxial compressive strength tests, each core sample underwent a density test and an ultrasonic test.
Density test
Density was calculated using samples of smooth core. Averaging multiple calliper readings allowed for the calculation of the specimen volume. A balance that could weigh the specimens precisely to within 0 points of the sample mass was used to determine their mass. The specimen mass to volume ratio was used to calculate the density values.
Ultrasonic test
To test the samples' elastic qualities, the USG 40 ultrasonic generator, made in Pirna, Germany, by Geotron GmbH, was employed. For the measurements, a 250 kHz ultrasonic transducer was employed. The ultrasonic tests yielded P- and S-wave velocities.
Triaxial compressive strength test
A stiff testing machine was used to perform the triaxial compression tests on smooth core specimens. The tests used confining pressures ranging from 1 MPa to 10 MPa. The triaxial cell of the HoekFranklin type has a capacity of about 70 MPa, while the load frame has a capacity of 4600 kN. Tests involved constant observation of the axial load and axial displacement. Two extensometers are used to measure axial deformation. Using an MTS Teststar IIm controller, the servo-hydraulics are controlled at high speed and in closed loop to operate the testing system. It is possible to use computed signals, such as stress or strain, or variable feedback signals, such as force or displacement, as control modes with this closed-loop control. However, this feature of the system has not been used in this study. The sample is loaded in axial strain control at a rate of 10-5 mm/ mm/s beyond peak strength after being simultaneously loaded laterally and axially to the selected confining stress level.
Table 1 provides the textural characteristics of the tested samples along with statistical analyses. The values of VBP vary from 3.05 per cent to 80.93 per cent. The values of ABD vary from 2.15 per cent to 10.22 per cent. Blocks have aspect ratios ranging from 1.54 to 2.22. Blocks range in roundness from 0.53 to 0.85. Table 2 provides descriptive statistics of the physico-mechanical test results. The differential stress readings fall between 26.40 and 131.20 MPa. The density values are between 2.35 and 2.64 g/cm3. The values of P-wave velocity span from 3:71 km/s to 5:88 km/s. The range of values for S-wave velocity is 1.69 km/s to 3.26 km/s.
The triaxial compressive test results were used to plot the Mohr stress circles. As illustrated in Figure 5, the stress circles are not uniform, and the failure envelope derived from these circles will not be trustworthy. Normally, as the confining stress increases (σ3), the vertical stress (σ1) increases steadily, and the Mohr circles shift to the right. Such unconformities frequently occur in geologically complex materials such as fault breccias. The inconsistent trend is expected, given the varying textural characteristics of the samples. In geologically complex materials such as breccias, the differential stress (Δσ = σ1-σ3) at failure can be a useful tool for determining the triple strength. This is why the failure envelope was not used in the analysis; instead, the Δσ was used.
The intercorrelations between the test results and the textural characteristics are displayed in a correlation matrix. There are no significant correlations between the independent parameters and the dependent parameter (Δσ), as Table 3 illustrates. This suggests that there is more than one parameter that influences the Δσ. According to a prior investigation (Kahraman et al., 2008), the strength range of block and matrix values is wide. This could be the cause of the absence of associations. The varying textures of the samples could be another factor. Therefore, in order to derive strong correlations, multivariable analysis is required.
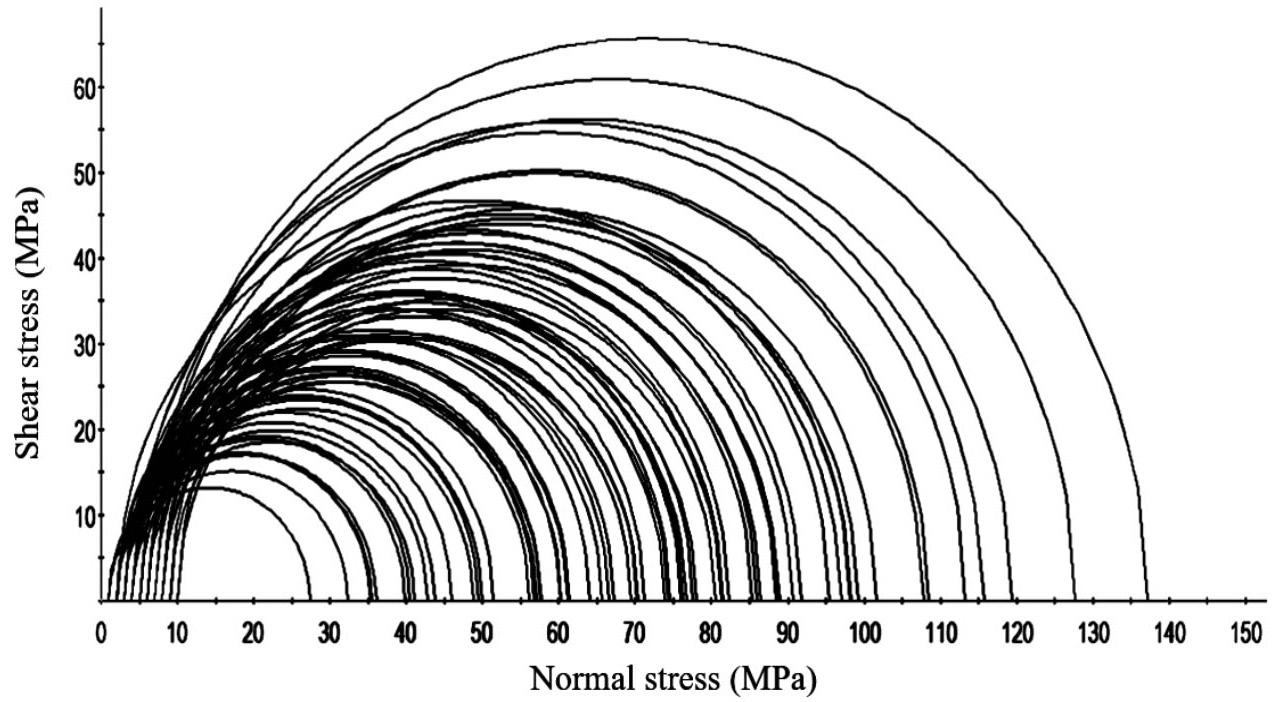
Alternative prediction models for the Δσ were examined using stepwise regression analysis. The software was used to create the following four models.


where, Δσ is differential stress (MPa), Vs is S-wave velocity (km/s), VBP is volumetric block proportion (%), ρ is density (g/cm3), and ABD is average block diameter (mm).
The first model (Equation 2) has a weak correlation coefficient. The other models (Equations 3-5) have moderate correlation coefficients.
Artificial neural networks (ANNs) are extremely simplified models of the human brain's nervous system. The basic processing components of these models are interconnected assemblies of neurons arranged in layers. As can be seen in Figure 5, every neuron

in one layer is connected to the neurons in the layer below it, and so forth. Wij stands for ‘weights,’ and it describes the connection between the ith and jth layers. The potent tool for estimation and classification is provided by these connections between the layers. In order to minimise a predetermined cost function, these connections are optimised during the learning phase. The activation of a neuron is determined by its activation function, which is shown in Figure 6 as (f), and the weighted sum of its inputs is calculated to determine the neuron's output.
Multi layered perception (MLP) neural networks are the kind utilised in this investigation. In Figure 7, an MLP neural network is displayed. An input layer, one or more hidden layers, and an output layer make up MLP networks. There are many processing units (neurons) in each layer, and each unit is fully connected to units in the layer below it via weighted connections. The MLP uses nonlinear mapping functions to convert i inputs into k outputs.

Table 4
Feed-forward back propagation
Feed-forward back propagation
Some investigators (Kumar, 2005; Altun et al., 2007) demonstrated that when data is highly skewed, ANN models do not always perform well in predictions. In order to minimise skewness in the data, a transformation such as power transformation can be applied prior to neural network analysis. The degree of symmetry of the normal distribution is gauged by its skewness. A symmetric distribution (one that is not skewed) is indicated by a skewness coefficient of 0. When a distribution is positively skew, it is skewed to the right; when it is negatively skew, it is skewed to the left. As demonstrated by Tables 1 and 2, the parameters' skewness values are typically low. Consequently, there is no need to transform or handle the data.
For the ANNs analysis, data from 68 rock samples were used. The network was trained, and several ANN models were developed using the data of the first group of 48. Ten of the data points were used for testing, and the other ten were used for validation.
Three regression models (Equations 3-5) mentioned in the aforementioned exhibit moderate correlation coefficient values. In order to evaluate these regression models against ANNs models, three distinct types of neural network structures were implemented in the MATLAB environment for the purpose of predicting the Δσ. The structures of the ANN models, i.e., the quantity of input layer neurons, hidden layer neurons, and output layer neurons are provided in Table 4. Table 4 also displays the training parameters and the algorithm used during the training phase.
A neural network with the structure 2-2-1 (Model I in Table 4) is used in the first trial. Using this structure, a model is built that illustrates the nonlinear relationship between the independent variables and the Δσ value. The model I is [6]

A neural network is built in the second trial using the structure 3-5-1 (Model II in Table 4). The model II is

The third trial involves the construction of a neural network with the structure 4-6-1 (Model III in Table 4). The model III is

where, Δσ is differential stress (MPa), Vs is S-wave velocity (km/s), VBP is volumetric block proportion (%), ρ is density (g/cm3), and ABD is average block diameter (mm).
Tanjant sigmoid
Tanjant sigmoid
Tanjant sigmoid
Learning rate: Adaptive gradient: 7.36 Epochs: 18
Learning rate: Adaptive gradient: 227 Epochs: 18
Learning rate: Adaptive gradient: 42.4 Epochs: 11
LevenbergMarquardt backpropagation algorithm (trainlm)
LevenbergMarquardt backpropagation algorithm (trainlm)
LevenbergMarquardt backpropagation algorithm (trainlm)
Scatter plots indicating measured and predicted values can be used to display how well the derived models estimate values. When comparing estimated and observed data, a plotted data set should ideally have its points distributed around the 1:1 diagonal straight line. An accurate estimate is shown by a point that is on the line. Indicating non-linearity in one or more parameters, a systematic departure from this line can, for instance, show that larger errors typically go hand in hand with larger estimations. Plots of estimated Δσ versus observed Δσ are shown in Figures 8-10 for Models I, II, and III, respectively. The plots exhibit uniform point scattering around the diagonal line, indicating the plausibility of the models.
The correlation coefficients and standard error of estimates were used to compare the models produced by regression analysis and ANNs. Table 5 illustrates the moderate correlation coefficients of the regression models (Equations 3-5). Corresponding ANN models, however, have high correlation coefficients (Equations 6-8). Table 5 also provides the standard error of estimate values. ANN models
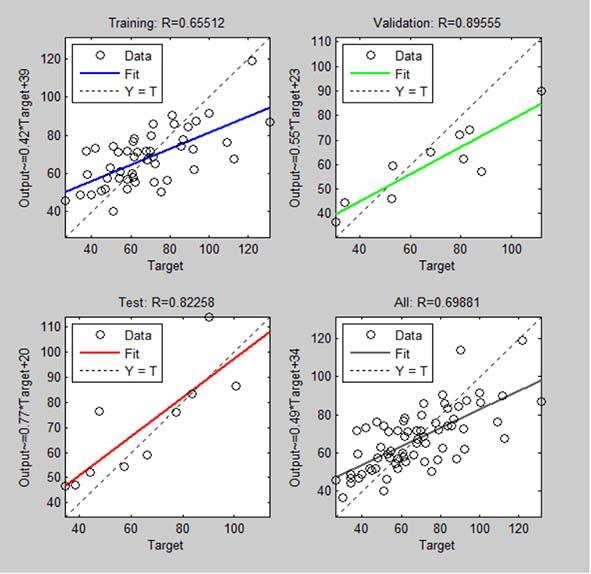
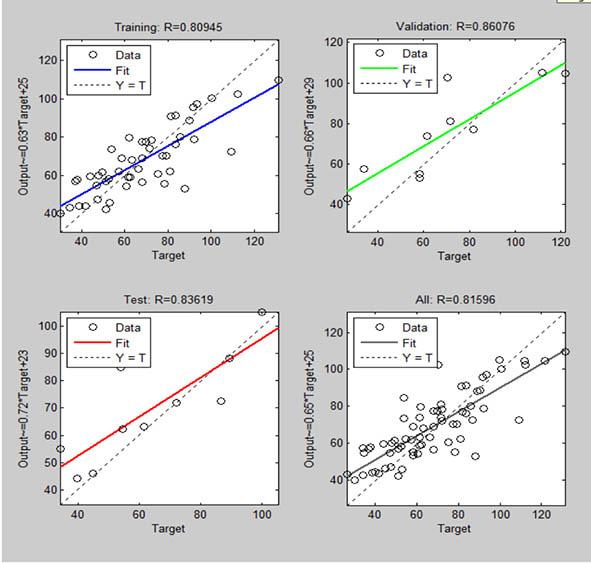

exhibit lower standard error of estimates values in comparison to regression models. Comparison results reveal that ANNs models are strong and reliable for predicting the Δσ of fault breccia compared to the regression models.
The correlations between Δσ and breccia characteristics such as S-wave velocity, VBP and average aspect ratio of blocks are examined, but these are weak, as shown in Table 3. The fact that the strengths of both the matrix and the blocks have wide ranges and the specimens have different textures is likely the cause of weak correlations. It is clear that the triaxial strength of the Misis fault breccia does not depend on one rock property. Multiple regression analyses were performed in anticipation of developing strong
Table 5
Correlation coefficients and standard error of estimates for the models produced from ANN and regression analysis
Model type Model no Coefficient of correlation (r) Standard error of estimate
models. However, the models derived from the multiple regression analysis show moderate correlation coefficients. An ANN analysis was then performed using the independent variables included in the regression models with moderate correlation coefficients. The developed ANN models were shown to be strong and reliable. The three ANNs models can be used to estimate the Δσ of the Misis fault breccia or similar breccias. Model I (Equation 6) is practical and easy to use because it has only two independent variables (S-wave velocity and VBP). Measuring S-wave speed is very simple. Determining VBP is quite difficult and time-consuming. Alternatively, VBP can be easily estimated from density as there is a good correlation between VBP and density, as shown in Table 3. The correlation equation is:
where, VBP is volumetric block proportion (%) and ρ is density (g/cm3).
The predictability of the Δσ of the Misis fault breccia from physical and structural properties was examined using regression and ANN analysis. It was seen that there were no significant correlations between Δσ and independent variables. Some models with moderate correlation coefficients were derived through multiple regression analysis. Three different ANN models were constructed and compared with the regression models. Comparing the ANNs models with the regression models revealed that the ANNs models are stronger and more reliable than the regression models. The ANNs model (Equation 6) including S-wave velocity and VBP is practical and easy to use. A final note is that the Δσ of the Misis fault breccia can be reliably predicted from indirect methods using ANN analysis.
This study was supported by the Alexander von Humboldt Foundation.
References
Afifipour, M., Moarefvand, P. 2014. Mechanical behavior of bimrocks having high rock block proportion. International Journal of Rock Mechanics and Mining Sciences, vol. 65, pp. 40–48. https://doi.org/10.1016/j.ijrmms.2013.11.008 Alber, M., Kahraman, S. 2009. Predicting the uniaxial compressive strength and elastic modulus of a fault breccia from texture coefficient. Rock Mechanics and Rock Engineering, vol. 42, pp. 117–127. https://doi.org/10.1007/s00603-008-0167-x
Altun, H., Bilgil, A., Fidan, B.C. 2007. Treatment of skewed multidimensional training data to facilitate the task of engineering neural models. Expert System with Applications, vol. 33, pp. 978–983. https://doi.org/10.1016/j.eswa.2006.07.010
Avsar, E. 2020. Contribution of fractal dimension theory into the uniaxial compressive strength prediction of a volcanic welded bimrock. Bull. Eng. Geol. Environ. 2020, vol. 79, pp. 3605–3619. https://doi.org/10.1007/s10064-020-01778-y
Basarir, H., Tutluoglu, L., Karpuz, C. 2014. Penetration rate prediction for diamond bit drilling by adaptive neuro-fuzzy inference system and multiple regressions. Engineering Geology, vol. 173, pp. 1–9. https://doi.org/10.1016/j.enggeo.2014.02.006
Buergi, C., Parriaux, A., Franciosi, G., Rey, J.-Ph. 1999. Cataclastic rocks in underground structures – terminology and impact on the feasibility of projects (initial results). Engineering Geology, vol. 51, pp. 225–235. https://doi.org/10.1016/S0013-7952(97)00079-3
Caselle, C., Comina, C., Festa, A. Bonetto, S. 2024. Electrical resistivity tomography for the evaluation of Areal Block Proportion (ABP) in bimunits: Modelling and preliminary field validation. Eng. Geol. vol. 333, p. 107488. https://doi.org/10.1016/j.enggeo.2024.107488
Chester, F.M., Logan, J.M. 1986. Implications for mechanical properties of brittle faults from observations of the Punchbowl Fault Zone, California. Pure and Applied Geophysics, vol. 124, pp. 79–106. https://doi.org/10.1007/BF00875720
Coli, N., Berry, P., Boldini, D. 2011. In situ non-conventional shear tests for the mechanical characterisation of a bimrock. International Journal of Rock Mechanics and Mining Sciences, vol. 48, pp. 95–102. https://doi.org/10.1016/j.ijrmms.2010.09.012
Dagdelenler, G., Sezer, E.A., Gokceoglu, C. 2011. Some non-linear models to predict the weathering degrees of a granitic rock from physical and mechanical parameters. Expert Systems with Application, vol. 38, pp. 7476–7485. https://doi.org/10.1016/j.eswa.2010.12.076
Ehrbar, H., Pfenniger, I. 1999. Umsetzung der Geologie in technische Massnahmen im Tavetscher Zwischenmassive Nord. In Vorerkundung und Prognose der Basistunnels am Gotthard und am Lötschberg. Rotterdam, Balkema, pp. 381-394.
Festa, A., Pini, G.A., Ogata, K., Dilek, Y. 2019. Diagnostic features and field-criteria in recognition of tectonic, sedimentary and diapiric mélanges in orogenic belts and exhumed subductionaccretion complexes. Gondwana Res. 2019, vol. 74, pp. 11–34. https://doi.org/10.1016/j.gr.2019.01.003
Gayathridevi, K., Ray, A. 2025. Mechanical Characterization of Soil–Rock Mixture Under Varying Block Parameters, Matrix Properties and Matrix Water Content Using Destructive and Non-Destructive Testing. Indian Geotech J (June 2025) vol. 55, no. 3, pp. 1779–1794. https://doi.org/10.1007/s40098-024-01054-w
Goodman, R.E., Ahlgren, C.S. 2000. Evaluating safety of concrete gravity dam on weak rock: Scott Dam. Journal of Geotechnical and Geoenvironmental Engineering, vol. 126, no. 5, pp. 429–442. https://doi.org/10.1061/(ASCE)1090-0241(2000)126:5(429)
Gunaydin, O., Gokoglu, A., Fener, M. 2010. Prediction of artificial soil’s unconfined compression strength test using statistical
analyses and artificial neural networks. Advances in Engineering Software, vol. 41, pp. 1115–1123. https://doi.org/10.3390/app11041949
Habimana, J., Labiouse, V., Descoeudres, F. 2002. Geomechanical characterisation of cataclastic rocks: experience from the Cleuson–Dixence project. International Journal of Rock Mechanics and Mining Sciences, vol. 39, no. 6, pp. 677-93. https://doi.org/10.1016/S1365-1609(02)00042-4
Haneberg, W.C. 2004. Simulation of 3-D block populations to characterize outcrop sampling bias in block-in-matrix rocks (bimrocks). Felsbau-Rock and Soil Engineering, vol. 22, pp. 19–26.
Kahraman, S., Altun, H., Tezekici, B.S., Fener, M. 2005. Sawability prediction of carbonate rocks from shear strength parameters using artificial neural networks. International Journal of Rock Mechanics and Mining Science, vol. 43, no. 1, pp. 157–164. https://doi.org/10.1016/j.ijrmms.2005.04.007
Kahraman, S., Alber, M. 2006. Estimating the unconfined compressive strength and elastic modulus of a fault breccia mixture of weak rocks and strong matrix, International Journal of Rock Mechanics and Mining Sciences, vol. 43, pp. 1277-1287. https://doi.org/10.1016/j.ijrmms.2006.03.017
Kahraman, S., Alber, M. 2008. Triaxial strength of a fault breccia of weak rocks in a strong matrix. Bulletin of Engineering Geology and the Environment, vol. 67, pp. 435–441. https://doi.org/10.1007/s10064-008-0152-3
Kahraman, S., Alber, M., Fener, M., Gunaydin, O. 2008. Evaluating the geomechanical properties of Misis Fault Breccia (Turkey). International Journal of Rock Mechanics and Mining Sciences, vol. 45, pp. 1469–1479. https://doi.org/10.1016/j.ijrmms.2008.02.010
Kahraman, S., Alber, M., Fener, M., Gunaydin, O. 2010. The usability of Cerchar abrasivity index for the prediction of UCS and E of Misis Fault Breccia: Regression and artificial neural networks analysis. Expert Systems with Applications, vol. 37, pp. 8750–8756. https://doi.org/10.1016/j.eswa.2010.06.039
Kahraman, S., Alber, M., Fener, M., Gunaydin, O. 2015. An assessment on the indirect determination of the volumetric block proportion of Misis fault breccia (Adana, Turkey). Bull Eng Geol Environ, vol. 74, pp. 899–907. https://doi.org/10.1007/ s10064-014-0666-9
Kahraman, S. 2016. The prediction of penetration rate for percussive drills from indirect tests using artificial neural networks. J. South. Afr. Inst. Min. Metall. vol. 116, pp. 793–800. https://www.saimm.co.za/Journal/v116n08p793.pdf
Khoshjavan, S., Khoshjavan, R., Rezai, B. 2013. Evaluation of the effect of coal chemical properties on the Hardgrove Grindability Index (HGI) of coal using artificial neural networks. J. South. Afr. Inst. Min. Metall. vol. 113, pp. 505–510. https://www.saimm.co.za/Journal/v113n06p505.pdf
Kumar, U.A. 2005. Comparison of neural networks and regression analysis: A new insight. Expert System with Applications, vol. 29, pp. 424-430. https://doi.org/10.1016/j.eswa.2005.04.034
Laws, S., Eberhardt, E., Loew, S., Descoeudres, F. 2003. Geomechanical properties of shear zones in the Eastern Aar Massif, Switzerland and their implication on tunnelling. Rock Mechanics and Rock Engineering, vol. 36 , no. 4, pp. 271–303. https://doi.org/10.1007/s00603-003-0050-8
Lindquist, E.S., Goodman, R.E. 1994. Strength and deformation properties of a physical model melange. In: Nelson PP, Laubach SE, editors. In Proceedings of the 1st North American Rock Mechanics Symposium. Rotterdam: Balkema, pp. 843–50. https://onepetro.org/ARMANARMS/proceedings-abstract/ NARMS94/All-ARMS94/ARMA- 1994-0843/121172
Lu, Y.C., Tien, Y.M., Juang, C.H., Lin, J.S. 2019. Uncertainty of volume fraction in bimrock using the scan-line method and its application in the estimation of deformability parameters. Bull. Eng. Geol. Environ. 2019, vol. 79, pp. 1651–1668. https://doi.org/10.1007/s10064-019-01635-7
Mahdevari, S., Maarefvand, P. 2017. Applying ultrasonic waves to evaluate the volumetric block proportion of bimrocks. Arab. J. Geosci. 2017, vol. 10, pp. 204. https://doi.org/10.1007/s12517-017-2999-8
Marais, C., Aldrich, C. 2011. The estimation of platinum flotation grade from froth image features by using artificial neural networks. J. South. Afr. Inst. Min. Metall. vol. 111, pp. 81-85. https://www.saimm.co.za/Journal/v111n02p081.pdf
Medley, E.W., Goodman, R.E. 1994. Estimating the block volumetric proportions of melanges and similar block-in-matrix rocks (bimrocks). In Proceedings of the 1st North American Rock Mechanics Symposium. Rotterdam: Balkema, pp. 851–8. https://onepetro.org/ARMANARMS/proceedings-abstract/ NARMS94/All-ARMS94/ARMA- 1994-0851/121194
Medley, E.W. 1994. The engineering characterization of melanges and similar block-in-matrix rocks (bimrocks). Ph.D. Dissertation. University of California at Berkeley, California. Ann Arbor, MI: UMI, Inc.
Medley, E.W. 1997. Uncertainty in estimates of block volumetric proportions in melange bimrock. In Proceedings of the International Symposium on Engineering Geology and The Environment. Rotterdam: Balkema, pp. 267–72.
Medley, E.W. 2001. Orderly characterization of chaotic Franciscan Melanges. Felsbau-Rock and Soil Engineering, vol. 19, pp. 20–33.
Canada: University of Toronto Press, pp. 509–16. https://www.geoengineer.org/bimrocks/files/Medley2002.PDF
Sayadi, A., Monjezi, M., Talebi, N., Khandelwal, M. 2013. A comparative study on the application of various artificial neural networks to simultaneous prediction of rock fragmentation and backbreak. Journal of Rock Mechanics and Geotechnical Engineering, vol. 5, pp. 318–324. https://doi.org/10.1016/j.jrmge.2013.05.007
Singh, V.K., Singh, D., Singh, T.N. 2001. Prediction of strength properties of some schistose rocks from petrographic properties using artificial neural networks. International Journal of Rock Mechanics and Mining Sciences, vol. 38, pp. 269–84. https://doi.org/10.1016/S1365-1609(00)00078-2
Slatalla, N., Alber, M., Kahraman, S. 2010. Analyses of acoustic emission response of a fault breccia in uniaxial deformation. Bulletin of Engineering Geology and the Environment, vol. 69, pp. 455–463. https://doi.org/10.1007/s10064-010-0296-9
Sonmez, H., Gokceoglu, C., Tuncay, E., Medley, E. 2004. Relationship between volumetric block proportion and overall UCS of a volcanic bimrock. Felsbau-Rock and Soil Engineering, vol. 22, pp. 27–34.
Sonmez, H., Gokceoglu, C., Medley, E.W., Tuncay, E., Nefeslioglu, H.A. 2006. Estimating the uniaxial compressive strength of a volcanic bimrock. International Journal of Rock Mechanics and Mining Sciences, vol. 43, pp. 554-61. https://doi.org/10.1016/j.ijrmms.2005.09.014
Yang, Y., Zhang, Q. 1998. The applications of neural networks to rock engineering Systems (RES). International Journal of Rock Mechanics and Mining Sciences, vol. 35, no. 6, pp. 727–745. https://doi.org/10.1016/S0148-9062(97)00339-2
Yuanyou, X., Yanming, X., Ruigeng, Z. 1997. An engineering geology evaluation method based on an artificial neural network and its application. Engineering Geology, vol. 47, pp. 149–56. https://doi.org/10.1016/S0013-7952(97)00015-X
Zorlu, K., Gokceoglu, C., Ocakoglu, F., Nefeslioglu, H.A., Acikalin, S. 2008. Prediction of uniaxial compressive strength of


Affiliation:
1Anglo American, Group Mining, Technical and Operations, South Africa
2Anglo American, Kumba Iron Ore, South Africa
3TECT Geological Consulting, South Africa
Correspondence to:
M. Bester
Email: marnus.bester@angloamerican.com
Dates:
Received: 31 Oct. 2024
Revised: 8 May 2025
Accepted: 21 Jul. 2025
Published: August 2025
How to cite:
Bester, M., Dlokweni, T., Basson. I., Koegelenberg, C. 2025. Risk-based slope design: Insights from the Thabazimbi failure. Journal of the Southern African Institute of Mining and Metallurgy, vol. 125, no. 8, pp. 421–436
DOI ID: https://doi.org/10.17159/2411-9717/3593/2025
by M. Bester1, T. Dlokweni2, I. Basson3, C. Koegelenberg3
Abstract
Certain degrees of safety, economic, and financial risk are implicit in any mining operation. At Thabazimbi Mine, slope stability was one of the major sources of risk, largely due to data uncertainties. Consequently, a risk-based approach in slope design was followed.
On 6 June 2015, a slope failure occurred in Thabazimbi Mine’s Kumba pit, involving approximately 65 million tonnes of rock failing into the pit and the valley below. Although the failed mass moved rapidly and resulted in a run-out distance of approximately 900 m, controls had been put in place to successfully evacuate all personnel. Risk assessment during the onset of failure supported the decision to not compromise the safety of personnel in any way, leading to unavoidable equipment loss.
This contribution presents the failure as a case study in the context of a risk-based approach to slope design as well as the importance of implementing geotechnical controls to effectively manage slope instability risk. Furthermore, a comprehensive back-analysis was performed, on a fully constrained 3D model, utilising 3DEC software, to gain insights into the failure mechanism.
In conclusion, lessons from the Thabazimbi slope failure are valuable as they demonstrate the importance of following a risk-based approach in slope design to effectively manage safety and financial risk in open pit mines.
Keywords slope failure, risk, geotechnical controls
Introduction and background
Thabazimbi (“mountain of iron” in Setswana) Mine has been operating since 1932 and is currently in the closure phase. It is situated approximately 250 km north of Johannesburg in the Limpopo Province of the Republic of South Africa (Figure 1). Thabazimbi mine primarily produced high-grade haematite ore (more than 62% iron (Fe) content), which is particularly low in contaminants and sold exclusively to ArcelorMittal South Africa. The Thabazimbi area has a recorded mean annual precipitation (MAP) of 645 mm, of which 90% falls between October and April. The area is characterised by high peak temperatures, with daily maximum temperatures that may rise above 40 °C in summer.
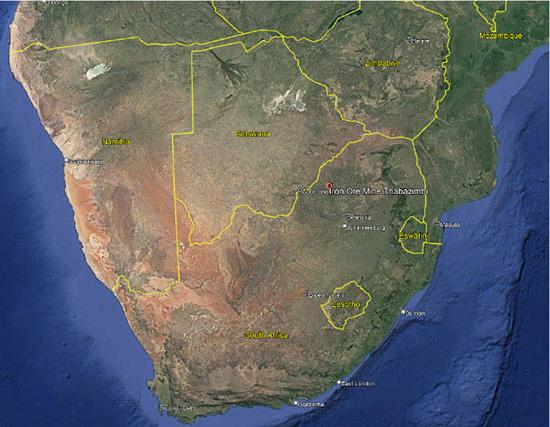
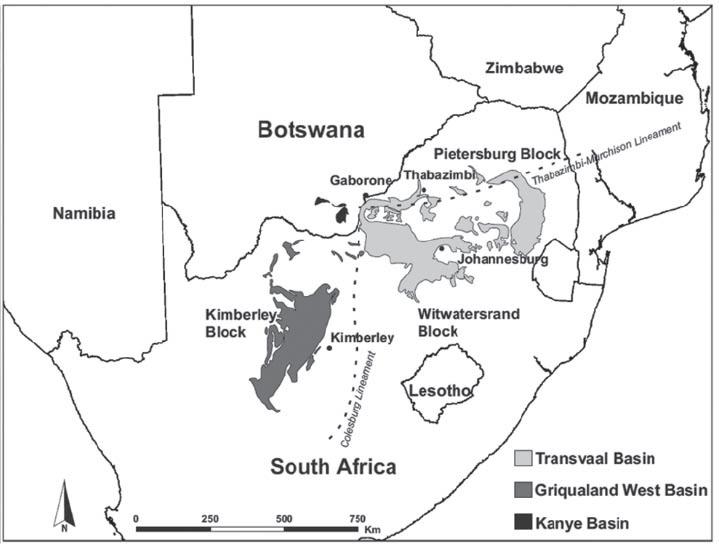
Geological setting
Thabazimbi Iron Ore Mine is hosted by the Neo-Archaean (ca. 2.5 Ga) Transvaal Supergoup, which occurs on the Kaapvaal Craton of Southern Africa. The Transvaal Supergroup comprises three subbasins: the Transvaal Basin in the east, the Griqualand West Basin in the west, and the Kanye Basin to the north in southern Botswana (Figure 1). The amalgamation of several Archaean greenstone belts, including the Witwatersrand Basin, and their underlying crystalline trondhjemite-granodiorite-granitoid (TGG) basements led to the formation of the Kaapvaal Craton (Poujal et al., 2003; Zeh et al., 2013), and formation of prominent suture zones referred to as the Colesburg lineament (De Wit et al., 1992) and the ThabazimbiMurchison lineament (Zeh et al., 2013).
The Transvaal Supergroup is composed of basal chemical sediments and is separated from overlying volcanoclastic sediments by a regional unconformity (e.g., Eriksson et al., 2006). At Thabazimbi Mine, the simplified stratigraphy from the base upwards consists of three broad packages, although there is a significant tectonic imbrication of portions of these: 1) thick, basal dolomites of the Chuniespoort Group (Malmani Subgroup); 2) a thin shale unit that grades into a thick banded iron formation (BIF) of the Penge Formation and 3) overlying siliciclastic sediments of the Pretoria Group (Basson, Koegelenberg, 2017). These sequences were intruded by ca. 2.05 Ga mafic sills of the Bushveld Complex (Rajesh et al., 2013), which have been subsequently deformed, and late, relatively undeformed, ca. 1.1 – 1.3 Ga Pilansberg Complex dykes (Van Niekerk, 1962; Allsopp et al., 1967).
Structural setting
Thabazimbi Mine occurs in the Mohlapitsi Fold-and-Thrust
Belt (Good, De Wit, 1997) of the Thabazimbi-Murchinson lineament. Close to the northern margin of the Transvaal Basin, the Transvaal Supergroup has been folded and imbricated along a segment of the regional E-W trending Thabazimbi-Murchinson lineament (Gutzmer, Beukes, 1988; Good, De Wit, 1997; Basson, Koegelenberg, 2017). Basson and Koegelenberg (2017) suggest that Thabazimbi Mine exploits localised hematite enrichment along an E-W trending, 20 km long, structurally complex horizon. Highgrade hematite mineralisation is typically confined to the base of a sequence of banded iron formation (BIF), on three prominent, E-W trending mountain ranges that are locally referred to as the Northern, Central and Southern Ranges as illustrated in Figure 2 (Basson, Koegelenberg, 2017). Kumba pit is situated at the extreme western end of the Northern Range.
The regional structure is due to uplift and duplication of the stratigraphy along two north-verging, E-W trending, oblique-slip thrusts, namely the Belt-of-Hills Thrust and the Bobbejaanswater Thrust (Du Plessis, Clendenin, 1988; Du Plessis, 1990). Duplication is accentuated by positively-weathering BIF, which defines significant scarp slopes along the Northern and Southern Ranges. The northernmost boundary of the Mohlapitsi Belt is marked by the Belt-of-Hills Thrust that juxtaposes Malmani Subgroup dolomites over younger units of the Transvaal Supergroup and Waterberg Group. The southernmost margin is marked by Pretoria Group sediments that dip gently southwards below the ca. 2054 Ma Bushveld Complex. The reader is referred to Basson and Koegelenberg (2017) for a more detailed overview of the structural setting of the Thabazimbi Mine area, and for insight into the 3D geometry of various mining areas. Table 1 serves a summary of the main deformational features of the Thabazimbi Mine region.

Table 1
Summary of structural features in the Thabazimbi area. Modified from Basson and Koegelenberg (2016) and references therein
Event
Extension
Compression
Extension
Structural features
D1 Gentle, southwards- dipping Transvaal Supergroup. E-W trending listric faults.
D2 Inversion of listric faults to thrusts. Gentleto-open, km-scale, shallowly plunging F2.
Comments
Crustal extension and sagging during emplacement of the Bushveld Complex and contemporaneous deposition of the Waterberg Group.
Regional top-to-the-N thrusting and steep reverse faulting. Mine-scale to mesoscale D2 thrusts and folds show predominantly northwards kinematic transport and imbrication “pop-ups” are bound along their southern sides by S-verging reverse faults, along broad fold hinges.
D3 Oblique, sinistral strike-slip duplexes. Reactivation of D2 structures.
D4 NW-SE trending normal faults. Mesozoic extension during sedimentation and eruption of Karoo Basalt, forming half-grabens.
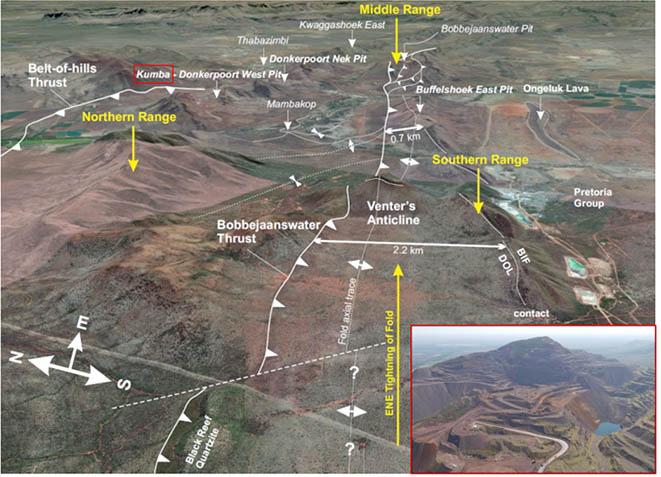
Mineralisation
Mineralisation at Thabazimbi Mine may be categorised into two main types, largely based on tectonostratigraphic position (Basson, Koegelenberg, 2017). Ore is categorised as normal or typical if it is constrained to the base of Penge Formation, i.e., between the base of BIF and a lower carbonaceous shale layer that directly overlies the Malmani dolomite. Shale shows variable thicknesses due to both thrusting, shearing, and flexural-slip or buckle folding (Basson, Koegelenberg, 2017), whereas ore categorised as ‘atypical’ or ‘Thabazimbi-type’ is situated stratigraphically higher, relative to the top of the dolomite, and is enclosed in BIF. Atypical ore often runs parallel to the sheared contacts of a laterally-persistent diabase sill or series of sills. Based on its crosscutting orientation, ore and diabase sills are hosted by northwards-climbing thrust planes. Kumba pit is known for containing one or more of these ‘atypical’ ore zones.
Orebodies mined
Before closure, mining was carried out in three pits (Buffelshoek, Donkerpoort Nek, and Kumba) using conventional open pit mining methods (Figure 3). Open pit mining operations by Kumba Iron Ore at Thabazimbi Mine ceased in September 2015 and current activities consist of decommissioning, reclamation, small scale mining, and monitoring.
The geometry and thickness of the basal orebody, which overlies the shale, is controlled by dolomite karst topography, the intensity of which decreases from north to south. Wad is expected to be present as dislocated localised pockets on the dolomite contact. Wad is a generic name for (often poorly crystalline) soft manganese oxides/ hydroxides, often containing significant amounts of hydroxides/ oxides of other metals and adsorbed metals (Ni, Co, Cu, Fe, and other transition metals, alkali elements, etc.). The upper orebody, overlying a diabase sill, is cuspate in nature and dips generally increase towards the outer edges of orebodies as they pinch out.
Based on the available drillhole data and mapping, ore bodies pinch and swell along both dip and strike directions, resulting in variations in orebody thickness and dip. Tabulated in Table 2 are the general characteristics of the ore bodies or the portions thereof.
Most of the mining activities took place above the groundwater table and the pits were predominantly dry. The Thabazimbi operations are situated in mountainous terrain, with the Crocodile River draining the southern section of the area. Groundwater flow contours indicate drainage from higher lying, mountainous areas towards the higher-yielding dolomitic aquifers and the Crocodile River and Rooikuilspruit stream.
Slope design and risk assessment
Kumba Iron Ore utilises a standardised geotechnical risk management process that employs risk controls at all levels, including slope design, slope monitoring, operational controls, and evacuation procedures (Figure 4).
Results from geomechanical analyses conducted in the Kumba pit, indicated that the design adhered to industry and company acceptability criteria. Figure 5 shows the locations of cross-sections used in the initial stability analysis and Table 3 presents a summary of the factor of safety (FoS) and the model probability of failure (PoF) of the cross-sections that intersected the failure surface. This was completed for the initial design in 2008, and the follow-up study was conducted in 2014.
Subsequent to the geomechanical analysis, a comprehensive geotechnical risk assessment for Thabazimbi Mine was conducted for the Life of Mine plan. Fault and event tree analyses were incorporated into the Kumba Iron Ore Hazard Identification and Risk Assessment (HIRA) criteria, in order to enable the comparison of slope failure risk with other assessed risks on the mine. This was performed routinely, according to the mine planning cycle.
Thabazimbi Mine had limited geological / structural and geotechnical data, and taking into account the full failure history of the mine, the resultant geotechnical uncertainty had to be
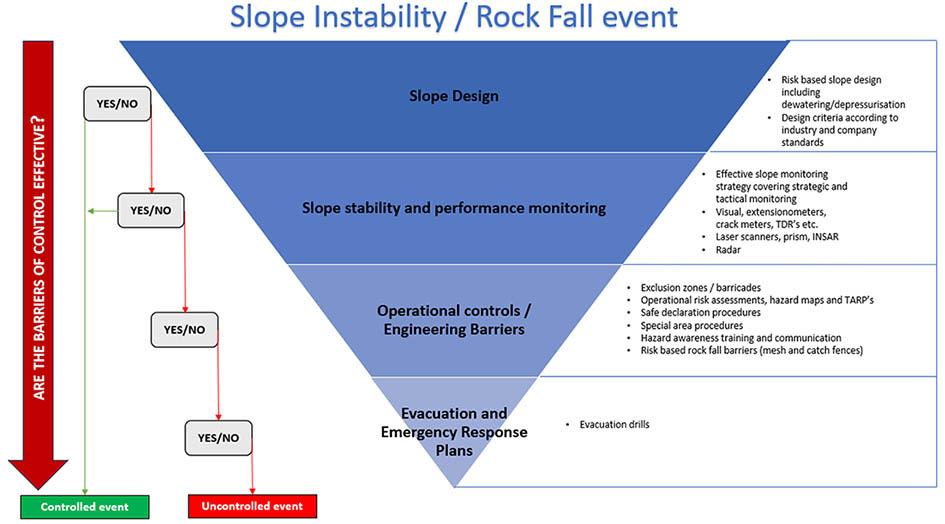

incorporated in the fault tree analysis. Subsequently, and despite the fact that the resulting fault tree analysis indicated higher probability of slope failure, the safety risk (HIRA) that was determined, using event tree analysis, was considered to be acceptable and defensible. This was dependent on all geotechnical risk control measures – including slope radar monitoring, survey prism monitoring, operational controls, and evacuation procedures – being adequate, in place, and effective.
On 6 June 2015, a significant slope failure occurred at the Kumba open pit. An approximate volume of 65 million tonnes of rock failed into the pit and the valley below it, inundating the production area of the pit. Although the failure was significant in terms of production impact, the trigger action response plan informed by slope monitoring data, allowed for early warning and safe evacuation of personnel.
Table 3
The sequence of events leading to, and subsequent to the onset of the slope failure, is shown in Figure 6: the initial slope stability radar monitoring deformation alarm triggered on 1 June 2015 (Day 1), 6 days before failure.
The sequence shows continued increase in displacement rates over 6 days leading up to the failure. Displacement rates increased to 20 mm/hr by Day 3. On Days 4 and 5, displacement rates continued to increase, to 75 mm/hr immediately prior to failure. The onset of the failure was at 22:00 on Day 5, with the failure event occurring at 02:45 on Day 6 ( 6 June 2015).
The Kumba pit slope monitoring strategy included a Leica GeoMos Survey Prism System for slope performance monitoring and GroundProbe Slope Stability Radars (SSRs) for safety-critical monitoring. Figure 2 illustrates the Kumba pit with locations of the two SSRs, survey robotic theodolite stations, and prisms installed on the highwall. Regular visual inspections of the pit were carried out, with photographic and written records being kept for each geotechnical inspection. This monitoring strategy was considered adequate for the assessed Kumba pit slope stability risk.
Both automated monitoring systems, GeoMos and SSR’s, successfully detected the onset of the failure and provided early warning, facilitating the evacuation process. The GeoMos prism monitoring data is illustrated in Figure 8, while the SSR monitoring data is depicted in Figure 9. Deformation rates and velocities exceeded 500 mm/day leading up to the failure, with a total displacement of approximately 2 metres before the event occurred. Figure 10 shows a comparison of photos before and after the failure.
Geotechnical conditions leading to the failure were manifold, involving several inputs with varying degrees of data confidence. Variations in the geological, structural, rock mass, mining, and
Summary of geomechanical modelling results for corresponding sections in the failure area
Kumba Iron Ore Analysis, 2008 SRK Consulting Analysis, 2014
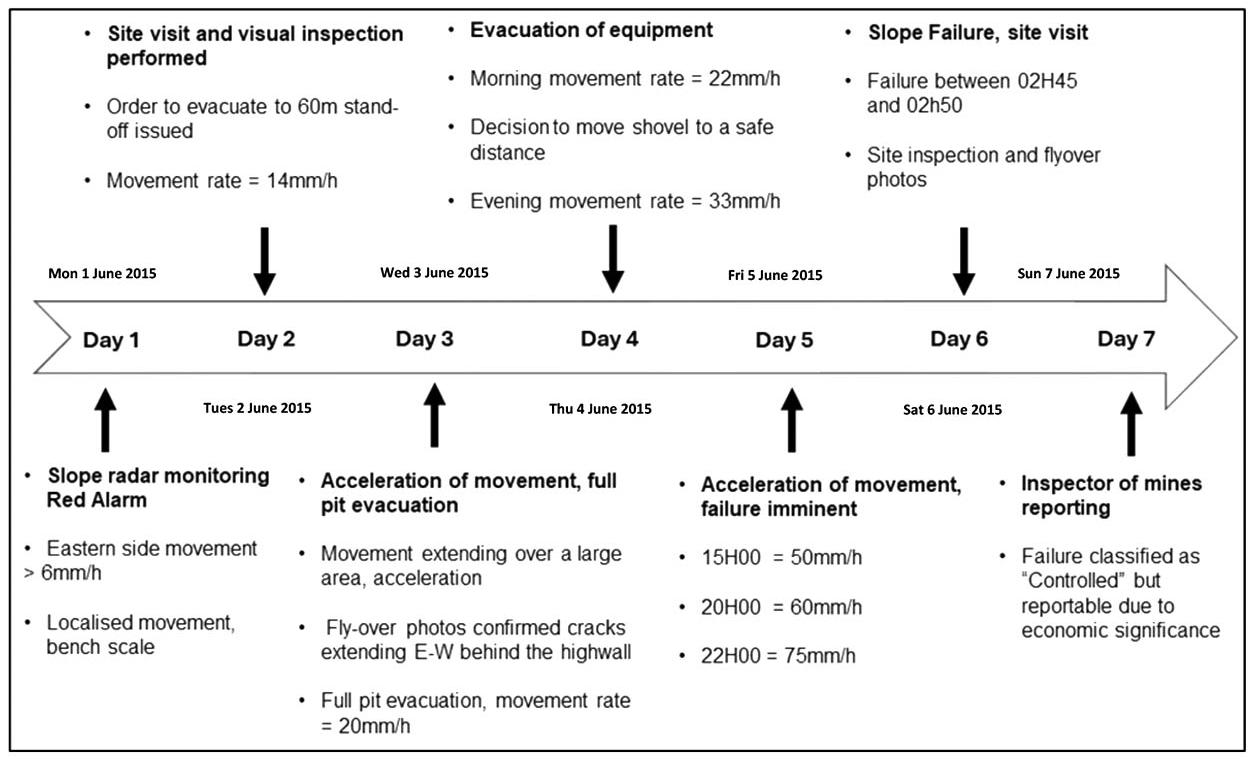
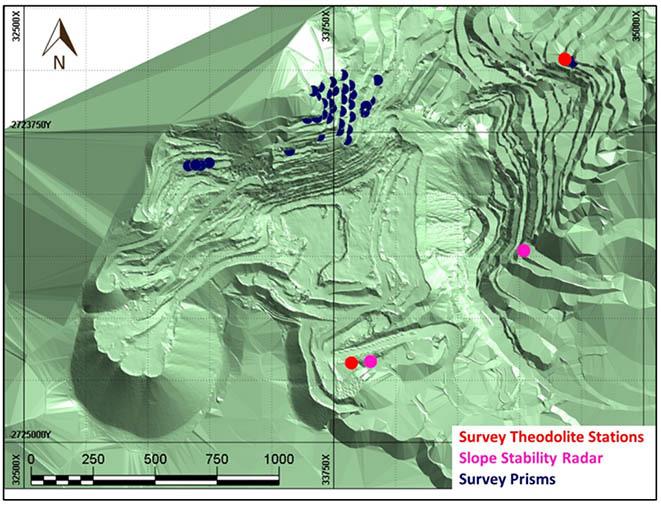


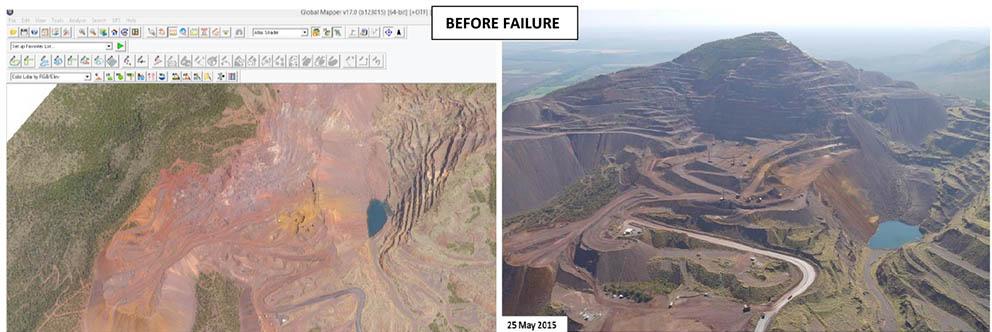

groundwater conditions individually and jointly contributed to triggering the failure. The three-dimensional nature of the pit slope, combined with the surrounding topography and geotechnical conditions, required a phased approach to the analysis. Each phase introduced increasing levels of complexity, allowing for a deeper understanding of the failure mechanisms as the investigation progressed. For this reason, the back-analysis comprised geological back-analysis, 2D and 3D numerical modelling.
Geological back-analysis
Geological back-analysis of the slope failure requires a fullyconstrained three-dimensional (3D) model. Although the original 3D model of the Kumba pit existed at the time of failure, this version contains an updated structural interpretation that considered all, albeit limited, historical mapping data, an up-todate drillhole database, and available downhole structural data. Consequently, it provides a fit-for-purpose 3D model for failure simulation and is considered to be a significant improvement over the previous 3D model(s). The 3D model was built using a workflow approach, with the following basic steps:
➤ Drillhole database import and validation;
➤ Cleaning (e.g., compositing) of drillhole data and intersections;
➤ Point/structural data import (in this case face mapping data);
➤ Fault network construction based on explicitly-mapped points and offsets of contacts between adjacent drillholes;
➤ Establishment of a fault chronology (cross-cutting relationships and fault activation to create fault-bounded blocks;
➤ Lithological surface construction;
➤ Establishment of surface chronology;
➤ Surface chronology activation to construct lithological volumes.
Fault network construction
The generally cross-cutting fault network at Kumba pit consists of two dominant orientations: 1) NE-trending normal or reverse faults that have exploited fold-related cleavage; and 2) NNW-trending strike-slip faults, often with a component of vertical offset. In general, NE-trending faults terminate against NNW-trending faults,
with the latter continuing to the model boundary. ‘Activation’ of the fault network results in a total of 57 fault-bounded blocks (Figure 6), each with their own average bedding and lithological contact orientations. A total of 48 NE-trending faults were constructed. A decision was made to construct the NE-trending faults with a predefined average orientation of 330°/75°– 85°, modified based on locally-available data. A total of 7 NNW-trending faults is represented.
Bedding and contacts
Dolomite and shale volumes are generated from surfaces that employ measured lithological contacts and structural discs as modelling parameters. Plotting these orientations on stereonets produces contoured maxima of 153°/36° and 156°/34° for dolomite and shale contacts, respectively (Figure 12).


This partially overlaps with the contoured maximum of bedding but not necessarily the orientation of contacts derived from pit mapping (196°/25°; Figure 12). This may denote an acute angular relationship between bedding and contacts, or some form of rotational deformation between the two, which is entirely possible as the Kumba pit occurs close to a lateral ramp within the Northern Range.
Banded iron formation (BIF)-diabase and BIF-shale-dolomite contacts are tectonised, characterised by top-to-the-N kinematics. To reiterate, from a geotechnical or back-analysis viewpoint, these (particularly dolomite-shale-BIF contacts) should be modelled as broad, weak zones. In the case of the BIF-shale dolomite transition, this has a combined thickness of 40-50 m, straddling the modelled lithological contact in the 3D model. Furthermore, the thrusted upper contact between the lower diabase sill and BIF is defined by a finely-laminated and sheared clay-calcite-rich zone with occasional fault gouge and quartz schlieren, as illustrated by Figure 13 (Basson, Koegelenberg, 2017), over a maximum thickness of approximately 1 m. Consequently, there are numerous sites of weakness, focused along major contacts, distributed throughout the stratigraphy or tectonostratigraphy, combined with locally-variable, block-specific bedding orientations.
Three-dimensional geological model discussion
Figures 14 and 15 are cross-sections through an area that is suspected to be the focal point of the slope failure at Kumba pit. Included are previously-modelled dolomite surface as well as the pit surface prior to failure.
In the focal point, the steep angle (~61°) of dolomite (2014 dolomite surface) between adjacent drillholes does not honour the bedding, as the dip direction/dip of the two respective fault-
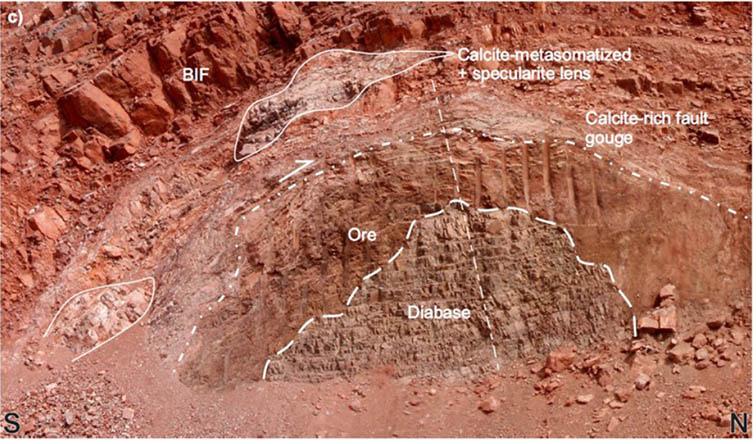
bounded blocks (Block 34 and 35) is constrained by mapping and downhole data: 170°/37° for Block 34, and 171°/28° for Block 35, respectively. Regarding the updated 3D model, a nearby mapping point for a fault, just off-section, has been recorded (330.3°/71.8°) and as such, informs the position and orientation of modelled Fault NE07 that is locally of high confidence. Consequently, the updated model supports brittle offset rather than steepening of the relevant dolomite contact. Notably, the local effects of fault drag cannot be excluded due to lack of data resolution, which otherwise has caused localised steepening of bedding in other parts of the pit.
Regardless of the lack of resolution of the updated 3D model, it does however strongly suggest that the sheared dolomite/shale and BIF contact, in Block 34, is vertically higher and closer to the pit surface, compared to the previous 2014 model. The original, explicitly-modelled dolomite contact (2014) is approximately 93 m from/below the pit surface, whereas the revised contact in Block 34 (this model) extends to within 50 metres of the toe of the slope.
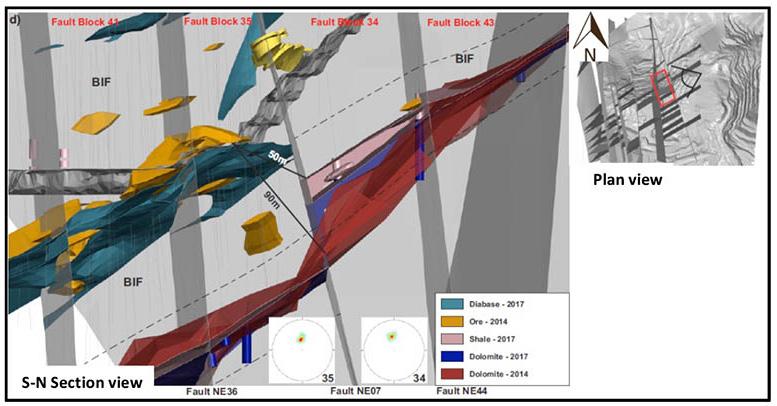

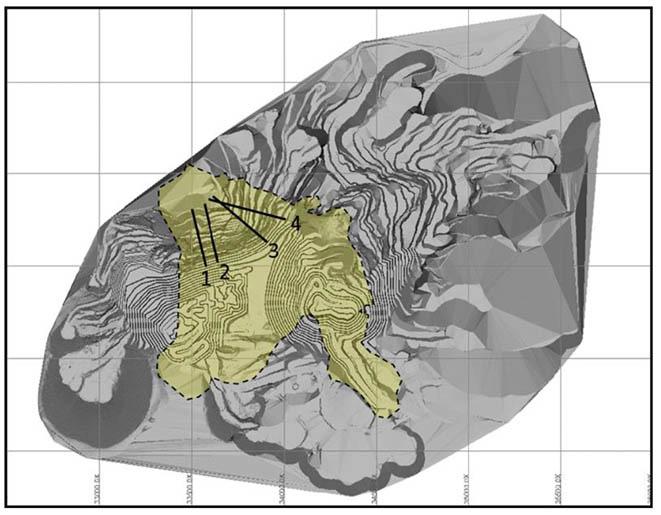
previous studies. Sections 3 and 4 intersected the diabase sill and ‘atypical’ ore, described in the previous section, towards the toe of the slope.
In general, geotechnical data levels at Thabazimbi Mine were low, with limited core drilling and laboratory strength test data available in the Kumba pit area. The quality of core drilling was poor, with core recoveries below 60%, due to difficult drilling conditions experienced in the Kumba pit. A geotechnical testing programme, delivering limited results, was completed prior to the geomechanical analysis of the 2008 Life of Mine pit layout. Therefore, geomechanical properties were derived mainly from surface mapping and from the limited laboratory testing data.
Summary of rockmass parameters used in the 2D back-analyses

There is another combination of features that may have had a significant effect on the strength of the toe of the slope (Figure 15); a thin sliver of ‘atypical’ ore, directly in contact with a sill beneath it, which runs into Fault NE07 from the south, that has been downthrown due to the abovementioned apparent reverse movement along Fault NE07. This feature is extremely close to Benches 1 and 2 of the pre-failure pit and immediately down-dip of the area wherein the dolerite surface was close to the pre-failure pit surface. These features are reasonably considered in the context of a broad (40-50 m) tectonised zone. The outline of this zone is shown on Figure 15 as a dashed, line and it is apparent that this overlaps with the fault-juxtaposed atypical ore zone. As a first approximation and working concept, Figures 15–18 highlights several proposed paths of propagation for the failure, aided by lateral, NNW-trending faults that acted as release planes.
In order to validate the root cause of the slope failure, a twodimensional (2D) stress-strain deformation analysis was first conducted using the RS2 Finite Element Analysis program by Rocscience. The analysis considered two sets of rock mass parameters described in previous geotechnical design reports, as well as dolomite/banded iron formation (DOL/BIF) contact properties determined in previous back-analyses of slope failures in Kumba pit.
A previous back-analysis of a failure in a different sector recommended that slopes in the Kumba pit should have a minimum BIF thickness of 50 m between the slope toe and the DOL/BIF contact. Although located in a separate geotechnical design sector from the Kumba South pit, this criteria was considered appropriate for the failure area due to the similarity of the lithologies present. The location of the four sections utilised for the back-analysis is illustrated in Figure 16. Sections 1 and 2 were found to have a pit slope toe-to-DOL thickness of 61 m and 70 m, respectively, which exceeded the 50 m of minimum thickness recommended in the
The rock mass strength was characterised using the Hoek-Brown criterion, with equivalent Mohr-Coulomb parameters calculated for the bedded units based on the Barton-Bandis criterion. A summary of the rockmass strength parameters is included in Table 4.
The DOL/BIF contact was considered to be the dominant failure mechanism and was the focus of this analysis. The contact properties were selected from previous reports to show how modelled slope stability changed as new insights into the contact strength properties were introduced. A summary of the contact parameters used in the first set of analyses in this study is shown in Table 5.
RS2 models were created for four cross sections spaced across the failure surface. A 5 m thick DOL/BIF contact was added to the models explicitly, with its associated strength parameters considered to cater for the contact as well as a continuous shale layer at the contact. The shale is not ubiquitous in drilling results, but due to its physical properties and the nature of the percussion drilling done in most areas, it has been assumed to be present throughout. Three contact strength scenarios were modelled for each set of rock mass parameters, including cases where there was no contact, a weak contact (c = 1.5 kPa, φ = 16°) and a moderately strong contact (c = 9.1 kPa, φ = 46°).
The moderately strong contact represents strength parameters for the shale, assumed to be present along the dolomite contact, while the weak contact values simulate a mix of shale and weathered dolomite (Wad) along the contact. Prior to the failure Wad was
Table 5 DOL/BIF contact shear strength properties
Table 6
Summary of RS2 analysis results
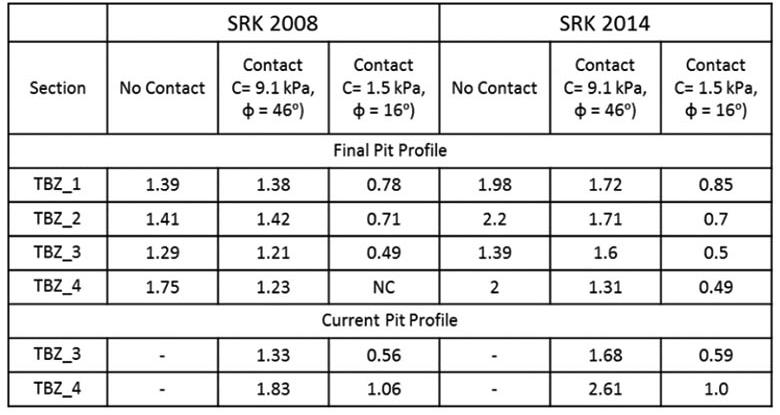

expected to be present as dislocated localised pockets. However, the failure surface revealed a much greater extent of Wad present along the dolomite contact. In reality the back-analysed rock mass values for the failure are likely to fall between the moderately strong contact and weak contact values. A sensitivity analysis was carried out to define the likely range of material parameters in the area of the failure.
The first analysis was carried out using both the final pit profile for all four sections and the pit profile at the time of failure for Sections 3 and 4. A summary of the analysis is included in Table 6. All four sections were found to be stable when there was both no contact and a contact of moderate strength when the final pit profile was used. The stability of these sections increased when the pit profile at the time of failure was used (Sections 3 and 4). When a weak contact was present, all four sections were found to be unstable when modelled with the final pit profile. However, when the pit surface at the time of failure was used, Section 4 was found to be marginally stable and Section 3 was unstable.
A sensitivity analysis was completed for Sections 3 and 4 to investigate the influence the contact strength and toe burden had on slope stability. These sections were of particular interest, as slope monitoring data indicated that initial slope movement began in this area. Three burden depths were considered to simulate the influence of mining (and indirectly blasting) on slope stability. The three slope profiles shown in Figure 17 were analysed with contact strengths varying between c = 1.5 – 9.1 kPa and φ = 16° – 46° for each case. The results are illustrated in Figure 18.
The results suggested that the distance to the shale contact (toe burden) had a significant influence on slope stability. The variation of contact strength parameters indicated that slope stability was
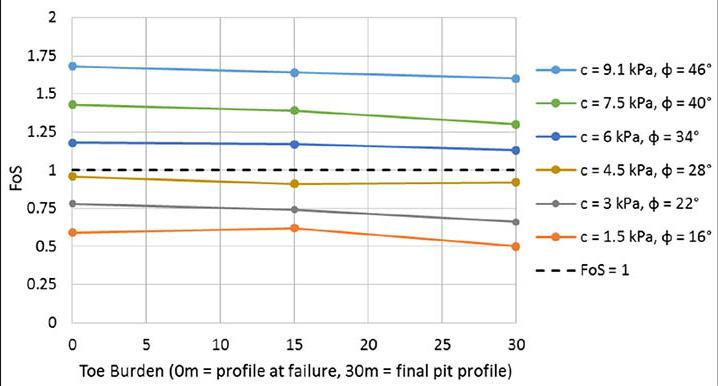
also dependent on the contact strength. The models suggest that the actual contact strength parameters were approximately c = 4.5 kPa, and φ = 28°.
Although the 2D analysis provided an initial understanding of the shear strength at the DOL/BIF contact prior to failure, it did not fully capture the complex interactions inherent to the 3D slope geometry. Factors such as geological structures, material anisotropy, and the step-path failure mechanism required a more comprehensive 3D approach to accurately back-analyse the failure. Therefore, a three-dimensional analysis was performed using a Distinct Element Code, 3DEC by Itasca, to back-analyse the failure. 3DEC allows important structural features (e.g., faults, contacts) to be modelled explicitly and other minor structures to be included implicitly. Figure 19 shows that four stages of the pit development were modelled, which included: 1) pre-mining stage to achieve the initial stresses properly; 2-4 years 2012 to 2014 as pre-failure stages to accumulate displacements.


In the area of analysis, all principal faults and the contact between shale and dolomite material were modelled explicitly, as shown in Figure 20. Figure 21 shows the location of the contact as well as the distribution of all the materials in the numerical model.
An important element in the failure back-analysis is the anisotropic behaviour of some of the lithologies, specifically banded iron formation (BIF) and shale (SH), on a rock mass scale. The anisotropy orientation in BIF is variable relative to the position in the wall, as presented in Figure 22. At present, it is not practical to simulate the explicit bedding within a large-scale 3DEC pit model due to the large computational requirements. For this reason,
equivalent continuum representation was employed to ensure reasonable computation times and in order to simulate the effects of anisotropic rock mass strength and deformation behaviour on
slope stability.
Itasca has developed a ubiquitous joint rock mass (UJRM) modelling technique to account for rock mass anisotropy and scale effects in 3DEC. The ubiquitous joint constitutive model was developed to simulate well-defined strength anisotropy due to embedded planes of weakness within an isotropic continuum material. When used to simulate rock mass strength and deformation behaviour under unconfined compression, the UJRM model represents the progressive degradation of matrix cohesion and ubiquitous joint failure at various stages of loading.

Table 7
Ubiquitous properties for BIF and SH units (Cabrera, Lorig, 2017)
BIF structures
structures
The anisotropic analysis was presented in a previous report for Kumba Iron Ore’s Sishen Mine (Cabrera, Lorig, 2017). For backanalysis, the anisotropic behaviour for both BIF and shale material was used, with the ubiquitous joints’ properties for these materials presented in Table 7. In the numerical model this has been assigned using different dips and dip directions for every zone, depending on its position. The anisotropy orientation in shale is parallel to the shale-dolomite contact.
Major structures included in the analyses were implemented explicitly in the 3DEC models. Their behaviour is represented by a linear Mohr-Coulomb failure criterion, and the residual values are
8
Shear strength properties for the faults and shale-dolomite contact Cohesion (kPa)
(°)
Strength (kPa)
Principal faults 10 23 1 SH - DOL Contact 0 25 0
cres = 0 (cohesion), Øres = Øpeak (friction). Shear strength parameters of the structures (including principal faults and shale - dolomite contact) are presented in Table 8.
Brittle rock mass properties
It was decided to use an advanced constitutive model (CaveHoek) for considering strain-softening rock mass behaviour. The CaveHoek model was developed specifically by Itasca Consulting Group to describe a Hoek-Brown rock mass behaviour under caving conditions, but this has lately been used in open pit mining. The constitutive relation (shown simplified in Figure 23), allows representation of the nonlinear weakening behaviour of materials based on prescribed variations of properties as a function of the plastic shear strain.
The CaveHoek model allows for representation of elastic modulus softening, density adjustment, variable dilation, dilation shutoff, scaling properties to zone size, tension weakening, cohesion weakening, and frictional strengthening. In cases where the open joints controlling rock mass strength have a preferred orientation (as in Kumba pit), ubiquitous joints can be activated within the model with orientations that reflect their true orientation distribution. When the stress has exceeded the elastic limit, the rock mass yields by fracturing without losing all its cohesion. A full description of the Itasca CaveHoek model is provided in a paper by Lorig and Pierce (2000).


CaveHoek residual properties must be defined in terms of Hoek-Brown parameters mb, a and s. Fitting these parameters to the Barton shear strength envelope at 30% porosity results in the following values: mb = 2.0, a = 0.77 and s = 0. The peak parameters must be defined in terms of σci, GSI, mi, and Ei. The values used in the analyses were obtained from the previous stability analyses and are shown in Table 9.
Analysis results
The numerical model results are analysed in terms of numerical velocity. An unstable condition is assumed in the model when, after a significant number of calculation steps, the numerical velocity remains aligned and above a certain value (different in each model). Figure 24 schematically shows the definition of stable/unstable related to numerical velocities.
Figure 25 shows the calculated numerical velocities for 2012 to 2014 mining stages. Blue numerical velocity represents stable zones. Green numerical velocities represent yielding zones. Red numerical Table
Using the original rock mass properties, the analyses showed stable conditions. Some rock mass properties had to be reduced, as listed in the following, to accurately simulate the failure:
➤ Contact between shale and dolomite: c = 0 and Ø= 15°
➤ Principal faults: c = 10 kPa and Ø = 25°
➤ BIF anisotropy: c = 0, Øpeak = 25° and Øresidual = 20°
➤ Shale anisotropy: c = 0, Øpeak = 18° and Øresidual = 16°
These properties were found to be realistic to simulate the failure numerically.


velocities represent local and shallow failures at the center of the slope. The yellow line represents the observed limits of the 2015 failure.
The numerical model is considered well calibrated as most of the slope presents high numerical velocities. The model showed stable conditions in 2014 (with some local failures at bench scale) and globally unstable in 2015 extending down to the shale-dolomite contact in some points. The mechanics of the movement is complex, sliding along the shale-dolomite contact and failing because of the BIF anisotropy. The western limit of the global failure is better achieved than the eastern one, because of the N-S principal faults orientation.
Because of the size and complexity of the numerical model, the use of a small strain assumption was mandatory. This assumption means that further degradation of the slope after the initial failure was not fully captured, as the nodes are not actually moving, just numerically.
In conclusion, the 3DEC modelling properties for the shaledolomite contact, faults, and BIF-shale anisotropy had to be reduced to simulate the observed failure as accurately as possible. The resulting model closely aligns with the 2D back-analysis using RS2, which highlighted that stability was highly dependent on the contact strength. A logical conclusion is that the shale-dolomite contact was significantly weaker than initially expected, likely due to weathering, Wad formation, and possibly elevated pore pressures from surface water ingress.
Discussion
Based on the detailed back-analysis presented in the previous sections, the Kumba pit failure mechanism can be explained by the following sequence of events:
➤ 27-29 May 2015: Mining activities at the eastern toe of the slope exposed a thin layer of atypical ore in direct contact with an underlying sill, which had been displaced by faulting. This faulting also brought the shale-dolomite and BIF contact in Fault Block 34—just north of the toe—closer to the pit surface. Initially, the modell ed dolomite contact was located approximately 93 m below the pit surface; however, after revision, the dolomite contact in Block 34 was found to be within 50 m (or less) of the slope’s toe. This shift triggered the initial relaxation at the eastern toe, marking the onset of a complex step-path failure.
➤ Friday, 29 May 2015: Prism monitoring indicated movement on the eastern side of the slope.
➤ Monday, 1 June 2015: Failure propagated along a north-south fault up the slope, triggering radar alarms.
➤ Tuesday, 2 June 2015: The failure then progressed from east to west, with cracks observed to be opening along faults and the shale-dolomite contact from the eastern highwall across towards the west (Figure 26). A north-south fault on the westerns side of the slope acted as another release plane, facilitating the failure’s propagation down the western side of the slope. This effectively created a large, ‘loose’ block of ground on the BIF-shale-dolomite contact.
➤ Wednesday, 3 June 2015: Visual, ground-based, and helicopter inspections revealed alarming signs (Figure 27). The authors conducted an on-site inspection of the pit in the presence of the Mine Manager. During the visit, dust trails were observed rising along fault lines on both sides of the pit, accompanied by audible cracking noises emanating from the slope. These observations confirmed significant instability, prompting the immediate decision to evacuate the pit.
➤ Thursday, 4 June 2015: The rate of acceleration temporarily slowed, but despite the authors' inverse velocity calculation from the previous day predicting a failure at approximately 23:00 on Friday, strict no-entry orders remained in effect, except for moving a shovel to a safer distance during the morning.
➤ Friday, 5 June 2015: Continued unravelling of the slope along faults was observed. Radar monitoring indicated rapid acceleration over the entire slope area (Figure 28).
➤ Saturday, 6 June 2015: Failure occurred at 02:45 with a runout of approximately 900 m in less than 5 minutes (Figure 29). The anisotropic nature of BIF—characterised by steeply dipping bedding on the western side, and therefore nondaylighting in the slope—contributed significant strength to


the entire BIF rock mass. This strength allowed a buildup of stress at the toe of the failure surface. It is inferred that the accumulated stress triggered the violent nature of the failure, which also accounts for the extensive run-out distance. It may also be inferred that, had the BIF featured daylighting bedding (weaker orientation), failure would likely have shown movement at the toe earlier and exhibited slower movement, akin to the earlier Kumba West failure (a slow moving smaller failure that occurred earlier).
From a safety perspective, the failure was well managed, with no personnel exposed and no potential for unwanted safety consequences. However, from a financial standpoint, the event effectively sterilised the remaining ore, resulting in force majeure consequences for Kumba pit, which in turn precipitated closure proceedings for Thabazimbi Mine.
This raises an intriguing question: What if every uncertainty had been known prior to the commencement of mining? While hindsight offers perfect clarity, it is essential to consider the broader economic context that informs risk-reward decisions. The Kumba pit was actively mined for six years, up until 2015, supplying the domestic iron ore market under cost-plus contractual agreements. During this period, production from Kumba pit effectively ‘freed up’ tonnage from Sishen and Kolomela Mines for export, generating significant foreign exchange and contributing to Kumba Iron Ore’s financial success, as well as to South Africa’s economy through royalties and taxes.
In retrospect, had the full extent of geotechnical uncertainties been known—along with the costs and practical challenges of obtaining this data—it is likely that the pit would have been deemed uneconomical. The additional waste removal required to ensure stability could have rendered the project financially unviable, resulting in the premature closure of Thabazimbi Mine, along with the associated loss of jobs.
Therefore, every tonne extracted from the Kumba pit added significant value on the reward side of the equation, contributing
to both the local and national economy. At the same time, diligent geotechnical risk management ensured that no harm came to personnel, effectively balancing economic gains with the highest safety standards.
The development and operation of Kumba pit exemplified a complex balance between economic rewards and the inherent risks of mining. While the pit's eventual failure had significant financial implications, its six years of production played a vital role in supporting both domestic iron ore demand and the generation of foreign exchange through exports. At the same time, robust geotechnical risk management strategies ensured that personnel safety remained uncompromised, even in the face of uncertainty.
Key lessons learned from the Kumba slope failure are summarised as follows:
➤ When dealing with uncertainty, it is crucial to incorporate probabilistic analysis, along with event and fault tree analysis, to inform decision-making, rather than relying solely on model factors of safety.
➤ The significance of an accurate conceptual failure model as the foundation for all geotechnical design work cannot be overstated.
➤ Always calibrate limit equilibrium stability analysis with numerical modelling.
➤ When geological contacts are tectonised, they should always be explicitly modelled as broad, weak zones to assess the sensitivity of stability to their presence. If found to be a potential driver of instability, it should trigger targeted data acquisition to improve confidence in its parameters to improve slope design reliability.
➤ Slope performance monitoring vs. critical monitoring: While critical monitoring tools like slope stability radars (mitigation controls) ensure the safety of personnel, long-
term strategic monitoring (preventative control) is essential for verifying slope performance and ensuring that measured movements remain within design tolerances.
➤ Slope design verification: Ongoing face mapping of each newly exposed bench is vital for reconciling the design with all four components of the geotechnical model, enabling early identification of any deviations or anomalies.
➤ One cannot be too conservative when it comes to run out distance assessment.
Ultimately, the decision-making process at Kumba pit reflects the careful navigation of risk and reward, where every mined tonne carried both economic value and the full implications of effectively managing potential geotechnical hazards.
Acknowledgements
We extend our sincere appreciation to Kumba Iron Ore for the opportunity to present this work. In particular, we acknowledge the leadership and commitment of Mr. Glen McGavigan, whose guidance has been instrumental throughout this process. We also gratefully recognize SRK Consulting, with special thanks to Mr. Peter Terbrugge and Mr. Des Mossop, for their valued collaboration and steadfast support. Furthermore, we wish to acknowledge the insightful contributions of Dr. Loren Lorig and Mr. Alex Cabrera from Itasca Consulting Group, whose technical expertise and assistance have significantly enriched this study.
References
Allsopp, H.L., Burger, A.J., Van Zyl, C. 1967. A minimum age for the Premier kimberlite pipe yielded by biotite Rb-Sr measurements, with related galena isotopic data. Earth Planet Sci. Lett. 3, pp. 161–166.
Basson, I.J. Koegelenberg, C. 2017. Structural controls on Fe mineralization at Thabazimbi Mine, South Africa. Ore Geology Reviews, vol. 80, pp, 1056–1071.
Cabrera, A., Lorig, L. 2017. 3D Numerical Modelling for Kumba Iron Ore Operations Sishen Mine: Kumba Internal Report.
De Wit, M.J., Roering, C., Hart, R.J., Armstrong, R.A., De Ronde, C.E.J., Green, R.W.E., Tredoux, M., Peberdy, E., Hart, R.A. 1992, Formation of an Archaean continent: Nature, vol. 357, pp. 553–562, doi: 10.1038/357553a0.
Du Plessis C.P. 1990. Tectonics along the Thabazimbi-Muchison lineament. Unpublished Ph.D., Witwatersrand University, (p. 307).
Du Plessis, A., Clendenan, C.W. 1988. The Bobbejaanwater Fault System south of Thabazimbi, western Transvaal. South African Journal of Geology, vol. 91, no. 1, pp. 97–105.
Eriksson, P.G., Altermann,W., Hartzer, F.J. 2006. The Transvaal Supergroup and its precursors. In: Johnson, M.R., Anhaeusser, C.R., Thomas, R.J. (Eds.), The Geology of South Africa. Geological Society of South Africa and Council for Geoscience, Johannesburg, pp. 237–260.
Good, N., De Wit, M.J. 1997. The Thabazimbi-Murchison lineament of the Kaapvaal Craton, South Africa: 2700 ma of episodic deformation. Journal of the Geological Society of London, vol. 154, pp. 93–97.
Google Earth Pro. (2015). Version 7.1.5.1557 (Software). Google Inc. https://www.google.com/earth/
Gutzmer, J., Beukes, N.J. 1998. Earliest laterites and possible evidence for terrestrial vegetation in Paleoproterozoic. Geology, vol. 26, pp. 263–266.
Lorig, L.J., Pierce, M.E. 2000. Methodology and Guidelines for Numerical Modelling of Undercut and Cave Mines. Proceedings of MassMin 2000, Brisbane, Australia, 2000.
Poujol, M., Robb, L.J., Anhaeusser, C.R., Gericke, B. 2003. A review of the geochronological constraints on the evolution of the Kaapvaal Craton, South Africa: Precambrian Research, vol. 127, pp. 181–213, doi: 10.1016/S0301-9268(03)00187-6.
Rajesh, H.M., Chisonga, B.C., Shindoa, K., Beukes, N.J., Armstrong, R.A. 2013. Petrographic, geochemical and SHRIMP U–Pb titanite age characterization of the Thabazimbi mafic sills: extended time frame and a unifying petrogenetic model for the Bushveld Large Igneous Province. Precambrian Research vol. 230, pp. 79–102.
Van Niekerk, C.B. 1962. The age of the Gemspost dyke from the Venterspost gold mine. Trans. Geol. Soc. S. Afr. vol. 65, pp. 105–111.
Zeh, A., Gerdes, A., Heubeck, C. 2013. U–Pb and Hf isotope data of detrital zircons from the Barberton Greenstone Belt: constraints on provenance and Archaean crustal evolution. Journal of the Geological Society, 2013, vol. 170; pp. 215–223. u

19-20 NOVEMBER 2025 — CONFERENCE
NOVEMBER
—


We are excited to announce the 2025 MineSafe Conference and Industry Awards Day a key event dedicated to enhancing safety, health, and environmental practices within the mining and metallurgical industry. This conference will serve as a vital platform for knowledge-sharing and idea exchange among key stakeholders, including mining companies, the Department of Mineral Resources and Energy (DMRE), the Minerals Council South Africa, labour unions, and health and safety practitioners at all levels in the minerals industry. The Industry Awards Day on 21 November 2025, serves as a platform to recognise individuals and organisations who achieve and portray high standards of safety, health and sustainability practices.
Promoting Learning: Facilitating the exchange of experiences and best practices to enhance safety, health, and environmental standards in the mining and metallurgical sector.
Addressing Safety, Health, and Environment: Discussing critical safety and health concerns for employees, contractors, and local communities while emphasising sustainable environmental practices.
Enhancing Relationships with Local Communities: Addressing the environmental, social, and economic impacts of mining operations to foster stronger community engagement.
Zero Harm Approach: Promoting a commitment to a workplace free from injuries and accidents, reinforcing the industry’s dedication to safety.
Value-Based Approach: Encouraging a culture where health and safety go beyond compliance and become core organisational values.
Tackling Industry Challenges: Exploring solutions to pressing industry issues such as logistics, energy consumption, and workforce safety. By bringing together a diverse group of stakeholders, this conference aims to drive meaningful collaboration


and collective action towards a safer, healthier, and more sustainable future for the mining and metallurgical industry.
Join us as we work together towards Safe Mines, Healthy Lives, and Sustainable Futures!
Sponsorship opportunities are available. Companies wishing To partner on this event should contact the Conference Coordinator.
The conference should be of value to:
• Safety practitioners
• Mine management
• Mine health and safety officials
• Engineering managers
• Underground production supervisors
• Surface production supervisors
• Environmental scientists
• Minimizing of waste
• Operations manager
• Processing manager
• Contractors (mining)
• Including mining consultants, suppliers and manufacturers
• Education and training
• Energy solving projects
• Water solving projects
• Unions
• Academics and students
• DMRE
• Occupational health practitioners
Call for papers on the topics of safety, health and environment
Prospective authors are invited to submit titles and abstracts of their presentations in English and not longer than 500 words. Abstracts should be submitted to:
For

Affiliation:
1Dokuz Eylul University, Graduate School of Natural and Applied Sciences, Geological Engineering Department, Turkey
2Geological Engineering Department, Engineering Faculty, Dokuz Eylul University, Tınaztepe Campus, Turkey
Correspondence to: E. Kalhan
Email: e.kalhan@ogr.deu.edu.tr
Dates:
Received: 20 Nov. 2024
Revised: 11 Jun. 2025
Accepted: 15 Jun. 2025
Published: August 2025
How to cite:
Kalhan, E., Kincal, C. 2025. Slope stability evaluation of Gneiss rock slopes using slope mass rating (SMR) and QSlope. Journal of the Southern African Institute of Mining and Metallurgy, vol. 125, no. 8, pp. 437–452
DOI ID:
https://doi.org/10.17159/2411-9717/3606/2025
ORCiD:
E. Kalhan
http://orcid.org/0000-0001-6385-4968
C. Kincal
http://orcid.org/0000-0002-3279-4170
by E. Kalhan1, C. Kincal2
Abstract
One of the biggest problems in open pit mining is slope stability. The avoidance of slope stability problems depends on a comprehensive assessment of environmental and operational factors such as geology, climate, and mining activities. In the light of these considerations, slope geometries should be determined in accordance with engineering principles. In this research, the slope stability of rock slopes in a mine opened in a gneiss geological unit has been studied. Production activities were ceased in 2019 due to the slope movements in the eastern part of the quarry. In order to safely continue the production, field works were primarily carried out. To assess slope stability, detailed discontinuity surveys were carried out on bench faces. Subsequently, kinematic and numerical analyses were employed to identify geometries that are expected to maintain stability under the prevailing geological structures and environmental constraints. Engineering geological studies such as scanline measurements in steps and investigation of potential failure mechanisms by kinematic analysis technique were carried out. Small module reactor and Q-slope rock mass classification systems were used to evaluate slope stability. Based on these classification systems potential unstable rock slopes were identified and thematic maps were created using geographic information systems. The most suitable slope geometries are suggested for these slopes. In addition, the improvement methods suggested by the rock mass classification systems were proposed for these slopes.
Keywords
gneiss, Q-slope, slope mass rating (SMR), rock mass classification systems, slope stability, open pit mine
Introduction
Although there are many definitions of slope it can be generally defined as "the mass that makes a certain angle with the Earth's face" (Cernica, 1995; Das, 1994). Slope failures usually cause great loss of property and lives. Therefore, engineers have to determine and evaluate the stability of slopes (Coduto, 1999).
Mass movements dominantly occur as a result of gravitational forces acting on slope. However, there may be one or more reasons that accelerate the occurrence of these movements. These can be divided into internal and external causes. External causes include "excavations on the toe of the slope changing the angle of the slope, removing the overburden of the slope and facilitating the entry of surface waters into the slope", while internal causes include "increase in pore water pressure (u), decrease in cohesion of the slope material and decrease in the internal friction angle" (Kılıç, 2005).
For safe slope design geological conditions should be considered. Therefore, different slope designs around the mine may be required. It is the determination of the maximum slope height and slope angle planned for rock slopes. In the first stage of design, there is a balance between slope stability and economy. It means that the volume of rock required to be excavated is less and steeper slopes have a lower cost than slopes with less slopes (Hoek, Bray, 2004).
Rock mass classification has become extremely important in engineering projects. It is a useful tool as it saves time and provides detailed information. For this purpose, Terzaghi (1946) presented the first empirical classification system developed. As a result of this system and subsequent studies, these empirical systems have been continuously improved by Deere et al., (1966, 1970), who developed a classification system based on the principle of evaluating the main discontinuity features in the rock mass, known as the rock quality designation (RQD), and improved this system in their forward studies (Deere, 1989). Rock mass rating (RMR) and Q-system can be considered as the backbone of rock mass
classification systems (Barton et al., 1974; Bieniawski, 1973; Tomás et al., 2012; Chen et al., 2017). However, there are some limitations in using these classification systems for slopes. Both classification systems have many shortcomings as they only consider the rock mass and related geological factors. In general, both systems make a classification by evaluating only geological conditions (Pantelidis, 2009; Paul et al., 2012; Jhanwar, 2012). The slope mass rating (SMR) classification is based on the RMR system and takes into account both the geological conditions in the rock mass and the geometrical relationship between the slope and discontinuities. Romana (1985) emphasised that besides these relationships, the method of production is also important in slope stability and should be taken into account. If kinematic failure is observed on a slope, SMR can be applied on these slopes (Basahel, Mitri, 2017). Many studies have been carried out for this purpose. Riquelme (2016) used this system in different scenarios. These studies show that SMR provides highly reliable results in predicting failure. However, he stated the main advantages of using the SMR index calculation technique and stated that this approach can be used on a large scale in engineering projects that may develop in the coming years (Riquelme, Tomás, 2016). Myat and Aung (2022) studied the area between Kywedatson and Wetphyuye, in the Mandalay Region of Myanmar, which consists of different sedimentary, igneous and metamorphic rocks. Based on the SMR results, they divided the road slopes into (a) very low hazard zone, (b) low hazard zone, (c) medium hazard zone and, (d) high hazard zone in terms of landslides. They identified 29 rockfalls out of 54 areas and predicted that the failures can be reduced by the improvement methods proposed according to the SMR system.
Siddique (2015) conducted studies in the Himalayan region, which is a very active region, to determine safe areas and to determine their vulnerability to sliding. According to the results of the study, it was stated that the SMR values, which vary in different ranges, are in the stable class and/or some block failures may occur. Ietto (2018) conducted a study to reveal the engineering characteristics of the weathering profiles of granitoid rocks located on the southern edge of the Capo Vaticano cape, in the south-central part of the Calabria-Peloritani Arc. According to the SMR system, working slopes are classified as completely unstable, unstable, partially stable, and stable. By determining plane failure, toppling failure, and wedge type failure in the examined slopes, the comparison between the potential and actual stability conditions of the examined slopes clearly demonstrated a good agreement. Sandria (2023) applied SMR at the inlet and outlet of the Dolok Dam diversion tunnel and successfully identified slope failures and/or slides. Jordá-Bordehore (2017) used slopes found in mining and construction activities for the Q-slope classification. He determined the stability of slopes below 30 m, such as slate, granite, and limestone, located in the Guadarrama mountain range north of Madrid, Spain. It has been shown that the obtained results can be used in different engineering projects and have been successfully applied in back analysis. Ravoshti (2018) used the Q-slope classification system to investigate the stability of jointed rock slopes in the Bonab-Malekan highway project. Along the route, 10 different slopes were determined for slope geometries to be used in future projects. According to the results of the study conducted on the slopes examined based on the Q-slope principle, 5 slopes were determined as partially unstable, 4 slopes as stable and 1 slope as unstable. Q-slope, another classification system, was tried to establish a correlational relationship between Q-slope and the stability of the slopes, as a result of the studies carried out by
Azarafza (2020) on some sedimentary rock slopes in the Iranian region. For this purpose, supervised learning models were used to obtain a correlation with the Q-slope studies for 200 slopes representing the tectonic structures of Iran in 10 regions such as Zagros, Alborz, and the Southeast Mountains. According to his results, he showed that the distribution for the instability class is limited to two linear cases called Line U (upper limit) and Line B (lower limit).
In this study, slopes of an open pit mine opened in gneiss is considered for the reasons stated in the aforementioned. There are many different mining enterprises, large and small, in this area of study and slope movements are common in this area. Field investigations, engineering geological works, and rock slope stability assessments were carried out within the scope of this study in order to stabilise the rock slopes opened in gneiss and to continue operations. The stability of the slopes was determined with the measurements made in the summer months of 2020. With the help of these studies, the determination of unstable slopes and the improvement and/or reinforcement processes of these slopes were determined in order to continue the production in a safe and efficient way. However, the steepest slope angles that can remain stable without any reinforcement and improvement are revealed. In addition, a digitising process was carried out using geographic information systems in order to evaluate these slopes, so as to identify the slopes that may experience failure and to better understand the classification systems that were used.
The study area is located in the Menderes Massif, which constitutes one of the main tectonic zones of Anatolides that crop out in Western Anatolia (Graciansky, 1965). There are eighteen albite open pits of different sizes in this region. The studied mine is one of the most famous albite mining sites in the region (Kıncal, 2014). Leucocratic orthogneisses rich in terms of tourmaline were exposed in the study area. Two types of tourmaline-rich leucocratic orthogneisses were detected in the study area. The first group consists of orthogneisses derived from granoblastic textured coarse granites. The foliation planes of these rocks are defined by the parallel sequence of muscovites. This condition type consists of medium-grained, albite-rich leucocratic orthogneisses (Candan et al., 2005). All of the geological units in the open pit albite mine have been deformed by a shear zone. The Na-feldspar ore-bearing zone with mineralogical composition was developed along the shear zone. The dip directions of foliation planes in orthogneisses are almost perpendicular to this zone. Orthogneisses are characterised by their massive structures. It is seen that the mine site contains gneiss as ore body and wall rock (Figure 1). The direction of the ore deposit is N27E/55-60SE with an approximate length of 660 m developing along the shear zone in the mine. Metaquartzite and rutile lenses are observed. These lenses tend in the NE-SW direction.
Rock slopes often experience failure along existing geological structures. Therefore, most slope problems require consideration of geometric relationships between discontinuity planes, slope, and related force vectors. One of the most important requirements for rock slopes is to determine the correct failure mechanism (Bell, 1992). Within the scope of this study, scan-line works proposed by ISRM (2007) was conducted at 119 different observation points in the eastern part of the open pit mine opened in gneisses (Figure 1).

A total of 1613 discontinuity measurements were recorded from these observation points and the data (such as orientation of discontinuity spacing, persistence, roughness, etc.) were evaluated according to ISRM (2007) standards. The orientations of the discontinuity planes were transferred to the stereographic projection with Dips 7.016 software (RocScience, 2019) and the type of failures at each observation point was evaluated kinematically and expressed as a percentage in Table 1. In addition, the major discontinuity sets in the open pit mine slopes were determined by
using the pole concentration points of all discontinuities taken from the eastern part of the mine (Figure 2). In addition, the classes and properties of the dominant discontinuity sets recommended by ISRM (2007) are given in Table 2.
In addition, the Schmidt hammer test was conducted to measure the uniaxial compressive strength (UCS) of discontinuity planes proposed by Barton and Choubey (1973). Experiments were carried out with an L-type Schmidt hammer at a total of 119 different points. As a result of the laboratory studies conducted by
Table 1
Type of failures kinematically at observation points


*: (-) Non-structurally controlled (highly weathered slope), T: Toppling, W: Wedge, P: Planar, S.C.: Structurally controlled
Kadakçı and Koca (2014) belonging to the same region, the unit weight values of orthogneisses were used (Table 3). UCS values were calculated by using the following Equation 1 suggested by Barton and Choubey (1977). Orthogneiss rock slopes were determined to be ‘moderately strong’ according to the Anon (1977) classification (Table 4).
LogJCS = 0.00088γR + 1.01 [1]
Where:
JCS: Strength of the discontinuity surface (MPa)
γ: Unit volume weight (kN/m3)
R: Schmidt rebound value.
Slope stability assessments
Rock mass classifications form the backbone of the experimental design approach and are widely used in rock engineering (Singh, Goel, 2011). Rock mass classification systems are very helpful in the front-end of a project where very little data is available (Hoek, 2007). RMR and Q-system are the most widely used among rock mass classification systems in rock mechanics and engineering by engineering geologists, mining geologists, and consultants (Morales, 2017). However, it is almost impossible to apply the correction factor for slopes due to the wide range of correction factors and the lack of definition factors (Romana et al., 2015). However, Q-system is also not applicable for slopes. Due to this deficiency, the Q-slope system for slopes was developed by Barton and Bar (2015). In this study, two of the rock mass classification systems discussed in the aforementioned were used to evaluate the slope stability of the open pit mine. These are SMR and Q-slope systems. In order to calculate the %RQD used as input parameter for both SMR and Q-slope classification system, Equation 2 proposed by Priest and Hudson (1976) was used.

RQD%=100e-0.1λ(0.1λ+1)
Where λ is the number of fractures in a metre. For the interpretation and evaluation of rock mass classification systems, the geographic information system software was used, and the rock classification rating was digitised by IDW method. In rock mass classification systems, which are carried out on this research, parameters such as slope geometry, attribute of discontinuities that causes failure, discontinuity spacing, roughness, friction angle, and filling material were taken into account for analyses.
SMR is a geotechnical classification system developed by Romana (1985) for rock slopes and obtained from basic RMR. It is calculated by adding a few adjustment factors to the basic RMR system. These adjustment factors are directly related to the relationship between the joints in the rock slope and the slope geometry. However, it also takes into account the excavation or blasting method. The SMR score calculated by subtracting from the RMR system is obtained with the given Equation 3.
SMR = RMRbasic + (F1xF2xF3) +F4) [3]
Where rock mass rating (RMR) is a system developed by Bieniawski (1973, 1989) to evaluate the quality of rock masses in engineering projects. The RMR system is derived from the rock mass classification framework introduced by Bieniawski (1989), who formulated five principal parameters to systematically evaluate the discontinuity characteristics of rock masses. These parameters are the UCS of intact rock, percentage RQD spacing between discontinuities, and the condition of discontinuities and groundwater. The fourth parameter of RMR was detailed by
Table 2
Major discontinuity sets and their classification according to ISRM (2007)
Rock
Orientation of discontinuity
Description Medium persistence Low persistence Low persistence Medium persistence High persistence Roughness Description Discontinuity surfaces are generally rough undulating (IV. Class)
Highest-lowest Rebound (r) 10-56
Wall strength
Description
Aperture
Weak rock-Medium strong rock
0.25-0.5 mm: Partly open/closed feature
Description and/or
0.5-2.5 mm: Open/gapped feature
Filling Description: Geometry: wall roughness. Filling type: weathering grade
Seepage Seepage rating III
Description:
The discontinuity is dry but shows evidence of water flow. i.e., rust straining. etc. (Unfilled discontinuities)
D/DD: Dip / Dip Direction. SD: Standard Deviation
Table 3
Test results of orthogneiss mass (Kadakçı, Koca 2014)
Physico-mechanical
n : Test number
Bieniawski (1989) in order to define the discontinuity conditions of rock mass. The RMR system takes values ranging from 0 to 100 (Bieniawski, 1973).
Other parameters given in Equation 3 can be explained as follows. F1 is a parameter related to the dip direction of the discontinuity (or the plunge direction of the intersection line of two planes (ai)) and slope in the rock mass, αj and αs, respectively (Anbalagan et al., 1992). F2 is explained as a parameter related to the dip of the discontinuity (βj) (or the angle of plunge of two
Table 4
discontinuities (βi) in the case of a wedge) that causes failure in the rock slope. This parameter is taken as 1.0 for toppling type failure (Romana, 1985). Both F1 and F2 can be calculated from the table as well as approximately calculated in Equation 4 and 5 developed by Romana (1993) as an alternative.
F1 = (1-sin | A|)2 [4]
F2 = tan2 B [5]
Another parameter, F3 is a parameter dependent on the dips relationships between the joints and the slope surface, in fact, which the adjustment factor range between 0 and -60 developed by Bieniawski (Romana, 1993), as illustrated in Table 5. F4, which is the final correction factor, is an adjustment factor depending on the method of excavation or blasting in the rock slope (Romana, 1985), as depicted in Table 6. In addition to planar and toppling failure modes, wedge type failure was also described by Anbalagan et al. (1992), added and taken into account for use in the SMR system. In
Average UCS value obtained from Schmidt hammer test results of discontinuity planes at observation points
Table 5
Adjustment ratings for F1, F2, and F3 (Anbalagan et al., 1992)
Type
P T W A = |αj-αs| |αj-αs-180| |αi-αs|
P W B = βj βi
P W T C = βj-βs βi -βs βj +βs
P/T/W
Failure: P planar; W wedge; T toppling. Dip direction: αj discontinuity; αs slope. Dip: βj discontinuity; βs: slope
Table 6
Adjustment factor F4 for the method of excavation (Romana, 1985)
Excavation method (F4)
Presplitting +10 Blasting
this article, three types of failure types namely planar, wedge, and toppling were used, as developed by Anbalagan et al. (1992). Romana (1985) defined different classes for rock slopes from very bad to very good according to the SMR score. After SMR scoring, definitions such as slope stability condition, failure type, and failure probability can be made. It was developed to guide the front end of planning for rock slope (Table 7). Also depicted is the improvement guide by Romana (2003) according to the class described (Figure 3).
Q-slope
Q-slope is a geotechnical classification system developed by Barton and Bar (2015) for engineering studies such as slope and road cuts that use six different parameters, such as RQD, Jn, Jr, Ja, Jw, and SRF as in the Q-system. However, unlike the Q-system, several parameters have been updated, and they proposed the following Equation 6 to estimate the Q-slope value (Barton, Bar, 2017).
Table 7
Description of SMR classes (Romana, 1985)

The first four parameters in Equation 6 are as in Q-system (Barton et. al., 1974) and remained unchanged. These are: rock quality definition, RQD (Deere, 1963), joint set number (Jn), joint roughness number (Jr), and joint alteration number (Ja) (Barton, Bar, 2017). RQD / Jn represents the block size. Jr / Ja is known as a friction resistance pair and can be applied to joints on either side of the wedge as needed (Barton, 2018). However, the adjustment factor for discontinuities in the rock slopes, which is called the O-factor, has been developed by Barton and Bar (2015) and it is not available in the Q-system. Another parameter is the environmental and geological condition number, which is used in this system as Jwice. This is different from Q-system in that the slopes are exposed to external factors (such as climate, wind, and freezing) for a very long time and Q-slope has also gained a new structure (Barton, Bar, 2015). Due to the prolonged exposure of slopes to external factors, their stability is strongly influenced by environmental and geological conditions such as climate, wind, and freeze-thaw cycles. Accordingly, slope stability is evaluated differently from the conventional Q-system, leading to the development of the Q-slope classification with a revised structure (Barton, Bar, 2015). In case of slope reinforcement or drainage measures, adjustment factors are also included, and calculations of these adjustments are given also by Barton and Bar (2015). SRF slope is the stress reduction factor for the slope. SRFa has been developed to determine the physical conditions of the slope surface and can be scored from the suggested

table by Barton (2015). SRFb is similarly used in the Q-index and is a parameter developed for the stress-strength on the slope. SRFb is a very considerable parameter for highly weathering, weak, and low strength materials in rock slope. However, it becomes more important as the slope and height of the slope increase (Barton, Bar, 2017). SRFc was developed for planes of weakness that adversely affect rock slopes in many aspects. SRFslope uses the maximum value between SRFa, SRFb and SRFc. The tables suggested by Barton and Bar (2015) enable the estimation of SRFa, SRFb, and SRFc values, respectively. In other words, Jwice / SRFslope is external factors and stress. The shear resistance, τ, can be approximated using Equation 7.

However, thanks to an equation developed by Barton and Bar (2015), the steepest slope angle that can remain stable without reinforcement or improvement can be readily calculated using Equation 8 and interpreted from Figure 4.

Equation 8 matches the central data for dip angles between 35 and 85. For different Q-slope grades, the angles shown in the following can be considered as fixed (Barton, Bar, 2015).
Q-slope = 10 - slope angle 85°.
Q-slope = 1 - slope angle 65°.
Q-slope = 0.1 - slope angle 45°.
Q-slope = 0.01 - slope angle 25°.
Case study
In this study, an open pit mine opened in gneiss was chosen as the study site. Albite production has been carried out in this open pit mine since 2004. It was determined by the total station measurements in the area where the eastern slopes move during heavy rainy periods in 2019. From the moment observed, production was completely stopped to prevent any loss of property or life. In addition to the use of SMR and Q-slope systems to evaluate slope stability in this mine, the studies identified unstable slopes in the mine operation and recommended necessary improvement (such as re-excavation or surface drainage) and/or reinforcement works.
Application of slope mass rating (SMR)
In order to use slope mass rating (SMR) classification, it is

necessary to know the failure mechanism in the rock slope. The discontinuities taken from the 119 slopes in the eastern part of the open pit were transferred to the Dips V.7.016 software (2019) and the potential failure mechanism at each observation point was determined (Table I). Types of failures were detected in 76 of 119 rock slopes at the observation points. It was not included in the SMR system due to the loss of rock feature because of weathering in 43 observation points. After determining the failure mechanisms, rock mass rating (RMR) rock mass classification was conducted using all discontinuities data. The first five parameters used as input parameters in RMR classification were obtained from scanline measurements, which is suggested by International Society for Rock Mechanics (ISMR) (2007). The RMR inputs and their scores of slopes are presented in Table 8 to serve as an example, but the RMR scoring was also applied at 76 observation points.
After the types of failures and RMR scores of 76 observation points were calculated, the input parameters required for SMR calculation were also collected from the field. In this process, joint and / or joint set and slope dip angle / dip direction measurements were obtained for each slope. In other words, each slope has been evaluated separately. SMR scoring, failure mechanisms, and class of the mentioned slopes are presented in Table 9.
In the study area, 4 different SMR classes were identified, including 1 very bad, 22 bad, 41 normal, and 12 good. The SMR value that falls within the very good range was not detected on any observation point. The very bad rock slope is the slope number 119 (Table 9). Although these studies were carried out in the summer, the algae and rust traces observed on the discontinuity planes at
8
P: persistence, A: aperture, R: roughness, I: infilling, W: weathering, GW: ground water
the 119th observation point is an indication that there has been water outflow on the slope during rainy periods. This caused the 119th observation location to be classified as "very bad" due to the separating effect of water. However, the reason why none of the slopes are included in the “very good” class can be interpreted as the fact that the region is under tectonic regime and again, the groundwater in the region is at very high levels and the weathering effect is highly effective. Kinematically major type of failure mechanism in rock slopes is wedge-type of failure with 58% (total number of 44 location) in previous sections. Based on Romana’s (1985) classification system, the third class comprises 54% of the slopes studied, representing a total of 41 locations. This ratio also belongs to the class most observed at observation points. In this classification system the possible failure modes specified in Figure 5, namely "planar or big wedge" are kinematically compatible with the major failure mechanism in the open pit mine. This harmony can be easily observed on the slope number 32 (Figure 5). SMR class in the 32nd slope is III and its kinematic failure mechanism is wedge. As seen in the Figure 5, the failure mechanism determined by Romana (1985) and the failure mechanism determined kinematically of a rock slope of SMR class III are similar. However, it can be observed in the stereographic projection that there may be a few planar failures at the same locations.
RMR scores in the rock slopes studied are between 42 and 73. SMR scores are between 14 and 70. In other words, it is seen that when the SMR decreases the RMR score decreases. As an exception, SMR score is higher than RMR score in 18 slopes (Figure 6).
As can be seen from the graph in Figure 6, the slopes numbered 18, 21, 31, 33, 39, 44, 48, 50, 51, 52, 57, 58, 63, 70, 71, 73, 89, and 112 are more than SMR points. This is because it can be said that the relationship between discontinuity and slope angles in the SMR system is more favourable than other rock slopes. This caused the SMR to be higher than RMR. In order to better interpret the SMR and RMR scoring made in the open pit and to evaluate the scores in the individual slope scale, the scoring has been depicted by using the IDW method via QGIS (3.30) software (Figure 7).
As can be seen in the figures, it is clearly observed that the adjustment factors in SMR scoring decrease the RMR score.
According to the RMR scores given in Table 9, in any of the 76 rock slopes, it was not classified as "very bad rock" and "bad rock". In the classifications made on 76 rock slopes in the SMR class, one of them was classified as very bad and 22 of them were bad. To be expressed as a percentage, the sum of slopes included in the very bad and bad rock class was determined as 30% in the SMR classification system, while this rate is 0% in the RMR system. Again, in the SMR system, the rock slope in the normal class (III) is 54%, while this
is
Table 9
L: observation point of slopes, F.T. = failure type
64% in the RMR class. The most significant percentage difference belonging to the same rock slopes was determined in the rock class belonging to the "good" class. While the rate of slopes in the "good rock (II)" class in the SMR system is 16%, this rate is calculated as more than twice in the RMR system, that being 36%.
In addition to the SMR classification system, Romana (2003) has also proposed some improvement and support systems. Each of the 76 rock slopes studied on this figure developed by Romana (2003) is shown separately (Figure 8). As a result of the study on 76 slopes, different improvement and support methods were
determined. There are no slopes belonging to the place shown with white background. In addition, details regarding the scores of the slopes are indicated in the legend. As can be seen from Figure 8, in the improvement diagramme made according to the SMR score, all slopes can suggest one or more improvement or strengthening. As previously stated, rock slopes classified as third class are densely distributed, as illustrated in (Figure 8).
For example, slope number 46 has a score of 51.1. According to the improvements suggested by Romana (1985), many different improvements can be made on this slope such as shotcrete, bolt

anchors, and toe ditch. Another example can be given to slopes 119, 82, 98, and 110. Improvement works for these slopes should be different than others. Improvement works such as re-excavation or surface drainage should be done on these slopes. The different comments that can be made for other slopes can be easily examined in the diagramme developed by Romana (2003). It should not be forgotten that these reinforcement or support systems are only a guide. Different systems can be developed according to the production activity or the expenses of the contractor company.
Q-slope is another classification system used in this article to better examine and evaluate the slope stability. As mentioned in the slope stability assessment section, it is an empirical system developed by Barton and Bar (2015) in order to evaluate the rock
slopes with different parameters and to determine the steepest slope angle that can remain stable without any reinforcement at the first stage of the project (Barton, Bar, 2017). Within the scope of this study, the slopes at 76 observation points in the open pit mine were scored based on the tables and equations suggested by Barton and Bar (2017). In the mining operation, all slopes were realised in orthogneiss mass, and all of the slopes have a height of less than 30 metres (average heights of the slopes of 10–12 metres). This example, inspired by Barton and Bar (2015), copies the existing information about this system. This illustrates the proper implementation of the technique at an albite mine located in Turkey. RQD value, which is one of the first 6 parameters of the formula developed specifically for this system, is a parameter used in the RMR system, which is necessary for calculating SMR; the values were utilised based on the calculations performed using the


RMR system outlined in the preceding section. Another parameter of the formula, Jn (number of discontinuous sets) was determined as a result of scanline measurements. It should be noted here that the measurements taken for each slope are unique and have been considered independently of other slopes. Jr/Ja is evaluated differently for each slope outcrop. Here, it was scored for the most unfavourable joint set as suggested for the O-factor developed by Barton and Bar (2015). In wedge-type failures, the secondary joint set that causes failure was given appropriate scores, also developed
by Barton and Bar (2015). In order to calculate Jwice, which is another parameter developed differently from the Q-system, the amount of precipitation and temperature that the region experiences according to months by using the local meteorological resources of the country.
Based on these data, the 'wet environment' class was selected, which is one of the categories recommended by Barton and Bar (2015). The reason for this is that as can be seen from the data, the region receives heavy rainfall, especially in winter, and the
Table 10
Q-slope values of slopes at observation locations
average temperature is low during these rainy periods. During the investigations carried out in the summer periods, it was determined that the slope steps were stable (production stopped), but because of the characteristics of the discontinuity of planes on the slopes (orientation, roughness, spacing, etc.) it was found to be "incompetent" rock. In other words, for this study, the Jwice value of each slope was determined as 0.6. In addition, when there was no drainage and / or reinforcement system in the proposed graph in any bench of the pit slopes, it was not multiplied by any coefficient.
Observation points for the SRFa parameter were evaluated separately. As a result of these observations, it was thought that there were large block falls on the slopes due to blasting and there was a rock slope sensitive to weathering. Considering these situations, the B description class suggested in the scoring system for the rock slope is given, namely “Loose blocks, signs of tension cracks and joint shearing, susceptibility to weathering, severe disturbance from blasting”. One of the parameters required to define the SRFb parameter is UCS, and this parameter was determined
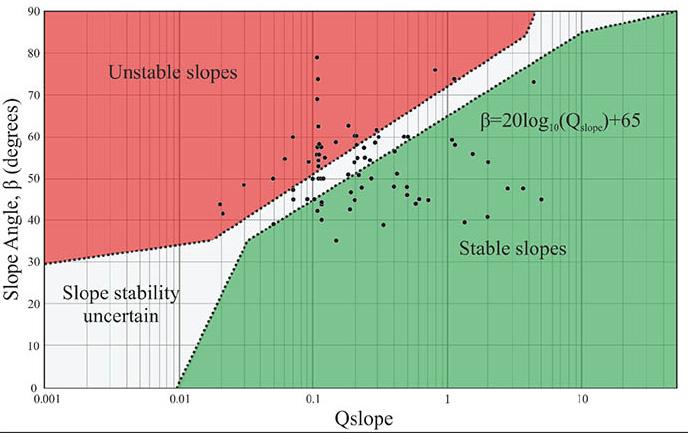
empirically by using an L-type Schmidt hammer in the field. The second parameter is the maximum principal stress. This parameter is calculated by RocLab V.0.1 software by following the generalised Hoek and Brown failure criterion (Hoek, Brown, 1997) for jointed rock mass (RocScience, 2007). As a result of these operations, σc / σ1 value was calculated and SRFb score was found. The SRFc value, which is the last denominator of the system, was again realised by defining the main discontinuity sets from the observation points. A different SRFc score was found for each slope. According to Barton and Bar (2015), the highest value of SRFa, b, and c, values were included in the calculation. At the end of all these processes, after the necessary calculations were made at 76 observation points, the Q-slope score of each slope was revealed (Tabel 10).
After the Q-slope scores were calculated, they were placed in the semi-logarithmic table proposed by Barton and Bar (2015) ( Figure 9). All rock slopes are indicated by black points.
According to this classification system, 31 stable, 27 unstable, and 18 uncertain classes were determined as a result of the analyses performed on a total of 76 slopes. The proportional values of these classes were determined as 41%, 35%, and 24%, respectively.
Barton and Bar (2015) stated that, in addition to the diagramme in Figure 9, the steepest slope angle that can remain stable without reinforcement and a support system can be found with a simple Equation 9.

It is possible to classify the rock slope by comparing the current slope angles of the aforementioned slopes and the steepest slope angles produced by the formula developed by Barton and Bar (2015). In the analysis made within the scope of this study, the steepest slope angle was determined by both methods (Table 11).
According to the results of Q-slope on 76 slopes, 18 uncertain classes were determined. These slopes can become stable in the classification system empirically made even by only reducing the slope angles by a few degrees. To give an example, the slope number 51 is included in the stable class only by reducing the angle with a difference of 0.43 degrees. In other words, the slope can become stable in relation to the material properties with the necessary slope angle reduction process that can be made on slopes. However, the openings of several slopes that appear to be ‘stable’ in the table were reduced more than necessary. This increases the cost of
Stable: S, UnCertain: UnC, Unstable:UnS

excavation and causes loss of time. Some of the mentioned slopes can be given as 18, 31, 48, 56, 57, and 63. Classes were depicted by the IDW method using a QGIS program to show the spread of Q-slope classification in the field and slope scale. During this mapping process, the classification developed by Barton and Bar (2015) was used. Since the program uses the IDW method only as a numerical value, stable slopes are given 1, uncertain slopes 0, and unstable slopes -1 values. Following the coding process, its spatial distribution was illustrated on the mining area located on a slope of 76°, using the IDW interpolation method (Figure 10).
The research area is located within the Menderes Massif, an important tectonic zone of the Anatolides prominent in Western Anatolia (Graciansky, 1965). This study used the scan-line technique advocated by ISRM (2007) and covered 119 observation points in the eastern part of the albite open pit mine that opened in gneiss (Figure 1). A total of 1613 discontinuity measurements were carried out at these points and the data, including discontinuity orientation, spacing, persistence and roughness, were evaluated according to ISRM (2007) guidelines. As a result, the dominant failure type detected was wedge (58%).
In light of the kinematic failure potential observed in this mining region, two rock mass classification systems have been used: SMR and Q-slope. For SMR classification, kinematic failure type has to be evident. Four SMR classes were identified in the study area: 1 very poor, 22 poor, 41 fair, and 12 good. No slopes fell into the ‘very good’ range due to the tectonic activity of the region and high groundwater levels that tend to exacerbate the effects of weathering. The majority of the observed failures (58%) were wedge failures.
In the 76 slopes examined, various improvement and support methods were suggested by Romana (1985). These methods range from shotcrete and bolt anchors to re-excavation and surface drainage, depending on slope characteristics. Additionally, slopes at 76 observation points were scored using Barton and Bar (2017) tables and equations and the relevant Q-slope scores were revealed (Table 10). According to this classification system, 31 slopes were evaluated as stable, 27 slopes as unstable, and 18 slopes as uncertain. The rates of these classes are 41%, 35%, and 24%, respectively. In particular, slope 18, which was initially classified as uncertain, was able to achieve stability with slight angle adjustments, as was the case for slope 51, which was classified as stable with an angle reduction of only 0.43 degrees.
According to field observations and classification systems, many slopes in both systems can be defined as ‘unstable’. Examples of this are presented in Table 12. As a result of the analysis, it is clearly observed that the slopes numbered 29, 34, 41, 74, 81, 82, 82, 85, 88, 90, 96, 98, 98, 108, 110, 114, 117, and 119 are observed as “unstable” in both classification systems. The reason for this is that these slopes are extremely altered (HW) and the fracture-cracks are extremely intense. It was observed that UCS and %RQD values were low on the slope surfaces and therefore the slopes were extremely unstable in both classification systems. On the other hand, some slopes were classified as ‘stable’ in the Q-slope system, while some slopes were classified as ‘unstable’ in the SMR. These slopes are observation points 11 and 59. The reason for this is that the ‘current slope angle’ value in the Q-slope classification system is considerably smaller than the ‘maximum slope angle’ value. Since this value is not observed in the SMR system, differences are observed in both classification systems. Besides, the opposite situation was also observed. In other words, some slopes classified as ‘unstable’ in the Q-slope were classified as ‘stable’ in the SMR. The slopes in question are slopes 44, 62, and 71. The reason for this is that the UCS and %RQD values are very high. Therefore, RMR and consequently, SMR values are high. However, since the slope angle is extremely steep, the class of the slopes is considered to be "unstable" in the Q-slope (Table 12).
As a result of this study on gneiss rock slope, it is thought that the use of both classification systems in terms of providing very practical and fast information in pre-stabilisation studies will guide future studies. It is expected to give more accurate results qualitatively due to the kinematic analysis for the use of the SMR system, followed by the use of the RMR classification system. In the next stage of the study, the ‘slopes with sliding potential’ observed in the region can be studied in more detail and the ‘factor of safety (FoS)’ can be calculated on these slopes by numerical analysis method, and by comparing the values calculated both numerically and kinematically, the studies can be continued with the safest and maximum efficiency.
Acknowledgment
The authors’ thank the two anonymous reviewers for their very constructive and valuable comments, which significantly led to the improvement of the paper. We would also like to express our gratitude to M.Sc Geological Engineering, Melikhan Karakas and PhD. Geological Engineering, Saffet Deniz Karagoz, who directly contributed to the studies carried out in the field.
Statements and declarations
Funding
The authors declare that no funds, grants, or other support were received during the preparation of this manuscript.
The authors have no relevant financial or non-financial interests to disclose. On behalf of all authors, the corresponding author states that there is no conflict of interest.
Author contributions
All authors contributed to the study conception and design. Material preparation, data collection and analyses were performed by Enes KALHAN, Cem KINCAL. The first draft of the manuscript was written by Enes KALHAN and all authors commented on previous versions of the manuscript. All authors read and approved the final manuscript. Also, the work in this manuscript was conducted from the first author’s Master Thesis.
Consent for publication
All authors mutually agreed to publish the work in this journal.
References
Anbalagan, R., Sharma, S., Raghuvanshi, T. K. 1992. Rock mass stability evaluation using modified SMR approach. In Proceedings of the 6th National Symposium on Rock Mechanics pp. 258.
Anon. 1977. The description of rock masses for engineering purposes. Quarterly Journal of Engineering Geology, vol. 10, pp. 43–52.
Azarafza, M. 2020. Application of the modified Q-slope classification system for sedimentary rock slope stability assessment in Iran. Engineering Geology, vol. 264, no. 105349. https://doi.org/10.1016/J.ENGGEO.2019.105349
Bar, N., Barton, N. 2017. The Q-slope method for rock slope engineering. Rock Mechanics and Rock Engineering, vol. 50, no. 12, pp. 3307–3322. https://doi.org/10.1007/S00603-017-1305-0
Barton, N., Bar, N. 2015. Introducing the Q-slope method and its intended use within civil and mining engineering projects. ISRM Regional Symposium Eurock 2015 and 64th Geomechanics ColloquiumAt: Salzburg
Barton, N., Choubey, V. 1977. The shear strength of rock joints in theory and practice. Rock Mechanics, vol. 10, no. 1–2, pp.1–54. https://doi.org/10.1007/BF01261801
Barton, N., Lien, R., Lunde, J. 1974. Engineering classification of rock masses for the design of tunnel support. Rock Mechanics, vol. 6, no. 4, pp. 189–236. https://doi.org/10.1007/BF01239496
Basahel, H., Mitri, H. 2017. Application of rock mass classification systems to rock slope stability assessment: A case study. Journal of Rock Mechanics and Geotechnical Engineering, vol. 9, no. 6, pp. 993–1009. https://doi.org/10.1016/J.JRMGE.2017.07.007
Bell, F.G. 2004. Engineering geology and construction. CRC Press. https://doi.org/10.1201/9781482264661
Bieniawski, Z.T. 1989. Engineering rock mass classifications: a complete manual for engineers and geologists in mining, civil, and petroleum engineering. John Wiley & Sons.
Branch, Z., Ravoshti, D.A., Hajiagha, L.F. 2018. Utilization of the Q-slope empirical classification system in jointed rock slopes: A case study for Bonab-Malekan highway. Journal of Geotechnical Geology, vol. 14, no. 2, pp. 193–196.
Candan, O., Çetinkaplan, M., Oberhänsli, R., Rimmelé, G., Akal, C. 2005. Alpine high-P/low-T metamorphism of the Afyon Zone and implications for the metamorphic evolution of Western Anatolia, Turkey. Lithos, vol. 84, no. 1–2, pp. 102–124. https://doi.org/10.1016/J.LITHOS.2005.02.005
Cernica, J.N. 1995. Geotechnical engineering: Soil mechanics Chichester. John Wiley and Sons Inc.
Coduto, D.P. 1999. Geotechnical engineering: Principles and practices Prentice-Hall Inc.
Das, B.M., Sobhan, K. 1994. Principles of geotechnical engineering (8th ed.). PWS Publishing Company.
Deere, D.U. 1964. Technical description of rock cores for engineering purposes. Rock Mechanics and Engineering Geology, no. 1, pp. 17–22.
Deere, D.U. 1989. Rock quality designation (RQD) after 20 years. U.S. Army Corps of Engineers Contract Report, vol. 89, no. 1.
Graciansky, P. 1965. Précisions sur le métamorphisme du massif de Menderes le long de sa bordure méridionale. Bulletin of the Mineral Research and Exploration Institute of Turkey, vol. 64, pp. 9–23.
Hoek, E. 2006. Rock mass properties, In Practical rock engineering, pp. 1–47. University of Toronto Press.
Hoek, E., Bray, J.W. 2004. Rock slope engineering. London: Institution of Mining and Metallurgy.
Hoek, E., Brown, E.T. 1997. Practical estimates of rock mass strength. International Journal of Rock Mechanics and Mining Sciences, vol. 34, no. 8, pp. 1165–1186. https://doi.org/10.1016/S1365-1609(97)80069-X
Ietto, F., Perri, F., Cella, F. 2018. Weathering characterization for landslides modeling in granitoid rock masses of the Capo Vaticano promontory (Calabria, Italy). Landslides, vol. 15, no. 1, pp. 43–62. https://doi.org/10.1007/S10346-017-0860-5
International Society for Rock Mechanics (ISRM). 2007. The Complete ISRM Suggested Methods for Rock Characterization, Testing and Monitoring: 1974–2006. Suggested Methods Prepared by the Commission on Testing Methods; Ulusay, R., Hudson, J.A., Eds.; ISRM Kozan Ofset: Ankara, Turkey.
Jhanwar, J.C. 2012. A classification system for the slope stability assessment of opencast coal mines in central India. Rock Mechanics and Rock Engineering, vol. 45, no. 4, pp. 631–637. https://doi.org/10.1007/S00603-012-0223-4
Jordá-Bordehore, L. 2017. Application of Q slope to assess the stability of rock slopes in Madrid Province, Spain. Rock Mechanics and Rock Engineering, vol. 50, no. 7, pp. 1947–1957. https://doi.org/10.1007/S00603-017-1211-5
Kadakçı, T. K., Koca, M. Y. 2014. Açık ocak albit işletmesindeki kaya şevlerinin sonlu elemanlar yöntemi kullanılarak duraylılık değerlendirmesi. Jeoloji Mühendisliği Dergisi, vol. 38, no. 1, pp. 1–19.
Karagöz, S.D., Kıncal, C., Koca, M.Y. 2020. Investigation of the causes of an instability in an albite mine opened in menderes massif and monitoring slope movements before the failure employing robotic total station equipment. Journal of Geological Engineering. vol. 44, pp. 41–66. DOI 10.24232/jmd.740511
Kılıç, R. 2005. Kaya mekaniği ders notları, vol. 39, pp. 61–90. AÜFF Döner Sermaye İşletme Yayınları.
Kincal, C. 2014. Application of two new stereographic projection techniques to slope stability problems. International Journal of Rock Mechanics and Mining Sciences, vol. 66, pp. 136–150. https://doi.org/10.1016/J.IJRMMS.2014.01.006
Morales, M., Panthi, K. K., Botsialas, K. 2019. Slope stability assessment of an open pit mine using three-dimensional rock mass modeling. Bulletin of Engineering Geology and the Environment, vol. 78, no. 2, pp. 1249–1264. https://doi.org/10.1007/S10064-017-1175-4
Myat, A., Aung, D., New, H. 2022. Ground improvements for landslide prevention along the road between Kywedatson and Wetphyuye, Mandalay Region and Shan State, Myanmar (Doctoral dissertation). University of Yangon Research Journal, vol. 11.
Pantelidis, L. 2009. Rock slope stability assessment through rock mass classification systems. International Journal of Rock Mechanics and Mining Sciences, vol. 46, no. 2, pp. 315–325. https://doi.org/10.1016/J.IJRMMS.2008.06.003
Priest, S.D., Hudson, J.A. 1976. Discontinuity spacings in rock. International Journal of Rock Mechanics and Mining Sciences and Geomechanics Abstracts, vol. 13, no. 5, pp. 135–148. https://doi.org/10.1016/0148-9062(76)90818-4
Riquelme, A.J., Tomás, R., Abellán, A. 2016. Characterization of rock slopes through slope mass rating using 3D point clouds. International Journal of Rock Mechanics and Mining Sciences, vol. 84, pp. 165–176. https://doi.org/10.1016/J. IJRMMS.2015.12.008
Rocscience Inc. 2007. RocLab V.0.1: Rock mass strength analysis using the generalized Hoek-Brown failure criterion.
Rocscience Inc. 2019. Dips - 7.016: Graphical and statistical analysis of orientation data.
Romana, M. 1985. New adjustment ratings for application of Bieniawski classification to slopes. In Proceedings of international symposium on the role of rock mechanics, pp. 49–53. ISRM.
Romana, M.R. 1993. A geomechanical classification for slopes: Slope mass rating. In Comprehensive rock engineering, vol. 3, pp. 575–600). https://doi.org/10.1016/B978-0-08-0420660.50029-X
Romana, M., Tomás, R., Serón, J.B. 2015. Slope mass rating (SMR) geomechanics classification: Thirty years review. Rock Mechanics and Rock Engineering, vol. 50, no. 7, pp. 1947–1957. https://doi.org/10.1007/S00603-017-1211-5
Sandria, L.A., Indrawan, I.G., Hendrayana, H. 2023. Rock mass characterizations and kinematic analysis for construction design method of diversion tunnel of Dolok Dam, Central Java. E3S Web of Conferences, vol. 468, no. 02005. https://doi.org/10.1051/E3SCONF/202346802005
Siddique, T., Alam, M.M., Mondal, M.E.A., Vishal, V. 2015. Slope mass rating and kinematic analysis of slopes along the national highway-58 near Jonk, Rishikesh, India. Journal of Rock Mechanics and Geotechnical Engineering, vol. 7, no. 5, pp. 600–606. https://doi.org/10.1016/J.JRMGE.2015.06.007
Singh, B., Goel, R.K. 2011. Engineering rock mass classification, pp. 1755–1315. Boston: Butterworth-Heinemann. pp. 1–365. https://doi.org/10.1016/C2010-0-64994-7
Terzaghi, K. 1946. Rock defects and loads on tunnel supports. Commercial Shearing and Stamping Company
Ulusay, R., Hudson, J.A. 2007. The complete ISRM suggested methods for rock characterization, testing and monitoring. International Society for Rock Mechanics-Turkish National Group. u

Affiliation:
1MLB Consulting, Ballito, South Africa
2Koidu Limited, Kono District, Sierra Leone
Correspondence to:
K.B. Le Bron
Email: kevin@mlbconsulting.co.za
Dates:
Received: 22 Dec. 2024
Revised: 24 Mar. 2025
Accepted: 13 Apr. 2025
Published: August 2025
How to cite:
Le Bron, K.B., van Eeden, M.C., Vermeulen, R. 2025. Learnings from development of an underground sub-level open stope mine below an open pit. Journal of the Southern African Institute of Mining and Metallurgy, vol. 125, no. 8, pp. 453–458
DOI ID:
https://doi.org/10.17159/2411-9717/3626/2025
ORCiD:
K.B. Le Bron
http://orcid.org/0009-0008-9541-0016
M.C. van Eeden
http://orcid.org/0009-0009-4974-5816
R. Vermeulen
http://orcid.org/0009-0005-3919-6615
by K.B. Le Bron1, M.C. van Eeden2, R. Vermeulen2
Abstract
This paper presents the lessons learnt during the transition from an open pit method to a sub-level open stoping method at the Koidu Limited kimberlite pipe. These learnings may assist other mines with planning, both from a practical implementation perspective (layout, charging up challenges), and a method for estimating potential dilution and stability challenges associated with the interaction between the surface and underground excavations. Predictive geotechnical stability modelling was successfully applied to highlight potential failure zones, which allowed modification and enhancement of the mining layouts and quantification of the potential dilution of the kimberlite from indicative instabilities.
Keywords open pit -underground interaction, geotechnical modelling, sub-level open stoping, dilution, kimberlite
Introduction
Koidu Limited is located in the eastern province of Sierra Leone, approximately 360 km from the capital city, Freetown. The Koidu Limited mine hosts two kimberlite pipes and four major kimberlite dykes, with a number of blow zones (volumetric lenticular enlargements with diameters up to 30 m – appears similar to a kimberlite pipe) – see schematic in Figure 1.
A schematic of the K1 mine design to Level 8, together with the access drives and the K2 mine design, are presented in Figure 2. The K1 kimberlite pipe has been mined down to 280 m during its open pit operations and has since transitioned to an underground mining operation in 2016 as open pit operations became economically unviable due to high stripping ratios (Figure 2). The K1 kimberlite pipe dimensions are 45 m along its N-S axis and 115 m along its E-W axis (at 100 masl). Due to an excessive ore gap during the establishment of the underground mine, it was decided to extend the open pit excavation by an additional 20 m, extending from surface (380 masl) to approximately 300 m below surface. Koidu’s weather varies between a wet season of approximately 6-9 months (highest rainfall experienced between June and August months), and a dry season of 3 months from December to February month (winter months). The city records rainfall varying from ~7 mm in December to a ~319 mm in August.
As shown in Figure 2, two access points for the underground mine were decided on, namely a sacrificial adit from the 144 Level switchback located within the K1 open pit (this was changed from the initial 208 Level to further reduce the ore gap, with 208 Level subsequently being used as a pump station), and a permanent decline developed from surface, named the Central Decline (positioned between the K1 Pipe and the K2 Pipe). The main purpose of the 144 Level adit, developed from within the K1 open pit, was to immediately access and establish the underground mine with the knowledge that at some point during its life, it may become unstable due to the impact of the underground mine on the open pit rock walls. The Central Decline intersected the decline developed from the 144 Level adit at ~100 mamsl, whilst the K1 Level 2 stope was being mined. A breakaway was developed from the Central Decline, which provides access to the K2 Pipe, which is located at approximately 255 mamsl.
The blasted material from the first two sublevel open stope (SLOS) levels was hauled through the K1 open pit, after which it was decided to abort hauling via the open pit ramps due to geotechnical stability concerns, i.e., the switchback started collapsing after mining of the Level 1 and Level 2 stopes had been completed. At the same time, the 208 Level pump station was decommissioned (due to stability concerns) and replaced with the 305 Level coffer dam (Figure 2).
All elevation levels are with reference to mean sea level (mamsl) with surface at 380 mamsl.
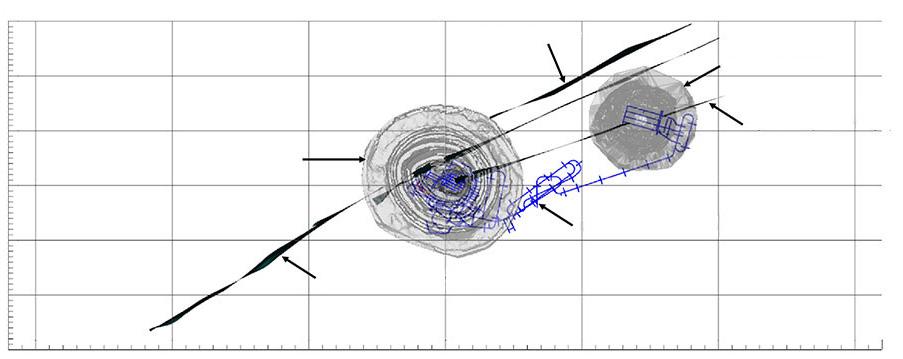

This paper presents the stability assessment methods, which informed the decision-making around the placement and the use of the access declines (Central Decline and the sacrificial 144 Level adit) and pumping arrangements, as well as a method for quantification of potential dilution using discrete element modelling, and learnings from a practical implementation perspective.
Photographs showing the tunnelling quality in pre-stoping fresh kimberlite are shown in Figure 3 and in the weathered kimberlite during stoping of the K1 pipe in Figure 4).
The software, developed by Itasca, Fast Lagrangian Analysis of Continua in 3 Dimensions (FLAC3D) was chosen for this study. The models were initially run applying the elastic constitutive model (prior to mining). The Mohr Coulomb constitutive model was then applied to determine potential tensile and shear fracture zones. Figure 5 presents FLAC3D plots of the open pit and Dyke
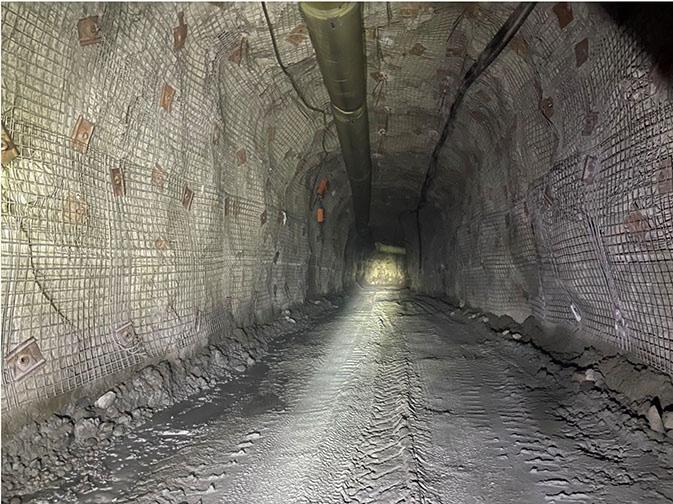
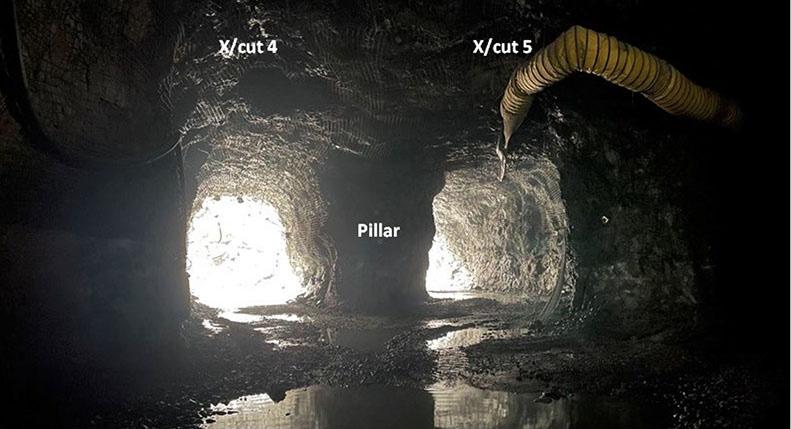

Zone B (DZB) kimberlite dyke outlines in the model. The initial lithological model based on the exploration drilling information indicated that the kimberlite dykes do not intersect, however it was later established during the underground mining that these dykes do intersect.
Stability assessment deepening of open pit prior to sub-level cave mining
Based on initial assessment, the potential for failure appears to be associated with the blow material. The potential for failure was predicted from ~240 m above mean sea level, down to the pit floor, which is greater than the failure experienced on the DZB, which extended from ~140 mamsl to ~180 mamsl. This suggested that the rock mass properties assigned to the blow material may be weaker than current conditions and observations. A bridge, which had been constructed after a historical failure along Dyke Zone B during mining of the open pit, is at approximately 160 mamsl. However, the potential exists for deterioration of the blow material, which may lead to potential failure from a depth of ~240 mamsl below surface to the pit floor, which would affect the ramp leading to both the 144 Level adit and the 208 Level pump station. The potential failure depth into the high wall is predicted to be ~50 m and approximately 60 m (measured horizontally) above the elevation of 150 mamsl. Below the elevation of 150 mamsl, the affected area includes virtually all the walls, as predicted by the model. The affected area increases radially throughout the pit, between the pit bottom elevation and 150 mamsl, after extracting the cut between 100 mamsl and 110 mamsl. This indicated the need for improved pre-split drilling and blasting to limit the potential for blast damage and dynamic loading, which may lead to rock falls.
The potential for failure of the granite rock mass was predicted from ~200 mamsl (Figure 6). This meant that the potential failure in the granite was predicted to extend to an elevation of 8 m below the 208 Level pump station, i.e., the bench immediately below 208 Level. The 305 Level coffer dam was predicted to be outside the potential failure zone predicted by the FLAC3D model. The pump station on 208 Level was therefore de-commissioned and replaced by the coffer dam on 305 Level.
Impact of the underground sub-level cave on rock wall stability
Further FLAC3D modelling suggested that, for the conditions assumed in the model (i.e., no water, no deterioration of the rock mass due to weathering, etc.), the secondary deformation in the open pit was more likely to occur during mining of Level 1 Extension as compared to Levels 2 to 4 (Figure 7). The 144 Level switchback was predicted to collapse should the Level 1 extension be mined. Based on the modelling results, it was decided not to mine the Level 1 extension in order to reduce the potential influx of waste material from the potentially large failure predicted. The modelling results further predicted that the planned stope dimensions on Level

3 (as modelled) should have no negative impact on the stability of the decline ramp, for the middling of ~40 m between the open stope and the decline at Level 3.
pit failure events
Failures that have occurred in the open pit are listed below:
➤ Failure along the kimberlite dykes (numerous failures have been observed during mining of the open pit, mainly after high rainfall events).
➤ Failure of the blow material, which appeared to be as a resultof dynamic loading, possibly due to slip along kimberlite dyke-granite contact (the extent of which was similar to that predicted by the FLAC3D model) – (Shariff, 2018).
➤ Undercutting of the jointed granite, which resulted in failure along some of the prominent and persistent joints (as predicted by the distinct element modelling).
➤ The K1 open pit shell saw a failure along one of the weathered kimberlite dykes. The failure that extended 30 m into the high walls of the open pit occurred along the intersection of two kimberlite dykes. This failure migrated ~30 m horizontally, initially exposing the M28 re-muck, as per Figure 8 to Figure10. Continuous self-mining of the kimberlite dyke continued to undercut the M28 re-muck, compromising the main access decline. The main access decline ended up being totally undercut and collapsed into the stope. The correct decision was therefore taken to stop all use of the main access decline and to develop a new access decline.
➤ Cracks were observed along the 144 Level switchback, after which crack meters were installed to monitor the displacement after the initial failure at M28 re-muck. The crack meter readings showed that no further opening occurred after the collapse of the M28 re-muck, even after completing stoping down to Level 7 had been completed.
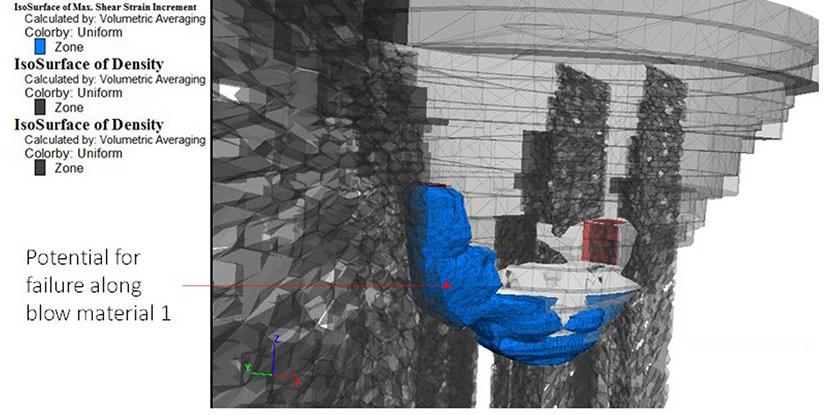


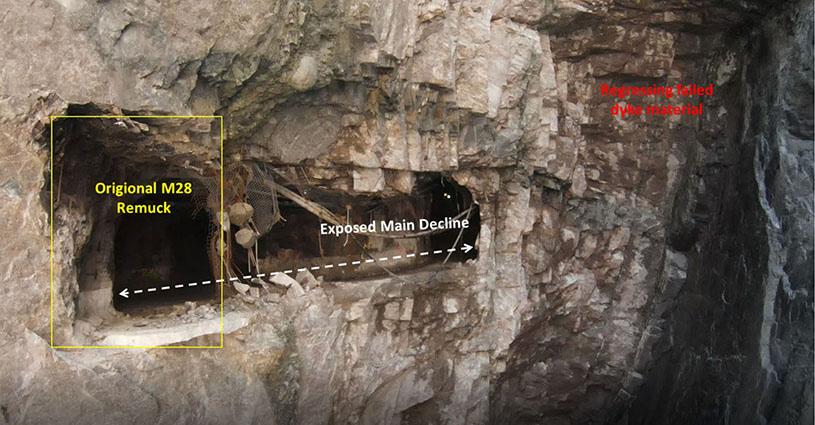
Assessment of potential dilution using a distinct element model
Photographs showing the impact of the different joint sets and dykes on the slope stability in the K1 open pit are presented in Figure 11. The joint set orientation data were used as input into a numerical modelling software to determine the types of failures and extent thereof on the K1 pit (as illustrated in Figure 12). The results indicate that toppling, wedge, and planar failure is predicted (as observed underground). It should be noted that due to the high
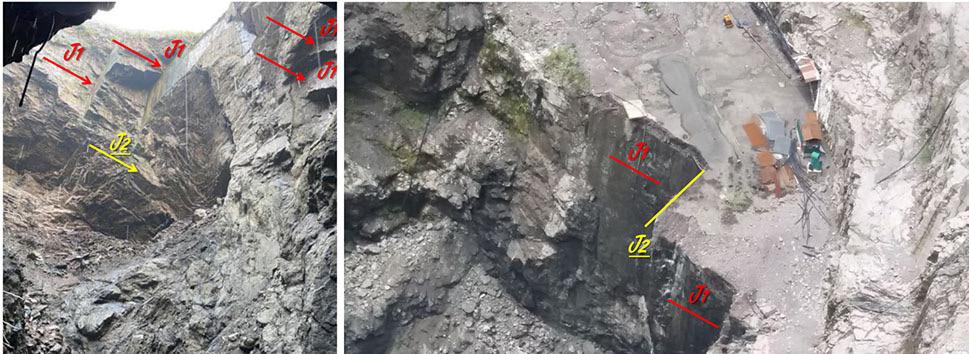
wall slope angle, relative to the dip of the joint sets, the effect of the instability is limited to the bench-scale. Although the joints are persistent over more than a single bench height, the following is evident:
➤ The undulating and stepped contacts improve the shear strength.
➤ Failure may occur where the joint daylights along the slope but requires other planes of weakness to allow dislodging to occur. The bench crests generally have the lowest confinement, which makes dislodging of rocks easier to occur there than from the high wall under confinement.
The mine design for K1 Sub-Level open stopes as simulated using Itasca’s 3D Distinct Element Code (3DEC) software is shown in Figure 13.
Three stages of granite collapses are predicted in the distinct element model, which are:
1. Initial collapse – undercutting of the open pit high wall by the underground stope.
2. Subsequent collapse – undercutting of the Level 1 stope by the Level 2 stope.
3. Tertiary collapse – failure of the granite in the open pit, not as a result of undercutting due to mining, but rather by the collapse of rock mass below it.


The distinct element modelling further predicts the following:
1. Kimberlite from the sidewalls of the stopes (and the open pit high walls) is likely to dislodge from the kimberlitegranite contact.
2. Undercutting of granite and kimberlite is likely to result in collapses, due to the failure along joints (overhang conditions created which exposes persistent joints).
3. Both the fresh kimberlite and granite is likely to remain stable if:
a. No joints (including the contact) in either the fresh kimberlite or granite are present in the overhang rock.
b. If the joints in the granite dip into the sidewall of the stope. Although toppling failure is possible, the distinct element model mainly indicates opening along the joints. For a collapse to occur, a third joint set or random joint is required).
c. Even in the absence of joints within the kimberlite, time dependent failure may still occur due to the weathering of the kimberlite, which reduces the overall rock mass strength of the kimberlite and may lead to a collapse due to rock mass failure and not structural failure.
4. Based on the distinct element modelling, the volume of kimberlite rock that will dislodge from the rock walls, is likely to be more than the granite rock that may dislodge (this is mainly due to the volume of kimberlite that has been left against the stope sidewalls). The maximum volume of granite rock mass predicted to collapse into the stope over a cross-cut / mining length of ~30 m (~15 blast rings spaced 2 m apart) is predicted to be ~9,500 m3, which equates to ~25,650 tonnes. For the same cross-cut / mining length, the maximum volume of kimberlite rock mass predicted to collapse into the stope is predicted to be ~18,000 m3, which equates to ~43,000 tonnes, which is approximately 70% more tonnes and almost double the volume of the granite.
5. The distinct element model predicted that Level 2 would most likely be impacted by the collapse of granite from Level 1 and above. With the mining of cross-cut 4 on Level 2, the model showed that additional kimberlite as well as granite will dislodge from Level 1.
6. The predictive distinct element modelling applied has tracked closely with the collapse of 32 Kt of granite waste rock and the incidental recovery of 81 Kt of additional kimberlite resulting from the collapse.
The typical extraction configuration in the main stopes consist of:
➤ 4.5 m x 5.0 m crosscuts developed in arch shape.
➤ The crosscuts are developed along the E-W axis of the orebody.
➤ A slot cut drive is developed perpendicular to the limits of the ore crosscuts on the extremities of the ore-waste contact zone.
➤ A circular blind raise, with a diameter of 1.5 m is drilled from the bottom up as an initiating free-face in order to blast a slot cut, which will serve as the free-face for subsequent production blast rings once the stope has been fully established.
➤ There are typically 3 draw-points per production level. Figure 14 shows the mine/stope configuration and Figure 15 shows a plan view of typical drawpoint layouts.
The FLAC3D geotechnical model has significantly guided the design, configuration and placement of draw points and the extraction sequencing. Various zones within the production stopes have been deferred (e.g., Level 1 extension) as they have the potential, according to the geotechnical model, to initiate waste failures and influxes into the stopes, which will have significant adverse financial implications. These deferred zones have been sequenced to be alternatively mined toward the end of the life of the K1 underground mine when such impacts can be managed accordingly through abandonment or selective extraction; this approach will ensure that underlying stopes remain viable due to the current controls on dilution as a result of the predictive insights provided by the FLAC3D modelling. The mine design layouts have been further enhanced by the development of the slot drives in the middle of the ore body, which increases the number of draw points from 3 to 6 with a tramming half- loop, which will have a positive effect on productivities, dilution control, flexibility, and an added layer of safety for personnel and equipment. Placement of all permanent infrastructure (return airways, dams, decline shafts) has also been meticulously informed by the modelling to ensure a safe and efficient underground operation.
Drilling, blasting and charging up
In the planning and execution of drilling, blasting, and charging up operations for the 40-metre vertical stope, a comprehensive approach was adopted, considering various critical factors and


utilising advanced geotechnical modelling tools such as FLAC3D and 3DEC. These tools provided invaluable insights into the subsurface conditions, enabling the development of effective blind bore slot patterns and stope blast designs prior to commencing any drilling or blasting activities. The detailed blast design for this operation considered the following key elements:
➤ Blind bore raise positioning: The positioning of the blind bore raise was carefully planned to ensure long-lasting integrity while establishing the slot. Special attention was given to orient the blind bore raises perpendicular to ore cross-cuts, optimising their effectiveness.
➤ Blast hole design: The design of blast holes for slot establishment factored in various critical parameters, including void size (with a specific focus on a 1.5-metre circular blind raise/free face), rock compressive strength, desired fragmentation size, burden and spacing, and the type and quantity of explosives to be employed.
➤ Stope/cross-cut ring layout: The layout of the main stope/ cross-cut rings was carefully engineered to minimise toe burdens. Consideration was given to avoid crowding of the bottom holes while still achieving the desired fragmentation outcomes.
➤ Special considerations for waterlogged areas: Given the challenging waterlogged underground conditions in which mining is conducted, a meticulous approach was taken to the specification of explosives and accessories for blasting operations.
➤ Sticky emulsion explosives: In this context, emulsion explosives with adhesive properties were thoughtfully selected. The "sticky" emulsion adheres to the borehole walls, enhancing the efficiency of blasting in wet conditions.
➤ Innovative solution for groundwater mitigation: Due to the significant groundwater encountered after blast hole drilling; an innovative in-house solution was developed to prevent emulsion washout from the charged-up holes. Blast balls, in combination with blast hole liners, were strategically inserted into the drilled holes before charging up. This innovation effectively prevents groundwater from diminishing the adhesive properties of the emulsion, thus reducing emulsion losses in the blast holes and ensuring desired blasting outcomes.
➤ Geotechnical stability and predictive insights: Throughout the planning and execution phases, geotechnical stability controls were continuously implemented. Insights obtained from advanced FLAC3D modelling contributed significantly to the decision-making process, enhancing the overall viability of the underlying stopes and highlighted the importance of planning a secondary access.
In summary, the drilling, blasting, and charging up operations for the 40-metre vertical stope were conducted with precision and innovation, leveraging geotechnical modelling, meticulous blast design, and adaptive solutions to address the unique challenges posed by waterlogged underground environments. These measures collectively ensure the safety, efficiency, and effectiveness of the blasting operations while optimising the recoveries from the stopes. Figure 16 and Figure 17 illustrate a typical blast ring layout.
Predictive geotechnical stability modelling is invaluable when dealing with complex mining layouts. However, this is dependent on an understanding of the potential failure mechanisms,
choosing the correct modelling tools and constitutive model, deriving the representative rock mass strength parameters, which requires mapping data, core logging data, laboratory test data, and instrumentation data (deformation, strain, etc.), continuous back analysis, and carrying out model calibration for application in future (all rock mass failures should be investigated, effectiveness of mining and support strategies should be recorded).
Extensive self-mining of up to 30 m of the kimberlite (because of a combination of weathering due to numerous high rainfall events, and jointed rock mass) in the blow, dykes, and pipes have led to instability of the 144 Level switchback and 144 Level adit, as well as a portion of the main access decline at M28 re-muck, which indicate the importance of compiling three-dimensional structural models together with advanced inelastic predictive modelling that allow simulation of the stability of complex underground excavations.
References
Anon. 2014. FLAC3D Version 5.01 Manual. Anon. 2016. 3DEC Version 5.2 Manual.
Armstrong, R. 2010. SRK Consulting Report. Kyeramateng, F. 2024. Personal communication.
Shariff, M. 2018. Koidu Diamond Internal Report on Fall of Ground.
Van Eeden, M. 2024. Personal Communication. Vermeulen, R. 2024. E-mail communication. u

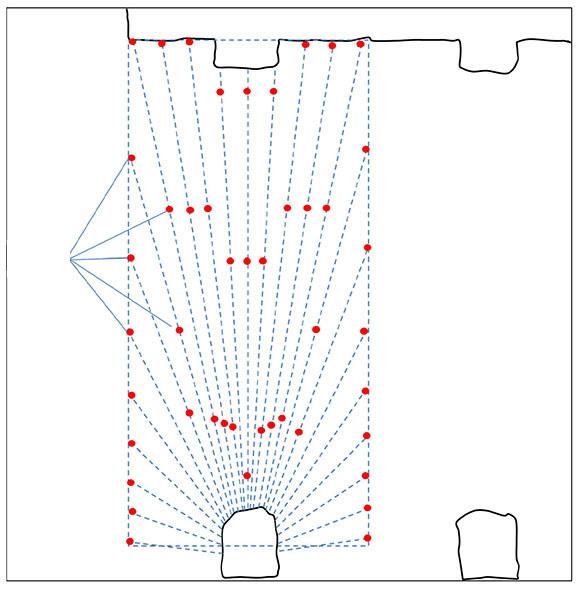

Affiliation:
1SRK Consulting, South Africa
2University of the Witwatersrand, South Africa
Correspondence to: P. Linzer
Email: plinzer@srk.co.za
Dates:
Received: 9 Jan. 2025
Revised: 7 Apr. 2025
Accepted: 16 Jul. 2025
Published: August 2025
How to cite:
Linzer, L.M., Linzer, P. 2025. Guide to using gravity in the detection of underground voids.
Journal of the Southern African Institute of Mining and Metallurgy, vol. 125, no. 8, pp. 459–466
DOI ID:
https://doi.org/10.17159/2411-9717/3640/2025
ORCiD:
L.M. Linzer
http://orcid.org/0000-0003-1581-0420
P. Linzer
http://orcid.org/0009-0005-6204-3553
by L.M. Linzer1,2, P. Linzer1
Abstract
The gravity method is often applied in mining-related scenarios such as geological and mineral exploration, detecting subsurface cavities and voids (“receptacles”) that may become sinkholes, siting of surface structures, fault-mapping, and more. It is also widely applied in geotechnical engineering to map subsurface karst profiles and to detect subsurface cavities, such as can occur in open pit mines. While it is widely acknowledged that, compared with other available geophysical methods, this method is the most applicable to the karst profiling problem, survey geometries applied in the field are often far from optimal. The gravity surveying specifications prescribed in SANS 1936 omit some key requirements for optimal survey outcomes, and this paper is intended to fill those gaps. The authors have seen scopes of work that require only a few measurements over the footprint of a proposed structure, indicating a lack of understanding of the nature of the gravitational field. A single gravity measurement is subject to the camouflaging effects of several influences, many of which can be larger than the anomaly caused by the subsurface density variation itself. Papers in the body of literature show an awareness of the need to map the regional field so that it can be subtracted to unmask the residual gravity anomaly, but rarely do they examine how instrument sensitivity governs the size of detectable anomalies or discuss how a detailed terrain correction can be instrumental for isolating faint targets.
This paper aims to explain how to apply the gravity method correctly to mining and geotechnical problems, specifically in the detection of subsurface cavities. It discusses various factors to assist with optimising the acquisition of gravity data and its processing so as to maximise the practical value of gravity surveys.
Keywords geophysics, gravity survey, gravity data corrections, subsurface voids, field discipline
Introduction
The gravity surveying specifications given in SANS 1936 (2012), Part 2 (2012), require that a competent geophysicist should either perform or oversee a survey. In executing the survey, it states that. a) A gravity map shall be produced and used to determine borehole positions. A residual gravity map shall be produced after completion of the borehole drilling. On large projects, a preliminary residual gravity map may be produced after the initial phase of drilling and then refined after all drilling is completed. The final residual gravity map shall be incorporated into a report to be prepared by the competent geophysicist. b) The accuracy of reduced observations on a relative basis shall be at least 0,01 mGal or better. c) Contour intervals on gravity maps shall not exceed 0,1 mGal.”
While these specifications are in themselves correct, they are not adequate and miss some key requirements. This paper intends to explain the subtleties that affect gravity survey data to the engineering and geotechnical community. This entails background theory and definitions necessary for the rationale behind the second part of the paper, which follows here.
Gravity anomalies caused by subsurface density variations are superimposed onto the Earth’s gravitational field. The Earth’s gravitational field varies from g = 978.0318 cm/s2 at the equator (978.0318 Gal) to g = 983.152 cm/s2 at the poles (983.152 Gal) (Dentith, Mudge, 2014). The reason for this 5 Gal variation is that the Earth is an oblate spheroid, flattened at the poles and bulging at the equator, so a measurement of the surface gravity at the poles is higher because it is closer to the Earth’s centre of mass. Gravity anomalies in mineral exploration are typically ~1 mGal in magnitude, which is 10-8 of the Earth’s surface gravity. For geotechnical applications, the gravity anomalies are often even smaller at ~0.02 mGal, which is 10-10 of the Earth’s surface gravity.
Very sensitive instruments called gravimeters are used to measure gravity anomalies caused by subsurface density variations. Commercial gravimeters currently in use realistically have sensitivities of ~0.01 mGal (10-10 of Earth’s surface gravity), although manufacturing specifications may quote 0.001 mGal sensitivity, but this accuracy is mostly unrealistic for a field survey where there are various sources of noise (micro-vibrations caused by distant earthquakes, waves, wind, etc.). In addition, more than one gravimeter may be used in a large gravity survey, adding to the measurement error by way of subtly differing instrument responses. The gravimeters in common use contain metal or quartz zero-length springs to support the test mass, and they are relative instruments that record the difference in gravity between each survey station and a survey base station.
Superconducting gravimeters can achieve sensitivities of approximately one trillionth (10−12) of the Earth’s surface gravity, but these are not widely used owing to their cost. These gravimeters do not have a mechanical spring, and their functioning principle involves the levitation of a spherical specimen by a magnetic field generated by coils (Goodkind, 1999). The sphere moves up and down in response to changes in gravity; therefore, the voltage is altered automatically, with the objective of maintaining equilibrium by moving the sphere to the correct position (Amarante, Trabanco, 2016). The voltage changes required to maintain this equilibrium are direct analogues of changes in ambient gravity.
The important point to note here is that the gravity method is designed to detect relative anomalies, not deviations from an absolute standard. As such, an adequate background sampling must exist against which any anomalies can be contrasted. For geotechnical and exploration work, this requirement remains in force, regardless of whether an absolute or a relative gravimeter is being used. Therefore, gravity needs to be properly sampled not only within the area of interest, but also sufficiently beyond it to provide the necessary body of background readings.
A single measurement of the gravitational attraction on the surface of the Earth is the combined effect of several influences: the latitude at which the measurement is taken; the elevation or distance from the Earth’s centre of mass (centroid); the topography of the surrounding terrain; Earth tides and density variations in the subsurface (Figure 1). In addition, the zero-length spring in the gravimeter stretches with use and temperature changes over the course of a day, resulting in instrument drift. The regional subsurface geology also affects measurements, for instance the presence of horst/graben structures and/or variable basement topography, among others.
There is an increase in gravitational intensity with latitude due to both the rotation of the Earth and the bulge at the equator. The centrifugal acceleration due to the Earth’s rotation is at a maximum at the equator and zero at the poles, and it opposes the force of gravitational attraction (Telford et al., 1990). In contrast, the flattening at the poles increases the gravity since the measurement point on the surface is closer to the centre of mass. This is counteracted partly by the increased attraction due to the excess mass at the equator (Telford et al., 1990).
The correction is maximum at a latitude of 45° and varies by approximately 0.81 mGal per kilometre north or south from the
equator, while it is zero at the poles and equator. This means that to achieve an accuracy of 0.01 mGal, the north-south location of the gravity stations is required to an accuracy of ~12 metres.
Gravity varies with the inverse square of the separation distance between the Earth’s centroid and a mass near its surface, and it is therefore necessary to correct for changes in elevation between stations and to normalise the field readings to a datum plane. The magnitude of gravity change with elevation is 0.3086 mGal/m. This effect considers only the change in elevation and not the density of the material between the station and datum. This correction is known as the free-air correction. For an accuracy of 0.01 mGal, the usual accuracy of a gravimeter, the elevations must be known to within 3 cm (Telford et al., 1990).
To compensate for the attraction of material between the datum plane and the station elevation (which is ignored in the free-air correction above), a second correction known as the Bouguer correction is required. This correction assumes a slab of constant density, with infinite horizontal extent between the datum and station. For an average crustal density of 2.67 g/cm3, the Bouguer correction changes according to 0.112 mGal/m, where it is subtracted if a station is above the datum (Telford et al., 1990).
The free-air and Bouguer corrections are usually combined into a single operation.
If the topography has rapid elevation changes, a complex correction, known as the terrain correction, is required. In such a case, the assumption of the Bouguer slab of infinite horizontal extent is not adequate, and it becomes necessary to compensate for the increased gravitational attraction exerted by the excess mass of hills, ridges, mountain ranges, and other elevated terrain, and also for decreased gravitational attraction from the mass deficits due to valleys, depressions, gullies, excavations, and such.
In Figure 2, at point “A” (hill) there is excess mass above the elevation-corrected measurement point “P”, which reduces the gravity measurement there because it exerts an upward vertical gravitational force component on “P”. At “B” (valley), there is absent mass below “P”, which reduces the net vertical gravitational force component because it does not attract as strongly downwards.
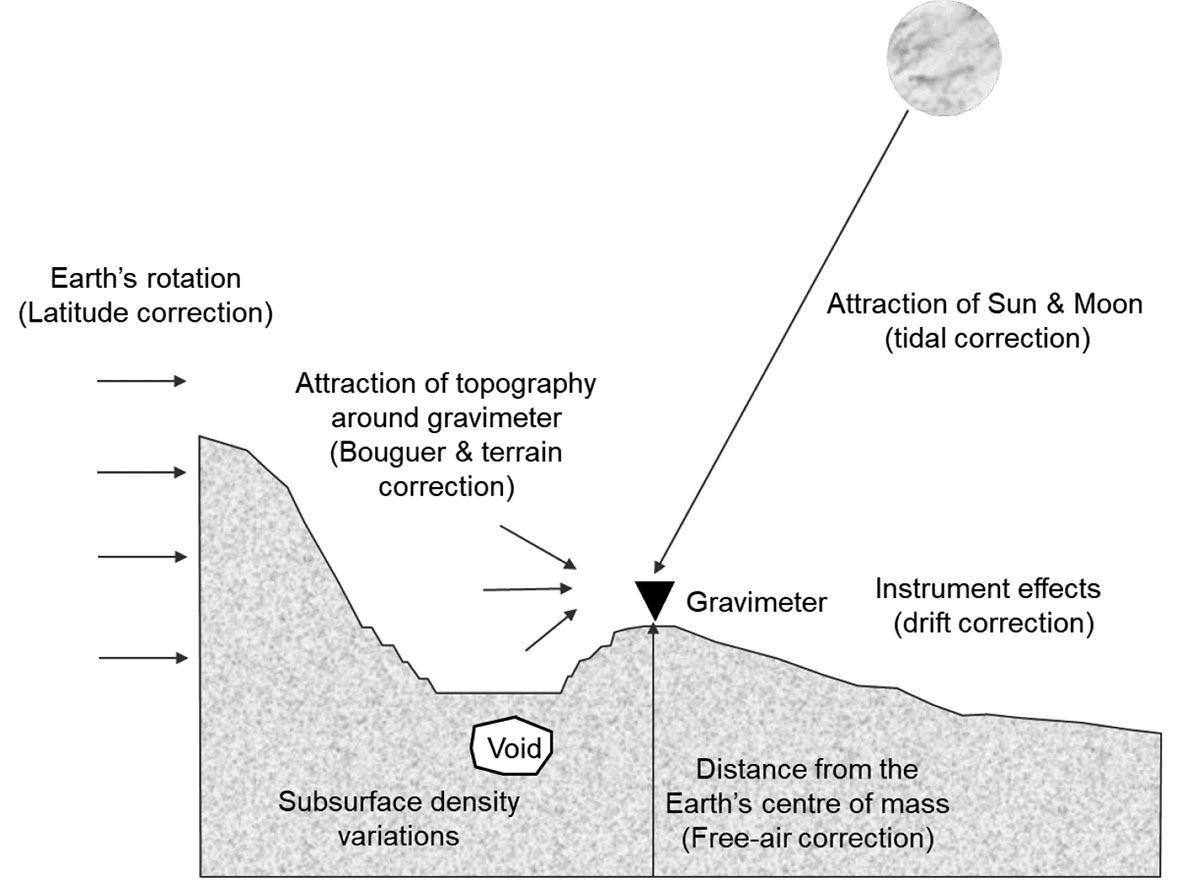

One needs to be reminded that there is 0.3086 mGal variation over a 1 m elevation change. A 5 m elevation change will cause a change in gravity of 1.5 mGal, which is 50% more than a typical exploration target of 1 mGal, and 75 times more than a geotechnical target of 0.02 mGal.
For high-resolution surveys, relatively small features close to the survey station, such as culverts, rock dumps, storage tanks, reservoirs, open pits, hillocks, washout gullies, etc., can have a significant effect on the measured gravity and can be a major source of error in high-resolution gravity work. Large topographic features tens of kilometres away from the station, and even very large mountain ranges (> 100 km distant) may also need to be included in the correction.
In cases where there are voids, cavities, or receptacles in an open pit, the changes in terrain due to the benches and highwalls can have a large effect, and an accurate terrain correction will be critical to unmask the anomalies caused by subsurface low-density zones. This aspect will be discussed in more detail shortly.
A gravity measurement taken on the surface of the Earth is also affected by the gravitational attractions of the Sun and Moon. The Sun’s effect is smaller, despite it being of a far larger mass than the Moon because of the Moon’s closer proximity to the Earth. Collectively, the effects of the Sun and Moon are referred to as tidal effects and they produce gravitational changes of less than 0.3 mGal. Tides oscillate on a period of approximately 12 hours and 24 minutes. The period of 12 hours is due to the rotation of the Earth, while the 24 minutes result from the daily delay caused by the lunar orbit, which has a cycle of 29.5 days (Amarante, Trabanco, 2016). The tidal effect is greatest at the equator.
When the Earth, Sun, and Moon are in the same alignment (during full moon and new moon), a phenomenon known as the syzygy tide occurs, where the variation between high and low tide is at a maximum (Amarante, Trabanco, 2016). When the Moon is waxing or waning, and not in alignment, the quadrature tide occurs where the tidal variations are smaller.
Modern computerised gravimeters automatically calculate and apply the tidal correction to the measured gravity using the method of Longman (1959). Other formulae have been proposed by Bartels (1957), Schureman (1940), and Pettit (1954), but they are essentially the same (Dehlinger, 1978). A recent study by Amarante and Trabanco (2016) has updated some of the constants (such as the mass of the Sun). The results do not vary significantly but the updates will prove increasingly significant as gravimeters of greater precision and sensitivity are developed.
A gravimeter will usually not record the same results if read
repeatedly at the same station mainly due to creep of the spring over time, resulting in changes in their null reading value or reference value. The changes in spring properties are usually related to temperature, despite gravimeters being constructed out of materials that are relatively insensitive to temperature changes. This drift in modern gravimeters is lower than that of older instruments, but it is still significant, being of the order of ~0.1 mGal per day.
The drift is monitored by making repeat readings at one or more designated base stations. The time elapsed between repeated readings will determine the desired accuracy of the survey. Milsom (2003) recommends a maximum time between repeat readings of 1 to 2 hours. Good field practice dictates at least 10% repeat measurements in each loop (Murray, Tracey, 2001), however, the authors have been involved in surveys where ~40% repeat measurements were taken due to noisy field conditions. Thus, the gravity survey practitioner should be aware of the environmental conditions in which the survey is being conducted and adjust the base station measurement frequency accordingly.
To compute and remove the instrument drift effect, a linear interpolation is applied between successive base station measurements. The drift correction per minute to be applied to each measurement can be calculated using the following formula (Moleleki, 2019):

where B1 and B2 are the base station readings of observed gravity at times 1 and 2, respectively, while TB1 and TB2 are the times (in minutes) of these readings. TS is the time at each gravity station at which a measurement was taken between those at the base stations B1 and B2. LI is the drift correction/minute to be applied to each measurement.
Looping procedures are often applied in the field, which involve measurements at subsets of the survey’s stations being taken between a start- and an end reading at a base station for each subset. That is, the survey consists of a series of loops. In such a procedure, a central easy-to-access base station is chosen and repeat readings are made at that station every hour. Sometimes a leapfrogging procedure is used, where one station in a loop is repeated, so effectively two readings are made at that point, then a new base station is selected, and a new loop is surveyed. The risk with this approach is that a systematic error can propagate through the loops, resulting in an apparent tilt in the regional field that is not real, i.e., an unwanted artefact. For large surveys, a better approach is to lay out a base station grid with a master base station.
More complex looping schemes are often employed, particularly when the survey, because of its large areal extent, requires the use of multiple base stations.
Techniques to unmask the gravity anomaly: important considerations
Potential field measurements of the Earth’s gravitational (and magnetic) field are affected by both ambiguity and non-uniqueness; the phenomenon where many different distributions of density (or magnetic susceptibility) can produce the same geophysical anomaly. A well-known example is shown in Figure 3 where a deep sphere and a shallower lens-like body with the same density contrast can produce the same residual anomaly. Figure 4 shows a famous case study where the minimum of a Bouguer gravity survey in the Moray
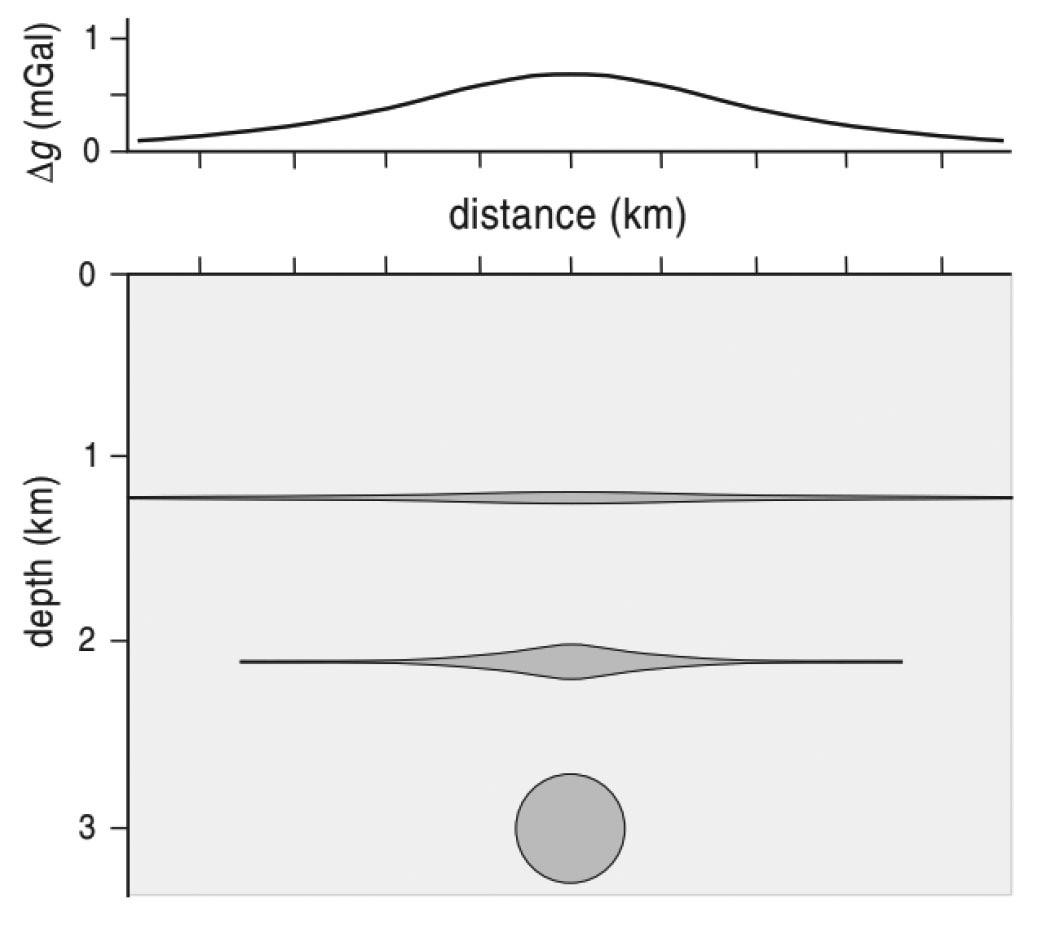

Firth in NE Scotland was interpreted as being due to a granite pluton (Arkell, 1933). Many years later, after drilling and a seismic reflection survey, it was realised that the cause of the minimum was actually a sedimentary basin (Collette, 1958; Sunderland, 1972).
Terrain correction
The gravity terrain correction (GTC) is especially important where expected gravity anomalies are relatively small and/or where the topography is highly irregular in the near vicinity of the survey area. Historically, there have been cases in dolomite environments where constructions on surface (e.g., runways) and mining infrastructure (e.g., ramps) were sited over voids, the collapse of which had significant adverse consequences, both operational and financial. Such disasters could well have been avoided through the application of the gravity method with comprehensive GTC processing since the anomalies in such cases are typically very small, as will shortly become clear.
Prior to the advent of digital computing, this correction was done manually using the so-called Hammer net method, which involved dividing the area surrounding each measurement station into sectors and concentric radial sections (“compartments”) according to a large, superimposed circular net template, averaging the elevations in each portion, and calculating a gravity correction based on the elevation differences between the station and the average portion elevations.
Performed manually, the Hammer net approach is obviously labour-intensive and repetitive, and therefore prone to mistakes. “Terrain corrections can be extremely tedious” (Milsom, 2003). For the same reasons, the method clearly also lends itself well to computerisation.
Some GTC computer codes exist but they are either unobtainable or outdated in respect of both capability and the hardware and/or software platforms on which they will run. Proxy methods that rely on mathematical simplifications of topographical complexities and/or on statistical techniques for estimating the corrections also exist, but these methods invariably lose relevance where the topography becomes increasingly irregular close to the survey area—which is precisely the situation in which the greatest possible correction accuracy is required.
In response to these deficiencies, SRK Consulting has developed its own GTC algorithms from first principles, based on the Hammer net method but with some enhancements, and implemented them first as a statistical analysis software (SAS1) script prototype for testing and validation, and later as a standalone Microsoft Windows program. For the latter, the algorithms are optimised for processing speed, making extensive use of multithreaded parallel processing, and large GTC jobs can be farmed out to multiple PCs, each processing a different portion of the survey data. Even so, GTC processing runs can take a considerable time to complete but tests with real-world data have shown that this effort can add real value in terms of target contrast, resolution, and definition. The required input data consist of survey station positions and elevations, and a terrain digital elevation model (DEM, typically taken from public domain, 1-arcsecond SRTM data) out to 100 km or more in all directions beyond the survey area.
The following example, while highly idealised, serves well to illustrate the difference that proper GTC processing can make. The example is of a gravity survey done on the floor of a circular opencast mining pit to identify subsurface cavities. The hypothetical pit has five benches and a spherical cavity due east of the centre of the pit floor, halfway between the centre and the pit floor edge. Figure 5 shows the conceptual pit layout and dimensions.
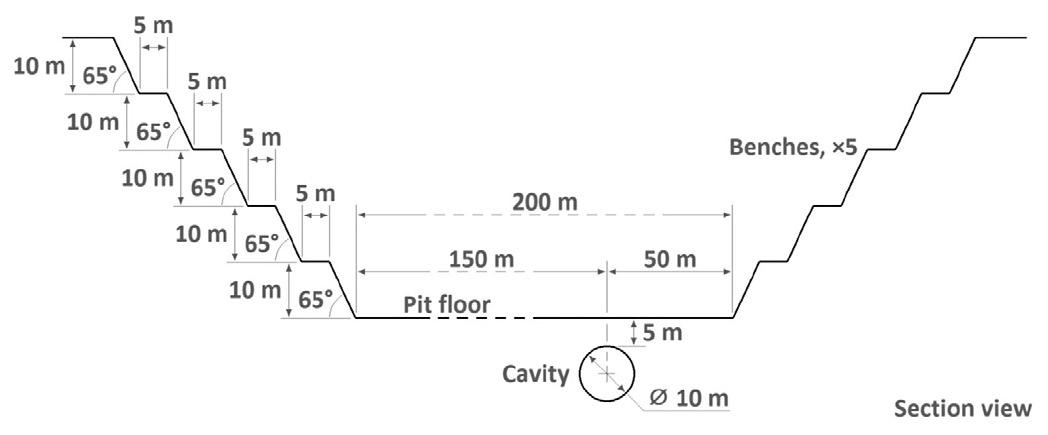
1SAS = Statistical Analysis Software (https://www.sas.com)
In addition, a ridge 10 km to the north of the pit is assumed, which runs east-west for 30 km. It has a symmetric trapezoidal cross-section (i.e., its north-south section) with sides sloping at 45° and is 500 m wide at its base, 200 m high, and 100 m wide at the top. Apart from the interior of the pit itself and this ridge, all other terrain around the survey area is assumed to lie at the same elevation, which is the ground level at the uppermost edge of the pit. All rock densities are assumed to be 2.5 g/cm³ throughout.
Figure 6 shows a plot of the reduced gravity data for this theoretical survey after all corrections have been applied, except for the terrain correction.
Figure 7 shows a plot of the reduced gravity data for this theoretical survey after all corrections, including the terrain correction, have been applied. The gravity residual values have been shifted by a constant offset to emphasise the narrow range within which they fall. This would be the final output from the gravity survey.
When comparing Figures 6 and 7, it is important to note the ranges of their respective gravity values. In Figure 6, the range is 1.7021 mGal, compared to 0.0685 mGal in Figure 7. This wide disparity in the magnitudes of the ranges underscores the earlier point that cavities or voids such as incipient sinkholes typically produce a very small gravity anomaly compared to other influences, in this case the effect of the near-field topography. The plots should therefore be compared qualitatively in a relative sense without reference to their gravity values per se.
It is immediately clear that there is a reversal of the gravity highs and lows between the two plots: Figure 6 shows the highest values at the centre of the pit and the lowest values at the pit floor’s periphery, whereas Figure 7 has the highest values at the pit floor’s outer region. This difference is entirely attributable to a cancelling upward gravitational pull by the surrounding benches, where the upward pull is greatest at the pit floor’s edge, closest to the bottom bench. The upward component diminishes rapidly towards the centre of the pit floor—as the inverse cube2 of the distance from the outer edge— and is at a relative minimum at the pit’s centre. This effect explains why, in Figure 6, the gravity values are low at the periphery of the pit floor and higher at its centre.
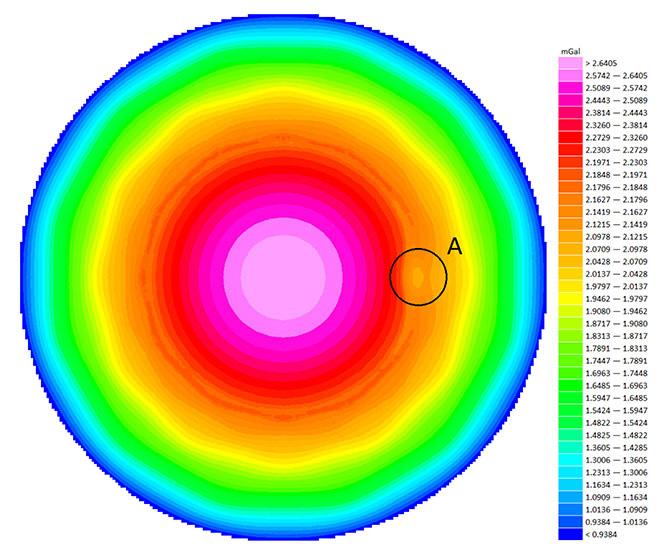
Figure 6 also highlights a very small gravitational anomaly at “A”, which is the result of the subsurface cavity. Without the terrain correction, this could easily escape notice or be ignored as being insignificant. However, the anomaly is the desired target of the gravity survey, and applying the terrain correction brings it into much sharper focus and improved contrast, as is shown in Figure 7.
It is also clear that the east-west ridge mentioned earlier at 10 km to the north of the pit has no discernible effect on the measured gravity values or on the terrain correction, but this does not justify a general reduction of the extent of the surrounding terrain that should be included in the terrain correction processing. A higher, more prominent ridge-like feature such as a mountain range at the same distance would produce a correspondingly more pronounced terrain effect.
From these considerations it is therefore evident that in the right circumstances, the effect of the near-field terrain can almost completely obscure the subsurface cavity, possibly leaving it undetected, likely to the detriment of the pit operations and personnel. Moreover, since it is often the case that such cavities are for safety reasons sought inside pits or other excavations, similar circumstances to those referred to here can occur in practice.
On a more abstract note, with regard to the afore-mentioned example, omitting the gravity terrain correction could clearly in this case result in an inaccurate, substandard, and possibly useless report on the presence of cavities in the pit, which is what the survey was intended to reveal. As such, this could prompt the pit operator to question the usefulness of the gravity technique (and perhaps even geophysical exploration methods in their entirety), especially if the cavity were subsequently to collapse. In turn, this loss of confidence does a disservice to gravity survey practitioners and may result in such surveys not being performed at all, or where they are mandatory, them being performed as mere box-ticking exercises.
The preceding illustration and discussion of the gravity terrain correction demonstrate its importance as a further gravity data processing step, especially in situations where gravity anomalies are
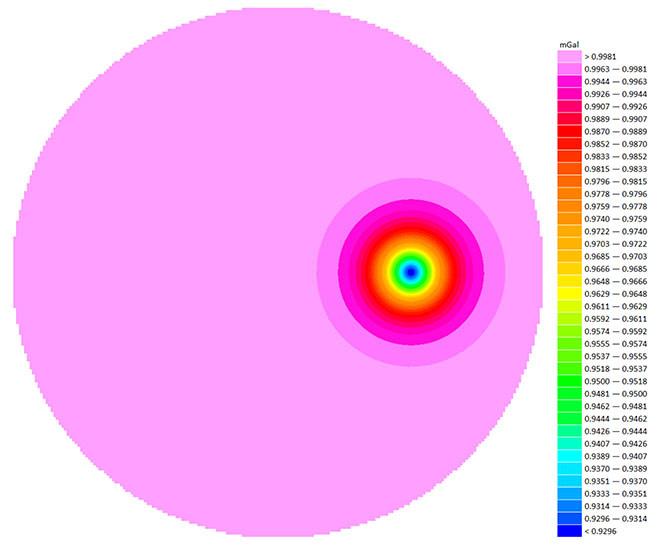
2The total gravitational force is inversely proportional to the square of the separation distance, while for a given elevation difference, the force’s vertical component is inversely proportional to the distance. Taken together, the two produce an inverse-cube effect
expected to be subtle and/or where the terrain at, or surrounding the survey area, is highly variable in terms of local elevations. However, a reliable guideline or heuristic is currently lacking to decide when applying the terrain correction is warranted and how far out it needs to be taken. Future gravity survey work will likely assist with establishing appropriate rules in this context.
Line lengths to record the regional field
The regional gravity field is the long wavelength gravity caused by the bedrock topography such as horsts, grabens, dipping basements, etc. When the gravity is measured at a point on the surface, it is the combined effect of the local, subsurface density variations (short wavelength) that is usually the target of such studies, and the regional field caused by larger structures. An example is shown in Figure 8, where an air-filled cavity (10 m diameter) at a depth of around 50 m in a material with density contrast of -2.0 g/cm3 (e.g., sandstone) overlays deeper granitic material (relative density contrast of -0.5 g/cm3), dipping to the right of the Figure.
The total Bouguer anomaly recorded (Figure 8a) will be the sum of the effects of the cavity, the subsurface material, and a dipping basement. The regional trend caused by the subsurface overlaying the dipping basement is shown in Figure 8b. Subtraction of the regional trend from the Bouguer gravity will reveal the residual anomaly (Figure 8c) caused by the cavity. It should be noted that the areas labelled “Model edge effects” in the figures are identified to emphasise that the apparent gravity reduction occurring towards the model’s edges is a modelling artefact, rather than what would be seen in reality. The modelling was done using Grav2D, a freeware program written by Cooper (1998).
There is no hard-and-fast way to isolate the regional trend, but there will usually be a difference in the lateral scale of the various anomalies. Hence, there is a strict need for survey lines that are long enough to detect regional trends. Prior knowledge of the regionalscale geology can help guide the line length selection.
Direct estimates of the regional gravity anomaly can be made from an independent dataset, e.g., the regional gravity map of South Africa. However, this requires the local gravity survey to be tied into the regional grid by taking measurements at common base stations, which typically would entail additional costs that survey requestors are usually reluctant to pay. Graphical estimates of the regional trend are based on simply plotting the observations and sketching the interpreter’s estimate of the regional gravity attributes. There are several mathematical techniques for estimating regional trends such as moving averages, long wavelength filtering, upward continuation, function fitting, etc., but all of these require a data grid that is large enough and detailed enough to capture the longer wavelength regional variations.
Gravity is a potential field that needs to be sampled on a grid to map relative differences. The station spacing needs to be close enough to define the anomaly, of which its requirement depends on the target size and its depth. The sample spacing should be small enough to record at least two points over the anomalous mass and one on either side of it, along a survey long enough to define the regional effect. The station spacing geometry is illustrated conceptually in Figure 9.
Gravimeter sensitivity and target resolvability
The sensitivity of the gravimeter is also an important consideration, since a survey will not reveal anything useful if the anomaly

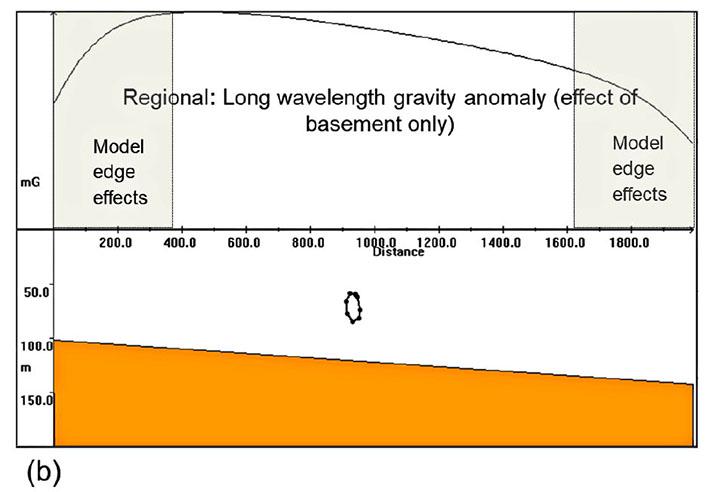
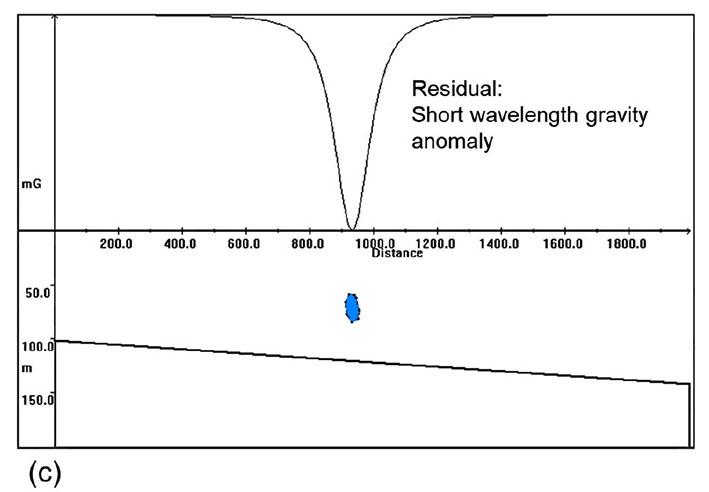
Figure 8—(a) Modelled gravity response of cavity and basement; (b) modelled gravity response basement only; (c) modelled response of cavity only
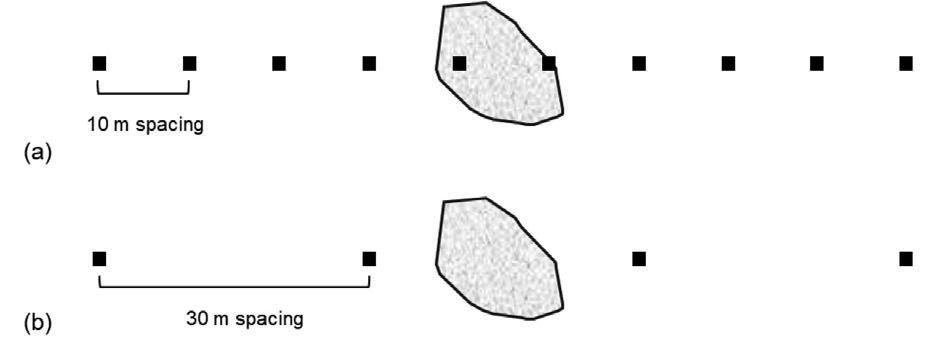
Figure 9—Example showing a plan view of station spacing vs target width. (a) Appropriate spacing of 10 m. (b) Suboptimal spacing of 30 m for a target with an approximate width of 12 m
amplitude is below the detection limit of the instrument. If the realistic sensitivity of the instrument is 0.01 mGal, it will not be possible to detect an anomaly of 0.001 mGal, no matter how close the station spacing.
To illustrate this point more concretely, the limits of detection of a spherical 10 m radius air-filled cavity at depth increments of 10 m, from 20 to 100 m, were calculated using forward modelling,
and are shown in the two figures that follow. The line length in Figure 10 is 500 m, and gravity readings are made at 5 m and 30 m intervals in 10(a) and (b), respectively. The anomalies caused by the cavity at 40 m (–0.010 mGal) and shallower depths are still within detectability limits for both station spacings, provided there is no or only insignificant background noise. The cavities lying deeper than 40 m will not produce gravity anomalies large enough for a standard gravimeter to measure accurately. Realistically, however, only the cavities at 20 m for both station spacings will be reliably uncovered (–0.025 mGal). Note also how the anomaly widens with the wider station spacing.
In Figure 11, the line length is reduced to 100 m, with the same station spacings. The effect of the shorter line length is that the gravity anomaly does not return close enough to the background level, resulting in smaller overall anomalies over the cavity. (To calculate the anomaly’s magnitude, subtract the furthest measurement from the absolute maximum). The cavities at 40 m are now below the limit of detectability (< 0.010 mGal in magnitude). Note also the slightly different scales on the gravity anomaly (vertical) axes of the plots.
Figure 12 shows the modelled gravity response of a variable radius spherical cavity (5, 10, to 25 m radius) at depths of 10, 20, to 100 m, sampled along a 500 m line at 5 m station spacing. The 0.01 mGal limit of detectability is shown as a horizontal dashed line. A large cavity that has a 25 m radius produces a detectable anomaly at all depths from 10 to 100 m, whereas a 5 m cavity is only detectable at depths from 10 to 20 m, and at 30 m depth, it is below the detectability limit. The graph in Figure 13 shows the same permutations of anomaly size with depth, but for a 100 m line length. Note how the detectability of the different cavity sizes drops, with the 25 m radius cavity now only being detectable for depths from 10 to 50 m.
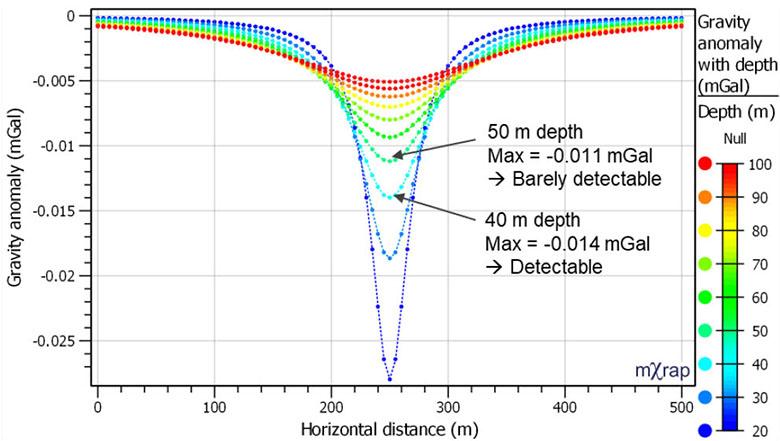

Note again the slightly different scales on the maximum gravity anomaly (vertical) axes between Figures 12 and 13.
Achieving an accuracy of 0.01 mGal
Accuracy and sensitivity are different concepts. Instrument manufacturers will state the sensitivity of an instrument, for example that it is sensitive to field changes of ~0.01 mGal. However, an accuracy of a specified level will only be achieved if readings are carefully made, and drift and tidal corrections are diligently applied. The SANS specifications mention that the accuracy of reduced observations on a relative basis shall be at least 0.01 mGal or better. This means that the standard deviation of all measurements made at a single base station should be 0.01 mGal or less, which is right at the sensitivity limit of most commercial gravimeters. It is doubtful

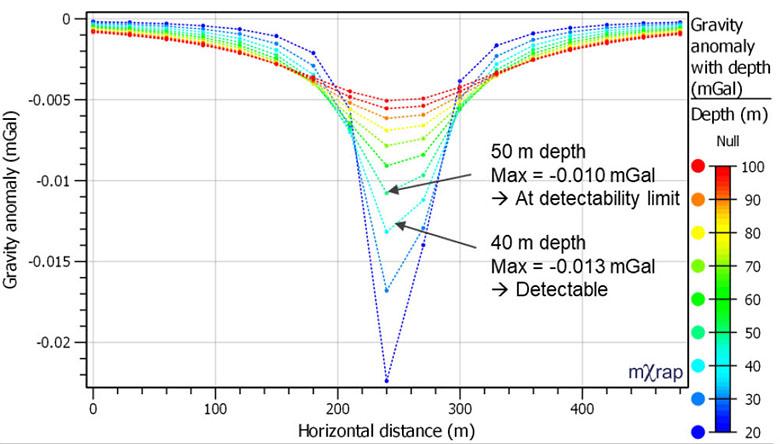

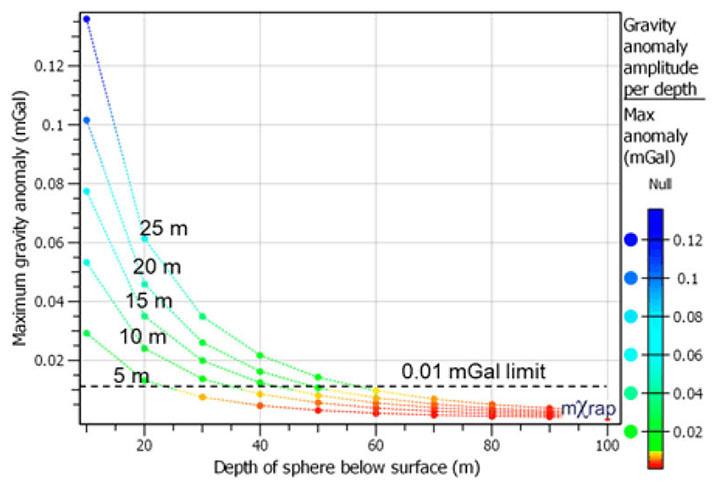
Figure 13—Modelled gravity response of variable radius cavity (5, 10, to 25 m radius) at depths of 10, 20, to 100 m sampled along a 100 m line at 5 m station spacing
that such accuracy is ever achieved in dolomite surveys, given the survey designs and field practices in the industry, as well as the level of anthropogenic noise in urban areas where these surveys are often performed.
This work provides guidelines and explains their origins to aid the geotechnical community with planning and conducting gravity surveys that are tailored to the target type, survey purpose, and geological environment, that will yield useful data. The key considerations are:
➤ As explained in the introduction, the usefulness of the gravity method significantly hinges on adequate sampling not just in the area of immediate interest but also in its near vicinity. This was illustrated by examples in which the line lengths, station spacing, and target sizes were varied.
➤ Looping procedures, often applied in field surveys, run the danger of systematic error propagation, possibly producing a tilt artefact in the apparent regional field. For large surveys, a better approach is to lay out a coarse base station grid with one master base station.
➤ Applying the gravity terrain correction (GTC) is especially important where expected gravity anomalies are relatively small and/or where the topography is highly irregular in the near vicinity of the survey area. The additional value derived from proper GTC processing is not limited to detecting subsurface cavities; it can improve gravity survey results, regardless of a gravity survey’s purpose and despite this paper’s title.
➤ Simple forward modelling can help to assess whether expected targets are detectable in a given geological environment and for a given survey design.
➤ Survey lines must be long enough to capture the regional trends so that they can be subtracted to show residual anomalies. Knowledge of the regional scale geology can help guide the line lengths.
➤ Station spacing must be designed with the minimum target size and expected anomaly magnitude in mind. At least two
survey points are required over the target, and one on each side of it.
➤ The practically achievable gravimeter sensitivity and ambient background noise must be borne in mind to avoid pointless or substandard surveys.
Acknowledgements
The authors hereby extend their deep and heartfelt gratitude to the two anonymous reviewers whose valuable comments and suggestions have added significantly to the quality, the substance, and the readability of this paper.
References
Amarante, R.R., Trabanco, J.L.A. 2016. Calculation of the tide correction using in gravimetry, Revista Brasileira de Geof´ısica (2016) 34(2): 193-206 © 2016 Sociedade Brasileira de Geofísica, ISSN 0102-261X.
Arkell, W.J. 1933. The Jurassic System in Great Britain. Oxford: Oxford University Press.
Bartels, J. 1957. Geophysik II/Geophysics II. Handbuch Der Physik, Encyclopedia of Physics/ Geophysik/Ge. Springer-Verlag.
Collette, R.J. 1958. Structural sketch of the North Sea. Geologie Minjnb, vol. 20, pp. 366–371.
Cooper, G.R.J. 1998. GRAV2DC for Windows User’s Manual (Version 2.05). Geophysics Department, University of the Witwatersrand, Johannesburg.
Dehlinger, P. 1978. Marine Gravity, vol. 22 of Elsevier Oceanography Series. Elsevier.
Goodkind, J. 1999. The superconducting gravimeter. Review of Scientific Instruments, vol. 70. 10.1063/1.1150092.
Longman, I.M. 1959. Formulas for computing the tidal accelerations due to the Moon and the Sun. Journal of Geophysical Research, vol. 64, no. 12. pp. 2351–2355.
Milsom, J. 2003. Field Geophysics Third Edition. John Wiley & Sons Ltd, ISBN 0-470-84347-0.
Mussett, A.E., Aftab Khan, M. 2000. Looking into the Earth: An introduction to geological geophysics. Cambridge University Press, 32 Avenue of the Americas, New York, NY 10013-2473, USA.
Pettit, J.T. 1954. Tables for the computation of the tidal accelerations of the Sun and Moon, vol. 35. Transactions American Geophysical Union
Schureman, P. 1940. Manual of harmonic analysis and prediction of tides. No. 98. U.S. Department of Commerce. Special Publication.
Sunderland, J. 1972. Deep sedimentary basin in the Moray Firth. Nature,vol. 236, pp. 24–25.
Telford, W.M., Geldart, L.P., Sheriff, R.E. 1990. Applied Geophysics Second Edition. Cambridge University Press, ISBN 0-521-33938-3. u

Affiliation:
1AngloGold Ashanti, South Africa
Correspondence to: J. Venter
Email: juventer@anglogoldashanti.com
Dates:
Received: 18 Feb. 2025
Revised: 23 Apr. 2025
Accepted: 17 Jul. 2025
Published: August 2025
How to cite:
Venter, J., Banff, C., Hamman, E.C.F. 2025. Calibratable rock mass shear strength for open pit slopes. Journal of the Southern African Institute of Mining and Metallurgy, vol. 125, no. 8, pp. 467–476
DOI ID:
https://doi.org/10.17159/2411-9717/3674/2025
ORCiD: J. Venter
http://orcid.org/0009-0008-5456-8319
by J. Venter1, C. Banff1, E.C.F. Hamman1
Abstract
Open pit slope stability analyses for large scale instabilities are often carried out using limit equilibrium, finite element or finite difference computer programs. All of these require empirical estimates of rock mass shear strength when calibrated values are not available, which is a common occurrence. A common method of estimating rock mass shear strength is the Hoek-Brown failure criterion, which often over- or underestimates rock mass shear strength when used in limit equilibrium or elastic linearly plastic slope stability analyses, resulting in published alternative estimates for the coefficients of the Hoek-Brown failure criterion. This paper investigates the differences between limit equilibrium and elastic linearly plastic slope stability analysis based on the Hoek-Brown failure criterion. The investigation consisted of a comparison of 3840 RS2 finite element analysis models completed with strain softening, and 216 Slide2 limit equilibrium models. The models were used to evaluate a methodology to determine equivalent limit equilibrium and elastic linearly plastic shear strength parameters that provide the same stable slope angles and instability back break distances as the more representative strain softening stress analysis methods. This paper presents the methodology and compiles the results into design charts and equations for equivalent limit equilibrium Mohr-Coulomb shear strength parameters, that simplify calibration against actual case studies. The results compare well with older empirical shear strength estimates, however, a detailed calibration of the results against case studies will need to be carried out. The analysis also did not consider pore pressure effects; this is left for future publication.
Keywords
rock mass strength, open pit slopes, Hoek-Brown, strain softening, Mohr-Coulomb
Introduction
Estimation of rock mass strength forms part of the open pit slope design process, as this parameter is a required input for the calculation of inter ramp and overall slope factors of safety (FS) and strength reduction factors (SRF). FS and SRF are typically assessed through limit equilibrium or elastic linearly plastic stress analysis methods. Rock mass shear strength estimates are particularly important for slope failure mechanisms where rock mass shear strength is a significant contributor to stability. Examples of rock mass shear strength controlled failure mechanisms are rotational failure in soft to medium strength rock masses and complex structural and rock mass fabric failure mechanisms where rock bridges often contribute most to the stability.
In an ideal world, rock mass strength would be measured directly, but as demonstrated by Hoek and Brown (1980), there is a scale component to rock mass strength, hence testing would have to occur on rock blocks of similar scale as the slopes being designed, for truly representative results. Testing of specimens of two orders of magnitude greater than current laboratory standards is physically impractical, thus rock mass strength estimation requires empirical rock mass strength models based on experience and back analysis. The most common, and perhaps most debated, model used today is the Hoek-Brown empirical peak rock mass shear strength model. The latest update of this model is published by Hoek and Brown (2019).
Limit equilibrium analysis models exclude strain compatibility and cannot accurately model rock mass behaviour, while stress models (i.e., finite elements and finite difference) can, if used correctly. This argument was used against the use of 3-dimensional limit equilibrium models by Read (2021). Read (2021) did however concede that 2-dimensional limit equilibrium methods can be used as they
represent a calibrated system due to being in use for so long. The problem with adopting a stress model only approach, is that this higher-level analysis also requires significantly more model settings that can impact the results, such as element (or grid) types, shapes and sizes, maximum number of iterations, and also the elastic (and plastic) properties of the materials. The practical significance is that slope designs during the investment phase of projects (i.e., concept, prefeasibility, and feasibility) often will not have sufficient information for model correlation or calibration to build reliable stress models. Stress models also tend to take significant time to build and run, which becomes capital (time) intensive. In practice, the time and data limitations to perform the sensitivity analysis that is required to understand failure mechanisms early on in a project, are therefore still reliant on traditional limit equilibrium approaches.
While Hoek (2007) proposes using the Hoek-Brown failure criteria in limit equilibrium software, Hoek (2007) also states that rock mass should be analysed using strain-softening failure criteria, as that represents the known behaviour of rock masses. Using strain-softening failure criteria is a significant hurdle to the current implementation of the Hoek-Brown failure criterion within limit equilibrium software, as Hoek-Brown only describes the peak shear strength criterion, which should be used as a yield criterion, as per Hoek (2007) and Hoek and Brown (2019). Many slope designs are carried out using limit equilibrium methods while basing the rock mass strength estimates on the Hoek-Brown failure criterion, and as such are over/under estimating stability.
A methodology by Hoek (2007) to estimate an equivalent linear Mohr-Coulomb failure criterion from the non-linear Hoek-Brown failure criterion, simplified the use of the Hoek-Brown criterion for computational purposes, but did not capture the strain softening behaviour of rock mass material. This problem could have been resolved by demonstrating the calibration of the Hoek-Brown failure criterion as used in limit equilibrium software. Sjoberg (1999), Douglas (2002), and Garcia and Alcantara (2024) compared the Hoek-Brown failure criterion to slope stability cases using elastic linearly plastic models in finite difference software, and all these authors concluded that the Hoek-Brown model could significantly over- or underestimate shear strength, leading these authors to provide alternative coefficients for the model. While these authors used 2-dimensional elastic linearly plastic models, the SRF results will likely be similar to limit equilibrium FS values, as elastic linearly plastic and limit equilibrium analysis in two dimensions provide similar results as demonstrated by Hammah et al. (2004). It can therefore be concluded that a calibration of the Hoek-Brown peak shear strength model against slope case studies will show that stability can be over- or under predicted by a significant margin. Instead of arguing against the use of the Hoek-Brown model, this paper takes the approach that all of these authors have valid points, and that reconciliation between their ideas can be found by tweaking the approach, as explained with reference to Figure 1 and Figure 2.
Figure 1 shows an idealised stress-strain graph for rock mass, with the rock mass behaviour close to slope faces at low confinement represented as Line 1 (green dash dots). Stability analysis using finite element and finite difference software is capable of modelling such behaviour, however, as stated earlier, significant additional data and computational effort is needed and so this approach is not practical for many slope stability problems. A simplified approach, the elastic instantaneously plastic model, is available in many software codes, and approximates rock mass
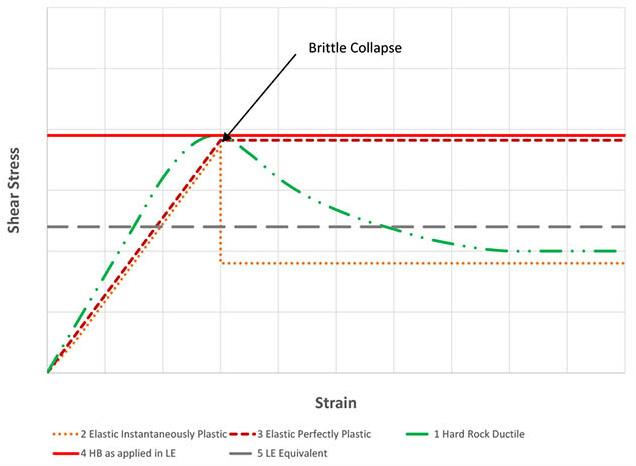
behaviour using an idealised linear stress-strain profile with instant strain softening as demonstrated by Line 2 (orange dots).
It is common for design engineers to use an elastic linearly plastic stress-strain profile (i.e., peak strength criteria) as shown by Line 3 (dark red dashes) when using finite element or finite difference software to estimate the SRF. The elastic linearly plastic approach tends to deliver SRF values close to the limit equilibrium FS (Hammah et al., 2004).
The reason the elastic linearly plastic SRF and the limit equilibrium FS tend to be similar, is that they both reflect a similar stress-strain profile. This is demonstrated by Line 4 (solid red) in Figure 1, which shows the stress-strain profile assumed when using limit equilibrium software. This is caused by two reasons:
➤ The limit equilibrium method can only account for force and moment equilibrium (depending on which method of slices is used; see Duncan and Wright (2005) for a good comparison) and is unable to account for the stress/strain relationship of rock masses, hence strength values must lie on a horizontal line in a stress-strain graph.
➤ One of the fundamental assumptions behind all limit equilibrium methods is that the FS values are the same for each slice generated using the method of slices as the overall FS value for a given slip surface.
As a result, SRF and FS analysis provide similar results as their stress-strain curves are similar for elastic linearly plastic material parameters.
Using the Hoek-Brown peak failure criterion in SRF or LE analysis over- or underestimates shear strength as real rock masses strain soften or strain harden and are not linearly plastic. This is illustrated in Figure 1 by the difference between Line 1 (representing real behaviour) and Lines 3 and 4 (representing idealised linearly plastic behaviour) to the right of the peak shear strength point. This difference explains why many authors such as Sjoberg (1999), Douglas (2002), and Garcia and Alcantara (2024) required a recalibration of the Hoek-Brown coefficients to match their back analysis based on elastic linearly plastic analysis.
Another study by Rose et al. (2018) concluded that using the Hoek-Brown failure criterion presents more realistic results when the D factor is scaled with confinement to match their case studies. Rose et al. (2018) propose that this must be caused by the HoekBrown failure criterion not accounting for the lack of blast damage
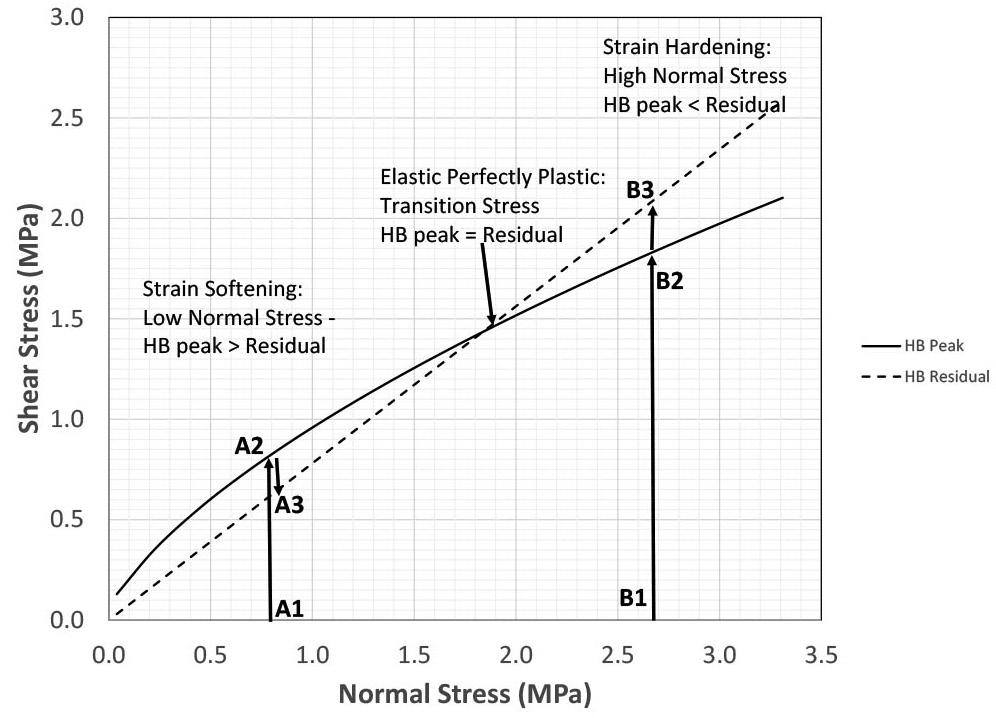
further from the slope face. Their solution was to define a stronger rock mass farther from the slope face to prevent deep seated failure mechanisms. The authors of this paper do not doubt that blast damage reduces with distance from the slope face, however, there is another mechanism that explains the shallow failure surfaces observed in the real world, and also the potential reduction in blast damage with depth. This can be explained by considering Figure 2.
Figure 2 shows the normal stress shear stress graph for a hypothetical rock mass. The solid line represents the Hoek-Brown rock mass peak shear strength. The dashed line represents the residual shear strength, assumed to be a straight line here with a friction angle of 38°. Three zones are indicated: The strain softening zone where the peak shear strength is higher than the residual shear strength, the strain hardening zone where the Hoek-Brown peak shear strength is below the residual shear strength, and the inflection point where the two lines cross, which represents the only point on the graph where elastic linearly plastic conditions occur. It is often assumed that this inflection point occurs at high confinement outside of slope conditions, but as shown in this example, this inflection point can occur at typical slope stresses for weak to medium strength rock. The example here represents a σci of 40MPa, GSI of 40 and mi value of 8 and D of 0.7.
Two stress paths are shown, Stress Path A and Stress Path B, both with constant normal stress. In Stress Path A, the shear stress increases from A1 to the peak shear strength at A2, followed by strain softening from A2 to the residual shear strength at A3. This represents the zone where the Hoek-Brown failure criterion tends to overestimate shear strength and which was the focus of the work done by Sjoberg (1999), Douglas (2002), and Garcia and Alcantara (2024). Stress Path B starts at B1 and behaves elastically to B2 as shear stress is increased. At B2 the rock mass starts strain hardening until the yield point at B3 is reached where the rock starts yielding without strength gain. In this zone, using the Hoek-Brown peak failure criterion will result in underestimated FS or SRF values as the curvature in the Hoek-Brown curve results in shear strength predictions below that of a friction only material, such as sand or gravel.
The investigation presented in this paper is based on the position that all the authors who investigated this problem have valid points, but that their results differ because they were not talking about the same regions on the shear stress – normal stress graph. To investigate this position, this paper determines the equivalent limit equilibrium cohesions and friction angles that will
provide an FS of 1 for a series of dry slope scenarios analysed using elastic instantly plastic finite element analyses. This is analogous to Line 5 (dashed grey) in Figure 1, which lies above the residual shear strength, but below the peak shear strength. This analysis is presented for slope heights of 200 m, 300 m, and 500 m, and a range of σci, GSI, mi and D values that span across most of the valid ranges for these parameters. Pore pressure effects were not investigated in this paper.
The equivalent limit equilibrium rock mass shear strength model was developed by comparing 3 840 analysed slope scenarios using the finite element software RS2, and 216 scenarios in the limit equilibrium software Slide2. The analysis consisted of generating 1 280 shear strength scenarios covering almost the full spectrum of possible combinations of Hoek-Brown parameters in a multidimensional grid. For each of the shear strength combinations, three sets of RS2 model slopes were generated with heights of 200 m, 300 m, and 500 m. For each slope height set, a model representing a different slope angle series was generated. The slope angles in the series ranged in one-degree increments from 25° to 89°.
The aim of the RS2 scenario analysis was to determine the slope angle that is ‘just stable’ (e.g., near an FS of 1) for each shear strength parameter set. For the purpose of this paper, this angle is called the critical angle. This was achieved by analysing each slope scenario in a number of slope angle stages, with the first stage starting at 25° and increasing the slope angle by a degree for each subsequent stage. As the first stage was defined to always be stable, increasing the slope angle in subsequent stages resulted in decreased stability until the critical angle was reached, with further slope angle scenarios failing to converge. To save time, the analysis was programmed to stop once the critical angle was reached. The last stage where the model converged within a set number of iterations was taken as the critical angle slope. In this way a database was created representing slope heights of 200 m, 300 m, and 500 m, and all the different combinations of σci, mi, GSI, and D, containing backbreak distances corresponding to each critical angle.
The limit equilibrium analysis was then used to determine Mohr-Coulomb parameters that match the critical angles and backbreak distances for the slope angle scenarios obtained in RS2. Integration of the results was carried out by matching the critical angles and backbreak distances from the limit equilibrium models and the finite element models (see Figure 3 for a demonstration).
The relationship between the equivalent limit equilibrium cohesion and the critical angle for each of the three slope heights were analysed. This correlation was used to determine the
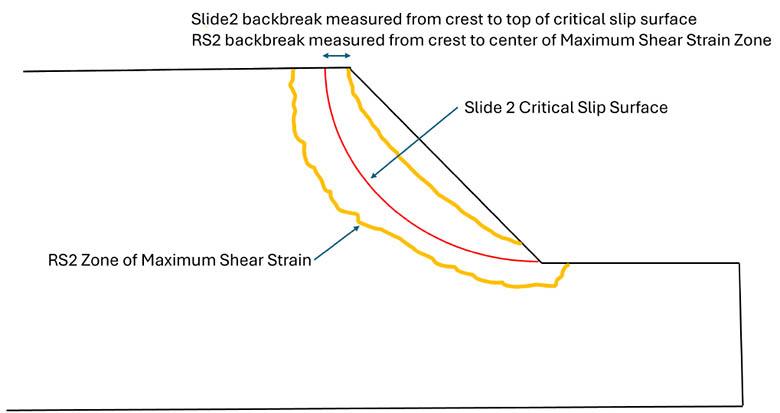

equivalent limit equilibrium cohesion. The process is illustrated graphically in Figure 4, which refers to equations and figures in Section 3.
In this way equivalent limit equilibrium cohesion and friction angle values, that provide the same Critical Angle and back break distance from the crest between limit equilibrium and finite Element methods, can be calculated.
The finite element analysis consisted of a single model with slope angles from 25° to 89° in one degree increments, as shown in Figure 5.
The model was run by simulating each slope angle as a different stage starting with the first stage having a slope angle of 25° and then progressively increasing the slope angle one stage at a time until the model no longer equilibrates. The model was then terminated to save time as further stages would simply increase the model run time without adding to the result. The last stable angle was used for the analysis and reported as the critical angle.
To test the effect of mesh element size on the model result, a sensitivity analysis was carried out on the following mesh element number scenarios:10 000, 20 000, 30 000, 40 000 and 80 000. All the scenarios were evaluated for the 500 m slope height model, which has the largest mesh element size, and for 3 sets of material parameters: an intact rock σci of 10MPa, 100MPa and 140MPa, and GSI values of 10 and 50, respectively, with mi values of 40. The sensitivity analysis showed that the error made if using 20 000 mesh elements per model (as opposed to 80 000 mesh elements) would be between 0° and 3° with a standard deviation of 1.4° in terms of critical angle. As the combined model run time for all analyses was approximately 1 year for a 20 000-mesh element case and increasing the number of mesh elements to 30 000 would take approximately 1.5 years to run, the decision was made to accept the error.
The main model settings were:
➤ Uniform mesh type;
➤ 3 noded triangles;
➤ 20 000 mesh elements regardless of slope height;
➤ Generalised Hoek Brown material strength model with strain softening.
1 280 scenarios for each slope height were simulated using the following parameters:
➤ Slope Height = 200 m, 300 m, and 500 m;
➤ σci = 10 MPa to 160 MPa in 10 MPa increments;
➤ Hoek Brown GSI value = 10 to 80 in increments of 10;
➤ Hoek Brown mi value = 5, 10, 20, 30, 40;
➤ Hoek Brown D value = 0.7 and 1.
➤ Residual shear strength of 0 kPa cohesion and 38° friction angle, following the suggestion by Hoek (2007). The residual strength was considered linearly frictional to high confinement motivated by experiments done on high confinement friction angles of rock by Byerlee (1978), and is therefore considered approximately realistic for rock masses.
For each of the models, the elastic linearly plastic option for the generalised Hoek-Brown shear strength parameters were used. The Poisson's ratio was set to 0.25 representing a mid-range for most rock types and the rock mass elastic modulii were calculated using the Hoek and Diederics (2006), as shown in Equation 1.

As the RS2 software requires Hoek-Brown inputs for both the peak and post peak shear strengths, the equivalent Hoek-Brown inputs for 0kPa and 38° friction angle were determined using the chart derived for this purpose, as depicted in Figure 6. The chart was derived by fitting the Hoek-Brown equation through a series of data points representing various friction angles with zero cohesion. Using this chart, selecting a 38° friction angle with zero cohesion requires using the same σci value as the peak shear strength, a sresidual value of 0.0001, an aresidual value of 1 and an mresidual value of 3.3. The fixed sresidual and aresidual values will always result in a MohrCoulomb line with zero cohesion. Varying the mresidual changes the residual friction angle, while varying the σresidual makes no difference. This is, however, hard coded into software codes, and so needed to be factored in.
The limit equilibrium analysis utilising Slide2 from Rocscience, consisted of carrying out a slope stability sensitivity analysis to determine the scenario slope angle with a factor of safety of 1 (critical angle) and the corresponding backbreak distance from the crest. A total of 216 scenarios were analysed, representing all combinations of the following attributes:

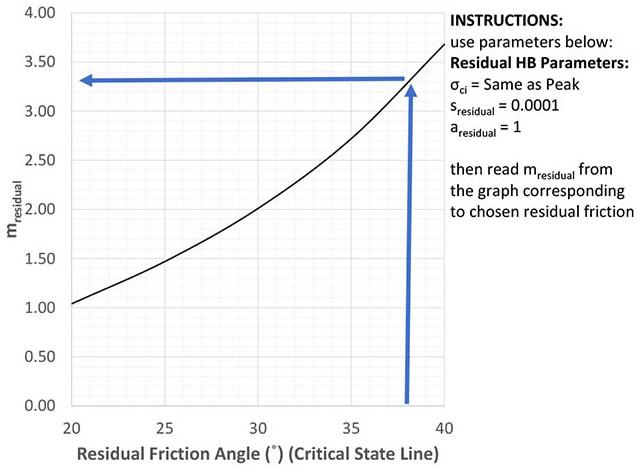
➤ Slope Height = 200 m, 300m, and 500 m;
➤ σci = 10 MPa, 50 MPa, 100 MPa, 150 MPa;
➤ Hoek Brown GSI value = 20, 40, 60;
➤ Hoek Brown mi value = 5, 20, 40;
➤ Hoek Brown D value = 0.7 and 1.
These values were selected to represent a realistic full spread of the likely parameters for the majority of rock slopes.
An example of a model used is presented as Figure 7 representing a 55° slope.
The model settings were:
➤ GLE/Morgenstern-Price;
➤ Number of slices = 50;
➤ Tolerance 0.005;
➤ Maximum Iterations 75;
➤ Non-circular;
➤ Path search;
➤ Optimisation settings = defaults.
Equivalent limit equilibrium Mohr-Coulomb parameters
During this process, it was realised that the relationship between these two analysis types can be simplified to reduce the number of Slide2 scenarios needed, because equivalent friction angles could be found to match both the critical angle and the backbreak distance from the crest by considering only variations in the σci. Therefore, the relationship between σci and the equivalent limit equilibrium friction angle was utilised to simplify the integration.
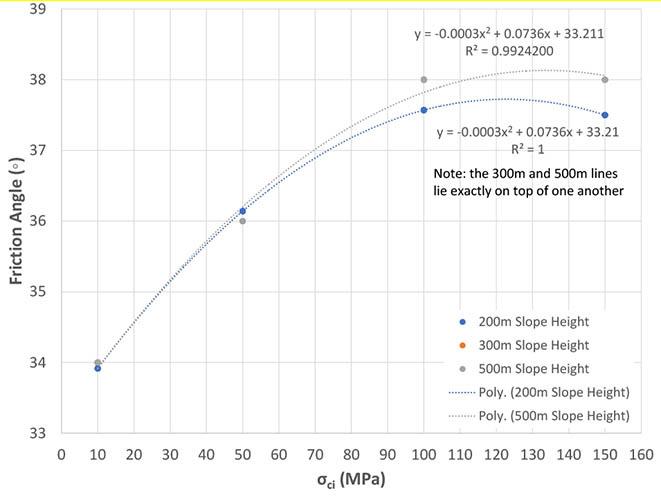
Results of the limit equilibrium and finite element analysis are compiled in the following to show how the limit equilibrium results were matched to the finite element analyses, the equivalent limit equilibrium Mohr-Coulomb (ELEMC) parameters were matched to the Hoek-Brown parameters, and how rock mass strength for limit equilibrium and elastic linearly plastic finite element analyses can be estimated. To achieve these, the ELEMC friction angle results are presented first, followed by the ELEMC cohesion.
Equivalent limit equilibrium Mohr-Coulomb friction angle Matching of LE to FE occurred by matching the critical angle and back break distance for each FE scenario to an LE scenario. As the LE back break for each slope is precisely specified by the critical failure surface, but the FE back break is provided by a broad zone of maximum shear strain, there was a little leeway in matching multiple FE analyses to each LE analysis. Using this leeway, it was discovered that the ELEMC friction angle can be directly correlated to the Hoek-Brown σci parameter, as demonstrated in Figure 8, with the choice of GSI, mi and D making no difference. Each point visible in the figure represents 6 points as combinations of GSI, mi and D. Figure 8 also shows that the 300 m and 500 m regression curves are exactly the same, but that the 200 m line provides slightly lower ELEMC friction angles by about half a degree, which is considered immaterial. This difference is likely smaller than the margin of error in estimating σci and so, for practical purposes, one might choose the 300 m and 500 m equation for the relationship as presented in Equation 2:


Equivalent limit equilibrium Mohr-Coulomb cohesion
The first step in deriving the ELEMC cohesion values was to find the correlation between the critical angle and the ELEMC cohesion for the LE results, these relationships are presented as Figure 9, with the matching equations for each slope height scenario. Some scatter is evident at lower critical angles due to the wide possible range of backbreak obtained in low slope angle finite element models.
The results also showed that a correlation is available between the back break distance and the ELEMC cohesion, as presented in Figure 10. This demonstrates that back break distance, cohesion, and the critical angle are closely related.
As the critical angle and the ELEMC cohesion intercept is correlated, and the critical angles were determined to the nearest 1°, the equation corresponding to the appropriate slope height scenario in Figure 9 was used to determine the ELEMC cohesion for the RS2 scenarios.
In summary, the ELEMC friction angles were determined from the FE scenario σci using Equation 2, and the ELEMC cohesion intercept was determined from the appropriate equation in Figure 9. This allowed the compilation of a data table with 3 840 scenarios that matches the Hoek-Brown parameters to the ELEMC parameters through the back break and critical angle.
Analysis of the 3 840 finite element scenarios
The previous section showed how the LE and FE analyses could
be matched to obtain an ELEMC friction angle and cohesion intercept for each Hoek-Brown FE scenario. This section presents selected figures from the resulting database of matching σci, GSI, mi, D, cohesion and friction angle groups, and derives simplified regression equations to estimate the ELEMC parameters from the data table. During the batch runs, 445 of the model result files became corrupted and were discarded. Most of these were during the 200 m slope height runs that would have resulted in critical angles of greater than 70 degrees. Furthermore, an additional 318 of the models did not produce a critical angle as the slope height and slope angle combination was not sufficiently high/steep to cause slope instability.
The first relationship to be displayed is that of the critical angle vs. GSI in Figure 11. Figure 11 shows that the maximum slope angle for all three slope height scenarios (200 m, 300 m, and 500 m) reached 89°, which means that for the stronger rock mass scenarios, the slope heights were not high enough to trigger instability, and the critical angle reported in Figure 11 is merely where the analysis stopped, not where the slope failed. The 200 m case has a higher critical angle for GSI values below 50, as the lower slope height requires less shear strength to be steeper than higher slope heights. A similar difference can be seen between the 300 m and 500 m cases.
The resulting plateau in critical angles can clearly be seen in Figure 12 that shows the average critical angle for all D and σci scenarios corresponding to each GSI value for the 3 slope heights.
As a result, one can expect to see a limit to the ELEMC cohesion values corresponding to each slope height. This is presented as the red arrows in Figure 13, which shows the ELEMC cohesion intercepts vs. GSI. These limits are 1 480 kPa for 500 m slope scenarios, 920 kPa for 300 m slope scenarios, and 620 kPa for 200 m slope scenarios.
To understand the effect of the Hoek-Brown D value on the ELEMC cohesion intercept, a GSI vs. ELEMC cohesion intercept sensitivity is presented for the two D value scenarios, as shown in Figure 14.
The two lines represent the average of all mi values for each GSI and D combination based on a σci value of 100 MPa. From Figure 14 reducing the D value from 1 (open pit disturbed) to 0.7 (open pit undisturbed) increases the ELEMC cohesion intercept by as much as 300 kPa for GSI values between 50 and 60, but the difference is smaller for GSI values below 50 and above 60. The result is that D has a greater effect on ELEMC cohesion and could potentially be a lever that can be used to calibrate this model against case studies.

Similarly, the effect of the Hoek-Brown mi value was evaluated and is shown for different mi values plotted in Figure 15, representing a σci value of 100 MPa and a D value of 0.7.
Figure 15 shows that the ELEMC cohesion intercept is less sensitive to changes in mi value than the D value. For GSI values above 65 and below 50 the ELEMC cohesion intercept is not sensitive to mi
In summary, this section showed that the 3 077 (3 840 -445 – 318) sets of matching ELEMC and Hoek-Brown parameters resulting from the LE to FE comparison can be used to obtain

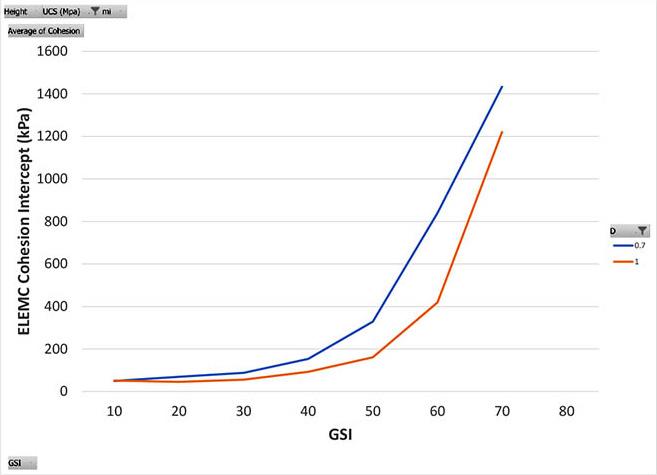

Figure 15—Example curve for 100 MPa σci showing effect of mi values
ELEMC parameters based on Hoek-Brown parameters. The results show that the ELEMC cohesion intercepts are sensitive to the Hoek-Brown D values, but less sensitive the Hoek-Brown mi value. The ELEMC friction angles could be determined by the simplified method presented already and so were not considered in this section. The next section analyses the results to determine regression equations that can be used to provide ELEMC parameter estimates.
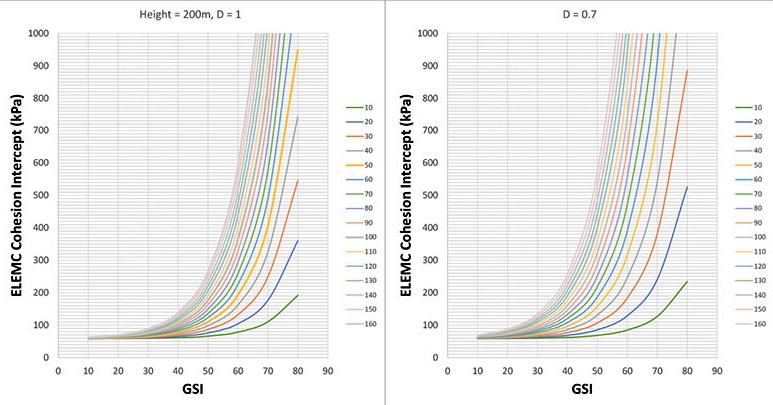

Regression curves
The true value of using the Hoek-Brown to ELEMC approach is that it allows for ongoing calibration of the design curves as more case studies become published, by updating the Hoek-Brown D parameter in the regression equations. It is the authors’ view that as more large open pit failures are reported, the additional data will facilitate fine tuning of the results that can then be fed back into the design of slopes. Towards this calibration, the logistic regressions used to fit the initial database are shown in Equation 3 and Equation 4 with regression coefficients compiled in Table 1.
Figure 16, Figure 17, and Figure 18 show the resulting cohesion design charts based on the Hoek-Brown to ELEMC analyses for slope heights of 200 m, 300 m, and 500 m, and D values of 0.7 and 1. The design charts were created by smoothing the results to remove irregularities caused by the granularity in the results, while still maintaining the integrity of the overall pattern.
Coefficients for calculating L
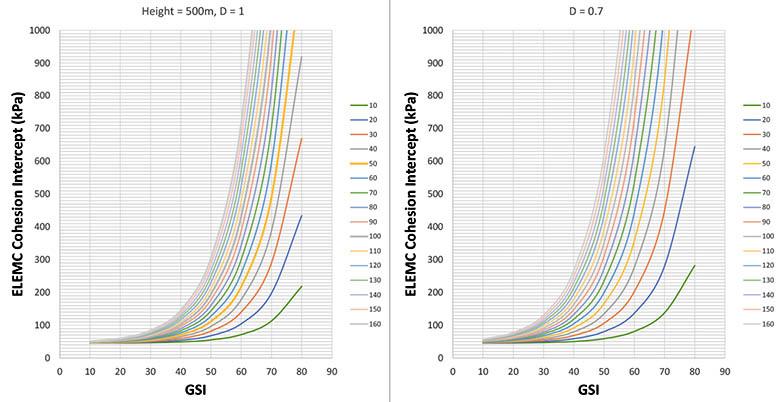
The Logistics curve was used for the ELEMC cohesion intercept (in kPa) with trial-and-error fit to match all combinations of the Hoek-Brown parameters. The results equation for ELEMC is:


The coefficients needed are presented in Table 1 that follows.
As a mathematical regression could not be used due to the number of variables and the complexity of the shape, a regression coefficient could not be calculated, but a series of manual 2-dimensional approximate relationships were developed. These approximate relationships are reasonably close to the analysed results, especially for GSI values below 60, but differences do occur. As a result, it will always be preferable to repeat this process for the specific material parameters encountered in a project. This will also allow the measured value of mi to be included in project specific calibration of properties if more accurate ELEMC parameters are needed.
Discussion
This paper sets out to compare the use of strain softening shear strength parameters, which more accurately represent rock mass behaviour than peak strength parameters typically used, against the use of equivalent limit equilibrium shear strength parameters (ELEMC) that provide the same critical slope angles and back break distances as the strain softening parameters. The results of the comparison demonstrate some important lessons. These are discussed in the following.
The equivalent ELEMC parameters as determined in the previous chapter are roughly in the same order of magnitude as the back analysed parameters proposed by Hoek and Bray (1981). This is valid for both the friction angles (30° to 40° for the equivalent LE values vs. 30° to 40° for the back analysed parameters) and the cohesion values (up to 1500 kPa for the equivalent LE values vs. up to 550 kPa for the back analysed values). The cohesion values appear somewhat different at first glance, however, the 1480 kPa result is for a slope with values for σci = 150 MPa value and GSI = 80.
These parameters are so strong that they are not represented in the Hoek and Bray (1981) database. Limiting the GSI value to a more common 60, and the σci to 100MPa, provides an ELEMC cohesion intercept estimate of 700kPa, which is not far off the Hoek and Bray (1981) database. Similarly, a comparison with the back analysed correlation presented in Singh and Goel (2011) back analysed values shows a similar agreement.
The models provided are correlated with the Hoek Brown peak shear strength criterion in combination with strain softening analysis using a residual friction angle of 38°. This makes them more realistic than estimates determined using the Hoek-Brown peak shear strength criterion alone. However, as the curve fitting process still has room for improvement, and only considers correlation against Hoek-Brown parameters, these models will still benefit from calibration against back analysis. The authors envisage investigating such a calibration for future publication, for this purpose the model was set up in such a way that readers can calibrate the model against their own data by changing the coefficients a and b in Table 1 representing different D values.
The results showed that the Hoek-Brown mi value only has a minor role to play as demonstrated in Figure 15, which means it can be argued that for smaller projects, or early design stages, the value of mi can be ignored, or triaxial testing postponed until later stages of the project. Perhaps more value will be had by using the available budget for more UCS testing.
The model can be used in three ways:
➤ Equivalent LE friction angles can be read off Figure 8 directly, and equivalent cohesion values can be read off Figures 15 to 17 once the appropriate slope height, GSI, σci and D is selected.
➤ The equivalent LE friction angles can be calculated using the Equation 1, and the equivalent cohesion can be determined by selecting the appropriate coefficients in Table 1, calculating L using Equation 4 and then the equivalent cohesion using Equation 3.
➤ An unintended benefit that arose from the results is that for existing slopes where cracks had formed, a rough estimate of the equivalent LE cohesion can be made using Figure 10. Interestingly, this relationship is agnostic of slope angle and slope height.
Using this approach assumes the user agrees that Hoek-Brown is correct, an mi value of 20 is appropriate and agrees with the RS2 modelling approach used, and the residual friction angle of 38°. Should the user not accept these assumptions or would prefer to calibrate their LE analysis using project specific data or more rigorous stress analysis, the approach described in this paper can be replicated. The important part of the approach is that the critical angles and backbreak must match in corresponding models, not the FS values.
It is to be noted that, this research did not simulate the effect of ground water on the results, this is left for potential future publication.
Conclusion
In conclusion, this paper fulfilled its stated objectives by deriving equivalent LE Mohr-Coulomb parameters for open pit slopes based on strain softening finite element analysis. The results demonstrated that the equivalent LE Mohr-Coulomb parameters provide more realistic slope angles than those obtained when using Hoek-Brown peak shear strengths in limit equilibrium software. It is therefore suggested that more appropriate limit equilibrium shear strengths will be obtained by calibrating against strain softening numerical models for a project using the methodology presented in this paper. In the absence of strain softening models, the simplified results presented in this paper can be considered to provide early estimates of the ELEMC friction angle and cohesion intercept. Following the work presented in this paper, several shortcomings that leave room for further investigation are:
➤ The ELEMC parameters are correlated with elastic linearly plastic Hoek-Brown parameters, however, in reality rock masses are not linearly plastic. Different results may be obtained if correlated with strain softening models that provide a graded transition from peak to residual strengths.
➤ The ELEMC parameters in this paper are easily calibratable but have not been calibrated yet. Further work in this regard is needed.
➤ There is also room for improvement in regression analysis of the database. The authors have exhausted their resources to find these curve fits, but ideally, access to software that can handle regression with 8 or more variables is needed.
➤ Groundwater was also not investigated and needs to be considered.
We look forward to seeing these issues investigated in future. With this in mind, interested readers are encouraged to collect databases containing the Hoek-Brown parameters: GSI, σci, mi, and D values corresponding to back analysed ELEMC cohesions and friction angles for both failed and stable slopes, and contact the authors.
References
Byerlee, J. 1978. "Friction of Rocks." Pure and Applied Geophysics vol. 116, pp. 615–626.
Douglas, K.J. 2002. The shear strength of rock masses - Phd Thesis. Sydney: The Univeristy of New South Wales.
Duncan, J.M., Wright, S.G. 2005. Soil Strength and Slope Stability Hoboken, New Jersey: John Wiley & Sons.
Garcia, R.R.P., Alcantara, J.A.S. 2024. "Equivalent Geological Strength Index approach with application to rock mass slope stability." Nova Lima.
Hammah, R.E., Curran, J.H., Yacoub, T., Corkum, B. 2004. "Stability analysis of rock slopes using the finite element method." Salzburg: Eurock 2004 & 53rd Geomechanics Colloquium Schubert (ed).
Hoek, E. 2007. Practical Rock Engineering. Toronto: www.rocscience. com.
Hoek, E., Brown, E.T. 2019. "The Hoek-Brown failure criterion and GSI - 2018 Edition." Journal of Rock Mechanics and Geotechnical Engineering, pp. 445–463.
Hoek, E., Brown, E.T. 1980. Underground Excavations in Rock. London: Institution of Mining and Metallurgy.
Hoek, E., Bray, J. 1981. Rock Slope Engineering. Revised 2nd edition. London. Institution of Mining and Metallurgy
Hoek, E., Diederichs, M.S. 2006. "Empirical estimation of rock mass modulus." International Journal of Rock Mechanics and Mining Sciences, pp. 203–215.
Hoek, Evert, Carlos Carranza-Torres, Brent Corkum. 2002. "HoekBrown failure criterion – 2002 edition." Accessed 01 22, 2025. https://static.rocscience.cloud/assets/verification-and-theory/ RSData/Hoek-Brown-Failure-Criterion-2002-Edition.pdf.
Read, J.R.L. 2021. "Three-dimensional limit equilibrium slope stability analysis, method, and design acceptance criteria uncertainties." Perth: P.M. Dight (ed). SSIM 2021. Second International Slope Stability in Mining. Australian Centre for Geomechanics. pp.3–10.
Rose, N.D., Scholz, M., Burden, J., King, M., Maggs, C., Havaej, M. 2018. "Quantifying transitional rock mass disturbance in open pit slope related to mining excavation." Seville: Slope Stability 2018. Asociacion National de Ingenieros de Minas & Colegio Oficial de Ingenieros de Minas Del Sur.
Singh, B., Goel, R.K. 2011. Engineering rock mass classification Oxford: Butterworth-Heinemann.
Sjoberg, J. 1999. Analysis of large scale rock slopes - Phd Thesis. Lulea: Lulea University of Technology.
Sjoberg, J. 1999. Analysis of Large Scale Rock Slopes. Phd Thesis. . Lulea: Lulea University of Technology. u

Affiliation:
1National Institute of Technology Raipur, India. 2Indian Institute of Technology (BHU) Varanasi, India
Correspondence to:
M.M. Masood
Email: maneebmasood@gmail.com
Dates:
Received: 10 Apr. 2025
Revised: 2 Jul. 2025
Accepted: 25 Jul. 2025
Published: August 2025
How to cite:
Masood, M.M., Verma, T., Raju, G.Y. 2025.
Development of a filtered inverse velocity method analyser: A comparative study of smoothing filters in surface mines for optimisation of slope failure predictions.
Journal of the Southern African Institute of Mining and Metallurgy, vol. 125, no. 8, pp. 477–484
DOI ID:
https://doi.org/10.17159/2411-9717/3709/2025
ORCiD:
M.M. Masood
http://orcid.org/0000-0002-2445-7406
T. Verma
http://orcid.org/0000-0002-3875-9704
G.Y. Raju
http://orcid.org/0000-0001-8330-9940
by M.M. Masood1, T. Verma2, G.Y. Raju2
Abstract
The inverse velocity method has proven to be an effective approach for predicting slope failures in surface mines by analysing displacement monitoring data. However, the accuracy of inverse velocity method predictions is significantly affected by instrumental noise and natural environmental variations, which influence the identification of different deformation stages. To enhance predictive accuracy, this study applies and evaluates three filtering techniques to velocity time series data: Exponential smoothing filter, short-term smoothing filter, long-term smoothing filter and also compares it to raw data (no filtering). A refined prediction framework, that is, filtered inverse velocity method analyser, is proposed to improve slope failure forecasting in surface mining operations. The results demonstrate that filter selection plays a crucial role in optimising failure time predictions, offering valuable insights for geotechnical monitoring and early warning systems in surface mines.
Keywords
slope monitoring, slope stability radar, surface mines, early warning systems, inverse velocity method
Introduction
Slope failures in surface mines represent one of the most critical challenges in the mining industry, posing severe risks to worker safety, operational efficiency, and financial stability. Slope deformations in mines, characterised by their sudden nature, can occur both during active mining operations and long after mining cessation due to residual geotechnical instabilities (López-Vinielles et al., 20200). The instability of mine slopes is influenced by various factors, including excavation activities, geological conditions, groundwater dynamics, and external loading factors such as blasting or heavy rainfall (Tao et al., 2020). The consequences of slope failure extend beyond safety hazards, as they lead to equipment damage, production losses, environmental impacts, and increased operational costs (Yalagandala akshay kumar et al., 2019).
Maintaining high production rates while ensuring the stability of slopes is a crucial balancing act in mine planning and design. Overly conservative designs can lead to unnecessary over-excavation and increased costs, whereas inadequate slope stabilisation measures heighten the risk of catastrophic collapses (Kolapo et al., 2022; Obregon, Mitri, 2019). To manage this challenge, the mining industry increasingly relies on monitoring systems that track slope movement, displacement, and deformation trends to provide early warning indicators of failure (Prasad et al., 2021). The ability to accurately predict slope failure time is fundamental to ensuring both operational continuity and worker safety, necessitating the development of robust predictive models and real-time assessment tools (Zevgolis et al., 2018).
Among the various techniques used for slope failure prediction, displacement monitoring plays a central role. Displacement, along with its derivatives, velocity and acceleration, are widely recognised as the most reliable indicators of impending failure (Masood et al., 2023). Slope monitoring programmes often utilise global navigation satellite system (GNSS) sensors, radar, robotic total stations, and LiDAR scanning to collect displacement data at regular intervals (Dick et al., 2015; Masood et al., 2024). The analysis of this data enables researchers to identify progressive deformation trends that signify slope instability (Masood et al., Dash, 2023; Masood et al., 2024; Terzaghi, 1950; Saito, 1969). A fundamental observation in geotechnical research is that slopes approaching failure exhibit an accelerating rate of movement, a phenomenon commonly referred to as tertiary or accelerating creep (Zavodni, Broadbent, 1978; Varnes, 1982; Cruden, 1987). This behaviour forms the basis of many failure prediction
models, which focus on estimating the time-to-failure (TTF) by extrapolating displacement and velocity trends (Dusseault, Fordham, 1993; Dok et al., 2011; Intrieri et al., 2019). However, traditional monitoring techniques alone do not provide explicit failure timing, necessitating the use of analytical and computational approaches to interpret displacement patterns and predict the imminence of collapse.
The inverse velocity method (IVM), first introduced by Saito (1965) and refined by Fukuzono Fukuzono (1985), is a widely used approach for failure prediction, based on the inverse proportionality between velocity and time-to-failure. As a slope approaches failure, velocity increases asymptotically, and plotting 1/velocity against time often reveals a linear trend in the final accelerating phase, enabling failure time extrapolation. Although conceptually simple, IVM’s real-time implementation in mining operations became practical only in the early 2000s with advancements in high-resolution displacement monitoring. Since then, numerous studies have enhanced IVM applications: Rose and Hungr (2007) demonstrated its effectiveness in predicting large-scale rockfalls, Dick et al. (2013) integrated machine learning with geodetic monitoring, Carlà et al. (2017; 2018) developed risk-based alarm strategies for open-pit mines, Zhou et al. (2020) proposed a modified IVM framework for improved accuracy, and Chen and Jiang (2020) introduced the dimensionless inverse velocity method (DINV) to enhance detection while reducing false alarms.
While the IVM has proven effective in predicting slope failures, its practical application in surface mining environments is still challenged by several limitations like sensitivity to noise and instrumentation errors, and variability in slope failure behaviour as some failures may be triggered by external shocks (e.g., seismic activity, rainfall-induced weakening, or mine blasting) leading to deviation from the expected inverse velocity trend. Many mine monitoring programmes operate on limited temporal sampling, where data is collected at daily or weekly intervals rather than real-time continuous recording (Petley et al., 2005). This can result in critical missed data points during rapid acceleration phases thus leading to under-sampling of data [Voight, 1988; 1989].
To address these limitations, this study proposes a filtered inverse velocity method analyser to enhance slope failure prediction in surface mines, identifying the optimal smoothing approach for improving time-to-failure (TTF) estimations, and validates
the methodology using real displacement monitoring data. These advancements contribute to proactive hazard management, reducing operational risks in mining and geotechnical engineering applications [Segalini et al., 2018; Glastonbury, Fell, 2002].
This study focuses on the analysis of deformation and displacement data, along with its derivatives, to assess slope stability and predict failure in surface mines. The dataset for this analysis comprises real-time monitoring data from three coal mines operated by South Eastern Coalfields Limited (SECL) and historical slope failure data digitised from an Australian mine. By integrating both real-time and historical datasets, this study enables a comprehensive evaluation of failure mechanisms across different mining conditions.
The first dataset consists of real-time monitoring data collected from three SECL mines, where slopes are continuously monitored to track displacement, velocity, and inverse velocity trends. The monitoring system utilises a slope stability radar (SSR), which provides high-resolution deformation data. In addition to real-time monitoring, historical slope failure data from an Australian mine were digitised and incorporated into this study. These datasets include recorded failure events with corresponding displacementtime trends, allowing for a retrospective application of inverse velocity analysis. This additional dataset provides valuable insights into different geological settings and deformation patterns, facilitating a broader validation of the proposed failure prediction methodology.
Slopes at the three SECL mines are monitored using SSR, which captures real-time displacement data to enable early warning alerts and failure predictions. The monitoring system includes continuous tracking of slope deformation, with each radar scan providing high-resolution movement data and automated data processing through specialised software called SSRViewer, which enables trend analysis, alarm triggering, and data export for further examination. Figure 1 shows the SSRViewer screen.

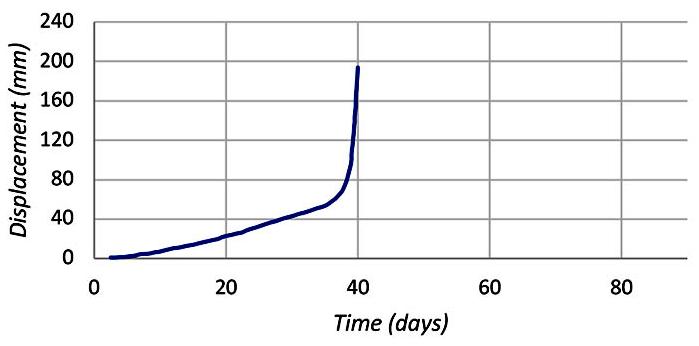
The data collected from the mines were extracted from SSRViewer and transferred to MS Excel for further analysis. This dataset contained time vs. deformation and time vs. velocity values, depending on the type of data extracted from SSRViewer. The extraction process involved the selection of the desired monitoring area and exporting the relevant data by right-clicking on the velocity or inverse velocity (IV) graph displayed on the left panel of the SSRViewer interface. Table 1 presents a sample dataset collected from one of the SECL mines, illustrating the format and structure of the extracted monitoring data. Table 2 presents sample digitised data points, while Figure 2 illustrates its graphical representations, highlighting deformation patterns preceding past slope failures. The combination of real-time and historical datasets strengthens the reliability of the study, ensuring that the proposed filtered inverse velocity method analyser is tested under diverse conditions.
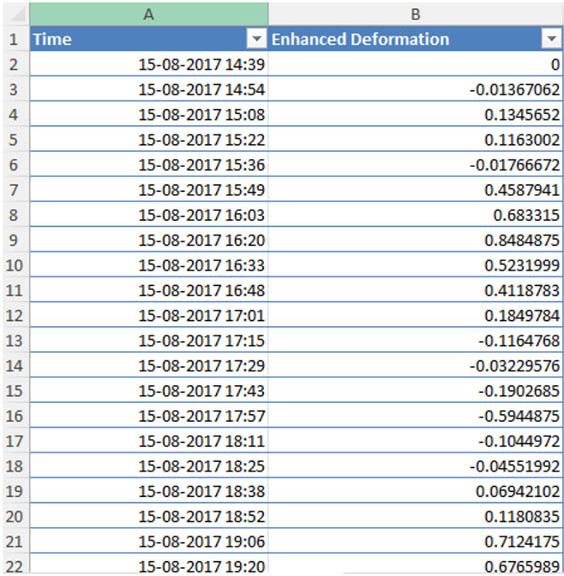
Table 2
Digitised dataset of an Australian mine (Voight,
Slope failures follow a progressive process consisting of three distinct stages: (i) deceleration, where movement slows down; (ii) steady-state deformation, where displacement occurs at a nearly constant rate; and (iii) acceleration, where movement rapidly increases, ultimately leading to failure. This three-stage model, validated through laboratory experiments and field monitoring, serves as a fundamental framework for analysing and predicting landslides and slope instabilities (Petley et al., 2005).
Building on this framework, Fukuzono (1985) developed a failure time prediction method by analysing the tertiary (final acceleration) stage of slope movement. A key concept introduced in this approach is the onset of acceleration (OOA) point, marking the transition from steady-state deformation to rapid acceleration. By plotting inverse velocity against time, this method enables the identification of failure trends and estimation of the time-to-failure. The acceleration phase is further classified into two segments: pre-OOA, where the slope remains stable but trends toward failure, and post-OOA, where velocity increases rapidly and inverse velocity approaches zero. To refine failure time estimation, Voight (1988; 1989) introduced mathematical models that incorporate displacement, velocity, and acceleration data to improve the predictive accuracy of inverse velocity analysis. Several researchers have since expanded on Fukuzono’s approach, introducing empirical equations to better characterise failure progression. A widely adopted method involves selecting critical points on the failure curve, plotting tangent lines, and extrapolating failure timing based on inverse velocity trends.
The accuracy of these models depends largely on two empirical constants, A and α used in Equation 1, which was introduced by Fukuzono by combining the developments on his earlier work.
5.42

where tf is failure time, Λ is inverse velocity.
A and α influence the shape of the inverse velocity curve. The value of α determines failure prediction accuracy and follows these trends:
➤ α = 2 results in a linear IV curve, simplifying failure estimation.
➤ α > 2 produces a convex IV curve, where failure time becomes less predictable.
➤ 1 < α < 2 generates a concave IV curve, requiring additional adjustments for precise forecasting.
Studies indicate that A and α are interdependent and vary based on kinematic motion patterns, material properties, and failure scale (Segalini et al., 2018). In practical mining applications, α = 2 is often assumed to ensure real-time visual feedback for operational decision-making, as it simplifies failure predictions and aligns with standard geotechnical monitoring practices. The IVM is a simple, yet effective tool for slope failure assessment and early warning but, as explained, its accuracy is affected by noise and measurement errors. The three filter models evaluated in the study are:
➤ Short-term simple box filter: A moving average filter applied over a short window to smooth minor fluctuations in velocity data.
➤ Long-term simple box: A similar moving average approach over an extended period to eliminate noise while preserving trend stability.
➤ Exponentially weighted moving average (EWMA): A more adaptive filter that assigns exponentially decreasing weights to past observations, allowing for dynamic responsiveness to sudden changes.
By integrating real-time monitoring data, inverse velocity analysis, and advanced filtering techniques, this methodology aims to improve the accuracy and reliability of slope failure predictions.
Computational analysis of smoothing filters and optimisation of slope failure predictions through filtering methods
The computational evaluation involves programmatic implementation on python of these filters using the codes mentioned in codebox 1, followed by comparative analysis to assess their impact on IVM-based predictions (Glastonbury, Fell, 2002).
Performance is measured by analysing filtered vs. raw inverse velocity trends, identifying the optimum filtering approach for early warning applications in surface mines.
The FIVM-Analyser applies computational methods to enhance slope failure prediction accuracy by analysing displacement trends and optimising inverse velocity predictions. It performs the following key tasks:
➤ Computes velocity and acceleration from displacement data by determining velocity and computing acceleration, essential for tracking slope stability trends.
➤ Computes inverse velocity for failure prediction by converting velocity values into inverse velocity (1/v) and handles zero and negative velocity values safely to avoid computational errors.
➤ Applies multiple smoothing methods to reduce noise.
➤ Estimates time-to-failure (TTF) by fitting a linear regression to inverse velocity data and accounts for measurement noise and inconsistencies to improve prediction accuracy.
➤ Compares predictions across all smoothing models and selects the best approach by evaluating all smoothing methods to determine the most stable and accurate prediction. Further, identifies the best model by comparing predicted failure times to the last measured time in the dataset.
Analysis of slope displacement, velocity, acceleration, and inverse velocity trends
The FIVM-Analyser was applied to displacement monitoring data to analyse slope deformation trends, estimate failure time, and compare the performance of different smoothing techniques. The results demonstrate the progressive failure process, with distinct trends observed in velocity, acceleration, and inverse velocity (IV) curves. Displacement data was first processed to compute velocity and acceleration. The acceleration curve exhibited three distinct stages, showing three different stages of velocity, as shown in Figure 3:
➤ Initial deceleration phase, where the rate of displacement slowed gradually.
➤ Steady-state deformation phase, with a nearly constant velocity.
➤ Acceleration phase, where velocity increased significantly as failure approached.
The three stages can be seen in Figure 3, where the acceleration initially turns negative, then is zero, and in then increases continuously leading to failure.
The acceleration curve fluctuated initially but showed a clear upward trend in the final acceleration stage, confirming the onset of tertiary creep before failure. The inverse velocity (IV) curve, a key indicator in failure prediction, was computed using raw velocity data. As expected, the IV curve followed a downward trend, approaching zero as the slope neared failure. However, raw IV data contained significant fluctuations due to noise, making it difficult to precisely estimate the failure time. To improve accuracy, filtering techniques were applied to smooth the IV curve and refine failure time predictions.

Evaluation of smoothing filters for failure time prediction
To reduce noise and improve failure time prediction accuracy, three smoothing filters (short-term moving average, long-term moving average, and exponentially weighted moving average) were applied to the velocity data. The effectiveness of each filter was evaluated by comparing their impact on failure time estimation and trend stability. Filtered inverse velocity curves showed significant improvements over raw data, reducing erratic fluctuations while preserving acceleration trends. The short-term moving average filter effectively smoothed short-term variations but retained some noise. The long-term moving average filter produced the most stable trend but slightly delayed failure time estimation. The exponentially weighted moving average filter, with its adaptive weighting, provided the best balance between noise reduction and responsiveness to acceleration. Failure time was estimated by applying a linear fit to the inverse velocity curve in its final phase. The slope constant ‘A’ was computed as the rate at which inverse velocity decreases, representing the acceleration characteristics of the failure process.
To determine the most effective filtering approach, predictions from all models were compared against historical failure data. Raw data predictions fluctuated significantly, reducing reliability. Short-term moving average and long-term moving average filters produced reasonable estimates, but short-term moving average retained fluctuations, while long-term moving average slightly delayed predictions. The exponentially weighted moving average filter predicted failure closest to 10 and 11 March, confirming its suitability for real-time failure detection, when the slope actually failed. To further validate, two other datasets were used and similar results were observed. An example from the study's dataset has been plotted. The visualisation that follows in Figure 4 illustrates:
➤ Raw velocity data points
➤ Filtered velocity data using three distinct techniques:
➤ Short-term moving average (SMA)
➤ Long-term moving average (LMA)
➤ Exponential smoothing filter (ESF)
These trends are compared to visually demonstrate the effectiveness of each smoothing approach on noisy velocity data.
Further, the corresponding inverse velocity trends are also shown, which are crucial for accurately identifying the time-to-failure in slope stability assessments.
The visual comparison of filters and raw data in Figure 4 clearly distinguishes between:
➤ Raw data: This line denotes the direct output from the slope monitoring system, including all instrumental noise and environmental fluctuations.
➤ Short-term moving average filter: Effectively smooths out minor, short-term fluctuations, providing a clearer trend while maintaining sensitivity to recent changes.
➤ Long-term moving average filter: Produces a very stable longterm trend but can lag in detecting rapid accelerations (critical for predicting imminent failures).
➤ Exponential smoothing filter: Strikes a balance, providing both stability and responsiveness, making it ideal for real-time early warning systems as supported by the study’s findings.
This comparison allows direct visual inspection of each filter’s ability to clean noisy data and enhance the reliability of failure time predictions.
Discussion and conclusions
This study applied filtered inverse velocity analysis to improve slope failure prediction in surface mines, utilising short-term moving average (SMA), long-term moving average (LMA), and exponential smoothing filters (ESF) to mitigate noise in velocity data. The results revealed that filtering significantly enhances the accuracy and stability of failure time estimates, compared to raw displacement trends. All three smoothing methods effectively reduced random fluctuations in the raw data, making it easier to identify the acceleration phase in slope deformation. Short-term moving average and exponential smoothing filter strike a good balance between smoothing out erratic signals and preserving the essential slope acceleration behaviour. Short-term moving average captures recent changes well but can leave minor fluctuations that slightly affect the final failure time estimate whereas Long-term moving average produces a very stable trend, albeit at the expense of slightly overestimating the actual failure time in rapidly accelerating
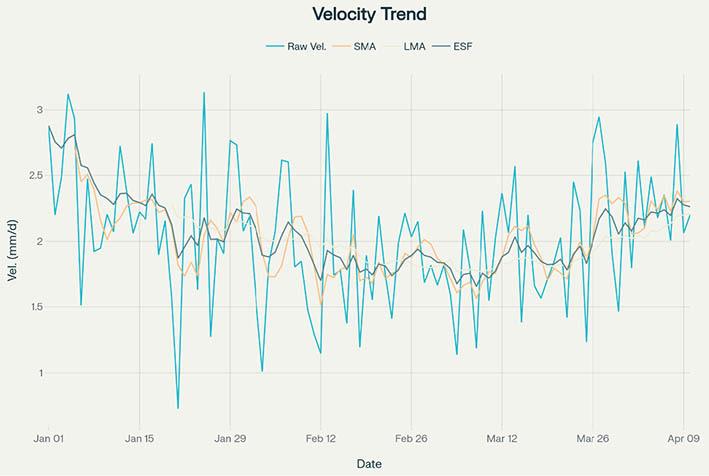
slopes. The exponential smoothing filter demonstrates superior adaptiveness to velocity changes, typically providing the most accurate and timely predictions relative to field observations. The best-performing filter (exponential smoothing filter) consistently predicted failure times closest to the observed collapse scenario while the raw data predictions were less reliable, highlighting the necessity of applying a suitable smoothing technique for early warning systems. Implementing filtered inverse velocity enhances the robustness of slope monitoring, reducing false alarms and misjudged failure times. Exponential smoothing filter is especially valuable in near-real-time applications, where rapid detection of accelerating slopes is critical for mine safety. Further work could explore nonlinear fitting (e.g., power-law or logistic models) to accommodate complex or multi-stage acceleration patterns. Hybrid approaches combining machine learning with classical inverse velocity methods might further refine slope failure prediction for diverse geotechnical environments.
Declarations
The authors declare that they have no conflict of interest.
Funding
The authors received no funding from an external source.
Data availability statement
Data sharing is not applicable to this article as no datasets were generated or analysed during the current study.
Author’s contribution statement
All authors contributed to the design and implementation of the research, to the analysis of the results, and to the writing of the manuscript.
Cover letter
This manuscript is the authors' original work and has neither been published, nor has it been submitted simultaneously elsewhere. All authors have checked the manuscript and have agreed to the submission.
Ethical approval
The paper has been submitted with full responsibility, following due ethical procedure, and there is no duplicate publication, fraud, or plagiarism. None of the authors of this paper has a financial or personal relationship with other people or organisations that could inappropriately influence or bias the content of the paper. This article does not contain any studies with human participants or animals performed by any of the authors.
Acknowledgement
Not applicable
Consent to Participate
Not applicable
Consent to Publish
Not applicable
References
Carlà, T., Farina, P., Intrieri, E., Ketizmen, H., Casagli, N. 2018. Integration of ground-based radar and satellite InSAR data for the analysis of an unexpected slope failure in an open-pit mine, Eng. Geol., vol. 235, pp. 39–52.
Carlà, T., Intrieri, E., Di Traglia, F., Nolesini, T., Gigli, G., Casagli, N. 2017. Guidelines on the use of inverse velocity method as a tool for setting alarm thresholds and forecasting landslides and structure collapses, Landslides, vol. 14, pp. 517–534.
Chen, M.X., Jiang, Q.H. 2020. An early warning system integrating time-of-failure analysis and alert procedure for slope failures, Eng. Geol., vol. 272, pp. 105629.
Cruden, D.M. 1987. Masoumzadeh, S., Accelerating creep of the slopes of a coal mine, Rock Mech. Rock. Eng., vol. 20, pp. 123–135.
Dick, G.J., Eberhardt, E., Cabrejo-Liévano, A.G., Stead, D., Rose, N.D. 2015. Development of an early-warning time-of-failure analysis methodology for open-pit mine slopes utilizing ground-based slope stability radar monitoring data, Can. Geotech. J., vol. 52, pp. 515–529.
Dick, G.J., Eberhardt, E., Stead, D., Rose, N.D. 2013. Early detection of impending slope failure in open pit mines using spatial and temporal analysis of real aperture radar measurements, In Proceedings of the Slope 2013: 2013 International Symposium on Slope Stability in Open Pit Mining and Civil Engineering, Perth, Australia, pp. 949–962.
Dok, A., Fukuoka, H., Katsumi, T., Inui, T. 2011. Tertiary creep reproduction in back pressure-controlled ring shear test to understand the mechanism and final failure time of fainfallinduced landslides, In: Annuals of Disas. Prev. Res. Inst. Kyoto Univ. (No. 54 B.).
Dusseault, M.B., Fordham, C.J. 1993. Time-dependent behavior of rocks, In: Book chapter 6 in Rock Testing and Site Characterization, pp. 119–149 Pergamon.
Fukuzono, T. 1985. A method to predict the time of slope failure caused by rainfall using the inverse number of velocity of surface displacement, Landslides, vol. 22, pp. 8–13.
Glastonbury, J., Fell, R. 2002. Report on the Analysis of the Deformation Behaviour of Excavated Rock Slopes (University of New South Wales School of Civil and Environmental Engineering, Kensing ton, 2002).
Intrieri, E., Carlà, T., Gigli, G. 2019. Forecasting the time of failure of landslides at slope-scale: A literature review, Earth Sci. Rev., vol. 193, pp. 333–349.
Kolapo, P., Oniyide, G.O., Said, K.O., Lawal, A.I., Onifade, M., Munemo, P. 2022. An Overview of Slope Failure in Mining Operations, Mining, vol. 2, pp. 350–384. https://doi.org/10.3390/mining2020019.
López-Vinielles, J., Ezquerro, P., Fernández-Merodo, J., BéjarPizarro, M., Monserrat, O., Barra, A., Blanco, P., García-Robles, J., Filatov, A., García-Davalillo, J., Sarro, R., Mulas, J, Mateos, R., Azañón, J., Galve, J, Herrera, G. 2020. Remote analysis of an open-pit slope failure: Las Cruces case study, Spain, Landslides., vol. 17, pp. 2173–2188.
Masood, M.M., Dash, A.K. 2023. A Review of Modern Techniques for Slope Behaviours Analysis and Prediction of Slope Failure in Mines, In International Conference on Sustainable and Innovative Mining Practices, pp. 246–259. Cham: Springer Nature Switzerland.
Masood M.M., Verma T., Seervi V. 2024. A Novel Predictive Framework for the Determination of the Threshold Limit Velocity of Open-Cast Mine Slopes, Journal of The Institution of Engineers (India): Series D., pp. 10:1–6.
Masood, M.M., Verma, T., Seervi, V. 2024. Development of an algorithm for the prediction of slope failure in surface mines, Journal of The Institution of Engineers (India): Series D., vol. 05, no. 2, pp. 875–85.
Masood, M.M., Verma, T., Murmu, S. 2023. The use of radar in the assessment of the stability of mine slopes in open cast mines, In Second International Conference on Emerging Trends in Engineering (ICETE 2023), pp. 1234–1246. Atlantis Press.
Obregon, C., Mitri, H. 2023. Probabilistic approach for open pit bench slope stability analysis—A mine case study, Int. J. Min. Sci. Technol., vol. 29, pp. 629–640.
Petley, D.N., Higuchi, T., Petley, D.J., Bulmer, M.H., Carey, J. 2005. Development of progressive landslide failure in cohesive materials, Geology, vol. 33, pp. 201–204.
Prasad, T., Barmavatu Praveen, Yalagandala Akshay Kumar, Kunchala Krishna. Development of carbon & glass fiber reinforced composites with the addition of nano egg-shell powder, Springer Lecture Notes in Mechanical Engineering (LNME), ICIME 2021, ISBN 978-981-16-7282-8 pp. 569-577. https://link.springer.com/ chapter/10.1007/978-981-16-7282-8_42
Rose, N.D., Hungr, O. 2007. Forecasting potential rock slope failure in open pit mines using the inverse-velocity method, Int. J. Rock. Mech. Min. Sci., vol. 44, pp. 308–320.
Saito, M. 1965. Forecasting the time of occurrence of a slope failure, In Proceedings of the 6th International Mechanics and Foundation Engineering, Montreal, QC, Canada, 8–15, pp. 537–541.
Saito, M. 1969. Forecasting Time of Slope failure by Tertiary Creep, In: Proceedings of the 7th International Conference on Soil Mechanics and Foundation Engineering, Mexico City, vol. 2. pp. 677–683.
Segalini, A., Valletta, A., Carri, A. 2018. Landslide time-of-failure forecast and alert threshold assessment: A generalized criterion, Eng. Geol., vol. 245, pp. 72–80.
Tao, Z.G., Shu, Y., Yang, X.J., Peng, Y.Y., Chen, Q.H., Zhang, H.J. 2020. Physical model test study on shear strength characteristics of slope sliding surface in Nanfen open-pit mine, vol. 30, pp. 421–429.
Terzaghi, K. 1950. Mechanisms of Landslides, Geotechnical Society of America, Berkeley, pp. 83–125. UNISDR.
Varnes, D.J. 1982. Time-deformation relations in creep to failure of earth materials. In: Proceedings of the 7th Southeast Asia Geotechnical Conference, Hong Kong, pp. 107–130.
Voight, B. 1988. A method for prediction of volcanic eruptions, Nature, vol. 332, pp. 125–130.
Voight, B. 1989. Materials science law applies to time forecasts of slope failure, Landslide News, vol. 3, pp. 8–10.
Yalagandala akshay kumar, Shaik shafee, Barmavatu Praveen. 2019. Experimental investigation of residual stresses in a die casted alluminium fly wheel, Elsevier material today proceedings, ISSN 2214-7853/ vol. 19, No. 02, pp. A10-A18. https://doi.org/10.1016/j.matpr.2019.07.628
Zavodni, Z.M., Broadbent, C.D. 1978. Slope failure kinematics, Bull. Can. Inst. Min., 1978, pp. 73, 69–74.
Zevgolis, I.E., Deliveris, A.V., Koukouzas, N.C. 2018. Probabilistic design optimization and simplified geotechnical risk analysis for large open pit excavations, Computers and Geotechnics, vol. 103, pp. 153–64.
Zhou, X.P.; Liu, L.J., Xu, C. 2020. A modified inverse-velocity method for predicting the failure time of landslides, Eng. Geol., vol. 268, pp. 105521. u
import numpy as np from scipy.optimize import curve_fit from scipy.ndimage import uniform_filter1d from scipy.signal import lfilter
def compute_velocity(time, displacement):
"""Computes velocity (mm/day), handling division by zero.""" delta_time = np.diff(time) velocity = np.divide(np.diff(displacement), delta_time, where=delta_time>0, out=np.zeros_like(delta_time))
return velocity, time[:-1] + delta_time / 2 # Midpoints for velocity times def compute_acceleration(time_vel, velocity):
"""Computes acceleration (mm/day^2), handling division by zero.""" delta_time = np.diff(time_vel) acceleration = np.divide(np.diff(velocity), delta_time, where=delta_time>0, out=np.zeros_like(delta_time))
return acceleration, time_vel[:-1] + delta_time / 2 # Midpoints for acceleration times
def compute_inverse_velocity(velocity):
"""Computes inverse velocity (1/v), safely handling zero and negative values.""" return np.where(velocity > 0, 1 / velocity, np.nan) def apply_smoothing(velocity, method="SMA", window=3, alpha=0.5): """Applies different smoothing techniques to velocity data.""" if method == "SMA": return uniform_filter1d(velocity, size=window, mode='nearest') if method == "LMA": return uniform_filter1d(velocity, size=window * 2, mode='nearest') if method == "ESF": return lfilter([alpha], [1, alpha - 1], velocity, axis=0) return velocity # Default: No filtering if invalid method def linear_fit_inverse_velocity(time, inv_velocity, num_points=6): """Fits inverse velocity to a linear model, handling NaNs.""" def linear_func(t, A, tf): return A * (tf - t) t_fit, inv_v_fit = time[-num_points:], inv_velocity[-num_points:] valid_mask = ~np.isnan(inv_v_fit) if np.sum(valid_mask) < 2: return np.nan, np.nan try: popt, _ = curve_fit(linear_func, t_fit[valid_mask], inv_v_fit[valid_mask]) return popt[0], popt[1] # A, t_f except RuntimeError: return np.nan, np.nan def analyze_slope(time, displacement, num_fit_points=6): """Performs slope deformation analysis & compares smoothing methods.""" velocity, time_vel = compute_velocity(time, displacement) acceleration, time_acc = compute_acceleration(time_vel, velocity) inv_velocity = compute_inverse_velocity(velocity)
# Apply different smoothing methods smoothed_results = {method: {"inv_velocity": compute_inverse_velocity(apply_ smoothing(velocity, method, 3))} for method in ["Raw", "SMA", "LMA", "ESF"]}
# Fit inverse velocity to estimate failure time for method in smoothed_results: smoothed_results[method]["A"], smoothed_results[method]["tf"] = \ linear_fit_inverse_velocity(time_vel, smoothed_results[method]["inv_ velocity"], num_fit_points)
# Determine best method (closest predicted failure time to last measured time) valid_methods = {m: res for m, res in smoothed_results.items() if not np.isnan(res["tf"])}
best_method = min(valid_methods, key=lambda m: abs(valid_methods[m] ["tf"] - time[-1])) if valid_methods else "None"
# Print results
print("\n### Slope Deformation Analysis Results ###")
print(f"Final displacement: {displacement[-1]:.2f} mm over {time[-1]:.2f} days")
print(f"Best smoothing method: {best_method}") for method, res in smoothed_results.items():
print(f"{method}: Predicted failure time = {res['tf']:.2f} days, A = {res['A']:.6f}" if not np.isnan(res['tf']) else f"{method}: Prediction failed (insufficient data)") Codebox1 - filtered inverse velocity method analyser
Why an integrated approach is key to ensuring slope stability
Complexities in understanding and solving slope stability issues often lead to the temptation to lean too heavily on a single aspect of the design, which is typically numerical modelling.
Rob Armstrong, who is a director, partner and principal geologist (geotechnical) at SRK Consulting (South Africa), highlighted the importance of integrating the insights of multiple disciplines when designing slopes.
“While numerical models are a crucial tool in the belt of the designer, these models must honour the potential failure mechanisms in each case,” said Armstrong. “Slope design requires models that are based on a thorough understanding of all of the inputs that go into the geotechnical model, which is complex and often requires a team of multiple specialists.”
To develop an implementable slope design– while also understanding the intricacies of operational risk management and project financing cycles – a mutidisciplinary teams of engineers and scientists is needed, he said.
“At SRK Consulting, our integrated approach to slope stability makes use of in-house and associated specialists in a range of critical fields,” he explained. “This includes engineering geophysics, structural geology, unmanned aerial vehicle (UAV) data collection for geotechnical studies, geostatistics and geohydrology.”
The results are comprehensive and fit-for-purpose geotechnical models that accommodate the complexities of each site – including geology, geological structure, weathering, alteration, groundwater and geomechanical properties.
He also pointed out that not every slope needs a detailed geotechnical model, and that a depth of experience is required to discern when it is required.
“Once an integrated geotechnical model is finalised, our experienced team of slope designers use this information to guide stability analyses,” he said. “With the help of advanced numerical modelling, if necessary, they use the model to analyse the actual mechanisms of failure – and to develop a practical, minable design.”
Importantly, life-of-mine slope design should not end with a design report. SRK Consulting often works with their clients’ operational teams to help implement the design, by updating and optimising the design as more is understood about the deposit and adjacent ground. This continuity becomes even more valuable when mine ownership or site teams change and institutional memory could be lost; in many cases, he notes, SRK provides this ‘memory’ through its long-term client relationships.
“To constantly refine the geotechnical model and slope design, we call on our in-house and associated specialists in blasting, monitoring, risk-based design, mine planning and other disciplines,” he said. “We complete the design and implementation cycle by applying our experience in mining to the slope designs – along with our clients –over several decades. This means working through the operational aspects of slope designs and gaining insight into what strategies work best.”
He explained that SRK Consulting embraces multiple disciplines in all projects that it undertakes, which cover all aspects of mining from exploration to closure. Its key services are provided in exploration, resource estimation, mine planning, surface water, groundwater, tailings storage facilities, ESG and closure – as well as the preparation of transactional documents such as due diligence studies, competent persons’ reports and technical reports.
Robert Armstrong Director | Partner & Principal Geologist at SRK Consulting South Africa


Affiliation:
1SRK Consulting, Canada
Correspondence to: A. Bloem
Email: abloem@srk.com
Dates:
Received: 21 Apr. 2025
Revised: 11 Jul. 2025
Accepted: 15 Jul. 2025
Published: August 2025
How to cite:
Bloem, A., Royle, M., Uken, R. 2025. Rock mass damage and induced passive depressurisation around open pits. Journal of the Southern African Institute of Mining and Metallurgy, vol. 125, no. 8, pp. 485–494
DOI ID: https://doi.org/10.17159/2411-9717/3715/2025
by A. Bloem1, M. Royle1, R. Uken1
Abstract
Rock mass damage induced by mining increases the fracture frequency and joint aperture width in the pit walls and rock mass behind open pit mine slopes. The depth and intensity of this mechanical damage relative to the pre-mining state is not well understood and yet is a major factor in the development of slope stability models and operational guidelines. The induced damage can be partitioned into domains or zones. The blast damage zone is essentially a ‘free flow’ rock mass volume, which transitions quite rapidly into the excavation damage zone, which extends beyond that. In both zones, transient high in situ water pressures are often linked to unstable slope conditions. Whereas rock damage can enhance passive depressurisation in the rock mass, high infiltration rates on the other hand, as one could expect during rainstorm events, will decrease slope stability within the dilated pit rock mass, especially in the blast damage zone-excavation damage zone, by increasing pore pressures for short periods of time. Ice jacking and freshet are additional factors to consider in (sub) arctic environments and can be exacerbated by unfavorable rock fabric orientation. On a local scale, brittle deformation damage zones, in the form of faults, can contribute to slope instability, or enhanced stability because of slope depressurisation, depending on their location and orientation relative to the pit shape and the water sources. In this study, the shapes of the damage zones and their anticipated impact on infiltration and/or passive depressurisation are considered for different pit morphologies, rock mass conditions, in situ stress, and hydrogeological settings. Some unusual hydrological situations, like mining towards rivers and lakes and the potential effects on pore pressures, are also considered. This investigation has resulted in the development of a method to adjust initial hydraulic conductivity values used to estimate transient pore pressure conditions found in rock masses exposed in different pit morphologies and stress regimes as well as discontinuities’ orientation relative to open faces within the open pit mine. The changes in K values and pore pressures can then be used to determine hydrogeological influence more accurately on future pit slope stability.
Keywords
rock mass damage zones, hydraulic conductivity adjustment, structural control, slope stability, risk characterisation, scoping level studies
Introduction
From a rock engineering perspective, the effects of groundwater pore pressure around open pits become progressively more important as design studies advance through the different stages of the mining project development, from exploration through to pre-production, production, and into closure. Figure 1 illustrates this idea (Bloem, Barnett, 2022), with the lower study level bars matching the upper model input components spaced from left to right. Lithology, alteration, and structural geology are where most of the data acquisition and knowledge development occurs in the early part of the study life cycle of a project. These parameters are considered ‘fixed’ in the project timeframe. The transient nature of the input components increases towards the right of Figure 1. Once the initial mineral exploration phase has been completed and the ‘extents’ have been identified, the project geology model typically gets upgraded, with detailed drilling information, into a comprehensive 3-D litho-structural model with the addition of major faults. It is at this point, normally, where the first estimates of hydraulic conductivity (K, m/s) and potential water inflow and related depressurisation rates are made using the pre-mining rock mass condition as a baseline. Also illustrated in Figure 1 is the relative possibility that the model input components’ properties may, and probably will, change throughout the life of mine, and that

hydrogeological data acquired during the scoping or pre-feasibility study (PFS) level of the study could potentially be used to estimate the hydraulic conductivity in the disturbed rock mass at some point in the future. The prediction of the K values needs to take in situ stress conditions and potential decay characteristics of the rock mass into consideration.
By unloading the rock mass, which occurs during open pit mining, the in situ stress fields are altered. Rock masses respond differently to these changes depending on orientation and/or magnitude of the stress fields over relatively short periods of time. The rock mass response is typically to undergo deformation, mostly in the form of an increase in fracture frequency and aperture width near the excavated void, a form of induced mechanical deterioration. These changes in turn increase the K of the rock mass and increase both flows out of (passive depressurisation) and into (infiltration) the previously more competent rock blocks. This can, depending on the ambient temperatures and diurnal and annual variations, also stimulate geochemical weathering of the rock mass. These transient effects will both decrease the effective stress (higher pore pressure) while also decreasing the original strength of the rock mass resulting in strength ‘decay’, which is progressive failure, over time (Bloem, Barnett, 2022). Increased K is linked to the rock mass condition since, in general, the more fractures and potential (dilated) water pathways that exist, the more readily water will passively drain from the rock mass, increasing the effective strength. Passive drainage and the resulting depressurisation will occur on any rock face. The extent of this effect, however, is not well understood at the pit slope scale because of a lack of available preand post-mining data. Therefore, assumptions have been made based on the original work on the damage zone (Hoek, 1994) and
others. This study attempts to build on that with a more detailed look at both the probability of increased fracture frequency and aperture width, and the connectivity for flow, which involves relative orientation and length of discontinuities within the rock mass.
This paper describes a method for the adjustment of K values for the changes in parameters over time, in the form of the hydraulic conductivity adjustment (HCA), and to do this, several main factors are considered in the following order: a) open pit shape, b) fault zones, c) rock mass condition and d) anisotropy. The HCA should be looked at as a scoping tool to determine areas that could have enhanced permeability and/or flow potential, both of which will influence infiltration (increases in pore pressure) and passive drainage (decreases in pore pressure) over time.
The shape of an overall slope as exposed during mining, relative to the in situ stress, regional water table, and flow direction, will influence the flow path and rate at which water moves through the rock mass adjacent to the open pit. For example, in a conical waste rock pile with little or no fines, any water added to the top of the rock pile flows down and outward towards the base’s perimeter (K ≈ 1E10-2 m/s). Undisturbed rock masses (K ≈ 10E-14 to 10E-5 m/s) will be considered in this paper for the purposes of the dilation model development and the HCA.
The low K example of a loosely consolidated rock pile is something like what is seen in unconfined rock masses that are exposed in open pits in the form of convex slopes (bullnoses or ridgebacks), as illustrated in Figure 2. The main difference for the latter, is

that the rock blocks will tend to be interlocking, compared to the ‘bulked’ rock pile. The further the bullnose extends into the open pit, relative to the external shape, the more likely it is to dilate due to lack of confinement, and one measure of this is the ratio between the half height radius (R) and the slope height (H). As R increases relative to H, confinement is removed, and de-stressed – within the excavation damage zone (EDZ) – rock mass conditions are induced. The orientation of the regional in situ stress has no influence on the hydraulic conductivity of a convex slope, because the slope is isolated from the regional stress field and will only be subject to vertical stresses (σv) within the bullnose.
Concave slopes tend to remain confined at R/H values less than 1, but as the radius increases further, so too will the de-stressed rock mass at the corners of the concave slope. If the regional principle in situ stress is parallel to the main rock face into which a concave slope is cut, the concave slopes will tend to have reduced hydraulic conductivity at relatively low in situ stress magnitudes. In other words, the relatively low initial K (while being mined) will change as the principal stress rotates around to the vertical and the rock mass dilates parallel to the local minor stress direction perpendicular to the slope. This ‘clamping’ effect, which does not necessarily damage the rock mass, has been observed (Royle, 2023) around mine shafts in the Athabasca basin of Canada, where most of the water entering the shaft comes from vertical dilated joints oriented parallel to the principal horizontal stress direction σH. As the radius of a concave slope increases relative to the height of the slope, it will tend to behave more like a local linear slope with unconfined corners.
Damage and dilation domains
A conceptual model for rock mass damage applied to open pit slope geotechnical studies was developed by Bloem and Barnett (2022) in which four main areas of mechanical weathering induced by open pit mining were identified. These non-discrete ‘zones’ of damage decrease in intensity outward and away from the excavation, as illustrated in the plan view of Figure 3 and in vertical sections parallel and perpendicular to the principal horizontal stress (σH) direction of Figures 4 and 5. These four main rock mass damage and dilation zones within the model, in order of decreasing hydraulic conductivity for the purposes of the HCA, are described as being:
➤ The blast damage zone (BDZ), which is the rock mass immediately adjacent to the bench face. It extends horizontally from about 0.5H for a controlled blast onto a pre-shear line, to as much as 2.5H or more for large uncontrolled production


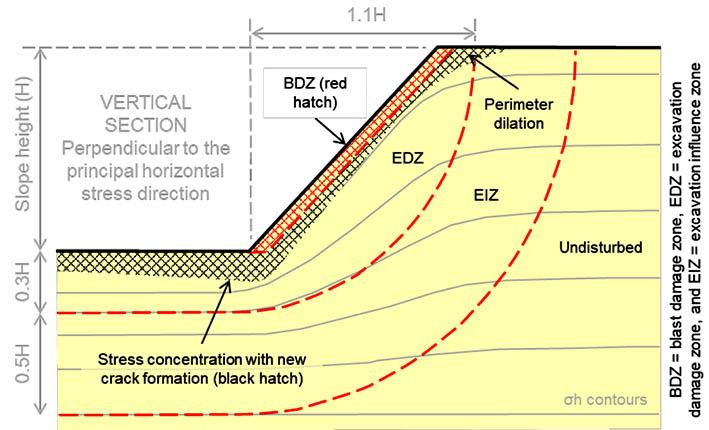
blasts, where H is the blast hole depth (Hoek, Karzulovic, 2000). A damage value of D ≈ 1 is currently accepted for a BDZ width of 1H in slope stability modelling. This zone displays displaced and loose rock blocks with many new fractures induced by blasting. The BDZ is characterised by ‘free flow’ water conditions in which the hydraulic conductivity is at a transient peak and pore pressures will decrease to close to atmospheric pressure, assuming fractures do not reclose due to weathering products like clay.
➤ The de-stressed rock mass domain underlies the pit perimeter, above and beyond the influence of the in situ stress field, is unconfined, especially along the axis, which is parallel to the principal in situ stress direction. Vertical stresses are still present, but the rock mass is decoupled from the regional horizontal stress field. Water passes through this domain relatively easily once fractures have dilated parallel to the local vertical stress. Passive dewatering occurs as the rock mass drains and depressurises relatively quickly, forming the base of the initial semi-stable interface of the ‘drawdown cone’ observed around open pit mines. The extent of the horizontally destressed rock mass will tend to expand over time. This domain is analogous to the natural (pre-mining) dilation of the rock mass due to erosion, glacial rebound, etcetera, with the only difference being that it is induced by mining activity.
➤ Excavation damage zone (EDZ) is the rock mass beyond the BDZ, which experiences post blast dilation because of unloading and new crack formation, and older crack
dilation as the pit deepens. The rupturing of rock bridges and coalescing of joints by step-path failure lead to the progressive weakening of the rock mass. The extent of this damage can be estimated for stability analysis using Hoek’s ‘D-factor’ system in which D = 1 (maximum damage) progressing outward to D = 0 (no damage) at the outer boundary of the EDZ. In fair ground, under moderate in situ stress conditions, the width of this zone is thought to be between 10% (Stacey et al., 2003) and 30% (Hoek, Brown, 2019) of the depth of the pit. The EDZ has progressively lower hydraulic conductivity, moving outward from the maximum within the BDZ, to lower values at the D = 0 position along the excavation damage zoneexcavation influence zone (EDZ-EIZ) interface. The EDZ is characterised by an increase in hydraulic conductivity and groundwater flow/depressurisation, which is induced because of the extension strain (Stacey et al., 2003) experienced by the rock mass.
➤ Excavation influence zone (EIZ) is the volume of rock, which forms a buffer between undisturbed rock mass and the zone of geomechanical loss of rock mass strength induced by mining. This zone displays minor changes in in situ stress orientation and magnitude, and hence the pre- and post mining hydraulic conductivity is thought to remain unaltered.
➤ Undisturbed rock mass is that which is beyond the EIZ and is characterised by no changes in in situ stress field orientation or magnitude. The rock mass and hydraulic conductivity properties are essentially static for the life of mine in this zone.
As depth increases, so too does the vertical stress which, in undisturbed rock masses, will close off joint apertures, which progressively reduce the available joint-related void space for water flow. This decrease in void space is reflected in a decrease in hydraulic conductivity with depth as noted by Wei et al. (1995) and Jiang et al. (2010). Data collected by SRK illustrating this characteristic is shown in Figure 6. Assuming a bulk in situ rock mass density of around 2,600 kg/m3, then the 1 MPa load depth is at approximately 40 m, the 3 MPa depth is 120 m, the 9 MPa depth is 340 m, and so on. Using this series, depth categories can be constructed, which in some way reflect the closure of open and soft filled joints with depth. The depth ranges are 0 – 40 – 120 –340 – 680 – 2,040 m. Beyond 680 m depth, which is approximately 18 MPa load, horizontal and sub-horizontal joints are unlikely to contribute significantly to the hydraulic conductivity of the rock mass and so have the lowest value in the HCA pit depth rating.

Aptly, the geometric range for hydraulic tests in this depth range are approaching 1 x 10-⁹ m/s, at which point groundwater movement becomes very limited.
Major fault systems are typically a static input parameter into the pit design process with the initial state depending on fault characteristics. For example, faults may be either coherent, have little or no damage zone, or have well developed gouge filled cores with associated damage zones. Mostly, faults with a complex reactivation history tend to have weaker fill material and wider damage zones compared to non-reactivated faults. In all cases, deformation within the EDZ and BDZ during sidewall dilation, will likely result in further weakening of fault damage zones. Depending on the size of the fault, depressurisation deformation may range from the bench to the overall pit slope scale, potentially resulting in wide zones of reduced rock mass quality and increased hydraulic conductivity. Fault systems can therefore have static properties throughout the life of the mine, or in specific cases, may be highly transient (Bloem, Barnett, 2022), with hydrogeological parameters that are more difficult to predict during the life of mine and beyond.
To characterise the relative influence of faults on the rock mass and the hydraulic conductivity, five classes are proposed (as illustrated in Figure 7) based on the cumulative fault and associated damage zone thickness. These range from a rock mass with no fault damage to a highly faulted rock mass with an extreme cumulative faulted
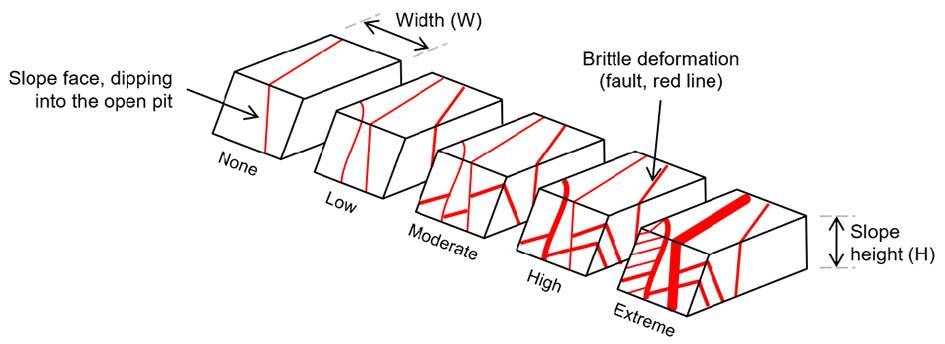
contribution. The cumulative fault damage zone width can also be viewed as a percentage of the width of the face, in which case the ‘extreme’ damage cumulative width on the slope would exceed 33%.
Fault orientation relative to the pit slope face is an additional factor that will influence the opening of new, or the dilation of existing faults, both of which have the potential to increase groundwater flow. This could lead to increased seepage for daylighting structures at the pit face resulting in depressurisation, or transient enhanced infiltration resulting in increased pressurisation.
Five orientation classes are provided (Figure 8), ranging from perpendicular to parallel with the pit slope. The most influential faults are those which hydraulically connect the slope face to large reservoirs of water, either in the backwall rock mass volume or the pit crest. If faults perpendicular to the slope do not dilate because of unloading, an increase in K leading to augmented depressurisation is unlikely, whereas parallel faults (or tension cracks) are likely to be more open, but not necessarily have a connected flow path to the slope face to allow for seepage losses to drain away the infiltrating water. The latter case may have little impact on passive depressurisation but does impose a risk of rapid infiltration during heavy rainfall and increases in pressures, leading to slope instabilities. Fault angles between these two endpoints will allow for both passive drainage to reduce pressures, and to drain-off rain events (although probably at a slower rate than infiltration increases pressures temporarily).
Rock mass condition
In open pits, the initial rock mass condition at time-zero (t0) is not necessarily what it will be as the excavation approaches final depth (tn). Decay of rock mass strength is not unusual over time. It is more pronounced in weaker and/or altered rock masses in temperate climates, ones with a wet/dry season, and those with pronounced freshet. By unconfining a rock mass, as illustrated in Figures 2 to 5, the local in situ stress fields are altered. When this occurs, the rock mass undergoes deformation, often in the form of increased fracture frequency and/or aperture near the excavation face (as observed in zones of increased stress near the pit floor as well). These effects decrease the rock mass strength and will ultimately result in some form of strain weakening (strength decay) over time. In mountain top mining, for example, relatively few new cracks are formed compared to high horizontal stress environments, but the pre-existing joints dilate, and step-path failures are induced as the rock mass ‘relaxes’. This results in an increase in the total volume of void space and hydraulic conductivity. The parameters that change can be estimated using well-known measures as described in the following, like intact rock strength (Bieniawski,
1989), among others, and rock quality designation (Deere, 1964). In addition, weathering will change over time, and the in situ stress will reorient itself around the advancing open pit shape.
Intact rock strength
Intact rock strength is commonly measured using unconfined compressive strength (UCS) testing, and the results for ‘rock’ range from 1 to more than 250 MPa. Most rocks fall into the 50 to 100 MPa range at or near the Earth’s surface. Rocks that are weaker than 25 MPa break much more readily than those that are significantly stronger (> 250 MPa). For the purposes of the HCA, RMR89 (Bieniawski, 1989) ranges have been used to represent intact rock strength, and all rocks that are stronger than 250 MPa have been assigned the same rating value (of 1). Strong rocks, when broken, will tend to retain their joint apertures, while weaker rocks’ joint apertures will tend to close over time as the intact rock structure decays.
Rock quality designation
Rock Quality Designation (RQD) is a measure that was introduced by Deere (1964) to characterise rock mass strength for engineering purposes. It is calculated as the sum of the length of the intact pieces of rock (> 0.1 m in length) for each drill run, expressed as a percentage. RQD is included in, and correlates to some degree, with Bieniawski’s (1976, 1989) rock mass rating system. Although field data do not show a strong correlation of high K to low RQD, potentially due to lack of connectivity and other factors, RQD has been included as part of the HCA rating system to provide a broadbrush estimate of the ‘brokenness’ of the rock mass, with ranges from 100 to 99%, 99 to 75%, 75 to 20%, and 20 to 0%.
Weathering of rock is a response to changes in the pressure, temperature, moisture, and the chemical environment in which it was formed (Fell et al., 2015) compared to the mined exposure. This is broadly expressed as mechanical changes in the rock mass, which tend to precede the chemical weathering processes. The rate at which weathering occurs, and the effect it has on the discontinuity void network, depends on the pre-mining rock mass composition and strength, as well as local hydrogeological and atmospheric conditions. For example, silicates are more stable than carbonates, sulphides, and clay minerals, with the latter often losing mechanical strength over relatively short periods of time of no more than a few years, depending on the rock type, moisture, and temperature range that they are being exposed to. In altered, weak, and/or argillaceous rocks, weathering processes will tend to decrease the hydraulic conductivity and the fines will ‘clog’ the flow path along fractures (and throats between pores) as they are transported through the

network. In hard or unaltered rock masses the influence of longterm decay is likely to increase K as joints and fractures that do open are more likely to stay open and not clog. The weathering rating classes used to describe the existing and/or anticipated rock mass conditions for the HCA, are those of Bieniawski (1989), in which the rock mass can be considered as being decomposed, highly weathered, moderately, slightly, or not weathered at all (none).
It has been demonstrated by Stacey (1973) and others, that the in situ stress field orientation varies around open pits. The shape of the damage zones, especially the EDZ and EIZ, depend on the terrain within which the open pit is mined (Figure 9) and the stress fields reorient themselves around the damage zones. In mountain-top environments the principal regional horizontal in situ stress (σH) is low because valley-floors create stress shadow zones at higher elevation, the rock mass tends to be unconfined, and most of the potential EDZ is made up of ‘loosened’ rock blocks around and below the pit. Dilation occurs in these environments as progressive, albeit slow (on the time scale of years to decades in very-poor to fair ground) vertical load induced ‘slumping’ (σv >> σH). In these cases, relatively few new joints are formed beyond the BDZ, and deformation is expressed as bulking of the rock mass as it ‘relaxes’ in place. There is no indication in mountain top mining that a significantly concave down EDZ develops, which means that water entering the system as rainfall or snow melt, will flow down and outwards towards lower elevations at the base of the geomorphologically de-stressed rock mass.
In valley bottom environments where the horizontal in situ stress (σH >> σh > σv) concentrates at the lowest part of the opening (Piteau 1970, Fell et al., 2015), damage induced by compression and upward movement of the rock mass in the floor (Matheson, Thomson 1973, Bell 1996, Hunt, 2005) of the pit tends to occur. This is like what is observed in drillholes advanced into highly stressed rocks, where borehole breakouts form perpendicular to the maximum in situ stress (σH). The amount of damage depends on the maximum in situ stress direction and magnitude relative to the intact rock strength and the pit shape. The weaker the rocks are, relative to the in situ stress magnitude, the more existing crack tips will extend, and newer cracks will be formed, which could increase the hydraulic conductivity of these zones as the joints coalesce, and rock bridge rupturing occurs. The in situ stress classes used for the HCA are based on the ratio between the principal horizontal stress (σH) and the vertical stress (σv). For laterally unconfined conditions, like on mountain tops, the stress conditions will have the relationship σv >> σH, while at the high stress extremes seen in
valley bottoms below sea level, the stress concentration will be σH >> σv.
Ice jacking
Ice jacking is a common modifying action caused when water infiltrates joints, fractures, or bedding, and then freezes and ‘expands’ the aperture during sub-zero temperature conditions in winter. This phenomenon is commonly observed in road cuts and causes bench scale damage in pits that can lead to spalling and localised instabilities. As this is mostly a ‘skin’ effect of no more than 5 to 10 m deep and not found at all pit locations, it has not been added to the Ratings table (see Table 1). Instead, in cases where this is a significant contributing factor, the HCA rating total can be reduced by up to 5 points to account for this localised effect.
Anisotropy
Foliation and bedding typically develop high-continuity anisotropic joint networks within rock masses, which can have significant influences on the BDZ, EDZ, and ultimately, the hydraulic conductivity surrounding open pits. For HCA purposes, a continuum from bedding-dominant to a foliation-dominant situation is considered. Bedding is usually dominant in low grade sedimentary metamorphic and orogenic terrains where deformation intensity is low. As deformation intensity increases, bedding is progressively overprinted by foliation (cleavage), and at high strains foliation becomes dominant with primary bedding no longer being preserved. The influence on the BDZ and EDZ by anisotropy is further influenced by bedding and foliation types, foliation, and bedding orientation relative to pit slope orientations, and the regional stress. High K can be expected to be correlated with an open bedding and certain (open) foliation types, where foliation and bedding orientations are perpendicular to pit slopes and parallel to regional stress.
Joints behave as pathways for water flow, and the longer (or more persistent) they are, the more pronounced their influence can be. Joints are, for engineering purposes, rock mass discontinuities with little or no cohesive strength and have no visibly discernable lateral offset, which is characteristic of ‘faults’. Even though some joints can be slickensided and do, therefore, have evidence of displacement across the plane, they are considered ‘joints’ and not micro-faults. Joint lengths can vary from a few centimetres, as in crackle-breccias, to several tens of metres or more in length, as is often seen in bedding parallel jointing. There is no direct relationship between joint length and aperture, but there is anecdotal evidence that in non-foliated ground, long and rough textured joints tend to have
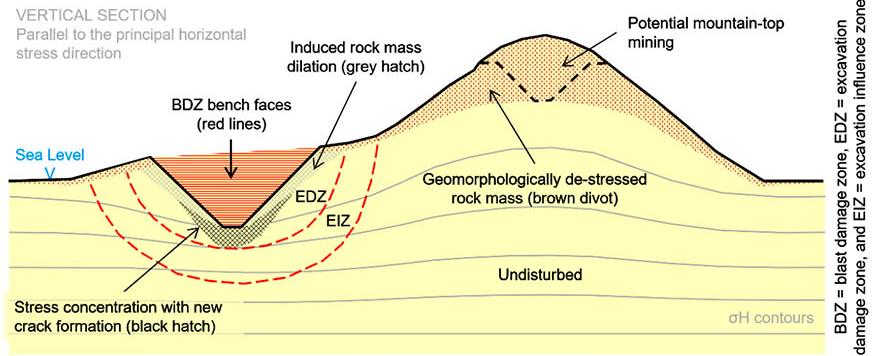
Table 1
Parameters and ranges of values with their relative weightings to estimate hydraulic conductivity adjustments for open pit damage and rock mass dilation

wider apertures. For the purposes of classification of lengths for the HCA, the RMR89 standard (Bieniawski, 1989) standard has been used in which the categories are <1 m, 1 to 3 m, 3 to 10 m, 10 to 20 m, and >20 m.
The frequency at which joints are encountered in scan-line mapping or drilling, as measured in counts per metre (FF/m), reflects the amount of jointing within the rock mass. Interconnected joints behave as pathways for water flow, and the longer (more persistent) and possibly more dilated they are, the more pronounced their influence potentially can be on passive depressurisation in an open pit environment. An extreme condition exists within rock mass rating systems in which, as the number of joints per metre approaches 40, being an end-member situation, any additional joints have little or no added cumulative impact on the behaviour of the rock mass. For example, 30 joints per metre is approximately what one would expect to record for an RQD of about 20%. Following on from this, an RQD of 75% has a fracture frequency of approximately 10, while the linear approximation of RQD at the low end of the spectrum is FF/m ≈ 3 (RQD ≈ 95%). At the point where FF/m ≈ 1, a rock mass would be considered undisturbed and ‘intact’ from a typical mining engineering perspective – and
this is the second from lowest increment proposed for the HCA’s FF/m classification, where RQD ≈ 99%. These FF/m classification categories (> 30, 30 to 10, 10 to 3, 3 to 1, and <1) are used for the HCA and could potentially be used to represent the rock mass damage zones presented in Figures 3 to 5, if calibrated using the base of the drawdown cone in open pit mines.
Fabric orientation, discontinuity length, and continuity
For groundwater to flow through the fractures, there needs to be a continuous (but possibly tortuous) flow path to a discharge point on the pit face. Figure 10 illustrates how discontinuity orientation becomes critical to discharge as the angle approaches 90° relative to the pit face – and even though the concept is scale-independent, a scale has been provided for context. Figure 10 also shows that at angles less than 10° it may have little impact on the ability to drain the rock mass within the timescale of mining but could be influential in short term transient events such as rainfall or snow melt.
Hydraulic conductivity adjustment
Rock disturbance factor
Using the parameters described in the aforementioned, a method is proposed for adjusting K values using a rock disturbance factor

Figure 10—Dominant anisotropy (bedding, foliation, fabric) relative to the slope face orientation, within ranges used for the hydraulic conductivity adjustment. Slope H & W are in the 10 to 1,000 m range
(RDF) to account for the changes in the individual parameters, as listed in Table 1. Once the changes in the input parameters have been estimated (Ratings Δ), the RDF can be calculated and used to determine the hydraulic conductivity adjustment (HCA), which results in the modified K value (K’) used for that domain and pit slope design sector of the slope. It is important to recognise that there is some cross correlation between individual parameters, and how they can affect K in the rock mass (for example, fracture length will affect slope drainage and infiltration differently depending on fracture orientation relative to the slope’s open face) but this has been done so that various scenarios can be dealt with. The initial approach to determining the RDF is to use a simple summation of the parameters, as described in Equation 1 and illustrated in Table 1, to estimate the Ratings Δ for a specific rock mass volume within the open pit slope. The RDF is described in Equation 2:


Hydraulic conductivity adjustment calculation and application
The RDF can be used to adjust the initial (t0) hydraulic conductivity measurements (K) to the estimated values that take the changes in the rock mass and pit slope characteristics (Ratings Δ) into account at tn. The adjusted hydraulic conductivity (K’) is K to the power of RDF, as shown in Equation 3:

RDF values can range from 0.001 (no adjustment) to 0.23 (extreme decreasing adjustment), but can also increase to above 1.00 in situations where the hydraulic conductivity is reduced by confinement or clogging/closure of joints. Two examples are provided in Appendix 1, the first (A) in which pre-mining data is used to estimate conditions during mining, and the second (B) in which data collected in one part of the pit is used in a different (deeper and more confined) location relative to the original K-measurement location relative to the pit shape. The overall workflow for calculating the HCA is:
[3]
Several iterations should be done, using slightly different parameter estimates so that the sensitivity of individual parameters can be assessed for each rock mass volume of interest. As the parameters can change significantly around an open pit, the RDF needs to be reviewed carefully to ensure the parameter ratings are appropriate. For example fracture dilation will change substantially as the testing location moves from the BDZ into the EDZ, and then into the EIZ. There are some situations that are not easily dealt with by the HCA but can be done with experience and engineering judgement. A good example of this is fractures parallel to a slope versus tension cracks. The slope-parallel fractures are expected to dilate because of unloading within the EDZ, in turn increasing infiltration, but ultimately this results in only a small increase in passive drainage. On the other hand, tension cracks above instabilities, which are also parallel to the slope, can significantly increase passive drainage in the local area. Another situation that is complex is the orientation of the principal in situ stress field relative to a fracture plane or foliation direction – if in compression rather than tension (dilated) relative to the anisotropy or fabric of the rock mass, they will behave differently. Unloading within the EDZ domain can be thought of as having the effect of dilating all of the fractures within the rock mass, but this effect could potentially be overridden by an increase in the in situ stress field’s magnitude for those fracture planes oriented perpendicular to the principal stress orientation direction.
Hydrogeological predictions and/or numerical modelling are used to determine the likely transient pore pressure distribution of the general rock mass (and specific geotechnical domains and pit design sectors) for use in stability modelling. To do so, assumptions need to be made on how the rock mass will change and be affected by passive drainage, which results in depressurisation and recharge, which reduce or even reverse depressurisation. These assumptions are influenced by changes in rock mass permeability, highlighting the need for a better understanding of how hydraulic conductivity evolves within rock slope domains over time. The HCA is useful in conceptualising, explaining, and justifying any proposed changes in K values when doing a pit slope model of an interim pushback or an end-of-life mine model.
➤ Measure the t0 hydraulic conductivity (K) or estimate it from similar areas and rock mass conditions.
➤ Rate the potential changes to the parameters, based on knowledge of the location in which the decayed rock mass will occur within the pit, and calculate the rock dilation factor (RDF).
➤ Apply the RDF to the t0 K value to calculate the expected tn hydraulic conductivity.
The HCA arrived at by using this method can be used as a guide to the possible hydraulic conductivity of the rock mass at tn.
Recharge (water pressure increase)
Rivers and lakes: The presence of water bodies near the pit slope have the potential for recharging or maintaining higher pore pressures in the rock mass (as illustrated in Figure 11). This could be exacerbated in cases where fractures form parallel to the slope, which will allow infiltration but could hinder passive drainage and result in increased pore pressures at depth.
Freshet, snow melt, and storm events: The influence of rapid snow melting, or significant precipitation events can cause considerable, if
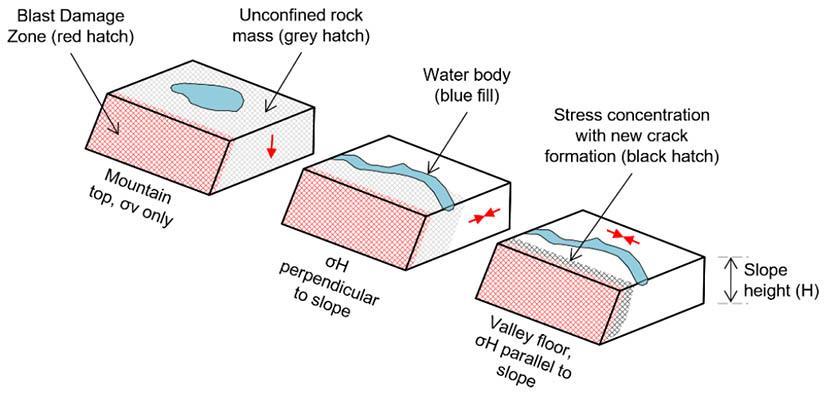
only temporary, increases in pore pressures in rock slopes, especially if vertical tension cracks are present. These rapid infiltration events can have significant impacts on the rock mass, an example of which is illustrated in Figure 12, where a 55 m increase in pressure was measured at a glacially formed natural slope of approximately 700 m height in northern British Columbia, Canada. The Figure 12 measurements are based on calibrated vibrating wire piezometer (VWP) sensors. At this location, vertical fracturing and dilation are thought to have been caused by the relaxation of the rock mass after the ice mass receded (melted) and is considered analogous to the unloading observed in EDZs in open pits. In situations where significant tension crack development has occurred along pit crests, the HCA rating total should be reduced by up to 10 points to account for this localised perimeter influence.
Discussion
The conceptual model developed for the open pit damage and dilation zone shapes is based on homogenous material types with simple stress field trajectories. It is recognised that rock masses are inhomogeneous and anisotropic, so too are the stress fields surrounding them, which can be deflected locally by large brittle deformation features, fabric, and so on. In general, though, as an open pit is mined progressively deeper, water flow occurs mostly through joints close to the current pit face in the rock mass, and as the vertical load (σv) increases, so the hydraulic conductivity (K) decreases.
Large brittle deformation features, like faults, can be considered as representing ‘broad’ discontinuities, which behave according to their ‘fill’ material and the fracture frequency of their damage zones. Foliation can also direct flow (along open planes), which is a form of anisotropic behaviour. At the one extreme, blast damage and rock mass dilation increases fracture-counts and aperture, respectively, which often leads to increased flow, while at the other extreme, depth closes off discontinuity-related void space, which
significantly reduces the hydraulic conductivity. These and other local variations in the discontinuity void shapes, whilst in situ stress direction and magnitude can influence the dilation of joints, which can induce anisotropic flow in and around open pits. This is not well understood at this point and needs further study.
Transient factors are seldom incorporated into slope stability models during the early stages of investigation, such as the scoping or PFS-FS levels, despite their potential significance. The HCA has been developed not only as an aid for the conceptualisation of how transient parameters influence water flow around open pits, but it could also be used for water flow simulations to assess how well the slope might depressurise with time or be impacted by recharge events.
The hydraulic conductivity adjustment (HCA) method has been developed for open pit mining environments and is an initial attempt at understanding and quantifying the multivariant effects of rock mass and geotechnical influences on passive depressurisation of pit slopes during mining. The method tries to provide geotechnical engineering practitioners with a semi-quantitative way of domaining the hydrogeological behaviour of rock masses within and around open pits.
It is proposed that hydraulic conductivity (K) measurements, acquired or estimated for undisturbed pre-mining rock masses, can be defensibly adjusted for planning and modelling purposes using geological and engineering judgement, to reflect a laterdate (K’) situation in which rock mass damage and/or dilation has occurred. Inputs to the HCA include ‘fixed’ and ‘transient’ input parameters. On the fixed end of the spectrum, the intact rock strength is relatively easily measured and does not change much for the life of mine (other than in chemically altered rocks), whereas fracture frequency or in situ stress and rock mass decay can change rapidly and are sometimes more difficult to quantify. As the project advances and open pit shapes change, transient parameter characterisation becomes increasingly critical. The use of instrumentation, along with updated drilling and characterisation programmes, is strongly recommended. No previously published data describing rock mass strength decay and the associated water flow around open pits to adequately calibrate the HCA have been found, and therefore underground excavation damage zone characterisation work was used to develop this conceptual model. Fortunately, field-based K profiles were available, which enabled estimation of the likely range of K to K’ variations. These profiles formed the basis of the initial calibration dataset for the HCA. Overall, it is recommended that geotechnical domains be established inclusive of mining induced damage zones to allow for
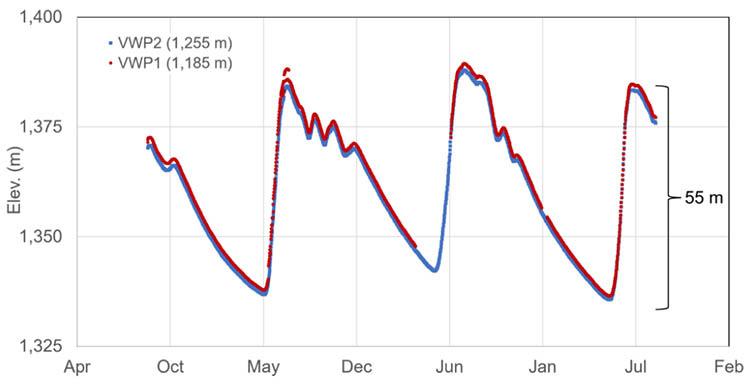
the quantification of the rock mass strength and the influence on hydraulic conductivity over time. Even though HCA estimates of future conditions can be made for any point in the mining project life cycle, the first choice for slope stability modelling data input should always be the use of rock mass and hydraulic conductivity data acquired within the present phase of the project. With sufficient calibration over time, use of this method could potentially enable the identification of the primary factors affecting the hydrogeological influences on pit slope stability in specific mining environments.
Acknowledgements
We thank our colleagues at SRK Consulting Inc (Canada) Inc for ongoing technical discussions, and for providing resources to prepare this work. Our gratitude is also extended to our volunteer external reviewers, Geoff Owen (Teck Resources Ltd.) and Shane O'Neill (O'Neill Hydro-Geotechnical Engineering Ltd), as well as the anonymous journal reviewers – all of whom provided useful guidance, which helped refine the final document.
References
Bell, J. 1996. Petro Geoscience 1. In situ stresses in sedimentary rocks (part 1): measurement techniques. Geoscience Canada. Bieniawski, Z.T. 1976. Rock mass classification in rock engineering applications. In Proceedings of a Symposium on Exploration for Rock Engineering, 1976 (vol. 12, pp. 97–106).
Bieniawski, Z.T. 1989. Engineering rock mass classifications: a complete manual for engineers and geologists in mining, civil, and petroleum engineering. John Wiley & Sons.
Bloem, A., Barnett, W.P. 2022. Geotechnical domain model evolution during the mining project lifecycle, Slope Stability 2022: Proceedings of the 2022 International Symposium on Slope Stability in Open Pit Mining and Civil Engineering, Tucson, Arizona.
Deer, D.U. 1964. Technical description of rock cores for engineering purpose. Rock Mechanics and Rock Engineering, vol. 1, pp. 17–22.
Fell, R., MacGregor, P., Stapledon D., Bell, G., Foster. M. 2015. Geotechnical engineering of dams, 2nd Edition. CRC press, London, pp. 21–26.
Hoek, E. 1994. Strength of rock and rock masses, ISRM News Journal, vol. 2, no. 2, pp. 4-16.
Hoek, E., Brown, E.T. 2019. The Hoek–Brown failure criterion and GSI–2018 edition. Journal of Rock Mechanics and Geotechnical Engineering, vol. 11, no. 3, pp. 445–463
Hoek, E., Karzulovic, A. 2000. Rock mass properties for surface mines. Slope Stability in Surface Mining, WA Hustrulid, MK McCarter and DJA van Zyl, Eds, Society for Mining, Metallurgical and Exploration (SME), Littleton, CO, pp. 59-70. Hunt, R.E. 2005. Geotechnical engineering investigation handbook CRC Press, London
Matheson, D.S., Thomson, S. 1973. Geological implications of valley rebound. Canadian Journal of Earth Sciences, vol. 10, no. 6, pp. 961-978.
Piteau, D.R. 1970. Geological factors significant to the stability of slopes cut in rock. South African Institute of Mining and Metallurgy
Royle, M. 2023. SRK Consulting (Canada) Inc. Personal communication.
Stacey, T.R. 1973, November. A three-dimensional consideration of the stresses surrounding open pit mine slopes. In International Journal of Rock Mechanics and Mining Sciences and Geomechanics Abstracts (vol. 10, No. 6, pp. 523–533). Pergamon.
Stacey, T.R., Xianbin, Y., Armstrong, R., Keyter, G. 2003. New slope stability considerations for deep open pit mines. Journal of the Southern African Institute of Mining and Metallurgy, vol. 103, no. 6, pp. 373-389.
Jiang, X-W., 2010. Semi-empirical equations for the systematic decrease in permeability with depth in porous and fractured media. Hydrogeology Journal, vol. 2010, no. 18, pp. 839–850
Wei, Z.Q., Egger, P., Descoeudres, F. 1995, April. Permeability predictions for jointed rock masses. In International journal of rock mechanics and mining sciences & geomechanics abstracts (vol. 32, no. 3, pp. 251–261). Pergamon. u
Appendix 1
These example calculations are based on the parameters and ratings provided in Table 1. Note that two parameters have an inverse effect on K, in other words, their ratings increase from left-to-right in Table 1. These inverse ratings are in the Rock Mass Rating (max total = 20) section and are the values used for rating intact rock strength and weathering.
Example A – Mining estimate using pre-mining data
In this example, K is estimated within an EDZ, based on pre-mining data collected within the same rock mass volume of interest (VOI). It is assumed that the t0 rock mass’ K was determined during the PFS or FS, and now the t1 VOI will be 100 metres behind the open pit mining face, within a linear slope in the destressed zone 100 m below the pit perimeter. Where there is no change in the parameter, it remains the same and thus cancels out (for example, in Faults below):
If t0 K = 1.0E-6m/s
Shape = (14 – 6) + (3) + (3) = 13 drillhole to pit shape change
Faults = (20 - 20) + (10 - 10) = 0 no change in faults Rock Mass = (3 – 3) + (4 – 3) + (2 – 3) + (4 – 4) = 0 changes in RQD and weathering
Anisotropy = (8 – 6) + (4 – 3) + (5 – 1) = 7 dilation of joints, orientation
Rating Δ = 13 + 0 + 0 + 7 = 20 = see eqn. 1
RDF = (100 – 20) / 100 = 0.80 see eqn. 2
Then t1 K’ = K ^ RDF = 1.0E-6m/s ^ 0.80 = 1.6E-5m/s see eqn. 3
In this example, the location of the rock mass volume of interest (VOI) relative to the pit shape changes such that the rock mass at the new location is more competent than the intial location tested. The change in ratings can be used to estimate the “upgrade” in rock mass and resulting decrease in K. The t0 rock mass’ K was determined within the EDZ behind a convex slope at 50 m depth, and the t1 VOI being considered is 100 m behind the face, within a concave slope at a depth of 200 m, with a modest decrease in FF/m and anisotropy.
If t0 K = 1.0E-6m/s
Shape = (3 – 10) + (3 – 3) + (3 – 2) = -6 locations change in the pit
Faults = (10 – 14) + (10 – 10) = -4 fewer fault intersections
Rock Mass = (4 – 4) + (3 – 4) + (3 – 1) + (1 – 4) = -2 increases in rock mass strength
Anisotropy = (4 – 8) + (2 – 4) + (2 – 3) = -7 confinement related changes
Rating Δ = -6 – 4 – 2 – 7 = -19 see eqn. 1
RDF = (100 – (-19)) / 100 = 1.19 see eqn. 2
Then t1 K’ = 1.0E-6m/s ^ 1.19 = 7.2E-8m/s see eqn. 3
1-3 October 2025 — International Mineral Asset Valuation Conference 2025
Navigating Mineral Asset Valuations in an Uncertain Future
The Maslow Hotel, Sandton
Contact: Gugu Charlie Tel: 011 538-0238
E-mail: gugu@saimm.co.za
Website: http://www.saimm.co.za
13-16 October 2025 — Geometallurgy Conference 2025
Future-Ready Geometallurgy: Trusted Data, Advanced Tools, Smarter Decisions
Glenburn Lodge and Spa, Muldersdrift
Contact: Gugu Charlie Tel: 011 538-0238
E-mail: gugu@saimm.co.za
Website: http://www.saimm.co.za
21 October 2025 — 21ST Annual Student Colloquium 2025
Adapting the African Mining industry to changing global trends to ensure long term sustainability
Mintek, Randburg, Johannesburg
Contact: Gugu Charlie Tel: 011 538-0238
E-mail: gugu@saimm.co.za
Website: http://www.saimm.co.za
27-29 October 2025 — 9TH International PGM Conference 2025
PGM - Enabling a cleaner world
Sun City, Rustenburg, South Africa
Contact: Gugu Charlie Tel: 011 538-0238
E-mail: gugu@saimm.co.za
Website: http://www.saimm.co.za
30-31 October 2025 — 8TH Young Professionals Conference 2025
Mintek, Randburg, Johannesburg
Contact: Gugu Charlie Tel: 011 538-0238
E-mail: gugu@saimm.co.za
Website: http://www.saimm.co.za
16-22 November 2025 — The 12TH International Copper Conference (Copper 2025) Phoenix, Arizona, USA
Website: https://www.extractionmeeting.org/ Extraction2025/Extraction2025/Copper2025/default.aspx
19-21 November 2025 — MineSafe Hybrid Conference 2025
Safe Mines, Healthy Lives, and Sustainable Futures Emperors Palace Convention Centre
Contact: Camielah Jardine
Tel: 011 538-0237
E-mail: camielah@saimm.co.za
Website: http://www.saimm.co.za
3-4 March 2026 — Tailings 2026—Where to Now?
Indaba Hotel, Spa and Conference Centre, Fourways
Contact: Gugu Charlie Tel: 011 538-0238
E-mail: gugu@saimm.co.za
Website: http://www.saimm.co.za
13-14 April 2026 — SANCOT Symposium 2026
Unlocking Africa’s Potential: Advances in Tunnelling in Civil Engineering and Mining
Southern Sun Rosebank
Contact: Gugu Charlie Tel: 011 538-0238
E-mail: gugu@saimm.co.za
Website: http://www.saimm.co.za
12 May 2026 — Diversity and Inclusion in the Minerals Industry Conference 2026
Re-imagining Diversity and Inclusion - Where to From Now?
Southern Sun Rosebank
Contact: Gugu Charlie
Tel: 011 538-0238
E-mail: gugu@saimm.co.za
Website: http://www.saimm.co.za
26-28 May 2026 — SAIMM Pyrometallurgy International Conference 2026
Foundation of Competitiveness and Sustainability
CSIR International Convention Centre, South Africa
Contact: Gugu Charlie
Tel: 011 538-0238
E-mail: gugu@saimm.co.za
Website: http://www.saimm.co.za
24-25 June 2026 — Mine-Impacted Water Conference 2026
Mintek, Randburg, Johannesburg
Contact: Gugu Charlie
Tel: 011 538-0238
E-mail: gugu@saimm.co.za
Website: http://www.saimm.co.za
18-21 August 2026 — SAIMM Uranium Conference 2026
Swakopmund Hotel and Entertainment Centre, Swakopmund, Namibia
Contact: Gugu Charlie Tel: 011 538-0238
E-mail: gugu@saimm.co.za
Website: http://www.saimm.co.za
22-25 September 2026 — XIX International Society for Mine Surveying Congress 2026
Century City, Cape Town
Contact: Gugu Charlie
Tel: 011 538-0238
E-mail: gugu@saimm.co.za
Website: http://www.saimm.co.za
18-22 October 2026 — XXXII International Mineral Processing Congress 2026
Cape Town, South Africa
Contact: Camielah Jardine
Tel: 011 538-0237
E-mail: camielah@saimm.co.za
Website: http://www.saimm.co.za
The following organizations have been admitted to the Institute as Company Affiliates
acQuire Technology Solutions
African Pegmatite
Allied Furnace Consultants
AMIRA International Africa (Pty) Ltd
Anglogold Ashanti Ltd
Anton Paar Southern Africa
Arcus Gibb (Pty) Ltd
Becker Mining (Pty) Ltd
Bluhm Burton Engineering Pty Ltd
BSI Group South Africa
Buraaq mining Services (Pty) Ltd
Caledonia Mining South Africa
Carbocraft
Castle Lead Works
CIGroup ACE Pty Ltd
DDP Specialty Products South Africa (Pty) Ltd
De-Tect Unit Inspection (Pty) Ltd
Digby Wells and Associates
EHL Consulting Engineers (Pty) Ltd
EKATO South Africa
Elbroc Mining Products (Pty) Ltd
Epiroc South Africa (Pty) Ltd
Ex Mente Technologies (Pty) Ltd
Exxaro Resources Limited
FLSmidth Minerals (Pty) Ltd
G H H Mining Machines (Pty) Ltd
Geobrugg Southern Africa (Pty) Ltd
Glencore
Gravitas Minerals (Pty) Ltd
Hatch (Pty) Ltd
Herrenknecht AG
Impala Platinum Holdings Limited
IMS Engineering (Pty) Ltd
Ingwenya Mineral Processing
Ivanhoe Mines SA
Longyear South Africa (Pty) Ltd
Malvern Panalytical (Pty) Ltd
Maptek (Pty) Ltd
Mech-Industries
Micromine Africa (Pty) Ltd
Minearc South Africa (Pty) Ltd
Minerals Council of South Africa
MineRP Holding (Pty) Ltd
Mining Projection Concepts (Pty) Ltd
Mintek
MLB Investments CC
Modular Mining Systems Africa (Pty) Ltd
Murray & Roberts Cementation (Pty) Ltd
M84 Geotech
Paterson & Cooke Consulting Engineers (Pty) Ltd
Pump and Abrasion Technologies (Pty) Ltd
Redpath Mining (South Africa) (Pty) Ltd
Rosond (Pty) Ltd
Roytec Global (Pty) Ltd
Rustenburg Platinum Mines Limited - Union
Schauenburg (Pty) Ltd
Sebotka (Pty) Ltd
SENET (Pty) Ltd
Sibanye Gold Limited
Solenis
Sound Mining Solution (Pty) Ltd
SRK Consulting SA (Pty) Ltd
Tomra (Pty) Ltd
Trans-Caledon Tunnel Authority
Ukwazi Mining Solutions (Pty) Ltd
VBKOM Consulting Engineers
Weir Minerals Africa
Zutari (Pty) Ltd
MARCH 2026 CONFERENCE
3-4 MARCH 2026 – CONFERENCE | 5 MARCH 2026 – TECHNICAL VISIT
Indaba Hotel, Spa and Conference Centre, Fourways
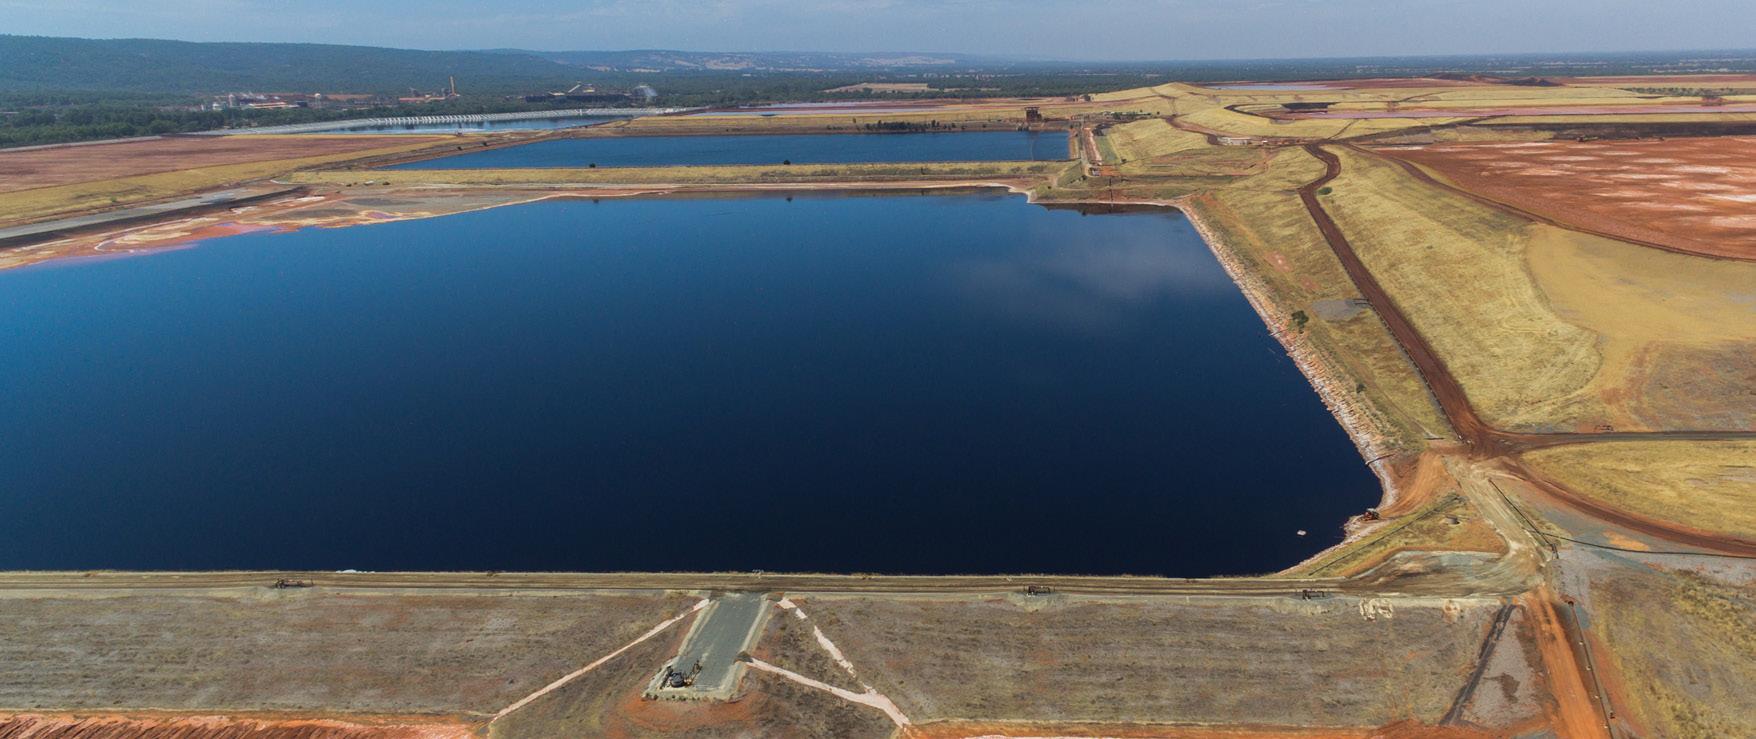


The SAIMM is proud to announce its upcoming 2026 conference on Tailings. Since the inaugural event, which raised the profile of tailings management and fostered collaboration among industry stakeholders, and the subsequent conference that focused on embracing the Global Industry Standard on Tailings Management (GISTM), the field has seen significant progress. We’ve deepened our understanding of GISTM requirements, advanced geotechnical knowledge of tailings dams, engaged more stakeholders, and made strides toward improved safety through GISTM compliance. However, despite these achievements, tailings dam failures persist, signalling that there is still much work to be done and lessons to learn. As we look to the future, the 2026 conference will ask: Where to now? In a world of new standards, evolving expectations, and emerging possibilities, what opportunities lie ahead? What residual risks need addressing? How can we further reduce, reclaim, or reuse tailings? How can we accelerate the adoption of new technologies and set a new benchmark for the industry? What impacts, once considered acceptable, are no longer tolerable, and how can we best manage them?
Join us in 2026 to explore these critical questions and engage in meaningful discussions with key role players in the tailings industry.
For further information contact:




Mining operators are seeing an increased demand for minerals and ores. Operators must now consider the costs of pump maintenance and replacement as well as the cost-benefit of utilizing fewer larger pumps versus several smaller pumps to perform the same work.
Mining operators are seeing an increased demand for minerals and ores. Operators must now consider the costs of pump maintenance and replacement as well as the cost -benefit of utilizing fewer larger pumps versus several smaller pumps to perform the same work.
The KSB GIW® MDX pump line delivers proven results in the harshest hard rock mining applications.
The KSB GIW® MDX pump line delivers proven results in the harshest hard rock mining applications.

W: www.ksb.com/en-za
T: +27-11-876-5600
W: www.ksb.com/en-za T: +27-11-876-5600
