
Comprehensive Plan: Our Roadmap to 2055
Adopted June 11, 2025 Resolution # 2025/07

Steering Committee
Kayla Brooks Hancock County Planner
Dan Riley City Council President
Retta Livengood Greenfield Chamber of Commerce
Harold Olin
Greenfield-Central School Corporation Superintendent
Jason Cary Assistant Superintendent
Mary Gibble Hancock County Community Foundation
Sara Joyner Main Street Organization
Matt Braur Comm - Ind Developer VP
Ron Pritzke Citizen/Retired Zoning Attorney
Randy Sorell Hancock County Economic Development Council
Jennifer Hudson CPA Municipal Advisor
Mike Terry City Plan Commission
Jason Koch City Engineer
Steve Long Hancock Regional Hospital CEO
Sharon Kramer Admin to Steve Long
City Staff
Ellen Kuker Parks Department
Charles Gill Water Utility
Scott Yost Electric Utility
Nicholas Dezalan Wastewater Utility
Tyler Rankin Street Department
Rob Souchon IT
Chief Brian Hartman Police Department
Chief Jason Horning Fire Department
Amanda Dehoney Animal Management
Jane Webb Utility Coordinator
Mitch Ripley HR Director
Guy Titus Mayor
Lori Elmore Clerk-Treasurer
Joan Fitzwater Planning Director
Evan Beaty Assistant Planner
Donna Butler Assistant Planner


The Greenfield Comprehensive Plan is Our Roadmap to 2055. Contained in this Plan is a bold, flexible, and collaborative long-term Vision with supporting Goals and Objectives to make informed and desirable decisions about the future of development within the City. This Plan is the outcome of a two-year planning process (June 2023 – June 2025) that brought people together from across the community, including elected officials, City staff, community organizations and government partners, to envision the best path forward regarding land use and development, with the available resources, data, and aspirations of the community. It is critical for elected officials and City Department Heads to consider the long-term capacity, such as necessary staff and funding to achieve the community’s Vision. We won’t reach the end of the roadmap tomorrow — but we know the destination — which allows us time to cover our bases, then prepare to hit the road with a solid Plan.
Our Roadmap shows us the best path to achieve our Vision, but like any roadmap, we might hit a few bumps or discover a better route along the way. In other words, the community should be prepared to adjust course as physical, economic, and social conditions change in Greenfield and its surroundings. There are trends on which we need to Act Now, trends that we can Prepare For, and trends that we need to Watch and Learn. For example, we know housing and real estate markets will shift with economic changes, we can prepare for advances in technology, and we should continually listen to and learn the needs and wants of the people as the City evolves culturally and demographically. Hence it is generally recommended for the City to update this Plan around every five years if City staff and officials believe it is warranted. Annual reviews should occur between updates to map unforeseen challenges, what has been achieved so far, and how best to proceed. After 30 years, the City should undertake a major rewrite and review of the Vision, Goals, and Objectives.
Vision Statement
Our Roadmap to 2055 envisions Greenfield as:
• An authentic American city respectful of our heritage and intentional with our future
• A vibrant, accessible, and connected array of gathering places
• A resilient economy that supports a variety of business and employment opportunities
• A street network with enhanced connectivity and mobility
• A place with diverse and multi-generational housing options
• A community focused on safety and well-being
• A flourishing arts and cultural scene
• Continued high-quality education opportunities for all life stages
• Robust civic engagement and pride
• A harmonious relationship between nature and development
The diagram in Figure 1-2 shows how the plan has been structured. Starting at the top is the most essential element of the Plan: a vision, or in other words, a community-driven mission statement for the future.
Following the vision statement are goals and objectives which support the vision. Underneath objectives are an Implementation Matrix, and Recommended Actions. These elements of the Plan are about how to prioritize action and track progress.
Placetypes, the Future Development Map, and Subarea Plans all describe the desired physical attributes of the community (i.e. ‘development’) based on the vision. Subarea plans give the City a more detailed description of how an important area of the community should be developed, such as downtown along the Pennsy Trail. The Future Development Map does not dictate when development should occur, rather how it should look and function when it does occur.


Figure 1-3: Four-Phased Approach to Comprehensive Planning.
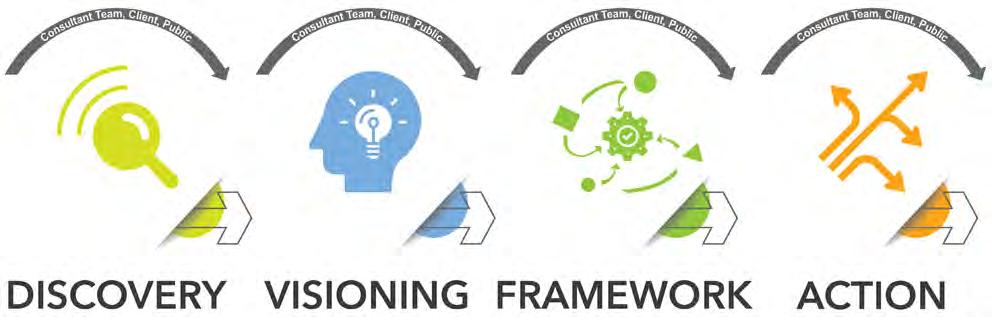
Finding a Roadmap
Uncovering data trends and learning about the community.
Choosing the Destination
Defining a vision and goals for community and development.
Planning the Route
Brainstorming and deciding on ways to achieve the vision and goals.
Setting off with a Plan
Prioritizing action, finalizing then adopting the plan as public policy.
people comprised of community leaders around Greenfield that met regularly throughout the planning process to provide insight and direction for the consultant team (see the next section on Community Engagement).
The second phase, Visioning, involved working with residents and stakeholders to imagine what kind of community they wanted Greenfield to be in 20 years. The Plan’s Vision and Goals were crafted during this phase with the ideas generated from public workshops and focus groups. The Steering Committee helped orient the consultant team based on these ideas to put together a draft Vision statement. Then, an additional meeting with the Steering Committee and City Department Heads finalized the Vision and Goals.
The first phase of the planning process, Discovery, consisted of data collection and analysis to learn the lay of the land and determine local trends in land use, housing, transportation, demographics, the environment, and the economy. This phase also included a review of previously completed reports, studies, and plans at the local and regional level, and if necessary, at state and federal levels. The consultant
team, Rundell Ernstberger Associates, began the Discovery phase with an evaluation of the City’s last comprehensive plan adopted in 2015, working with City staff and elected officials to note progress and development trends in and around Greenfield since its adoption.
This phase also brought together the Plan’s Steering Committee: a group of around 30
The third phase, Framework, tackled several aspects of the Plan, including Objectives for each Goal as well as how future development should feel and function. Future development was defined by creating Placetypes, which were then mapped onto a Future Development Map. Characteristics such as land use, street design, site design, and building design were created for each placetype. This type of place-based planning also built on previous planning efforts, including the Health and Heritage Regional Development Plan (aka Stellar Communities Plan) and Greenfield’s Downtown Revitalization Plan (see the Executive Summary or Chapter 3 for a description of Greenfield’s placetypes). Additionally, in comparison to traditional land use planning (which only defines land use),
placetypes have a greater emphasis on the quality of development rather than quantity.
A series of underlying Objectives for each Goal was drafted by the Steering Committee and focus groups comprised of City departments and utility services. Objectives identify more actionable ways to achieve a goal that have broad support from community members and organizations. Residents and stakeholders were engaged again to review the draft Objectives at another public workshop and in online activities. At the workshop, residents and stakeholders also brainstormed Action Steps for each Objective in groups of three to six. These Action Steps are the most specific and actionable (i.e. “boots on the ground”) element of the Plan. To ensure the Plan remains flexible over the Plan’s 30year lifetime (2025-2055), they were written as recommendations rather than mandates. In other words, they are possible avenues to improve the community, suggested by the community.
During the fourth and final phase, Action, the consultant team worked with the Steering Committee, and City departments and Utility Providers to identify when and who could implement each Objective. These details were assembled into an Implementation Matrix, which will help the City and any of its partners prioritize the Objectives, such as how much and when to prepare and allocate resources for them. Residents and stakeholders were engaged to solidify the Implementation Matrix and provide further insight into what Objectives they wanted to be prioritized.
Additionally, two design concepts were created:
1. Downtown Pennsy Trail
2. State Road 9 / Opportunity Parkway
These design concepts do not represent subarea plans, however, they should inform if the City decides to pursue subarea planning efforts.
The Pennsy Trail concept shows how trailoriented development could gradually increase residential and job density downtown by offering new housing types, additional places for retail, and creating memorable experiences for both residents and visitors.
The areas on the northside of Interstate-70 along State Road 9 and Opportunity Parkway shoud develop with a mix of uses, but predominantly bio-tech, ag-tech, and other innovative agricultural users. The east side of SR 9 should develop as a lifestyle center centered around recreation along Brandywine Creek with supporting mixed-use buildings.
At the end of this phase, a Draft Plan was presented at a public open house, along with public meetings for Greenfield’s Plan Commission and City Council. Afterward, a final public review and comment period of 30 days was announced per Indiana Code. After revisions via public input, a Final Plan was presented for adoption by both the Plan Commission and City Council.
Community engagement lies at the heart of the Comprehensive Plan, with emphasis on meeting people where they are by attending community events, collaborating with local businesses to spread awareness, and posting updates on social media, local news, and the City’s website. Through a series of public workshops, events, and online activities to supplement face-toface conversations, the voices of hundreds of residents and stakeholders were heard. These outreach initiatives served as vital points for idea-sharing, education, and consensus-building, providing valuable insights and perspectives that have shaped the creation of this Plan: Our Roadmap for 2055.
The Steering Committee met regularly throughout the planning process to provide insight and direction for the consultant team. This included how to best engage the public, review community feedback, and what avenues exist locally to accomplish the Vision, Goals, and Objectives.
Focus group meetings were held periodically to hear from a broad range of perspectives and insights. Each group was themed around certain topics so participants could provide their local
expertise for a more informed planning process, including several staff workshops to ensure the Plan was broadly understood throughout the City and achievable for each City department. They were also organized if there was a noticeable lack of engagement from segments of the community at public workshops. In total, there were 10 focus groups, with some groups meeting multiple times throughout the planning process:
• Elected and Appointed City Officials
• Local Business Economic Development
• Downtown Businesses and Organizations
• Schools and Arts Organizations
• Nonprofits and Community Resources
• Public Services and Utilities
• Developers, Builders, and Realtors
• City Department Heads
• High School Students
• Residents (Renters and Homeowners)
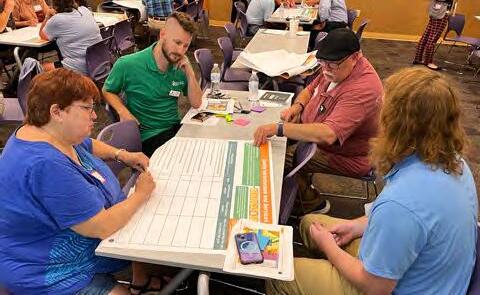
There were several meetings and events at each of the four phases of the planning process. These community engagements included:
• Two workshops where residents worked collaboratively in groups,
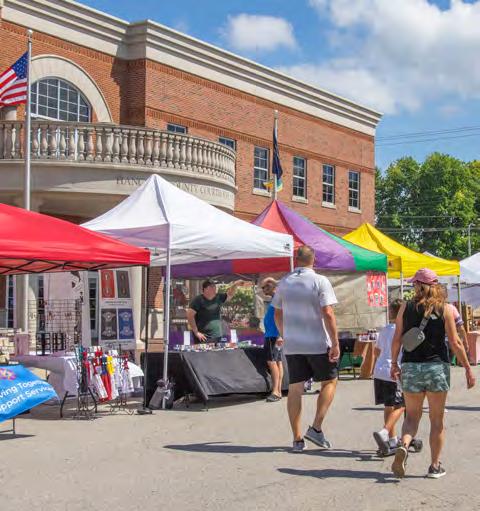
• Pop-up tents at two popular social events,
• An open house where residents could come and go as they please, and
• Public presentations at City Council and Plan Commission meetings.
In addition to face-to-face conversations, a dedicated project website was created for the planning process (GreenfieldinGear.com). This website allowed the community to engage in the planning process online if they couldn’t attend in-person. For example, public workshops were converted into online formats with the same activities as the in-person meetings. People could also download materials from meetings through the website, such as presentations and activity boards, and give feedback on the Plan via online forums, periodic polls, and contact forms.
Community leaders to guide the project team and provide insight on the inner workings of the community.
Groups of people with local expertise on a certain topic and segments of the community with a noticeable lack of representation in the planning process.
Recurring meetings to discuss feasibility of the Plan and promote consensus among the City’s many boards, commissions, and departments.
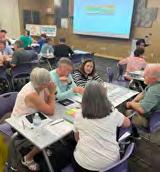
Collaborative, hands-on meetings open to everyone. Participants discussed and brainstormed solutions to a variety of topics
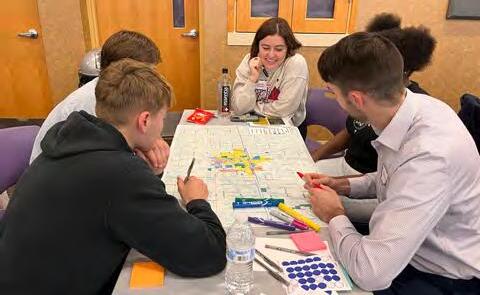
brainstorm ideas on future redevelopment and transportation around Greenfield at a community workshop in April 2024.
Online activities and opportunities to get involved available to everyone. The website acted as a hub for documents, information, and updates on the Plan.

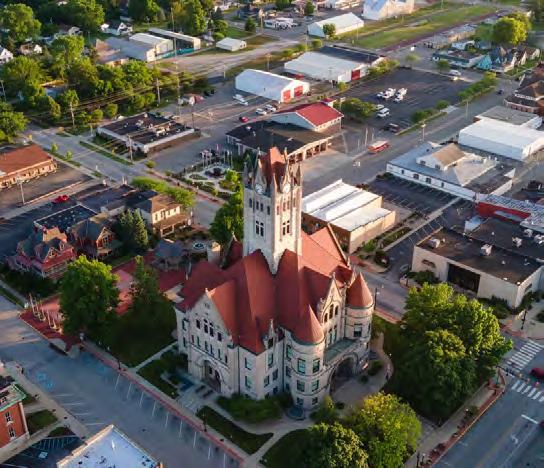
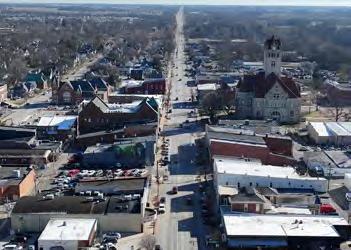
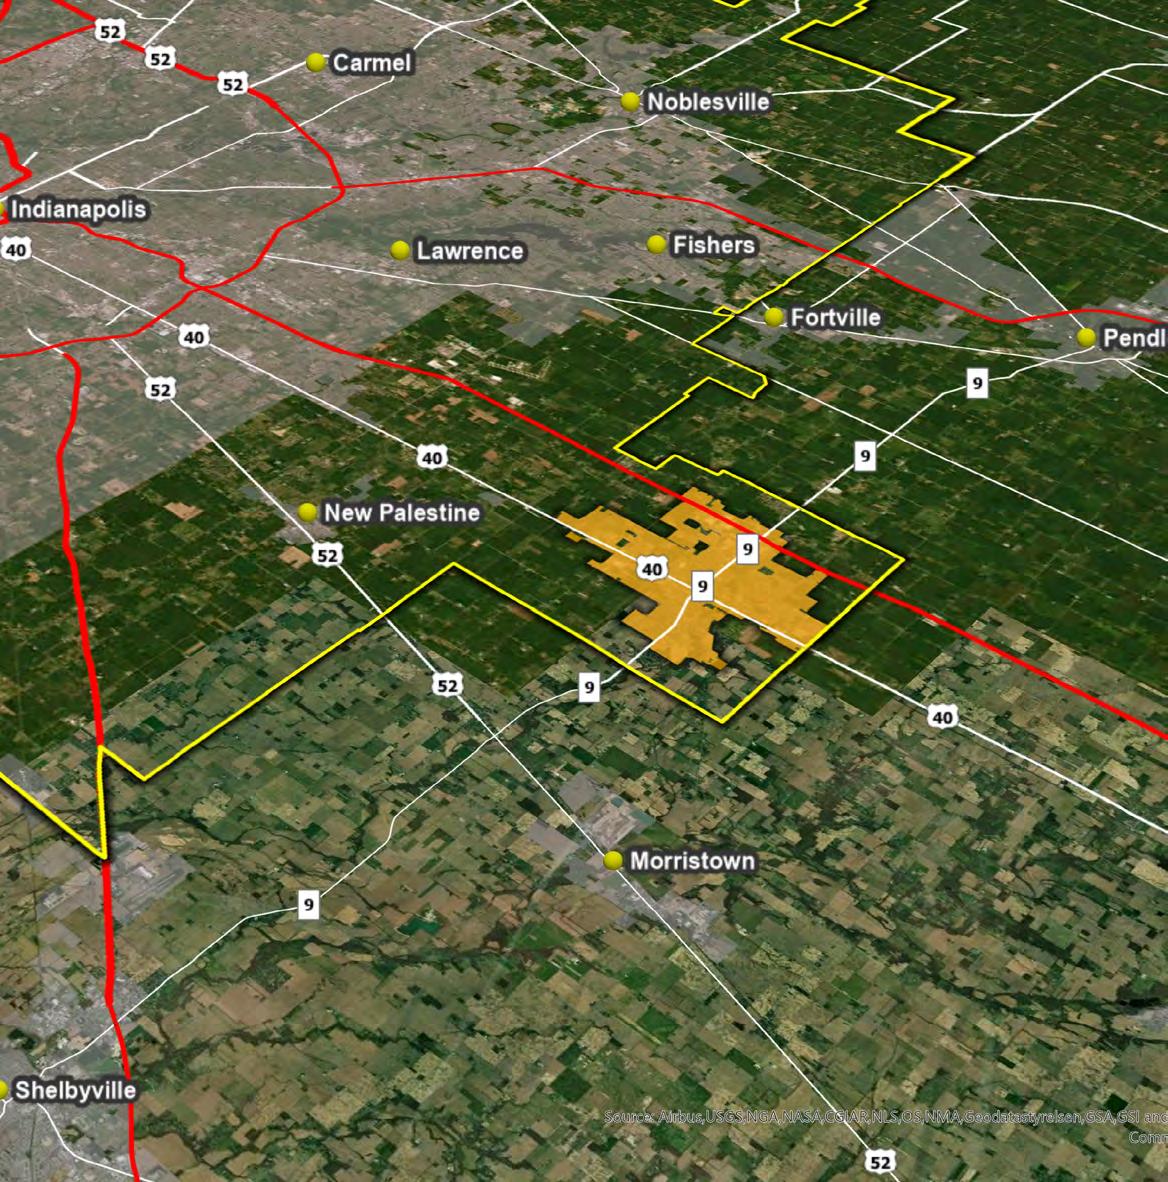
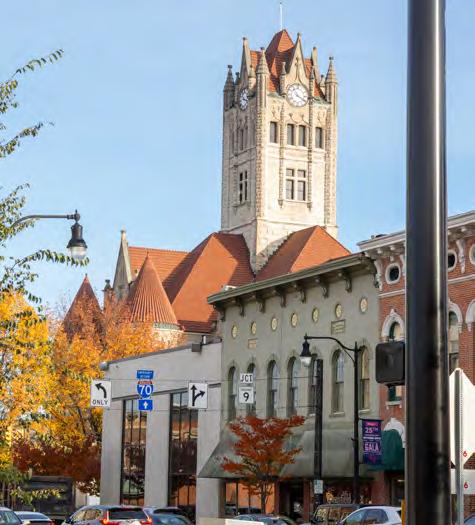
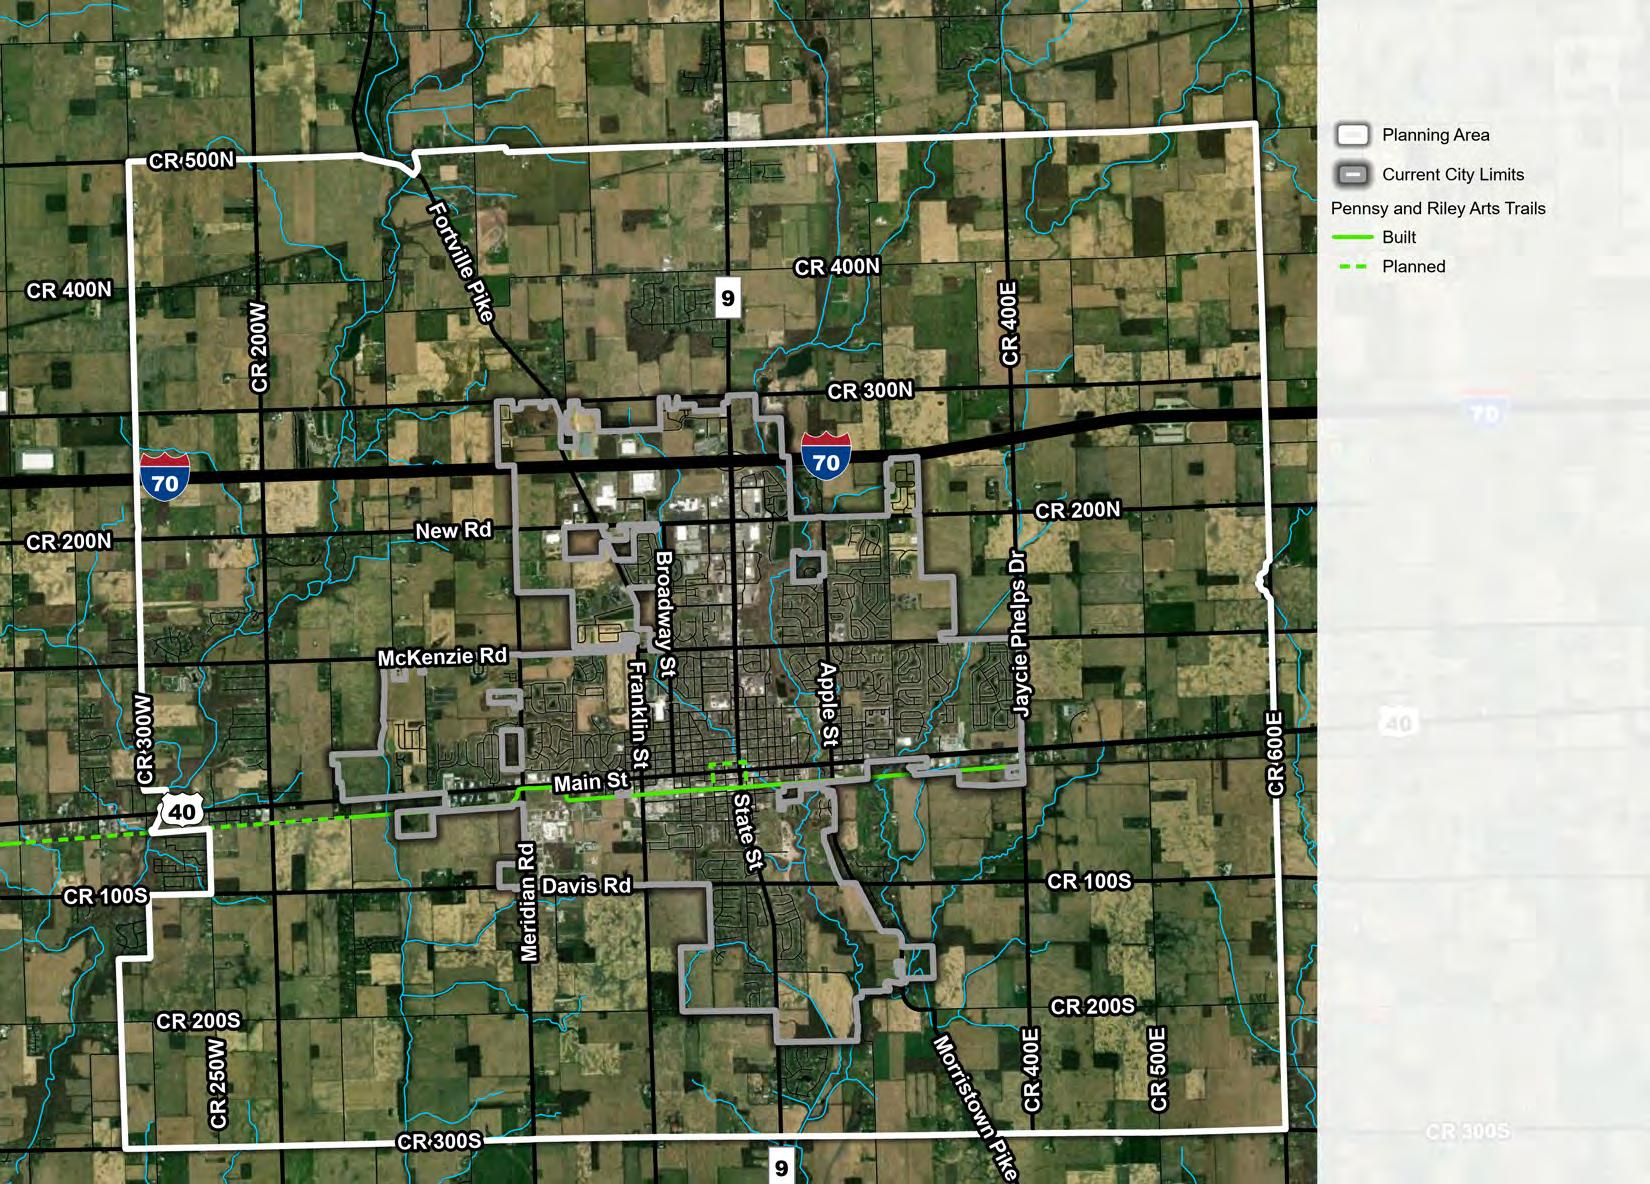
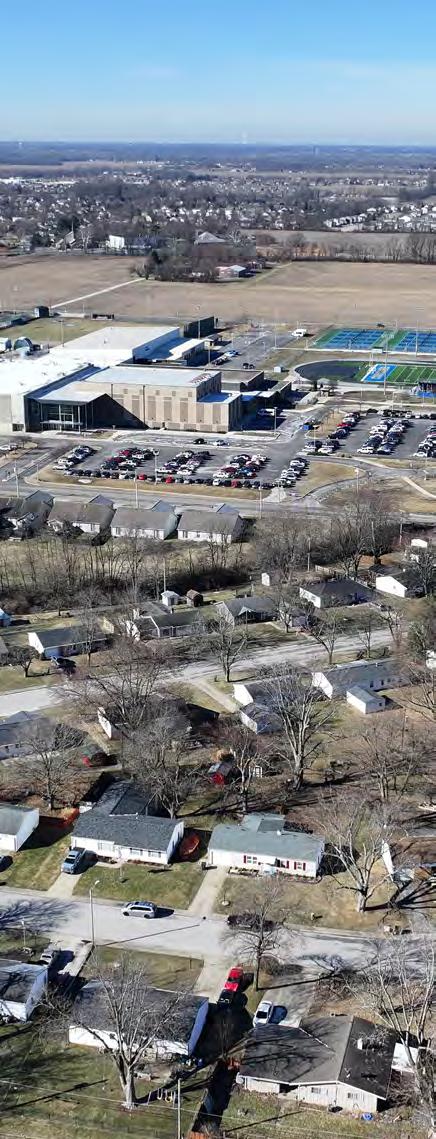
The City of Greenfield is centrally located in Hancock County on the east side of the Indianapolis metropolitan area. The city takes part in regional planning efforts through the Indianapolis Metropolitan Planning Organization (IMPO or Indy MPO). Greenfield has been the largest municipality in Hancock County since the county’s creation in March 1828 and was chosen as the county seat in April 1828. The City is located on generally flat plains, which gradually rise in elevation to the east and fall to the west.
The City provides several public utilities, including water, wastewater, stormwater, and electricity. Unlike many local governments in Indiana, Greenfield owns its electric utility which has allowed it to have one of the lowest electric bills in the Indianapolis region.
Indiana Code (IC) requires certain standards for a comprehensive plan, which can be found in the 500 series of IC 36-7-4. According to IC 36-7-4-502, a comprehensive plan must have at least:
• A statement of objectives for the future development of the jurisdiction.
• A statement of policy for the development of public ways, public places, public lands, public structures, and public utilities.
• A statement of policy for the land use development of the jurisdiction.
Additionally, this plan also provides a basis for updates to the City’s Unified Development Ordinance. This ordinance is the major driver of how new development will look and function. Under IC 36-7-4-601, no ordinance may be adopted until a comprehensive plan has been approved. Updates to the unified development ordinance is how communities in Indiana can adapt and change over time regarding their built environment and how it matches the communities needs and wants.
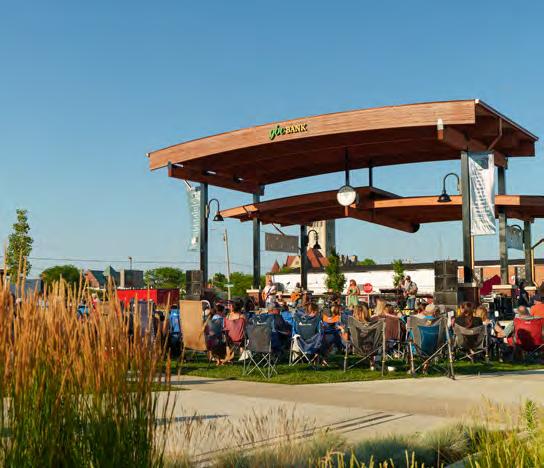
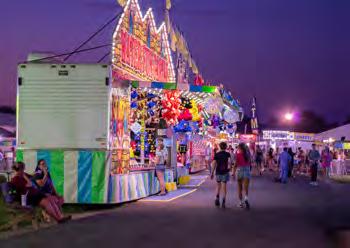
Two pop-up events were held early in the planning process to capture what the community saw as the City’s strengths and weaknesses. The first pop-up was held at the Hancock County Fairgrounds on July 19, 2023. The second was held on August 26, 2023, at Depot Street Park before the start of a concert. These exercises were also repeated with the Steering Committee and nine focus groups. These findings should provide context for City officials, staff, and community partners for future planning efforts.
Strengths are existing aspects that residents think enhance the City.
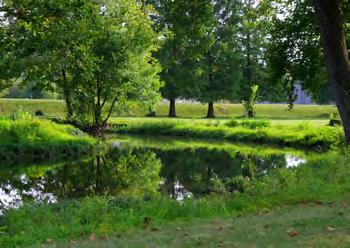
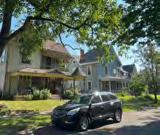
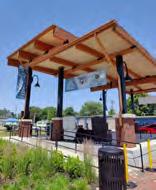
The parks and trail system are highly enjoyed, especially amenities like the Splash Pad at Riley Park.
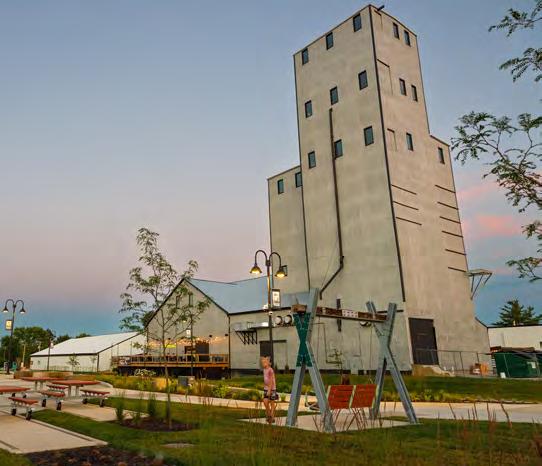
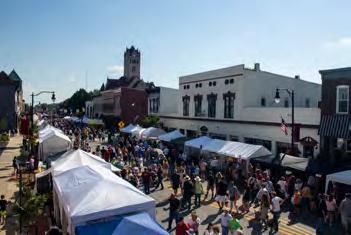
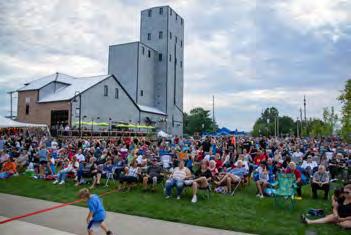
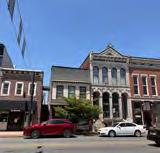
Vibrant ambiance and entertainment at Depot Street, including shops, restaurants, and concerts.
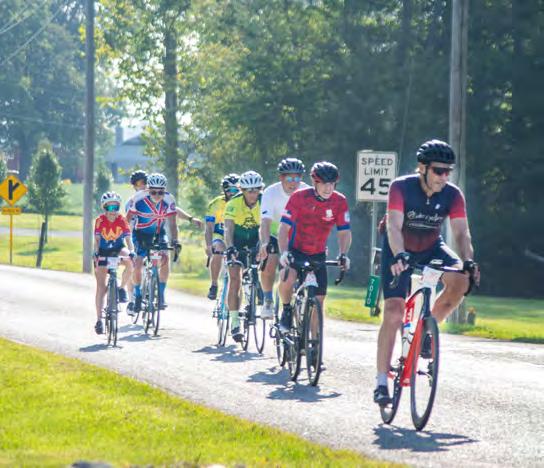
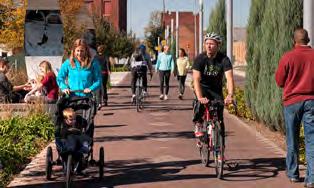
Pennsy Trail is popular for walking and cycling among residents of all age groups.
Downtown and State Road offer diverse food options and specialty shops.
Residents appreciate the aesthetics and peacefulness of public parks and advocate for more additions and improvements.
Weaknesses are existing issues that residents think detract from the City.
Zoning laws are restrictive, need to be revised to accommodate more housing for people at all income levels.
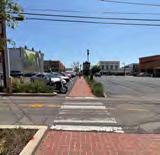
Pedestrian and bicyclist safety concerns along Main Street and State Street. Restroom facilities missing along the Pennsy Trail.
Lack of childcare services.
Need to address homelessness and lack of pathways to secure housing.
Lack of late-night dining options and multicultural cuisine.
High regard for Police and Fire Departments and school district. Some areas remain inaccessible by wheelchair.
Very collaborative network of nonprofits and City’s excitement to work with community organizations.
Proximity to Indianapolis means there are many amenities that are nearby if they are not in Greenfield.
Insufficient gas stations.
Traffic safety concerns at various intersections and missing crosswalks. Gaps in the sidewalk and trail network. Connectivity north of interstate-70. High-quality schools and growing educational opportunities such as Amplify Hancock. Flooding. Homes in floodplain.
Lower utility bills than comparative cities. Lack of streetlights in certain areas.
Greenfield has:
• Momentum: Reinvestment in Downtown/Main Street, parks, transportation, regional collaboration, and Depot Street Park & Amphitheater.
• Foresight: We have seen what other communities around Indianapolis have experienced and the results, and we know the regional and national trends affecting our local area, such as trailoriented development, and a desire for more housing choices, community events, and gathering spaces.
With this Comprehensive Plan, Greenfield has:
• A Bold Vision for the Future
• A Roadmap to Quality and Managed Development
These are the big ideas to consider in future planning and development decisions:

Missing Middle Housing: A spectrum of housing types and sizes with built-in homeownership options.

Greenfield’s Next Economic Boom: The Bio-tech and Ag-tech Industries.
Zoning Changes: Getting Ahead of Regional Development Trends
Sustainable Infrastructure and Investments: Ensuring upfront investments in infrastructure for new development can pay it back long-term via property tax revenue.
Walkable and Connected Communities: Encouraging more mixing of land uses and creating places where walking is safe, convenient, and interesting.

Workforce Development: Up-skilling, vocational, and educational programs.
Complete Streets Network: A safe and complete street network to eliminate traffic-related deaths.
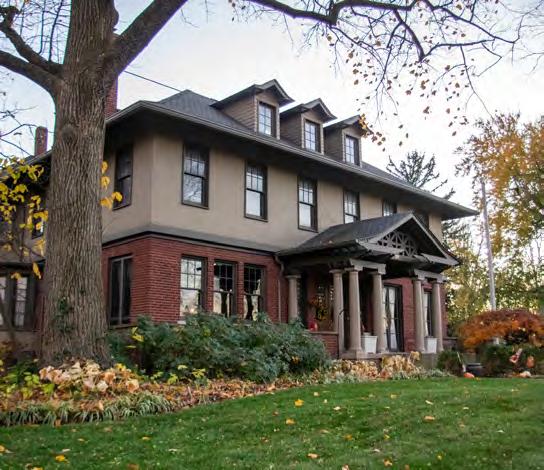
Heritage-Based Architecture: Respecting the past while building for the future.
Placemaking: High-quality, accessible, and unique neighborhood and gathering spaces.
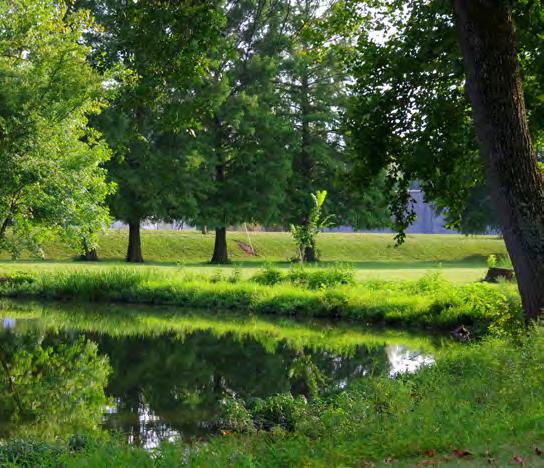
Conservation: Protecting nature for public health, recreation, and education.
Empowering the Creative Economy: Bold policy and regional collaboration to empower individual creativity, drive entrepreneurial ecosystems, build community identities, attract and retain talent and inspire innovation.
Community Engagement: Transparency, thriving civic organizations, and continuous opportunities to get involved.
Several common themes surfaced during community engagement, such as centering the importance of balancing growth and development while maintaining Greenfield’s small-town character and quality of life. Another theme was a push to address the City’s barriers and weaknesses while capitalizing on its strengths and opportunities. This work is essential for Greenfield’s continued vibrancy, to ensure a high quality of life for residents, and to maintain a healthy economy and environment.
Positive trends, competitive advantages, or potential improvements that can be made to the City in the future
Revitalization and Market Trends: Opportunities exist to enhance Downtown with growing interest in urban living, especially from younger age groups. Proactively prepare for housing markets trending toward more walkable communities.
Community Engagement: There’s potential to improve engagement through mobile resources, social media, and better communication of events and services.
Economic Development: Encouraging strategic growth, supporting entrepreneurship, attracting new industries, working with schools to offer internships at local businesses.
Transportation: Establishing shuttle services, developing connections to airports and hotels, and expanding the City’s trail network to enhance its convenience and connection to community destinations.
Negative trends, externalities, or risks that may stand in the way of implementing the Plan in the future
Limited Resources: Challenges include funding shortages, staffing issues, and the capacity of community organizations due to falling numbers of volunteers and increased service needs.
Arts and Entertainment: Developing nightlife, expanding event spaces and amenities, and creating more year-round recreational activities and gathering spaces for youth and teenagers.
Prevailing Status Quo Mindset: General resistance to any change presents a barrier to inclusivity and the implementation of certain initiatives, public projects, developments, etc.
Housing Availability and Affordability:
Demand for more affordable housing, especially for young families, and more housing options to retain and attract talent.
of Connectivity: Roads like US 40, I-70, and SR 9 remain difficult or risky to cross as a pedestrian or bicyclist. New developments with limited connection to the wider street network can reduce mobility by making it more challenging or inconvenient to walk, bike, and drive around the community.
Infrastructure Maintenance and Expansion: Development is occurring quickly around Greenfield, which may put a strain on infrastructure and services, limiting expansion which in turn limits opportunities to pursue.
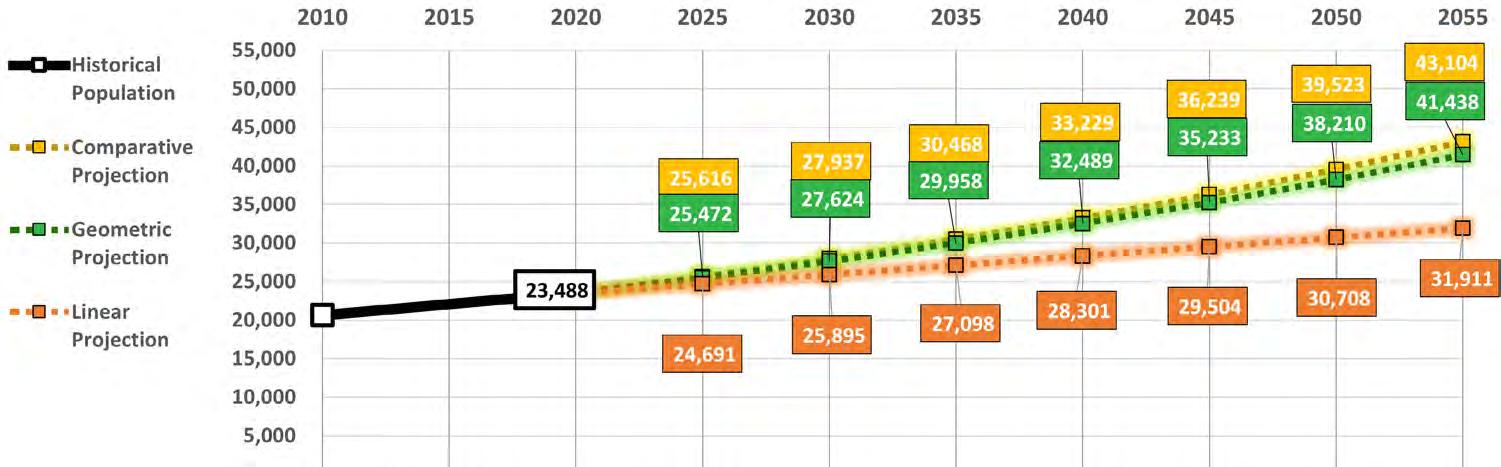
Population projections provide a guide for the City to plan utilities, services, and infrastructure investments. In 2023, Hancock County was the fastest growing county in Indiana, and in 2024, it was the second fastest growing county, according to the Hancock Economic Development Council. Large-scale public and private investments, especially in the Mt. Comfort Corridor and quality-of-life aspects (parks, trails, schools, greater variety of businesses and restaurants). As the county seat and largest city in the county, Greenfield can expect to continue attracting people and development with its highquality schools and growing parks and recreation system, as well as reinvestments into downtown.
Three methods were used to project the population to the year 2050, creating three different scenarios for the City to consider. The rates of growth used for each projection are based on previous 20-year growth rates since 1980 sourced from the US Census Bureau’s decennial censuses. The geometric projection is the most likely to occur and preferred scenario on which to base public investments and planning. However, since projections are, naturally, predictions of the future, the City should assess and recalculate population projections every five years in conjunction with an update of the Plan, or as necessary.
This scenario uses a linear projection, meaning the rate of population increase stays the same year-over-year. Linear projections are mainly used for stagnant and/or nearly fully developed communities, where the rate of population growth is the same year-over-year. In other words, it is assumed that the number of people added to the population each year will be 1,203 people.
This scenario uses a geometric projection, meaning the rate of population growth is a percentage of the population at present This method is similar to compound interest calculations and is used for young and/or quickly developing communities. Greenfield is not a new city, but it is growing at a rapid pace like Hancock County. Therefore, this is the recommended and most likely scenario to occur based on current trends.
This scenario is calculated in the same way as the geometric projection. However, instead of using previous population counts for Greenfield only, the growth rate is based on the average 20-year growth rate of comparative or similar communities
The communities chosen are county seats (like Greenfield) for the counties that wrap around Indianapolis/Marion County, often called called the suburban counties. This includes the following communities:
• Lebanon (Boone County),
• Noblesville (Hamilton County),
• Greenfield (Hancock County),
• Danville (Hendricks County),
• Franklin (Johnson County),
• Martinsville (Morgan County), and
• Shelbyville (Shelby County).
This comparative projection is meant to provide insight into how similar cities in the Indianapolis Metropolitan Area’s ‘suburban’ counties are growing, which is faster than the most likely scenario though not by much.
In addition to population projections, housing and land needs to acommodate the projected population were calculated. These estimates are based on the geometric projection, or most likely scenario. It is estimated Greenfield will need an additional 7,778 housing units by 2055. If the status quo regarding the average household size and urbanized area density, this housing will require 14,818 more acres, which includes both homes and businesses that serve those homes.
It is important to note that the projected housing and land needs are subject to change. Shifts in socioeconomic trends (e.g. average houshold sizes) and development trends (e.g. urbanized area density) can greatly impact these projections.
Cities have limited capability in regulating how many people live in one housing unit, which impacts how many units are needed. However, cities can have a much greater impact on how
much land is needed for each unit by revising zoning, subdivision, and other development regulations. This is where placetypes (Chapter 3) play an important role in the future of development in Greenfield. Placetypes are a set of recommendations about where and how new developments should look, feel, and function throughout the community. They also establish a balance between the needs of Greenfield’s growing community with the desire to preserve open spaces and rural landscapes on the eastside of the City.
*Assumes no change in average household size (2.40) and urbanized area density (0.86 units/acre) from the year 2020. In this case, the ‘urbanized area density’ measures the number of housing units divided by the area of the entire City, including the shops, services, and job centers that support those homes. By including the entire City, it paints a more comprehensive picture of the amount of land that may be developed for both residential and non-residential purposes. Estimates assume no change in development patterns. **2020 total units from ACS 5-Year Estimates.
The purpose of this chapter is to lay out the goals which inform policy and strategies for the plan. During the process goals and objectives were identified that support the vision of the future. These in turn guided the development of the placetypes map and the recommendations for each placetype. This chapter is laid out by defining the goals, identifying the related objectives, and listing the recommendations and action steps for each recommendation. The fourth chapter, Action, prioritizes the goals and related objectives
Naturally, they are comprehensive in scope and accomplished over the lifetime of the Plan. Goals break down the Vision into broad, thematic focus areas that express the community’s values when it comes to future planning and development. The Plan’s six goals seek to shape local decision-making and planning practices to promote the responsible use of resources and ensure quality, desirable developments.
A general policy direction was defined for each goal, with underlying objectives. These objectives guide how the City can achieve a goal in ways that have broad support from community members, who reviewed and provided feedback for each one through workshops, the project website, and other public events.


Objectives guide how the City can achieve the Plan’s six goals in ways that have broad support from the community. A key difference between goals and objectives is while objectives can be accomplished throughout the 30year planning process, goals can only be accomplished at the end of the planning process (the year 2055). Hence, objectives are more actionable than goals and can be implemented in somewhat shorter timeframes. To help the City identify priorities, the objectives are categorized in an implementation matrix (Chapter 4). This matrix assigns a level of difficulty and the estimated time it will take to complete each objective. It also identifies partners which can help implement the objective (e.g. City departments, public agencies, private/nonprofit organizations, etc.).
Recommended actions are the most specific and actionable (i.e. “boots on the ground”) elements of the Plan. They are also the most subject to change because the best actions to take can and likely will evolve as the community develops. To ensure the Plan remains flexible over its 30-year planning period, the recommended actions are written as recommendations rather than mandates. In other words, they describe possible avenues for action, but if conditions change in the community, the City should consider alternatives that would better accomplish the objective.
Several focus areas were identified during the planning process. These areas present the greatest opportunities for the City to pursue innovative development that provides upward mobility and a high quality of life for Greenfield residents. Local businesses will also benefit from the intentional development of these areas by bringing additional customers and creating spaces to expand, downsize, and/or right-size. Key focus areas include:
1. West side of SR 9 to CR 200W and from I-70 north to CR 400N:
2. South side of I-70 from Fields Boulevard to Sugar Creek:
3. SR 9 corridor from I-70 to McKenzie Road for infill development and redevelopment of commercial properties:
4. Pennsy Trail from Pennsylvania Street to Meek Street:
5. Area from Franklin Street to the east, CR 200W to the west, South Street to the north, and CR 300S to the south:
Chapter 3, Placetypes, should inform the development of these areas. This includes the Future Development Map, placetypes, and design concepts created as part of the comprehensive planning process should inform the development of these areas.
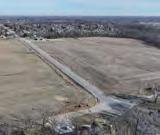
Strategic annexation plays a critical role in Greenfield’s long-term economic development by expanding the city’s footprint to accommodate new industries, employment centers, technology hubs, and agricultural innovation. The city can focus on three primary annexation areas, each designated for a specific industry to maximize job creation, tax revenue, and infrastructure development. In northwest and southwest Greenfield, the emphasis should be on advanced manufacturing, and life sciences, capitalizing on proximity to major transportation routes and supply chain networks. This expansion can enable Greenfield to attract large-scale employers, improve infrastructure, and boost local commerce.
In western Greenfield, annexation efforts can support the development of data centers, artificial intelligence (AI) facilities, and cybersecurity companies. With fiber-optic infrastructure, redundant power grids, and access to high-speed broadband, this area can serve as a technology hub for high-wage jobs and digital innovation. The city can also offer tax incentives and sustainability credits to attract companies utilizing renewable energy sources for data storage and cloud computing.
Southern Greenfield can become a leading center for bio-agriculture sciences and precision farming, leveraging partnerships with Purdue University and AgriTech companies to foster research and development in sustainable farming, genetic engineering, and controlled-environment agriculture. With access to rail lines, research institutions, and support, this zone can become an innovation hub, strengthening Greenfield’s reputation as a leader in modern agriculture and biotechnology. By strategically aligning these annexation efforts with key industries, Greenfield can position itself for sustained economic growth and diversification.
Ensuring long-term food security will require thoughtful use of land and a commitment to agricultural resilience. South Greenfield can contribute to this goal by supporting a range of farming and food production approaches—from established practices to emerging innovations. With room for both traditional agriculture and research-based development, this area is well positioned to respond to changing needs over time. Access to rail lines, research institutions, and regional infrastructure adds to its potential. By aligning future annexation efforts with these priorities, Greenfield can strengthen its role in securing a stable, regionally rooted food system.
1. West side of SR 9 to CR 200W and from I-70 north to CR 400N
2. South side of I-70 from Fields Boulevard to Sugar Creek
3. SR 9 corridor from I-70 to McKenzie Road for infill development and redevelopment of commercial properties
4. Pennsy Trail from Pennsylvania Street to Meek Street
5. Area from Franklin Street to the east, CR 200W to the west, South Street to the north, and CR 300S to the south


Guide Greenfield’s future growth in a way that is deliberate, thoughtful, and sustainable—ensuring development aligns with the community’s vision, capacity, and long-term resilience. Direct new investment to areas with existing infrastructure and planned expansion, while preserving the character of established neighborhoods, protecting natural assets, and supporting efficient service delivery. Balance economic opportunity with environmental stewardship and neighborhood vitality through coordinated planning, intentional decision-making, and strategic infrastructure investments. Embrace growth that reinforces a connected, inviting, and fiscally responsible future for all residents.
Objective 1: Identify key focus areas to target investment and ensure growth to diversify the City’s tax base and bring new employment opportunities.
Recommended Actions
• Plan for and ensure the necessary infrastructure for key focus areas is phased, and in place to support development. To accomplish this, align capital improvement planning (CIP) with the key focus areas.
• Invest in utilities, roads, and drainage systems in advance or alongside development – not after.
• Consider zoning and economic development incentives for priority areas, such as tax increment financing (TIF), tax abatement, density bonuses, waivers for certain development regulations, and more.
• Ensure transportation and nontransportation infrastructure improvements are made in these key focus areas to support economic development initiatives.
• Work with Hancock County Economic Development Council to develop a campaign to market key focus areas.
• Continue to prepare and advertise shovel-ready sites with sufficient infrastructure to support new businesses.
• Work within a public-private partnership to create a business incubator and co-working space to make Greenfield an innovation/entrepreneurial hub.
• Work with agri-technology, bioscienc, organic food, and natural farming industries as targeted businesses for industrial areas.
• Proactively rezone key focus areas to facilitate their development.
• Encourage renewable energy in new developments such as rooftop solar, solar above parking lots, and community solar installations.
• A primary focus on a subarea plan for the southern industrial area between Franklin Street, CR 300S, CR 200W, and South Street to plan the character of growth, its intensity, and the aesthetics of new development in the area and how it abuts residential areas.
Objective 2: Ensure safe, compact, well-connected, and orderly development patterns that are pedestrian- and bicycle-oriented.
Recommended Actions
• Use planning tools such as the 2055 Planning Area, Future Development Map, phased infrastructure investments, and interdepartmental coordination to guide development in a strategic and fiscally responsible manner.
• Promote future development that is coordinated, logical, and aligned with the city’s vision by directing growth to areas with adequate infrastructure, public services, and connectivity.
• Promote compact, contiguous development patterns that preserve natural features and open space, minimize urban sprawl, and support efficient delivery of municipal services.
• Require service extension agreements that support compact, contiguous growth.
• Incentivize or require both street and pedestrian/ bicyclist connectivity within subdivisions and master planned developments to maintain and enhance connectivity throughout the City.
• Complete a sidewalk conditions survey to identify missing paths and assess low-hanging-fruit connections, such as partnering with businesses to create safe and visible bike/pedestrian routes through parking lots.
• Require sidewalks, and where present, trail connections from new and infill developments to nearby amenities including schools, parks, library, businesses, commercial nodes, and more.
• Identify ‘desire paths’ across the City, where sidewalk/trail constructions and/or midblock crossings should be prioritized.
Objective 3: Preserve natural and sensitive environmental features through thoughtful design.
• Using GIS, create and regularly update a comprehensive database of natural resources and environmental systems for use in planning and decisionmaking.
• Encourage development with creative site design layouts that protect natural and sensitive environmental features and incorporate them into the design.
• `The use of cluster or conservation subdivisions are one technique that could be used to protect these features and allow smaller lot sizes and greater density, while protecting and preserving natural features.
• Work with Hancock County and other jurisdictions toward a common goal to protect natural and sensitive features by considering programs that help preserve farmland and natural features, such as transfer-of-development rights, conservation easements, and land banking.
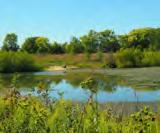
• Prioritize establishing parks and recreational amenities in areas with sensitive environmental features like the wetland reserve at Beckenholdt Park.
• Leverage state and federal funding for floodplain buyouts, and consider establishing a Conservancy District (IC 14-33). This tool forms a special taxing district to solve specific local issues related to water resources management, including flood prevention and control. See more information here: https://www. in.gov/dnr/water/communityassistance-and-information/.
Objective 4: Align development and UDO (Unified Development Ordinance) regulations with the future vision of the community.
Recommended Actions
• Analyze the zoning districts in the UDO as compared with the comprehensive plan placetypes to ensure the character of development is implemented through the regulatory process.
• Update the UDO to allow for a mixture of heritage-based, formbased, and performance-based standards that allow thoughtful, creative, yet character-driven design.
• Consider expanding the Recreational Trail Overlay District to other trails in the City
• Complete a comprehensive study on parking usage by land use and time-of-day to determine data-based standards for parking minimums, maximums, and shared parking standards.
Objective 5: Develop a future annexation strategy.
Recommended Actions
• Identify priority areas that are outside the city’s existing jurisdictional limits
• Expand city boundaries to create designated business parks and industrial zones with ready-to-build sites and highspeed infrastructure access, with the assistance of appropriate professionals (i.e. land agents).
• Prioritize target areas based on future assessed value and potential growth of assessed value.
• Develop an infrastructure plan to serve potential annexation areas.
• Ensure annexation decisions are consistent with infrastructure capacity, placetypes, and service delivery policies.
• Actively engage property owners to participate in future annexation into the City.
• Work with department heads to understand the impact of annexation on their departments. Establish regular coordination and communication between Planning, Engineering, utilities, school districts, emergency services, and elected officials.
• For areas to be annexed, examine different scenarios that account for a range of development densities and service-intensities, using the placetypes map as a basis.
Objective 6: Create fiscally responsible budgets for necessary investments that support population and business growth.
Recommended Actions
• Actively pursue developers and businesses that align with the goals and objectives of the city.
• Adopt a multi-year budgeting plan in line with an update to the City’s Capital Improvement Plan that outlines when and how projects will be funded and completed.
• Estimate the additional staff and resources required for the projected population, then determine a timeline and identify funding for the needed capacity.
• Create budget scenarios based on high/low costs and high/low returns of future development, infrastructure, and public service investments. Include both capital and operational costs.
• Develop City revenue and expenditure projections for tax increment financing districts and other incentive programs.
• Require fiscal impact studies for major developments to evaluate long-term municipal costs and benefits to the City.
• Identify needs for developer contribution towards infrastructure (i.e. roads, sidewalks, trails, utilities, etc) in alignment with growth goals beyond improvements internal to the development.
Policy Direction
Enhance the ability for the city to retain, expand, and attract businesses. This should include opportunities for residents to achieve stability and upward mobility, enhance their financial wellbeing, and find prosperity. This can be achieved through a wide range of employment options, entrepreneurship, education and training, and access to resources by leveraging Greenfield’s unique qualities and location.
Objective 1: Retain, expand, and support existing businesses that contribute to the local economy.
Recommended Actions
• Offer tax abatements, grants, and educational opportunities to support existing business retention and expansion.
Objective 2: Support education and workforce development.
Recommended Actions
• Strengthen collaborations between local schools, colleges, universities, and major employers to create job-specific training programs.
• Establish on the job training initiatives with local businesses through apprenticeships and internship programs.
• Explore emerging, high-tech, and innovative industries such as geographic information systems (GIS), telecommunications, and other informations industries
• Develop a career hub to connect job seekers with employment opportunities in high demand fields.
• Promote Greenfield as a desirable location for young professionals and skilled workers through housing incentives and quality of life improvements.
• Encourage STEAM (Science, Technology, Engineering, Agriculture, and Math) education and bio-agriculture research initiatives.
• Work with Amplify Hancock and the Greenfield-Central School Corporation to explore these opportunities, as well as complementary industries like information. Information industries can include geographic information systems (GIS), telecommunications, and more.
Objective 3: Attract new businesses that will invest in the community.
Recommended Actions
• Develop a comprehensive campaign to promote Greenfield’s economic assets to potential investors and businesses in advanced manufacturing, healthcare, technology, and bio-agriculture.
• Create an alignment between economic development incentives and the Planning Department so that each informs the other.
• Create a one-stop shop for business information and development approvals.
• Expand City boundaries to create designated business parks and industrial zones with shovelready sites and high-speed internet access.
Objective 4: Build a strong economy that can withstand economic shifts.
Recommended Actions
• Diversify the economic base with targeted industry growth by encouraging the development of a variety of industries to avoid over-reliance on any single sector.
• Invest in workforce development and skills training (i.e. apprenticeships, trade programs, and small business training programs).
• Support infrastructure growth and digital connectivity to boost business confidence, support remote work and encourage innovation.
• Encourage co-working spaces and small business incubators to support small business growth and entrepreneurship.
• Develop a strategic economic resilience plan to identify vulnerabilities in the local economy. Create contingency plans for major disruptions (i.e. supply chain issues, pandemics, and utility disruptions)
Objective 5: Attract and retain a range of talents to meet local economic needs.
Recommended Actions
• Develop affordable and diverse housing options by working with developers to offer mixed income housing and starter homes for young professionals, quality rental options, and live work units.
• Promote quality of life enhancements in parks, trails, downtown, cultural events, festivals, live music, and expansion of childcare.
Objective 6: Encourage and foster a culture of entrepreneurship.
Recommended Actions
• Provide startup grants, business incubators, maker spaces, and mentorship programs to foster innovation and entrepreneurship.
• Integrate entrepreneurship into education and community programming through youth entrepreneurship clubs or business plan competitions, community workshops on e-commerce or home-based business, and spotlight success stories and networking events.
• Create incentive programs for startups.
• Create a business accelerator program that partners with regional chambers, investors, and universities. Provide opportunities focused on business development, seed funding and training in marketing, finance, and scaling.
Policy Direction
Position downtown as the cultural, economic, and civic heart of Greenfield by fostering a vibrant, walkable, and active environment that honors its heritage while embracing innovation. Encourage a mix of residential, retail, office, entertainment, the arts, and public spaces that support round-the-clock activity. Promote adaptive reuse of historic structures, strategic infill development, and public realm enhancements to create a dynamic sense of place. Leverage regional connectivity, multi-modal access, and placemaking investments to attract residents, entrepreneurs, and visitors, ensuring downtown remains a destination and a driver of long-term prosperity.
Downtown should contain:
• A diversity of living options.
• Consistent pedestrian and bike traffic.
• A wide range of activities available all day.
• The preservation of local history and small-town charm through architectural enhancement and a celebration of the arts.
Objective 1: Support development and redevelopment that builds on the heritage and character of downtown.
Recommended Actions
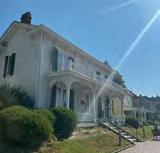
• Promote historic preservation and adaptive reuse of historic buildings that can be saved.
• Conduct a detailed inventory of historic buildings that still remain in the downtown
• Create design guidelines that reflect historic character to encourage the use of traditional materials, preserve building
scale, façade details and historic signage and require context sensitive architecture for new infill projects.
• Provide incentives such as grants, tax credits, design support, incentive zoning, streamlined approval processes for adaptive reuse of heritage properties.
• Establish or update historic design guidelines within the Downtown to protect architectural character.
• Develop form-base regulations for Downtown that reinforce traditional streetscapes and block patterns.
• Work with the County to re-open South Street where Courthouse Plaza is located to re-establish connectivity within Downtown.
• In the UDO, review and refine height, setbacks, and façade articulation standards for compatibility.
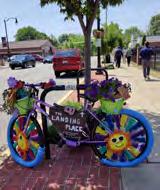
• Celebrate local culture through public art, murals, and storytelling elements.
• Partner with location organizations to implement the Greenfield Arts Roadmap: Cultivating a Vibrant Creative Landscape 2025 - 2035.

• Activate alleys, courtyards, and underutilized spaces as pedestrian connectors and social nodes.
• Redesign the Pennsy Trail to be an active boulevard creating a walkable, pedestrian-scale environment designed for active transportation, recreation, and fostering redevelopment opportunities of residential, commercial and institutional land uses.
• Incorporate digital tools (e.g. apps, QR codes, augmentedreality, website) to engage residents and visitors in local history.
• Provide technical assistance to property owners interested in preserving or restoring their buildings.
• Align zoning, incentives, and infrastructure investments to support heritage-sensitive development.
• Prioritize corner lots and highvisibility nodes for vertical mixeduse that reinforces the street edge and pedestrian activity.
• Host events that celebrate downtown Greenfield’s history.
Objective 2: Encourage the development of mixed-use buildings and housing options downtown.
Recommended Actions
• Identify key sites for infill development and ensure infill design is sensitive to existing development character.
• Create a development toolkit or pattern book that supplements the comprehensive plan placetypes and the UDO zoning districts that showcases compatible infill types (live-work units, small scale mixed use, apartments, etc.)
• Work with local banks to help prioritize gap financing or site assembly for strategic infill.
• Encourage upper story housing, especially in historic commercial blocks.
• Support developers in creating housing that reflects downtown’s scale and identity.
• Prioritize mixed-income housing options to sustain vibrancy and opportunities for all.
• Update the UDO to support mixed-use flexibility by ensuring the zoning regulations allow vertical and horizontal mixed use in the downtown, adjust parking requirements in downtown to support walkability and feasibility, and introduce height and density bonuses for projects that include affordable or upper story housing in historic buildings.
• Leverage state/federal housing tax credits to support projects that include both housing and commercial components.
• Identify appropriate sites for missing middle housing types (e.g. townhomes, stacked flats, courtyard apartments, duplexes, etc.) and ensure that the UDO allows these by-right in the zoning district.
• Partner with nonprofits or developers to build or rehab units for seniors, young professionals, and workforce households.
• Develop design guidelines or a pattern book showcasing successful local or regional vertical integration of mixed-use precedents.
• Create a development toolkit with model layouts, financing options, and regulatory guidance for downtown property owners.
• Empower Greenfield Main Street, or a Downtown Association, to work with local banks and the Indiana Office of Community and Rural Affairs (OCRA) to establish a local revolving loan or façade improvement program targeted at small-scale mixeduse property owners to maintain building facades and make improvements to the outside of building.
• Offer incentives for mixed use and infill projects that can include tax increment financing, tax abatement, assistance with infrastructure or development grants.
Objective 3: Improve infrastructure within the downtown area to support increased density.
Recommended Actions
• Invest in utility upgrades, broadband access, and streetscape enhancements that support higher intensity land use.
• Evaluate fire and life safety needs for upper-story residential conversions in historic buildings.
• Create a capital improvement plan that prioritizes infrastructure support in areas targeted for mixed-use growth.
• Work with INDOT to redesign the streetscape of SR9 and US40 to incorporate pedestrian enhancements within the Downtown to slow traffic and make it safer for bicyclists and pedestrians when they upgrade the road.
Objective 4: Expand and diversify employment options downtown.
Recommended Actions
• Focus on attracting new employment sectors downtown.
• This can include the development of an incentive package targeting key growth industries suited to downtown settings such as creative services (marketing, design, digital media), health and wellness, professional and technical services, startups and smallscale manufacturing (e.g. artisan production).
• Leverage proximity to the Indianapolis Metropolitan area to attract satellite offices of regional firms.
• Encourage the development of co-working spaces, business incubators, and shared offices in underutilitiezed downtown buildings.
• Using TIF funds, provide seed funding or grants to support public-private partnerships that offer workspace for small businesses and freelancers.
• Promote building retrofits that accommodate modern office needs (e.g. fiber access, shared amenities, natural light, etc.)
• Work with local nonprofits to launch a downtown business accelerator program offering technical assistance, business plan support, and micro-grants.
• Simplify permitting and licensing for small and home-based businesses seeking a downtown presence.
• Promote a “live-work-play” environment downtown through mixed-use zoning and placemaking investments.
• Expand downtown events, dining options, and public spaces to make downtown attractive for employees and employers alike.
Objective 5: Advance a pedestrian- and bicyclefriendly downtown.
Recommended Actions
• Invest in flexible downtown green spaces that accommodate events and everyday leisure (e.g., lawn games, picnic areas, shaded seating).
• Strengthen pedestrian and bike access to parks, venues, and gathering places for all ability levels.
• Add benches, hydration stations, and safe crossings to support movement between activities.
• Ensure new development connects sidewalks and to nearby trail systems.
• Encourage new development to incorporate public spaces into their design that can be used for both the public and private residents.
Objective 6: Continue to support a wide range of activities and amenities for all ages.
Recommended Actions
• Partner with schools, nonprofits, and businesses to co-host intergenerational activities such as art walks, book fairs, and STEAM showcases.
• Create space for passive recreation (e.g., public chess tables, outdoor reading nooks, sensory gardens) alongside larger events.
• Introduce playable features for children (interactive art, musical play structures) and accessible features for seniors and people with disabilities.
• Create dedicated safe spaces for teens, including but not limited to teen lounges, e-sports areas, and youth-led pop-up shops.
• Partner with schools and youth organizations to design events by and for young people.
• Offer youth job training or volunteer opportunities tied to downtown programs or events.
• Install seating, wayfinding, lighting, and shade structures with senior users in mind.
• Encourage redevelopment or adaptive reuse of buildings as multi-purpose community venues (e.g., art studios, maker spaces, game cafés).
• Create indoor spaces for cold or rainy weather: drop-in centers, galleries, reading lounges, and performance venues.
Objective 7: Streamline the approval process for downtown mixed-use projects.
Recommended Actions
• Layer some parts of conventional zoning (use matrix and use standards) with a formbased code that prioritizes building form and public realm compatibility. Clearly define allowable building types, massing, and street relationships to reduce the need for variances or custom PUDs.
• Offer an expedited review track (projects that meet pre-defined criteria related to placetype, design guidelines, or housing and retail mix) for mixed-use and residential projects in designated downtown priority areas such as along the Pennsy Trail. Publish a checklist for eligibility and estimated timeline to improve transparency.
• Provide pre-application meetings with planning and development staff to reduce uncertainty and clarify expectations.
• Coordinate site plan review with utilities and infrastructure departments to remove bottlenecks.
• Consolidate zoning, urban design, signage, and infrastructure requirements into a user-friendly development handbook for downtown. Include illustrative examples, streamlined process diagrams and contact points for assistance.
• Consider administrative approval for projects that meet specific form and use requirements.
• Create an ombudsman position to assist applicants through the process, especially first-time or small-scale developers.
• Regularly report on development review timelines, approval rates, and common delay points to improve accountability. Use dashboards or annual reports to evaluate success of the development approval process and adjust procedures as needed.
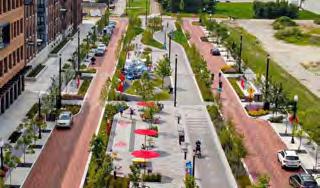
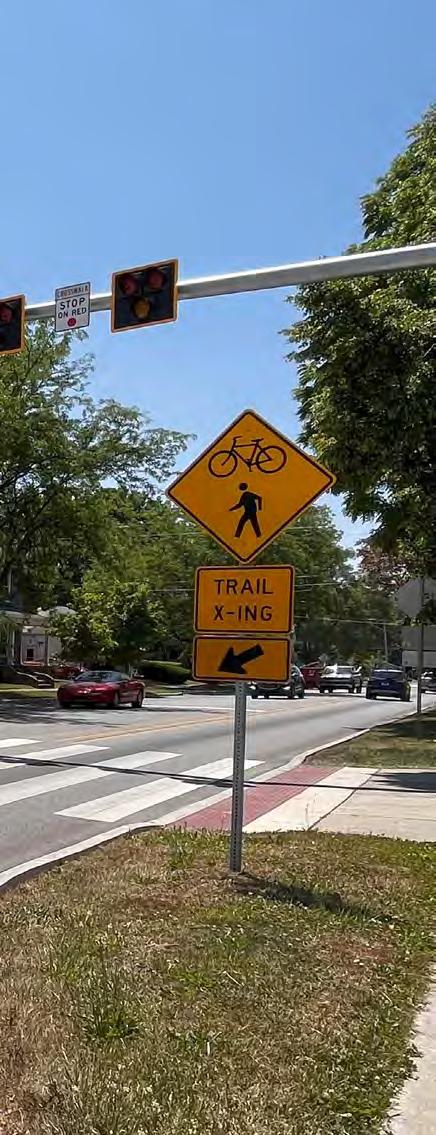
Trail-oriented developments (TrOD) are developments in which buildings face a trail rather than or in addition to a street. They are walkable places, designed at a pedestrian- or human-scale, and usually mixed-use with residential and/or commercial spaces. TrOD is intended to create vibrant places that promote active forms of transportation and recreation which improve public health and well-being. A 2015 report by the Urban Land Institute, a national organization focused on land use and development, found that over half of all people and nearly two-thirds of millennials would like to live in places that do not require frequent use of a car – sometimes this is referred to as “car-lite.” TrODs have also been found to increase revenues, both public and private. For instance, businesses along the Indianapolis Cultural Trail saw a 48% increase in revenue from 2008 to 2015 after the trail was constructed. Learn more about trail-oriented development by reading the Indy MPO’s report here: https://www.indympo.org/planning/project-library/ regional-plans/land-use-development .
TrOD is currently represented in Greenfield’s Unified Development Ordinance (UDO) as the Recreational Trial Overlay (RTO.
Policy Direction
Promote a diverse range of housing options that are affordable to residents across all income levels, life stages, and occupations. Recognize that attainable housing is essential to sustaining workforce stability, economic competitiveness, and generational retention. Encourage the development and preservation of housing types— including duplexes, townhomes, accessory dwelling units, and small-scale multifamily—that meet the needs of teachers, first responders, young professionals, seniors, and service workers. Align land use policy, infrastructure investment, and incentive programs to support housing choice, lower cost burdens, and maintain the city’s familyfriendly character.
Objective 1: Support and increase the supply of a variety of housing and living options.
Recommended Actions
• Encourage the development of ‘missing middle’ housing.
• According to the National League of Cities , missing middle housing refers to housing that provides diverse housing options along the spectrum of affordability, which includes duplexes, triplexes, fourplexes and bungalows. Middle housing is not eligible for tax credits or most other federal, state or local government subsidies. Typical middle housing types include multiunit structures such as townhomes, duplexes, triplexes and fourplexes. Other examples can include cluster homes and cottage courts.
• Permit by-right duplexes, triplexes, fourplexes, townhomes, and cottage courts in targeted or new residential zoning districts.
• Enable accessory dwelling units (ADUs) by-right citywide with flexible design and occupancy standards.
• Structure incentives so smalland medium-scale developers can participate—not just large multifamily builders.
• Establish local funding pools (e.g. a housing TIF district) or tax abatement programs to close financing gaps for workforce housing projects.
• Identify vacant or underutilized parcels in neighborhoods, downtown, and near corridors for compact, diverse housing.
• Allow adaptive reuse of commercial, office, and civic buildings into residential or livework units.
• Support housing designed for aging in place, including singlestory homes, universal design standards, and senior cohousing models.
• Review and streamline codes that raise costs or limit housing choice (e.g., excessive lot widths, outdated parking ratios, setback requirements).
• Create a menu of pre-approved housing designs to speed permitting and reduce costs for small-scale developers, such as the City of South Bend, IN.
Objective 2: Identify and address the barriers and gaps in available housing for varying socioeconomic and age groups.
Recommended Actions
• Map out which income groups and age cohorts (e.g., early career, seniors, multigenerational households) are currently underserved.
• Identify how housing can support residents from early adulthood to retirement—including starter homes, roommate-friendly rentals, aging-in-place units, and downsizing options.
• Use the above recommendations to develop a framework to ensure neighborhoods include a mix of housing products that serve multiple life stages, not just single-family or luxury rentals.
• Convene developers, lenders, housing advocates, and residents to identify policy, financial, and perception-based barriers to housing production and access. Tackle issues like land availability, construction costs, impact fees, and NIMBY resistance with targeted solutions. Use findings to create a “Housing Gap Elimination Action Plan.”
• Promote duplexes, ADUs, and flexible home designs that accommodate grandparents, adult children, or live-in caregivers.
Objective 3: Encourage and enforce, when possible, maintenance of residential properties.
Recommended Actions
• Launch a “Healthy Homes Block Program. This can be done by offering mini-grants, tool libraries, or volunteer crews to help homeowners complete basic maintenance tasks. Recognize successful blocks with signage or neighborhood events.
• Implement a tiered property maintenance framework. Develop a proactive inspection program that categorizes properties based on condition, with education-first outreach for minor issues. Use risk-based enforcement, prioritizing vacant, absentee-owned, or chronically neglected properties. Reserve stronger penalties for noncompliance after repeated notices or safety concerns.
• Partner with local youth and trade schools to create a “fix it forward” program where local high school or trade students assist in basic repairs under supervision. They can earn service hours, workforce experience, and community visibility. Prioritize crossgenerational support for elderly and disabled homeowners.
• Use data to target outreach & investment by mapping code enforcement cases, property
age, tenure, and vacancy to identify “maintenance stress zones.” Combine with indicators to ensure low-income and historically disinvested neighborhoods get proactive assistance—not just enforcement. Develop “Neighborhood Resiliency Profiles” to guide city programs and grant applications.
• Create a flexible code enforcement toolkit empowering code officers with a range of responses: from friendly door hangers and repair resources to formal citations. Use mobile tech tools such as GIS-based surveys to document issues, notify residents, and follow up efficiently. Ensure consistency across neighborhoods while allowing flexibility for unique circumstances.
Objective 4: Prioritize the development of housing in locations with pedestrian and bicycle access to local destinations.
• Use the bike trail network as a housing spine, promoting compact, accessible housing along greenways and shared-use paths. Support Trail-Oriented Development focusing on midscale housing, bike hubs, and neighborhood retail nodes. Example: the Pennsy Trail.
• Create mobility priority housing zones which are designated specific areas within ¼ to ½ mile of schools, parks, job centers, or downtowns as priority housing development zones. This will help to target city investment for housing. Align these priority housing development zones with zoning incentives, infrastructure investment, and streamlined permitting for missing middle housing, mixed-use and workforce housing types.
• Require developers to demonstrate safe walking/biking connections as part of project approvals when located in walkable nodes. Offer expedited review or density bonuses for projects that contribute to or extend pedestrian/bike networks.
• Create a “Complete Streets Housing Bonus” by providing incentives for housing projects that are located along or help implement designated Complete Streets corridors.
• Prioritize projects that include front-facing pedestrian entrances, short setbacks, and bike amenities.
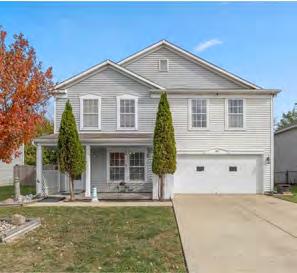
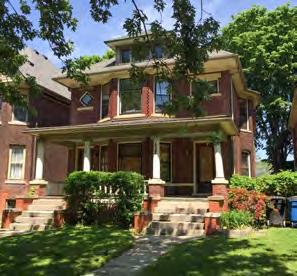
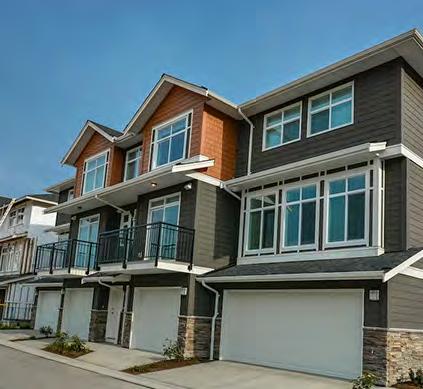
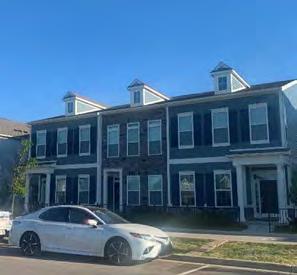
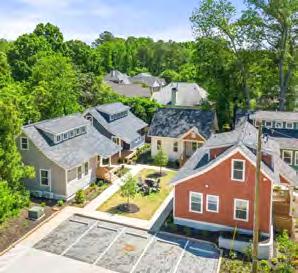
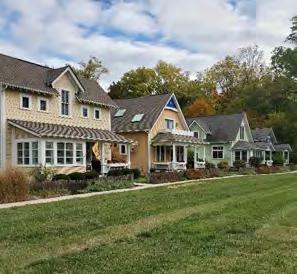
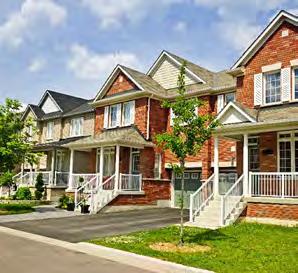
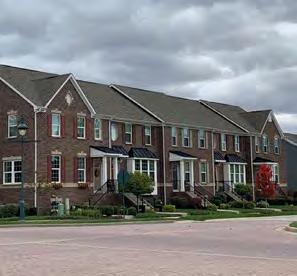
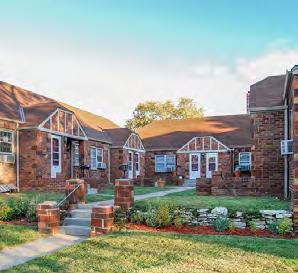
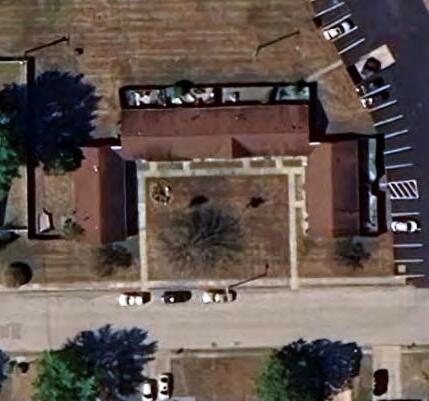
These housing types are to be used as the residential component of Greenfield’s placetypes found in Chapter 3. The photos used in this figure do not necessarily represent the character of each placetype — they only represent a type of housing product.
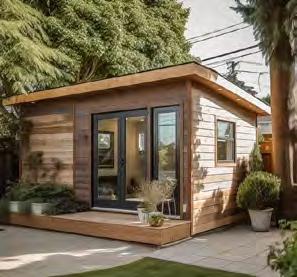
A standalone (i.e. detached) building with one housing unit.
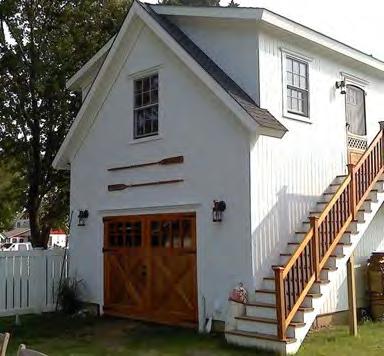
A small housing unit on the same grounds as, attached to, or separate but within the same structure as another type of housing.
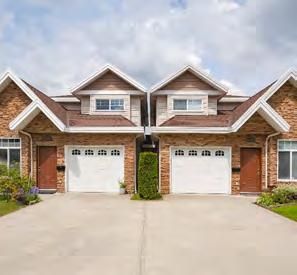
A building with two housing units attached from floorto-ceiling, or a building that consists of two dwelling units arranged one above the other. A stacked setup, also known as stacked flats, typically work better on narrower lots than a side-byside duplex.
A building with three or four housing units that share a floor-to-ceiling wall.
A small grouping of attached or detached, single-family units who face a shared greenspace or common area. They may all be located on one large parcel or individual parcels. Sometimes referred to as pocket neighborhoods.
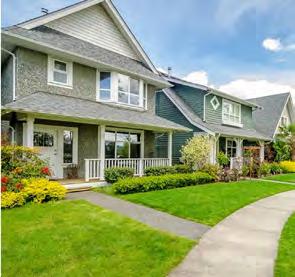
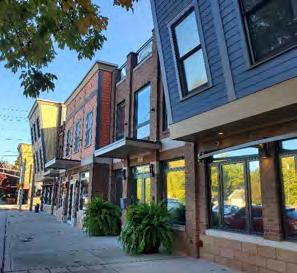
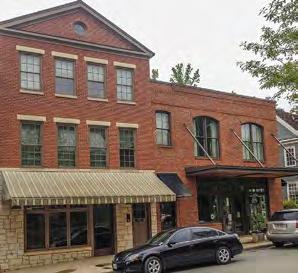
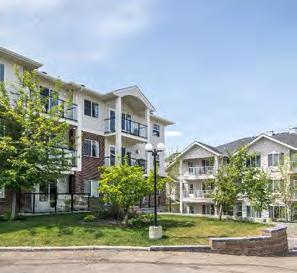
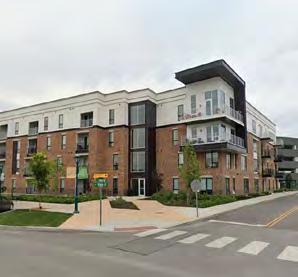
These housing types are to be used as the residential component of Greenfield’s placetypes found in Chapter 3. The photos used in this figure do not necessarily represent the character of each placetype — they only represent a type of housing product.
A grouping of attached single-family residences that share a floor-to-ceiling wall with each other. They are not stacked upon each other.
A small-scale mixed-use development that has at least one residential unit located above or behind an office or shop, allowing people to live and work in the same location.
A shared greenspace which is enclosed on three or four sides by a building that contains 5 to 24 residential units.
A building with 25 or more housing units.
‘Middle’ housing refers to the types of housing products in between apartment buildings and single-family homes, such as duplexes, townhomes, cottage courts, courtyard buildings, and more. Since World War II, most communities across the U.S. and Canada have solely focused (or allowed via zoning) detached, single-family homes or apartments. Hence, today, the presence of newer ‘middle’ housing types is few and far between. Encouraging more ‘middle’ housing promotes greater choice and can improve affordability.
Learn more about the missing middle housing types by going to: MissingMiddleHousing .com
Policy Direction
Deliver and maintain high-quality, resilient infrastructure and public services that meet the current and future needs of all residents and businesses. Ensure that investments in roads, utilities, digital connectivity, public facilities, and green infrastructure are efficient and aligned with community growth. Emphasize proactive planning, sustainability, and coordination across departments and partners to maximize long-term value, improve service delivery, and support economic competitiveness. Infrastructure and services should enhance safety, accessibility, and quality of life—building a strong foundation for inclusive, connected, and thriving neighborhoods
Objective 1: Construct an accessible and safe transportation network for multiple modes of transportation.
Recommended Actions
• Update the City’s Public Improvement and Design Standards and Specifications Manual to include a complete streets policy.
• The policy should include all new and retrofitted streets, as well as streets that are scheduled to be repaved/reconstructed soon, to ensure they serve pedestrians, bicyclists, and motorists.
• Create context-sensitive design guidelines that vary by street type (downtown, neighborhood, arterial, collector, etc.). Include accessibility standards aligned with ADA guidelines and universal design principles.
• Design streets for multimodal function by prioritizing narrow lane widths, street trees, midblock crossings, and protected intersections in urban areas. Use street design to slow traffic and increase visibility for pedestrians and cyclists –especially around schools and parks. Incorporate freight, delivery, and emergency access needs without compromising multi-modal safety.
• Align land use and transportation investments by concentrating new development near existing or planned multi-modal corridors and hubs. Promote mixed-use, pedestrian oriented design in these areas to reduce reliance on cars. Using zoning and incentives to support mobilityrich neighborhoods.
• Develop a prioritized, multi-year capital plan for multi-modal transportation improvements. Package small projects into larger grant ready bundles for federal/state/MPO funding. Coordinate across public works, parks, schools, and regional partners to streamline implementation.
Objective 2: Invest in utilities, and plan for expansion based on the Future Development Map.
Recommended Actions
• Align utility capital planning with the Future Development Map by using the future development map to prioritize infrastructure investment in areas targeted for near- and mid-term growth (e.g., mixed-use nodes, infill corridors, employment centers). Phase capital improvements to support compact, contiguous development, avoiding costly leapfrog or speculative extensions.
• Develop a utility master plan with future forecasting including water, sewer, stormwater, and power, future capacity needs by placetype and intensity, climate resilience and smart infrastructure components. Integrate it into the comprehensive plan update process and capital improvement planning cycle.
• Define clear service tiers (e.g., Tier 1 = urban core, Tier 2 = planned growth, Tier 3 = future reserve) with distinct extension timelines. Use these tiers to guide annexation, zoning, and development approvals
• Use utility availability as a growth management tool. Condition rezonings or project
approvals on utility readiness, ensuring adequate capacity and pressure levels are in place or programmed. Avoid premature development in infrastructurepoor areas.
• Modernize infrastructure through asset management by maintaining an inventory of utility infrastructure age, condition, and risk profile. Prioritize replacement and upgrade of aging or vulnerable lines in areas aligned with the future development map to maximize return on investment. Adopt sensor technologies to monitor system performance and detect failures early.
• Secure and leverage funding for utility investment by seeking federal and state funding for infrastructure extensions in priority growth zones (e.g. USDA, ARPA, SRF, EDA, MPO, OCRA , etc.) Use Tax Increment Financing (TIF) or developer cost participation to fund system expansion where growth is planned but not yet served.
• Use GIS and dashboards to track real-time alignment between development approvals and utility availability. Require developers to contribute data on demand projections and infrastructure needs during site plan submission.
Objective 3: Maintain strong intra- and inter-governmental collaboration.
Recommended Actions
• Develop an intergovernmental collaboration framework by formalizing partnership with school districts, utilities, county government, economic development, and regional planning bodies through a Memorandum of Understanding (MOU). Set a clear expectation for shared data, land use alignment, capital planning and public engagement.
• Coordinate planning processes and schedules by aligning comprehensive planning updates with related efforts like transportation plans, utility master plans, school facility plans, and hazard mitigation plans. Share data and modeling tools across agencies to improve consistency and cost effectiveness.
• Host an “Annual Partner Planning Summit” that convenes city staff, elected officials, school leaders, regional planning organization, economic development, infrastructure agencies, and the county for an annual collaborative planning retreat. Review major initiatives, policy shifts, and budget needs. Identify opportunities for joint funding applications, zoning coordination, and shared public facilities.
• Consider an Office of Communications for the City of Greenfield that would serve as the central hub for strategic communication, public engagement, and brand management, ensuring clear, consistent, and accessible messaging across all departments and to all audiences.
• Develop a city department called “Greenfield Welcome ” where the department serves residents and visitors by planning events and offering engagement opportunities at community events.
Objective 4: Ensure adequate staffing of civil servants and public services.
Recommended Actions
• Conduct a citywide staffing needs assessment analyzing staffing levels across all departments relative to population growth, service demand, and performance benchmarks.
• Include succession planning, retirements, and future programming needs. Use the findings to project staffing needs for 5-, 10-, and 20-year horizons.
• Develop a civil service workforce strategy that creates a multiyear staffing and recruitment plan focused on diversity and representation, retention and advancement, and cross-training and succession planning. Identify critical roles in planning, engineering, inspections, public safety, parks, IT, utilities, and communications that require near-term attention.
• Align staffing with capital and development growth by tying new hires to major capital improvement projects, neighborhood growth areas, population growth, and new service demands (e,g, park expansions, trail maintenance, and increased traffic enforcement, new fire station, etc.)
• Ensure that new development is matched by staffing resources to manage inspections, customer service, and public safety needs.
• Work with local schools, community colleges, and workforce boards to expand talent pipelines to create entry-level pathways into city employment (e.g. internships, apprenticeships, job shadowing). Launch a “Civic Careers Program” to expose students and residents to careers in planning, engineering, IT, and parks.
• Monitor staffing levels and service performance by creating performance dashboards tracking staffing ratios, response times, resident satisfaction, and overtime hours. Use these metrics to justify budget investments and identify gaps. Report progress annually to the City Council.
• Maintain a contingency plan for service disruptions, major weather events, or health emergencies that strain staffing. Create cross-trained “reserve” staff pools for roles like shelter coordination, emergency dispatch, and communications.
and security resources.
• Conduct a comprehensive public safety needs assessment. Evaluate staffing, equipment, training, and facility needs across police, fire, EMS, and emergency management departments. Analyze response times, service gaps, and future growth areas identified in the Future Development Map.
• Ensure that future community safety locations are identified on the future development map as Greenfield continues to develop so that emergency response times are maintained within operational parameters.
• Upgrade public safety technology: radios, real-time crime centers, vehicle GPS, and data analytics. Invest in fire station retrofits, emergency operations centers (EOC), and resilience hubs in high-risk areas. Ensure facilities and vehicles meet standards for accessibility, energy efficiency, and officer well-being.
• Use Crime Prevention Through Environmental Design (CPTED) principles in parks, trails, alleys, and public spaces. Expand LED lighting, clear sightlines, and pedestrian infrastructure in areas with high crime or low visibility. Require safety considerations in all new development projects during site plan review.
Foster a city where public spaces and community programs inspire connection, creativity, and participation across all ages and backgrounds. Support the development of welcoming places—from parks and plazas to libraries and civic centers—that serve as hubs of social life, culture, and innovation. Invest in dynamic programming that reflects the city’s diversity, honors its heritage, and brings people together through shared experiences. Prioritize partnerships, flexibility, and design excellence to ensure public spaces are well-used, well-loved, and evolving.
Objective 1: Foster accessible, active, and engaging community spaces, designed to support mental and physical health that is suitable for an array of events for all ages and abilities.
Recommended Actions
• Develop a community space typology plan. This would include establishing design guidelines for and classifying parks, plazas, and civic spaces by their function, size, amenities, and event capacity. Ensure the city has a mix of large event spaces, neighborhood gathering spots, and informal “everyday” hangouts. They do not have to be owned by the city. Use this framework to prioritize upgrades, programming, and identify where need spaces are needed.
• Prioritize active design to encourage movement by adding walking loops, nature trails, adult fitness stations, and accessible
bike paths to support daily physical activity. Connect parks to neighborhoods and downtown via safe, tree-lined pedestrian and bike infrastructure and incorporate low-impact exercise areas.
• Apply universal design principles to all public spaces. Design all spaces to be accessible by default—not retrofitted—ensuring seamless navigation for all ages and abilities. Include smooth paths, sensory features, adaptive equipment, shade structures, and rest areas. Install wayfinding signage in multiple formats (text, icons, Braille, audio-enabled kiosks).
• Activate spaces through yearround programming. Host a citywide event calendar that includes seasonal events (e.g., concerts, markets, movie nights, wellness classes) for multiple age groups. Partner with local artists, youth groups, and senior
services to co-produce events tailored to their communities. Support small-scale “pop-up” events and informal placemaking activities in pocket parks and plazas. Host events that focus on health equity, stress reduction, and community support such as free fitness classes, mental health first aid workshops, and seasonal nature therapy programs. Partner with Hancock Regional Hospital, Greenfield School Corporation, and other nonprofits to deliver outreach, screenings, and support services in community spaces.
• Co-locate community services and amenities. Cluster restrooms, water stations, bike racks, food kiosks, and free Wi-Fi in parks and gathering areas. Include shared-use spaces for public art, vendor stalls, and mobile programming (e.g., bookmobiles, health vans, play carts). Create permanent or temporary “community
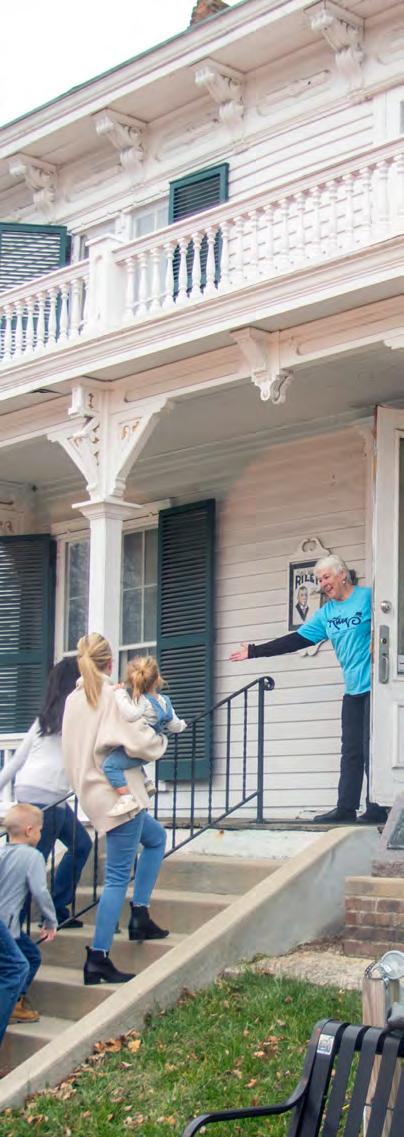
The concept of ‘third places’ have gained momentum in the public in recent decades as people look for places to connect or reconnect with their community, especially places that don’t require money to participate.
In this concept, the ‘first’ place is home, and the ‘second’ place is work. ‘Third’ places are where people frequent outside of their first and second places. This can include parks, places of worship, cafes, libraries, gyms, theaters, and more. These places are typically informal and open to everyone. They are where strangers come together over a shared interest which over time forms a community.
Originally proposed by sociologists Ray Oldenburg and co-author Karen Christensen in their book ‘The Great Good Place,’ they layout seven characteristics of third places:
Open and inviting; Comfortable and informal; Convenient; Unpretentious; There are regulars; Conversation is the main activity; and Laughter is frequent.
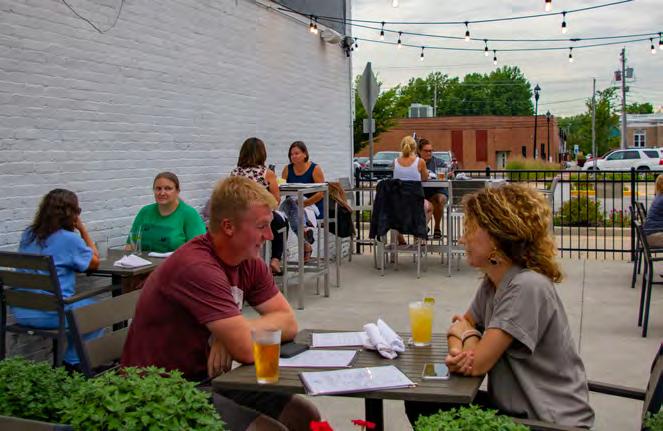
commons” that flexibly support events, recreation, and civic engagement.
• Integrate Nature, Play, and Wellness. Blend green infrastructure with play features and gathering spaces—e.g., bioswale amphitheaters, storybook trails, nature-based sensory play areas. Install multigenerational fitness zones, such as accessible workout stations, tai chi gardens, or walking loops. Encourage events focused on community wellness, such as mental health awareness days, healing arts events, or elder wellness fairs.
• Repurpose Underused or Temporary Spaces. Convert vacant lots, alleys, or overflow parking into seasonal play areas, mini-plazas, or community art hubs. Use shipping containers, pavilions, or shade sails to create flexible infrastructure with minimal permanent impact. Partner with private property owners to allow weekend or after-hours use of open areas for programming.
• Design spaces for holistic well-being by incorporating nature-based features that support mental health – e.g. pollinator gardens, quiet zones, water features, and tree canopy. Integrate spaces for contemplation, mindfulness, and sensory stimulation, such as labyrinths, aromatic gardens, and healing circles.
• Create multi-functional, intergenerational destinations by designing spaces with zones or features for toddlers, teens, adults, and seniors to gather, move, and relax in the same area. Include flexible event lawns, climbing sculptures, group swings, outdoor games, and storytelling corners that support playful interaction and community cohesion.
Objective 2: Foster active use of community spaces through the arts, entertainment, and recreation.
Recommended Actions
• Activate existing public and civic spaces by retrofitting underused spaces (e.g. parking lots, plazas, libraries, community centers) into pop-up performance zones, art galleries, or game courts.
• Offer city-owned venues at reduced cost to local artists, musicians, and community groups for events and classes.
• Leverage local sponsors (banks, breweries, healthcare systems) to co-fund concerts, art walks, or weekend tournaments.
• Create a city-recognized Creative Directory of artists, musicians, trainers, and facilitators for event and program matchmaking.
• Install interactive art, public pianos, play sculptures, chalkboard walls, and game stations in parks and downtown corridors.
• Encourage community art installations, pop-up stages, and mural-making events that invite public participation by streamlining permitting and offering up city spaces at reduced cost.
• Turn greenways and trails into “playful corridors” with embedded sound, light, and movement art.
• Partner with Greenfield Schools to coordinate shared use of gyms, auditoriums, classrooms, and green spaces for after-hours and weekend programs.
• Co-sponsor city- and districtwide youth showcases and recreational competitions.
• Develop a branded map or digital guide to highlight venues, upcoming events, and ways to get involved.
Objective 3: Promote design excellence and placemaking principles in all new and renovated public spaces.
Recommended Actions
• Establish citywide public space design guidelines by developing a public realm design manual with clear standards for materials, scale, lighting, landscape, art, accessibility, and character. Tailor guidance for different space types - plazas, parks, streetscapes, trails, and civic nodes while encouraging local variation and creativity.
• Create a placemaking review process for capital projects. Incorporate a design excellence review for all city-led or cityfunded public space projects. Form an advisory design panel of architects, artists, planners, and community leaders to review major proposals and provide place-based input. See page 42 for additional guidance.
• Apply the “ Power of 10+” Placemaking Principle (see page 39). Ensure every new or renovated space includes at least 10 distinct uses or features (e.g., seating, games, art, shade, performance areas, gardens, food kiosks). Encourage diversity of scale—spaces for individuals, pairs, families, and large gatherings.
• Use public art, materials, signage, and landscaping that reflect the city’s culture, history, and natural setting.
• Equip public spaces with movable furniture, multi-use zones, shade structures, weather protection, and universally accessible features.
• Embed local artists and cultural leaders into design teams from project inception, not just at the end.
• Launch short-term pop-up plazas, painted intersections, or mobile gathering spots to trial concepts before permanent investment. Involve local schools, artists, and businesses in co-designing temporary interventions.
• Encourage developers to fund or build public plazas, art features, and green space as part of mixed-use or civic-adjacent projects. Offer bonus incentives or fast-tracking for development that contributes high-quality, publicly accessible design features.
Objective 4: Incorporate community voices into the design, programming, and stewardship of public spaces.
Recommended Actions
• Develop a standard process for engaging residents early and often in public space projects— starting from concept design through implementation and post-occupancy.
• Form neighborhood-based or project-specific advisory groups made up of residents, youth, elders, business owners, and artists. Ensure these groups have a real voice in decision-making, not just symbolic input, with transparent reporting on how feedback is used.
• Allow residents to propose and vote on small-scale projects (e.g., new benches, murals, play features, lighting) in parks, plazas, and civic spaces. Allocate a portion of the parks or public realm budget annually for community-prioritized projects.
• Use signage, public art, and interpretive elements to share local histories, cultures, and resident voices in public spaces. Encourage community-led audio tours, murals, or history trails that embed meaning into place.
• Recruit and train local volunteers to help care for, activate, and promote public spaces in their neighborhoods. Recognize stewards with stipends, community awards, or service credits—building pride and longterm engagement.
• Publicly recognize projects and programs shaped by residents through signage, storytelling, and citywide celebrations. Share success stories in city communications to build a culture of participation and pride.
Objective 5: Partner with local organizations such as Main Street, Hancock County Tourism and the Chamber of Commerce to establish metrics and systems to track participation, community satisfaction, and programming diversity.
• Develop a citywide community program evaluation framework. Create standardized tools to measure attendance, engagement quality, satisfaction, and demographic reach across all civic, cultural, and recreational programs. Include both quantitative (surveys, check-ins) and qualitative (interviews, visual feedback) methods.
• Build an interactive, public-facing dashboard that shows real-time participation stats, event maps, and program trends.
• Send brief surveys via QR codes, text, or email following events and programs. Include questions on satisfaction, accessibility, relevance, and suggestions for improvement. Offer incentives like prize drawings or gift cards to boost response rates.
• Establish baseline benchmarks and annual goals by setting realistic targets for year-over-year increases in total participation, diversity of program types, and attendance from various geographies within the city. Revisit and update these annually.
• Collect video snippets, quotes, photos, and drawings from participants to bring human context to the numbers. Feature these stories in city reports, social media, and council briefings to show impact beyond the stats.
• Track how often and by whom city spaces (parks, plazas, community centers) are used for events or programs. Analyze usage patterns to determine where investments in infrastructure or programming should be increased.
• Publish annual Community Engagement & Program Reports to highlight wins, address gaps, and share lessons learned. Use findings to refine program offerings, change locations, improve accessibility, and inform budget decisions.
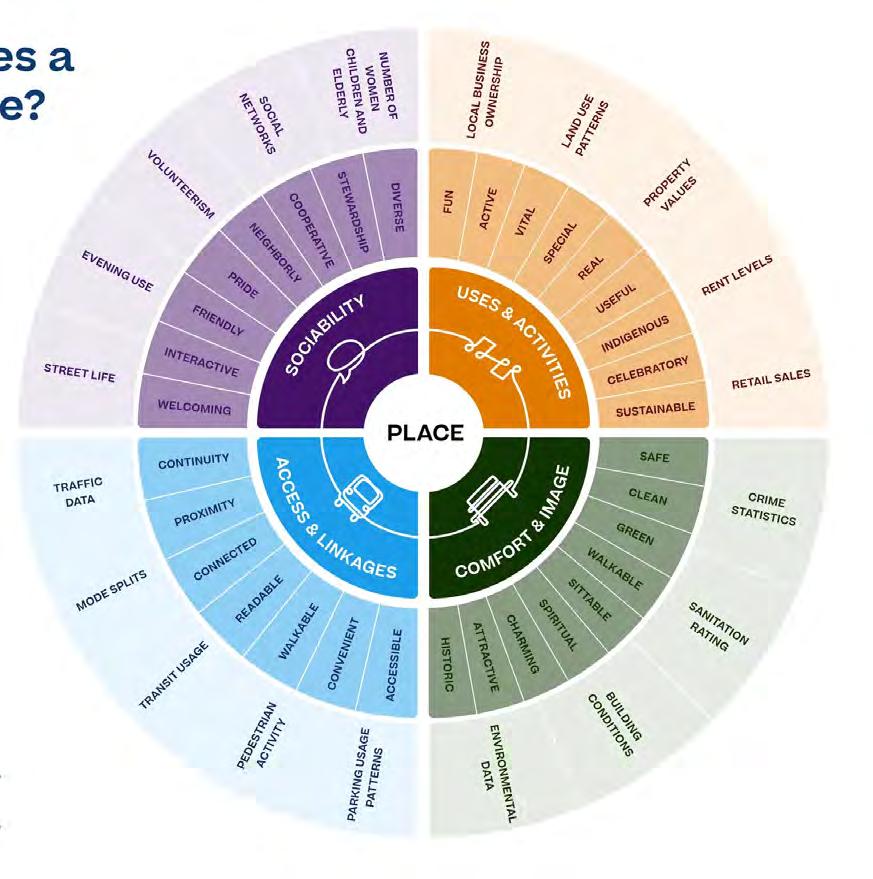
from the Project for Public Spaces
The Power of 10 Principle is a concept coined by Project for Public Spaces (PPS) who developed this simple benchmark for a place, neighborhood, or city. It helps designs and elected officials think at a human scale. The premise is that a great place needs to have 10 thing to do in it or 10 reasons to be there. For example, a city needs to have 10 great destinations, a destination needs to have 10 places in each destination and each place should have 10 things to do. The thought behind this is that the more there is to do, the more people will want to spend time there.
The image to the right shows the four quadrants: the key attributes that make up a place, including sociability, uses and activities, access and linkages, and comfort and image.
The next ring shows the ‘intangibles’ for each of the key attributes and the outer ring shows the benchmarks or measurements of that key attribute.
Learn more by going to: https://www.pps.org/article/the-power-of-10.
This page is intentionally left blank.
Placetypes are a major component of the Plan’s roadmap to 2055. Each placetype establishes a series of development recommendations based on the desired character of new development and redevelopment. They set forth how different parts of the Planning Area should be planned, developed, and/or conserved, as well as how different land uses can be mixed together to create vibrant neighborhoods and community spaces. The community’s Vision and Goals are the guiding principles with which these placetypes were created, with the intent to encourage well-designed places which will protect and enhance the community’s character, safety, and well-being. There are 10 different placetypes in this plan.
A “space” is simply a physical location. A “place” is a space with identity, purpose, and meaning, such as “Downtown.” Although these attributes are subjective in nature, the comprehensive plan seeks to encourage the development of places that people care about, which often relates to how people interact with the space. Are there areas to casually socialize? Do people go there because it’s necessary or because they want to? Do people live there out of necessity or by choice? Perhaps, there is a mix of both at play, but either way it’s a place that the community can be proud of. The role of of this chapter is to define the desirable characteristics of future development and redevelopment, according to the Plan’s Vision and Goals, in order to build memorable and quality places to live, work, and play.
Figure 3-1: Goals as the Basis for Placetypes
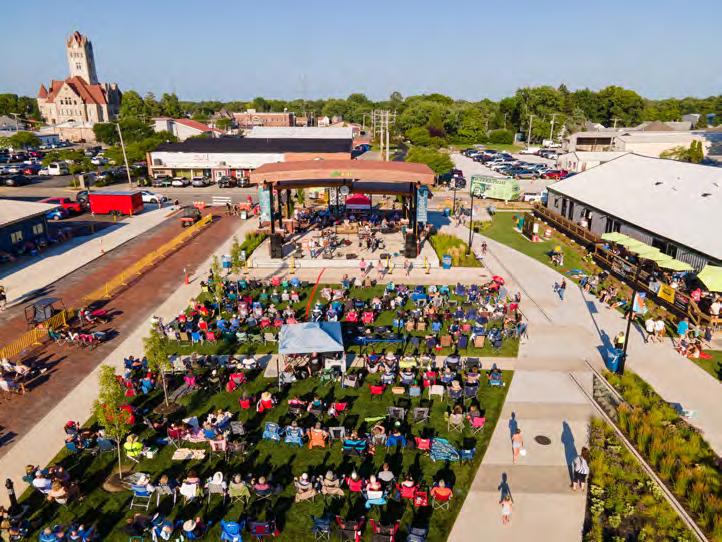
Land uses are the foundational elements of a placetype. Building upon land use, each placetype has specific descriptions and recommendations on several supporting elements, including:
• Mobility
• Site Design
• Building Design
• Special Considerations
There are ten placetypes and three special development considerations on the Future Development Map. Each placetype defines primary land uses, and in many cases, these uses are encouraged to be intermixed. Depending on the placetype, mixed-use can mean different things. In some situations, there is horizontal mixed-use where compatible land uses are developed in a walkable and well-connected fashion, but each use is in separate buildings from each other. In vertical mixed-use, uses are integrated into a single building where one use might be on the first floor and other uses on the upper floors.
Secondary land uses are also identified, but these uses should be developed in a supporting or limited capacity, so as to not exceed the primary land uses within each placetype.
Beyond land use, placetypes contain recommendations for building form (height, placement, and character), site design (landscape, amenities, access, and parking), and
transportation (vehicular, bicycle and pedestrian, and transit). Each placetype includes a set of precedent images that visually describe the intent of the placetype recommendations.
Many of the placetypes include additional guidance for development under “Special Considerations.” This guidance relates to specific areas on the Future Development Map that are unique, such as key segments of major roadways, prominent intersections, topographic concerns, or other characteristics that should be taken
into context. In some instances, these special considerations are supported with additional precedent imagery and subarea plans that have an in-depth perspective into how development should look and function.
Development intensity is a measurement of how different types of development have different impacts on the land, infrastructure, public services, natural systems, and more. This includes both the construction process (a shortterm impact but more difficult to quantify) and the final product (the ongoing, long-term impact and somewhat easier to quantify). Development intensity is often quantified by two units of measurement:
1. Floor-to-area ratio (FAR): Often used to measure both residential and nonresidential uses.
2. Residential dwelling units per acre (DU/ acre): Used to measure residential uses.
The intensity of non-residential development (commercial, industrial, institutional, etc.) could also be measured jobs per acre, although site-specific data would be generally more limited. Hence it would be needed at the conceptual level or before a development occurs.
Development intensity is highly related to its ability to pay for itself, meaning a property produces enough property tax for the city to maintain all the required roads, utilities (water, wastewater, stormwater, electric, etc.), and public services (police, fire, EMS, trash, etc.) for that development. Typically, the more intense a development, the more efficient and financially feasible the services to the development are.
As of the writing of this Plan, since the Indiana Property Tax Cap Referendum in 2010, property tax rates in Indiana have been capped, meaning a property owner’s property tax bill cannot exceed the gross assessed value of:
• 1% for an owner-occupied primary residence (homestead);
• 2% for residential property, other than an owner-occupied primary residence, including apartment;
• 2% for agricultural land;
• 3% for other real property (commercial, industrial, etc.); and
• 3% for personal property.
Note: institutional properties such as schools, civic buildings, and nonprofits are exempt from property taxes.
By ensuring a healthy balance of land uses, guided by Greenfield’s placetypes, the City can maintain infrastructure and sustain its investments in the community for generations to come.
As mentioned before, residential density is often measured by the number of dwelling units per acre. Density plays a significant role in preserving both rural and natural areas. When comparing densities to each other, a lower-density development typically uses more land to house 100 people, than a higher-density development which would use a smaller amount of land and could possibly house more than 100 people. Therefore, it is recommended that increasing the density near built-up areas and where existing infrastructure is available is preferable than continually developing “greenfield” sites that is typically developed at a lower density and doesn’t have readily available utility extensions.
In addition to recognizing the impact of density, it is important to understand that density can look drastically different, even at the same density. The look/feel of density comes down to its design and layout, which is described by the placetypes, to create a vibrant and attractive city. To provide context and precedents for Greenfield’s placetypes, the table on the next page has existing development examples around Greenfield and other communities. Data for dwelling units originate from the 2020 Decennial Census.
For a mode of transportation (driving, walking, biking, etc.) to be viable – that is, useful, convenient, safe, and reliable – the supporting infrastructures must be widely accessible and thoroughly connected. For example, almost every public right-of-way in Greenfield enables vehicular travel. Besides for certain pedestrianized areas such as the Pennsy Trail and the North Street Living Alley, people know and can trust that a street will have the necessary infrastructure for vehicular travel (dedicated space for car lanes and parking either on the street or somewhere nearby).
Although tremendous progress has been made on the City’s trail and sidewalk networks, their viability (useful, convenient, safe, and reliable) for people who walk, roll, or bike cannot yet be compared to the vehicular network. This is most noticeable as you leave the City, where most sidewalks and trails end at the City limits. However, with a growing demand for more quality-of-life amenities, walkable communities, and reinvestment into aging transportation systems at all levels of government, “complete streets,” meaning streets that have supporting infrastructure for most or all travel choices, are growing in both demand and supply.
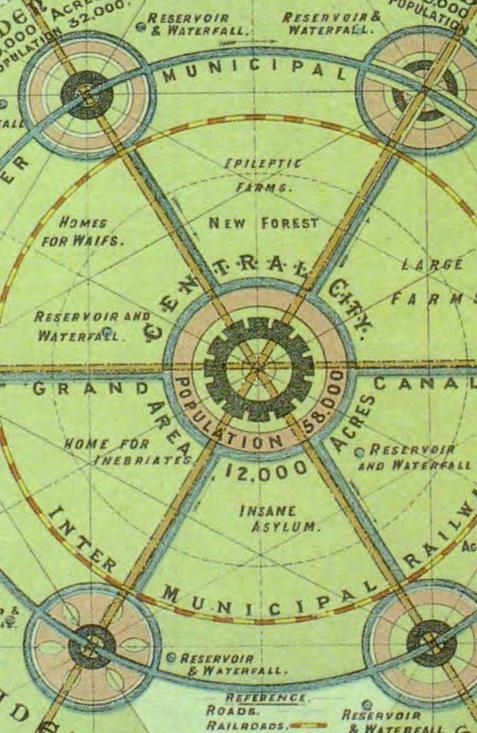
There are many historical planning movements that have sought to redefine what cities looks like, especially in the way people experience different densities and access to open space. Many of which still impact planning practices and thought today, including the Garden City and City Beautiful movements, Central Place Theory, New Urbanism, and more. If you wish to learn more about how places have developed over time, you can start by learning some of the most well-known planning theories here: https://urbandesignlab.in/top-15-theories-in-urbanplanning/. All this to say, cities change over time, and proactively preparing for it allows Greenfield to take control of its future: the purpose of this Plan and the community’s Vision and Goals.
Area designated as Rural Reserve Placetype
Bowman Acres, Greenfield, Indiana
0.03 DU/ acre Rural Reserve
Keystone, Greenfield, Indiana
0.57 DU/ acre Estate Neighborhood (Note: The lack of sidewalks in this existing development is not recommended for future developments)
2.94 DU/ acre Suburban Neighborhood
Photos (Note: photos are not all at the same scale)
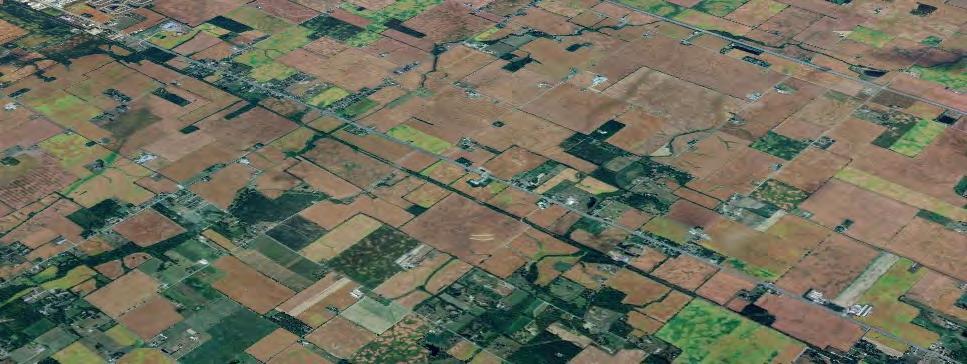
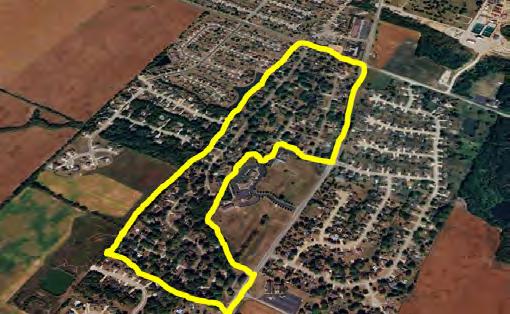
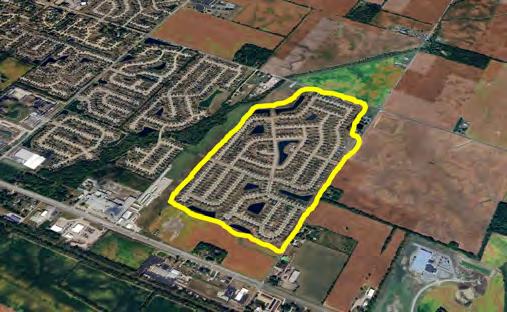
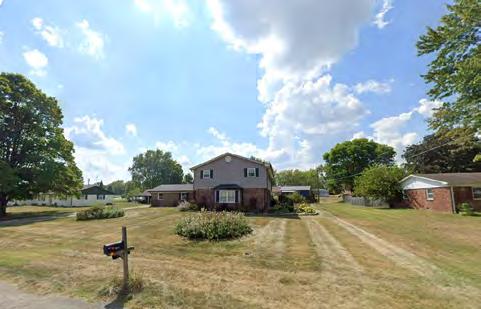
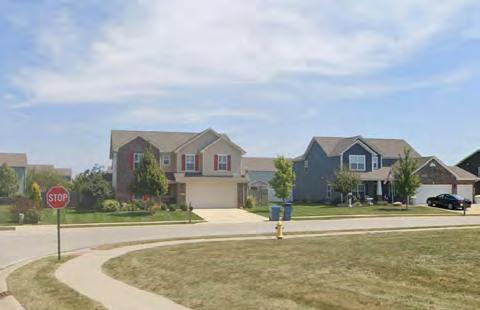
Village Homes, Davis, California
Weston Village, Greenfield, Indiana
3.90 DU/ acre Suburban Neighborhood Mixed Residential Neighborhood
Village (under construction), Westfield, Indiana
3.00 DU/ acre Suburban Neighborhood Mixed Residential Neighborhood
3.85 DU/ acre Mixed Residential Neighborhood
Photos (Note: photos are not all at the same scale)
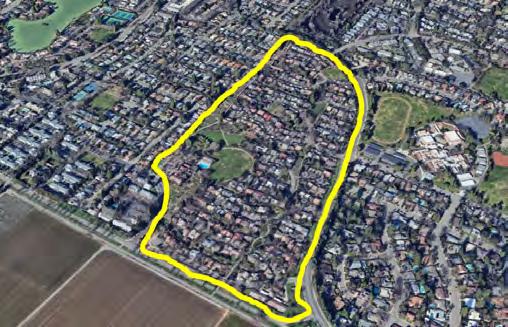
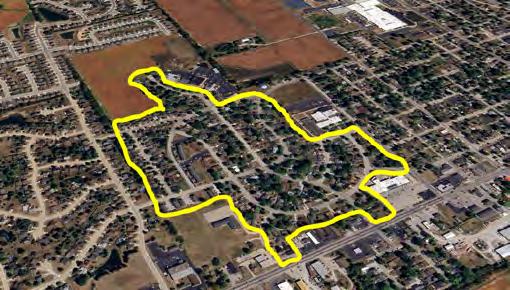
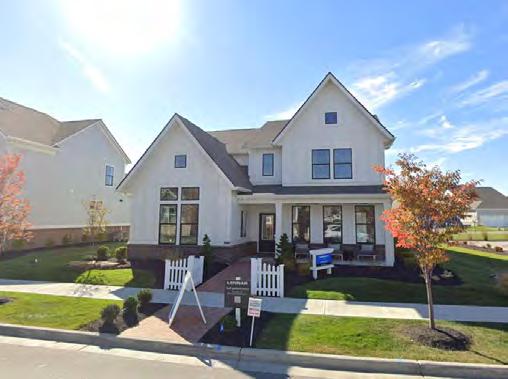
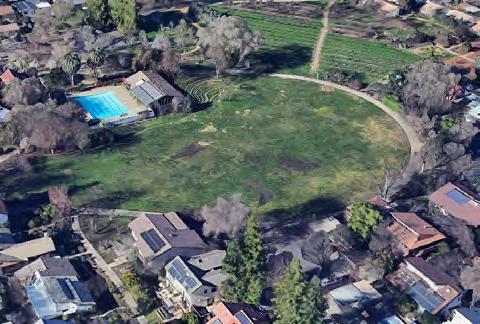
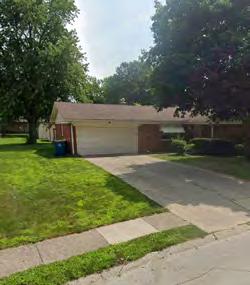
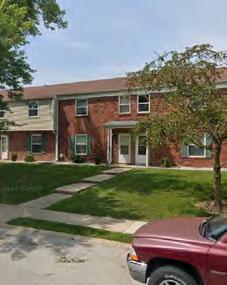
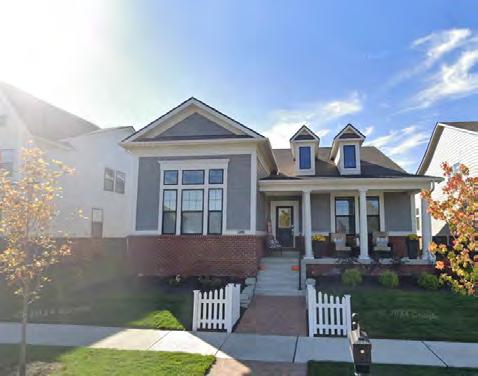
North Hampstead, Valparaiso, Indiana
6.60 DU/ acre
Photos (Note: photos are not all at the same scale)
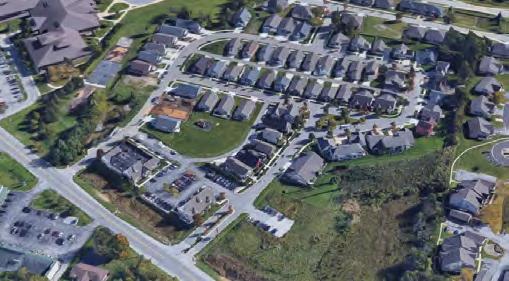
Mixed Residential Neighborhood Neighborhood Center
Saxony Village, Fishers, Indiana N/A Neighborhood Center
The aerial below shows attached (fourplexes, duplexes) and detached single-family homes)
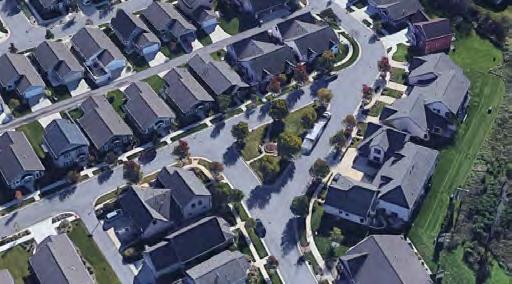
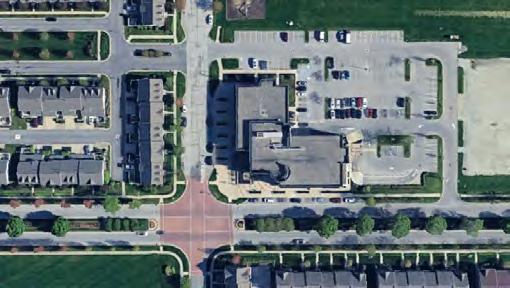
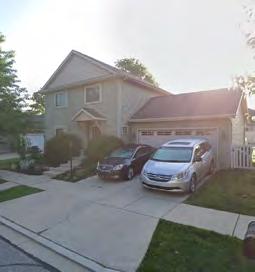
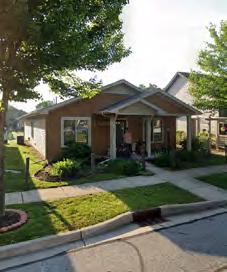
The image below shows a corner store (pizza restaurant) at the front of the development with outdoor dining facing the primary street – native vegetation was planted in front to dull traffic noise, manage stormwater, and provide open space.
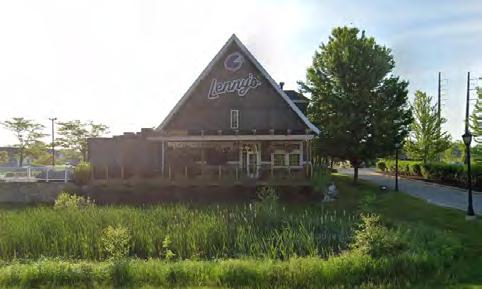
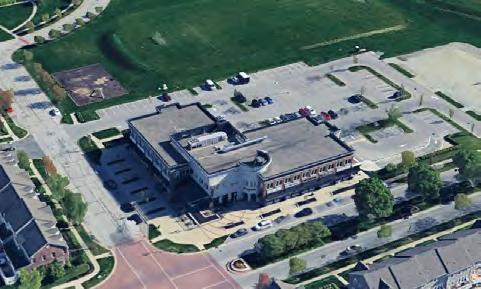
King of Prussia Town Center, King of Prussia, Pennsylvania N/A Suburban Commercial Center
Clay Terrace, Carmel, Indiana N/A Suburban Commercial Center
Cypress Waters, Coppell, Texas N/A Employment Hub
Photos (Note: photos are not all at the same scale)
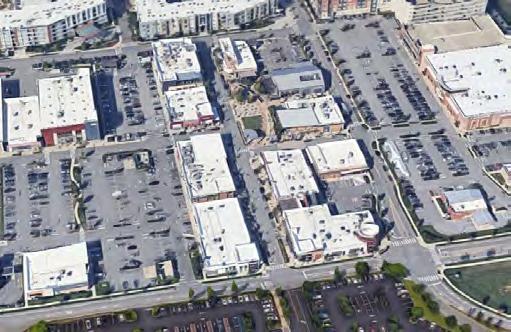
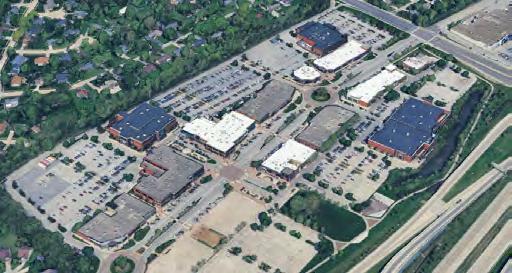
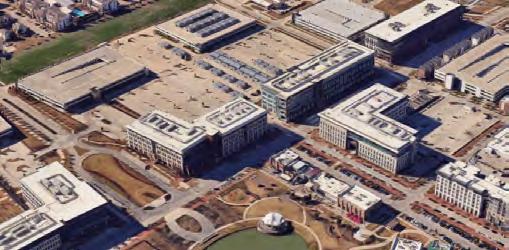
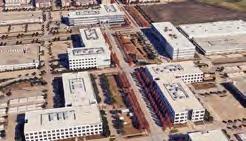
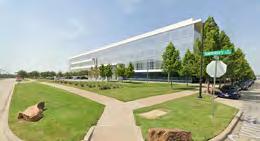
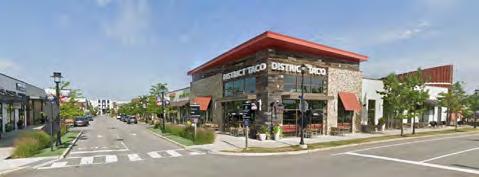
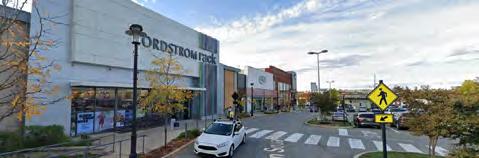
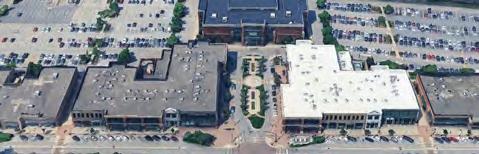
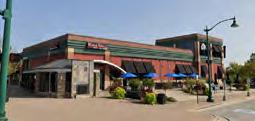
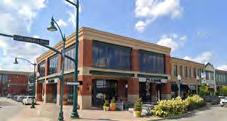
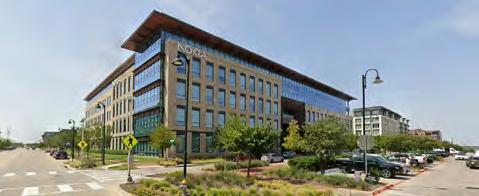
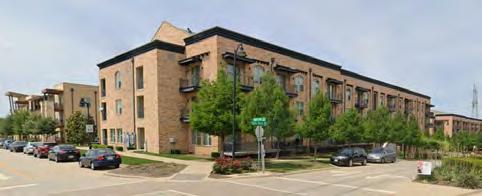
The MIBOR Realtor Association, Central Indiana’s chief realtor organization of 10,000+ members, conducts a survey across the region every six years, most recently in 2022. The survey asks about satisfaction with the community in which people currently live and/ or where they want to live. A full report is available at https://www. indympo.org/maps-and-data/data-studies . Seven key findings for Greenfield include:
1. Neighborhood qualities, like nearby shops and amenities, were consistently more important than home qualities, like size and appliances, in deciding where people would like to move,
2. Only 17% of respondents living in Hancock and Shelby County were satisfied with the number of shops/restaurants within walking distance of their home, the lowest satisfaction score in the metropolitan area,
3. Across the metropolitan area, satisfaction with housing affordability, road quality, and walkability lagged behind other neighborhood qualities,
4. Respondents ranked (1) safety, (2) reliable/high-speed internet, and (3) the quality of streets and roads as the three most important aspects of a community,
5. Most respondents preferred to live in mixed-use suburbs,
6. People who were younger, unmarried, and/or currently renting were more likely to favor walkable communities,
7. Households with children were more likely to rank open space with higher importance.
The Future Development Map identifies where placetypes are or should be physically located in the community. It does not dictate when development occurs, rather it describes how development should look, feel, and function if/when it does occur. The process of making the map included:
• An analysis of the community’s trends in real estate development, population, economy, housing, environment, and more
• Public input gathered from workshops, the project website, and other events,
• Discussions with focus groups including elected officials, City staff from utilities, police, planning, fire, parks, local community organizations, and government partners like Hancock County.
The Planning Area, expanded from the City’s 2015 Comprehensive Plan during the third phase of the planning process, shows a much more expanded planning boundary and illustrates the desirable qualities and types of development in each placetype. While there is no expectation by the City that it will grow to that entire boundary within the next twenty years, by adopting that planning area, it allows the City to plan, provide direction, and collaborate with the County and other utility providers regarding the future of growth and development outside of the City.
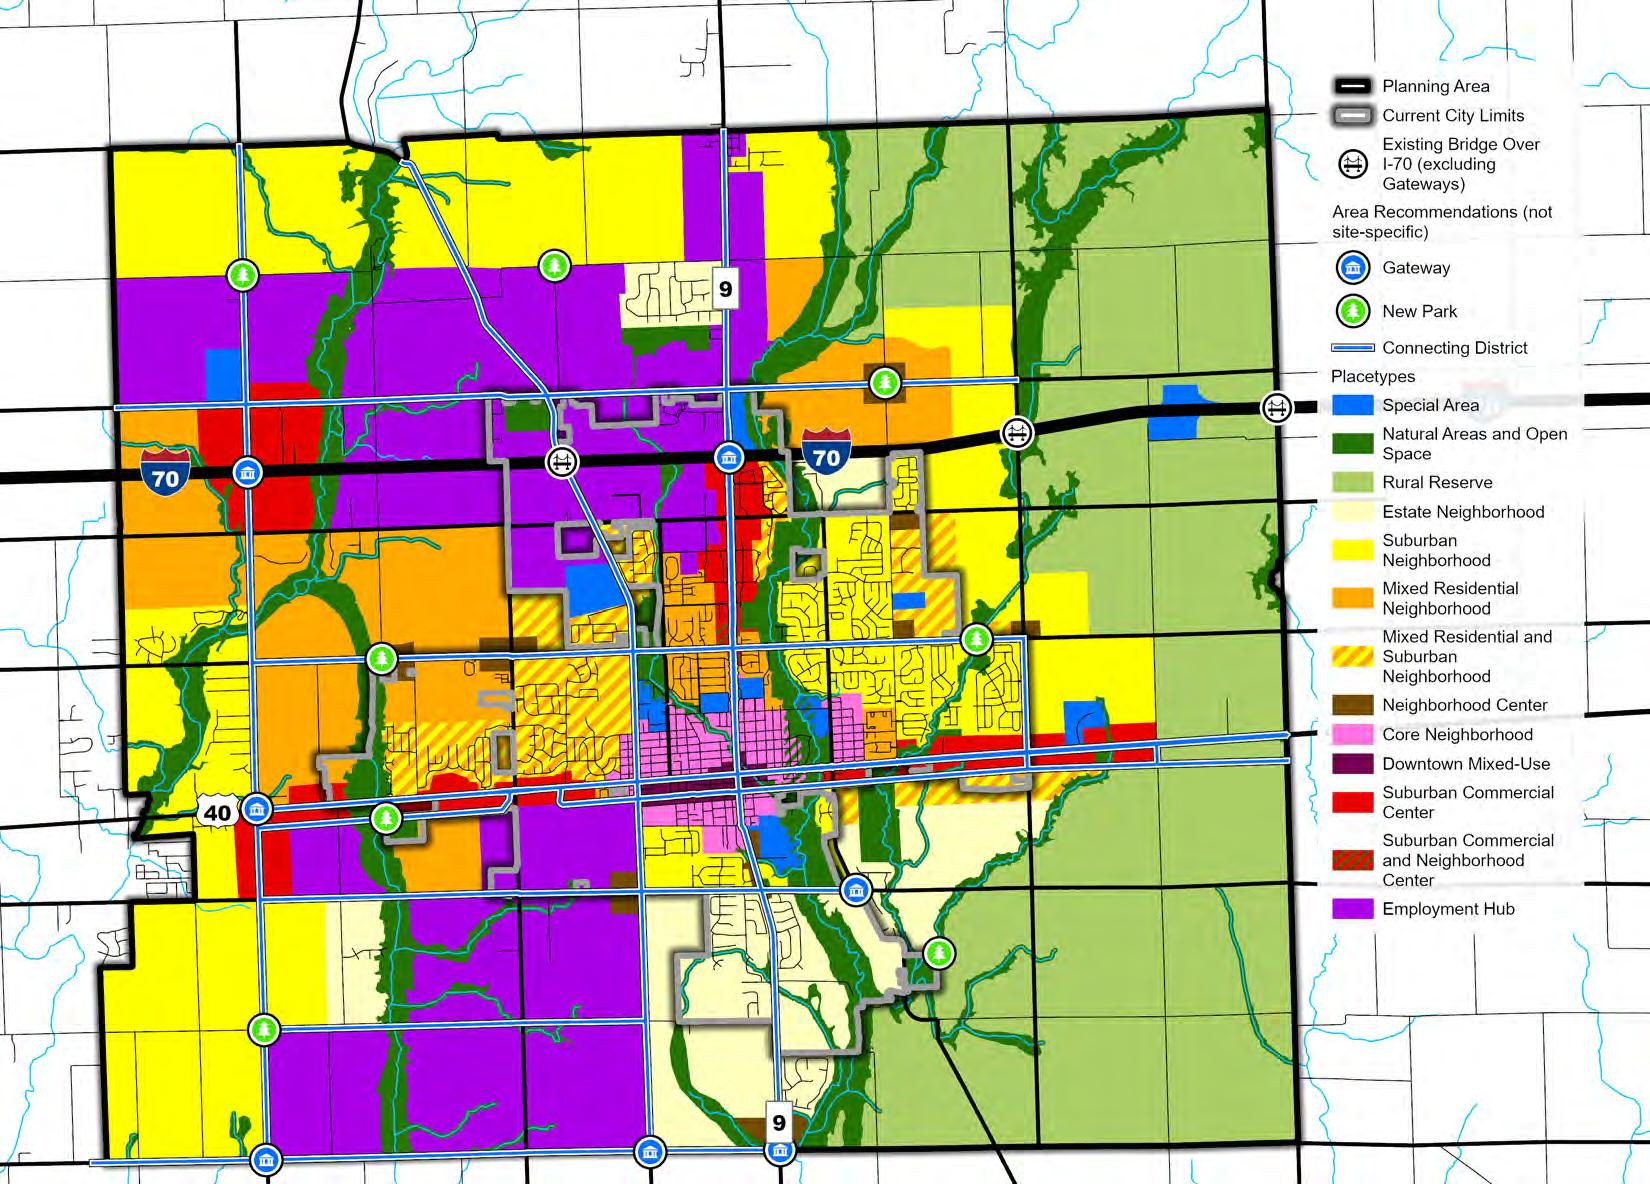
These recommendations should be applied to all placetypes. They include how greenspace should be laid out, street design, connectivity, and building and site design. However, their application should always be sensitive to the context of the area by allowing for some flexibility if there is a high level of difficulty in constructing and/or maintaining a development long-term.
Preserve natural features or integrate them into a development’s design.
Stitch together natural features and open spaces across developments to create conservation/wildlife corridors.
Buffer pedestrian, bicycle, and vehicular traffic from each other with grade separations and, where possible, planting strips.
There should be wayfinding signage at key intersections for destinations like downtown, the Pennsy Trail, Riley Home, Depot Street Park, and more.
Use trees and native vegetation in planting strips or medians (see IDNR and the Indiana Wildlife Organization for a list of native species).
Preserve sight lines at intersections for increased safety and visibility.
Enforce the City’s Complete Streets policy for new roads and when repaving existing roads to incrementally improve and build a safe and connected multi-modal street network.
Incorporate accessible design infrastructure at crossings where feasible (e.g., ADA ramps, diagonal crossing, tactile paving, audible pedestrian signals, etc.).
Locate utility infrastructure underground where possible and, when locating underground is not possible, screen infrastructure with vegetation or beautification methods (e.g., utility boxes can be painted to become public art or murals).
Connect residential developments to nearby multi-use pathways, trails, businesses, and greenspaces.
There should be several connections between different developments and subdivisions, by both filling in connectivity gaps in existing development and proactively planning connections for new/future development, including but not limited to stub streets and trails.
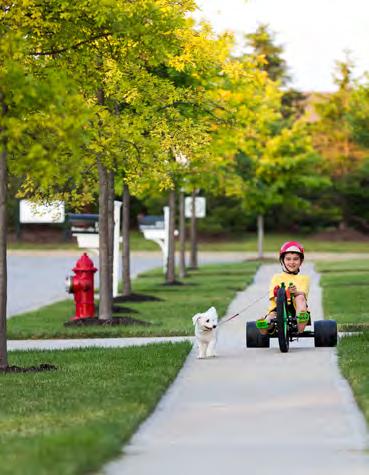
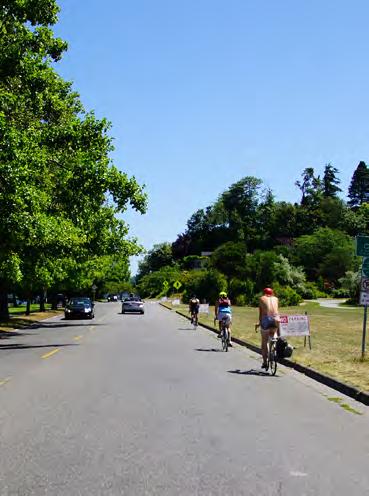
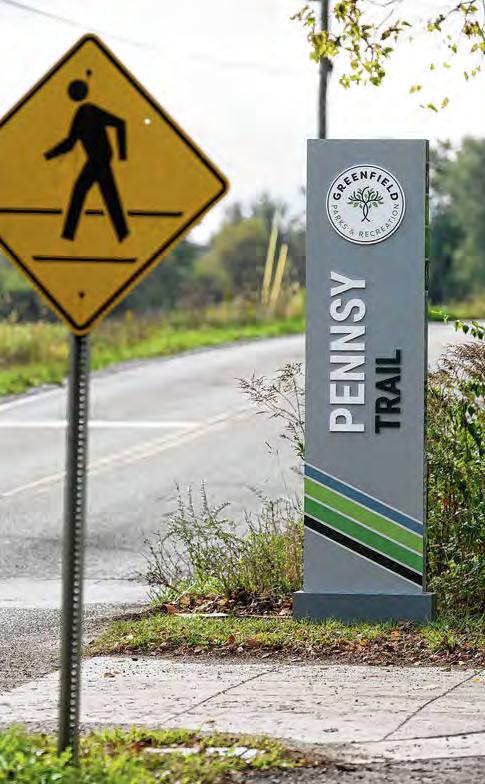

All neighborhoods should provide an enhanced pedestrian system with the use of through-block trail systems, recreation, corridors, and enhanced rights-of-way which provide direct connections to community facilities, such as parks and civic buildings, as well as shops and employment areas.
Cul-de-sacs are discouraged as they fragment the street network; however, if present, they should maintain connectivity to the broader network with off-street pathways.
New buildings should complement the character, design, and placement of their surroundings, especially in areas that have existing development.
Buildings should have at least one front entrance facing the primary street to create an accessible and welcoming appearance.
Along major roads, buildings should be setback farther than on local roads to allow space for outdoor seating, wider sidewalks, bike racks, and other pedestrian-friendly features.
Sidewalks and trails should be continuous across driveways and entrances, keeping pedestrians and cyclists at the same level as the sidewalk instead of lowered to the vehicular level, making walking and biking more comfortable, improving visibility for drivers, and enhancing traffic safety.
Encourage landscaping features like rain gardens, bioswales, and other native plantings to manage stormwater runoff, enhance biodiversity, and improve groundwater quality.
Screen parking lots from the street with vegetative buffers or low-height walls, while maintaining clear sightlines into the lot for public safety.
When a parking lot is present behind or on the side of a building, a secondary entrance is encouraged from that area for convenient access to the building.
Design parking garage facades to complement the character of surroundings buildings while maintaining visibility into the garage to enhance safety.
Locate parking areas behind buildings or within the interior of developments to promote pedestrian and bicycle activity or cafes and gathering spaces along streetscapes and improve pedestrian and bicycle access to building entrances.
If a parking lot has more than two parking aisles/rows separating the primary building entrance from the street, incorporate a clearly marked, high-visibility pathway for pedestrians and bicyclists to safely access the building entrance.
In large parking lots, a clear and convenient pathway for pedestrians should be delineated to the building’s main entrance(s).
The photo below is shows an excellent example of well-planned access management, where several developments share an access/frontage road, rather than each one directly connecting to the major road. This setup reduces the number of conflict points along a road and allows traffic engineers to better manage traffic. It also reduces the likelihood of crashes, especially between vehicles and pedestrians/bicyclists because there is less interaction between them on major roads. Instead, interactions can mainly occur on lower-speed frontage roads. However, one of this critiques of this example is the jagged sidewalk and inconvenient access points for pedestrians and bicyclists.
Major road with minimal access points to increase traffic safety and better control circulation
Larger setbacks on major roads to buffer traffic noise pollution and/or provide spaces for outdoor seating and greenspaces
Pedestrian and bicyclist infrastructure (painted crosswalks, sidewalks, etc.) should connect directly to the main entrance of buildings
Access road shared between multiple developments. Combines multiple access points into one, controled access point to a major road.
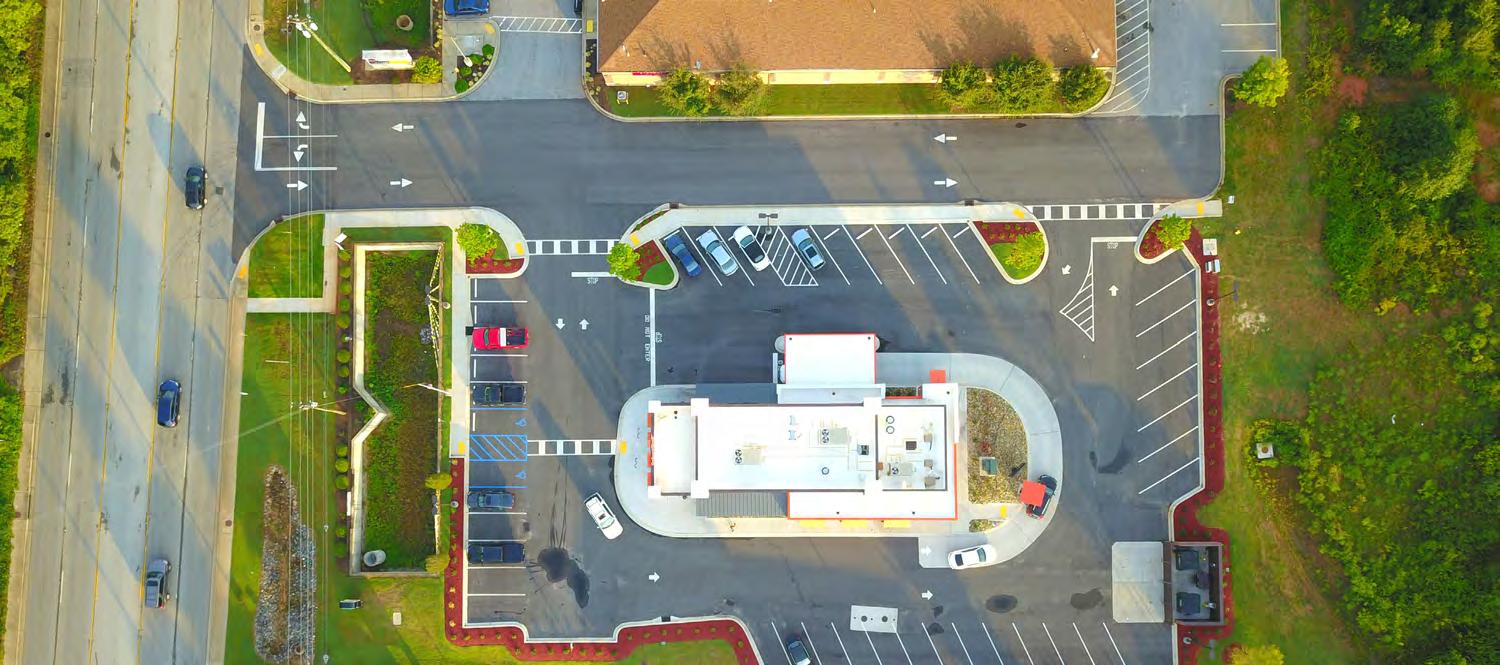
This page is intentionally left blank.
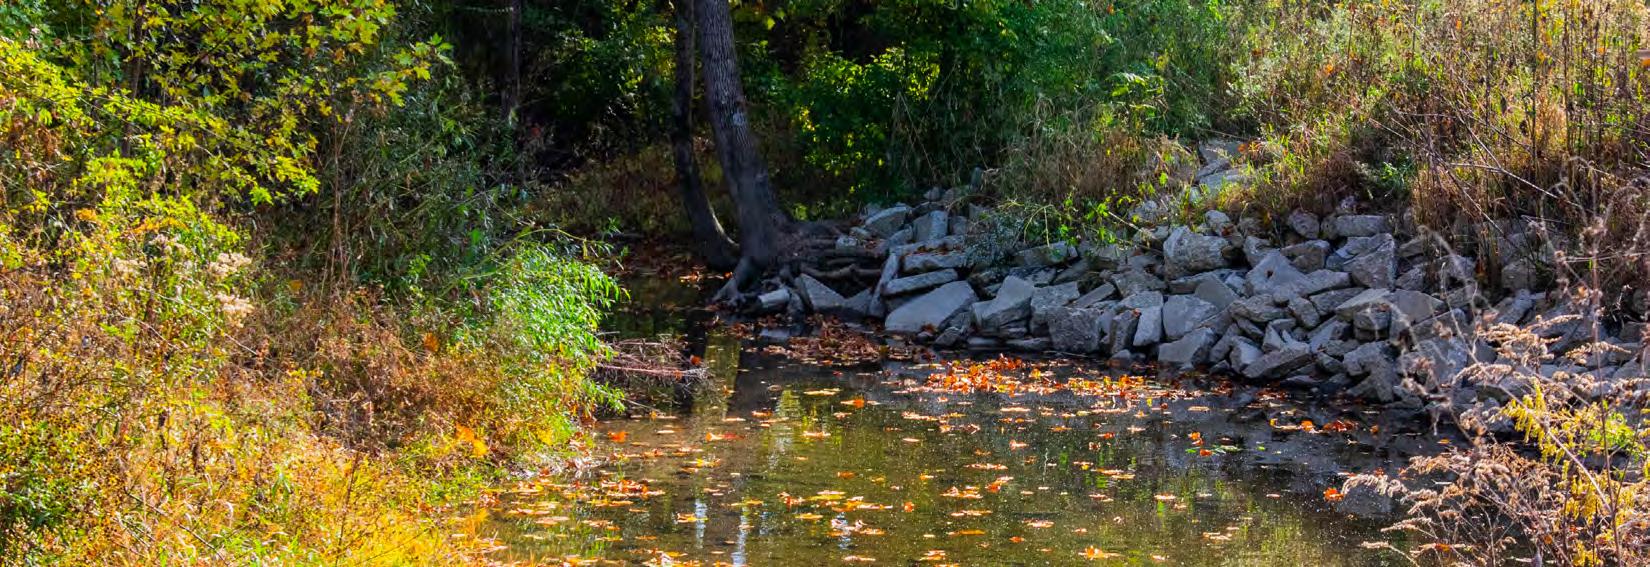
Naturals areas and open spaces include sensitive environmental features like waterways, forests, wetlands, floodplains, and parks. These areas should have minimal to no human disturbance, seeking to maintain an equilibrium between urban development in nearby placetypes and the protection of critical natural resources. Minimal to no new development also helps preserve nature and local ecological health, while providing opportunities for leisure and recreation. Conservation and restoration are important aspects of this placetype, especially to encourage efforts to improve biodiversity and manage the natural flow of floods to boost the city’s ability to handle and better recover from natural disasters.
If new development occurs, it should be designed around natural areas to highlight them as community amenities with pedestrian and bike systems that connect throughout the city. Pedestrian connections and trails are highly encouraged along waterways and through scenic areas. Expanded connections to nearby neighborhoods, downtown, and parks are also desired.
1. Water resources, especially wetlands and aquifers that naturally filter and cleans groundwater, are conserved.
2. Green spaces are accessible by people of all ages and abilities, providing a quiet reprieve from the busy city and a place to reflect and experience nature.
3. Forests, prairies, and other natural areas are or should become interconnected, creating wildlife corridors that help to restore nature by having minimal to no disturbance from humans.
4. In some areas, such as Brandywine Creek, recreational assets like parks, trails, and facilities for education about nature are encouraged to improve residents’ quality of life and connection to nature.
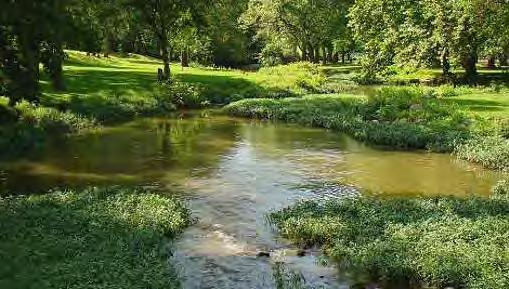
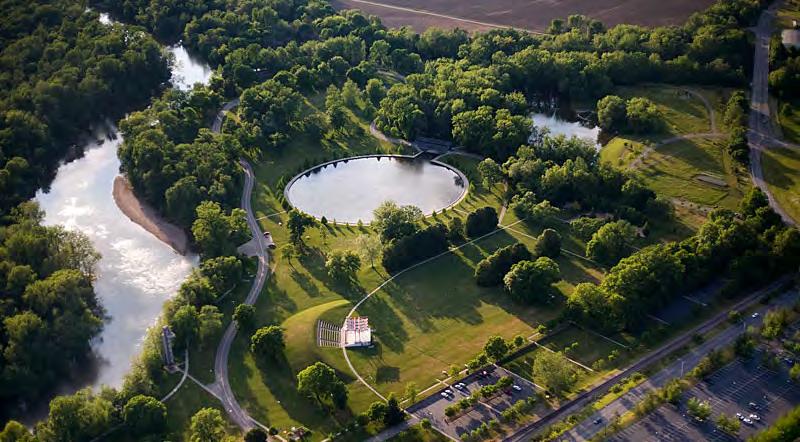
5. Dedicated spaces for public gatherings, events, and art are encouraged, given their is minimal impact to the environment, to promote social connection, community pride, and a sense of belonging.
6. Pedestrians and bicyclists take priority as the main forms of transportation. This can be accomplished by a highly connected trail network between built-up and natural areas.
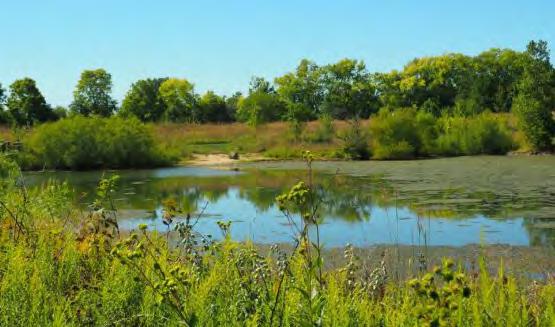
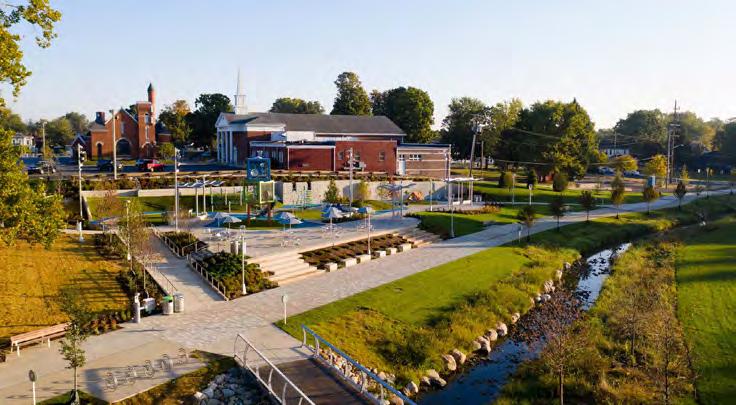
Car parking is strategically placed at key points of interest and entry, where vehicular access is necessary or highly desirable.
Gateways and New
= Primary Use | = Secondary Use | = Discouraged
Residential Uses*
Detached, Single-Family
Accessory Dwelling Unit
Duplex
Triplex / Fourplex
Cottage Court
Townhome
Live-Work Building
Courtyard Building
Apartment Building
Commercial Uses
Auto-Service/-Parts Dealer
Gas Station
Building/Garden Material/
Equipment Supplier
Grocery Store
Restaurants, Food and/or
Beverage Service
Drive-through Business
Retail / General Store
Indoor or Personal Storage
Recreational / Fitness
Business
Hotel or Accommodation
Professional Office
Auction Facility
Entertainment Venue
Veterinary Clinic
Kennel
Agricultural Tourism
(markets, produce stands)
All Other Commercial Uses

Industrial Uses
Artisanal/Small Workshop
Light Industrial
Heavy Industrial and/or
Manufacturing
Distribution and Warehousing
Natural Resource Extraction or Excavation
Outdoor Storage
Civic / Institutional Uses
Governmental Service
Daycare / Childcare Service
Senior Care Service
Healthcare Service
Educational Service
Place of Worship
Utility Facility
Convention Center
Air Transport Facility
Ground Transport Facility
Open Spaces (besides parks)
Sports Facility
Conservation Community Garden Other Uses
Parking Lot
Parking Garage
Farmland


*Refer to Chaper 2: Attainable Housing for definitions.
Street Network
• Several major streets cut through this placetype, including I-70. As they travel through this placetype, extra care should be taken to reduce their environmental impact through sustainable street design elements such as integrating native vegetation and rain gardens along the street.
• Local streets should be curvilinear to limit through-traffic, reduce vehicle speeds, and preserve natural features.
• Bicyclists and pedestrians should take priority as the main forms of transportation in this placetype.
• Where feasible, wildlife crossings/bridges are encouraged to reduce habitat fragmentation due to human development, especially in areas known to have large deer and other animal populations. It is infeasible for local government alone to build wildlife crossings but could be accomplished at a regional or statewide level.
• Streets should generally have low speed and capacity to create or preserve a quiet atmosphere and reduce environmental impact.
Speed and Capacity
Vehicular
Bicycle and Pedestrian
Character
• Access streets that go through parks or natural areas should have traffic calming elements that reduce vehicle speeds as well as the ability to speed, such as small roundabouts, speed bumps, and narrow lanes.
• Vehicular mobility should be limited throughout parks and natural areas, with most access and spaces dedicated to active recreation such as biking and walking.
• Sidewalks and trails should be at least 8 and 12 feet respectively.
• Bicycle and pedestrian infrastructure should be highly connected to other placetypes, especially built-up residential and commercial areas, to reduce the need for vehicular access and the resulting noise from vehicles.
• Trees line the street on either side, separating pedestrians and bicyclists from vehicle traffic, while also creating tree tunnels that can discourage speeding.
There is no preferred network since development is generally discouraged. However, if any development does occur, such as along Brandywine Creek, any networks should be designed around natural areas and open spaces.
Preferred Network Use limitedly Discouraged

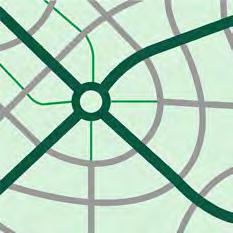
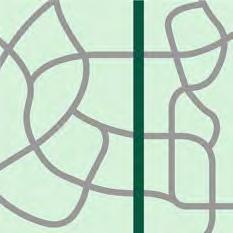
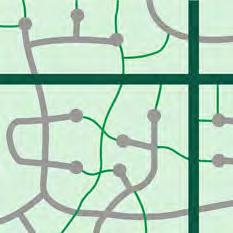
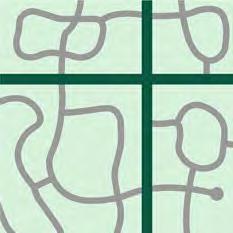

Access
Building Placement
• Access should occur from connecting trails, sidewalks.
• Vechiular access should be located at the edge of this place as to not disturb, disconnect, or fragment natural areas and open spaces.
• Buildings have low to no impact on the environment. They should be located away from natural features to preserve them, such as waterways, floodplains, and hilltops/high-elevation areas. Preferably, they are located near the edge of the placetype.
• Water activities such as kayaking, trails, and other recreational amenities are encouraged.
• Public restrooms should be accessible with clear signage and preferably built to blend into the surrounding landscape such as using lumber or stone materials/facades.
Amenities and Open Spaces
Off-Street Parking
• Any amenities that are structures, such as playgrounds and restrooms, should be sufficiently buffered from waterways and floodplains.
• Maps, markers, and other wayfinding signage should be clearly marked along trails and at trailheads, showing points of interest around the community that can be reached with the trail.
• Selective, low-impact clearing may be appropriate for nature education opportunities, spaces for informal gatherings, and seating areas for scenic vistas.
• Parking areas should be located at the edge of natural areas/open spaces.
• Buffer parking areas with trees, bushes, and other vegetation.
• Parking areas themselves should have clear edges to separate them from nature.
• Drainage and stormwater runoff should be managed on-site as much as possible to reduce pollutants from entering nearby waterways.
• Removing and replacing invasive plants with native ones is highly encouraged.
• New plantings along waterways to solidify the streambank and reduce erosion.
Landscaping
• Pathways, excluding high-use trails, should be made with natural materials such as compacted dirt or gravel but not at the expense of wheelchair accessibility.
• New buildings are generally discouraged in this placetype, but if constructed, they should blend into the environment as to not stand out.
• Building design should reference its surroundings, such as using visually or physically similar materials that blend the building into the background.
Character
Orientation
• Buildings should also have ‘bird-friendly’ design to reduce the likelihood of window collisions, such as semi-transparent instead of completely transparent windows, exterior glass detail, and reducing the surface area of windows higher up on the building.
• See the American Bird Conservancy’s report on “Bird-Friendly Building Design” for additional guidance: https://abcbirds.org/ newsroom/publications/
• Buildings should be oriented toward natural features and open spaces to provide scenic views to inhabitatants.
• While orientation towards a street is generally favored, the more important aspect of a building’s orientation should be influenced by the preservation of natural features and open spaces.
Entrances
• Building entrances should face a trail/sidewalk that connects into a natural area/open space, as well as parking areas.
• As a significant natural feature, meandering through the middle of the City, Brandywine Creek should be developed into a central artery for recreation and transportation.
Brandywine Creek and Trail
• While its floodplain should be respected, recreational activities and facilities (canoeing, kayaing, swimming, lounging, seating areas, etc.) that engage the riverfront are highly encouraged.
• Work with the Parks Department to aquire land and/or easements for a future Brandywine Creek Trail.
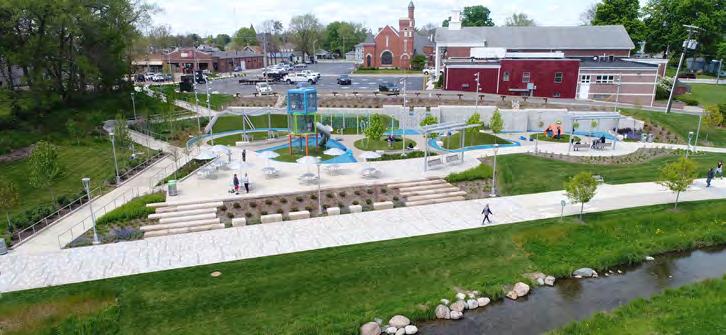
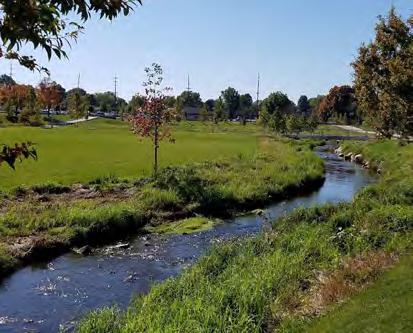
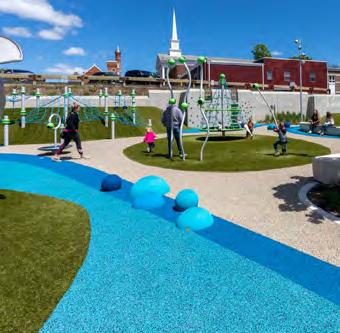
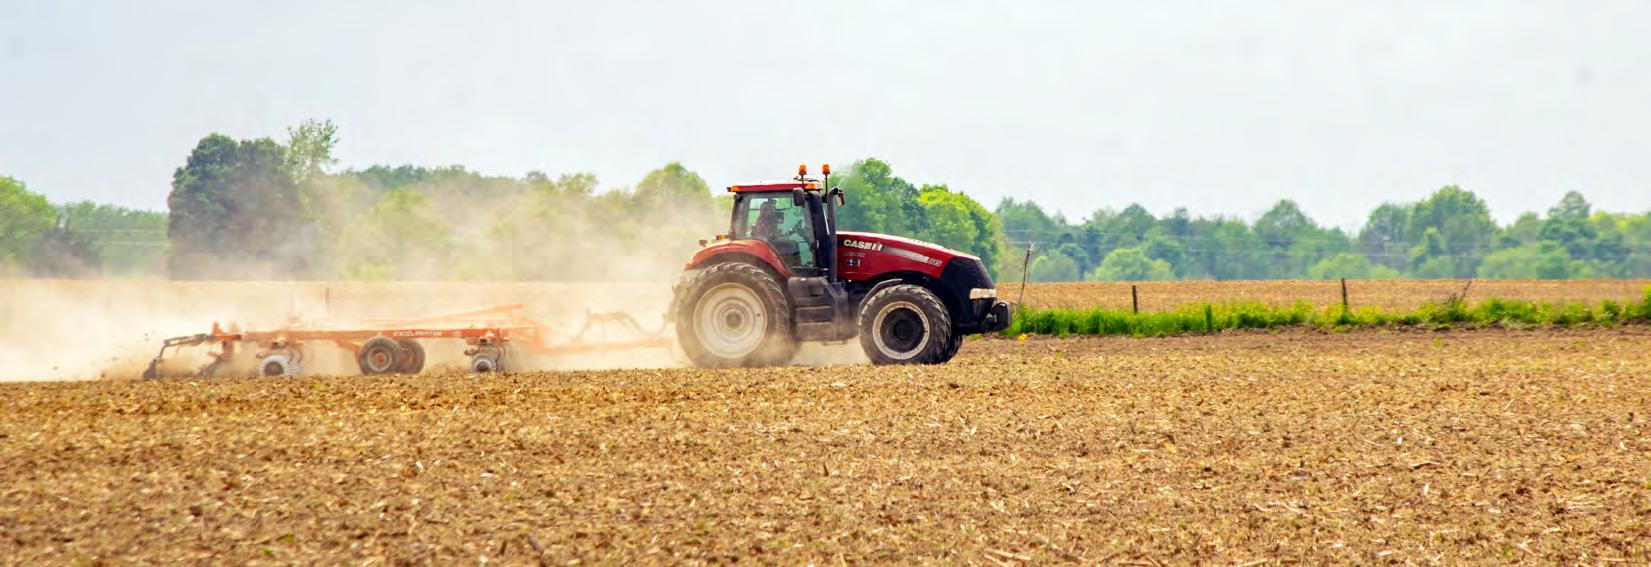
The Rural Reserve covers most of the east side of the Planning Area and is characterized by a mix of agricultural uses with single-family residences scattered along county roads. Water and sewer utility access is unavailable in these areas. Rural road widths are not capable of handling high traffic volumes. New growth should only be encouraged in areas where adequate public water, sewer, and streets are available or planned.
Areas within the Rural Reserve should be subject to further planning in coordination with infrastructure improvements, public service capacity, and improved transportation access. Until adequate infrastructure is available, the land use recommendation is to preserve these areas for future municipal growth and development. Development is discouraged where it would restrict or prevent the future extension of water, sewer, and roadway improvements for the buildout of these areas.
Historic site features such as cemeteries, barns, accessory structures, and agriculturally related features should be preserved in their locations and context with careful site design around them to preserve the character of Greenfield. Any new buildings should be designed around natural features to protect forested areas, farm viewsheds, water resources, and tree rows.
1. Open sky and county roads lined with crops, interspersed with singlefamily homes, define the landscape.
2. Viewsheds across acres of farmland and open space create a rural atmosphere and provide a reprieve from city life.
3. Agricultural uses are sufficiently buffered from waterways, forming riparian buffers that provide wildlife habitat, improve water quality, and reduce soil erosion.
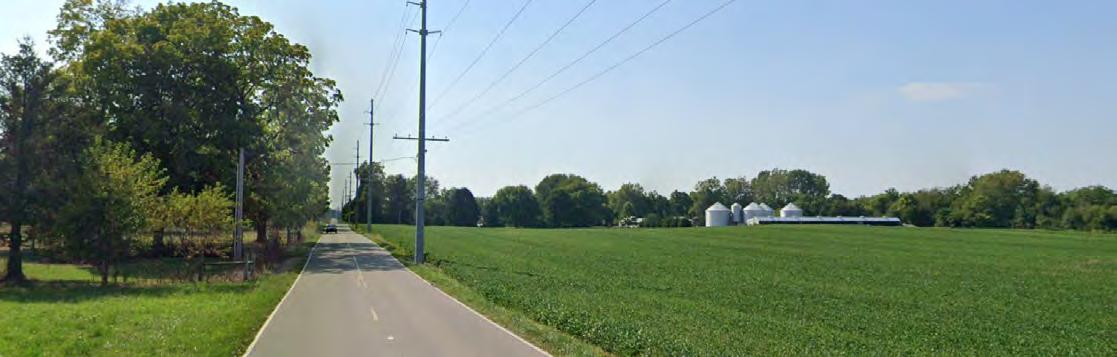
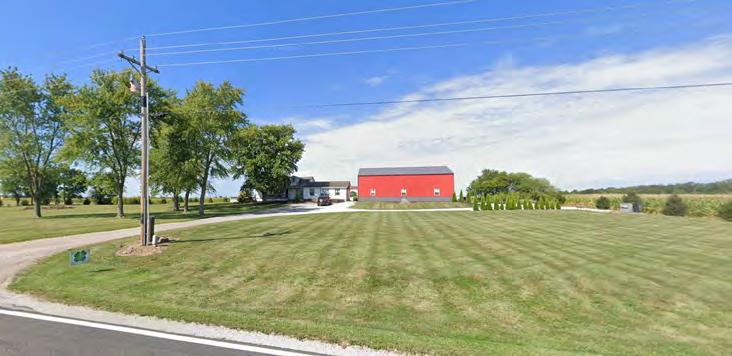
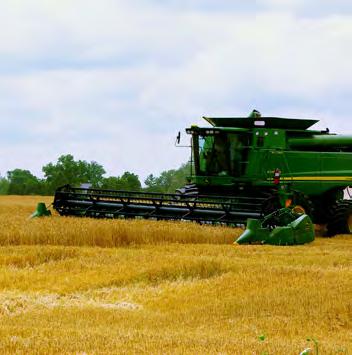
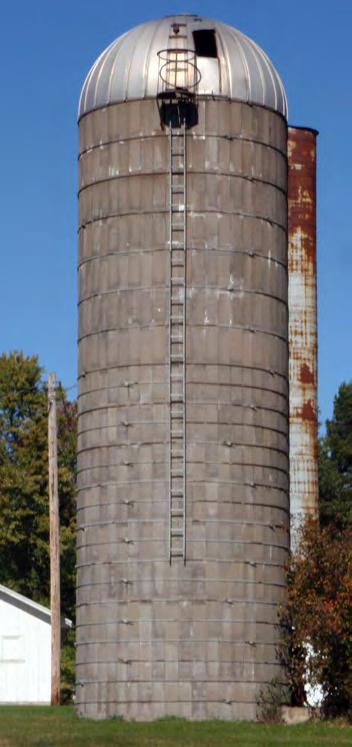
Farm vehicles and equipment are frequent users of the street network and are accommodated with wider medians on either side of the street.
5. There are opportunities for agricultural tourism, such roadside produce stands and farm tours, that encourage relationships between rural and urban areas.
Sidewalks and trails are sparse but connect to significant greenspaces and natural features.
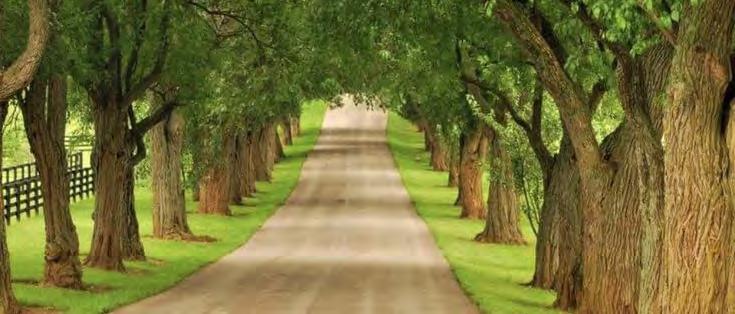
Street Network
Speed and Capacity
• Super grids are formed by county roads and laid out via the Public Land Survey System (PLSS).
• Where possible, streets should be rerouted around legal drains and other water features to reduce the number of bridges needed.
• Intersections where roads meet at an irregular angle or are unaligned with each other should be corrected and straightened when possible.
• US 40 and CR 600E are medium to high traffic streets, while all other streets medium to low traffic counts.
• Streets typically do not have the capacity for large developments.
• Most vehicular traffic should occur on two-lane, county roads.
• Stop signs are and should be present at most intersections.
• Traffic and wayfinding signage should be highly visible, being placed away from foliage that could grow and block view sights.
Vehicular
Bicycle and Pedestrian
• Where necessary, roundabout medians should have low grade separations to maintain easy mobility for farm vehicles and equipment.
• Golf carts could serve as an alternative form of transportation, preferably separated from faster-moving traffic using the wider medians on the side of the street.
• Bicycle and pedestrian infrastructure are limited due to low population density.
• Shared bike lanes (“sharrows”) are highly discouraged, and instead wider medians should be available for slower-moving bicyclists and/or golf carts from fast-moving vehicles.
While the preferred network is a ‘traditional grid,’ it is intended to mean the super grids formed by the Public Land Survey System (PLSS). Major roads, such as US 40, are shown in dark green and local county roads are shown in grey. There should be very few if any properties that are not directly connected to an existing major/county road.
Preferred Network Use limitedly Discouraged
Character
Streetside Amenities
• The transition from urban to rural is clearly felt through street design and land use, such as farmland and aboveground utility lines.
• Farm vehicles and equipment are common to see using and road and working adjacent farmland.
• Roads are usually one lane in each direction with wider medians are present on either side of the street to accommodate farm vehicles and equipment.
• Native trees and vegetation should line most major streets to both protect adjacent cropland from harsh winds and enhance the street’s aesthetic appeal.
• Streetside farm stands are encouraged as a way for people to buy fresh, local produce and develop relationships between urban and rural areas.
• Trails and sidewalks are uncommon but where present, there is a clear separation from vehicular traffic. Preferably they are located on the opposite side of drainage canals that run along the street.
Water Management
Site Design
Access
Building Placement
Amenities and Open Spaces
• Drainage canals on either side of streets are highly encouraged to reduce the likelihood that streets become impassable during major storms or inclement weather events.
Off-Street Parking
• Curb cuts for driveways are common.
• Shared drives or frontage roads are encouraged where there are clusters of buildings to reduce the number of access points, and therefore conflict points on major roads.
• Setbacks for residential buildings of 50 to 60 feet from the street centerline are common for older buildings.
• New structures should be setback at least 100 feet from the street centerline to match the character of other new buildings and reduce noise impact from vehicular traffic.
• Structures should be buffered at least 100 feet from waterways, creating riparian buffers that can improve water and soil quality.
• Maintain open space in the front of a building to preserve a feeling of openness.
• Playgrounds, greenspaces, and other outdoor recreational areas are encouraged for supporting civic and institutional uses.
• Parking should be minimized or consolidated to reduce the amount of pavement and pollutants, such as car oils that may runoff into groundwater and nearby waterways.
• Vegetative buffers and tree lines are encouraged to screen parking areas from the street’s view.
• Parking areas should be located on the side of or behind buildings to enhance a property’s curbside appeal and maintain open space in front of the building.
Landscaping
• Preservation of existing natural features including floodplains, riparian buffers, tree rows, forested areas, wetlands, waterways, and other natural features.
• Invasive plants should be removed and replaced with native plants within the riparian buffers.
• Lot splits wherein one lot retains only the riparian buffer and any other natural features like floodplain area is highly encouraged to better protect and conserve these features.
Character
Orientation
Entrances
Height
Mixed-Use
Integration
• Building materials should not stand out among the existing agricultural and natural landscape, such as by minimizing the use of bright paint colors and limiting the number of tall structures.
• Large street-facing windows are discouraged to match the existing character and reduce glares that could affect drivers.
• Buildings themselves may be oriented at certain angles; however, a reason must be given in how the orientation improves energy efficiency, including but not limited to sun direction and passive cooling techniques like natural ventilation.
• Building entrances should be oriented toward the street or a side parking area.
• Non-agricultural buildings should be limited to two stories or no taller than surroundings buildings to match the existing character.
• Agricultural uses should be the primary use for most sites; however, the recommended non-agricultural uses may take place on the same site but in separate buildings and only if they serve a supporting role.
• Where agricultural and non-agricultural uses share the same site, the non-agricultural use should be located closest to the street.
• The Lower Big Blue River Watershed is a critical component to drainage management, farmland productivity, and water quality on the eastside of Greenfield and Hancock County.
Lower Big Blue River Watershed Management Plan
Rural Preservation Strategies
• The US Environmental Protection Agency (EPA) created a restoration and management plan for the watershed in 2020, identifying Nameless Creek and Anthony Creek-Six Mile Creek as high priority areas with concerns for nutrient availability, sediment (e.g. streambank erosion), and E. coli concentrations.
• The EPA’s management plan includes over $500,000 for restoring and protecting the watershed, such as reducing the number of pollutants entering associated waterways and increasing public awareness about what individuals and communities can do to improve the health of the Lower Big Blue River Watershed.
• Since development is discouraged in this placetype, annexation is also discouraged. Hence, consider using the following strategies in conjunction with Hancock County and other regional partners:
• USDA Easement Programs (e.g. Agricultural Conservation Easements and Healthy Forest Reserves)
• Land Banking and/or Transfer of Development Rights program (TODR)
• Develop a Rural Reserve Overlay District with Hancock County
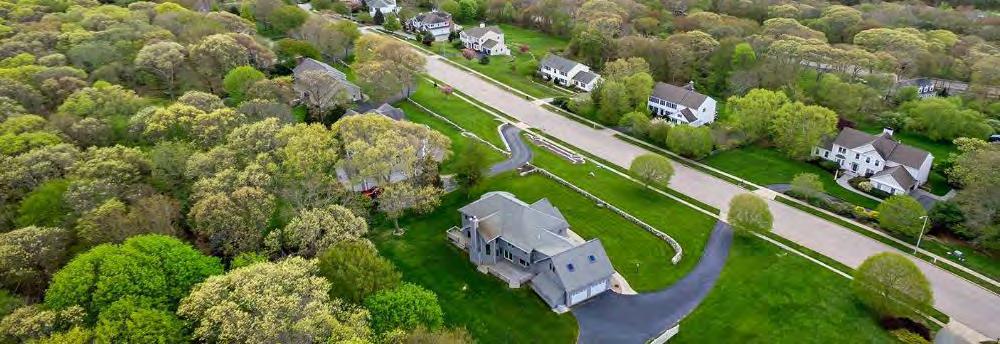
The Estate Neighborhood placetype represents the most limited and carefully managed form of development within the Planning Area. The Estate Neighborhood placetype is located sparingly throughout Greenfield and is designed to embrace rural characteristics in an environmentally responsible manner and support low-impact development. This placetype emphasizes low-intensity development designed around natural features in the land with a strong focus on preservation, privacy, and abundant open space. Most developments should feature large-lot single-family homes, accessory dwelling units, parks and common areas to maintain open space and natural features.
Construction of these developments should also have low impacts on the land, such as limited -- preferably no -- use of clear cutting, stripping of the topsoil, leveling vast areas of land, and other practices that lead to degraded land and soil health. Strict development standards ensure this area remains a low-intensity, low-density, and well-planned transitional step from urban to rural parts of the Planning Area.
1. Development is limited to detached single-family homes and accessory dwelling units (ADUs) to preserve the area’s rural and spacious character while maintaining a low-density residential focus.
2. Parks, greenways, and trails provide outdoor recreational opportunities while protecting the area’s natural beauty and environmental integrity.
3. Strict growth standards and the limited placetype boundary ensure controlled development to prevent urban sprawl and support lowimpact development.
4. Abundant open spaces create a peaceful, secluded environment for residents seeking privacy and tranquility.
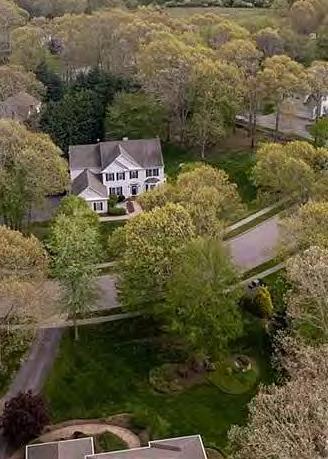
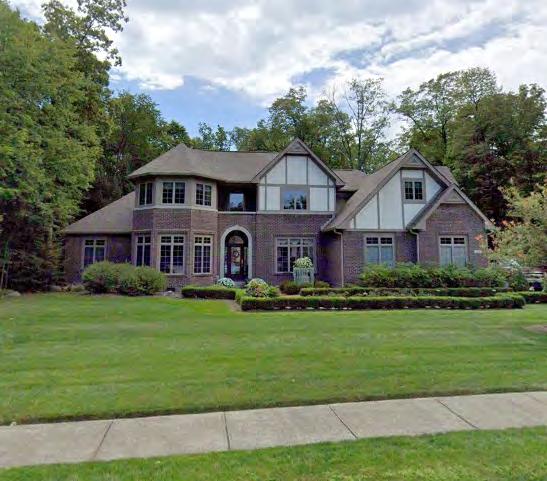
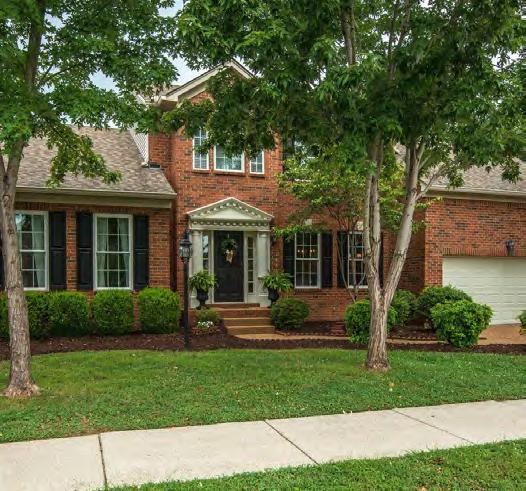
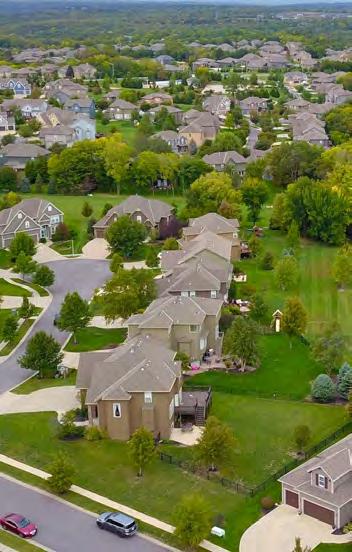
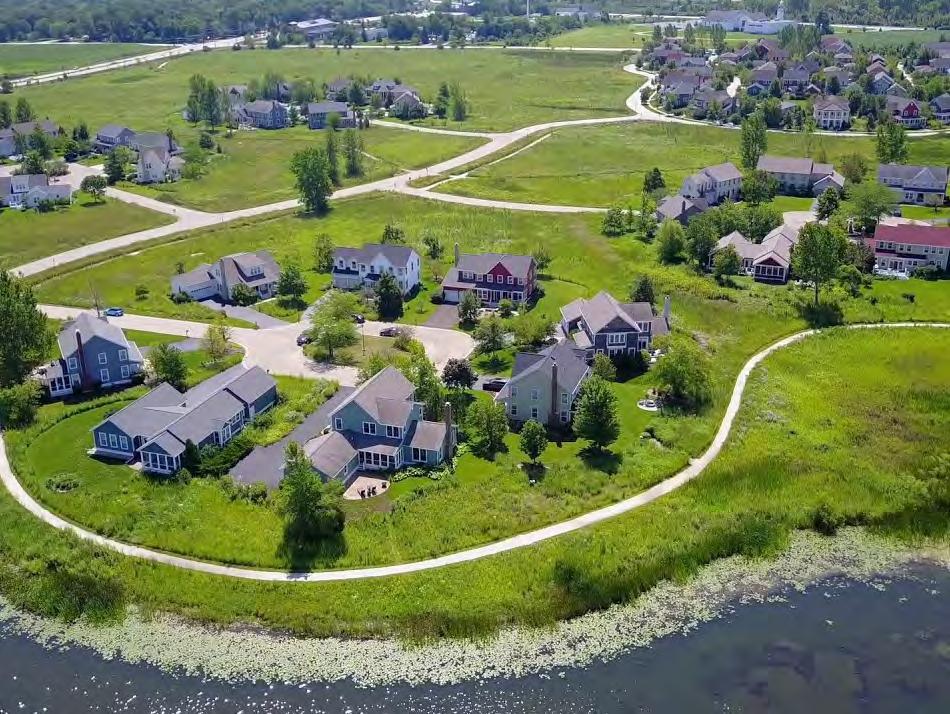
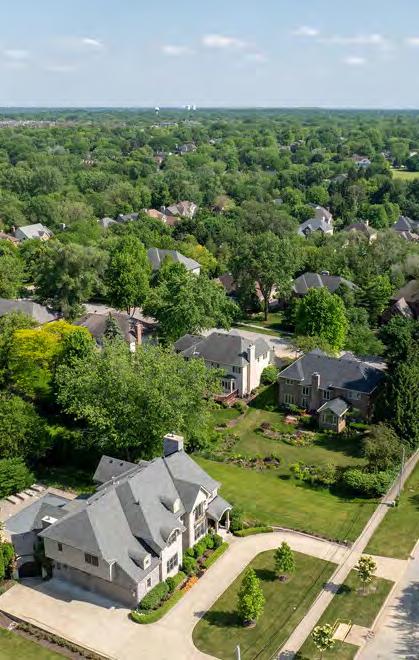
Gateways and New
= Primary Use | = Secondary Use | = Discouraged
Residential Uses*
Detached, Single-Family
Accessory Dwelling Unit
Duplex
Triplex / Fourplex
Cottage Court
Townhome
Live-Work Building
Courtyard Building
Apartment Building
Commercial Uses
Auto-Service/-Parts Dealer
Gas Station
Building/Garden Material/
Equipment Supplier
Grocery Store
Restaurant, Food and/or
Beverage Service
Drive-through Business
Retail / General Store
Indoor or Personal Storage
Recreational / Fitness
Business
Hotel or Accommodation
Professional Office
Auction Facility
Entertainment Venue
Veterinary Clinic
Kennel
Agricultural Tourism
(markets, produce stands)
All Other Commercial Uses
Industrial Uses
Artisanal/Small Workshop
Light Industrial
Heavy Industrial and/or
Manufacturing
Distribution and Warehousing
Natural Resource Extraction or Excavation
Outdoor Storage
Civic / Institutional Uses
Governmental Service
Daycare / Childcare Service
Senior Care Service
Healthcare Service
Educational Service
Place of Worship
Utility Facility Convention Center
Air Transport Facility
Ground Transport Facility
Open Spaces (besides parks) Sports Facility Conservation
Parking Lot Parking Garage Farmland
*Refer to Chaper 2: Attainable Housing for definitions.
Street Network
Speed and Capacity
• Design streets to follow natural contours and existing landscapes to minimize grading and preserve mature trees.
• Where a street grid exists, it should be maintained to support connectivity and efficient transportation.
• Curvilinear grid networks are preferred over cul-de-sacs to reduce congestion, promote walkability, and improve emergency access.
• Design streets for low-speed travel with traffic calming elements, such as narrower lanes and landscaped medians, to reinforce safety and discourage cut-through traffic.
Vehicular • Residential streets prioritize local access over through-traffic to ensure a quiet, low-speed environment.
Bicycle and Pedestrian
Character
• Install high-visibility, separated bicycle lanes along major roads to improve cyclists’ safety.
• Place signage along streets to remind drivers to share the road with cyclists and increase awareness of pedestrian and bike crossings to improve the overall safety for non-vehicular users.
Streetside Amenities
• Include five-foot (5’) sidewalks on at least one side of local streets to provide safe and comfortable pedestrian mobility.
• Install narrow travel lanes to help reduce vehicle speeds and enhance safety for pedestrians, cyclists, and wildlife.
• Plant street trees along roadways at regular intervals and establish a dense tree buffer at residences abutting I-70 to mitigate noise, improve air quality, minimize the urban heat island effect, and enhance residents’ privacy.
• Thoughtfully place elements such as benches and trash cans at key locations like parks and neighborhood gathering spaces to support walkability and enhance cleanliness.
• Use low-impact, downward-facing lighting along streets to improve safety while preventing light pollution and maintaining the neighborhood’s peaceful, rural atmosphere.
• Incorporate bioswales and vegetated ditches using native plantings into road design to manage stormwater naturally and protect groundwater quality.
Preferred Network Use limitedly Discouraged
On-Street Parking
• Permit on-street parking on one side of the street to maintain traffic flow, minimize congestion, and improve safety for cyclists.
• Parking areas are to be intermittent rather than continuous, incorporating landscaped breaks to prevent long stretches of parked cards from dominating the streetscape.
• Streets with on-street parking must include a designated travel lane and minimum clearance for cyclists to enhance safety and visibility.
• Ensure parking spaces are placed away from intersections, driveways, and pedestrian crossings to maintain clear sightlines and reduce potential conflicts.
Access
Building Placement
• Design driveways to minimize curb cuts to reduce conflicts between vehicles and pedestrians and should be positioned to minimize their visibility from the street to ensure that the home’s primary architectural features remain prominent.
• Sidewalks or trails provide continuous pedestrian access, connecting homes to parks, open spaces, and natural features.
• Setback homes from the roadway to maintain a rural aesthetic, with generous front yards to reinforce open space and privacy.
• Integrate accessory dwelling units thoughtfully to complement primary residences and fit within the neighborhood’s character.
• Parks and open spaces serve as central gathering areas, featuring natural trails, picnic areas, and seating that encourage outdoor recreation and community interaction.
Amenities and Open Spaces
• Greenways and nature trails connect homes to parks, open spaces, and natural features to enhance walkability and strengthen residents’ connection to nature.
• Community gardens are recommended as additional neighborhood amenities to support sustainability while preserving the area’s ecological integrity.
• Design driveways with minimal paving, using natural or permeable materials to reduce runoff and environmental impact.
Off-Street Parking
Landscaping
• Ensure garages and driveways are visually unobstructive and placed to the side or rear of homes rather than dominating the streetscape.
• Encourage shared driveways where feasible to reduce curb cuts and maintain a cohesive streetscape.
• Place natural buffers and hedges along property lines and adjacent to roadways to reinforce the rural feel and maintain privacy.
• Construct rain gardens to manage stormwater runoff and improve biodiversity.
• Construct fencing from natural materials, such as wood or stone, to preserve rural character.
• Use native vegetation and shade-providing trees to enhance aesthetics, support the environment, and offer privacy between homes.
Orientation
Character
Entrances
Height
• Position buildings to face streets, trails, or shared open spaces to reinforce a sense of community while maintaining privacy through setbacks and landscaping.
• Use high-quality materials and architectural details that complement the rural aesthetic and integrate natural elements to avoid stark contrasts with the landscape.
• Adopt generous front, side, and rear setbacks to provide open space between homes and ensure privacy while allowing for landscaping that enhances aesthetics and environmental resilience.
• Design front entrances to be prominent and inviting, incorporating porches, stoops, or patios to enhance the connection between homes and the streetscape.
• Structures are limited to two (2) stories to maintain the low-density, rural character of the area.
Conservation Subdivisions
• A type of residential development that devotes at least half of its potentially buildable land area to permanently protected open space, farmland, and/or natural features into one undivided parcel. Fragmentation of these areas are limited.
• Minimizes individual lot sizes while maintinaing overall density (number of homes per acre) by allowing larger building coverage of lots.
Conventional vs. Conservation Subdivision Design (Graphics by the Southeastern Wisconsin Regional Planning Commission). Learn more at https://www.sewrpc.org/Info-and-Data/Zoning-and-Ordinances
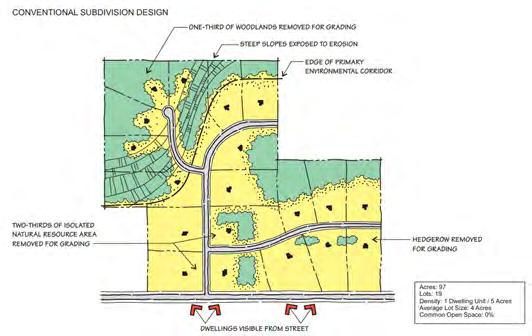
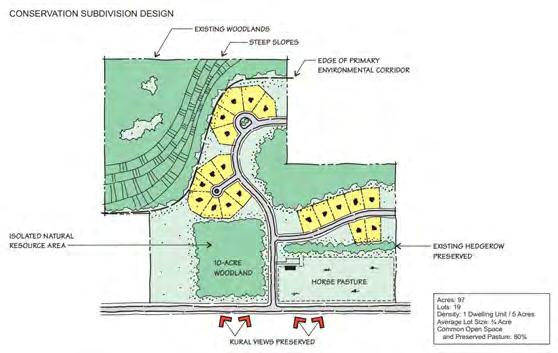
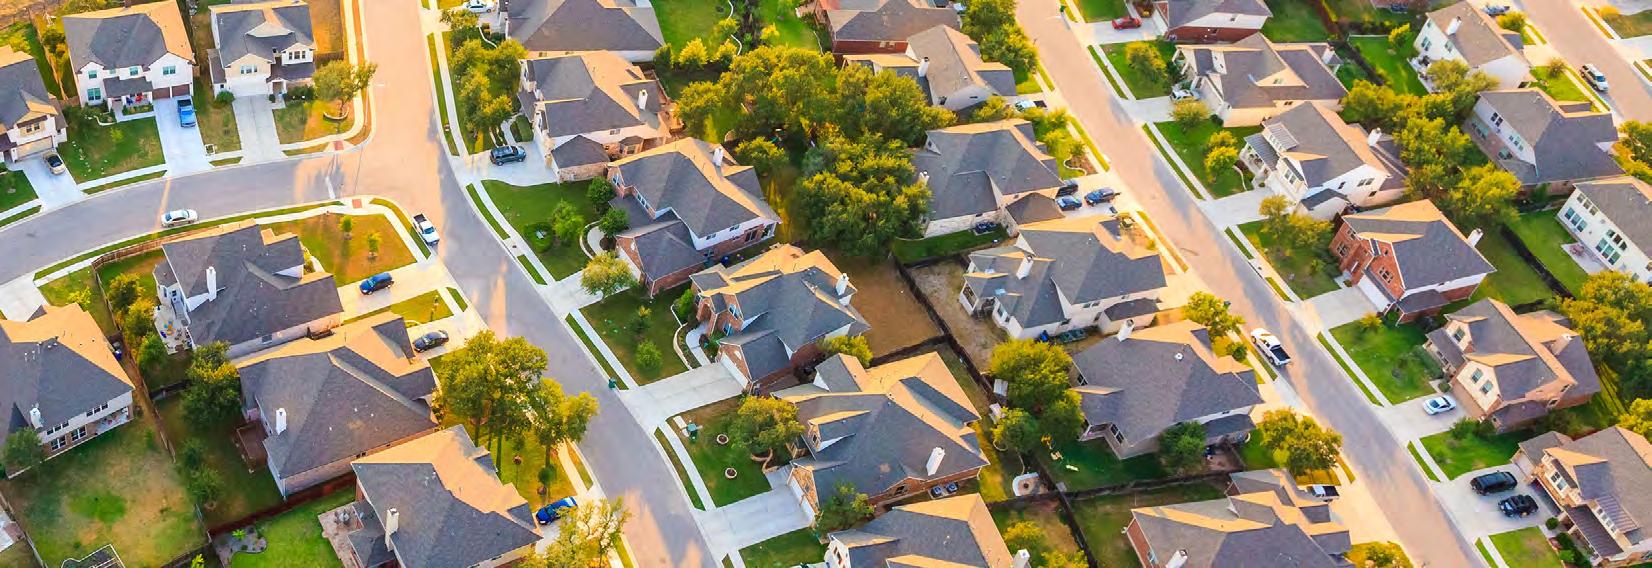
The Suburban Neighborhood placetype is a primarily residential and low-scale area intended for quiet, private living. Single-family homes are the majority of housing; however, small-scale, multi-family options are encouraged to promote housing diversity. Homes of all types should sit relatively closer to the street or sidewalks to encourage social activity. Sidewalks and a network of trails and bike paths link homes to parks and open spaces to encourage active transportation and enhance safety, particularly for children and those without vehicle access.
To support daily needs and preserve residential character, small-scale commercial uses and community-oriented services, such as corner stores, specialty shops, senior care services, or childcare services, may be conditionally permitted in this placetype. Tree-lined streets, open spaces, and other amenities foster a walkable neighborhood with high accessibility and quality of life.
1. Low-density, detached single-family homes with some moderate density housing options (e.g., duplexes) are integrated thoughtfully to maintain the neighborhood character.
2. A network of sidewalks, trails, and greenways promote walkability within and between neighborhoods, parks, and community amenities, ensuring accessibility and safety.
3. Plenty of parks, open spaces, native plantings, and tree-lined streets provide opportunities for outdoor recreation, relaxation, and community gatherings while supporting biodiversity and stormwater management, contributing to a high quality of life.
4. Strategically located small-scale commercial uses, such as corner stores or specialty grocery stores, may be present to cater to residents’ daily needs.
5. The quiet, private residential atmosphere is complemented by wellmaintained gathering spaces and facilities that foster a sense of belonging and pride.
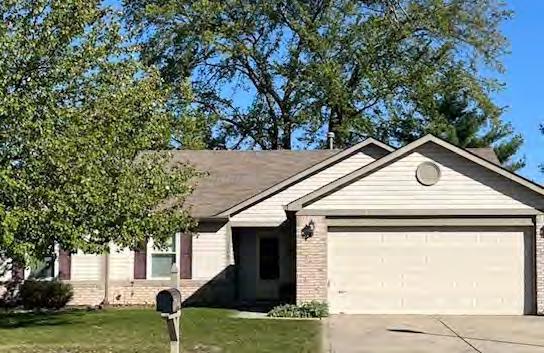
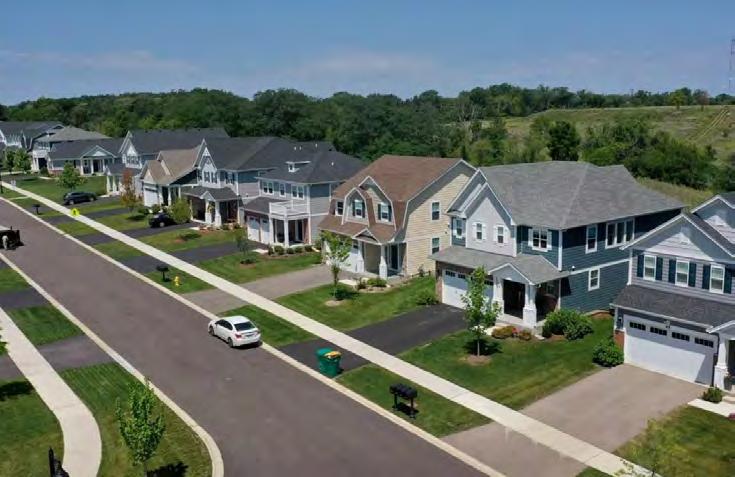
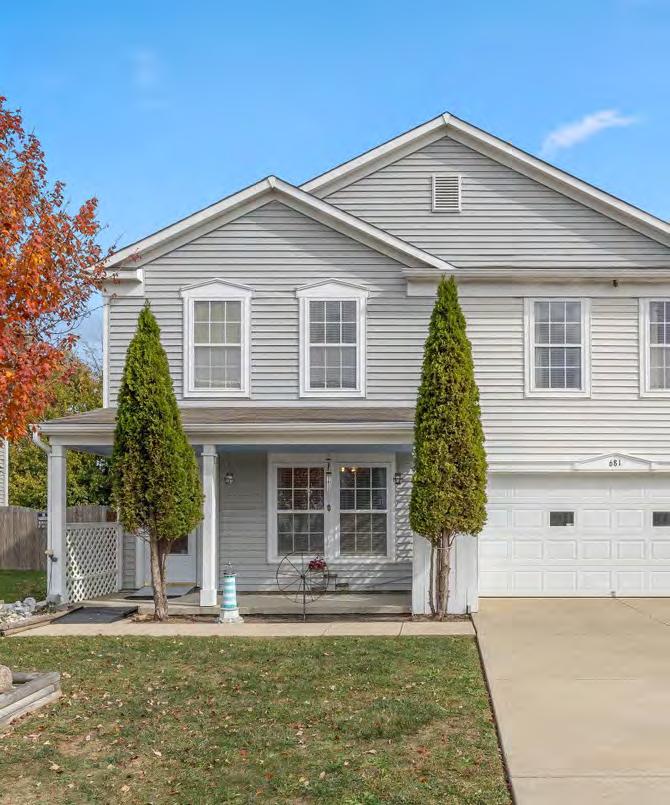
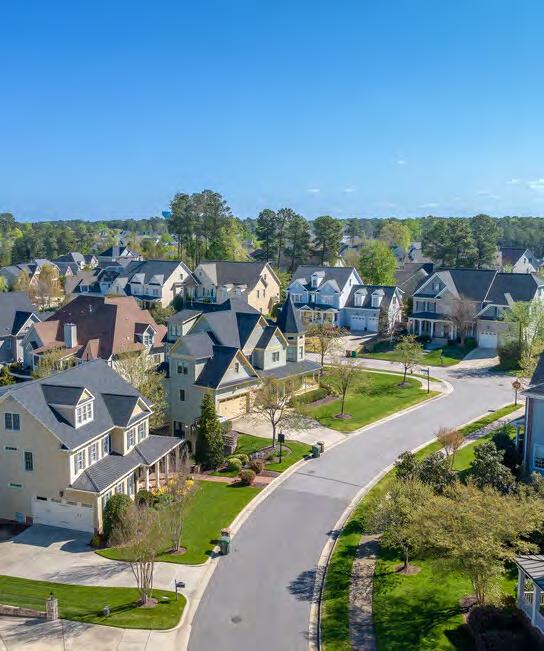
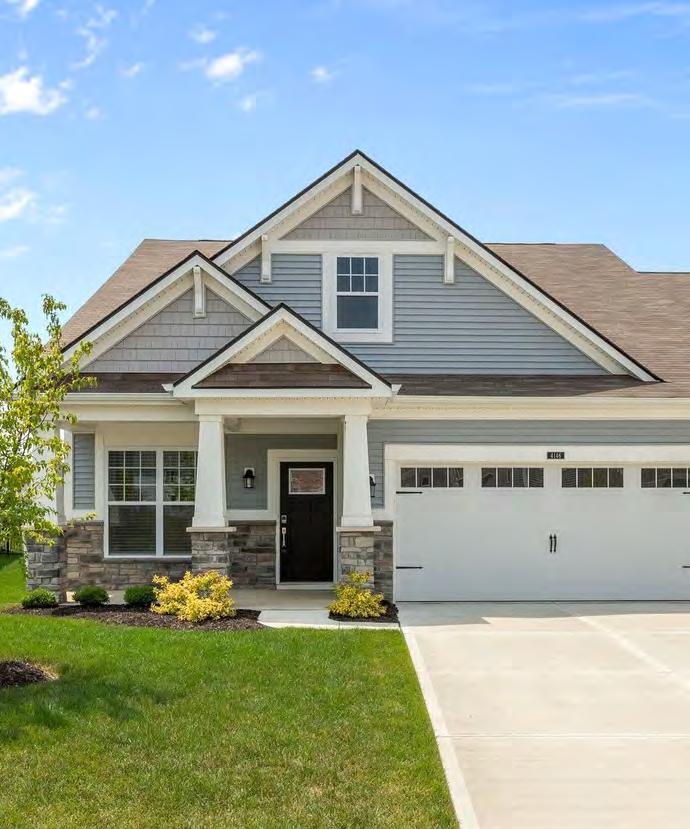
Duplex
Triplex / Fourplex
Cottage Court Townhome
Live-Work Building
Courtyard
Restaurant, Food and/or Beverage Service Only appropriate at key intersections and along major roads. Avoid large parking lots and excessive light pollution. Drive-through
Artisanal/Small
Street Network
Speed and Capacity
• Establish a well-connected street network to improve traffic flow and accessibility.
• Design streets to accommodate various users, including pedestrians and cyclists.
• Implement traffic calming measures such as speed bumps, landscaped medians, and curb extensions to enhance pedestrian safety.
• Ensure street capacity accommodates local traffic without encouraging excessive speeds.
Vehicular • Encourage alleys where possible to minimize curb cuts and maintain pedestrian safety.
• Develop a complete bike network with protected or well-marked bike lanes and station secure bike parking at key destinations.
Bicycle and Pedestrian
• Ensure sidewalk connectivity with a minimum width of 5 feet on local streets and 6 feet on major roads, incorporating planting strips for added separation from vehicular traffic.
• Install high-visibility crosswalks and pedestrian signals at major intersections and near schools, parks, and commercial areas.
• Provide accessible curb ramps and pedestrian islands where necessary to improve crossing safety.
Character
Streetside Amenities
• Provide sidewalks on both sides near parks, schools, or community centers to enhance accessibility and pedestrian safety.
• Construct narrower vehicle lanes to naturally slow traffic and improve safety for pedestrians and cyclists.
• Incorporate mid-black crossings, curb extensions, or raised intersections to further enhance pedestrian visibility and movement.
• Plant street trees at frequent intervals to offer shade, natural beauty, and improved stormwater management.
• Integrate pedestrian-scale lighting for safety and visibility, with fixtures placed at regular intervals.
• Place seating areas, benches, and pocket parks at key gathering points, such as trail connections or near small-scale commercial nodes or community services.
• Include decorative elements, such as planters, neighborhood signage, or decorative refuse bins, to enhance the suburban identity and reinforce a sense of place.
Preferred Network Use limitedly Discouraged
On-Street Parking
Site Design Access
• Place parallel parking on local streets to provide convenient residential access and naturally slow traffic.
• Integrate bump-outs between parallel parking areas to break up long parking rows, improve pedestrian crossings, and incorporate additional greenery.
• Limit on-street parking near intersections and driveways to ensure clear sightlines and enhance safety.
Building Placement
• Design continuous sidewalks to connect to adjacent properties, ensuring pedestrian accessibility across neighborhoods.
• Minimize curb cuts and strategically place them to enhance walkability and reduce vehicle conflicts at driveways and intersections.
• Clearly define sidewalk entrances to homes and separate them from driveways, where possible, to promote pedestrian safety.
• Place homes closer to the street to create a more engaging streetscape and improve pedestrian interaction.
• Maintain a consistent front setback with neighboring structures, while rear setbacks may vary.
• Place moderate-density housing along major corridors or as a buffer between high-density and low-density areas.
• Include parks, open spaces, or shared gathering areas in each neighborhood to support recreation and community engagement.
Amenities and Open Spaces
Off-Street Parking
• Integrate public art, benches, water features, and shaded seating areas to enhance the character of open spaces.
• Incorporate green infrastructure, such as rain gardens and permeable surfaces, into common spaces to manage stormwater naturally.
• Limit driveways in width to preserve green space and avoid excessive hardscaping.
• Consider shared driveways between neighboring homes, separated by vegetative medians to improve stormwater management and limit excessive pavement.
• Locate parking areas to the side or rear of buildings rather than in front yards to maintain an attractive streetscape.
• Use tree canopies and shade landscaping to enhance aesthetics, reduce urban heat, and improve comfort in outdoor areas.
Landscaping
• Plant native and drought-resistant vegetation to reduce maintenance needs and enhance environmental benefits.
• Integrate retention ponds and bioswales into developments to improve drainage and reduce flooding risks.
• Ensure building designs respect neighborhood context by using materials and architectural styles that fit the surrounding homes.
• Use varied window placements and facades to avoid monotony and enhance visual interest.
• Encourage architectural diversity, incorporating different rooflines, exterior finishes, and detailing to create a cohesive yet dynamic neighborhood aesthetic.
Character
Orientation
Entrances
Height
• Encourage energy-efficient features, such as solar panels, green roofs, and high-performance windows, in new home construction.
• Design outdoor living spaces, such as balconies, patios, and front porches, to enhance social interaction and promote community engagement.
• Use decorative fencing and landscaping for privacy while maintaining an open and welcoming character.
• Orient front doors toward the street to encourage a welcoming and active streetscape.
• Include covered porches, stoops, or entryways to provide shelter and add character to homes.
• Ensure entryways are well-lit and easily identifiable to improve visibility and security.
• Buildings should not exceed two (2) stories to maintain the low-density, suburban character of the area.
• Consider height transitions between different placetypes to ensure compatibility with adjacent uses.
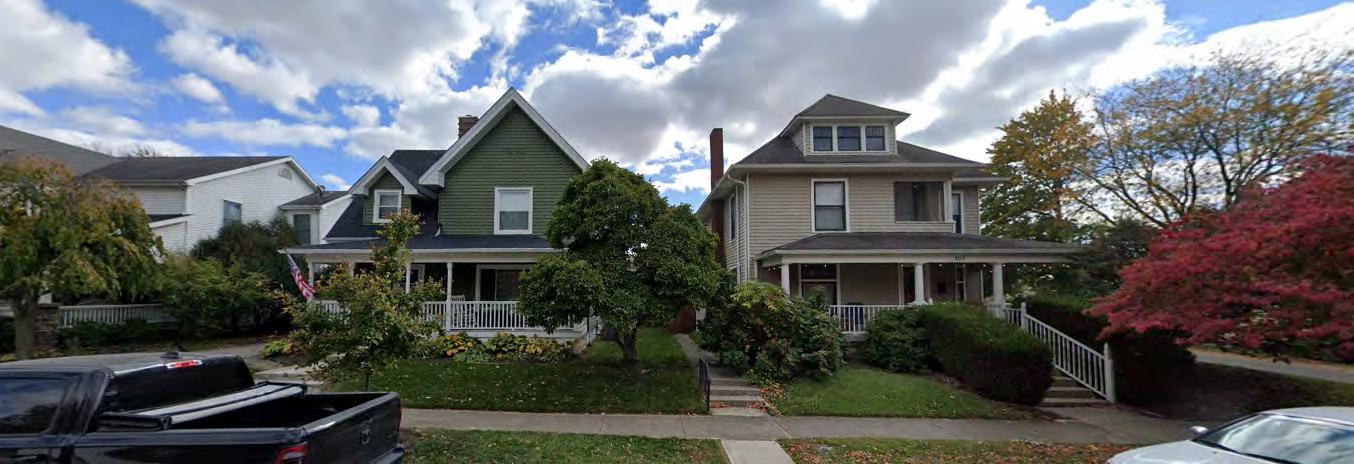
Mixed Residential Neighborhoods serve as a blend semi-urban and suburban-style development, providing housing options and amenities, such as shops and open spaces, in a walkable setting though residential uses should remain the majority of development. A semi-gridded street network is encouraged, and new neighborhoods should be developed around focal points like a park or a neighborhood center with retail and/or offices. The walkable streets, desirable shops, and gathering spaces attract young professionals, young families, and families wanting to downsize (either because their kids have moved out, they no longer need as much space, or something else) to continue living in Greenfield. Higher residential densities are encouraged closer to shops and amenities, ensuring a gradual transition to lower residential densities.
Secondary uses such as schools and small-scale businesses provide essential services. Creative and leisure-oriented uses, including artisanal workshops, recreation, and agricultural tourism, are also encouraged to contribute to the local economy and enhancing community life.
1. A mix of housing types, from single-family detached homes to multifamily developments, accommodate various needs and ensure compatibility with surrounding development.
2. Community-oriented and essential services like schools, parks, places of worship, and senior care facilities foster a sense of community and improve residents’ quality of life.
3. Small-scale businesses, such as grocery stores, restaurants, and personal services, are strategically located along major intersections and key corridors to provide residents with daily necessities while preserving the area’s residential character.
4. Artisanal workshops, agricultural tourism, and recreational and entertainment uses diversify land use and strengthen the local economy, provided they remain compatible with the surrounding area.
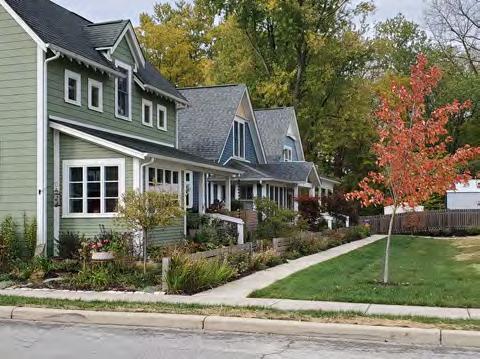
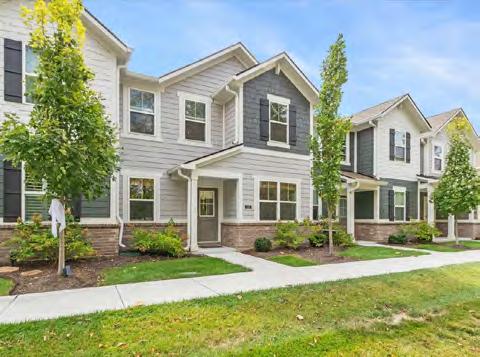
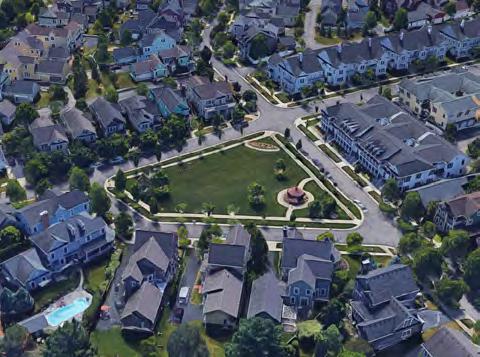
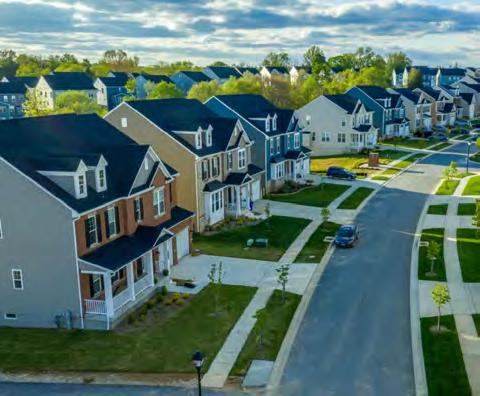
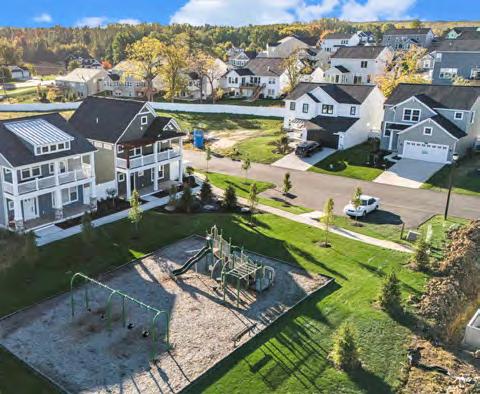
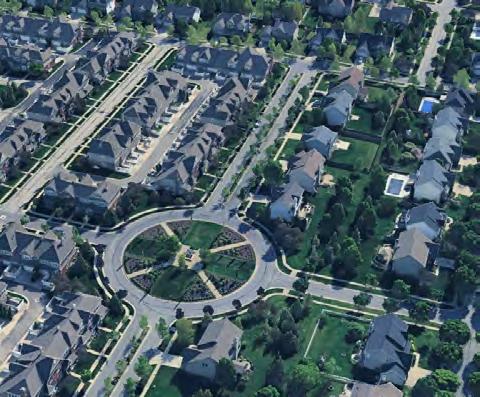
5. Safe and well-designed bicycle and pedestrian infrastructure connects homes to commercial nodes, institutional uses, and surrounding placetypes. Features like high-visibility crossing and signalized intersections encourage active transportation.
6. Environmentally conscious practices, such as water-efficient landscaping, native plantings, and sustainable stormwater management systems, strengthen environmental resilience while reducing infrastructure demands.
= Primary Use | = Secondary Use | = Discouraged
Residential Uses*
Detached, Single-Family
Accessory Dwelling Unit
Duplex
Triplex / Fourplex
Cottage Court
Townhome
Live-Work Building
(markets, produce stands)
Artisanal/Small Workshop Light Industrial Heavy Industrial and/or

Apartment Building
Courtyard Building Should have a central greenspaces. Buffer from lower-density residences.
Auto-Service/-Parts Dealer
Extraction
Gas Station Only appropriate at key intersections.
Building/Garden Material/
Equipment Supplier
Grocery Store
Restaurants, Food and/or
Beverage Service
Drive-through Business
Retail / General Store
Small-scale stores only.
Should not disrupt pedestrian and bicycle circulation. Drive-throughs to be located behind buildings or screened to minimize visual impact.
Indoor or Personal Storage
Storage units should be enclosed within a building and integrated within a mixed-use development. Exterior architectural should match the surrounding character.
Recreational / Fitness
Business
Hotel or Accommodation
Professional Office
Auction Facility
Entertainment Venue
Small-scale only. Appropriate only along major roads, bufferred from residences.
Small-scale only. Preferred as live-work building.

High-quality landscaping and extra screening/buffering from residences.
Only allowed as integrated into and wrapped by a mixed-use development. Farmland
*Refer to Chaper 2: Attainable Housing for definitions.
Speed and Capacity
• Design streets with a hierarchy that accommodates various transportation modes, from cars to bicycles and pedestrians.
• Form a grid-like network to promote connectivity and minimize dead-end streets.
• Connect major roads to surrounding areas and ensure smooth transport, with consideration for both local access and through traffic.
• Keep traffic speeds low in residential areas and moderate along major corridors to enhance safety and promote walking and cycling.
• Incorporate traffic calming elements, such as curb extensions and raised crosswalks, into the street network to slow down vehicles and create a safer environment for pedestrians.
• Design streets with appropriate capacity to support the local population without contributing to congestion or compromising the residential character of the area.
• Ensure vehicular movement prioritizes ease of movement while minimizing disruptions to the pedestrian and bicycle network.
Vehicular
Bicycle and Pedestrian
• Construct streets with traffic calming features, such as narrower lanes, speed tables, or landscaped medians, to promote safe driving speeds.
• Design key intersections to accommodate both vehicular and pedestrian traffic, with clearly marked crosswalks and pedestrian islands.
• Construct streets to include well-defined pedestrian pathways, with sidewalks that are wide enough to accommodate a variety of users.
• Protect sidewalks from vehicular traffic by using landscaping, trees, or low fences where possible.
• Integrate bicycle infrastructure, including protected or well-marked bike lanes and bike racks, into the street design to support alternative transportation methods.
• Connect bike lanes to key destinations like parks, schools, and commercial nodes.
Character
Streetside
Amenities
• Design narrower vehicle lanes to slow speeds and pedestrian safety.
• Install sidewalks on at least one side of the road in residential areas, with wider paths and sidewalks on both sides of the street in high-density areas.
• Incorporate public art, decorative elements, and painted crosswalks in public areas to reinforce community identity.
• Plant street trees at regular intervals for shade and pedestrian comfort.
• Place banners, pedestrian-scale lighting, and benches to enhance the public realm.
• Install bike racks, planter boxes, and waste bins in key locations.
• Use bioswales, rain gardens, and permeable pavers to manage stormwater naturally.
• Integrate green infrastructure into medians and streetside areas to enhance environmental benefits and beautify the area.
• Establish parallel parking along neighborhood and collector streets with landscaped medians are encouraged to break up long parking rows.
On-Street Parking
• Position bump-outs strategically to enhance pedestrian safety.
• Install angled or vertical parking near mixed-use areas to support businesses.
Access
• Ensure continuous sidewalks throughout the placetype to ensure pedestrian connectivity and encourage walking as a primary mode of transportation within neighborhoods.
• Limit the number of curb cuts along streets to minimize disruptions to the pedestrian and cyclist flow. When curb cuts are necessary, they should be well-marked and aligned with crosswalks for safety.
• Ensure sidewalk entrances to residential developments and commercial buildings are clearly defined and easily accessible to provide direct access from the street to building entrances.
• Place buildings strategically to maintain continuity of the street frontage and encourage active street life.
• Position residential buildings to face streets with low setbacks that enhance community interaction and neighborhood atmosphere.
Building Placement
Amenities and
Open Spaces
• Locate higher-density buildings, such as multi-family units, closer to key intersections or adjacent to areas with commercial uses to create a vibrant, mixed-use environment.
• Buildings should be compatible with the landscape, preserving views of agricultural land and other natural features wherever possible.
• Integrate public amenities such as parks, playgrounds, and small plazas into the design to provide communal spaces that encourage social interaction and outdoor activities.
• Design open spaces to serve as focal points for the neighborhood, offering seating areas, walking paths, and opportunities for leisure activities such as recreation or agricultural tourism.
• Use landscaping and public art to enhance the character of open spaces, contributing to both aesthetic appeal and functionality.
• Locate off-street parking areas behind or to the side of buildings to minimize visual impact from the street and screen with landscaping or low fencing made of wood or stone to ensure they do not dominate the streetscape.
Off-Street Parking
Landscaping
• Include vegetative medians, tree islands, and other green infrastructure into parking areas to improve aesthetics and reduce stormwater runoff.
• Prioritize shared parking areas, particularly in mixed-use developments, to reduce the overall parking footprint and enhance pedestrian-friendly design.
• Prioritize native vegetation, shade trees, and green infrastructure to enhance neighborhood aesthetics while contributing to environmental stewardship.
• Screen service areas, such as parking lots or dumpsters, through landscaping, fencing, or walls to maintain the residential character and prevent these areas from becoming eyesores.
• Construct buildings with architectural elements that complement the surrounding area, using materials and colors that blend with the semi-rural and suburban aesthetic of the neighborhood.
Character
Orientation
• Integrate large windows and porches to engage with the streetscape and encourage interaction between residents and the community.
• Incorporate features such as pitched roofs, varied facades, and recessed entryways to encourage housing diversity.
• Orient buildings to face the street to strengthen the street’s continuity, improve the neighborhood’s walkability, encourage social interaction, and help create a sense of place.
• For mixed-use or multi-family developments, the design should prioritize street-facing entrances to improve neighborhood engagement and pedestrian traffic.
• Locate entrances at the front of buildings, ideally facing the street, to maintain a pedestrian-oriented environment. Primary entrances should be clearly marked, with lighting and signage that promotes safety and visibility.
Entrances
Height
• Ensure ground-floor residential units and commercial spaces have direct access to the street to strengthen interactions with the public and enhance the neighborhood’s vibrancy.
• Buildings should generally not exceed two (2) stories to maintain a scale that is compatible with surrounding areas.
• Taller structures may be permitted near major intersections or adjacent to higher-density areas, but they should be designed to transition smoothly into lower-density areas.
• Increased building heights should incorporate elements that ensure that the transition from higher to lower development intensities is gradual.
• In areas where Mixed Residential Neighborhoods are already established, vacant properties or land with inactive uses, such as empty lots or surface parking, offer opportunities for new multi-family or mixed-use developments.
• When redeveloping land outside of the downtown area, it’s important to concentrate the building density in certain parts of a larger site. This will allow for more open space, create a variety of uses, such as placing commercial businesses closer to where people live, and improve the flow of traffic and pedestrians within the area and to nearby places.
• If redevelopment takes place, it should prioritize affordable housing and a variety of housing options to ensure that current residents are not displaced and all community members can find a place to live.
This page is intentionally left blank.
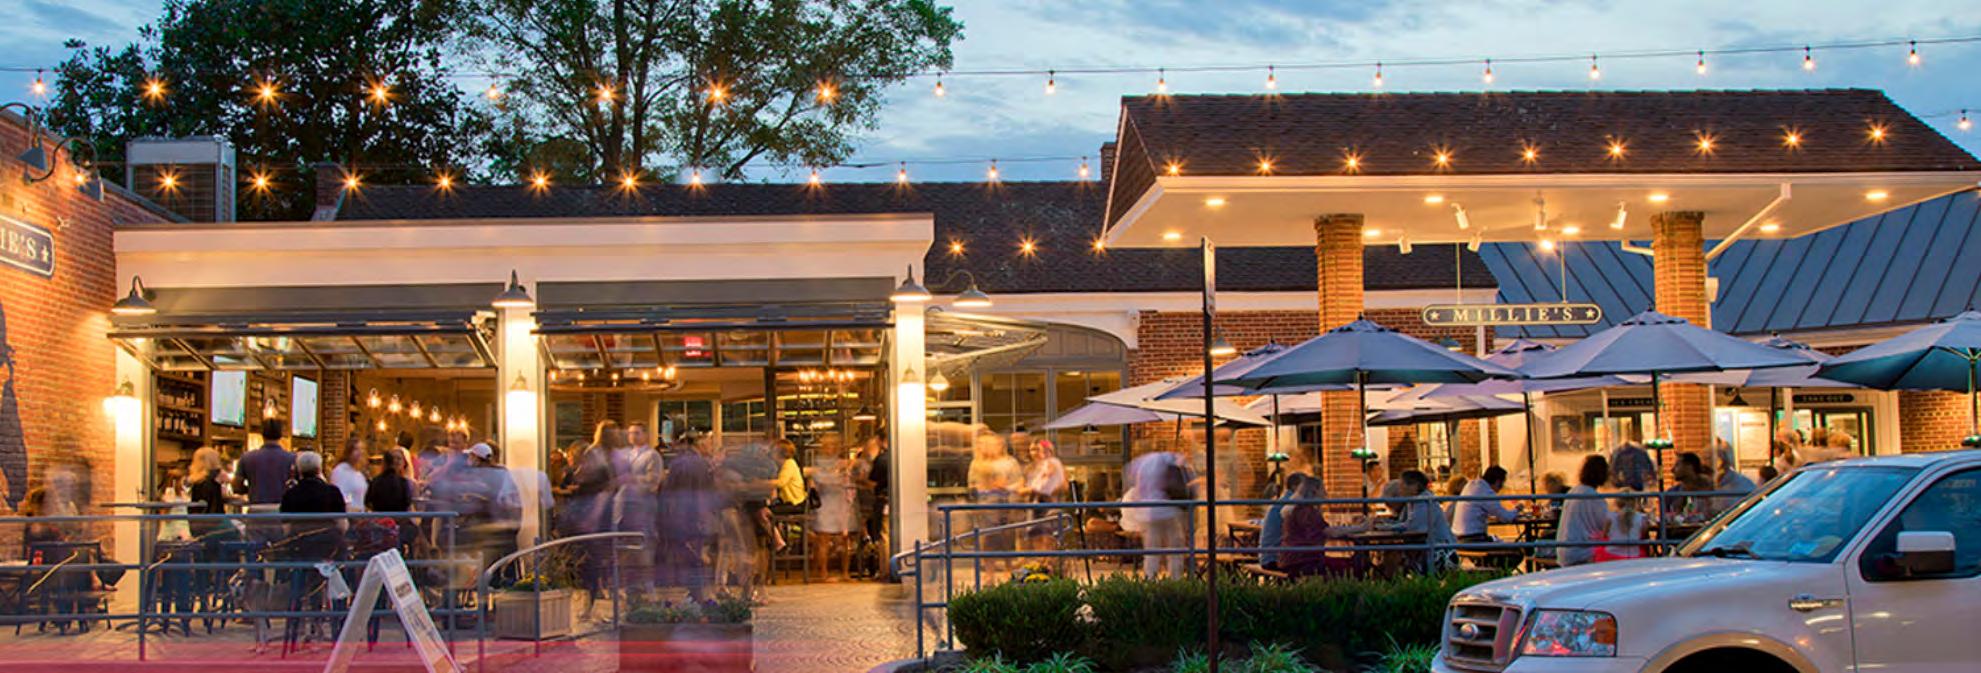
The Neighborhood Center serves as a vibrant commercial and civic hub for community activities, offering a mix of residential, commercial, and institutional uses in a compact and walkable setting. This placetype is typically located at key intersections and provides convenient access to goods, services, and gathering spaces for nearby neighborhoods and visitors. Pedestrian and cycling infrastructure enhance connectivity to the rest of the community, especially downtown Greenfield, through wayfinding signage and safe streets.
The Neighborhood Center should support the daily needs of nearby residents and foster social interaction between several surrounding neighborhoods. Centers should accommodate retail shops, restaurants, grocery stores, and professional offices alongside public spaces like parks and plazas. Institutional uses such as schools, childcare centers, and places of worship contribute to community life, education, and civic engagement.
By integrating a diverse mix of uses, this placetype strengthens neighborhood identity, encourages economic activity, and promotes longterm sustainable growth.
1. Neighborhood Centers are mixed-use hubs that integrate residential, commercial, and civic uses in a compact, walkable environment.
2. A variety of housing types are integrated into the neighborhood.
3. Essential businesses like grocery stores, restaurants, retail shops, and professional offices are strategically placed to meet the daily needs of residents and support economic vitality.
4. Civic and institutional uses, including parks, childcare services, and senior care facilities, contribute to the neighborhood’s social and cultural fabric. These spaces foster a sense of belonging, encourage gathering, and support recreational opportunities.
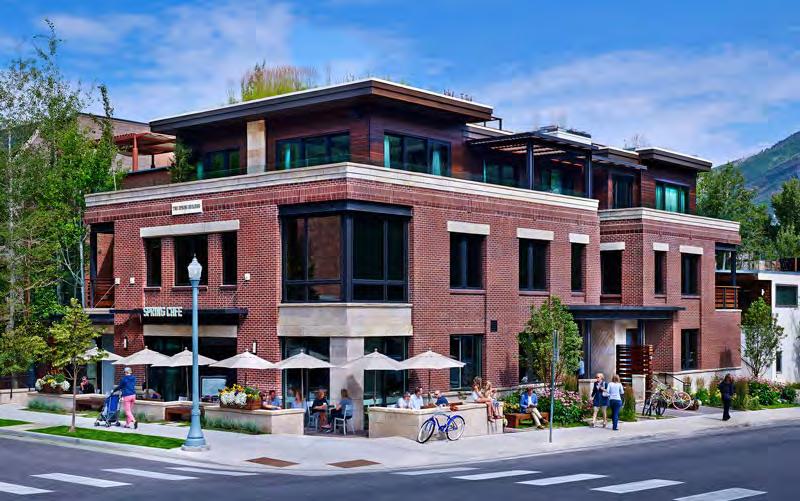
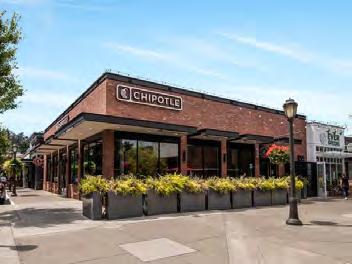
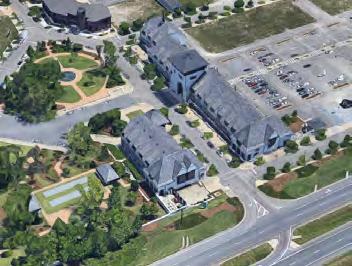
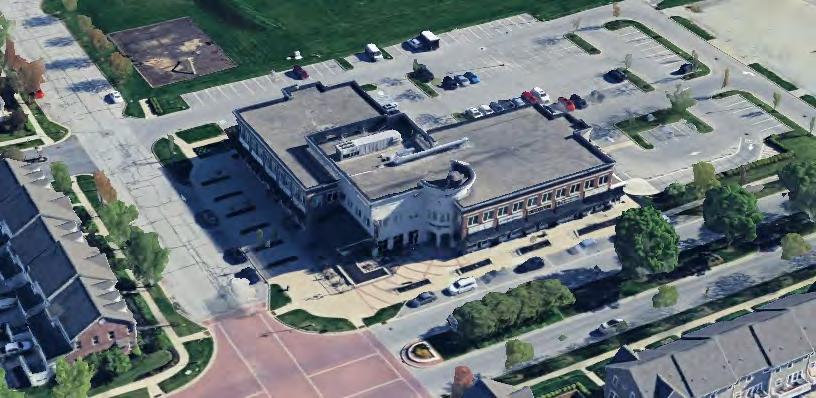
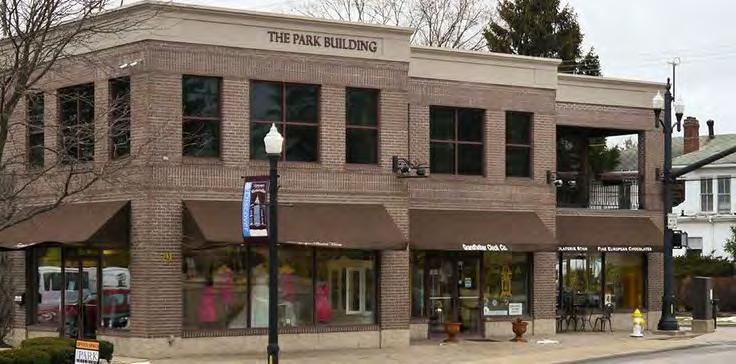
5. Comprehensive cycling and pedestrian infrastructure ensure safe and efficient connections between homes, businesses, and civic spaces.
6. Public space features, such as wide sidewalks, shaded seating, and bicycle racks, encourage active transportation and reduce dependency on cars within the placetype.
7. Higher-density development with a human-scale environment. Buildings typically feature active ground floor uses with upper-story residences or offices, ensuring efficient land use while preserving a communityfocused atmosphere.
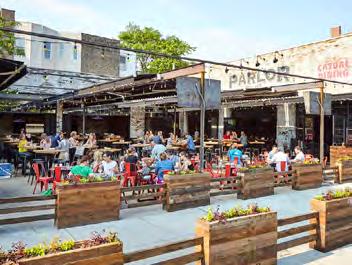
Residential Uses*
Detached, Single-Family
Accessory Dwelling Unit
Duplex
Triplex / Fourplex
Cottage Court
Townhome
Live-Work Building
Courtyard Building
Grocery Store
Restaurants, Food and/or Beverage Service
Small- to medium-scale buildings only. Big box stores are not appropriate.
Drive-through Business
Place drive-through lane at the rear or side of building. Maintain activate street-facing facades. Retail /
Indoor
Small-scale inns or boutique hotels designed at a neighborhood scale only. Large hotels are not appropriate. Professional
Small-scale only. Late-night venues are not appropriate.
Agricultural Tourism (markets, produce stands)
Shops that connect residents with local farmers and produce are highly encouraged. All Other Commercial Uses
Artisanal/Small Workshop
Light Industrial
Heavy Industrial and/or
Manufacturing
Childcare

Healthcare Service Small-scale only. No large hospitals.
Educational Service Small-scale only. No large campuses. Place of Worship Small-scale only. No large campuses.
Street Network
Speed and Capacity
Vehicular
Bicycle and Pedestrian
• Streets should prioritize connectivity and accessibility, with a well-defined grid or modified grid pattern that facilitates movement within the area and to surrounding placetypes.
• Block lengths should be short to support walkability and encourage active street life.
• Ensure traffic speeds remain moderate to low, with strategies that prioritize safety and multimodal access.
• Employ narrower turn radiuses at key intersections that slow vehicular turning to maintain a safe pedestrian environment.
• Minimize driveways and curb cuts to reduce conflicts between pedestrians and vehicles and maintain a continuous sidewalk.
• Incorporate curb bump-outs and pedestrian islands at pedestrian crossings to reduce crossing distances and improve safety.
• Clearly mark major intersections at pedestrian crossings with signalized or raised crosswalks for safety.
• Place wide sidewalks on both sides of the street and ensure they are continuous, incorporating streetscape elements, such as trees, lighting, and benches, to enhance the pedestrian experience.
• Implement separated bike lanes where feasible. Where space is limited, use high-visibility marked bike lanes to ensure cyclists’ safety.
• Strategically place bicycle parking and bike-share stations near commercial destinations, transit stops, and public spaces to encourage active transportation.
Character
• Design streets to prioritize pedestrian and cyclist safety through narrower vehicle lanes and traffic-calming measures such as curb extensions and high-visibility crosswalks.
• Install wide sidewalks (minimum 6-8 feet) to accommodate high foot traffic and outdoor seating.
• Activate public spaces with art, murals, planters, and decorative paving to create an inviting and vibrant atmosphere.
Streetside
Amenities
On-Street Parking
Site Design
Access
Building Placement
• Plant street trees at regular intervals to provide shade and enhance walkability.
• Place pedestrian-scale lighting to improve safety and create a welcoming environment, with banners used to reinforce district identity.
• Position benches, trash cans, bike racks, and wayfinding signage at convenient locations to support a comfortable and navigable environment.
• Encourage parallel on-street parking with bump-outs at intersections to shorten pedestrian crossings and improve visibility.
• Where space allows, consider angled parking on lower-speed streets to enhance parking availability.
• Encourage shared parking strategies, such as time-limited or designated spaces for businesses and residents.
Amenities and Open Spaces
• Encourage seamless pedestrian connectivity through continuous sidewalks connecting buildings, streets, and adjacent properties.
• Minimize the number of curb cuts and strategically place them to reduce conflicts between pedestrians and vehicles.
• Place buildings close to the street to support a compact, pedestrian-friendly atmosphere.
• Where possible, ensure mixed-use buildings maintain attractive façades from all vantage points.
• Encourage transitions to adjacent residential areas to use enhanced setbacks, landscaped buffers, and step-down building heights to minimize impacts.
• Have small plazas, pocket parks, and gathering spaces serve as community focal points.
• Integrate outdoor dining areas, small green spaces, and public seating into commercial and mixed-use developments.
• Use public art, wayfinding, and cultural features to strengthen the identity and vibrancy of the area.
• Locate off-street parking behind or to the side of buildings to reduce the visual dominance of parking areas.
Off-Street Parking
Landscaping
• Incorporate tree islands, vegetative medians, and bioswales into parking lots to provide shade, enhance aesthetics, and improve stormwater management.
• Encourage shared parking agreements to reduce excessive surface parking and improve land efficiency.
• Off-street parking should be accessed via alleys or secondary streets to reduce disruptions along primary corridors.
• Employ landscaping to enhance compatibility between different land uses and provide screening for parking, utility areas, and service zones.
• Incorporate native plants into developments to promote sustainability and reduce maintenance needs.
• Integrate permeable pavement and bioswales to improve stormwater management and reduce runoff.
• Incorporate street trees and landscaped planters to reduce runoff.
• Add green infrastructure solutions, such as bioswales, rain gardens, and permeable pavements, to help manage stormwater and improve the streetscape.
• Encourage active frontages by incorporating transparent windows at street level for commercial and public uses.
• Commercial buildings adjacent to residential areas should relate in scale and proportion to ensure compatibility.
• Promote mixed-use development, with upper floors allowed for residential spaces about ground-floor commercial or public use.
Character
• Encourage architectural features, such as varying rooflines and stepped façades, to create a more visually interesting streetscape.
• Fire escapes may be added to existing buildings when no other evacuation options exist. Rear or side façades are preferred, and placement must be approved by the Fire Chief.
• Orient buildings toward the street to reinforce a continuous and engaging street wall.
Orientation
Entrances
Height
• Permit zero side setbacks to create a seamless environment; modest front setbacks may allow for outdoor seating, landscaping, and wider sidewalks.
• Use rear setbacks for parking and service access to maintain a pedestrian-focused frontage.
• Primary building entrances should face the sidewalk and street to ensure direct and visible access for pedestrians.
• Clearly mark side entrances with architectural features, awnings, canopies, or lighting for visibility.
• Utilize space between the sidewalk and the building front with seating or active open space to activate the streetscape.
• Buildings may not exceed three (3) stories to maintain appropriate density while respecting existing buildings and residential areas.
• Encourage varied building heights within three (3) stories to create visual interest and break up monotony.
New Parks
Placetype
• Where there is a New Park and a Neighborhood Center recommended on the Future Development Map, the Neighborhood Center should include a relatively larger open space and/or greenspace as the central orienting feature. Development should hence radiate out from the open/greenspace.
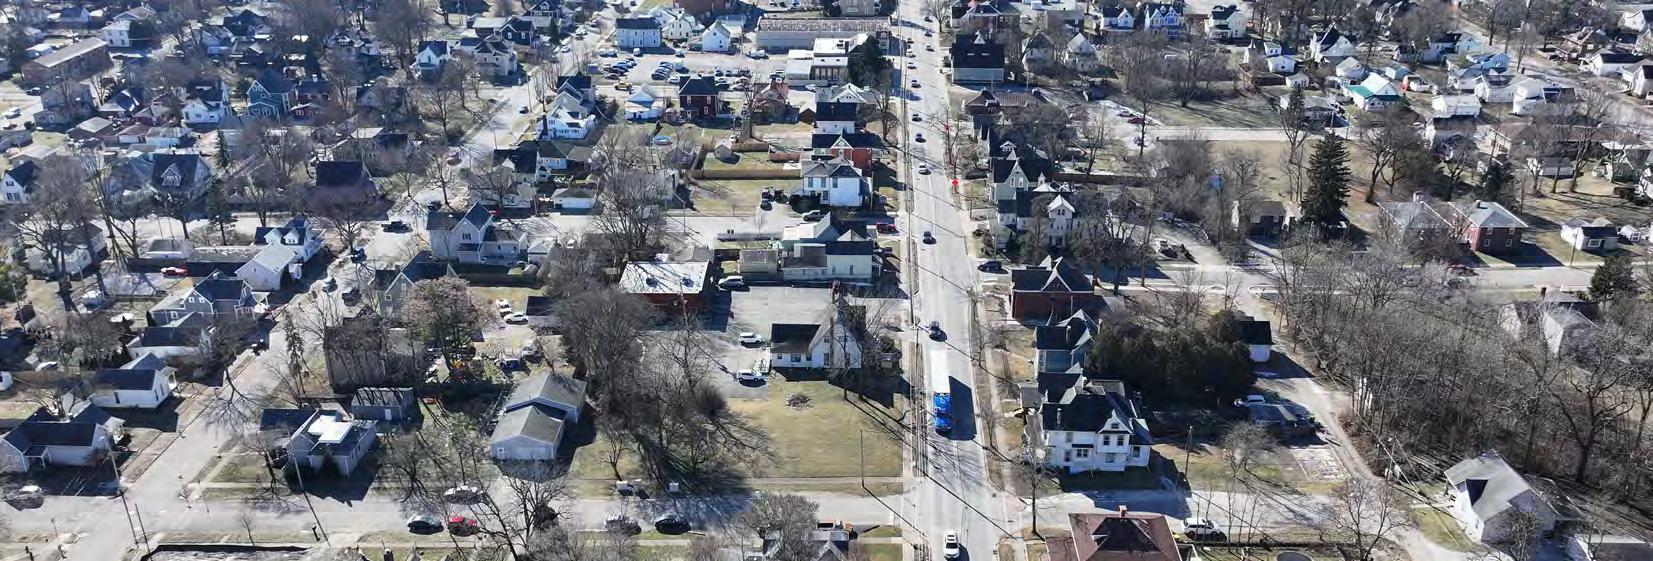
The Core Neighborhood features a diverse mix of housing types, ranging from historic single-family homes and townhomes to low-rise apartment buildings like small courtyard buildings. Many of these structures date back several decades, reflecting architectural styles from various eras. Housing density tends to be higher than in suburban areas, with residences often built closer together and closer to the street. This variety in housing accommodates a range of lifestyles and residents, including long-time homeowners, renters, and newcomers drawn to the area’s more urban character.
Land use in these neighborhoods is mostly residential but interspersed with commercial and institutional buildings, coexisting in close proximity to one another. Corner stores, cafes, and restaurants line major streets, while schools, churches, and community centers serve as neighborhood landmarks. The street network is laid out in a grid pattern, promoting walkability by providing multiple route options to be taken to other parts of the neighborhood and downtown. Narrow streets, alleys, and smaller block
lengths encourage pedestrian activity and create a more intimate, humanscale environment with a reduced dependence on private vehicles for transportation. The grid network fosters social connection through informal interactions as a result of more people walking and biking to nearby shops and services, contributing to the neighborhood’s vibrant and dynamic atmosphere.
1. Developments are alley-loaded.
2. Buildings reflect a range of architectural styles from different eras.
3. Traditional street grid with great connections downtown.
4. Mix of housing options and opportunities for infill development such as accessory dwelling units.
5. Buildings are built close to the street and to each other, with front porches to promote spontaneous social interactions.
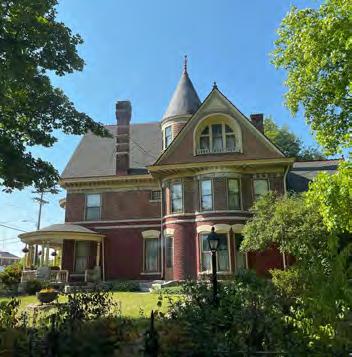
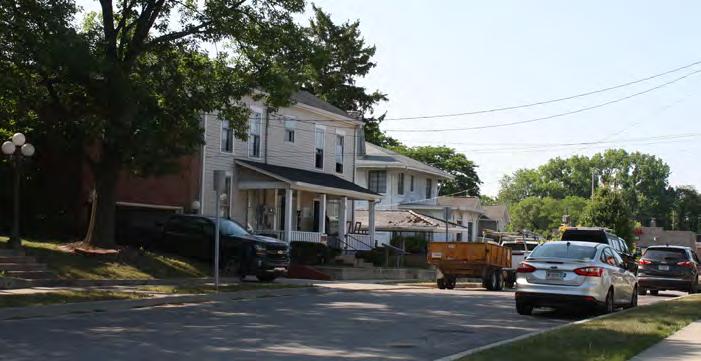
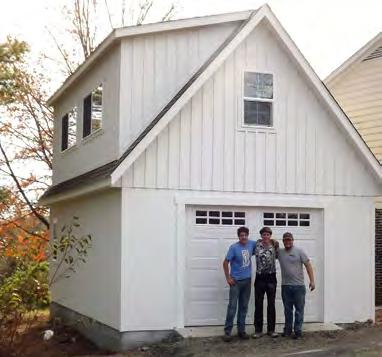
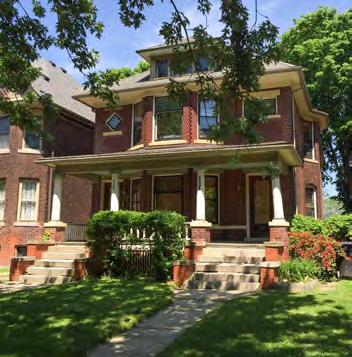

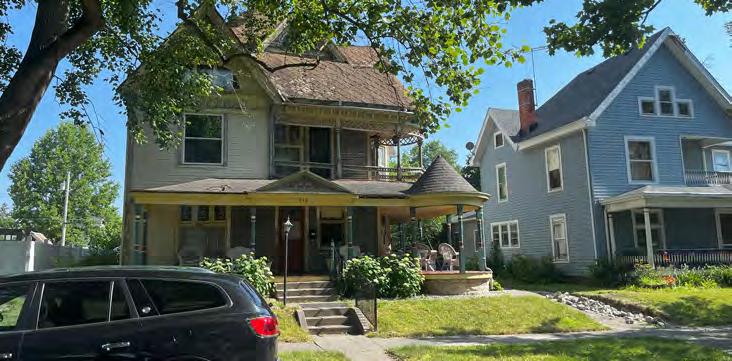
Corner stores and services like childcare along major throughfares and select intersections.
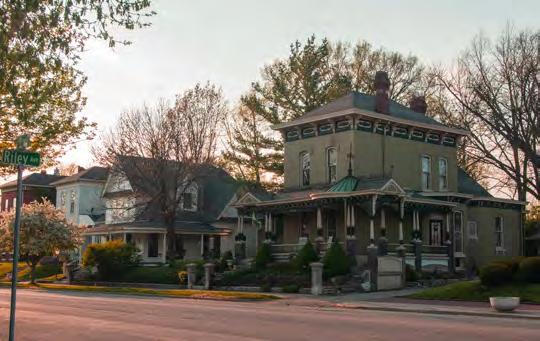
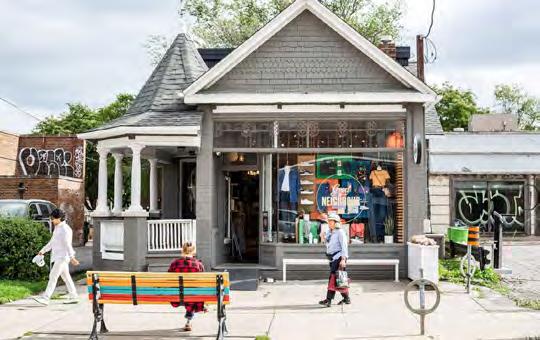
= Primary Use | = Secondary Use | = Discouraged
Residential Uses*
Detached, Single-Family
Accessory Dwelling Unit
Duplex
Triplex / Fourplex
Cottage Court
Townhome
Live-Work Building
Courtyard Building
Apartment Building
Commercial Uses
Auto-Service/-Parts Dealer
Gas Station
Building/Garden Material/
Equipment Supplier
Grocery Store
Restaurants, Food and/or
Beverage Service
Drive-through Business
Retail / General Store
Indoor or Personal Storage
Recreational / Fitness
Business
Hotel or Accommodation
Professional Office
Auction Facility
Entertainment Venue
Should be located on corner lots or along major thoroughfares.
Should be located on corner lots or along major thoroughfares.
Should be located on corner lots or along major thoroughfares.
Should be located on corner lots or along major thoroughfares.
Should be housed within a live-work building.
Industrial Uses
Artisanal/Small Workshop
Light Industrial
Heavy Industrial and/or
Manufacturing
Distribution and
Warehousing
Natural Resource Extraction or Excavation
Outdoor Storage
Civic / Institutional Uses
Governmental Service
Daycare / Childcare Service
Senior Care Service
Healthcare Service
Educational Service
Place of Worship
Utility Facility
Convention Center
Air Transport Facility
Ground Transport Facility
Open Spaces (besides parks) Sports Facility
Should be located on corner lots or along major thoroughfares.
Should be located on corner lots or along major thoroughfares.
Garden
Uses
Lot
Garage
Special
Veterinary Clinic
Kennel
Connecting Districts
Agricultural Tourism
(markets, produce stands)
All Other Commercial Uses
Gateways and New
only. No large fields.
*Refer to Chaper 2: Attainable Housing for definitions.
Street Network
Speed and Capacity
• Gridded street network with great connections to downtown shops and services.
• Streets should be convenient, comfortable, and safe for pedestrians and bicyclists on neighborhood streets.
• Residential streets are low-speed and low-capacity, discouraging speeding and through-traffic with four-way stops, narrow vehicle lanes, and street parking.
Vehicular • Alley-loaded access and garages are common and encouraged, while curb cuts for driveways should be limited.
• Every street, besides alleyways, should have sidewalks for pedestrians.
Bicycle and Pedestrian
• Bicyclists should feel comfortable on local streets.
• Pedestrian access should be primarily focused on the frontage street, though secondary entryways may be placed on the side or behind the structure.
Preferred Network Use limitedly Discouraged
Character
Streetside
Amenities
• Narrow vehicle lanes slow traffic through residential neighborhoods, increasing safety and comfort for pedestrians and bicyclists.
• Front porches line the street, slightly setback from the sidewalk, not too far away as to make socializing awkward but far enough to make social interaction optional.
• Neighborhood businesses have small-scale, blade signage that hangs off the front of the building, enhancing the aesthetic appeal of the store and minimizing light glare into nearby residences. Neon signage should be prohibited.
• Planting strips at least 8 feet wide between sidewalk and the street, where trees can be planted.
• Well-designed, pedestrian-scale street lighting is encouraged rather than large, overhead lights. Streetlights should minimize light pollution to improve the view of the night sky.
• Benches may be placed at select intersections where space is available to promote social interactions and connections between neighbors.
• Parallel parking.
On-Street Parking
Site Design Access
• Curb bump-outs and no parking near intersections to increase the visibility of pedestrians and bicyclists to drivers.
Building Placement
• Access via alleyways is common and encouraged.
• Curb cuts for parking areas are discouraged along any streets besides alleys.
• Sidewalks should connect to building entrances and be separated from driveways.
• Buildings should be close to the street and adjacent buildings, aligning with existing setbacks, preferably between 10 and 20 feet from the edge of the sidewalk. Where sidewalks are missing, a front setback between 40 and 50 feet from the street centerline is encouraged to align with setbacks. Corner lots should be setback on both street frontages with the aforementioned setbacks.
• Accessory dwelling units (ADUs) should be encouraged on the backside of properties, with at least a 5-foot rear setback, especially if located along an alleyway.
• Bike parking is encouraged on sites with multi-family residences.
Amenities and Open Spaces
Off-Street Parking
• Backyards are typically larger than front yards.
• Pocket parks are scattered throughout the neighborhood, providing spaces for children to play and neighbors to meet each other.
• Parking maximums instead of minimums should be considered.
• Access to parking areas via an alleyway instead of curb cuts on frontage streets is encouraged, ensuring minimal disruptions to the sidewalk for pedestrians and people in wheelchairs.
• Plant beds encouraged wrapped around the front of the building to increase greenery in the neighborhood.
Landscaping
• Tree plantings are also encouraged but should not block the street view of the primary building entrance.
• Non-residential uses should be screened with vegetation and/or wooden/iron fences to enhance privacy. Chain link fences are discouraged.
Character
Orientation
• New construction should incorporate historical architectural elements that match the existing character of surrounding residential uses, while leaving room for contemporary design preferences.
• Solar panels should be encouraged on slanted roofs that face south to increase solar power efficiency.
• Buildings should be externally oriented in line with the historical street grid and existing buildings.
• They can also be internally oriented around a shared courtyard or greenspace.
• Buildings sit close to the street and have front porches to encourage social interaction between neighbors.
Entrances
Height
Mixed-Use
Integration
• Multi-family units should be accessible through a shared indoor hallway or outdoor walkway, preferably with individual entrances for buildings with less than 5 units.
• No more than three stories tall or, if bordering the Downtown Core placetype, four stories are allowed.
• Developments may integrate different land uses either vertically with residential uses on top of non-residential uses like a corner store, or horizontally with non-residential uses in front of residential uses.
• Mixed-use developments should be selectively located at key intersections or along major throughfares and be sufficiently screened from adjacent residential uses with hedges, fences, or other types of privacy screens. Chain link fences are discouraged.
• Located on the west and east banks of the Brandywine Creek, respectively, these two historical subdivisions fall within the Creek’s natural floodplain, which has led to recurrent flooding issues for residents.
Wood-PrattBaldwin and Chandler’s Addition Subdivisions
• New development is discouraged in these areas unless measures to reduce the floodplain (as defined by the Federal Emergency Management Agency and the Indiana Department of Natural Resoruces) or flooding generally are taken.
• These measures could include flood modeling, green infrastructure such as rain gardens, an underground storage and infiltration system, a regional stormwater (retention/detention) pond, and expanding the limits of the floodplain upstream to reduce stress on the subdivisions downstream.
• See https://www.fema.gov/floodplain-management and https://www.in.gov/dnr/water/ for additional information, guidance, and support programs.
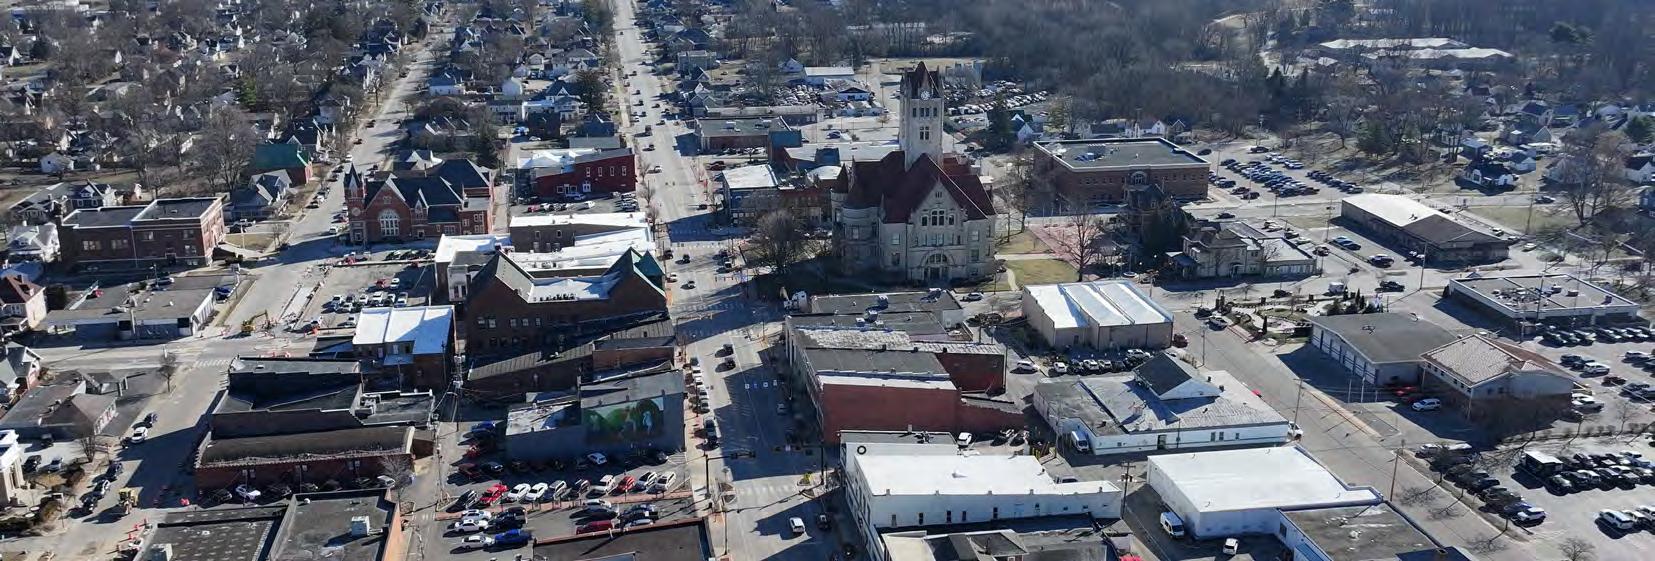
Greenfield in February 2025
The Downtown Mixed-Use area celebrates Greenfield’s heritage through architecture, attractive locally owned businesses, and year-round events that reflect its unique culture and history. With plenty of open-air seating, street art, artisanal workshops, Downtown Greenfield buzzes with an atmosphere of excitement and opportunity. Streets are lined with wellpreserved buildings and murals that pay homage to the town’s roots, while new developments blend seamlessly, honoring the legacy while embracing opportunities for new spaces and experiences. With a renewed emphasis on walkability and economic vibrancy, the downtown serves as a living testament to the past and a foundation for future generations.
“An authentic American city respectful of our heritage and intentional with our future” ...from the Vision Statement
1. Represents the heart of the city, where public spaces and plazas are used for events activities that bring the community together.
2. There are unlimited economic opportunities for small and local businesses with spaces for start-ups and for innovative practices to be tested.
3. The historical street grid remains intact, and gaps are filled in to enhance connections with adjacent residential neighborhoods.
4. Pennsy Trail and US 40 forms the backbones of downtown, with connected mixed-use developments, greenspaces, and gathering and event spaces.
5. Commercial and mixed-use buildings, with residences and/or offices above retail and restaurants, follow the traditional development style of wall-to-wall buildings.
6. Wide sidewalks with space for outdoor dining/seating, public art, decorative streetlights, trees, and benches for rest.
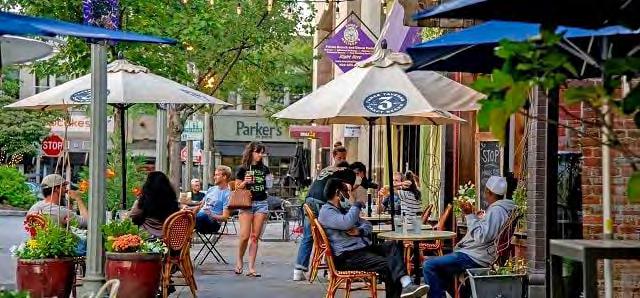
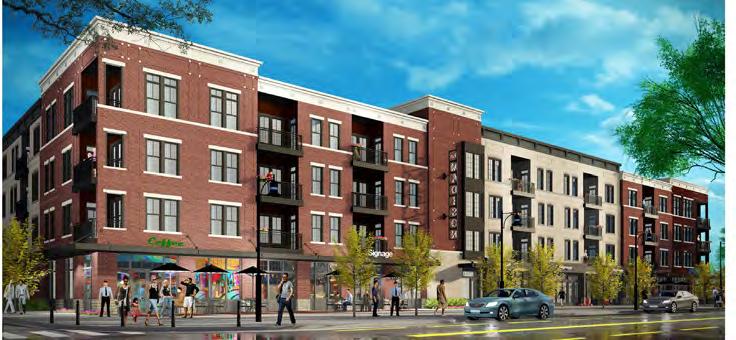
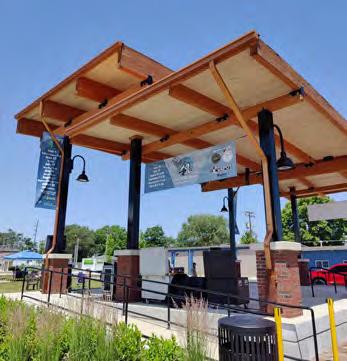
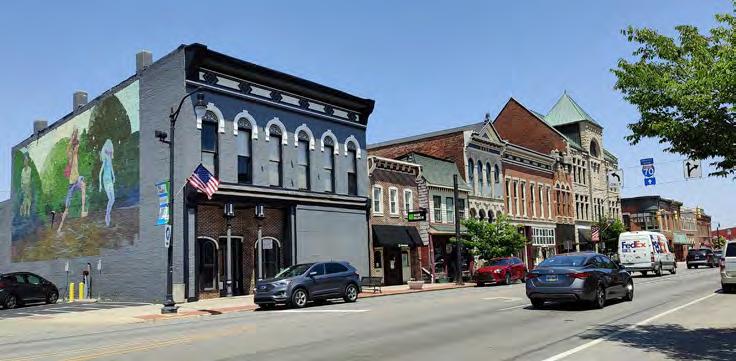
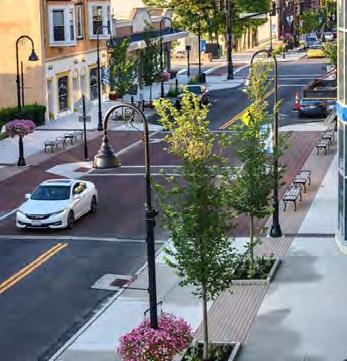
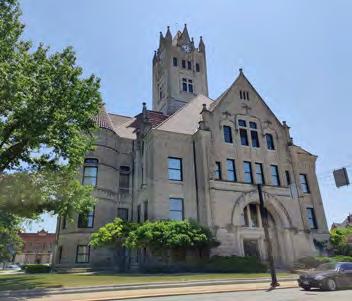
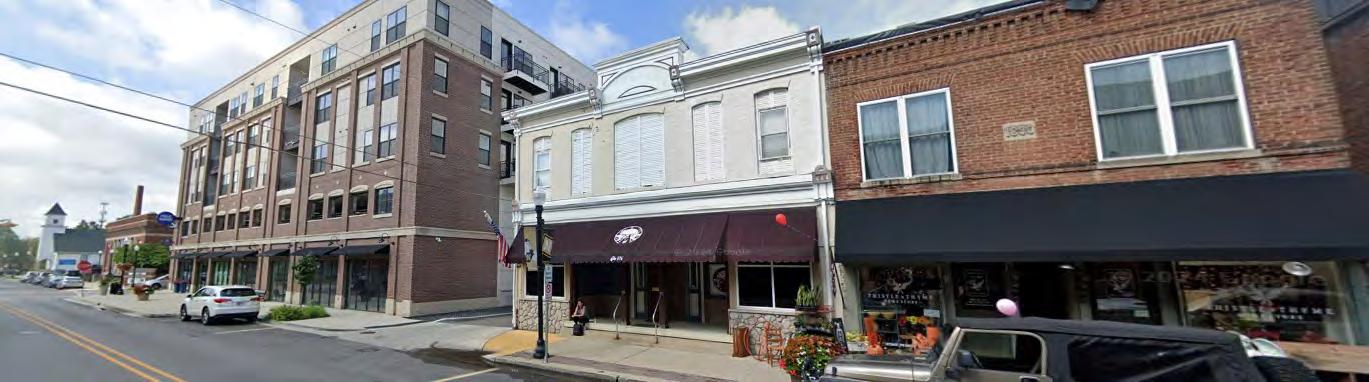
Gateways and New
= Primary Use | = Secondary Use | = Discouraged
Residential Uses*
Detached, Single-Family
Accessory Dwelling Unit
Duplex
Triplex / Fourplex
Cottage Court
Townhome
Live-Work Building
Courtyard Building
Apartment Building
Commercial Uses
Auto-Service/-Parts Dealer
Gas Station
Building/Garden Material/
Equipment Supplier
Grocery Store
Restaurants, Food and/or
Beverage Service
Drive-through Business
Retail / General Store
Indoor or Personal Storage
Recreational / Fitness
Business
Hotel or Accommodation
Professional Office
Auction Facility
Entertainment Venue
Veterinary Clinic
Kennel
Agricultural Tourism
(markets, produce stands)
All Other Commercial Uses
Mixed-use encouraged.
Small-scale only, such as a corner store.
Temporary events only, though shops with local produce are encouraged.
Industrial Uses
Artisanal/Small Workshop
Light Industrial
Heavy Industrial and/or
Manufacturing
Distribution and
Warehousing
Natural Resource Extraction or Excavation
Outdoor Storage
Civic / Institutional Uses
Governmental Service
Daycare / Childcare Service
Senior Care Service
Healthcare Service
Educational Service
Place of Worship
Utility Facility
Convention Center
Air Transport Facility
Ground Transport Facility
Open Spaces (besides parks) Sports Facility Conservation Community Garden
Other Uses
Parking Lot
Parking Garage
Farmland
Small-scale only. No large hospitals.
Small-scale training or tutoring facilities only.
Small-scale only. No large campuses.
Should be wrapped by buildings and/or have groundfloor commercial space.
*Refer to Chaper 2: Attainable Housing for definitions.
Subject to further review.
Street Network
• The historical street grid and network of alleyways should be maintained, limiting any closures to ensure connectivity.
• Reopening the street where the Courthouse Plaza currently sits to State Street should be considered to create a more connected grid.
• One-way streets are discouraged to maintain mobility throughout the downtown.
• When considering one-way conversions, the traffic impact should be modeled with assistance from Indy MPO staff and traffic modeling software.
• Bicyclists should feel comfortable biking on most streets downtown, besides major thoroughfares, without the need for dedicated infrastructure. This can be supported through narrowing lanes to slow vehicular traffic, adding stop signs, increasing visibility by installing curb bump-outs at intersections (i.e. “daylighting”), and enhancing visibility at night with streetlights.
• US 40 and State Street have high traffic volumes and medium-to-high traffic speeds, for both through-traffic and turning traffic.
Speed and Capacity
Vehicular
Bicycle and Pedestrian
• Regional traffic traveling to and from I-70 should be distributed and/or rerouted where possible to nearby thoroughfares such as Franklin Street, Broadway Street, or Apple Street. This could be supported through wayfinding signage.
• All other streets downtown should remain or become low-capacity and low-speed streets to create a more comfortable and friendly environment for pedestrians and bicyclists, without severely limiting access to parking for vehicles.
• Driveways and parking should be shared between adjacent buildings to minimize the number of curb cuts and land dedicated toward parking.
• Sidewalks and trails should be separated from vehicular traffic by grade-separated buffer strips.
• Bike parking at key intersections along the Pennsy Trail is encouraged. Businesses may provide additional parking in front of their store if it does not block pedestrian traffic.
• Buffer strips should include beds for native plants and groundcover.
• Sidewalk and bike connections to the Pennsy Trail and Riley Arts Trail are highly desired.
Preferred Network Use limitedly Discouraged
Character
Streetside
Amenities
• Sidewalks are wide and made from brick or concrete, with a preference for bricks such as the sidewalk in front of the Riley Home Museum.
• Public art and murals are encouraged on the sides of buildings and at key intersections.
• Streetlights can hang banners or the City flag to promote local events and boost community pride.
• Benches should be spaced out along the street, preferably closer to buildings than the vehicular travel lanes.
• Trash cans should be placed at all four corners of major intersections along Main Street, Pennsylvania Street, Depot Street, and State Street.
• Parallel parking is encouraged.
• Bump-outs containing plants, trees, and/or bike parking should be interspersed between parallel parking spots.
On-Street Parking
Water Management
Site Design Access
• Parklets are encouraged in select locations to provide additional outdoor seating for restaurants and other food/beverage establishments.
• Electric vehicle charging stations should follow the guidelines established in the City’s Electric Vehicle Charging Plan (“Charge Greenfield”).
• To reduce flooding, bioswales, rain gardens, and other green infrastructures are encouraged along streets with a high risk of flooding.
• Further study of Potts Ditch, which runs underneath downtown Greenfield, should determine how it affects flooding in the downtown area and what projects the City can pursue to better manage the impacts.
• Curb cuts to access parking areas should not be allowed on Main Street and State Street unless it is an alleyway.
Building Placement
Amenities and
Open Spaces
• Buildings should be at similar setbacks and distances to historical development patterns, so as to create harmony between redevelopment and historical buildings. A building should take up 90% to 100% of the lot area, with some exceptions for alleyloaded parking behind the building.
• Historical properties range between 20 and 60 feet in width, while typically having a length of around 132 feet. Redevelopment projects may require the assemblage of multiple smaller lots, hence larger lot sizes should be allowed.
• Small-scale public plazas between buildings should have plenty of seating and could include outdoor games, public art such as murals sculptures, water features like a fountain, and other amenities. Alleyways could also be used as public spaces or plazas, such as the existing Living Alley in downtown Greenfield.
• While plazas allow for smaller community spaces, the Depot Street Park should remain the central gathering place for the Greenfield community.
• Amenities should be consistently maintained and inventoried by the city to ensure a vibrant public atmosphere.
Off-Street Parking
• Parking areas should be placed behind or at the side of buildings.
• Parking areas should be landscaped with medians containing trees and/or shrubs. They should also be buffered from pedestrian and bicycle facilities with trees, groundcovers, planters, and/or knee-high walls.
• Parking should be designed with continuous sidewalks to improve pedestrian safety and visibility for drivers.
• Electric vehicle charging stations should follow the guidelines established in the City’s Electric Vehicle Charging Plan (“Charge Greenfield”).
• Shared parking and parking garages are highly recommended to minimize an overabundance of surface parking lots.
• Street trees are encouraged where there is enough room within the right-of-way (at least 6 feet and preferably 8 feet) for them to grow and stay healthy.
Landscaping
• Small bushes that frame a building entrance/window and planting pots hung from first-floor windows are encouraged to add additional greenery to the area.
• The native species lists from the IDNR Forestry Division and Indiana Wildlife Federation should be used to inform landscaping.
• Redevelopment projects should reinforce the façade of historical lot widths to ensure the historical character of the area is maintained. This could be done through architectural elements (columns, windows, awnings, corner posts, etc.) and changing how far a building is set back from the street every 20 to 60 feet.
• The 2011 Downtown Redevelopment Plan should be used as a reference for desired historical and architectural characteristics.
Orientation
• Buildings and entrances should always be oriented towards the street and in line with the historical street grid.
• Buildings should have at least one entrance for each side of the building that faces a public street.
Entrances
• Corner lots could either have two entrances (one for each street) or a single entrance at the corner that faces the intersection.
• There should also be an entrance identified for parking lots or garages as necessary.
Height
Mixed-Use Integration
• Two stories minimum. Six stories maximum except for around the Hancock County Courthouse where buildings should be no more than four stories to minimize disruptions to viewsheds of the courthouse.
• Any floor above four stories should be slightly setback further than floors below to enhance sunlight penetration to the street.
• Vertical integration of different uses is preferred and encouraged, such as apartments and/or offices above stores.
• When residential uses are on the ground floor, windows should be slightly elevated above the sidewalk to enhance privacy. Additionally, front porches are highly encouraged to provide opportunities for informal social interactions that build community.
• Street intersections with the Pennsy Trail and Riley Arts Trail should have raised crossings and clear signage displaying a map with community destinations that can be reached via the trails. The Hancock County Quality of Place Plan and Greenfield Arts Plan could be used to identify these destinations.
• Additional linear parks and gathering spaces should be expanded along the Pennsy Trail with Depot Street Park as a central destination on the trail.
• Developments should be oriented toward the trails to further activate spaces along the Pennsy and Riley Literacy Trails.
• Greenfield’s Complete Streets policy should be utilized whenever a redevelopment project or a street construction project occurs. When a street is scheduled to be reconstructed or repaved, a comprehensive review of the street’s design should be taken to see if bicycle and/or pedestrian facilities can be improved or expanded.
Midblock crossings should be constructed where ‘desire paths’ are located. Desire paths are where people inherently want to cross, and may do so dangerously, because it is the most convenient/preferred route.
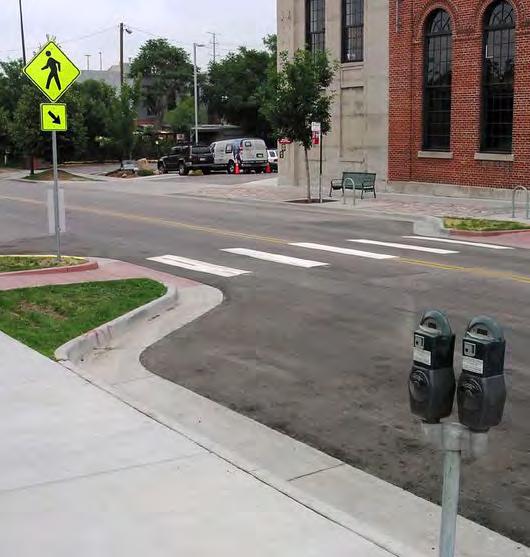
Off-street parking is buffered from pedestrian and bicycle infrastructure to ensure a comfortable walking/biking environment and improve aesthetic appeal of the area.
An example of wayfinding signage which shows people where trails, restaurants, and other landmarks are located downtown.
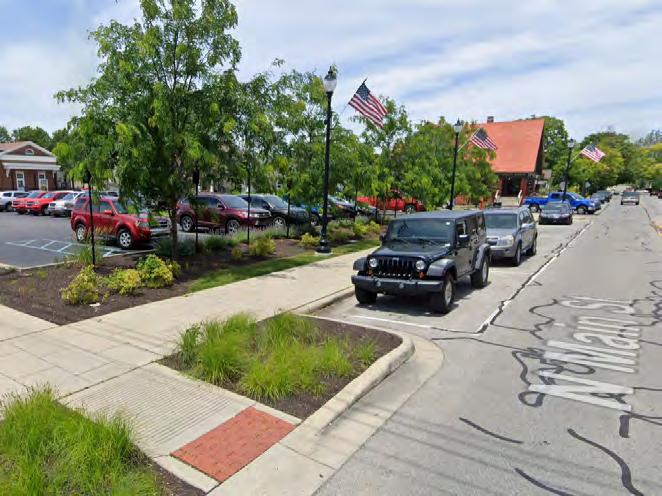
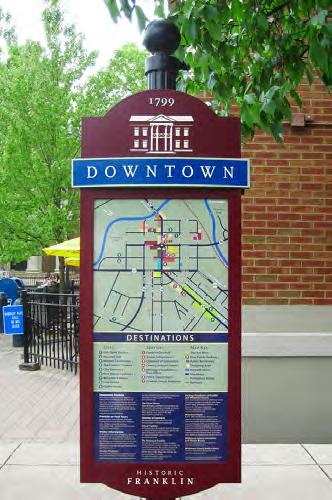
This page is intentionally left blank.
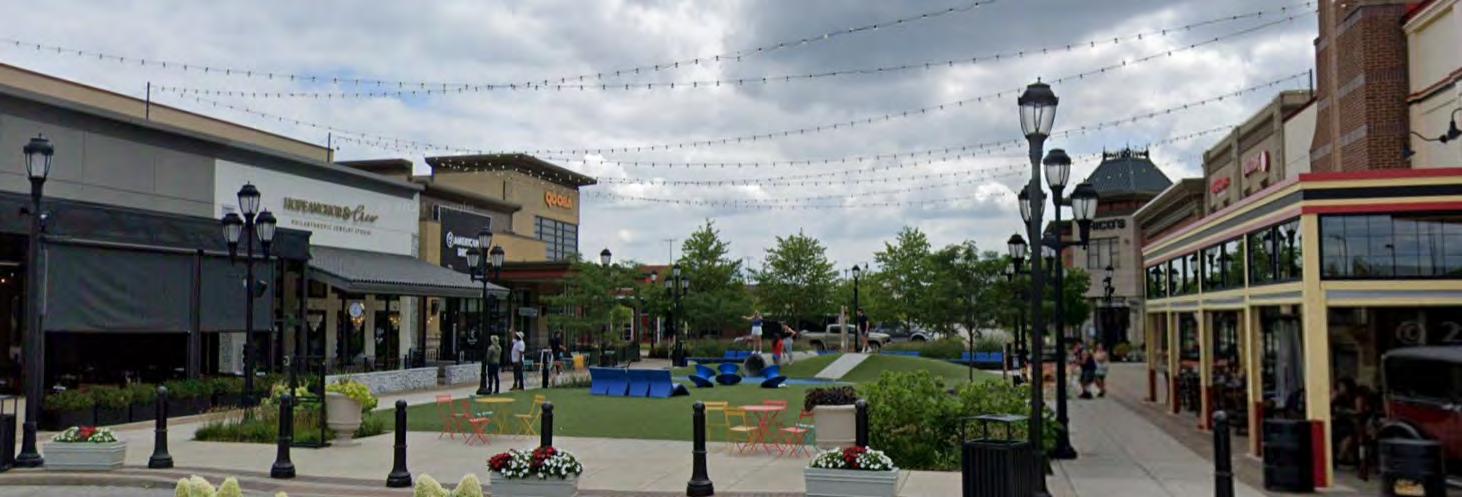
Suburban Commercial Centers are located at major intersections and along key corridors, serving multiple surrounding neighborhoods and attracting retailers and services that require a larger market area. A mix of commercial, office, residential, retail, and services are concentrated adjacent to larger nodes of activity. Commercial centers, major corridors, and office parks are prime locations for this placetype. Nearby patrons can comfortably walk or bike to the center, while faraway patrons can easily find parking with clear signage. While shopping, people can stroll through tree-lined sidewalks and spaces filled with locally made art that give the area a unique charm.
1. Storefronts are oriented toward shared spaces, such as plazas or greenspaces, which integrate areas for social gatherings, rest, play, dining, and general leisure.
2. Vacant properties and underused parking areas provide opportunities for redevelopment for mixed-use and residential structures providing housing and housing choice in and around our neighborhoods.
3. Buildings are designed with attractive architecture, and adaptable spaces that can be reused for a variety of purposes to sustain the longterm value and viability of commercial areas.
4. Discourage direct connections to major roads to reduce disruptions to traffic flow and improve pedestrian/bicyclist safety by limiting traffic turning from major roads to key intersections.
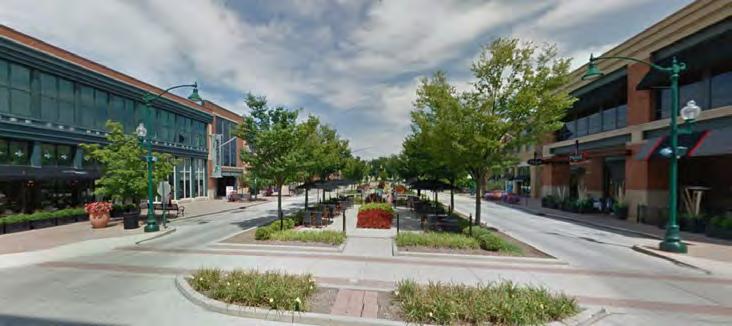
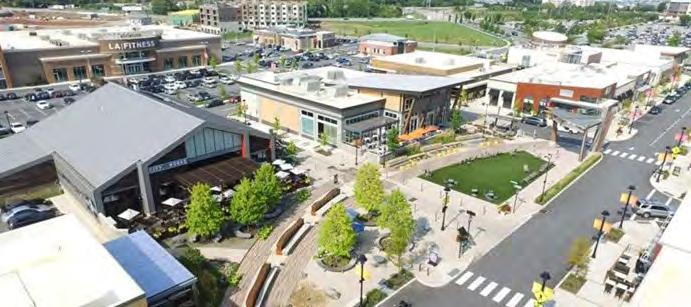
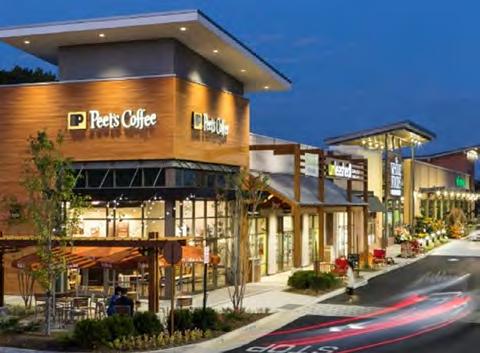
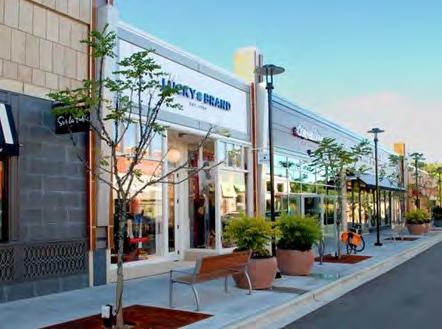
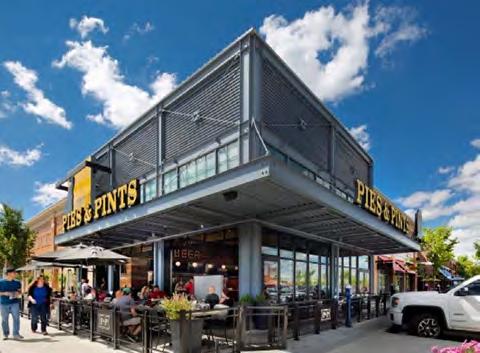
5. Buildings are integrated with each other and into trail networks with the rest of the community for convenient, safe, and accessible ways to walk or bike.
6. A variety of housing choices are incorporated into mixeduse buildings to diversify the housing stock, including more options for homeownership like condos.
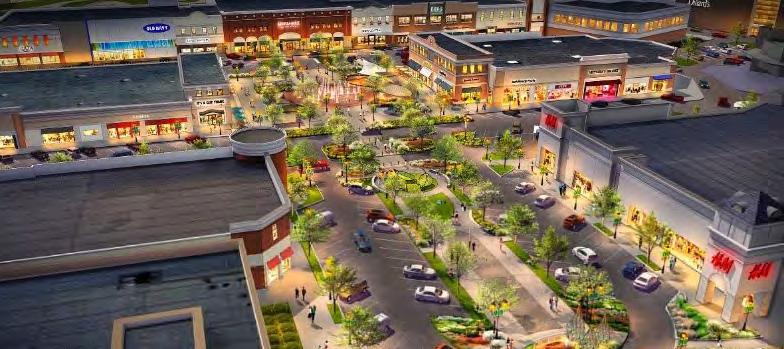
Gateways and New
= Primary Use | = Secondary Use | = Discouraged
Residential Uses*
Detached, Single-Family
Accessory Dwelling Unit
Duplex
Triplex / Fourplex
Cottage Court
Townhome
Courtyard Building
Industrial Uses
Artisanal/Small-Scale Workshop
Light Industrial
Heavy Industrial and/or Manufacturing
Distribution and Warehousing
Natural Resource Extraction or Excavation
Outdoor Storage Civic / Institutional Uses
Apartment Building
Live-Work Building Only at key intersections or areas with shared greenspaces.Residental entrances separate from commercial uses.
Commercial Uses
Auto-Service/-Parts Dealer
Gas Station
Only one allowed at major intersections and not within a quarter-mile of another gas station
Building/Garden Material/ Equipment Supplier Outdoor piles should be screened from the public right-of-way with vegetation
Grocery Store
Restaurants, Food and/or
Beverage Service
Drive-through Business
Retail / General Store
Indoor or Personal Storage
Recreational / Fitness
Business
Hotel or Accommodation
Professional Office
Auction Facility
Entertainment Venue
Veterinary Clinic
Kennel
Agricultural Tourism (markets, produce stands)
All Other Commercial Uses
Drive-throughs should not be accessed directly from frontage or major roads
Governmental Service
Daycare / Childcare Service
Senior Care Service
Healthcare Service
Educational Service Place of Worship
Utility Facility
Convention Center
Air Transport Facility
Ground Transport Facility
Open Spaces (besides parks) Sports Facility Conservation Community Garden
Uses Parking Lot Parking Garage Farmland
*Refer to Chaper 2: Attainable Housing for definitions.
Street Network
Speed and Capacity
• Create a well-connected multi-use street network with an emphasis on connecting residential areas to nearby commercial centers and community assets.
• New developments should be tied into regional transit service where possible, and plan for multiple mobility options within newly developed centers.
• On- and off-street connections to parks, schools, and other destinations.
• Incorporate traffic calming measures, such as speed bumps, landscaped medians, and curb extensions, to ensure safe speeds.
• Typically located along high-traffic, high-speed, high-visibility thoroughfares.
• Interior and frontage roads should be low-speed and have low- to medium-capacity to handle commercial traffic.
• Frontage roads are used to access parking areas.
• Street parking is available along important, interior roads with dedicated ADA spaces and selected spots for picking up online orders.
Vehicular
Bicycle and Pedestrian
• EV parking follows the guidelines recommended in the “Charging Greenfield” plan.
• Incorporate traffic calming measures, such as speed bumps, small roundabouts, landscaped medians, and curb extensions, to ensure safe speeds on access roads.
• New developments should be connected by a safe and accessible network of sidewalks and trails.
• Include well-designed pedestrian connections to trails or greenways.
• Gradually increase Suburban Commercial Center density to reflect the high emphasis on accessibility by all transportation modes.
While the preferred network is a ‘traditional grid,’ it is important to explain the interpretation for this placetype. Since most Suburban Commercial Centers are loacted linearly on major roads, it is intended for developments to use frontage roads (shown in grey), rather than connecting directly into major roads (shown in dark green).
Preferred Network Use limitedly Discouraged
Character
Streetside
Amenities
• Storefronts line wide sidewalks with space for street trees, benches, outdoor seating, and bike parking.
• Interspersed between storefronts are parks and open spaces that can include activities like jumbo chess, ping pong, and more.
• Signage for parking and businesses is clearly identified for pedestrians, bicyclists, and drivers.
• Pedestrian-scale and signage hangs off the side of buildings.
• Banners line sidewalks for event advertisements and community development.
• Benches are placed preferably along buildings rather than next to streets.
• Well-designed and pedestrian-scale streetlights enhance safety and walkability at night.
• No street parking on major roads including but not limited to State Road 9, US 40, or CR 200 W.
On-Street Parking
• On street parking should be limited to interior streets.
• Back-in and parallel parking are discouraged for better vehicle flow and access throughout the site.
• There should be little to no direct vehicular access on/off major thoroughfares, with most access coming from a frontage street.
• Design parking areas to minimize curb cuts and encourage continuous sidewalks that improve pedestrian and bicyclist safety.
• Prioritize pedestrian and bicycle access over traffic flow on interior streets, while allowing quick access to parking areas for vehicles on frontage streets.
• A majority of the frontage of interior streets should be occupied by buildings and urban open spaces, particularly on primary frontages.
Building Placement
Amenities and Open Spaces
• Commercial out-lots should be located between a frontage street and a major throughfare.
• New development should be located at the edges of large blocks to create a walkable environment, and parking and service areas should be screened from public view.
• Integrate green spaces such as plazas and parklets into commercial districts to serve as an amenity to businesses and visitors.
• Established areas should focus on incorporating additional community gathering spaces, pedestrian amenities, and enhanced landscaping as a catalyst for more destination activity around commercial uses.
• Parking areas are easily accessible with signage and frontage roads.
• Incorporate green spaces and landscaping, such as vegetative medians, within and around parking areas to enhance the aesthetic appeal of the site.
• Discourage the placement of large parking areas along major roads.
• Encourage shared driveways in clustered developments or where appropriate to maximize greenspace and reduce asphalt surfaces.
• When feasible, place surface parking at the rear or interior of the lot to enhance the pedestrian experience.
• Encourage parking wrapped with a building or below grade parking where feasible.
• Incorporate green infrastructure elements such as channels of absorptive landscaping, permeable pavement, and green roofs to mitigate urban flooding and heat-island effects.
Landscaping
• Incorporate landscaped buffers into new developments to minimize impacts on nearby established residential areas.
• Sensitive natural features within undeveloped areas should be preserved, or where possible, integrated into the development to serve as an amenity.
• Ground-floor building facades with a high degree of transparency which allows people to see into and out of the business.
Character
Orientation
• Front facades of buildings are typically located near the sidewalk on local and main streets, and on arterial streets greater separation between the building and street travel lanes is provided.
• New developments should transition along the edges to nearby residential neighborhoods with landscaping buffering, complete streets, pedestrian pathways, and lower building heights.
• Orient and/or screen building service functions and mechanical equipment for commercial developments behind the building.
• Locate entrances along wide sidewalks, trails, and shared spaces.
Entrances
Height
Mixed-Use Integration
• Building entrances should be easily identifiable through architectural elements such as a change in materials, height, and/or business signage.
• Taper building height and bulk in edge areas to transition to less intense development in neighboring areas.
• Key intersections should serve as the focus of mixed-use buildings, integrating a variety of apartment options above ground floor storefronts.
• Housing should be integrated into under-performing, mixed-use corridors and centers to help increase housing access.
• Develop designs standards for areas intended for transition from another development pattern to the suburban commercial center placetype which generally consist of roadway corridors or industrial areas that are no longer, or never were, compatible with proximate residential areas or the broader surrounding development pattern.
• Anchor commercial districts with mixed-use and commercial development at key intersections.
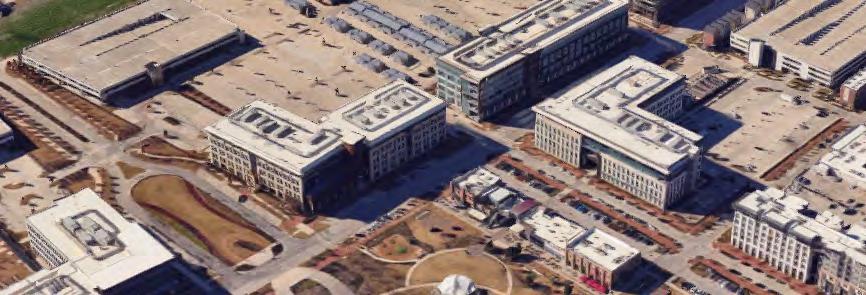
The Employment Hub attracts top-tier businesses offering competitive salaries and ample opportunities for personal and financial growth and stability, making it a magnet for emerging professionals. It is intended for regional-scale employment, which means a majority of people traveling here are commuters. Hence, the Employment Hub placetype should be near interstates or major roads that can accommodate large volumes of traffic, including cars, trucks, bikes, and buses. Each hub is enriched by partnerships with nearby universities, not-for-profits, and training centers, providing lifelong educational opportunities, upskilling programs tailored to local and regional industries, and research labs and offices. With a focus on innovation and collaboration, Employment Hubs should foster a thriving labor market and business environment, where people can pursue economic opportunities and flourish with newfound talents.
1. Cluster buildings around shared greenspaces and connect them with pedestrian pathways to create campus-style research and manufacturing centers.
2. Development is encouraged near areas with easy access to major transportation routes such as interstates and where truck traffic can be diverted from local roads and areas with Neighborhood Centers.
3. Complete Streets should move commuters efficiently, effectively, and safely between Employment Hubs and their homes, no matter what transportation option that they choose to use.
4. Attractive architecture, multipurpose, and adaptive spaces are builtin to developments to sustain the long-term value and viability of buildings.
5. Service bays, parking areas, and other back-of-building functions are located behind the building and screened with vegetation, tree lines, and small hills.
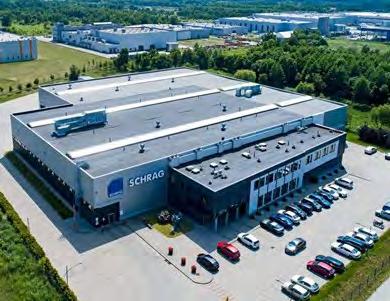
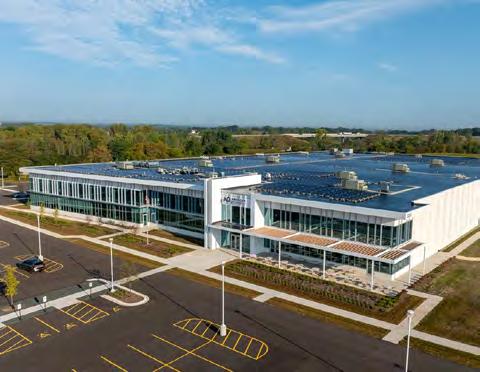
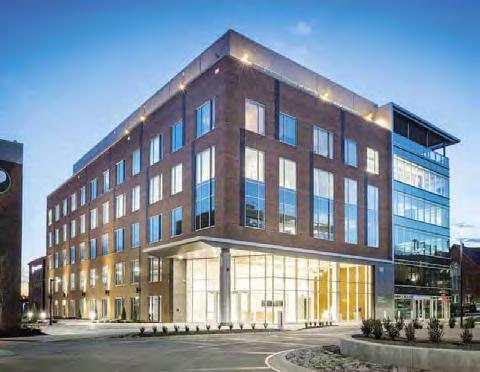
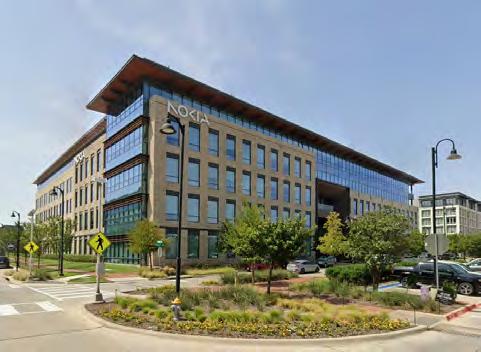
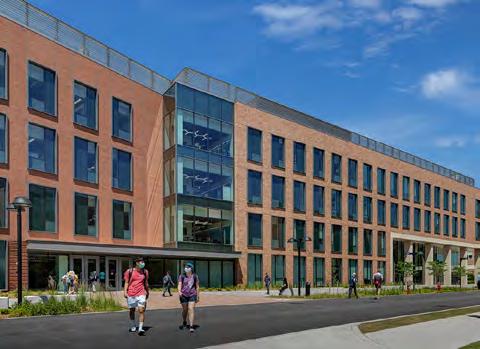
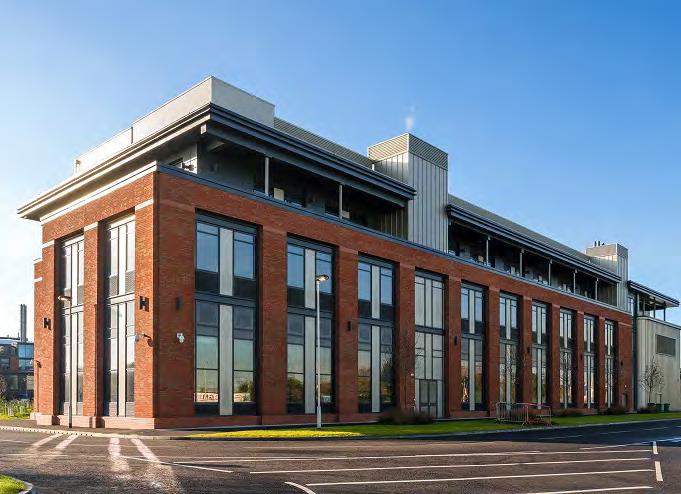
6. Streets are well-designed to separate truck traffic from other road users as much as possible.
7. Use renewable energy like rooftop solar panels and incorporate green infrastructure into buildings to reduce negative environmental impacts.
8. Building should be built or retrofitted, where possible, with facilities to reduce water consumption and reuse potable water resources.
=
Residential
Detached, Single-Family
Accessory Dwelling
Duplex
Triplex / Fourplex
Cottage Court
Townhome
Live-Work Building
Courtyard Building
Apartment
Auto-Service/-Parts
Restaurants,
Beverage
Drive-through
Should be located behind a building associated with a recommended primary use and screened with vegetation and/or topography.
Speed and Capacity
Vehicular
Bicycle and Pedestrian
• Trucks and cars have a high degree of separation from pedestrians and bicyclists on major roads, through street design elements such as guardrails, leading pedestrian signals, underpasses at high-traffic intersections, multiuse pathways that are buffered away from the street, and more.
• Truck and car access are separated on interior roads, with wider streets allowing for truck turning maneuvers on a select, limited number of interior streets.
• High volume of commuter and commercial vehicles on major roads such as State Road 9, New Rd, CR 300N, and, once the new interchange with I-70 is completed, CR 200W.
• Locate industrial uses along truck routes designed for anticipated capacity and divert traffic away from residential neighborhoods.
• Redirect most of the regional truck traffic from downtown (State Road 9) to CR 200 W once the new interstate interchange is completed.
• All land uses should be connected by a safe and accessible network of sidewalks and trails.
• Provide direct paths for pedestrians from parking areas to primary building entrances within large development.
• Off-street pathways that directly connect between buildings are encouraged, especially for campus-style developments.
Character
• Complete streets, built for a variety of transportation options, move commuters to and from office and industrial buildings.
• Restaurants and retail businesses continue to activate the street even after the workday is done, with opportunities for outdoor dining and activities, including board games and sports.
• Denser residential nearby, such as apartments and live-work buildings, reduce people’s dependence on vehicles by making travel by foot/bike viable and convenient options, which also helps reduce commute times for people who choose to use a vehicle or have no other alternatives.
Streetside
Amenities
On-Street Parking
• Streetside amenities should include benches, street trees, and garbage cans. These amenities should be strategically spaced within public spaces to foster a comfortable atmosphere and clean environment.
• Outdoor seating and dining areas should activate the street front, creating a lively atmosphere.
• No street parking on primary streets.
• Parking is encouraged on interior streets, in whatever fashion best fits the context.
• Curb bump-outs for increased visibility of pedestrians/bicyclists in crosswalks.
Building Placement
• Sidewalk entrances with either no stairs or an accessible ramp.
• Parking entrance to the side of the building, preferably shared with adjacent buildings to minimize its footprint, or at the back of the building through a frontage street.
• Cargo bays and other building service facilities should be at the back of the building.
• No further than 200 feet away from the centerline of the primary street.
• Transitional buffer of at least 300 feet from new industrial buildings where manufacturing activities take place to any nearby residential buildings.
Amenities and
Open Spaces
• Indoor and outdoor seating and dining areas attached to supporting commercial uses, courtyards, and other green spaces. Specifically, courtyards (both indoor and outdoor) should be designed with comfort and opportunities for professional meetings in mind such as the inclusion of charging outlets, coworking spaces, and semi-private conference spaces.
• Integrate green infrastructure such as tree boxes, permeable pavement, and green roofs to reduce urban flooding and heat island effects.
• Integrate outdoor pathways and recreation areas that are used as amenities by employees.
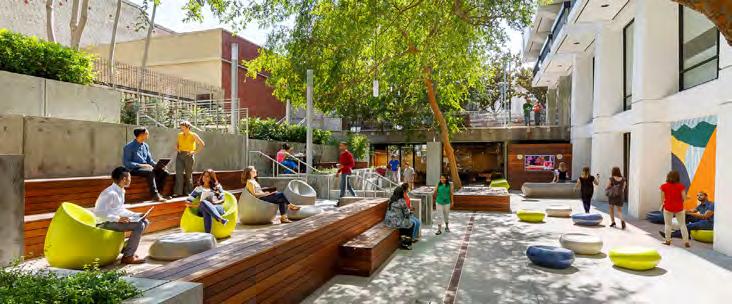
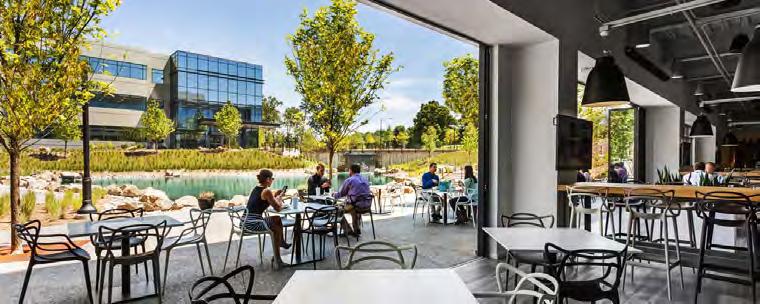
Off-Street Parking
Landscaping
• Utilize on-site landscaping and parking lot design to screen parking and service areas to create an inviting pedestrian environment.
• Future decisions regarding parking and drive-aisle paving materials should take into consideration both storm water and air-quality considerations.
• Preferably located behind or to the side of buildings, however, there may be up to four parking aisles/rows in the front of the building as long as there is a convenient and dedicated pathway for pedestrians and bicyclists to access the building.
• Parking garages may be preferred to surface parking to further minimize the amount of land used for parking.
• Vegetation such as trees, groundcovers, and/or plant beds should wrap around a building to soften its exterior.
• Transitional buffer of at least 300 feet from new industrial buildings where manufacturing activities take place to any nearby residential buildings.
Building Design
Character
• The character of the building should fit with the precedent imagery.
• Orient commercially-focused buildings or parts of buildings toward the street with street fronting entrances that connect to sidewalks.
Orientation
Entrances
• Loading, trash service, and other back-of-building functions should not be visible from the front of the building to ensure an attractive and inviting face to the community.
• Smaller warehouses or other less intense light industrial uses should include performance measures to ensure uses are not incompatible with surroundings.
• Building entrances should connect with sidewalks or trails.
• Mark building entrances to signal their location, such as added height, different materials, lighting, and/or other architectural elements.
• Interior entrances into courtyards or greenspaces are encouraged to improve access to open space and workplace quality for employees.
• Height should be equal to or less than the distance of the building setback from the primary street.
Height
Mixed-Use
Integration
• Buildings with a footprint of more than 100,000 square feet are encouraged to have different heights across the building to enhance the architectural appeal and visual variety.
• The structure is located so that it does not significantly impact, visually and physically, open sky visibility for nearby residences.
• Commercial uses, such as restaurants and retail stores should be integrated into the same building as industrial uses or offices, or in a separate but nearby building with pedestrian connections is encouraged.
• Industrial or office buildings with integrated commercial uses should be accessible by the public and be designed with the ability to remain open once the primary use is closed for the day.
• If a building has multiple land uses, heavy industrial/manufacturing uses should always be placed behind any other uses.
Opportunity Parkway
Data Centers
• Forming the spine of the North Economic Development Area, Opportunity Parkway has potential to house highly desirable biotech and ag-tech businesses that build onto the healthcare and agricultural industries in and around Greenfield.
• Land uses related to research and workforce development, such as offices and educational services, are desired.
• SIte development should follow the subarea plan for Opportunity Parkway and the State Road 9 corridor north of Interstate 70.
Background
• High revenues in the form of property taxes for the city, which can help subsidize service-intensive areas, such as Estate and Suburban Neighborhoods, and fund infrastructure maintenance.
• Low number of workers per square foot than office or other light industrial uses.
• Large water and electricity usage.
Recommendations
• With a general lack of visitors that would produce foot traffic, data centers should not be located along major corridors or on pedestrian-oriented streets.
• Data centers usually fall under “Light Industrial” in zoning codes but some communities have opted to create separate land use definitions for Data Centers or ‘data processing facilities.’
• Performance-based standards, such as noise limits and soundproofing, are encouraged as well as reducing the potential of a nuisance like sufficient buffering and screening from nearby properties.
References
• Loudon County, Virginia is a prime example of data center zoning where the community has suitable infrastructure and development sites.
• Missoula County, Montana offers a different perspective of data center zoning that seeks to mitigate potential environmental impacts, including energy consumption and electronic waste.
Future Southwest Employment Hub
• Work with INDOT to petition USDOT to change National Truck Network route from State Road 9 to CR 200W, north of US 52, once the new interchange between I-70 and CR 200W is completed. This will help reduce the number of cargo trucks traveling through downtown Greenfield.
• Reroute CR 200S to loop south around the regulated drain, M. Weber Ditch, to reduce the number of bridges to maintain, hence reducing long-term maintenance costs.
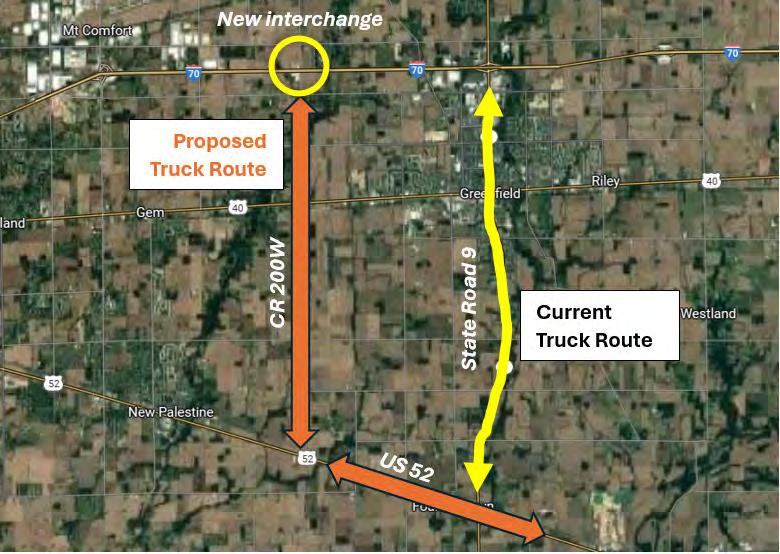
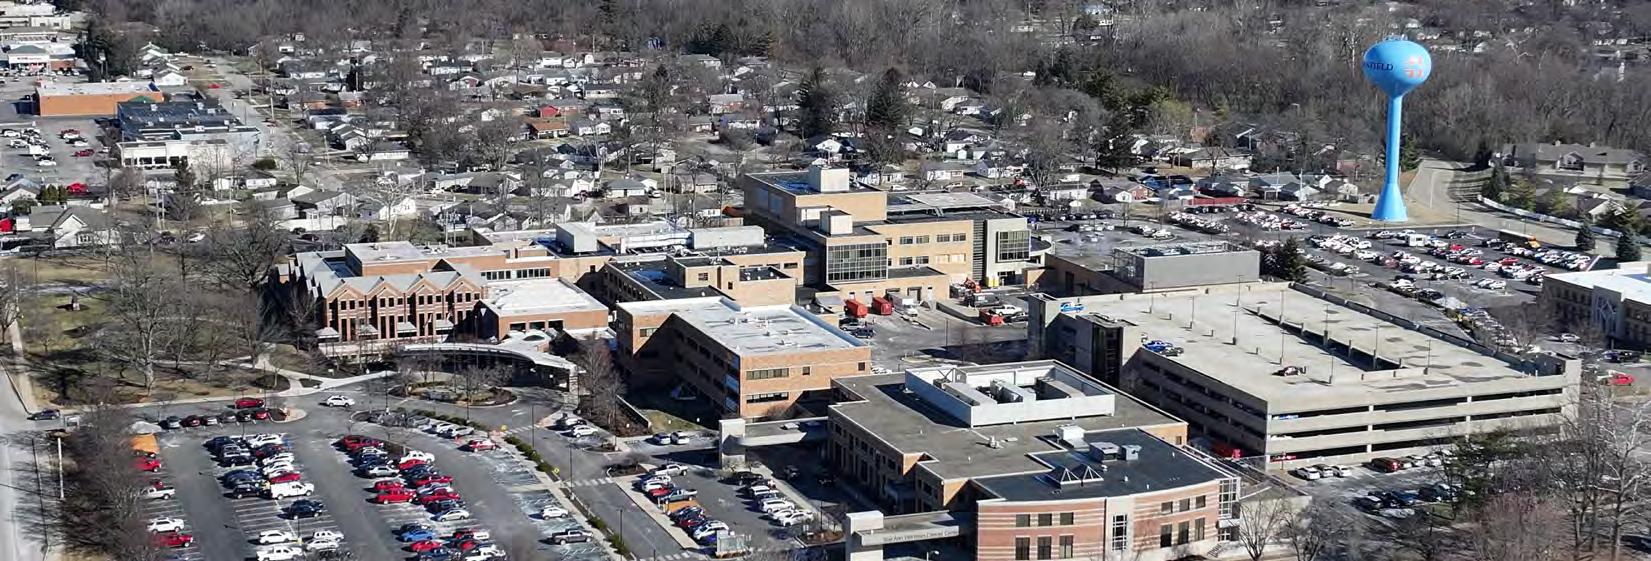
Special Areas have unique or ‘special’ conditions such as topography, a significant location, and/or serve an important function for the greater community. Typically, they include schools, healthcare, transportation hubs, and other large-scale public amenities.
These facilities are maintained and operated by their respective authorities. Future planning efforts for and around these facilities should be in coordination with the appropriate authorities.
Special Areas on the Future Development Map include:
• A mplify Hancock
• Greenfield Central Junior High
• Greenfield Central High School
• Harris Elementary
• JB Stephens Elementary School
• Hancock County Law Enforcement
• Hancock County Fairgrounds
• Hancock Regional Hospital
• Hancock County Highway Department
• Park Cemetery/Sewer Treatment Plant
• Interstate-70 Rest Stop
• Mixed-Use Lifestyle Center (see Opportunity Parkway/State Road 9 Concept and the section “Subarea Plans”)
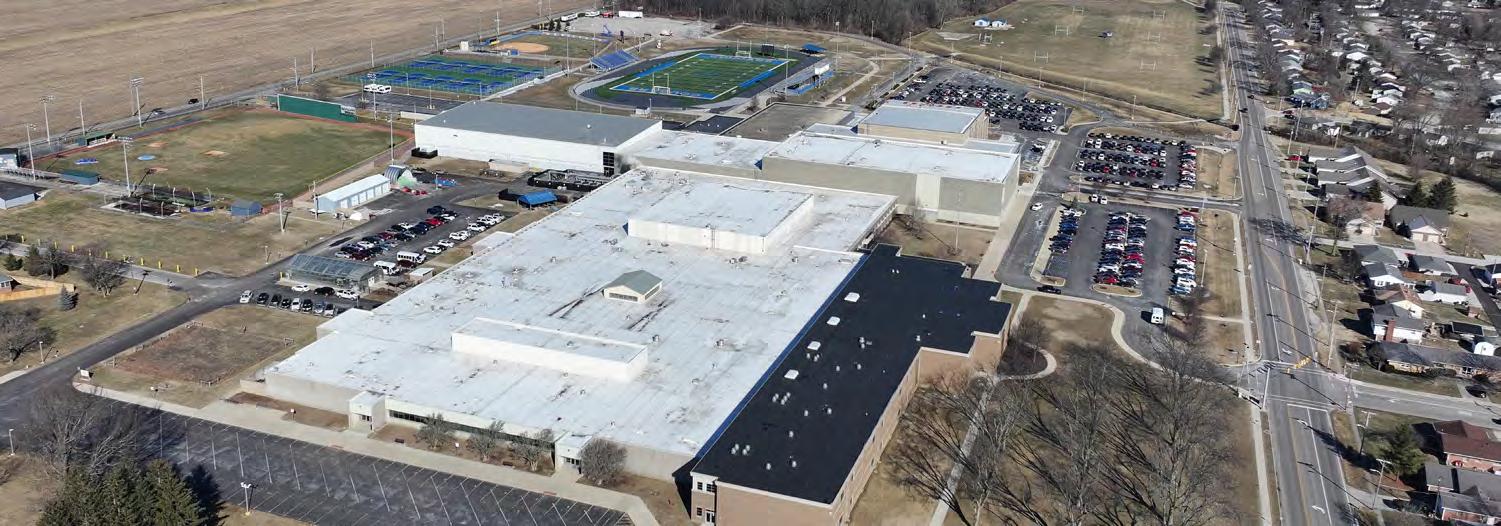
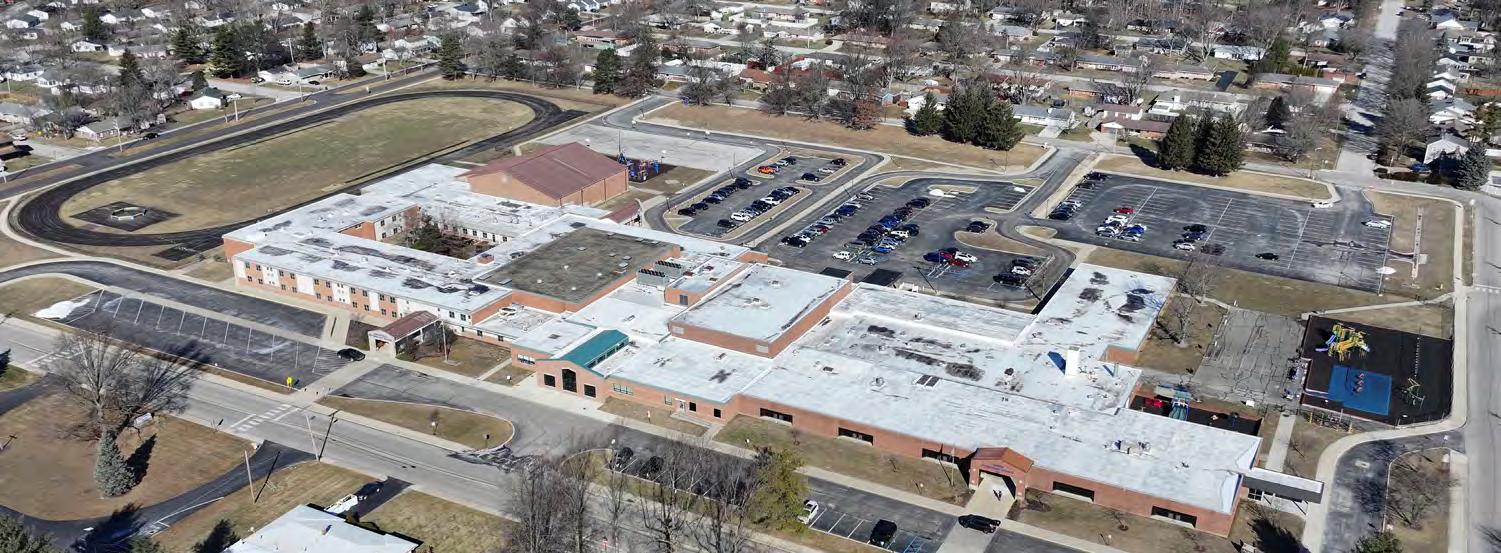
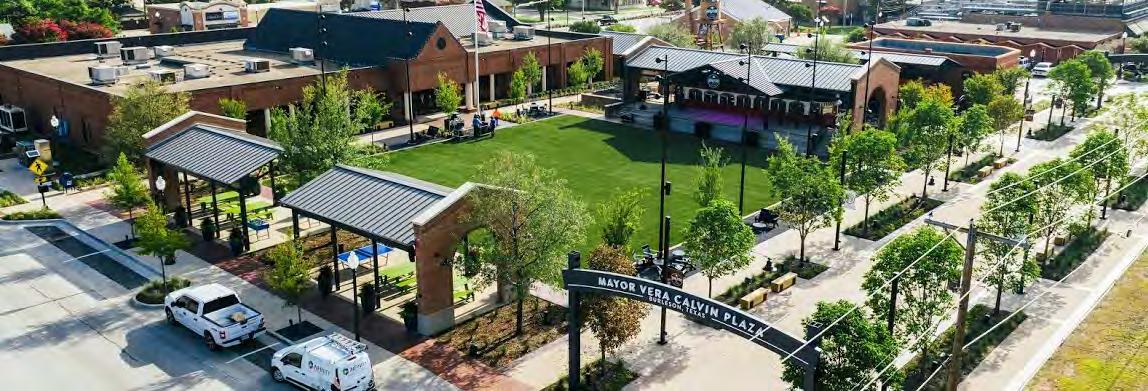
Unlike other placetypes, Connecting Districts are meant to modify the characteristics of other placetypes along specific, significant streets, shown as blue lines on the Future Development Map. The intent of this placetype is to:
• Activate the streetscape through building orientation, placement, and use to create a walkable environment.
• Provide streetside amenities like outdoor seating, bike racks, and community spaces, either along certain street segments or as pocket parks, to create opportunities for social interaction.
• Encourage active lifestyles by making walking and biking along these streets more interesting, useful, and convenient.
The Connecting District should have complete streets with dedicated, separate facilities for all road users, including cars, bikes, and pedestrians. This should also include supporting facilities, including street parking (depending on context) and bike racks. Mixed-use developments that activate the streetscape, such as outdoor seating, plazas, wider trails, and bike parking are highly encouraged. Depending on the context of different street segments, existing developments should be encouraged to redevelop in a way that supports the intent of the Connecting District. Like all placetypes, new developments should respect the character of already established developments nearby.
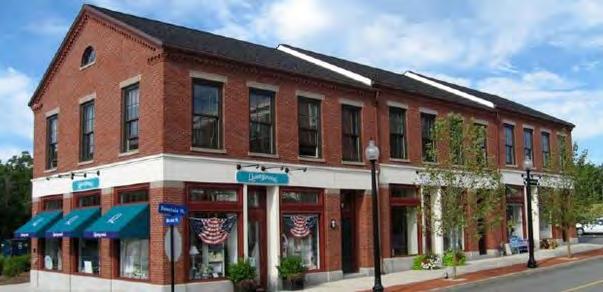
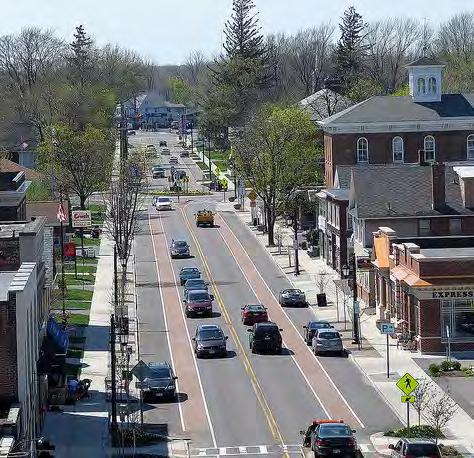
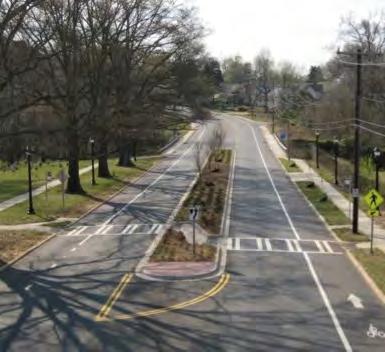
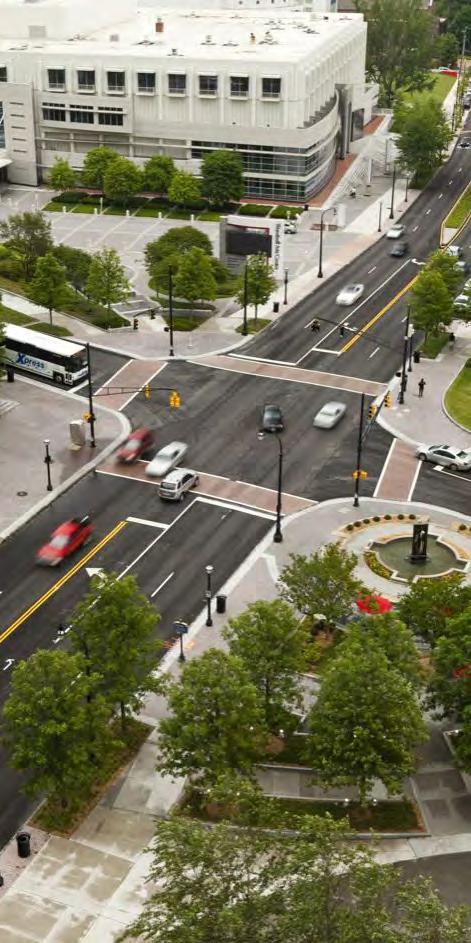
Connecting Corridors should not only connect people to landmarks in the community, but also to the streets themselves. Streets are and can be more than simply a way to travel. They are where neighbors can meet at informal gathering spaces, such as pocket parks, a cafe, or an outdoor games like a public chess board.
Buildings are the engines that make these activities possible. Their orientation toward the street is crucial to enhancing the streetscape, improving walkability and bikeability, and creating vibrant public spaces. Whereas most development in previous decades have been oriented around car parking, buildings along Connecting Corridors orient around the street, making it easier and more comfortable for pedestrians and bicyclists to access buildings. See the Strong Towns’ toolkit for additional zoning and design strategies: http://designyourtown.org/strategy/orientbuildings-to-streets/.
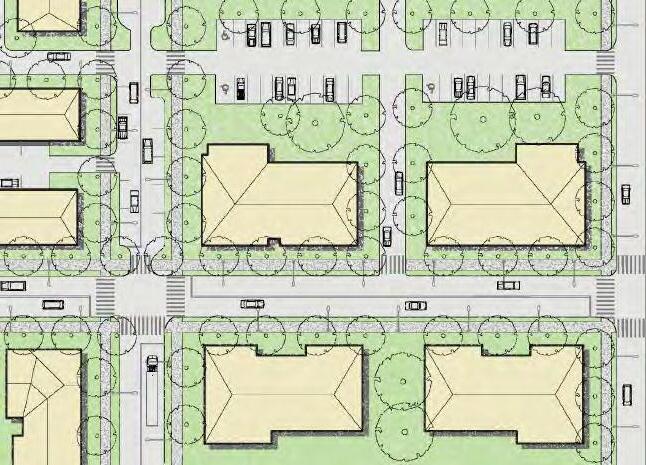
• Size primary parking lots for typical and reasonable demand and provide for peak parking in overflow areas away from primary street frontages. Promote shared parking opportunities.
Vehicular
Bicycle and Pedestrian
• Future decisions regarding parking and drive-aisle paving materials should take into consideration both storm water and air-quality considerations.
• Parking for large commercial trucks should be located toward the rear or side of buildings when possible and should not be adjacent to residential areas.
• A continuous sidewalk or trail should be maintained along all streets. This means sidewalks/trails maintain level grading instead of dropping down to the same level as vehicles at curb cuts, improving visibility of pedestrians and bicyclists for drivers, especially children.
• Bike racks should be easily locatable, such as being visible from the street, and placed near the main entrances to buildings or intersections. They can be shared between multiple developments.
• Outdoor seating, games, and other social activities along the Connecting District are highly encouraged.
• Street trees are critical for this placetype for several reasons, which may also be applied to all placetypes, including but not limited to:
Streetside Amenities
Building Placement
Amenities and Open Spaces
• Providing shade during hot summer days.
• Reducing wind speeds, both from weather and vehicular traffic.
• Discouraging speeding by creating a visual tunnel effect.
• Integrating nature into built-up areas.
• There should be minimal curb cuts into the site. Preferably vehicle access is shared between several developments to reduce the number of conflict points and possibility of crashes.
• There should be nearly direct access from a sidewalk/trail to the main entrance of a building. The entrance should be set back at least 10 feet but no more than 50 feet from a sidewalk or trail to maintain easy access for pedestrians and bicyclists, hence a walkable atmosphere.
• Design buildings around a central organizing feature or gathering space, like a common green or plaza, promenade, natural feature, or other shared space, excluding parking areas. Programmed common spaces surrounded by active uses and buildings attract or retain customers and convey a sense of community.
• Integrate green infrastructure such as tree boxes, permeable pavement, and green roofs to reduce urban flooding and heat island effects.
• Integrate paths and outdoor recreation areas that are used as amenities by employees.
Landscaping
• New developments should be buffered from surrounding developments of a different use with landscaped areas, screened parking areas, and open spaces that shield the view of structures, loading docks, or existing outdoor storage.
Orientation
Entrances
Height
Mixed-Use Integration
• Wherever possible, front commercial buildings along primary streets to ensure visibility and accessibility. Avoid street frontages dominated by parking lots or buildings set back large distances from the street.
• Orient new, commercially-focused buildings toward the street with street fronting entrances that connect to sidewalks.
• Residential building entrances should not front a major street unless there is a walk-up entrance, or in other words, residential entrances are above the street level by several feet.
• No taller than five stories -- except in the Downtown Core and the Employment Hub placetypes -- or two floors taller than existing development in the area, whichever is shorter.
• Buildings may be mixed vertically or horizontally, depending on the context:
• If there are mostly standalone buildings nearby, such as detached homes, horizontal mixing should be utilized.
• If there are multi-story buildings nearby, or if a new multi-story building fits with the character or future vision for the area, vertical mixing of land uses should be utilized.
Heavy Vehicular Traffic
Light Industrial Uses
• When located on CR 200W, CR 300N, or CR 300S, buildings may be set back further to accommodate enhanced landscaping and open spaces to provide greater separation between heavy street traffic. This is especially encouraged in the Employment Hub and Suburban Commercial Center placetypes.
• New light industrial uses considered within this placetype should be low impact, small-scale, incorporate clean emissions, and selfcontained to the interior of the building if adjacent to residential uses.
• Reposition or redevelop aging or obsolete shopping centers to more effectively compete in current and future retail markets and deliver goods and services to the local community.
Redevelopment
and Infill
• Housing should be integrated into under-performing, mixed-use corridors and centers to help increase housing access.
• Commercial and smaller office uses should be integrated into edge areas to transition into and provide a buffer for surrounding neighborhoods.
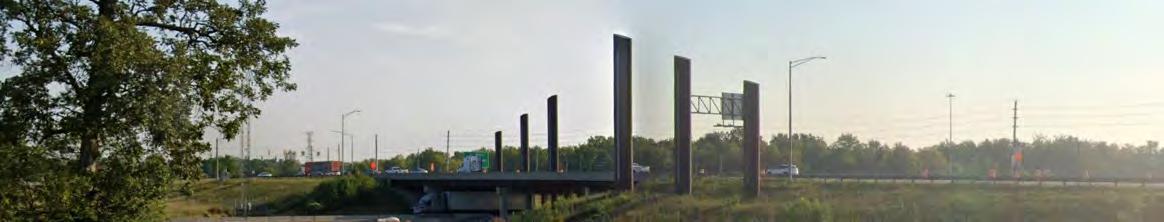
Rather than specific locations, these two placetypes represent a special development consideration for a general area on the Future Development Map. Gateways are located at significant entry points into the Planning Area, especially around existing or future built-up areas that. Gateways should be used to create a sense of arrival for visitors to and residents of Greenfield. This sense of arrival can be created through signs, monuments, or archways designed in a way that represents the community’s heritage, history, and culture. Creativity is encouraged when deciding how best to site and design gateways.
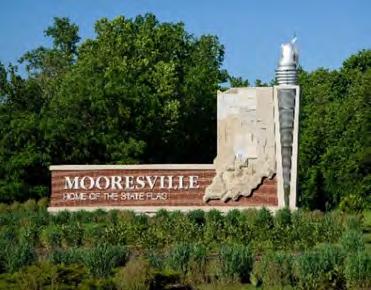
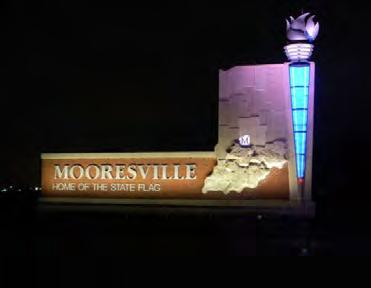
Similarly, there are several areas defined in the Future Development Map where City staff and officials should consider a new park to ensure families and residents in new developments remain well-served and have opportunities to connect with nature. The purpose, design, and amenities of these parks should follow guidelines established in the City’s Parks and Recreational Master Plan, as well as provide opportunities for public input. The locations of these New Parks are recommended based on a walkability analysis shown below. The walksheds, or the distance someone can walk in a certain amount of time, resulting from this analysis are shown below. The analysis involved two common methods to determine walksheds using geospatial analysis:
1. Creating half-mile buffers representing a 15-to-20-minute walk
2. Conducting a network analysis using a geographic information systems (GIS) program, ArcGIS Pro.
There are limitations to both of these methods, such as how different people walk at different speeds, but the analysis should provide a general guideline for the City’s Park Board, Parks and Recreational Department, and future planning efforts.
“Where there is a New Park and a Neighborhood Center recommended on the Future Development Map, the Neighborhood Center should include a relatively larger open space and/or greenspace as the central orienting feature. Development should hence radiate out from the open/greenspace.”
...from the Neighborhood Center: Special Considerations
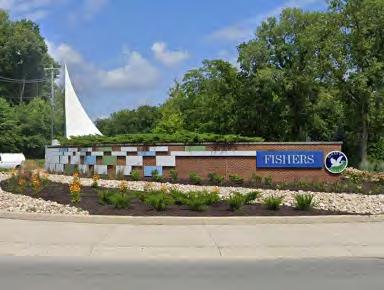
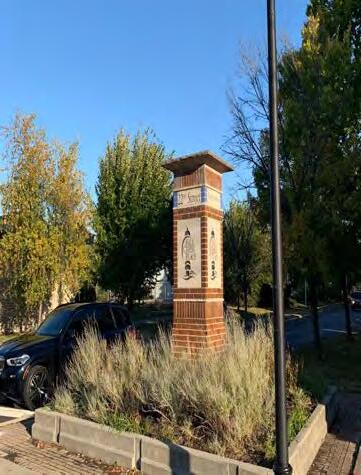
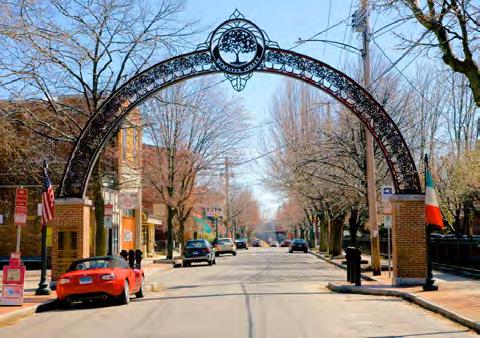
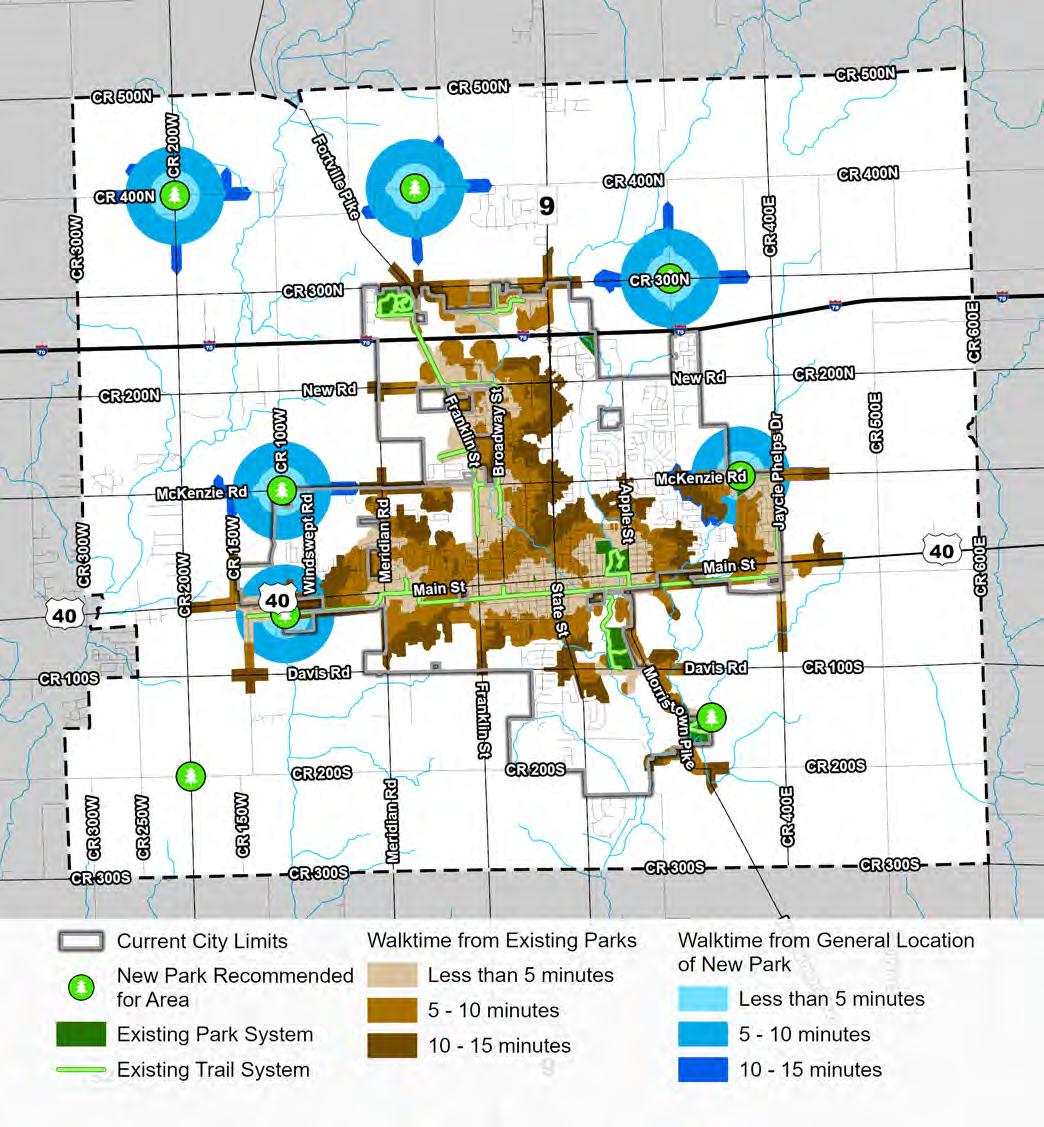
The undeveloped green space located northeast of the State Road 9 (State Street or SR 9) and Interstate 70 (I-70) interchange provides a unique opportunity for mixed-use development with convenient access to the interstate and downtown Indianapolis (approximately twenty miles due west of the interchange). Most importantly, due to its accessible and highly visible location, this site is suitable for commercial, retail, and office space. An additional opportunity is that development can be both externally focused on State Road 9 and internally focused on the Brandywine Creek
corridor, creating automobile connectivity to adjacent developments along SR 9, and creating pedestrian connectivity beneath the interstate to the City’s trail system to the south.
Within the site design concept, large commercial, retail, and office space would occur along SR 9 while residential, hospitality, and recreational development would locate more internal to the development, away from SR 9. East of Brandywine Creek, development would be limited to single-
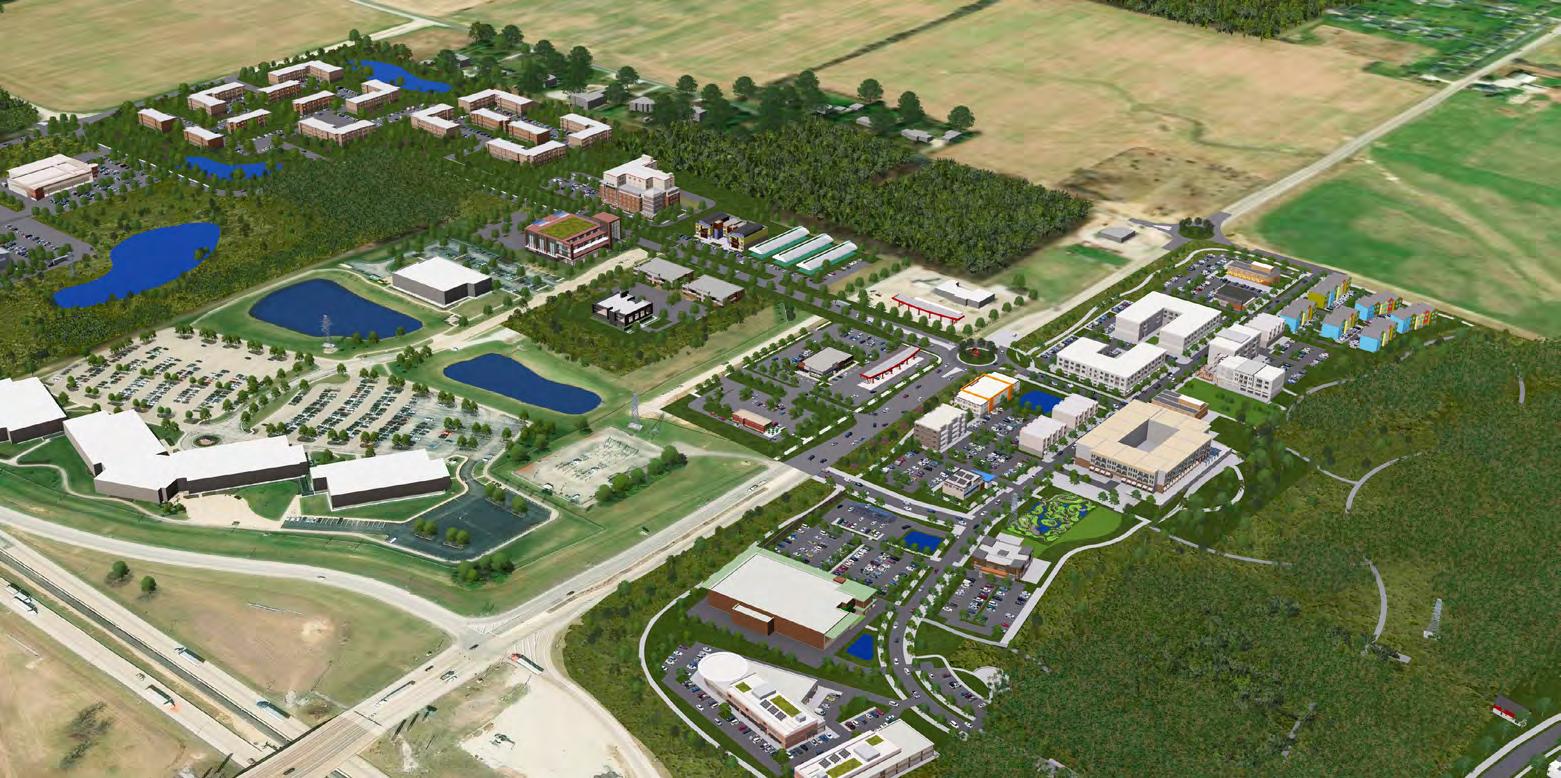
family residential. A main road is proposed to travel north-south through the east and west sides of the property, connecting to CR 300N on the north side of the property and across the creek on the south side of the site. Vehicular access to SR 9 is aligned with existing roadways west of SR 9 and roundabout improvements are recommended for the intersections of Opportunity Parkway and E 300 N.
• Employment Hub Placetype
• State Road 9 Corridor Study
Key considerations for establishing successful development at this location include focusing new buildings towards SR 9 and the internal roadway, and maintaining parking towards the rear, or center of new buildings and structures. Large surface parking lots should be avoided and parking should be placed in parking structures clad with mixed-use development where possible. Exceptions to this will need to occur, and where parking lots are developed adjacent to the roadways, they should be screened from view using vegetation and/or site walls.
Accessible pedestrian paths and trails should connect the new buildings to the primary roadways and improved intersections along SR 9 should include provisions to allow pedestrian and bicycle crossing. Internally, multi-modal paths should connect to the city’s trail system south of the interstate. Where accessible paths are intended to be multi-modal, they should be a minimum of eight feet wide, and where they are intended to be pedestrian only, they should be a minimum of five feet wide.
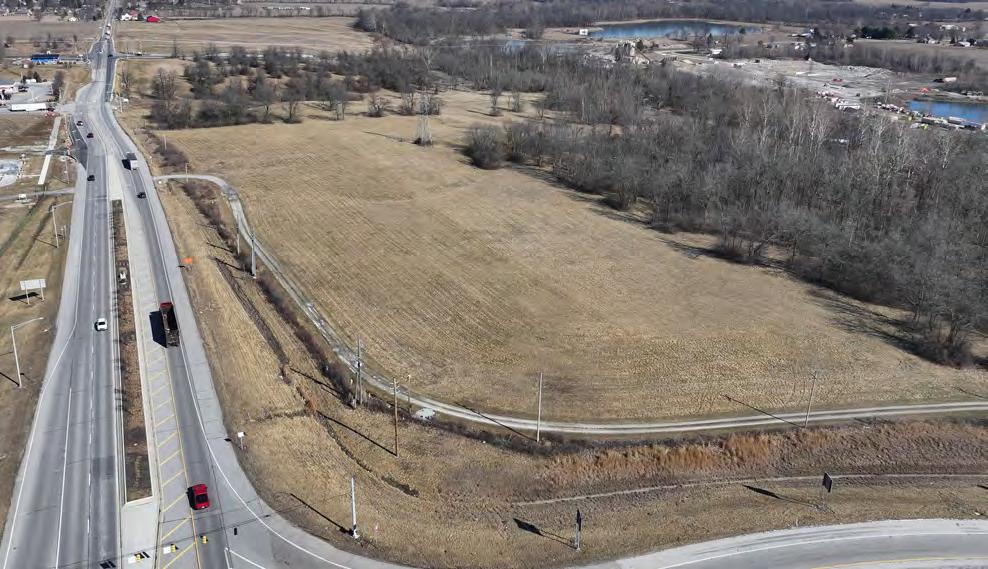
Brandywine Creek’s floodplain approximately follows the tree line
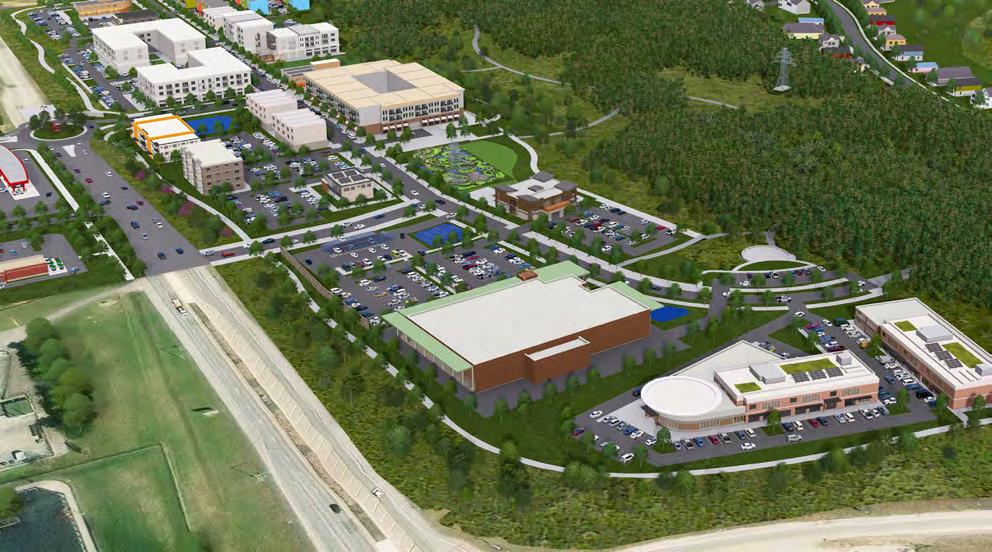
The floodplain and sensitive slopes should be protected from building and intensive development and reserved for park, open space, and trail development. New roadways should incorporate tree lawns/amenity zones and provide both pedestrian and vehicular lighting. New buildings should be limited to four stories and the structures should be a maximum size, utilizing design principles such as building stepbacks to help reduce their perceived scale and to help promote walkability.
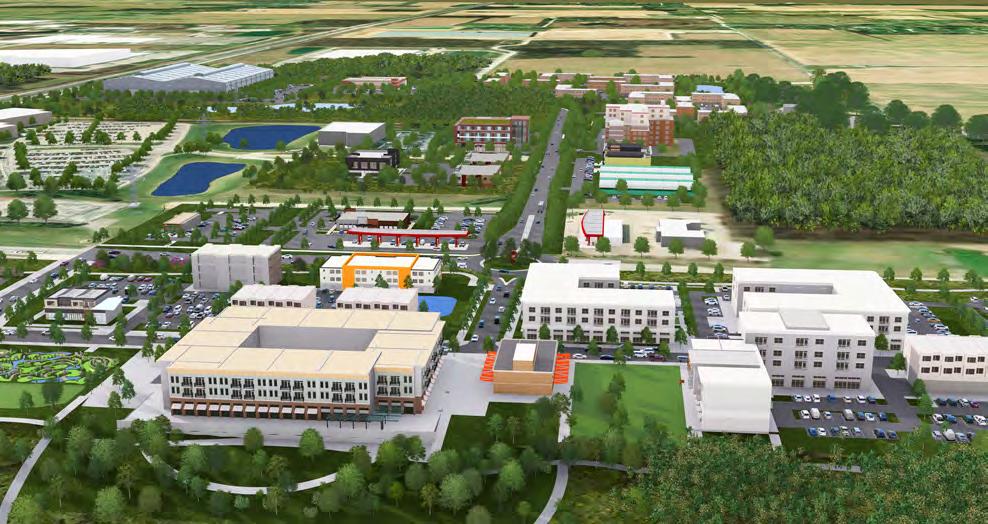
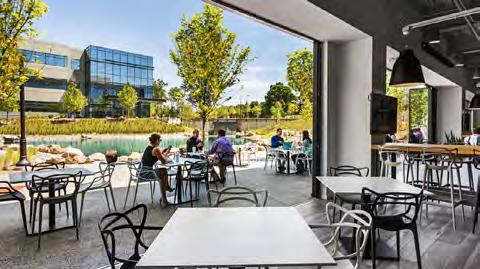
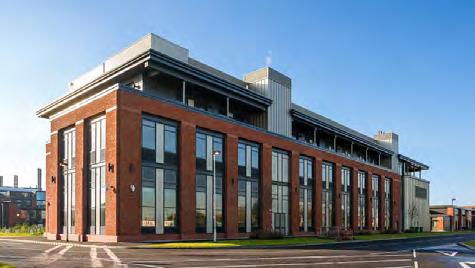
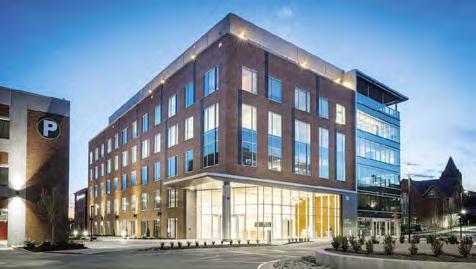
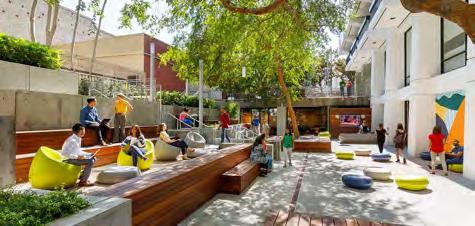
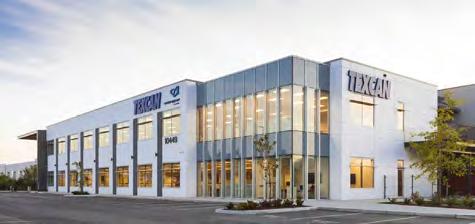
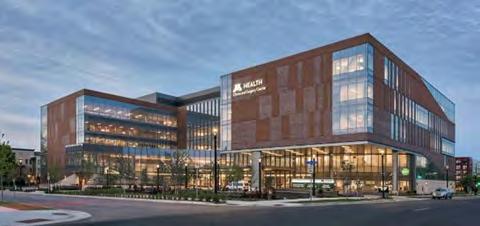
Several undeveloped sites remain northwest of the SR 9 and Interstate 70 interchange and near the Elanco headquarters. This area has established roadways and utility infrastructure, as well as multiple established parcels. Development within this area is focused on additional convenience, office, and commercial space near SR 9 and multi-family residential and hospitality development further west of SR 9. The primary vehicular access to the area is from the intersection of SR 9 and Opportunity Parkway which is envisioned to receive intersection improvements, including a roundabout, to promote increased vehicular safety, pedestrian safety, and connectivity to the proposed development east of SR 9.
Key considerations for establishing successful development in this area include extension of pedestrian and bicycle infrastructure to increase connectivity to Brandywine Creek and the city’s trail system to the east. Multi-modal paths should be a minimum of eight feet wide. Additionally, surface parking lots should be maintained internally or to the rear of new private development, encouraging the buildings to be located along the roadways. New buildings should be limited to four stories and the structures should be a maximum size, utilizing design principles such as building step-backs to help reduce their perceived scale and to help promote walkability.
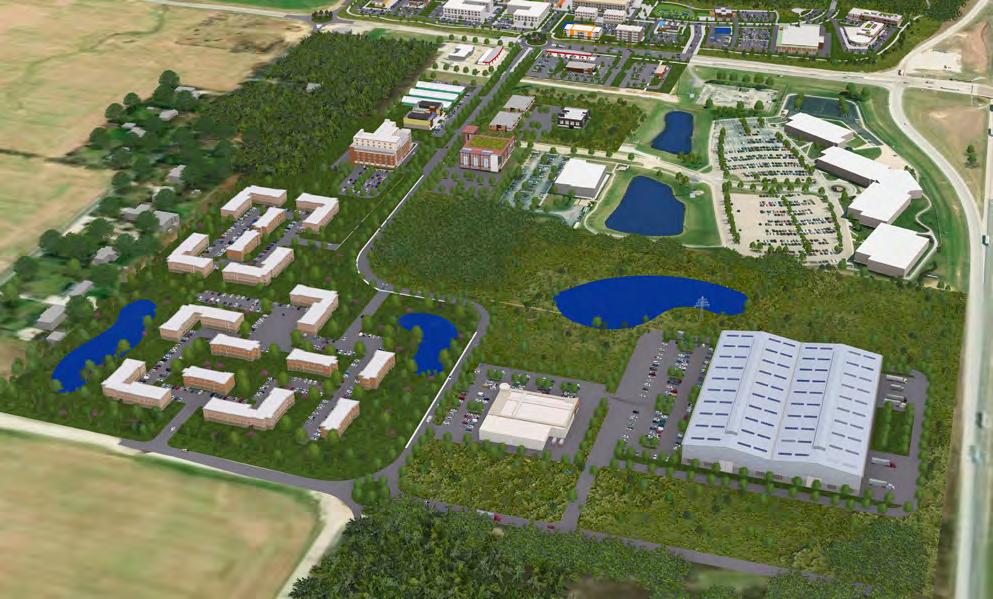
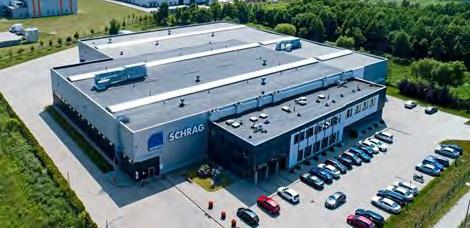
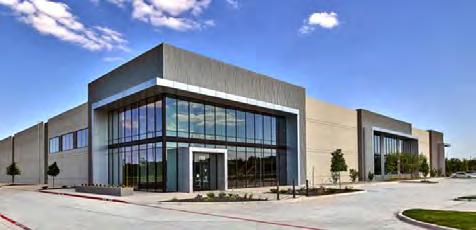
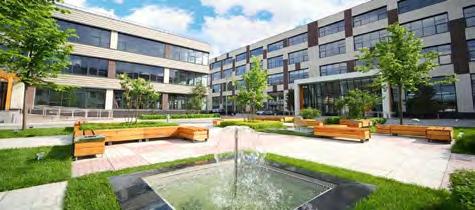
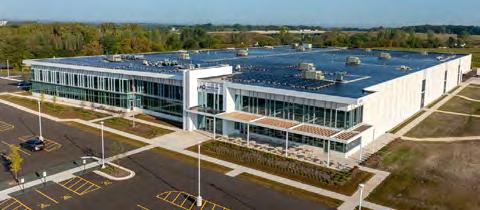
The redevelopment of the Pennsy Trail through downtown Greenfield is a unique opportunity to create mixed-use, trail-oriented development that will complement ongoing downtown revitalization. Within two blocks of Main Street, the vision for the Pennsy Trail redevelopment includes the creation of a multi-modal boulevard/ linear park that creates a series of linked, public spaces anchored by Depot Street Park on the west and surrounded by new buildings that incorporate parking structures clad with first floor retail, upper-level housing, and downtown hospitality opportunities. The vision is to create a walkable and vibrant district where people live, work, recreate, and contribute to the downtown atmosphere and economy. Building design should be respectful of the downtown’s historical character. However, buildings may incorporate some contemporary elements like rooftop balconies or materials so long as they do not overwhelm or diminish the overall historical character.
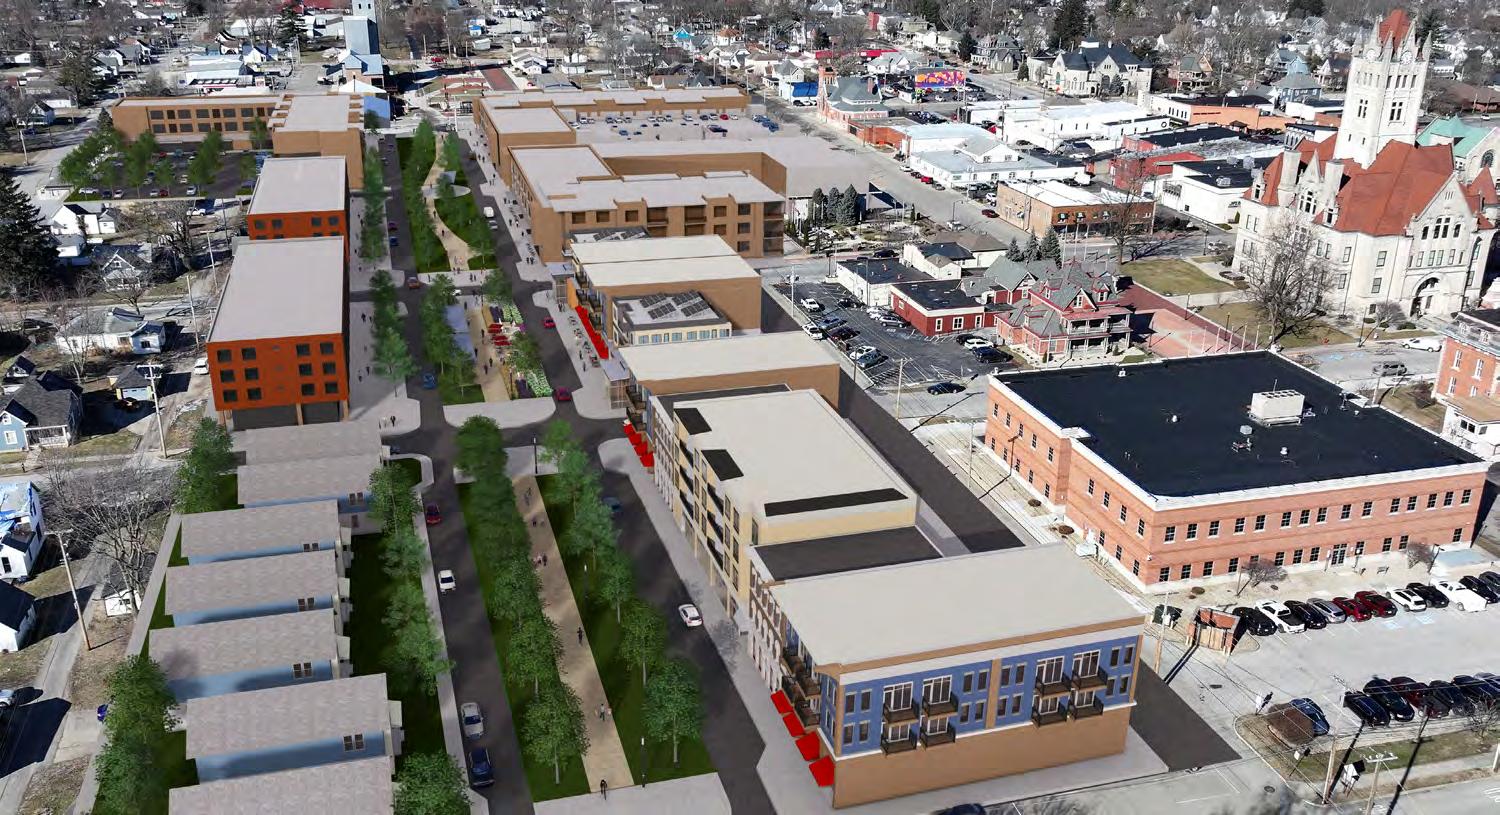
• Trail-oriented development
• Downtown Mixed-Use Placetype
Key considerations for establishing a successful Pennsy Trail redevelopment include dedication of a central right-of-way large enough to accommodate the trail, public space, vehicular traffic, parking, and development adjacent sidewalks. The central public space should be a minimum of 55’ feet wide with a multi-modal trail that is a minimum of eight feet wide - twelve feet is preferrable. Destinations and amenities within the public space should be strategically located and designed to complement adjacent developments. The public space should be well-connected to Main Street and the rest of the Greenfield community with complete street networks to promote connectivity. The street adjacent to the public space should incorporate narrow travel lanes, less than twelve feet wide, and on-street parking that is seven to eight feet wide. Curbs should “bump-out” at intersections to narrow the street at pedestrian and bicycle crossings to enhance safety and slow down vechular traffic. Sidewalks adjacent to new development should be generous in width - at least 15 feet - to allow for on-street dining, temporary signage, and retail spaces. New buildings should be constructed with a zero-lotline approach so that buildings are consistently located adjacent to the public right-of-way, which will establish a comfortable, walkable, and human-scale corridor. Building heights should not exceed four stories. Their facades should vary to eliminate large, uncomfortable monoliths. Surface and/or garage parking should be placed in the rear, or the center, of new developments.
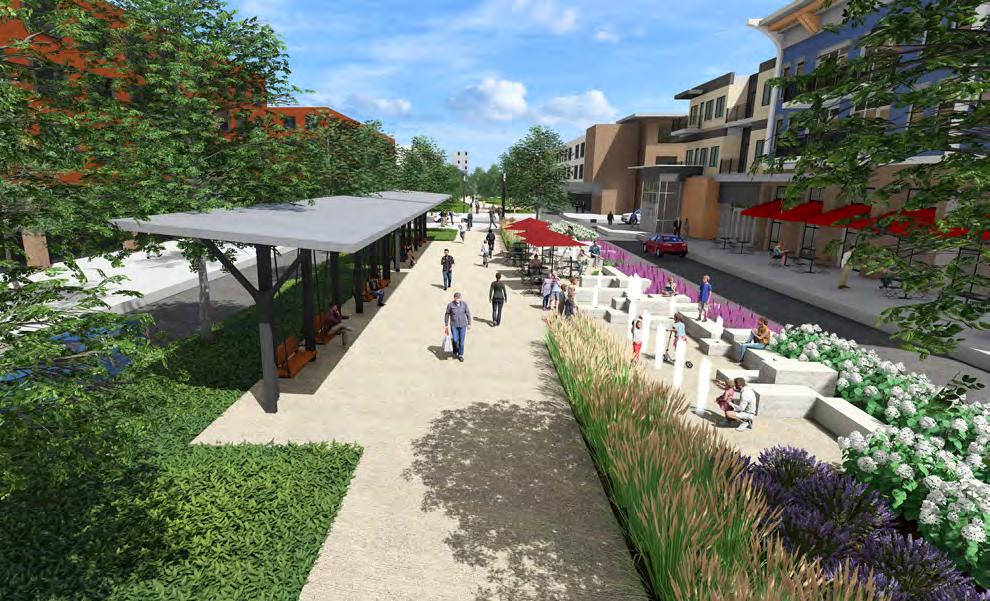
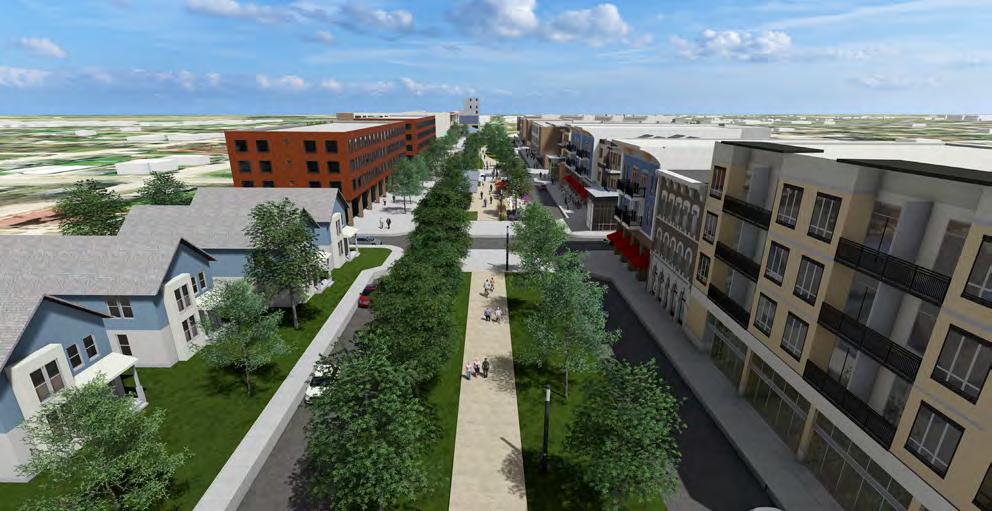
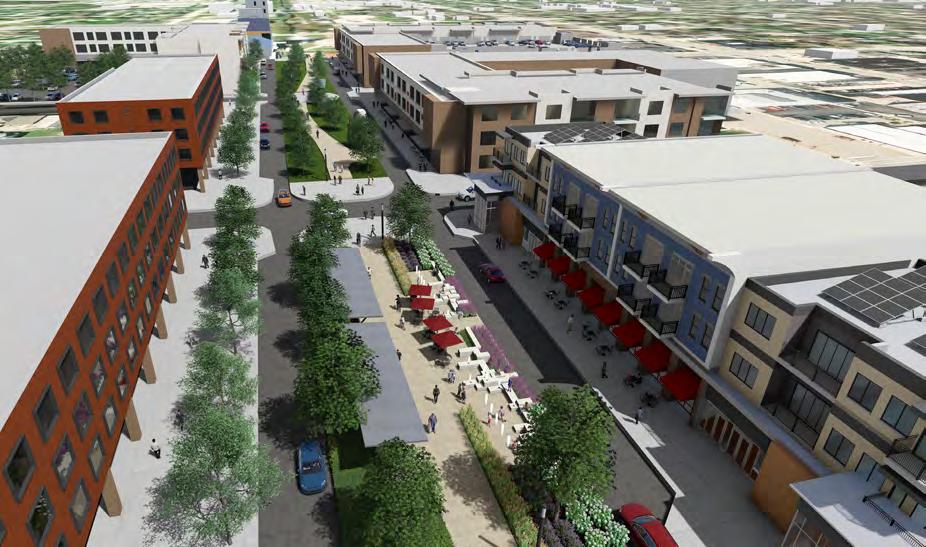
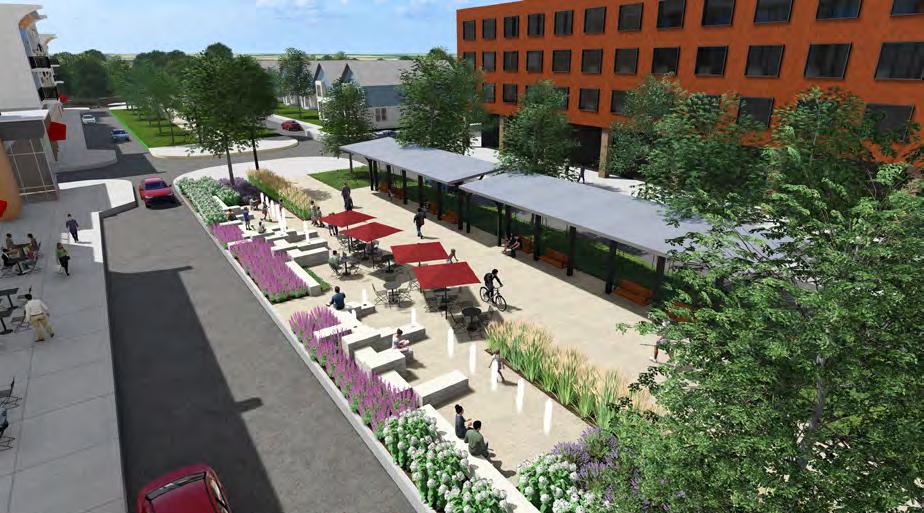
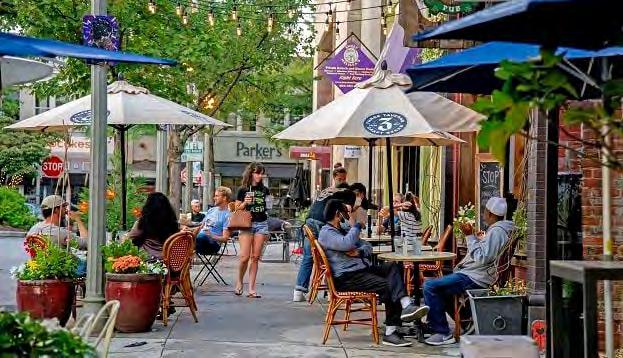
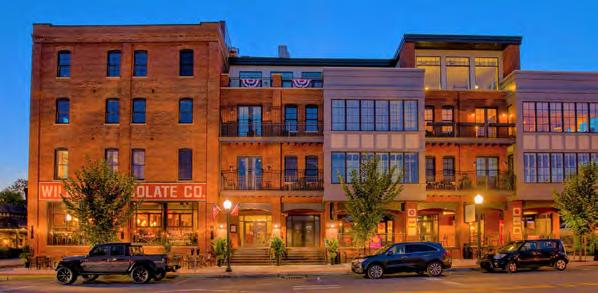
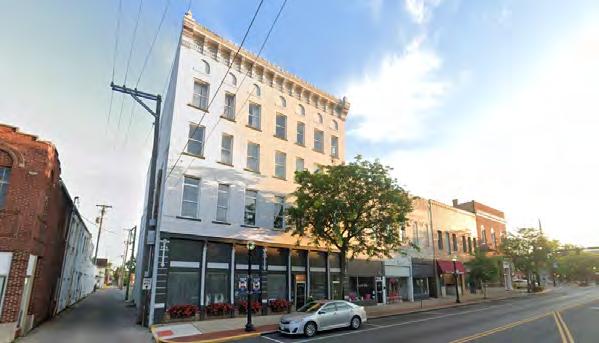
This page is intentionally left blank.
Implementation, otherwise known as “action,” is a process through which the Goals, Objectives and Recommendations of this Plan are translated into meaningful change and intentional efforts which advance the Vision. The Plan is intended to be implemented over a 30-year timespan, acting as the community’s roadmap to the year 2055. This allows time for city officials and staff to organize and act intentionally to avoid being overwhelmed by implementing the plan and the necessary daily tasks like development review, permitting, and infrastructure maintenance. This also allows the city time to create capital improvement strategies and identify funding sources to implement recommendations, which can take time to procure.
Once the Plan is adopted, there are several initiatives to pursue that lay the groundwork for much more effective action on the Plan’s recommendations, especially for the “Act Now” Recommendations. These initiatives are:
1. Share the Plan Widely: Meet with city departments and elected and appointed officials in Greenfield to review and discuss the Plan’s adoption. This brings everyone onto the same roadmap, building capacity for implementation.
2. Recruit Partners: Along with city personnel, talk to local businesses, organizations, county governments, and nonprofits to see how they can play a role in implementing the Plan and determining if/when they have the capacity to do so.
3. Get Community Ownership of the Plan: The steering committee and city officials should be able to readily talk about 1 to 3 priority recommendations. Encourage topics in the Plan to be on community leaders’ agenda throughout Greenfield.
4. Empower Staff and Partners to Act Now: Commit to providing time, budget, and other resources in a reasonable manner. Allow space to overcome challenges and unforeseen circumstances. Commitment, trust, transparency, and buy-in will sustain the implementation process over time.
5. Schedule Recurring Meetings: There should be a conscious effort to track progress, and when necessary, pivot to an alternative implementation method. Planning staff should hold a regular strategy review meeting with City Council and keep them engaged in plan implementation.

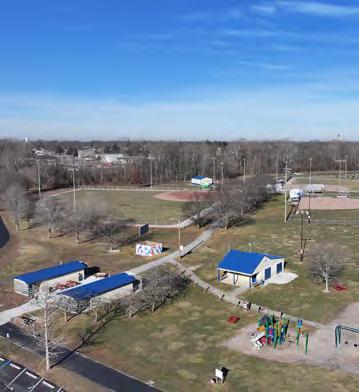
Planning is only effective when it results in action. This is why engaging the community and stakeholders in government and local organizations is significant for building partnerships, enhancing accountability, and celebrating accomplishments together. From years of experience, including previous planning efforts and professional insights, here are several reasons why some plans aren’t implemented or only partially implemented:
• Conflict: Differences over what actions to take will result in no action at all, or when pursuing accountability, it is done in a unconstructive or unproductive way.
• Capacity: There are not enough staff, time, energy, or funding available or planned.
• Continuity: Community leaders change over time naturally, but new leaders are not or do not become familiar with the Plan or buy into the Plan’s priorities.
• Accountability: There is not a conscious effort to continually use the Plan for decision-making, which may stem from lack of knowledge, understanding of the Plan’s value, or how to use the Plan in decision making.
• Understanding Its Value: The Plan is thought of as ‘done’ once it is adopted instead of the beginning of a 20-year effort, and/or the community’s long-term Vision and Goals are disregarded for short-term gains.
• Unrealistic Expectations: The Plan is expected to address every issue. It is only a guiding document specifically for development and other issues such as social issues. However, the plan should be amended from time to time as the needs and wants of the community change (see Chapter 1: A ‘Living’ Document).
• It is seen as the Planning Department’s plan, instead of the community’s plan: Many times departments only think of it as the planning department’s plan instead of understanding that the plan influences and informs many other community services such as utilities, transportation, parks, emergency services, etc. This is a community wide plan where public input was sought and used to develop the vision, goals, and recommendations and should be used by other departments to inform their projects and plans.
The following matrix provides structure for the city to partner with organizations and prioritize when to implement the Objectives of the Plan.
The matrix includes:
• Next Steps
• A Primary Lead
• Suggested Partners
• Level of Difficulty
• Estimated Time to Complete
Figure 4-1: Recommended Implementation Process Start implementation based on the ‘Next Steps’ Reach out to Suggested Partners Prioritize by Level of Difficulty Prioritize by Estimated Time to Complete 1 2
• Act Now: High priority objectives that set the framework for success for several other recommendations and whose impacts will change the trajectory of planning and development decisions for the lifespan of the Plan.
• Prepare: Particularly challenging objectives where additional time may be needed, such as intensive research and capacity building, and would be more impactful when certain “Act Now” recommendations are completed.
• Learn: Objectives where the priority is observing and identifying ongoing or upcoming trends before taking action. This allows more proactive and strategic approaches to be created, especially because there are relatively more unknowns influencing these objectives. Possible preparations may include scenario planning for unexpected or low-confidence trends.
A Primary Lead is the main contact point and organizer for the implementation of an Objective, who is typically a part of the city government. The Primary Lead may change over time as roles and responsibilities in the community evolve. However, the responsibilities of a Primary Lead should stay the same, which include:
• Defining the scope of implementation
• What actions to take, considering the recommended actions in Chapter 2
• Capacity building, such as what partners to bring on board and what funding might be necessary
• Troubleshooting, such as resolving conflicts that may arise during implementation, assessing the implementation process, and considering alternative strategies (i.e. pivoting) when necessary
The suggested partners are other entities that could help during the implementation of the Objective. Their role in implementation may be limited or expansive, depending on the Objective, and this should be communicated early on by the Primary Lead. Collaboration between city departments, governments, nonprofits, consultants, and public-private partnerships are some but not all options to alleviate some of the workload from limited city staff and public resources. The benefits of partnerships extend beyond alleviating the city’s workload, though, and include establishing relationships between the city and key organizations, building trust and community buyin to the Plan, and more.
An Objective’s level of difficulty depends on many factors, but some of the most common reasons are staff capacity (time and energy), funding, infrastructure capacity, and some level of continuity in leadership is required because the implementation process may take several years. Factoring in these reasons, Objectives have been ranked relative to each other from 1 (most difficult) to 4 (least difficult):
1. Most Difficult
2. More Difficult
3. Somewhat Difficult
4. Least Difficult
The estimated time to complete describes how long an Objective may take to implement once work has started. It does not represent when the implementation will begin over the 20-year lifespan of this Plan.
• Less than 1 year
• 1-4 years
• 5+ years
• Ongoing (i.e. to be implemented into the workflow of City staff or officials, or whenever a fitting situation occurs)
These estimates are partially based on an Objective’s difficulty rating and partially based on experience from previous planning efforts, such as the amount of time it takes to procure a grant or finance and construct a project. These timeframes are meant as general guidelines around which the City and its partners can plan how to allocate their time and resources. Depending on the conditions at the time of implementation, the Primary Lead should take into consideration factors that may make the estimate time to complete longer or shorter.
A.1. Identify key focus areas to target investment and ensure growth to diversify the city’s tax base and bring new employment opportunities.
A.2. Ensure safe, compact, well-connected, and orderly development patterns that are pedestrian- and bicycle-oriented.
Act Now Hard (1) Less than 1 Year
Prepare MediumHard (2) Ongoing Effort
• Board of Works
• City Council
• Public and Private Utilities
• Mayor’s Office
• Planning Department
• Plan Commission
• City Engineer
• City Council
• Plan Commission
• INDOT
• Parks Department
• Board of Works
• Developers
• Stormwater Department
• Board of Zoning Appeals
• Federal Emergency Management Agency
• Plan Commission
A.3. Through thoughtful design, preserve natural and sensitive environmental features.
Learn MediumEasy (3) Ongoing Effort
• City Engineer
• Developers
• Property Owers
• Hancock County Drainage Board
• Indiana Department of Natural Resources
A.4. Align development and unified development ordinance (UDO) regulations with the future vision of the community.
Act Now Hard (1) Less than 1 Year
A.5. Develop a future annexation strategy for the city.
Act Now MediumHard (2) Less than 1 Year
• Planning Department
• Plan Commission
• City Council
• Mayor’s Office
• City Council
• Comptroller
• Redevelopment Commission
• Hancock Economic Development Council, Property Owners
• City Attorney
• Planning Department
A.6. Create fiscally responsible budgets for necessary investments that support population and business growth.
B.1. Retain, expand, and support existing businesses that contribute to the local economy.
Prepare Hard (1) Ongoing Effort
Prepare Hard (1) Ongoing Effort
• City Council
• Comptroller
• City Attorney
• All City Departments
• Mayor’s Office
B.2. Support education and workforce development. Learn MediumHard (2) Ongoing Effort
• Hancock Economic Development Council
• Greenfield Chamber
• Greenfield Main Street
• Redevelopment Commission
• Hancock County
• Greenfield-Central School Corporation
• Ivy Tech
• Hancock Regional Hospital
• Greenfield Chamber
• Hancock Economic Development Council
• Hancock Economic Development Council
• Greenfield Chamber
B.3. Attract new businesses that will invest in the community Prepare Hard (1) Ongoing Effort
B.4. Build a strong economy that can withstand economic shifts. Learn Hard (1) Ongoing Effort
• Hancock County Redevelopment Commission
• Greenfield Redevelopment Commission
• Indiana Economic Development Corporation
• Hancock Economic Development Council
• Greenfield Chamber
• Hancock County Redevelopment Commission
• Greenfield Redevelopment Commission
• Indiana Economic Development Corporation, Local Business Workers
• Hancock County Tourism
• Shop Local
B.5. Attract and retain a range of talents to meet local economic needs.
Prepare MediumHard (2) Ongoing Effort
B.6. Encourage and foster a culture of entrepreneurship. Learn MediumEasy (3) Ongoing Effort
• Hancock Economic Development Council
• Greenfield Chamber
• Hancock County Redevelopment Commission
• Greenfield Redevelopment Commission
• Greenfield Main Street
• Indiana Economic Development Corporation
• Public and Private Utilities
• Lenders
• Entrepreneurs
• Redevelopment Commission
• Greenfield Main Street
C.1. Support development and redevelopment that builds on the heritage and character of downtown.
C.2. Encourage the development of mixed-use buildings and housing options downtown.
Act Now MediumEasy (3) 5+ Years
Prepare Easy (4) Ongoing Effort
• Historic Preservation Board
• Greenfield Main Street
• Property Owners
• Investors
• City Council
• City Council
• Hancock County
• INDOT
• Property Owners
• Redevelopment Commission
• Investors
• Indiana Office of Community and Rural Affairs
• Indiana Department of Natural Resources
• Indiana Housing & Community Development Agency
• US Federal Emergency Management Agency
• US Environmental Protection Agency
C.3. Improve infrastructure within the downtown area to support increased density. Prepare MediumHard (2) 5+ Years
• Historic Preservation Board
• Greenfield Main Street
• Property Owners
• Investors
• City Council
• Local Banks
• Planning Department
• Mayor’s Office
• Hancock Regional Hospital
• Greenfield Main Street
• Greenfield Chamber
C.4. Expand and diversify employment options downtown. Prepare Hard (1) 1-4 Years
C.5. Advance a pedestrian- and bicycle-friendly downtown. Act Now Hard (1) 5+ Years
• Hancock Economic Development Council
• Entrepreneurs
• Investors
• Private Utilties
• Hancock County Tourism
• Street Department
• City Engineer
• Parks Department
• Greenfield Main Street
• Community Foundation of Hancock County
• INDOT
• City Council
• Parks Department
• Greenfield Main Street
• Hancock Arts Council
• Hancock County Library
C.6. Continue to support a wide range of activities and amenities for all ages. Learn Easy (4) Ongoing Effort
• Greenfield-Central School Corporation
• Riley Festival
• Community Foundation of Hancock County
• Hancock Regional Hospital
• Hancock County Tourism
• Mental Health Partners
• Ricks Theater
C.7. Streamline the approval process for downtown mixed-use projects.
Act Now Easy (4) Less than 1 year
D.1. Support and increase the supply of a variety of housing and living options. Act Now Hard (1) 5+ Years
• Planning Department
• Mayor’s Office
• City Council
• Plan Commission
D.2. Identify and address the barriers and gaps in available housing for varying socioeconomic and age groups.
Act Now MediumHard (2) Less than 1 Year
D.3. Encourage and enforce, when possible, maintenance of residential properties. Prepare MediumEasy (3) Ongoing Effort
D.4. Prioritize the development of housing in locations with pedestrian and bicycle access to local destinations.
Prepare MediumHard (2) Ongoing Effort
E.1. Construct an accessible and safe transportation network for multiple modes of transportation. Prepare Hard (1) 5+ Years
• Developers and Builders
• Redevelopment Commission
• City Council
• Planning Department
• Developers and Builders
• Redevelopment Commission
• City Council
• Planning Department
• Planning Department
• Developers and Builders
• Redevelopment Commission
• City Council
• Planning Department
E.2. Invest in utilities, and plan for expansion based on the Future Development Map. Prepare Hard (1) 5+ Years
• Community Foundation of Hancock County
• City Council
• City Departments
• Senior Services
• City Council
• City Departments
• Board of Works
• Plan Commission
• Mayor’s Office
E.3. Maintain strong intra- and inter-governmental collaboration. Act Now MediumEasy (3) Ongoing Effort
E.4. Ensure adequate staffing of civil servants and public services. Act Now Hard (1) Ongoing Effort
• Hancock County
• Towns and Cities in Hancock County
• Indy MPO
• County Staff
• Elected Officials
• Various State Departments.
• All City Departments
• City Council
• Mayor’s Office
• Clerk-Treasurer
• Board of Works
• City Council
• Mayor’s Office
E.5. Strengthen community safety and security resources.
Learn MediumHard (2) 1-4 Years
F.1. Foster accessible, active, and engaging community spaces, designed to support mental and physical health that is suitable for an array of events for all ages and abilities.
F.2. Foster active use of community spaces through the arts, entertainment, and recreation.
Learn MediumHard (3)
Ongoing Effort
• Inter-Local Collaboration
• Hanocck County Emergency Management Agency
• Hancock County Commissioners
F.3. Promote design excellence and placemaking principles in all new and renovated public spaces.
Learn MediumEasy (3) Ongoing Effort
• Parks Department
• Hancock Regional Hospital
• Hancock County
• Religious, Civic, and Nonprofit Organizations
• Community Foundation of Hancock County
• Indiana Economic Development Corporation
• Indiana Office of Community and Rural Affairs
• Parks Department
• Streets Department,
• Hancock County
• Community Foundation of Hancock County
• Greenfield Main Street
• Local Businesses
Prepare Easy (4) Ongoing Effort
• Planning Department
• Community Foundation of Hancock County
• Hancock Economic Development Council
F.4. Incorporate community voices into the design, programming, and stewardship of public spaces. Prepare MediumEasy (3) Ongoing Effort
F.5. Establish metrics and systems to track participation, community satisfaction, and programming diversity. Act Now Easy (4) 1-4 years
• Parks Department
• Religious, Civic, and Nonprofit Organizations
• Hancock Regional Hospital
• Hancock County
• Community Foundation of Hancock County
• Parks Department
• Planning Department
• Mayor’s Office
This section lists certain recommended resources, including grants, cooperative agreements, and technical assistance programs that could help with the implementation of the Plan. It is intended for the Primary Lead of an Objective to research and pursue grants or delegate this task to one of their partners in implementation.
At the national level, almost all grants and technical assistance programs can be found at https://grants.gov/.
• US Department of Agriculture: Natural Resources Conservation Service
• US Environmental Protection Agency
• US Economic Development Agency
• US Department of Transportation
• US Small Business Administration
• US Department of Housing and Urban Development
• US Department of Interior
• National Park Service: Federal Historic Task Credit
• Land and Water Conservation Fund
• National Trust for Historic Preservation
• National Trust Preservation Fund
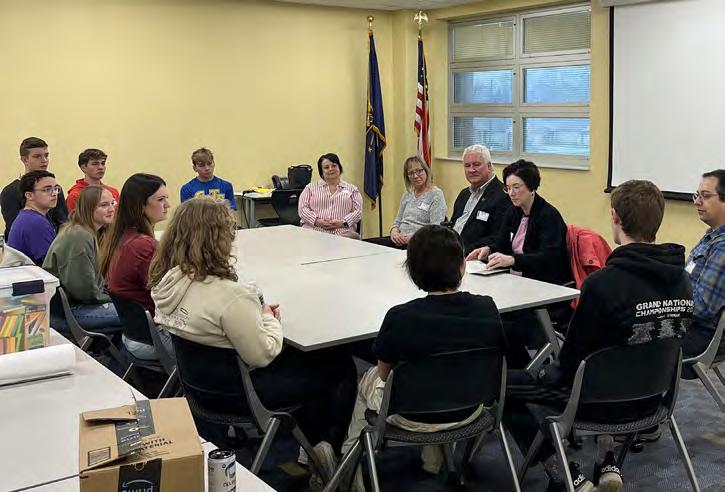
• Main Street America
• Arts Midwest
• National Endowment for the Arts
• “Our Town” Grant
• Grants for Arts Projects Program
• AARP
• Livable Communities Library
• Community Challenge Grant
• Capacity-Building Microgrants
• Demonstration Grants
• Senior Planet
At the state level, each state department will have its own grants listed on its webpage.
• Indiana Department of Transportation
• Community Crossings Matching Grant
• Indiana Department of Health
• Tactical Urbanism Demonstration Projects Supporting Active Transportation Grant
• Indiana Health Issues and Challenges Grant
• Planning Grants for Community Bicycle and Pedestrian Improvements
• Indiana Arts Commission
• Indiana Office of Community and Rural Affairs
• Indiana Main Street Program
• Community Development Block Grants
• Indiana Connectivity Program
• Indiana Landmarks
• Indiana Housing and Community Development Authority
• CreatINg Places Program/Grant
• Development Fund
• HOME Investment Partnerships Program
• Housing Trust Fund
• Indiana Department of Environmental Management
• Clean Water Act Section 205(j) Grants (Water Quality)
• Clean Water Act Section 319(h) Grants (Water Planning)
• Community Recycling Grant Program
• State Revolving Fund Wastewater and Drinking Water Loans
• Indiana Department of Natural Resources
• Community and Urban Forestry Annual Grants
• Land and Water Conservation Fund
• Indiana Trails Program
• Statewide Comprehensive Outdoor Recreational Plan
• Historic Preservation Fund Grant Program
• Certified Local Government Program (Historic Preservation)
• Discover the Outdoors Field Trip Grant
• Lake and River Enhancement Program
• National Road Heritage Trail
• Indiana Destination Development Corporation
• IDDC Grant
• Placemaking Activation Grant
• Indiana Economic Development Corporation
• Redevelopment Tax Credit Program
• Industrial Development Grant Fund
• Manufacturing Readiness Grant
• Skills Enhancement Fund (Workforce Training Grant)
At the regional level, the Indianapolis Metropolitan Planning Agency (Indianapolis MPO) can help fund and provide tools for analyzing economic development, transportation, and other planning projects. Finally, at the local level, the local chambers of commerce and community organizations, such as the Hancock Arts, Greenfield Main Street, and the Hancock County Community Foundation, may provide support and some community development grants depending on their own funding.
• Local Tax Increment Financing (TIF) Districts
• Local Riverfront District
• Local and National Historic Districts
• Indy MPO
• Transportation Improvement Program
• Local Planning Grant Program
• Hancock County Arts
• Hancock County Community Foundation (Hello Hancock)
• Greenfield Main Street
The American Community Survey (ACS) is a household survey developed by the Census Bureau to replace the long form of the decennial census program. It is a large demographic survey collected throughout the year from about 3.5 million addresses annually. The survey produces estimates for social, housing, and economic characteristics. The ACS also accumulates sample cases over 5-year intervals (i.e. 5-year estimates) to produce estimates for smaller geographic areas, including census tracts and block groups. See Census.gov for more information.
A comprehensive plan (also sometimes called a master plan, general plan, or community plan) is a foundational document for long-term planning and zoning for local governments, including cities, towns, counties, and other forms of local government. US states often require local governments to adopt a comprehensive plan to enact or change zoning regulations.
The US Census Bureau counts each resident of the country, where they live on April 1, every ten years ending in zero. The US Constitution mandates this enumeration to determine how to apportion the House of Representatives among the states. Unlike other surveys and programs done by the US Census Bureau, data from the Decennial Census is NOT an estimate — it is a count. See Census.gov for more information.
GIS connects data to a map, integrating location data (where things are) with all types of descriptive information (what things are like there). This provides a foundation for mapping and analysis that is used in science and almost every industry. GIS helps people understand patterns, relationships, and geographic context.
The benefits include improved communication, efficiency, management, and decision-making. See https://www.esri.com/en-us/what-is-gis/overview for more information.
Every Urbanized Area with a population of 50,000 or more (as defined by the US Census) is required by federal regulations to have a designated Metropolitan Planning Organization (MPO). MPOs are responsible for conducting a continuing, cooperative and comprehensive transportation planning process. The IMPO is comprised of more than 30 participating local governments such as cities, towns, counties, and public agencies across the Central Indiana region. Learn more at IndyMPO.org.
A geographic entity delineated by the Office of Management and Budget for use by federal statistical agencies. Metropolitan statistical areas consist of the county or counties (or equivalent entities) associated with at least one urban area of at least 50,000 population, plus adjacent counties having a high degree of social and economic integration with the core as measured through commuting ties. As of 2024, the Indianapolis MSA includes the counties of Marion, Boone, Hamilton, Tipton, Madison, Hendricks, Hancock, Morgan, Johnson, Shelby, and Brown. The Indianapolis MSA is NOT the same area as the Indianapolis Metropolitan Planning Organization. See Census.gov for more information.
The study area for this comprehensive plan, Greenfield in Gear, is the 30-year growth boundary defined by the City of Greenfield’s previous comprehensive plan adopted in 2015. A map is provided in the following pages.
The City of Greenfield is centrally located in Hancock County on the east side of the Indianapolis metropolitan area. The city takes part in regional planning efforts through the Indianapolis Metropolitan Planning Organization (Indy MPO). There are seven other municipalities in Hancock County: Fortville, McCordsville, New Palestine, Shirley, Spring Lake, and Wilkinson. Greenfield has been the largest municipality in Hancock County since the county’s creation in March 1828 and was chosen as the county seat in April 1828. Much of the land at this time was low and swampy, only
Figure 5-1: Regional and County Context
allowing the development of farmsteads on the few dry hills and knolls above Blue River and Sugar Creek. Gradually, surrounding lands were drained and irrigated for agricultural production, with only a few surviving wetlands today. Around 1835, the National Road (also known as US 40 or Main Street) was built through Greenfield, which facilitated wagon shipments from the Indianapolis area to Cincinnati and beyond.
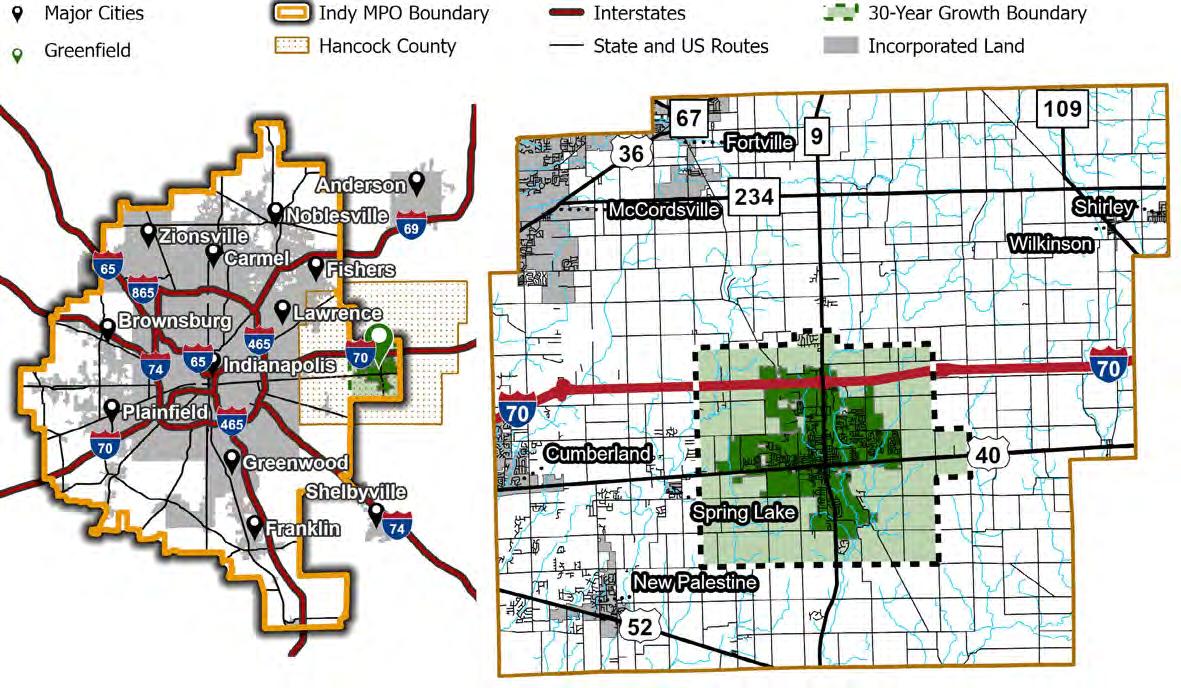
The construction of railroads through Hancock County in the 1850s and 1860s spurred agricultural production and strengthened Greenfield’s connection to a burgeoning Indianapolis. The Indiana Central Railroad, completed in 1851, provided regular passenger service from Greenfield to the capital. Shortly after its completion, Greenfield was incorporated as a city in 1876 with a population of 2,023 residents. When natural gas was discovered in 1877, Greenfield boomed with manufacturing plants and industries for over 20 years. Access to Indianapolis and the city’s local economy were boosted in 1900 with the completion of an interurban trolley between downtown Indianapolis and Greenfield.
The rapid late 19th-century growth of Greenfield and Hancock County came to a halt after the demise of the railroads and interurban lines during the first quarter of the 20th century in favor of automobiles. The county remained predominately rural with much of its population living in the relatively denser incorporated areas. The growth of Indianapolis during and after World War II, however, spurred suburban development across much of the county, including Greenfield. The county’s total population nearly tripled between 1940 and 1980 as large areas of farmland were developed into residential subdivisions.
The population growth rate slowed after 1980, though Hancock County remains one of the fastest growing counties in Indiana after other counties surrounding Indianapolis. Greenfield has accommodated this growth by continuing to develop large shopping centers along State Street and suburban-style subdivisions on the outskirts of the city. The completion of Interstate-70 in the 1960s, just north of Greenfield, encouraged more car- and truck-oriented transportation to and from Indianapolis.
The data analyses following this section, specifically of the built and natural environments, utilize the City’s previously defined 30-year growth boundary as Greenfield in Gear’s study area. This boundary was defined by the City of Greenfield’s previous comprehensive plan (2015 Plan) adopted in 2015. The study area is also consistent with the City’s current thoroughfare plan adopted in 2020.
The 2024-2028 Parks and Recreation describes the climate of the region: “[T] he summers are long, warm, humid, and wet and the winters are freezing, snowy, and windy. Over the course of a year, the temperature typically varies from 22 °F to 84 °F and is rarely below 3 °F or above 91 °F. The summer months are viewed as the best times to visit Greenfield based on the average number of clear, rainless days.”
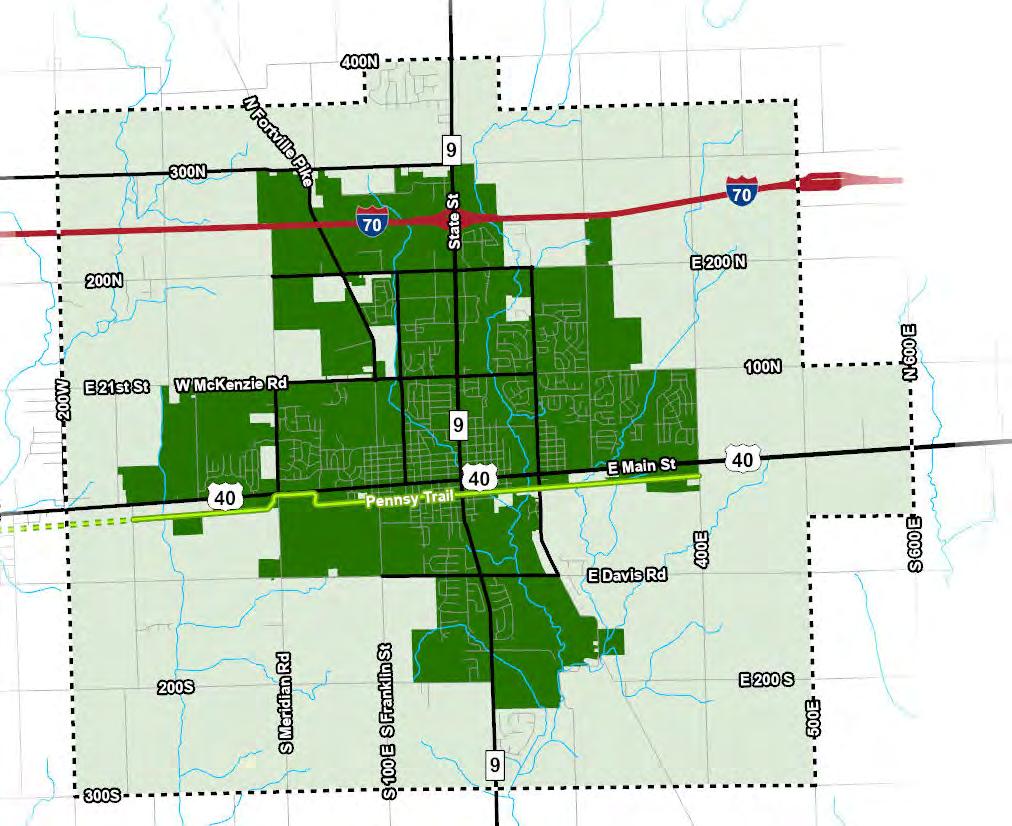
Planning is a continually evolving process to meet the needs and desires of a community, which means the goals and desired outcomes of planning will shift over time. Nevertheless, it is important to build on previously completed planning efforts to both increase the efficiency and effectiveness of current planning efforts. Previous planning efforts teach current planners (and the community) how and why the city has evolved, and lessons learned when implementing plans, such as funding limitations and the difficulty of implementing certain goals. Additionally, it is important to review plans of possible partners that can support Greenfield’s planning efforts where priorities align. Hence, the planning process to define Greenfield’s Roadmap to 2055 has included extensive review of the following previously completed and supporting plans, reports, and studies. Most of these plans can be found online either here (https://www.greenfieldin.org/government/planning-and-building/ land-use-plans-a-maps) or here (https://www.indympo.org/ planning/project-library).
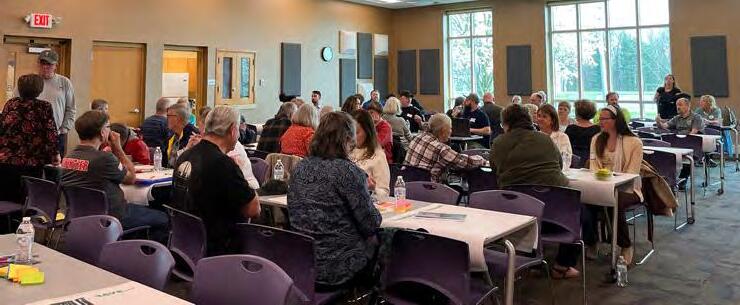
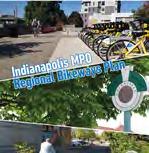
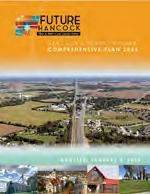
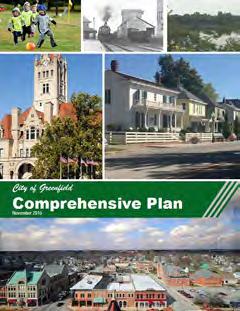
Adopted in 2015, the city’s previous Comprehensive Plan (2015 Plan) outlined a vision for the community, then identified strategies and actions to be taken that would achieve this vision. The city has come a long way since then. As of 2024, during the process to update the Comprehensive Plan, the city has accomplished almost all its goals. This includes major projects like updating the Thoroughfare Plan in 2020 and redeveloping downtown sites along the Pennsy Trail, such as a historic grain elevator and Depot Street Park.
Additionally, since 2015, Greenfield’s population has increased a whopping 10.9 percent, or 2,309 new residents, according to estimates from the American Community Survey (ACS).
Comparatively, Hancock County has grown by 11.9 percent, the Indianapolis Metropolitan Area by 5.1 percent, and the state by 3.3 percent. As one can note, the population is increasing rapidly in both the city and county compared to other areas of Indiana. Other key trends to look out for are discussed in following sections of the appendices.
Greenfield will continue to be an authentic American city by:
1. Investing in the historic downtown, surrounding neighborhoods, and corridors to preserve our heritage and provide a cultural center that inspires future innovation (Heritage/Legacy)
2. Promoting a targeted economic development strategy through identification of prime sectors for job growth and investment in quality business retention/ expansion programs (Economic Development)
3. Prioritizing all aspects of community health through housing, infrastructure, and amenities designed for people of all ages and abilities (Livable Community)
4. Providing exemplary learning opportunities through
partnerships with educational, institutional, service, and business organizations (Collaboration/Education)
First, the 2015 plan had a bold and compelling vision with realistic, achievable goals and actions. However, metrics with which to measure the successes of the plan were not defined. The lack of metrics to ‘grade’ the city’s progress only allowed staff and officials to use a pass-fail system. Instead a scale-based system may want to be used. This system would rank the city’s progress against its peer cities and provide deeper insight into the planning efforts that were, for example, (1) very unsuccessful/ unachievable, (2) somewhat unsuccessful, (3) somewhat successful, and (4) very successful.
Second, no population projections were made, which the City could use to evaluate itself and/or the 2015 plan to create a better plan going forward. Projections also help prepare the city to hire staff, land acquisition for public facilities like parks, and create better-informed budgets and financial decisions. Projections can also help build different scenarios, such as ‘lowgrowth’ and ‘high-growth’ scenarios that would further enhance the city’s resilience, and therefore
preparedness for the future. Scenarios could have also helped the city prepare for and recover more quickly from the COVID-19 pandemic and the socioeconomic shocks that it caused. All in all, while the 2015 plan suited the needs of the city when it was adopted, significant social and economic changes have occurred that necessitate the current undergoing to update the plan.
Capital Improvement Plans provide the link between the community’s goals outlined in the Comprehensive Plan with the fiscal realities of public financing and government budgets. The 2019 –2029 Capital Improvement Plan (CIP) of Greenfield focuses specifically on the downtown area. It outlines 15 critical projects, with a mix of public and private investment for the city to implement over a 10year planning period (2019 – 2029). The CIP estimates $75.6 million will be needed to implement these projects, with about $21.7 million (28.7 percent) funded by Greenfield.
The projects are classified into (1) street improvements, (2) private investment, and (3) civic enhancement. Street improvements include intersection improvements, trail construction, and street redesigns, such as the East Street Connector and the Depot Street Redesign projects. Private investments encompass housing projects, façade improvements, and other anchor destinations for the downtown. Civic enhancements are improvements to public spaces, such as parks, plazas, and other amenities. The 2019-2029 CIP should be folded into the Comprehensive Plan as an addendum.
five significant findings that the Comprehensive Plan can directly support:
5. The Parks and Recreation Department is understaffed and underfunded.
6. The city’s park system meets population-based acreage recommendations and has a high level of service, but the system lacks ‘neighborhood’ and ‘pocket’ parks.
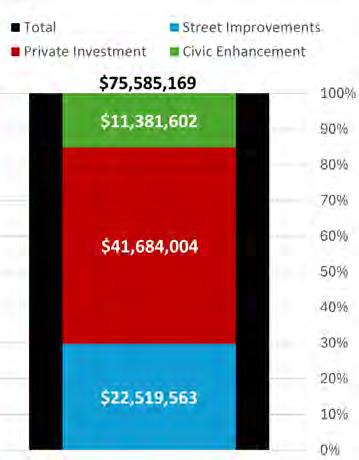
Adopted by the Greenfield Parks and Recreation Board in March 2024, the city’s 2024-2028 Parks and Recreation Master Plan (the Parks Plan) lays down a path for future parks, trails, and other recreational amenities. It is similar to how the Comprehensive Plan should guide future land use and development decisions. Hence, it is important to ensure the goals and actions taken to implement the Comprehensive Plan align with the parks plan.
The Parks Plan states the city’s vision for its recreational network: “To be the regional innovators for park experiences through nurturing community engagement and stewarding the natural environment, by creating diverse and educational experiences for all.” This vision is followed by a needs assessment of the city’s current recreational network. The assessment had
7. Ongoing investment and budgeting for parks is almost half of that of peer cities’ spending, resulting in a lower level of maintenance and programming within the parks system.
8. Land acquisition for parks should focus on properties that are adjacent to or contiguous with trails or existing parks.
9. Trails (both natural and paved) are the most important recreational facility to Greenfield’s parks system based on public feedback.
10. The Parks Plan should be folded into the Comprehensive Plan as an addendum.
Transportation networks incentivize or disincentivize the development of different land uses, densities, and character. Hence, it is critical to review the recommendations of the Thoroughfare Plan for the Comprehensive Plan. The City’s 2020-2030 Thoroughfare Plan identifies 20 priority projects to be completed up to the year 2030 and two potential projects. It also lays out a Complete Streets Policy, which is meant to promote traffic safety and encourage the construction of facilities for several modes of transportation, such as sidewalks and bike lanes, instead of only automobile-based transportation.
The 20 priority projects identified in the Thoroughfare Plan include improvements to safety at intersections, new trail construction, street widening, and reducing traffic congestion and are two ‘potential’ projects. McKenzie Road
is notable for its appearance in many priority projects. There are also two ‘potential’ projects that would have an enormous impact on future land use and development patterns: (1) a new interchange with Interstate-70 and (2) an alternate route for commercial vehicles on the west side of the city. However, the first potential project, the new interchange with I-70, is under construction by the Indiana Department of Transportation (INDOT) at County Road 200W instead of Meridian Street. Hence, a minor update to thoroughfare plan may be warranted.
Stellar Communities Regional Development Plan
Adopted in 2018, the Stellar Communities Regional Development Plan (Stellar plan) was born from a
collaborative effort between the communities of Hancock County, including Greenfield. It provides a blueprint for future development decisions in the county that is centered on health and heritage. The desired outcomes of the plan are to:
11. Preserve our heritage while providing opportunity districts with access to cultural amenities, jobs, and housing;
12. Nurture community health through infrastructure and amenities for people of all ages and abilities;
13. Cultivate new housing options inspired by neo-traditional and new urbanist principles that diversify our housing stock; and
14. Further develop the true heart of our region – our people assets.
The Stellar plan proposed several projects in downtown Greenfield, including the redevelopment of an existing grain elevator (now completed) and the Riley Literary Trail. It also became the basis of Greenfield’s Capital Improvement Plan.
Hancock County’s Comprehensive Plan (the County Plan), titled “Future Hancock County” and adopted in January 2023, provides a guide for how the county should manage its future growth and development. It lays out six strategic objectives to achieve over the next 20 years (2023 to 2043):
• Enhance intergovernmental collaboration and coordination,
• Strengthen the sense of community with a diversity of lifestyle choices,
• Expand workforce opportunities to make Hancock County a ‘live work’ county,
• Support a balanced, highquality housing mix,
• Invest in a safe and efficient transportation system concurrent with development,
• Leverage broadband infrastructure for community and economic development,
• Prioritize growth areas and investments in supporting infrastructure and services.
The recommendations of the County Plan are informed by key issues and opportunities discovered through data analysis, numerous public engagement efforts, and discussions with County staff and the Future Hancock Steering Committee. Each chapter of the plan presents the county’s goals, objectives, and policies which contribute to the six strategic objectives and how the county should implement the plan.
Overall, the County Plan is intended to serve as a guiding document for county leaders, and as such, it exclusively makes recommendations for the jurisdiction of the Hancock County Area Plan Commission — this does not include Greenfield.
However, it is important to recognize that growth and development in the county and the city are intrinsically linked with each other. This means the County Plan is a significant policy document for the city to consider, and both jurisdictions should seek to collaborate on similar objectives and recommendations in
the future. This collaboration opens up more funding and resources for both Greenfield and Hancock County, and ultimately reduces the expenses incurred by any one jurisdiction by dividing it among multiple jurisdictions.
Adopted in 2018 by Hancock County, the Hancock County Trails Plan evaluates and proposes several future trail routes that will connect the county’s various communities
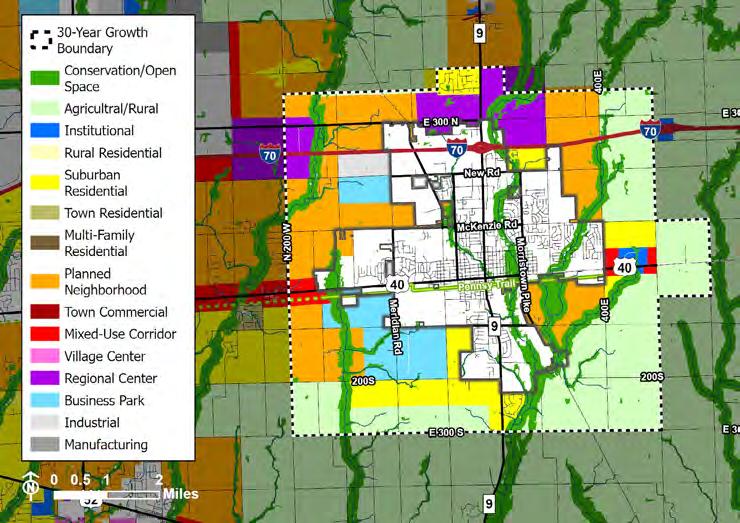
to parks, shopping, and jobs and improve residents’ access to outdoor recreation and quality of life. The future trails that are proposed around Greenfield extend out into the county based on city’s previously completed trails master plan. There are three new multi-use trails and three shared roadways proposed extending from Greenfield’s city limits:
• Multi-Use Trails
• Westward on McKenzie St
• Northward on State Road 9 / State St
• Southward on Franklin St
• Shared Roadways
• Northward on Jaycie Phelps Dr / N 400 E
• Southeastward on Morristown Pike
• Eastward on David Rd / E 100 S
These routes are not set in stone, but they do show where and how the county plans to invest time and resources for trail-related improvements. However, besides Cumberland and Spring Lake, the plan does not have many routes that connect Greenfield with other municipalities in Hancock County more directly. For instance, there is no proposed route along Fortville Pike which has a shorter and more
direct path to both McCordsville and Fortville. Nevertheless, the proposed routes can be a starting point for further discussion and collaboration between Greenfield, Hancock County, and other municipalities in the county.
Indianapolis Metropolitan Planning Organization (IMPO) Plans
Metropolitan Transportation Plan
The IMPO’s Metropolitan Transportation Plan (MTP) guides how, where, and what the IMPO will invest in, regarding transportation, over the next 20 years. With the help of transportation planners, engineers, elected officials and the public, the MTP ensures facilities and services required to support the mobility needs of the metropolitan area and its future growth are anticipated and adequately provided. In 2021
the IMPO concluded its updates on the most recent iteration of the MTP to create the 2050 Plan, which envisions an equitable transportation network that is safe, sustainable, fosters economic vitality, and enhances transportation options and choices for all users. Several important policies and projects are considered in the MTP, including complete streets, congestion management, project scoring criteria to identify priorities, environmental justice, and “red flag investigations” which are proposed projects within a half-mile of critical resources and/or infrastructures. The MTP concludes with several recommendations for the IMPO, the regional transportation network, and funding:
• Continue to develop performance measures,
• Expand ways to use the identified regional activity centers (Greenfield is identified as a regional activity center; see the MTP for a complete map),
• Continue visioning for transit in Central Indiana,
• Develop and support targets for regional and federal performance measures,
• Study the implications of emerging transportation technologies, and
• Monitor transportation funding.
Improvements to transportation affect nearly everything from land use patterns and economic viability to job access and qualityof-life. By taking account of these recommendations, Greenfield can better pursue and secure funding from the IMPO for its own transportation projects, while adding to the prosperity of the Central Indiana region by aligning its transportation priorities with the IMPO, as warranted.
The Regional Bikeways Plan was guided by public engagement throughout the process, including four steering committee meetings, ten focus group meetings, a public survey, and the Indianapolis Metropolitan Planning Organization (IMPO) Transportation Policy Committee. Some of the comments received focused on the prioritization map,
how IMPO funding is dispersed, and suggestions for bikeways in particular places around the metropolitan area. As of December 2020, the IMPO has identified several significant trails to better connect Greenfield residents within the city and between Indianapolis, including extensions to the Pennsy Trail, pathways along Brandywine Creek, Little Brandywine Creek, and Franklin St. A full map of the open and proposed trails can be found in the “Analysis” chapter of the IMPO’s Regional Bikeways Plan.
The Transportation Improvement Plan (TIP) is a four-year schedule of transportation projects proposed by the government and transportation agencies in the IMPO planning jurisdiction, which includes Greenfield, using certain funding mechanisms. The TIP changes over time as projects are either delayed, completed quicker than anticipated, or anticipated costs change. The
TIP is formally amended six times a year to reflect amendments and to add new projects. As of the 20242027 TIP, there are two projects with Greenfield as the lead agency:
• The Riley Literary Trail, a bike/ pedestrian project expected to cost $2,750,813, and
• The Fortville Pike & CR 300 N Roundabout, an intersection project expected to cost $1,709,250.
Additional funding sources and a portal for the city to submit transportation projects to the IMPO during its ‘call for projects’ can be found online at https:// www.indympo.org/funding/irtip
This webpage also shows more information about amendments and the most up to date version of the TIP.

The Statewide Comprehensive Outdoor Recreation Plan (SCORP) identifies recreational priorities at a state level. The plan is updated about every five years by the Indiana Department of Natural Resources. The SCORP provides useful information about outdoor recreation demand, supply, and industry trends that can be informative for the City’s Parks and Recreation Department and Parks Board. Several socioeconomic trends are discussed in the Introduction chapter of the SCORP. Unfortunately, this SCORP was created before the 2020 COVID-19 Pandemic, which significantly altered the discussed socioeconomic trends. Outside of socioeconomic trends, the SCORP
also identified several other trends that have continued after the pandemic:
• People want quality of place, and businesses follow people.
• Experiences with nature may promote formal learning and stewardship.
• Indiana’s obesity epidemic is still increasing.
• Indiana’s economy may slow down.
• Indiana tourism and outdoor recreation are contributing to the state economy more than ever.
Additionally, the SCORP inventories the current supply of local and state/ federal parks and recreation acres by county. It then uses this inventory to evaluate counties against the recommended parks and recreation acres per person and identify “critical counties” which (1) do not have the recommended supply of acres and (2) have a population growth rate higher than 1.44 percent between 2014 and 2018. According to the SCORP, Hancock County is a critical county and needs at least 3,689.66 additional acres to meet the recommended supply of parks and recreation acres (2,672.29 state/ federal acres and 1,017.35 local acres).
The SCORP provides statewide goals for parks and recreation providers to both address socioeconomic changes and trends identified previously and deficits in the supply of parks and recreation acres. These goals generally align with what is desired by the residents of Greenfield, previous planning efforts, and priorities of the city government. Since the city and state are generally pursuing the same goals, the city is better suited to apply for state grants and other funding sources to improve the local parks and recreation system. The SCORP goals are:
• Develop more trails and bicycle/pedestrian facilities.
• Encourage and promote outdoor recreation participation.
• Continue emphasizing Indiana’s aquatic resources, both natural and man-made.
• Protect and enhance Indiana’s natural and outdoor recreation resources.
• Provide funding for outdoor recreation development at the state and local levels.
In addition to these goals, the SCORP provides a map of visionary statewide trail systems and progress on the system. The Pennsy Trail is one of these visionary trails stretching across the state from
Richmond on the Ohio border to Terre Haute on the Illinois border. There is another potential visionary trail north of Greenfield named the Woolly Bear Trail, passing through the unincorporated community of Maxwell near the intersection of County Road E 500 N and State Road 9. The identification of these visionary trails by the state means there may be funding available in the future, and it is important to plan out the desirable land use patterns and development along these trails ahead of their construction.
Geography and the environment shape the physical, social, and economic fabric of cities. They influence many aspects of sustainability, quality of life, development regulations, and land use policies. Geographic factors like topography influence where human activity occurs across the land. Meanwhile, environmental factors like ecosystem services can support and provide extensive benefits to people when understood and managed well.
Topography provides insight into the lay of the land, including land formations, slope, elevation, and the arrangement of natural and built features. For example, although waterways are natural features and roads are built features, they both follow pathways that gradually change in elevation while avoiding steep slopes. The lay of the land plays a fundamental role in urban planning by influencing the location and type of infrastructure, land use, and other human activities.
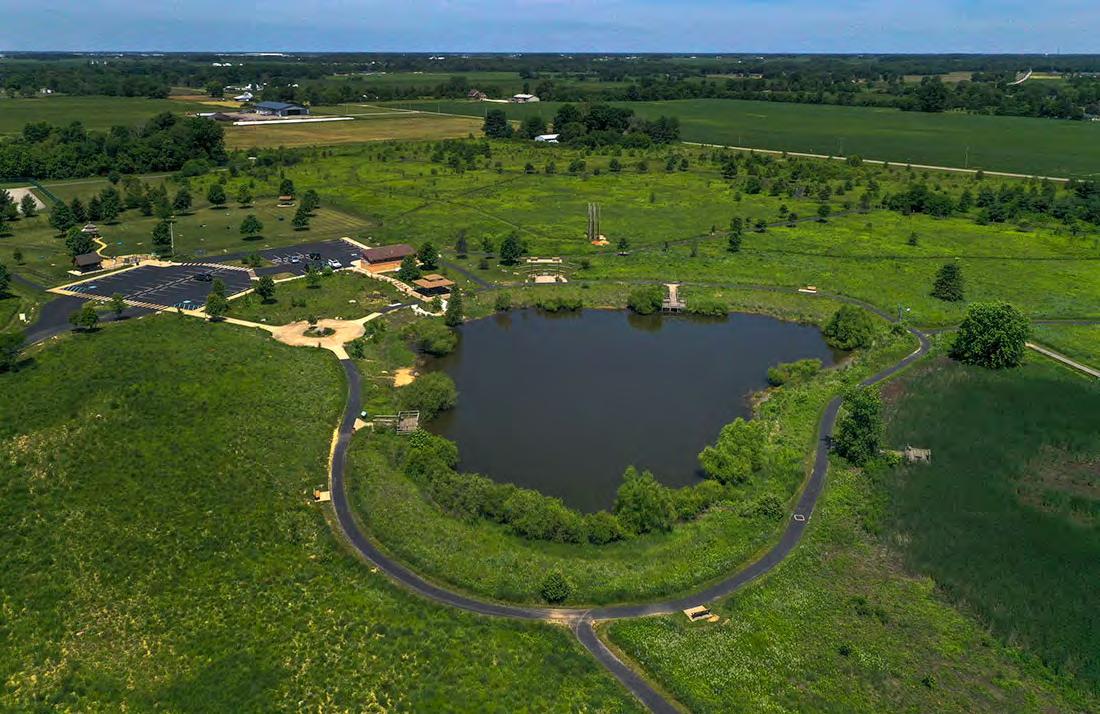
Source(s):Context Design
Greenfield is located within generally flat plains, which gradually rise in elevation to the east and fall to the west. Areas immediately adjacent to rivers and streams have the steepest slopes, most likely due to erosion. Oftentimes, this is caused by a loss of vegetation with deep roots that hold the soil together. The highest point of elevation in the city is the I-70 interchange, while the lowest point is Brandywine Creek as it exits the city’s southern boundary.
Ecosystem services is a scientific term that describes the benefits that natural systems provide to humans. There are four categories of ecosystem services: provisioning, regulating, cultural, and supporting. Provisioning services deal with resource extraction, such as food, drinking water, and timber. Regulating services encompass the natural processes that make the environment clean, sustainable, and functional like water purification, flood control, and pollination. Cultural services describe the bidirectional relationship between humans and nature, the ways in which we interact with and alter nature, and in turn how nature alters human activity. This includes non-material benefits to people, such as creative ideas born from interactions with nature (architecture, music, art, etc.). Supporting services are the natural processes that sustain and allow life to exist on Earth, such as photosynthesis, the water cycle, and the creation of soils. Begin to learn more about ecosystem services by visiting this website: https://leap.unep.org/sites/default/files/2020-09/undb-factsheet-ecoserv-en.pdf
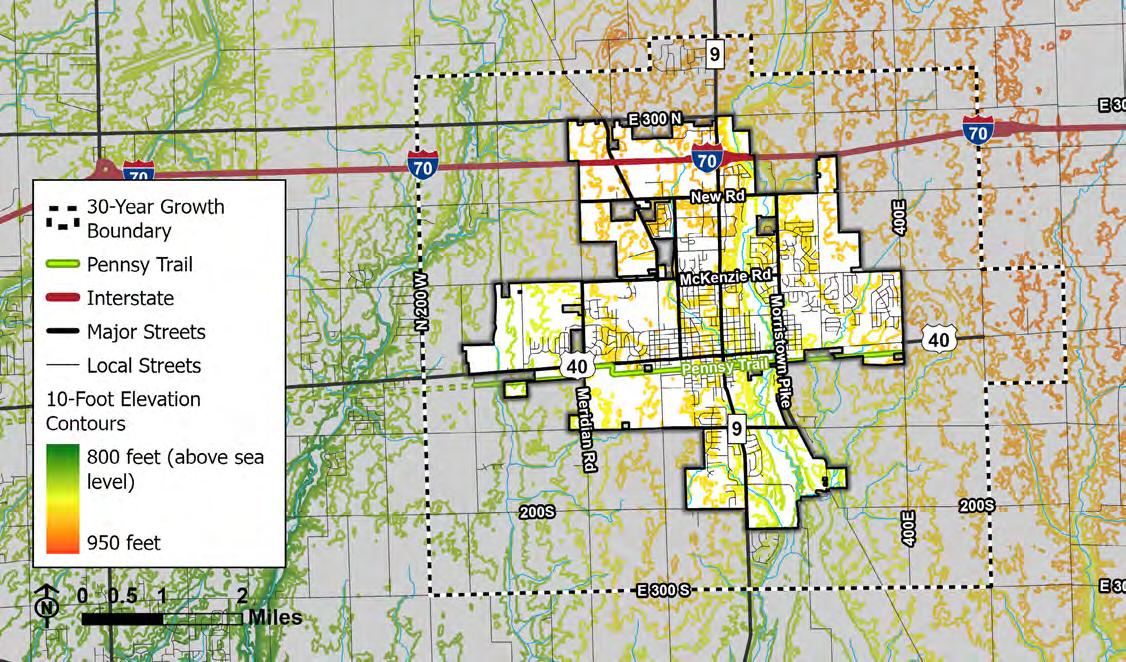
5-7: Floodplain Map
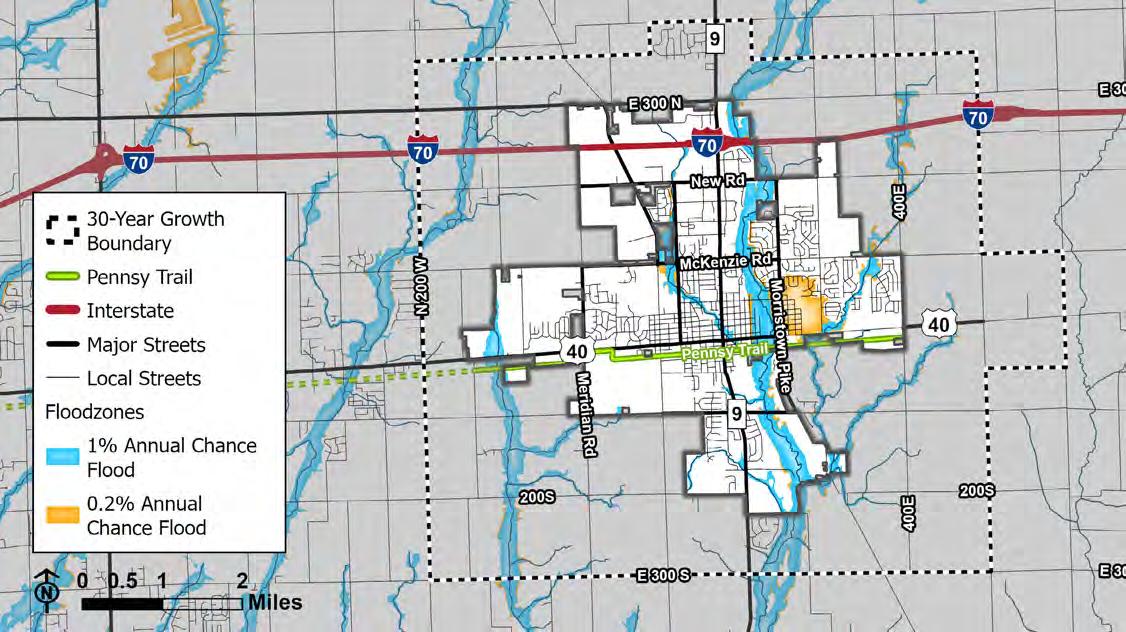
Source(s): Federal Emergency Management Agency
Source(s): Federal Emergency Management Agency; Analysis by consultant
Water resources are any natural features or processes that move or hold water. These resources are essential for various aspects of life, including drinking, agriculture, industry, and recreation. Water resources can be categorized into several types based on their origin and availability. There are two main types of water resources useful for planning purposes: surface water and groundwater. Surface water includes any visible water feature located aboveground such as rivers, streams, lakes, and reservoirs. Some of these surface water resources can appear temporarily because of weather, such as floodplains and some types of wetlands. On the other hand, groundwater is any water feature below the surface like aquifers.
The main waterway flowing through Greenfield is Brandywine Creek. Significant tributaries of Brandywine Creek are Little Brandywine Creek and Potts Ditch. Several other waterways are important to consider when planning for sustainable development: Wilson Ditch and Sugar Creek. Although these waterways generally fall outside of the city’s borders, they provide critical ecosystem services to the
surrounding areas, such as flood control and riparian zone habitats.
There are two flood zones used for planning purposes: the one percent and 0.2 percent annual chance flood zones. These zones have a one and 0.2 percent chance of flooding within any given year, respectively. They are also known as the 100- and 500-year floods, though this is a misnomer because areas could still flood multiple times a year. The land within and surrounding these zones is highly sensitive to development and can cause more severe flooding upstream if developed improperly. Development in these areas can also have detrimental effects on the riparian zone, which are lands adjacent to waterways that help prevent erosion and provide critical habitats for plants and animals.
Approximately 10.4 percent of Greenfield’s 30-year growth boundary is within a flood zone. Additionally, there are 2,251 properties within flood zones in the growth boundary. Almost 30 percent of those properties are within both the one and 0.2 percent chance flood zones. Brandywine Creek has the largest floodplain in the city, notably affecting residential areas to the east of Riley Park and north
of Main Street (US 40). Potts Ditch is another significant floodplain in Greenfield and mostly affects the area surrounding Hancock County Public Library. On the east side of Greenfield, Little Brandywine Creek’s floodplain is generally small due to channelization, affecting mostly properties around the intersection of E 200 N and N 400 E.
As defined by the EPA, wetlands are areas where water covers the soil or is present near the surface for varying periods of time. They provide habitat for thousands of different water- and land-based plants and animals. Benefits of conserving or restoring wetlands are not only wildlife habitat and biodiversity, but also better control of or less severe flooding. For the purposes of the comprehensive plan, the following analysis will only include wetlands that are naturally occurring (i.e. not created or modified by human interventions).
The EPA designates several types of wetlands. Temporarily or seasonally flooded wetlands are present for only a few days to a few weeks each year. Semi-permanently flooded wetlands persist through the growing season most years, with the water table usually at or very
near the land surface when water is absent. Permanently flooded and intermittently exposed wetlands have water present throughout the year, except in years of extreme drought for intermittently exposed wetlands.
There are 541.1 acres of wetlands within the growth boundary, accounting for 1.8 percent of its total area. Most of them only appear for brief time periods, with 82.2 percent of them being either temporarily or seasonally flooded. Several temporarily flooded wetlands are present along many significant waterways, including Sugar Creek, Brandywine Creek, and Little Brandywine Creek. Additionally, a few seasonally flooded wetlands are found north of Interstate-70 around the State Street interchange. Beckenholdt Park on E 300 N preserves two wetlands: one intermittently exposed and one seasonally flooded.
Also known as riparian buffers, riparian zones are areas of natural vegetation adjacent to streams and rivers. These zones provide critical ecosystem services such as slowing and storing floodwater, erosion control, and filtering agricultural and urban runoff. Many riparian zones around Greenfield have been significantly altered from their historical confluences due to human development, such as channelization for agricultural and flood control purposes. Studies cited by the U.S. Environmental Protection Agency (EPA) show that 75 to 90 percent of excess nitrogen (a common agricultural runoff) was removed from riparian zones with an average buffer width of 92 to 367 feet, respectively. The proper management of riparian zones directly improves the soil and water quality in the surrounding areas as well as downstream communities, meaning intergovernmental collaboration is key to management. Learn more about riparian zones and best management practices by beginning at this fact sheet created by the EPA: https://enviroatlas.epa.gov/enviroatlas/DataFactSheets/pdf/Supplemental/WaterscapeRiparianzone.pdf
Source(s): US Fish and Wildlife Service; IndianaMap; Analysis by consultant. *Only includes wetlands occurring naturally without significant, continuous human intervention.
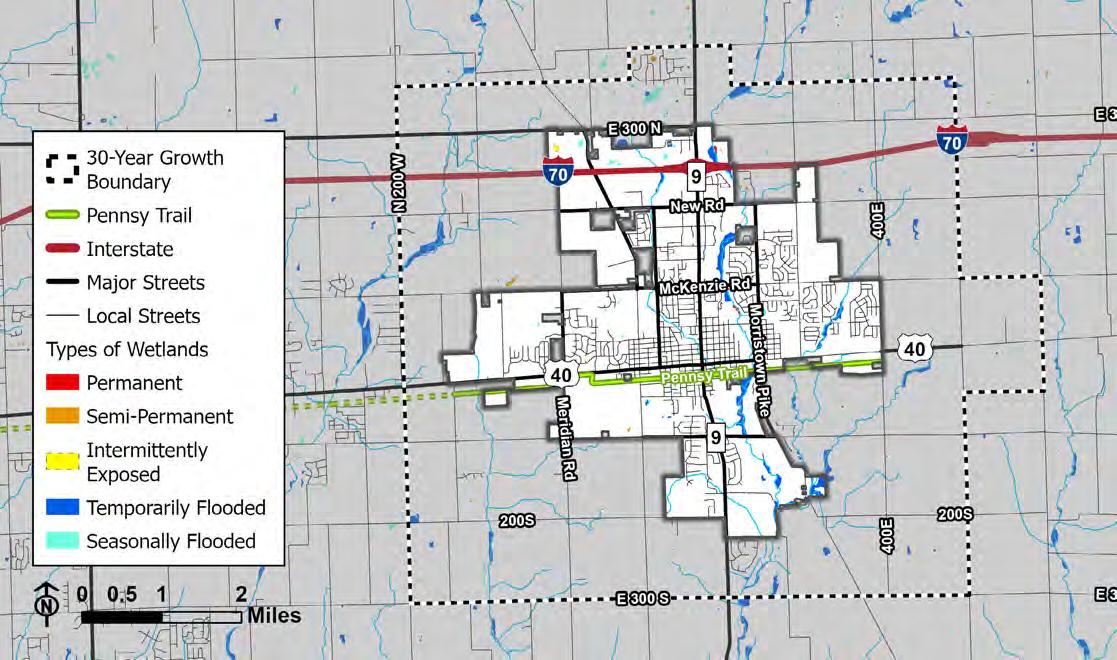
Source(s): US Fish and Wildlife Service; IndianaMap
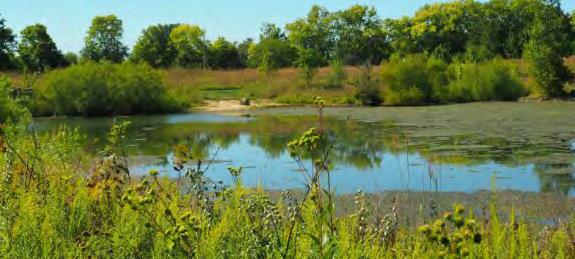
Aquifers are underground layers of water-bearing rock or sediment that store and transmit groundwater. Their primary functions are water storage, natural filtration, and maintaining stream flow for surface water features, especially during droughts. They have an important role in the hydrological cycle by providing a reliable and often renewable source of fresh water for development.
The New Castle Complex Aquifer System is the only aquifer system underlying Greenfield and most of Hancock County. The majority of wells that pump from this aquifer system is located along Brandywine Creek. According to a 2005 report from the IDNR Division of Water, this aquifer system can meet the needs of most high-capacity users. The system is not very susceptible to where it is covered by thick clay deposits. However, some areas where outwash is present pose a moderate to high risk of aquifer contamination because pollutants can more easily seep through the soil. A slight variant of this aquifer, New Castle Complex (Higher Potential), is present in the aquifer systems map below. The “higher potential” refers to potentially greater yields from wells in this area.
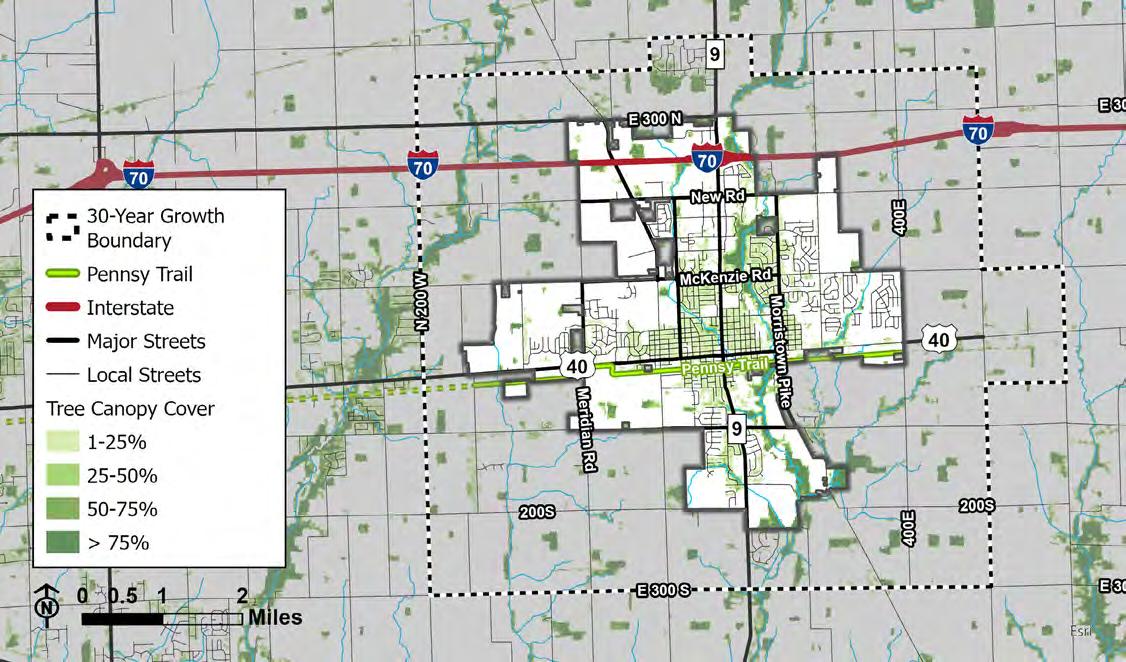
Source(s): US Geological Service, Multi-Resolution Land Characteristics Consortium (MRLC)
Land resources refer to the natural features and elements of the Earth’s surface that are valuable for various human activities, ecological functions, and economic purposes. The location of land resources tells a story about the lay of the land, and the management of these resources often impacts how humans can use and develop the land.
Forests within and near the city are mainly located alongside rivers and streams. Consequently, the tree canopy is much fuller near these water features. This pattern of forests is likely due to restrictions, both physical and regulatory, on development near waterways. The tree canopy is significantly less full in the newer, suburban areas of the city than within the historical street grid. This is likely a result from a combination of environmentally destructive construction practices (e.g. stripping and flattening the land before development) and simply that more time has passed for trees to grow within the historical grid than in newer developments. Brandywine Creek and Sugar Creek are especially significant for the relatively higher levels of tree canopy coverage surrounding them.
Soil health provides perhaps the most bountiful ecosystem services which sustain all life on earth, including the ability to purify water for drinking and acting as habitat for organisms that provide vital nutrients for growing crops. Three main categories help analyze soil health: physical, biological, and chemical characteristics. These characteristics are shown in the table and accompanying maps below. All data originate from soil surveys conducted by the Natural Resources Conservation Service (NRCS). Datasets are available for public download and viewing at the US Department of Agriculture’s (USDA) online tool, Web Soil Survey.
Within Greenfield’s 30-year growth boundary, there are 26 different soil types. However, just three soil types comprise 84.2 percent of the land: Crosby (44.2 percent), Brookston (29.2 percent), and Miami soils (10.8 percent). Crosby, Brookston, and Miami soils are closely related. All of them are made up of loosely compacted materials such as sand or wind-blown sediment typical of the American Midwest.
Source(s):
*Pesticide leaching potential and pesticide runoff potential are both metrics used for evaluating and determining the potential of the soil to transmit pesticides and the likelihood of the contamination of ground-water supplies. Ratings for pesticide leaching potential evaluate the movement of pesticides below ground, or through the soil, while pesticide runoff potential evaluates the movement of pesticides across the surface.
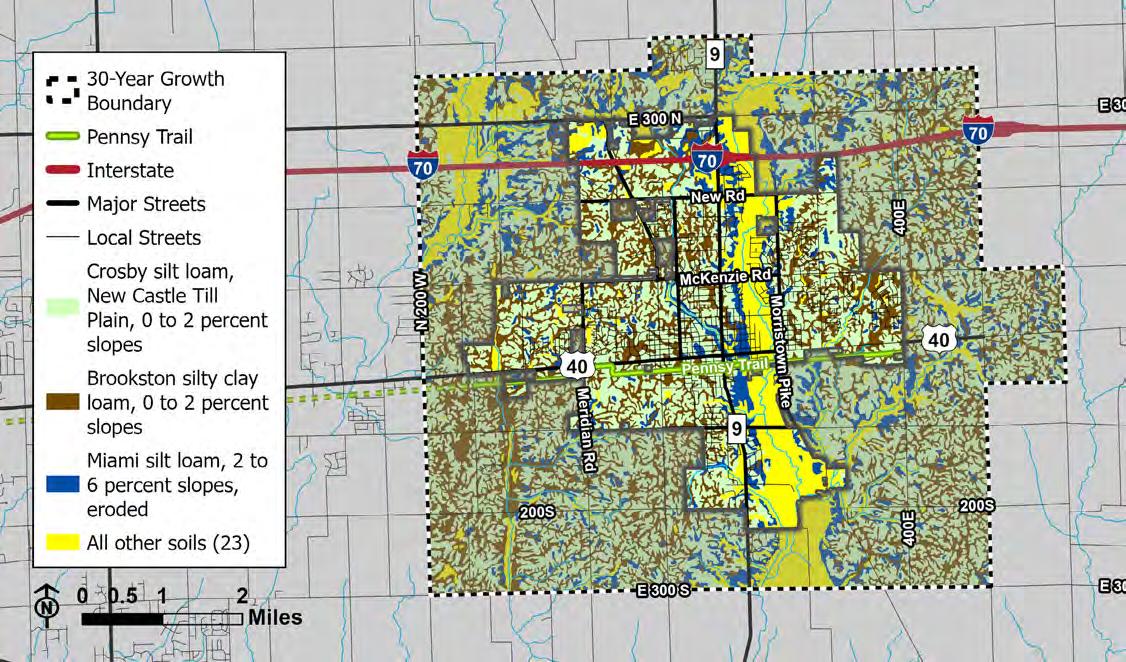
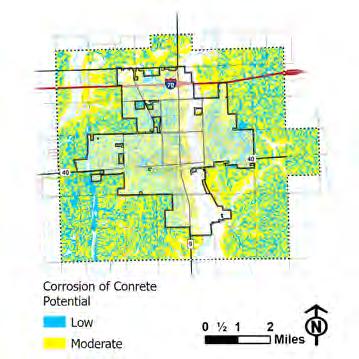
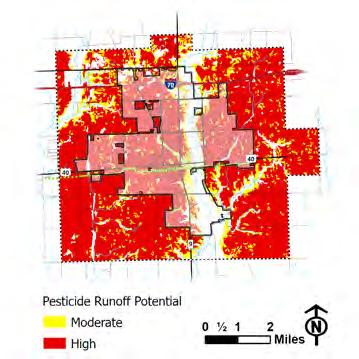
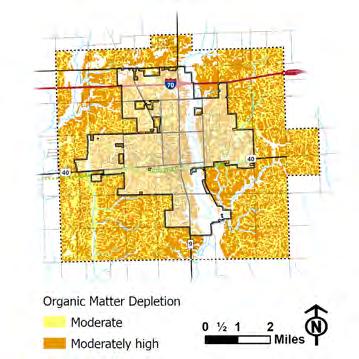
Source(s): US Department of Agriculture, Natural Resources Conservation Service, Web Soil Survey
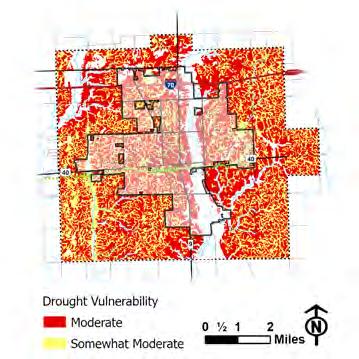
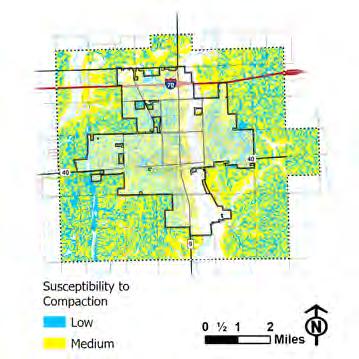
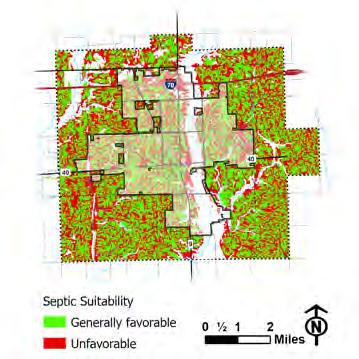
Pollution is the introduction of harmful substances or contaminants into the natural environment, causing adverse effects on ecosystems, human health, and the economy. These harmful substances, known as pollutants, can take various forms, including chemical substances, physical particles, and biological agents. It is crucial, especially in the context of urban planning, to understand where pollution originates and how it can affect the surrounding landscape so that comprehensive strategies can be identified for prevention, control, and remediation.
There are several common sources of point pollution like brownfields, leaking underground storage tanks, and landfills. It is important to note that without an in-depth study conducted by environmental experts, it remains uncertain whether any of the facilities identified in the “Possible Point Sources of Pollution Map” are point sources. The map only serves to locate facilities that the city may want to study further, such as working with the property owner(s) to provide environmental assessments or requesting a study to be done by the IDNR.
Unlike point pollution, specifics sources of pollutants are unidentifiable in instances of nonpoint pollution. Hence, efforts to clean up nonpoint pollution, even though important, are treating a side effect instead of the root cause. Waterways are often the most severely affected by nonpoint pollution, though soil contamination is another important aspect of nonpoint pollution impacts. However, readily accessible data is limited to waterways.
The EPA’s ATTAINS database compiles water quality assessments done by state agencies across the country (e.g. IDNR). These assessments monitor physical, chemical and biological factors that are assessed against EPA-approved standards or thresholds, such as the Clean Water Act. A waterway is designated as impaired if it is unsuitable to be used for certain purposes, such as swimming, eating fish, aquatic life, and drinking water.
According to the ATTAINS database, 33.0 percent of linear miles of waterways in the city’s 30-year growth boundary meet the water quality standards determined by the EPA. The city’s most significant waterway, Brandywine Creek, does meet the standards – that is, until it merges with Little Brandywine Creek on the south side of the city. This indicates that there may be contaminants coming from upstream point or nonpoint sources along Little Brandywine Creek. As shown in the graphics below, other waterways, including significant ones like Sugar Creek, Little Brandywine Creek, and Wilson Ditch, are either impaired (20.1 percent) or not yet assessed by the IDNR (46.9 percent). In comparison to Hancock County and across Indiana, there is a significantly lower rate of impaired waterways, but this rate may be misleading because almost half of the waterways (24 miles) in the 30-year growth boundary have not been assessed.
There are two classifications of pollution sources: point and nonpoint. According to the National Atmospheric and Oceanic Administration (NOAA), point sources are identifiable point from which pollutants can originate, such as a leaking underground storage tank, brownfield, or factory. On the other hand, nonpoint sources cannot be traced to a single, identifiable point. For example, urban areas and agricultural processes are a major origin of pollutants, but a specific point at which pollutants enter a waterway or the ground is unknown or over a large area. Additionally, litter is classified as a nonpoint source of pollution, however, landfills are point sources even though they may cover a larger because they are a single point from which pollutants are known to originate. Start to learn more by vising NOAA’s website here: https://response. restoration.noaa.gov/point-vsnon-point-water-pollution-what-sdifference
Geographic Area
Waterway meets standards Impaired waterways Unassessed waterways
Environmentally sensitive areas (ESAs) are lands that require special protection due to their ecological, cultural, or aesthetic significance. They are characterized by unique features, biodiversity, and natural processes that are highly susceptible to disturbances, especially from human development. Protecting ESAs is crucial for preserving biodiversity and improving community resiliency by maintaining ecosystem services like erosion control, water purification, and soil quality.
For the purposes of this comprehensive plan, physical features of ESAs include:
• Naturally Occurring Wetlands (i.e. not human-made)
• Heavily Forested Areas (i.e. areas with more than 25% tree canopy cover)
• Impaired Waterways (as reported by the IDNR)
• Riparian Zones (i.e. 100 meters on either side of a stream)
• Floodplains (i.e. 1% and 0.2% annual chance flood zones)
ESA Hotspots
Hotspots are areas with a concentration of physical features that characterize ESAs, as stated above. An analysis was completed using Geographic Information Systems (GIS) data of the physical features listed in the previous section. The datasets were overlaid on top of each other and used to create
an index that ranks the sensitivity of the environment in different areas of the 30-year growth boundary. Several hotspots ranked near or as “Highly Sensitive” on the map below. These hotspots include:
1. Brandywine Creek,
2. Little Brandywine Creek,
3. Sugar Creek, and
4. Thornwood Nature Preserve
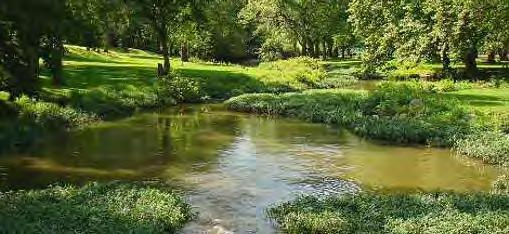
Source(s): Analysis by consultant
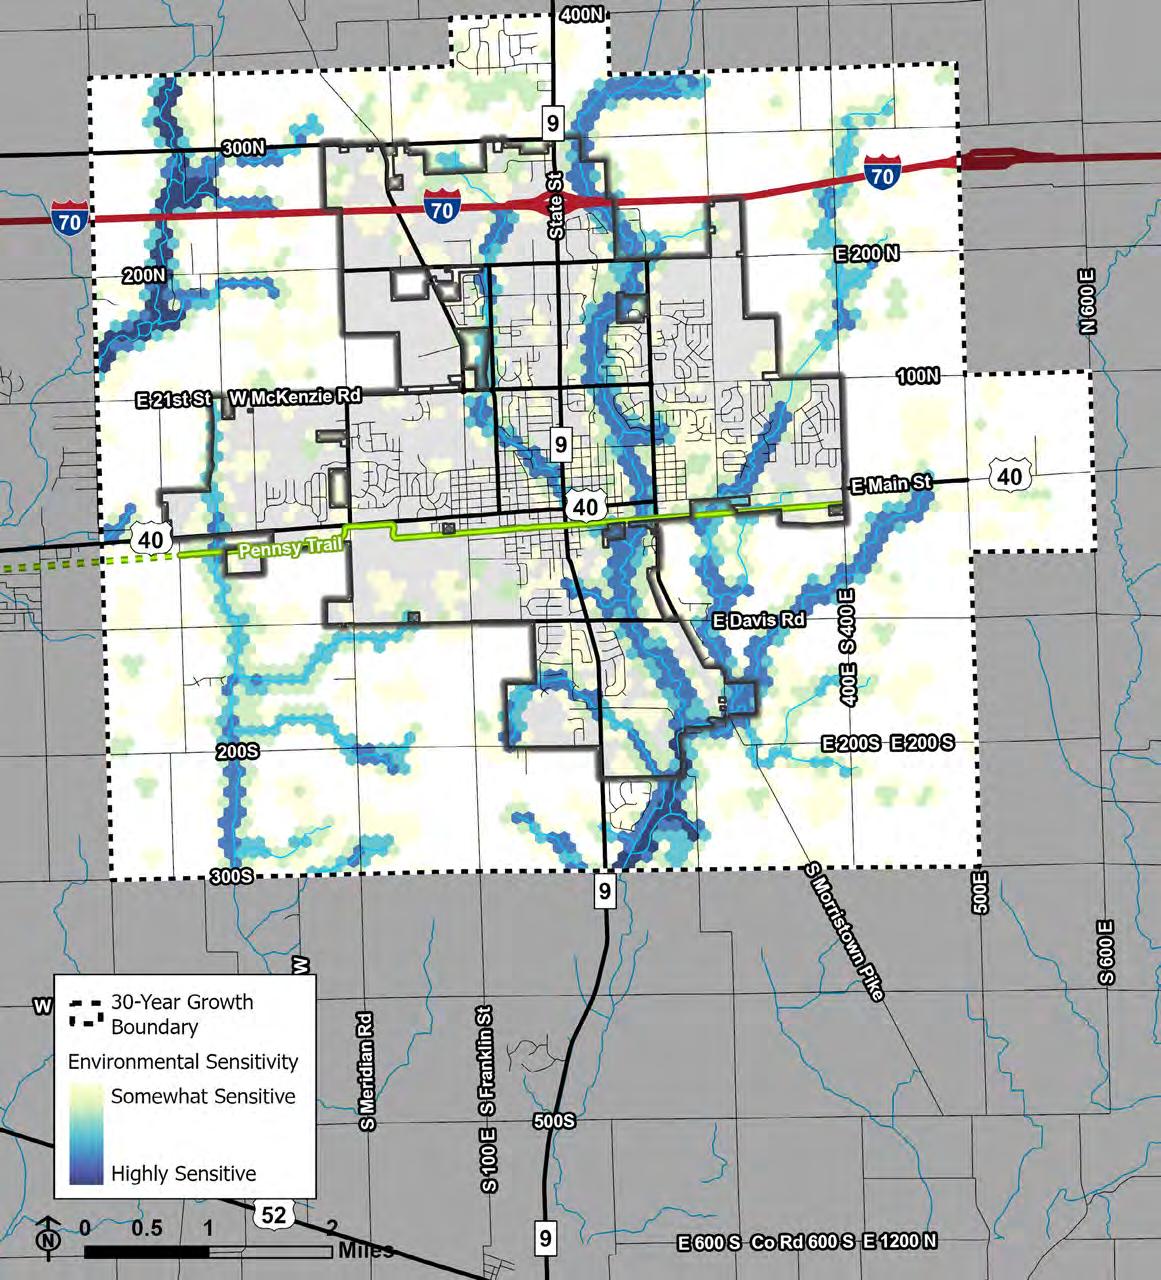
Infrastructure is the physical systems that serve the community, such as water, electricity, sidewalks, and parks. Services include public services such as police, firefighters, and ambulance services. Depending on the specific infrastructure or service, it may be provided publicly or privately. Items identified as “infrastructure” include services such as personnel and maintenance. Items considered to be solely “services” include infrastructure such as the library building, fire stations, police stations, etc.
The City of Greenfield has several departments that provide essential infrastructure, such as utilities, and public services like police and fire protection.
This section provides an overview of local government structure defined by Indiana Code (IC). According to IC 36-4, local governments in Indiana are generally comprised of three branches: executive, legislative, and administrative. The executive branch is headed by the Mayor, who may appoint the heads of city departments whom are then approved by the City Council. The City Council is part of the legislative
branch which can enact ordinances, or in other words local laws. The administrative branch is comprised of the City departments, department heads, and elected officials (including the Mayor and City Council) who are mainly responsible for the provision of City services, infrastructure, and other community services. The Clerk-Treasurer is part of the administrative branch and responsible for overseeing city finances and budgets.
The City of Greenfield provides several utilities and other types of physical infrastructure, including but not limited to parks, streets,
water, stormwater, wastewater, and electricity. Each type of infrastructure is essential to development, quality of life, and a thriving economy. Planning
The City’s Planning Department is mainly responsible for building inspection (including coordination with the City Police for code enforcement), the zoning and subdivision codes (i.e. unified development or UDO), permitting, and long-range planning efforts, such as this comprehensive plan. The Planning Department works closely with the City’s Advisory Plan Commission and Board of Zoning Appeals.
Public safety is a primary goal of local government. This includes the City’s Fire, Police, and Animal Control Departments. The City’s Fire Service Territory extends beyond the city limits to include all of Center Township.
Greenfield has also created a Traffic Safety, comprised of the Planning, Engineering, Fire, and Police Departments. The commission
is responsible for improving transportation-related safety, such as reducing car crashes, and produces an annual report with crash and traffic statistics.
Along with Greenfield’s Traffic Safety Commission, the City has several other boards and commissions to provide infrastructure and services, including:
• Board of Public Works and Safety (Board of Works),
• Advisory Plan Commission,
• Board of Zoning Appeals,
• Redevelopment Commission,
• Historic Board of Review, and
• Parks Board.
According to the US Census Bureau’s Annual Survey of Public Employment & Payroll (ASPEP), there are around 10 City employees for every 1,000 residents. To better understand the staff composition, imagine there were only 1,000 people living in Greenfield.
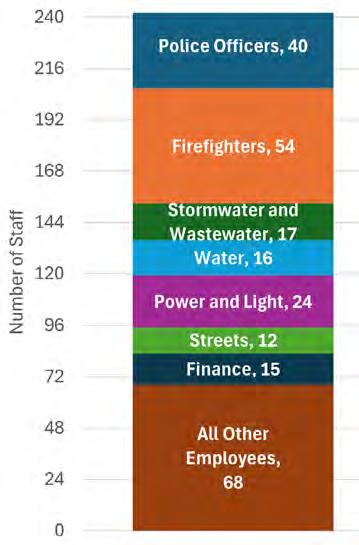
Out of the 10 City staff, there would be about two police officers, two firefighters, one staff member for Power and Light, and 5 staff members for all other departments.
In 2023, ASPEP shows the City of Greenfield with a total of 242 full- and part-time employees and, according to 1-year estimates from the US Census Bureau’s American Community Survey (ACS), a population of 24,174. This is up 9.5% since 2018, when the City’s population was estimated at 21,871.
On a 5-year average between 2018 and 2023, there were 247 total staff. However at the time of the 2023 survey, the City had 242 staff -- the same number of staff in 2018. This could point to hiring difficulties, including finding people with the right skillsets, as well as budgetary constraints for the City to expand its staffing capacity.
Source(s): (1) American Community Survey (ACS) 5-Year Estimates; (2) ACS 1-Year Estimates; (3) Census of Governments, Survey of Public Employment & Payroll Datasets. See https://www.census.gov/programs-surveys/apes/about/glossary.html for a Glossary of Definitions.
Hancock County and other nongovernmental organizations that serve the county provide several services pertinent to community planning. These providers reduce the burden on individual local governments and can coordinate across jurisdictions. These services include:
• Hancock County Emergency Management Agency (i.e. Homeland Security)
• Hancock County Soil and Water Conservation District
• Hancock County Solid Waste Management District (i.e. Recycle Hancock County)
• Hancock County Tourism Commission
• Greenfield Area Chamber of Commerce
• Hancock County Arts
• Hancock Health (Hancock Regional Hospital)
• Hancock County Community Foundation (i.e. Hello Hancock)
• Hancock County Food Pantry
• Hancock County Senior Services
• Hancock Economic Development Council
• Education
Although it is not a part of the local government, the Greenfield-Central School Corporation is an essential partner for improving opportunities and the quality of life for Greenfield residents. Greenfield-Central School Corporation is responsible for operating public schools and related facilities in and around Greenfield, including:
• Greenfield-Central High School
• Greenfield-Central Junior High School
• Greenfield Intermediate School
• Maxwell Intermediate School
• Eden Elementary School
• Harris Elementary School
• JB Stephens Elementary School
• Weston Elementary School
• Cougar Cubs Preschool
Greenfield maintains several public utilities, including water, wastewater, stormwater, and electricity. Water and wastewater services are available to people and businesses within the City’s water/wastewater service territory. On the other hand, the City’s electric service territory serves primarily within the city limits. Any expansions of territories, even when land is annexed by Greenfield, are limited by state legislature and rulings by the Indiana Utility Regulatory Commission.
The City’s Water Utility staff are responsible for the cleaning, testing, pumping, and distribution of potable water for domestic, commercial, industrial, fire protection use, and maintaining and reading water meters for billing purposes. Local water supply comes from underground aquifers. Water is pumped from wells to the City’s Water Filtration Plant. After going through the filtration and disinfection process at the plant, the water is then sent into the water distribution system.
Water Utility staff also maintain the City’s water distribution system, water plants, wells, and
water towers. Additionally, the department also technical reviews of development projects, which helps the Greenfield Plan Commission determine whether a project should be approved, modified, or denied.
Wastewater Utility is comprised of two departments, one of which operates the wastewater treatment plant and one that maintains all collection facilities (sanitary and storm sewers) throughout the City. A 2017 report by the utility marked a milestone in water management for Greenfield by no longer having a combined sewer overflow (a system historically used by communities where stormwater and untreated wastewater converge into a single pipe).
Greenfield Power and Light operates and maintains three distribution substations, as of 2024, providing reliable electric utility to residential and commercial customers within city limits. Unlike many local governments in Indiana, Greenfield owns its electricity which has allowed the City to have one of the lowest electric bills in the Indianapolis region.
The City is also a member of the Indiana Municipal Power Agency (IMPA), a member-owned not-for-profit where member utilities sell and purchase the necessary power for residents and businesses within their electric service territory. Learn more about IMPA here: https://www.impa.com/.
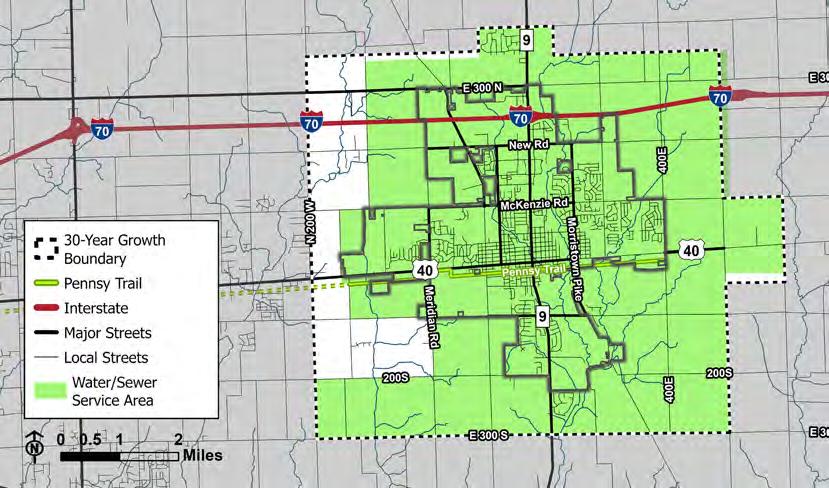
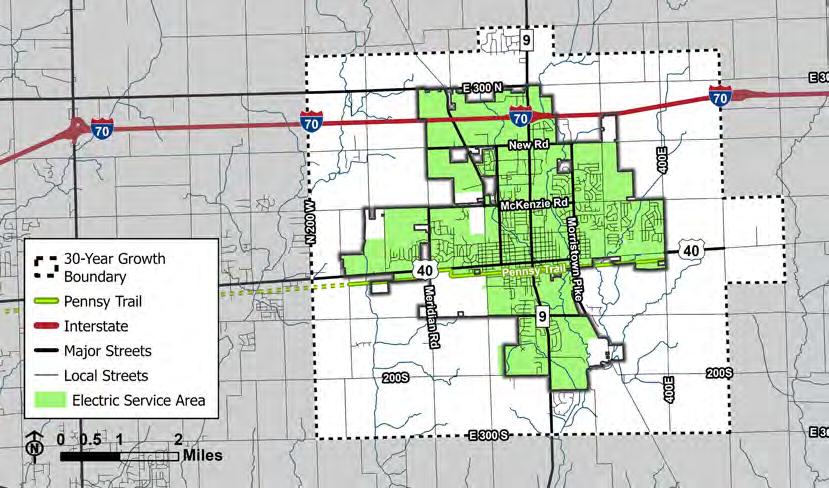
Each street has a different function with the greater network. These functions help planners analyze where and how people and goods move throughout the City. The Indiana Department of Transportation (INDOT) classifies every street in the state into categories based on:
• Distance served (and length of route),
• Access points (e.g. few, medium, many),
• Speed limit,
• Distance between routes,
• Usage (e.g. traffic volume),
• Significance (e.g. statewide, medium, local), and
• Number of travel lanes.
For example, I-70 has few access points, large traffic volumes, relatively higher speed limits, and serves regional and national travel purposes. More information about classifications can be found on the Federal Highway Administration (FHA) website here: https://www.fhwa.dot.gov/planning/processes/statewide/ related/highway_functional_classifications/fcauab.pdf
State St (SR 9) and Main St (US 40) are principal arterials, which are second on their network hierarchy after interstates. They generally have high traffic volumes, more lanes, and serve longer-distance travel. People using SR 9 or US 40 are often traveling to or from I-70. These two streets also act as the commercial backbone of the City, connecting people with businesses and services.
After principal arterials are minor arterials, which often connect into principal arterials or each other. They often handle crosstown trips rather than regional trips. Minor arterials include 300 N, New Rd, Franklin St, McKenzie Rd, Apple St, Davis Rd, and Meridian Rd.
Collector streets are meant to funnel traffic to and from local and arterial streets. They can be thought of as connecting individual neighborhoods to the broader Greenfield community. Collector streets include but are not limited to sections of Franklin St, McKenzie Rd, Blue Rd, and Jaycie Phelps Dr. Many of the county roads surrounding Greenfield are also classified as collectors.
5-22: Functional Classification (2022)
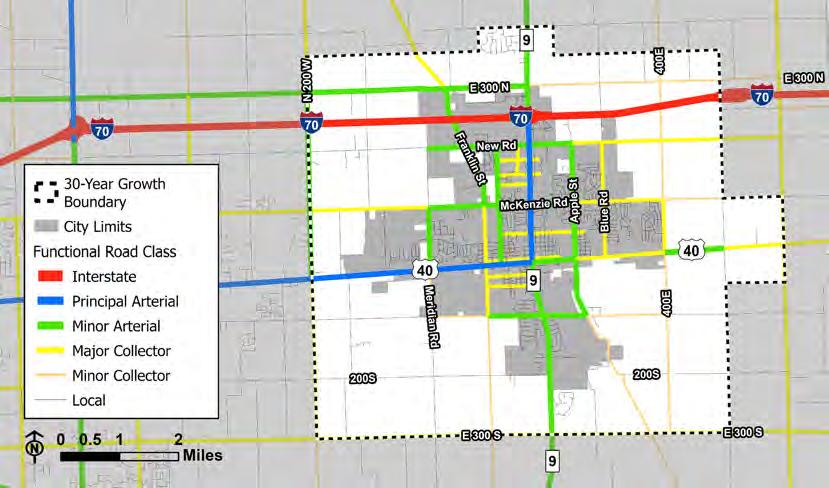
Source: Indiana Department of Transportation
More than 60,000 vehicles traveled daily on I-70 in 2022, where it crosses into the study area, according to traffic counts from INDOT. The highest volume of traffic on local streets is on State Street (SR 9) between McKenzie Rd and 300 N, which saw around 25,000 vehicles per day. The interchange with I-70 was the only access point to the interstate for all of Greenfield until recent. A new interchange is currently being built (as of 2024) at County Road 200 W which is the western border of the study area.
Precedent developments spurred on by new interstate access, such as the Walmart Supercenter and Greenfield at the Crossing on State Street, show the impact that new interstate access can have on development and traffic. With a new interchange at 200 W, it can be expected that traffic volumes will:
1. Grow along east-west streets such as New Rd, McKenzie Rd, and Main St with continued population growth, and 2. Be distributed between State Street and 200 W, which could lead to a reduced sense of traffic congestion, at least on local streets.
Besides State Street and I-70, other roads carrying a high amount of traffic relative to the rest of Hancock County include:
• East-west streets:
• 300 N,
• New Rd,
• McKenzie Rd, and
• Main St (US 40),
• North-south streets:
• Franklin St,
• Broadway St, and
• Apple St.
Most high-traffic intersections are located where two high-traffic streets meet each other. The City’s Thoroughfare Plan has recommended roundabouts for many intersections. The aim with these projects is to make car trips smoother and less dangerous by reducing deadly T-bone collisions, improving the visibility of pedestrians/bicycles, and slowing but not completely stopping traffic unlike a signalized intersection.
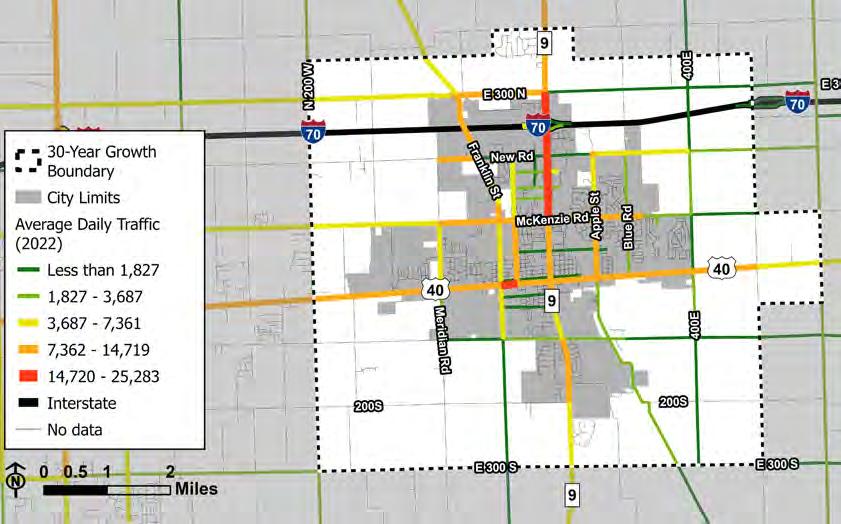
A majority of streets (65.0%) within the City have a sidewalk on at least one side of the street. Meanwhile, the same is true for only half the streets in the entire study area. This makes sense, since only about half of the study area has been incorporated into Greenfield. However, there are a few critical areas within the City that are missing sidewalks, including:
1. Sections of and areas around State Street (SR 9)between McKenzie Rd and 300 N, especially at the interchange with I-70,
2. Areas around the intersection of Davis Rd and State Street, and
3. Main Street (US 40) west of Franklin Street and east of Morristown Pike.
In addition to sidewalks, there is a growing network of trails. Pennsy Trail is the most significant, which would connect the City with Downtown Indianapolis except for a 2-mile gap west of Greenfield and east of Cumberland.
Trail Inventory
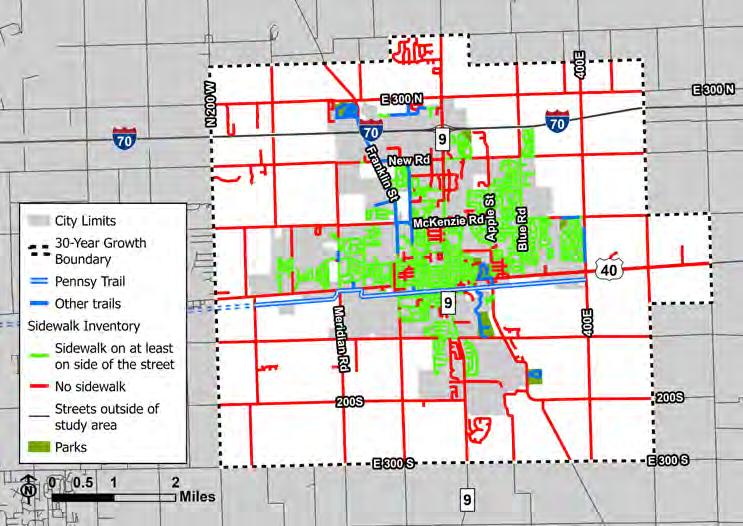
Source: City of Greenfield; Visual survey by consultant
Source(s): Visual survey by consultant
Land use has a significant impact on urban development, including bidirectional relationship with the economy, social activity, environment, and infrastructure. Supply and demand often dictate what land uses are economically desirable, including residential uses (housing), commercial uses (shops and services), and industrial uses (factories and related) uses. Additionally, social connections and the health of the environment are both impacted by the human activities that result from different land uses. Infrastructure, especially transportation, plays a key role in land use such as incentivizing development in more accessible areas, which provides more ways for people to travel between land uses –for instance, land uses like a home and a grocery store.
Land uses within city limits are generally more urban, while the study area has more rural characteristics. The predominant land use within the study area (i.e. the 30-year growth boundary) is agricultural, which is 67.5% of land compared to 22.8% of land within the city limits. The largest land use within the city is single-family residential uses (32.9%), such as mobile and detached homes. See more in-depth descriptions of existing land use patterns on the following pages.
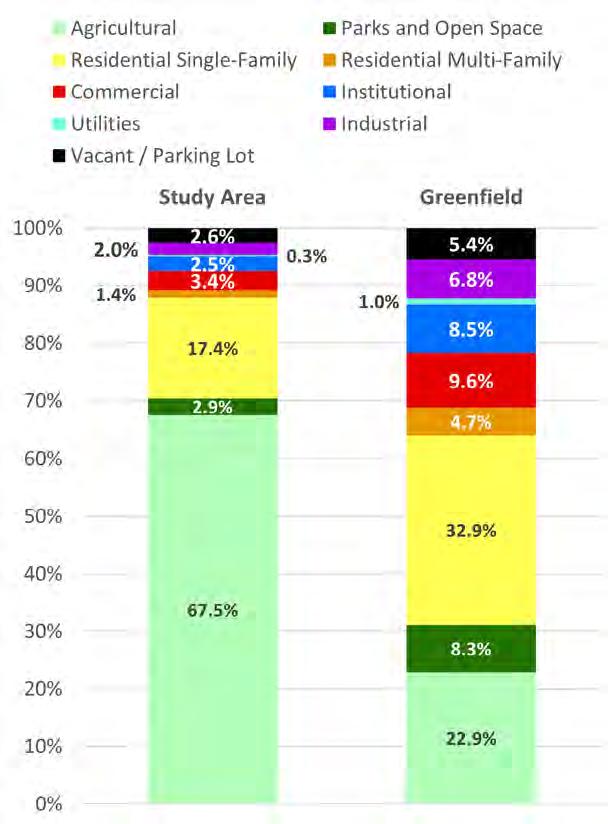
Visual survey and analysis of 2023 property tax classifications by consultant.
Figure 5-27: Existing Land Use Map (2023)
Source: Visual survey and analysis of 2023 property tax classifications by consultant.
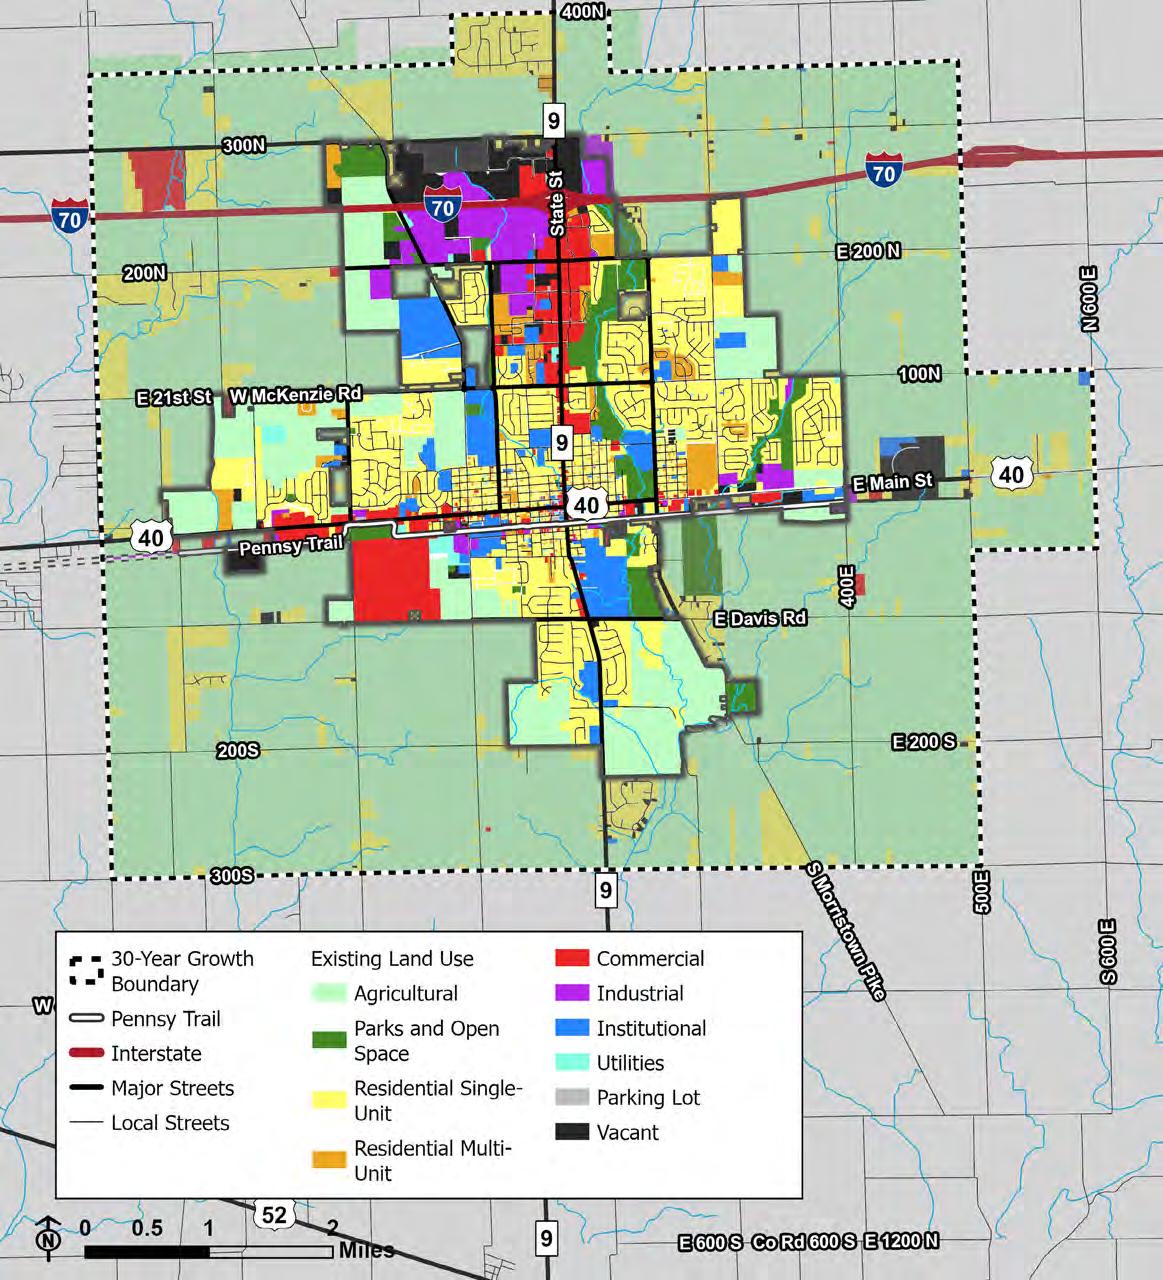
Figure 5-28: Existing Land Use Table (2023)
Source: Visual survey and analysis of 2023 property tax classifications by consultant.
Natural features have played a limited role in the location of new developments, but there are a few interesting patterns to note. New residential subdivisions on the east side of the city tend to be clustered around Little Brandywine Creek, whose floodplain provides a natural incentive for developers to set aside open space in their developments. It is likely that Wilson Ditch on the west side of Greenfield will play a similar role as development continues. On the other hand, commercial and industrial development has shied away from locating near natural features, most likely due to the increased costs of constructing flood control mechanisms.
Residential uses, including singlefamily and multi-family, are typically located away from major thoroughfares. Single-unit uses are more dominant in suburban areas of Greenfield, while multi-unit uses such as duplexes, triplexes, and apartments are more prevalent within the city’s historical street grid. Developments within this street grid are typically referred to as “traditional” neighborhoods. Some multi-unit developments, especially apartments, have been developed on the outskirts of the city in recent years. Parks and open space-related uses, such as golf courses, are often located nearby residential uses.
Commercial and institutional uses are the next largest land uses at 9.6 and 8.5 percent of land, respectively. Commercial uses include retail stores, services, and offices. Institutional uses typically include public buildings, civic groups, and places of worship. The transportation network plays a role in determining development patterns for these uses because it is crucial that they are easily accessible and visible to their customers/the public. Hence, they are usually on a major thoroughfare,
such as Main Street or State Street. Commercial uses are concentrated in three key areas: downtown, the western gateway of Greenfield on Main Street (US 40), and along State Street, stretching north from downtown Greenfield to Interstate-70. An outlier to these areas is the LabCorp campus located in southwest Greenfield and the Heartland Resort in the northwestern portion of the 30-year growth boundary.
Utility-related uses are sporadically located across the growth boundary area. Most utility stations are within the city limits. Some institutional uses, specifically public buildings, have utility-related uses attached to the primary building or on the same plot of land.
All industrial uses, such as manufacturing and warehousing, are located within city limits. They are concentrated along Interstate-70, with important local access roads including New Road, Franklin Street, State Street, and Opportunity Parkway. Historically, industrial uses were located along the railroad before its conversion to the Pennsy Trail. Industrial users would take advantage of rail-based transportation to ship and receive manufactured goods. Contemporarily, industrial uses have
moved out of the downtown toward Interstate-70 in favor of truck-based transportation.
Both vacant areas and parking lots present an opportunity for development or redevelopment. Key vacant areas include land along Opportunity Parkway currently planned for industrial and commercial uses. Additionally, a large development is taking place on the east side of Greenfield, outside of city limits at US 40 and Malcolm Grass Way. This development currently houses the Hancock County Sheriff’s Office and jail. Opportunity Parkway and Malcolm Grass Way both have vacant lots available for development.
When referring to “Parking Lots,” this means properties that are entirely dedicated to car parking. Most of these properties are found in downtown Greenfield, usually comprising a whole city block. It is important to note that most contemporary developments have car parking, whether it be residential, commercial, institutional, or industrial. Although not labeled on the map below as “Parking Lots,” they account for more than half of the land within contemporary commercial areas, especially along State Street.
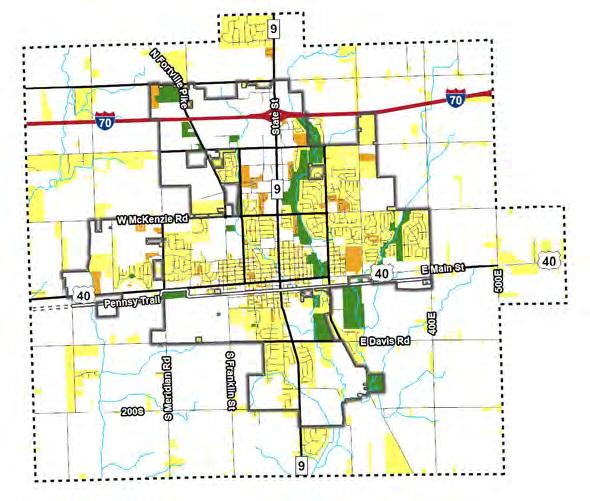
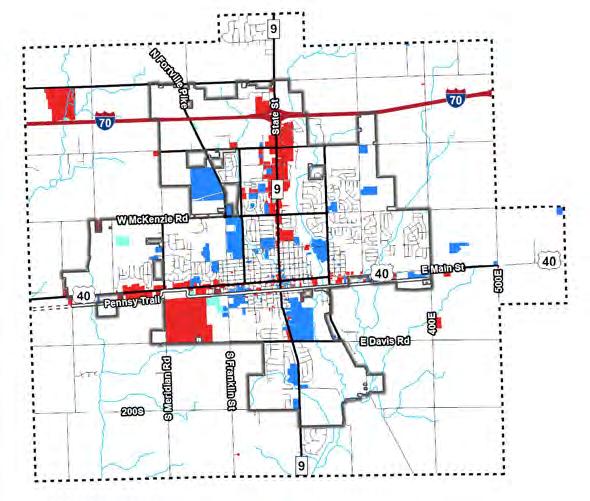

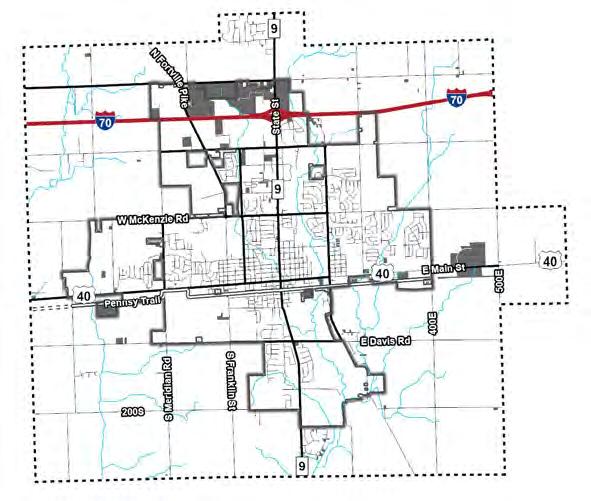
Downtown Greenfield is mostly comprised of commercial and institutional uses. There is also a larger concentration of utilities and parking lots than throughout the rest of the community. Residential uses surrounding the downtown, though historically they have been a part of it. Many of the buildings labeled “Commercial” on the map below have two to four floors that are vacant above the ground floor commercial use, which have historically been apartments or offices.
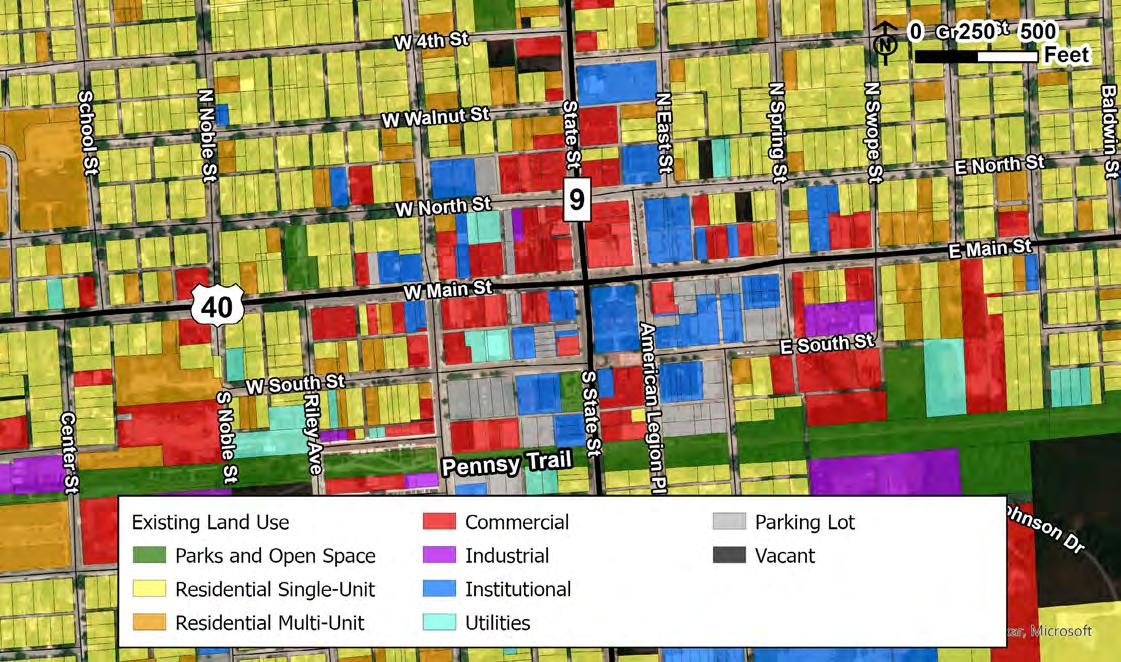
Many large-scale commercial and industrial developments occurred between 1990 and 2009. These developments significantly changed the character of northern Greenfield and improved job opportunities for residents. State Street and New Road absorbed most of these developments, incentivized by easy access to Interstate-70 and the city’s North Economic Development and Riverfront TIF districts.
Residential growth also boomed, especially between 2000 and 2009. Major subdivisions were developed on the far east and west sides of the city, including the Keystone, Indigo Springs, Sawmill subdivisions. Most of these subdivisions were filled out with single-unit, detached homes. Large-scale residential subdivisions continue to be developed on the edges of the city, including Woodfield Pointe, Evergreen Estates, and an increasing number of apartment complexes like the Villas at Timber Run and Stonehurst Pointe. Minimal development has occurred outside city limits, meaning Greenfield is absorbing most of the new construction within the growth boundary area in at least the past 30 years.
Historical patterns of annexation show generally equal growth in all four cardinal directions away from downtown Greenfield. Today, the city is more than six times larger in land area than it was in the 1950s.
The decade in which the largest amount of land was annexed was in the 2000s (2,977.7 acres), followed by the 1980s (1,647.1 acres).
Northward annexations along State Street (SR 9) are somewhat newer, aligning with the time when Interstate-70 was completed. The city most likely wanted to take advantage of the development that would be spurred on by access to the interstate. The most recent annexations in the 2020s include Thornwood Nature Preserve, the residential subdivision Evergreen Estates, and areas along the Pennsy Trail on the west side of the city. Annexations have usually taken place with a development plan in mind, such as Evergreen Estates or the business/industrial park along Opportunity Parkway on the north side of the interstate.
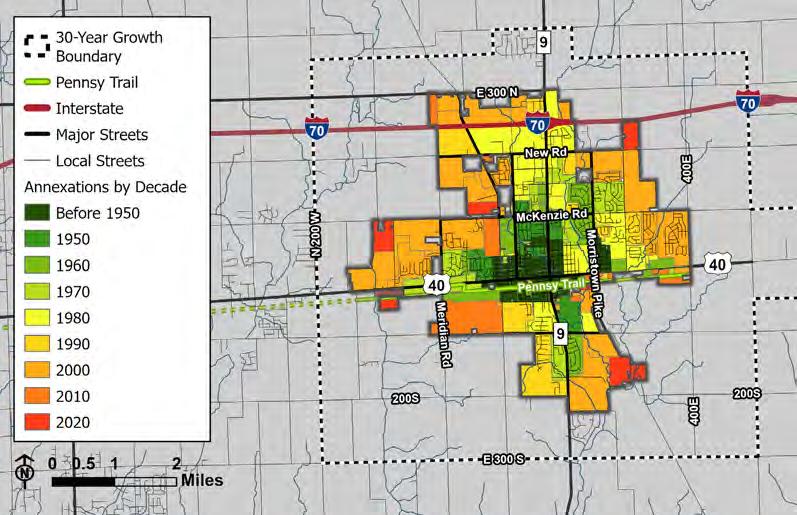
Source(s): City of Greenfield; Analysis by consultant
The urban-to-rural transect is an urban planning concept that attempts to describe the general change in development character, land uses, and density as someone travels from the urban core of an area to the surrounding rural areas. Not all developments will fit neatly into this concept (i.e. ‘special’ areas), but it does provide insight into the general development patterns of the city.
Greenfield has five distinct phases to its urban-to-rural transition. The transect starts at the city’s most urban area, Downtown, with its variety of land uses and wall-to-wall buildings. Developments then slowly become less dense and spread out as one travels to the end of the transect: rural areas comprised of vast corn and soybean fields dotted by farmsteads.
The heart of Downtown Greenfield is widely known in the community as the intersection of Main Street (US 40) and State Street (State Road 9), and more broadly the area within the original plat of the City. The Downtown is characterized by historical buildings ranging in height from one to five stories. Commercial and institutional uses – sometimes
mixed into one building – are most prevalent in this area, though a small concentration of older industrial buildings is located on the southern side of the area. Residential uses are the minority in the downtown, though many of the historical buildings used to house residents on their upper floors.
The traditional area of Greenfield is mostly confined to the historical street grid. It is characterized by a highly walkable environment with a variety of housing interspersed in residential neighborhoods, such as detached units, duplexes, triplexes, and small apartment buildings. Commercial buildings are located mainly along State Street or at busier intersections like Park Avenue and Apple Street. There are generally more amenities like trails and parks. Most buildings were first developed more than 40 years ago with walking as the main form of transportation in mind. This means residents are relatively closer to shops and services compared to their suburban and rural counterparts.
Suburban areas are characterized by larger buildings, relative to their Downtown or Traditional counterparts, located on the outer edges of the more urban “Traditional” areas. Developments
were generally built with private automobiles as the main form of transportation in mind. There are more open spaces, though they are not necessarily parks. Parking lots and residential car garages are common throughout this area. Land uses are heavily separated from each other. Residential uses are typically found in large subdivisions with single-unit, detached homes. Some of these subdivisions are interconnected with each other, however, many of them street networks isolated to themselves. Commercial and industrial uses are generally found on major thoroughfares and have large streetfacing parking lots.
Exurban areas are small collections of non-agricultural developments, usually residential in nature. They are similar in character to suburban areas but located farther away from cities and towns, as well as the public services and infrastructure that they offer. Sometimes, exurban areas are gathered around a built or natural feature, such as Sugar Creek or artificial waterbodies like Spring Lake.
Like any town or city, rural areas surround Greenfield. They are predominantly comprised of agricultural uses with farmsteads
or individual buildings like barns dotting the landscape. Vast fields of corn, soybeans, and other crops are the norm.
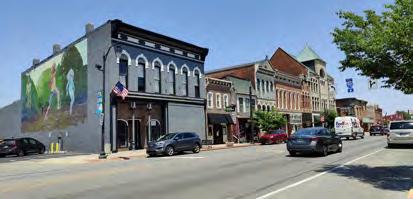
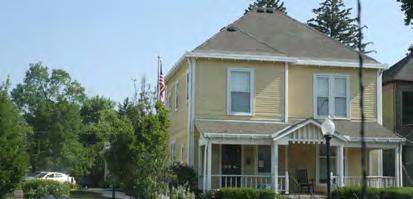
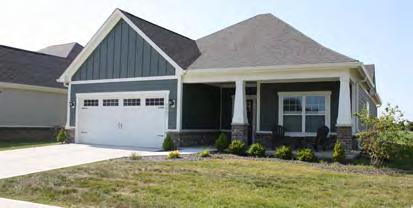
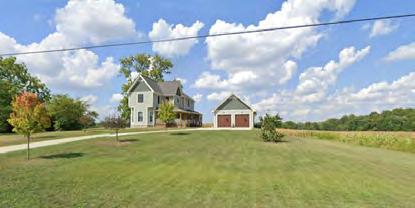
There are several areas around Greenfield that don’t follow the urbanto-rural transition concept. These special areas were typically developed to serve a specific interest, regional customer base, or major employer. Examples of special areas around Greenfield include the LabCorp campus, Hancock Regional Hospital, Heartland Resort, and Lark Ranch (agritourism).
Economic development areas (EDA) in Indiana, also known as tax increment financing (TIF) districts, are a way to coordinate government and private investments in real estate development. Funds received by the city from land within the TIF district are allocated to fund economic development activities, such as infrastructure improvements, in designated allocation areas within the district. The “increment” part of “TIF” comes from the anticipated property tax revenue increases that will come as a result if new development occurs and assessed property values increase.
The Greenfield Redevelopment Commission has established two TIF districts: North Economic Development and Riverfront. They are both designated for industrial and commercial properties only, meaning residential property assessments are not impacted. The North Economic Development TIF stretches along Interstate-70 between State Street and
Meridian Rd. Meanwhile the Riverfront TIF covers parts of downtown, eastern parts of Main Street, and areas along the west bank of Brandywine Creek. The Riverfront TIF also encompasses a separate TIF for Downtown Greenfield.
The North Economic Development TIF is mostly suburban in character and majority industrial, while the Riverfront TIF has a greater mix of uses and covers several areas with different types of character. Most land in the Riverfront TIF is already developed, with only 28.5 acres of vacant land, while the North Economic Development TIF has 286.7 acres of vacant land available for development. Hence, economic development efforts in the Riverfront TIF have focused on redevelopment that diversifies the city’s shopping options, and the North Economic Development TIF has mainly centered around job creation and manufacturing.
As one of many tools to incentivize development, these TIF districts have helped tremendously to encourage new industrial and office developments along the interstate and downtown redevelopment. The incremental value gained by properties within the TIFs totals $163,133,508 as of April 2023, according to data from the Indiana Department of Local Government and Finance’s online TIF viewer tool (http://gateway.ifionline.org/TIFviewer/ ). The North Economic Development TIF has had the largest incremental increase in land value, totaling over $155 million.
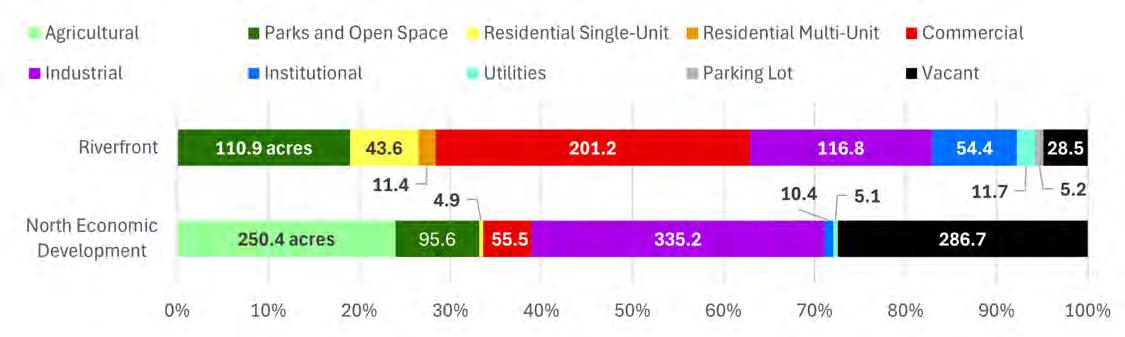
Source: Analysis by consultant
5-41: Existing Land Uses (2023) within TIF Districts Table
Source: Analysis by consultant
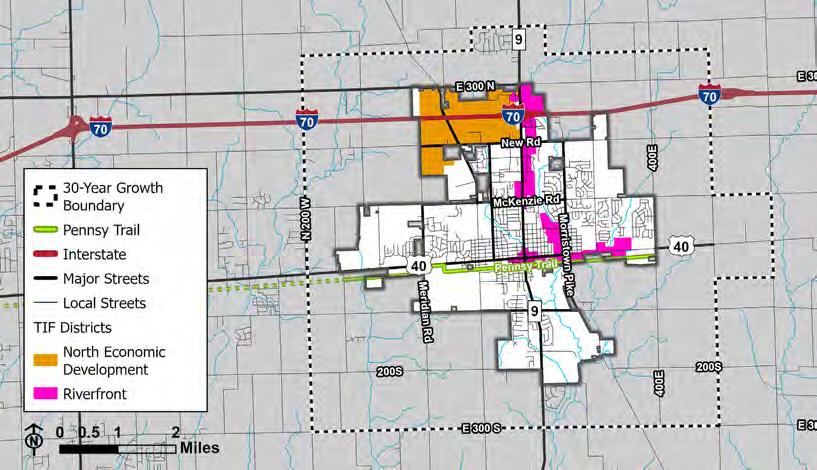
Zoning is a regulatory mechanism used by local governments to control the development and use of land within their jurisdictions. It involves dividing a municipality into different zones or districts, each with its own set of regulations concerning the types of activities that are permissible, the density of development, building heights, setbacks, and other specific requirements. For example, Greenfield’s Commercial North Gateway district generally allows commercial activities like restaurants and hotels, while limiting most, but not all residential and industrial activities.
There are 13 zoning districts and three overlay districts defined in the city’s Unified Development Ordinance (UDO), a part of the city code that regulates zoning and subdivisions. These districts have been generalized in the map below to better inform what development patterns the city hopes to achieve with the current layout of its zoning. Each zoning district and its accompanying “generalized” category are shown in the table to the right and the map on the next page.
Generally, commercial and industrial zoning districts are established along major thoroughfares, including Main Street, State Street, and Interstate-70. Meanwhile, residential districts and Planned Unit Developments (PUDs) fill in the rest of the city – PUDs are master-planned communities with unique development standards and regulations created by the developer with guidance from city staff that fit the master plan. Additionally, three overlay districts are established throughout the city.
The Park Overlay district designates areas that should be reserved for parks, recreational uses, and open spaces. Hence, this overlay is located near or on top of wetlands and major waterways, such as Beckenholdt Park and Brandywine Creek. The Neighborhood Commercial Node Overlay is established at key intersections where smaller-scale commercial developments are desirable to serve adjacent residential areas. These nodes, if developed, will give residents more opportunities to walk or bike to local shops and services rather than driving to larger commercial centers for all their necessities. The Recreational Trail Overlay district is established along Pennsy Trail in downtown Greenfield to encourage trail-oriented development and redevelopment in the city’s historical center.
Rezoning is when a property owner petitions the city’s Plan Commission to change the zoning for their property to another zone in the UDO. They are typically analyzed in two ways: (1) the regulations in the UDO act as a barrier to the supply of development to meet market demand and/or (2) the zoning districts are established inefficiently across the city. Greenfield saw a rapid growth of rezoning petitions in the 1990s which continued into the 2000s, according to records in the city code. Most of the approved petitions became residential zones, followed by commercial and PUDs.
5-44: Generalized Zoning Districts Map (2023)
Source: Analysis
consultant;
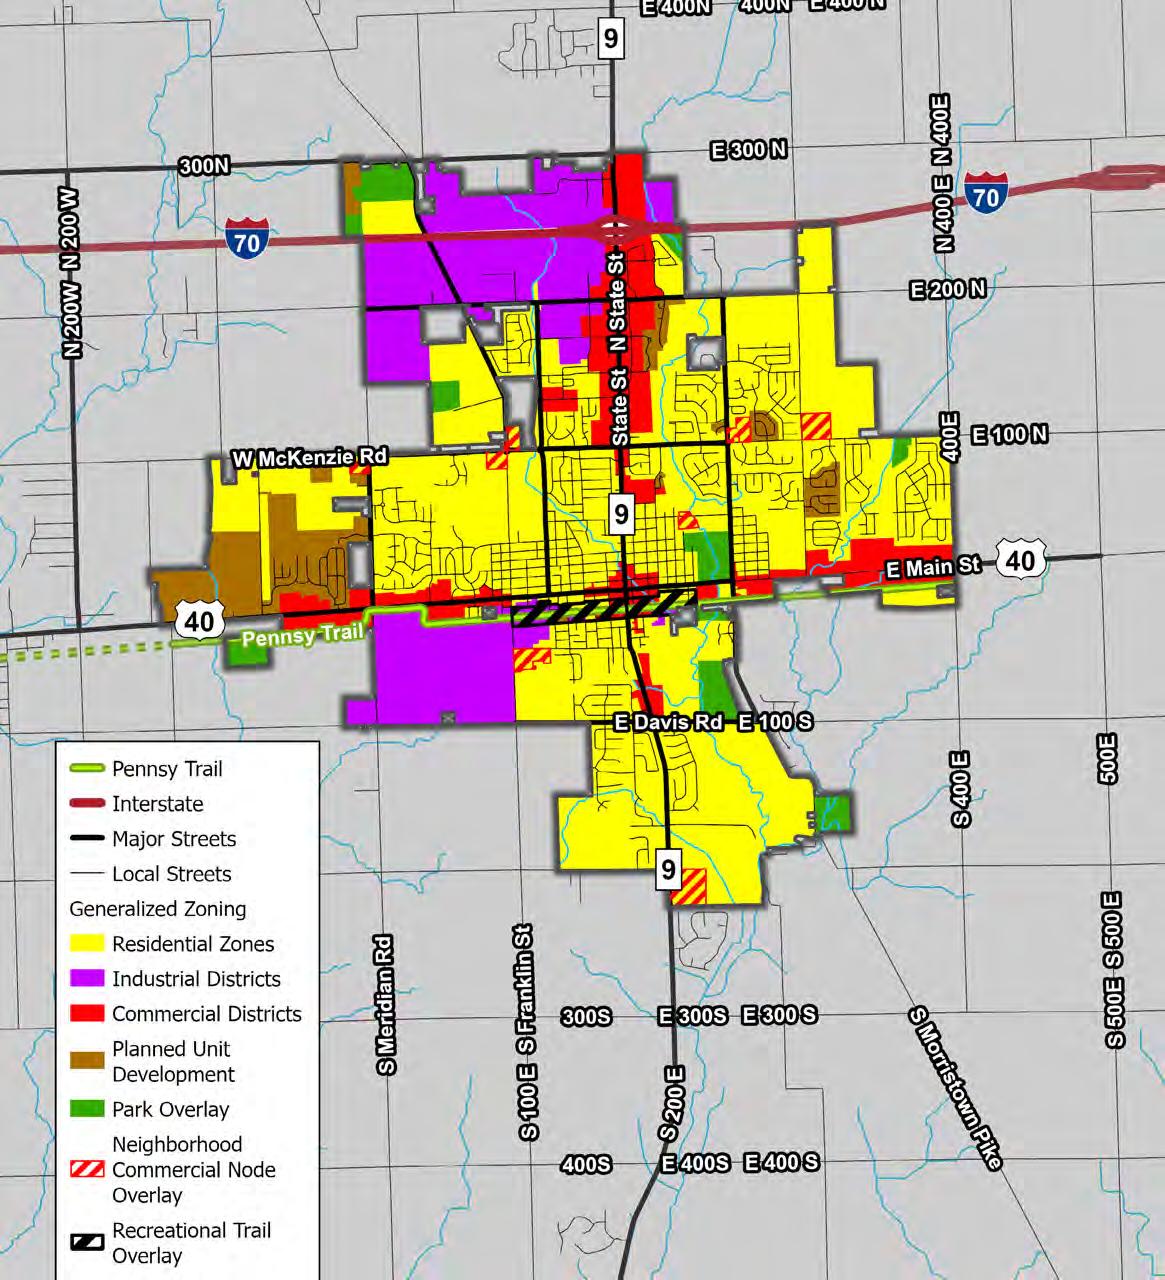
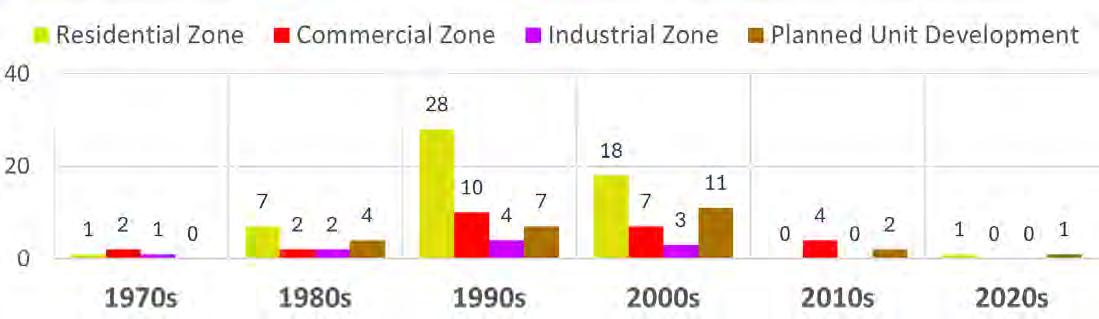
Development constraints and opportunities are critical in mapping to plan for the highest and best use of land in the future. Constraining factors mean development is unfavorable or restricted in an area, while opportunities are factors that present favorable conditions for development. It is important to note that a factor can be both a constraint and an opportunity. For example, development should be highly restricted in environmentally sensitive areas, but these areas also offer valuable recreational opportunities if preserved. Factors to consider as constraints or opportunities include but are not limited to the following:
• Environmentally Sensitive Areas
• Zoning Regulations and Incentives
• Annexation Viability and Return on Investment
• Vacant or Undeveloped Areas
• Public Service Coverage and Capacity
• Transportation and Utilities
• TIF Districts and Other Development Incentives
This appendix provides a comprehensive overview of Greenfield’s population, highlighting key trends and characteristics for data-driven community development and strategic planning. Several aspects of the population are analyzed, such as age, disability, and educational attainment, offering insights for current and future planning efforts.
Greenfield has a rich history that dates back to the early 19th century. When designated as the county seat in 1828, Greenfield had a modest population of 400 people. The construction of the National Road (US 40) in 1835, followed by the arrival of the Indiana Central Railroad in 1853, greatly influenced the town’s early development. When Greenfield was incorporated as a city in 1876, the population had grown to 2,203. The discovery of natural gas in 1887 drove rapid growth and industrialization, establishing Greenfield as a boom town over the next 20 years. This period saw the establishment of numerous manufacturing plants and other industries, contributing to the City’s expansion.
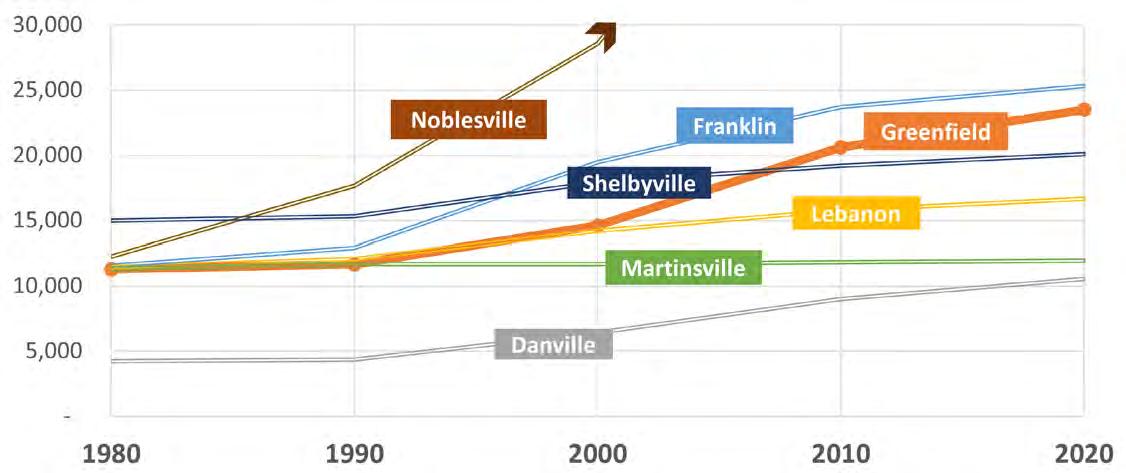
Source: US Census Bureau, Decennial Census
Throughout the 20th century, Greenfield’s population growth was aligned mainly with broader trends in Hancock County and the Indianapolis Metropolitan Area, with significant increases during eras of industrialization (early 1900s) and suburbanization (post-WWII).
Thus far, the 21st century has been a remarkably rapid period of growth for Greenfield. Between 2000 and 2020, the City’s population increased by 60.9 percent, compared to Hancock County’s 44.1 percent and Indiana’s 11.6 percent. This substantial growth can be attributed to Greenfield’s
strategic location within the greater Indianapolis Metropolitan Area, which allows Greenfield to enjoy its small-town charm while benefiting from the urban conveniences and opportunities provided by its proximity to Indianapolis.
Analyzing population density is vital for effective community development. It provides insights into where resources, infrastructure, and services are most needed, allowing for strategic and sustainable growth.
Hancock County is predominantly rural, with Greenfield representing its most populous municipality. Population density within the County
is primarily concentrated in the eastern regions, particularly near the City of Indianapolis border. There is also a noticeable population concentration near the Town of Shirley. This pattern highlights the pull of urban areas on population density.
Population density is most prominent within Greenfield in the City’s central areas. The highest densities, reaching up
to 4,596 people per square mile, are located immediately north of downtown. The city limits’ northern, western, and southern edges show significantly lower population densities. Interestingly, population density decreases along Interstate 70, primarily due to the presence of industrial, agricultural, and commercial land uses along the highway, which impacts Greenfield’s development of residential areas.
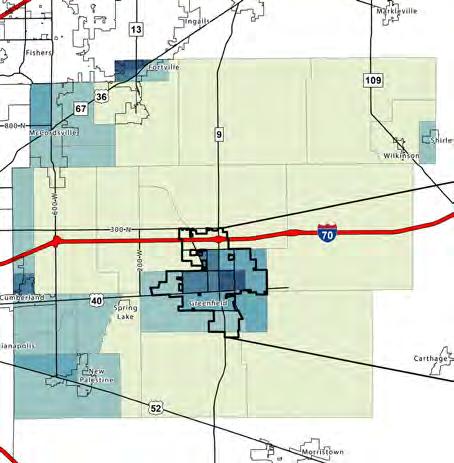
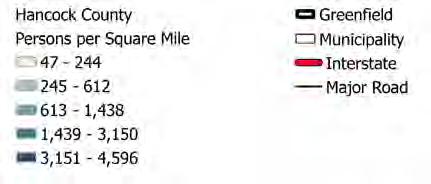
Understanding the age composition of Greenfield’s population allows the City to best plan for its future needs. Analyzing the distribution of different age groups provides insights into the demand for various amenities and services, such as preschools, educational institutions, healthcare, and senior services.
In 2020, babies (aged 0-4) made up 5.7 percent of Greenfield’s population, a decrease from 6.9 percent in 2010. The percentage of children (5-19) also decreased, making up 19.4 percent of the population in 2020, down from 21.8 percent in 2010. These changes in youth populations may impact the demand for early childhood and educational services, as well as child- and family-friendly amenities.
The young adult population, aged 20-34, remained relatively stable, totaling 19.4 percent of the population in 2020, compared to 20.6 percent in 2010. This indicates a steady presence of young adults in the community, a group that typically requires access to higher education, employment opportunities, and suitable housing. Middle-aged adults (35-64) maintained a consistent proportion, representing 37.3 percent of the population in 2010 and 2020. This stability reflects the ongoing need for mid-career employment, family housing, and healthcare services.
The senior population in Greenfield saw a notable increase, rising from 13.3 percent in 2010 to 18.2 percent in 2020. This demographic shift suggests a growing need for senior housing, healthcare services, and community programs for older residents. Additionally, the median age in Greenfield rose from 35.6 in 2010 to 37.8 in 2020, suggesting an aging population.
These demographic trends have important implications for Greenfield. A decreasing youth population might impact early childhood services and elementary school planning. The stable presence of middle-aged adults suggests a continued demand for employment and healthcare services. The significant increase in the senior population highlights the importance of planning for accessible transportation, healthcare, senior services, and agefriendly amenities. Understanding these trends will help anticipate and meet the community’s changing needs and ensure sustainable growth and a high quality of life.
Figure 5-49: Greenfield Population by Age
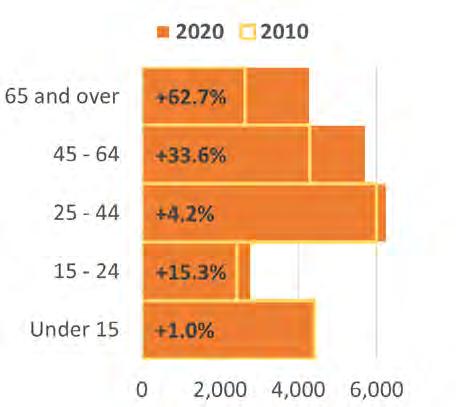
Source: US Census Bureau, Decennial Census
Figure 5-50: Indianapolis Metropolitan Area Population by Age
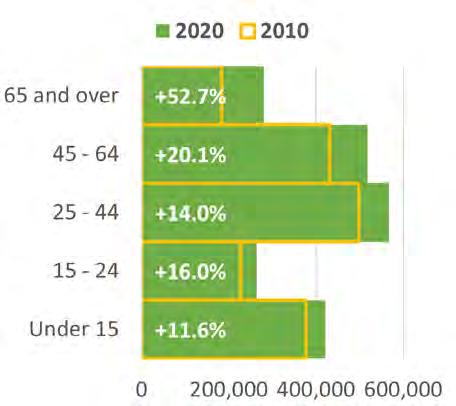
Source: US Census Bureau, Decennial Census
The data from 2020 and 2010 highlights that Greenfield remains a predominantly monoracial town, with the White population constituting 92.1 percent in 2020, slightly down from 96.0 percent in 2010. While this reflects the broader demographic trend in Hancock County and, to a lesser extent, the State of Indiana, Greenfield’s racial diversity is less pronounced than the Indianapolis Metropolitan Statistical Area (The Indy MSA), where the white population makes up 69.6 percent.
From 2010 to 2020, the Black population experienced a 22.5 percent decrease, from 1.5 percent to 1.2 percent. During this same period, the Asian population in Greenfield increased from 0.2 percent to 0.8 percent. Though this community represents a small portion of the total population, it grew an impressive 247.5 percent from its 2010 level. The percentage of individuals identifying as Other Races remained very small yet has substantially increased over the past decade by 130.8 percent. The most notable change is in the population identifying as Two or More Races, which grew from 1.7 percent in 2010 to 4.7 percent in 2020, increasing by 175.5 percent. This increase suggests a gradual shift towards more racial diversity, even if it remains modest compared to larger urban areas.
Acknowledging the growing diversity, even if slight, helps craft policies that ensure all racial and ethnic groups feel represented and supported. By understanding these demographic shifts, Greenfield can proactively address potential disparities and work towards building a more inclusive community that serves all residents.
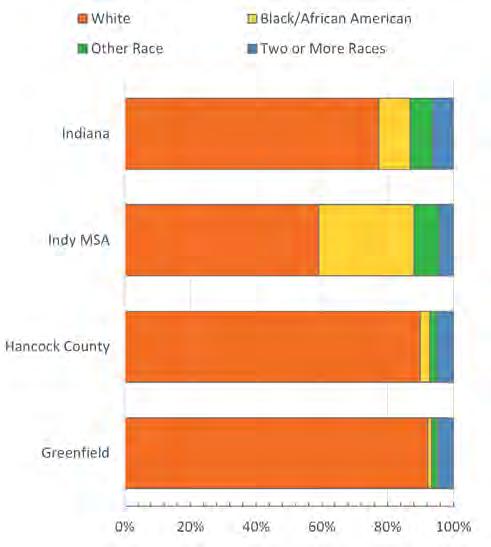


In 2020, Greenfield’s total civilian non-institutionalized population was 21,974, with 4,052 residents (18.4 percent) reported as having a disability. Understanding the distribution and types of disabilities within the community is critical for creating an inclusive and accessible city that caters to the needs of all residents. This data can guide the planning and implementation of services, infrastructure, and support systems to improve the quality of life for residents with disabilities.
Different types of disabilities affect the population in various ways. Hearing difficulties were reported by 6.4 percent (1,413) of the population. Vision difficulties were less common, involving 2.3 percent (501) of the population. Cognitive difficulties were reported by 9.5 percent (1,962), while 9.4 percent (1,940) experienced ambulatory challenges. Self-care difficulties affected 4.3 percent (882) of residents, and 8.1 percent (1,405) had problems with independent living.
The prevalence of cognitive and ambulatory (walking) difficulties highlights the importance of inclusive public spaces and support services, such as ramps, accessible transportation options, and specialized healthcare services.
When considering residents with a disability by age group, the prevalence of disabilities increases with age. No children under the age of 5 were reported to have a disability. In age 5 to 17 years, 13.6 percent (463) had a disability. For young adults aged 18 to 34 years, the percentage drops to 10.3 percent (575). However, the rate rises significantly in older age groups. Among those aged 35 to 64 years, 17.2 percent (1,338) had a disability. This percentage increases again for individuals aged 65 to 74 years, with 29.5 percent (622) reporting a disability. The highest rate is found among those 75 years and older, where 59 percent (1,054) had a disability.
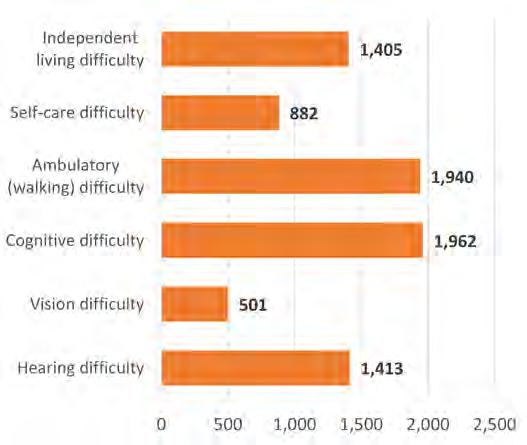
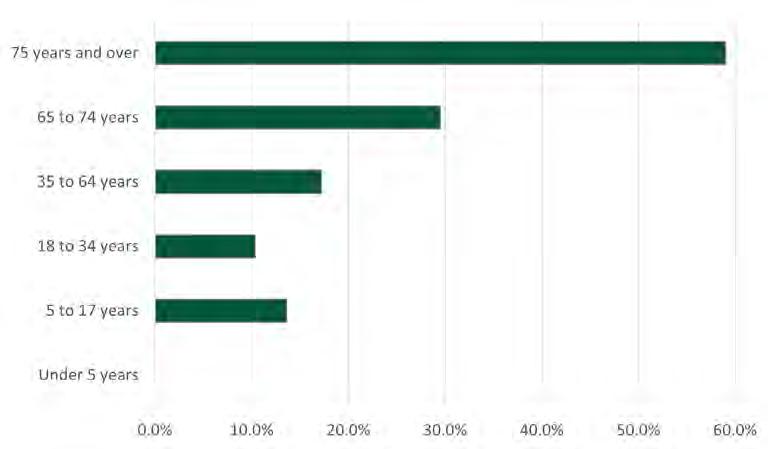
Educational attainment levels provide essential insight into the community’s workforce and potential economic development. In 2020, 7.9 percent of Greenfield’s residents aged 25 and older had less than a high school diploma, a decrease from 14.4 percent in 2010. This decline suggests improvements in educational attainment and a reduction in individuals without a high school diploma.
High school graduates made up 37.4 percent of Greenfield’s population in 2020, a slight decrease from 39.6 percent in 2010. However, this is higher than Hancock County (31.1 percent), The Indy MSA (27.4 percent), and Indiana (33.2 percent) in 2020. The proportion of residents with some college education but no degree increased from 19.5 percent in 2010 to 21.3 percent in 2020, reflecting a consistent pursuit of higher education but potential barriers to completing degree programs.
Residents with an associate’s degree in Greenfield increased from 8.3 percent in 2010 to 10.0 percent in 2020, indicating a rise in vocational and technical education. This is comparable to Hancock County (9.1 percent), but higher than The Indy MSA (7.7 percent) and Indiana (8.9 percent) in 2020. Bachelor’s degree holders also increased, from 12.8 percent in 2010 to 13.9 percent in 2020. Although this percentage is still below Hancock County (21.1 percent), The Indy MSA (20.8 percent), and Indiana (17.3 percent) in 2020, it suggests a trend towards higher educational attainment within Greenfield. In Greenfield, the number of graduate or professional degree holders nearly doubled from 2010 to 2020, increasing from 5.4 percent to 9.5 percent. This growth exceeds Hancock County (10.7 percent), is close to The Indy MSA (11.4 percent), and is higher than Indiana (9.9 percent) in 2020.
These trends indicate that Greenfield is experiencing positive growth in educational attainment across various levels. The increase in higher education attainment levels suggests a more skilled workforce, potentially attracting businesses and supporting economic growth.
5-55: Educational Attainment (2010 - 2020)
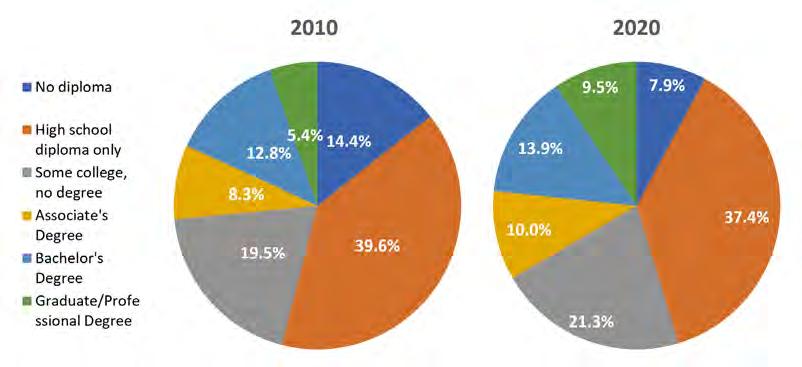
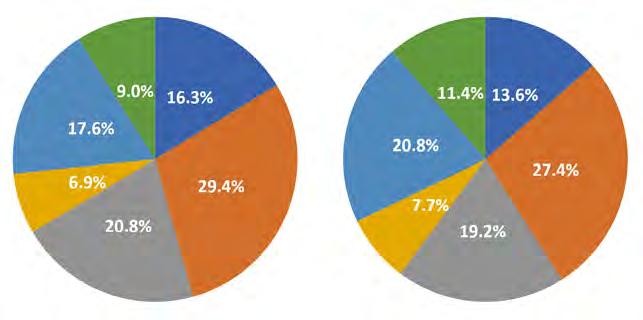
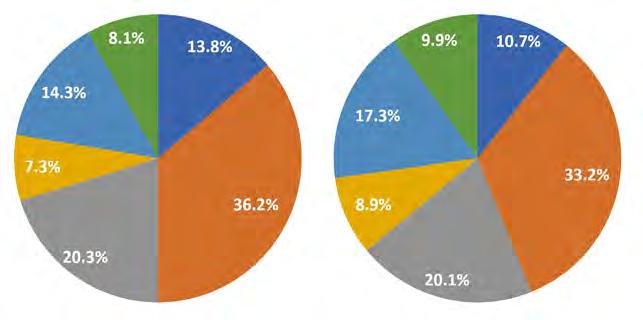
Source: US Census Bureau, ACS 5-Year Estimates
School enrollment plays an essential role in Greenfield’s educational landscape. Understanding enrollment trends can help identify funding needs, improve bus routes, enhance educational support services, and project class sizes, which can influence the demand for teachers or school openings or closures.
Between 2010 and 2020, the number of students enrolled in any level of schooling decreased from 4,930 to 4,508. The most significant change occurred in nursery and preschool enrollment, which dropped from 381 children (representing 7.7 percent of the total school enrollment) in 2010 to 181 children (4.0 percent) in 2020, a total decrease of 52.5 percent.
The decrease in early childhood enrollment is consistent with the decline of the population aged 0-4 years during the same period. It may suggest a potential reduction in the demand for early childhood education services. However, kindergarten enrollment experienced a 36.6 percent increase from 224 students (4.5 percent) in 2010 to 306 students (6.8 percent) in 2020, indicating a rise in the number of young children entering the school system.
Elementary school enrollment also experienced a significant decrease of 25.1 percent, with 987 students (21.9 percent) in 2020 compared to 1,318 students (26.7 percent) in 2010. Similarly, middle school
enrollment declined by 15.4 percent from 1,308 students (26.5 percent) in 2010 to 1,106 students (24.5 percent) in 2020. These trends reflect changes in the population of school-age children in Greenfield.
High school enrollment increased from 811 students (16.5 percent) in 2010 to 905 students (20.1 percent) in 2020, a total increase of 11.6 percent. This rise suggests a growing number of teenagers in the community.
Undergraduate college enrollment remained relatively stable, increasing by 4.0 percent, with 783 students (17.4 percent) in 2020 compared to 753 students (15.3 percent) in 2010. Graduate college enrollment also experienced a significant increase of 77.8 percent,
rising from 135 students (2.7 percent) in 2010 to 240 students (5.3 percent) in 2020, indicating an increased interest in advanced degrees among Greenfield residents.
The decrease in nursery and elementary school enrollments could signal shifting population demographics, while the increases in high school and graduate college enrollments suggest a focus on higher education. Understanding these patterns helps plan for the necessary educational resources and facilities to support the community’s growth and development.
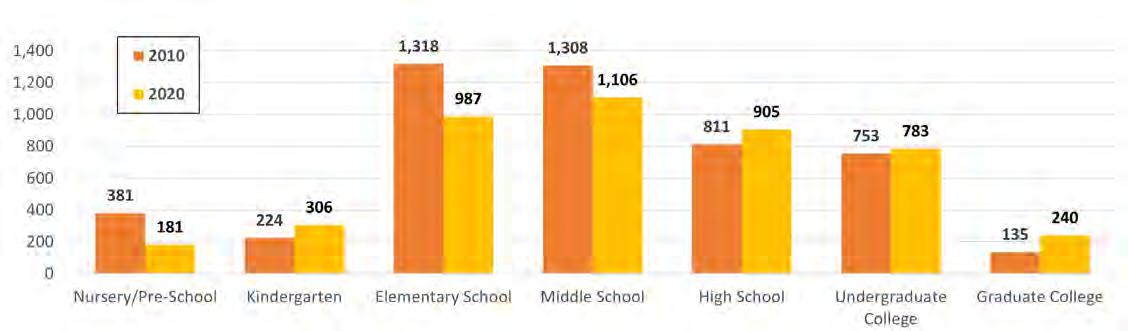
US Census Bureau, ACS 5-Year Estimates
Understanding the socioeconomic challenges Greenfield residents face helps create targeted interventions and support systems to uplift vulnerable populations.
In 2020, 10.1 percent of Greenfield’s population lived below the poverty level, higher than Hancock County’s rate of 5.9 percent but lower than the Indy MSA’s 11.5 percent and Indiana’s 12.9 percent. This was a slight decrease from 2012, when Greenfield and surrounding areas experienced higher poverty rates.
By age group, in 2020, 17.6 percent of Greenfield residents under 18 lived in poverty. This is consistent with the State average but higher than the Indy MSA and significantly higher than the 7.7 percent in Hancock County. This highlights a key area of concern, indicating that nearly one in five children in Greenfield faces economic hardships.
Among adults aged 18 to 64, 8.4 percent were below the poverty level in Greenfield in 2020, a decrease from 10.6 percent in 2012. This rate is slightly lower than the 10.7 percent in the Indy MSA and significantly lower than the State
average of 12.5 percent, but higher than the 5.2 percent in Hancock County.
For the senior population aged 65 and over, 7.2 percent were living below the poverty level in 2020, a decrease from 8.2 percent in 2012. This rate is consistent with both the Indy MSA and the State average, slightly higher than Hancock County’s 6.1 percent.
This data underscores the importance of addressing poverty through age-specific programs and policies. This may include ensuring children’s access to quality education and food programs. Job training and employment opportunities are crucial for working-age adults. For seniors, providing access to healthcare and affordable housing is essential.
Understanding the relationship between employment status and poverty is important to community planning. It helps shape strategies to enhance economic opportunities, identify workforce development gaps, and create targeted initiatives to reduce poverty.
In 2020, 10.1 percent of Greenfield’s population lived below the poverty level, a decrease from 11.8 percent
in 2012. Among the civilian labor force aged 16 years and over in Greenfield, 3.6 percent lived in poverty in 2020, down from 5.6 percent in 2012. This decrease reflects broader trends in Hancock County, the Indy MSA, and Indiana, indicating improved economic conditions from 2012 to 2020.
The poverty rate among employed residents decreased from 4.7 percent in 2012 to 3.3 percent in 2020. However, the poverty rate among unemployed individuals remained significantly higher, though it decreased from 15.3 percent in 2012 to 13.4 percent in 2020. These figures underscore the importance of job creation and workforce development programs to support those seeking employment.
In 2020, 6.1 percent of households in Greenfield received food stamps/ SNAP benefits, which is lower than the statewide average of 9.3 percent and the 8.7 percent seen in the Indy MSA but higher than Hancock County’s rate of 3.7 percent.
Among households receiving Food Stamps/SNAP in Greenfield, a sizable portion, 27.2 percent, included one or more people aged 60 years or older. This is slightly lower than the 29.2 percent in the
Indy MSA and the 28.1 percent in Indiana but much lower than the 44.6 percent in Hancock County. This suggests a great need for assistance among senior residents.
Households with children under 18 years represent 60.9 percent of Food Stamps/SNAP recipients in Greenfield, significantly higher than in the County, Indy MSA, and State. This suggests that a substantial number of families with young children in Greenfield are experiencing food insecurity and require support.
Additionally, 68.1 percent of Greenfield households receiving Food Stamps/SNAP benefits include one or more people with a disability, indicating a considerable need for assistance among residents with a disability in Greenfield.
Interestingly, 43.7 percent of households receiving Food Stamps/ SNAP benefits in Greenfield are at or above the poverty level, suggesting that many households above the poverty line still require assistance to meet their needs.
5-57: Poverty by Age Group (2012 - 2020)
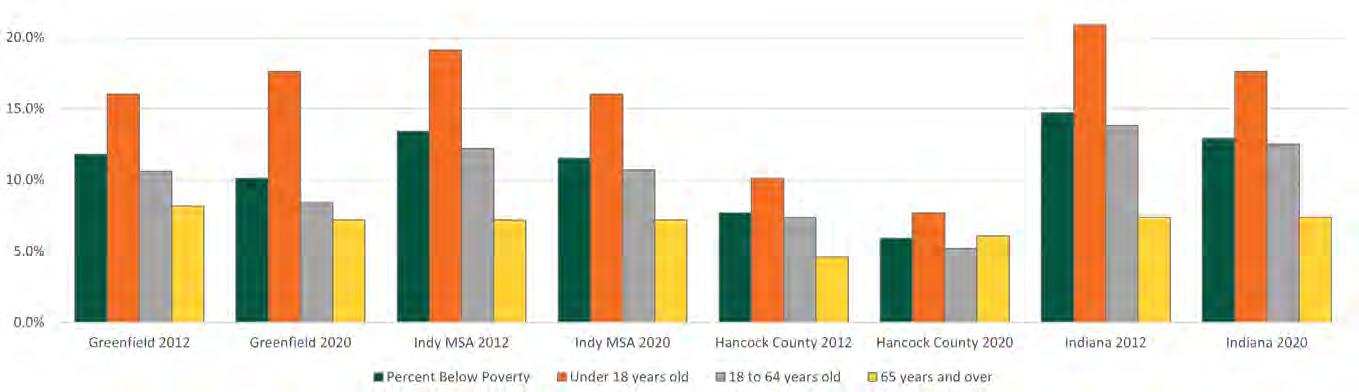
Source: US Census Bureau, ACS 5-Year Estimates
Figure 5-58: Percent of Households Receiving Food Stamps/SNAP (2020)
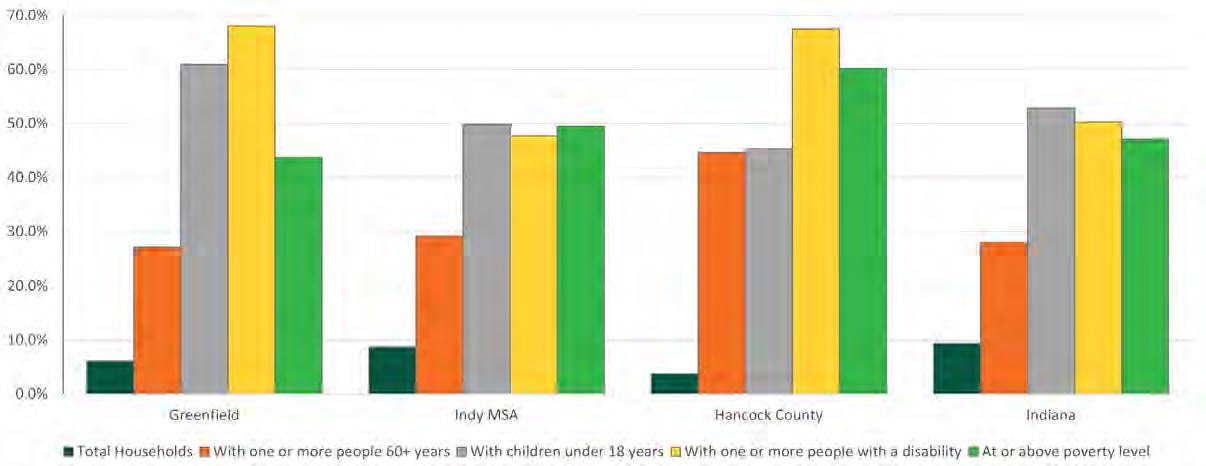
Source: US Census Bureau, ACS 5-Year Estimates
Housing refers to the places that people live in. These places can be single-family homes, duplexes, triplexes, multifamily apartment buildings, or any other place a person calls home. It is important to understand the existing conditions of housing to create a plan for the future that expands upon areas of the market that are lacking, and to plan for complementary land uses surrounding existing and future housing.
These graphs describe the composition and living arrangements of the average household and family households in the city of Greenfield, and for some graphs Hancock County and the state of Indiana are included. The percentage of family households in the city of Greenfield in 2010-2015 has followed the slight downward trend also experienced at the state level but shows to have stabilized from 2015-2020 having almost the same percentage of family households in 2020 from 2015.
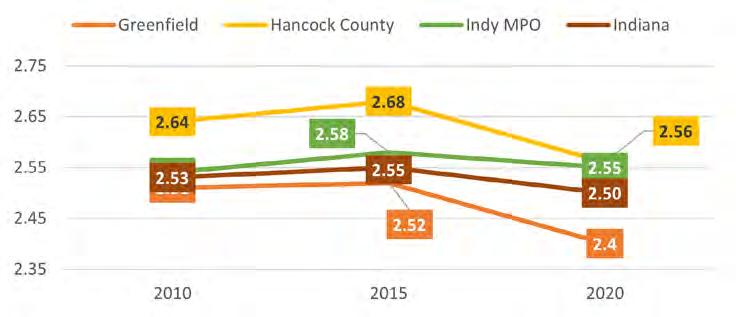
Source: US Census Bureau, ACS 5-Year Estimates
The first chart on the next page shows when current (2020) residents of Greenfield moved into their homes. The first graph showing the timeframe for when the householder moved into an owner-occupied unit and the second chart showing the number of individuals that moved into renter-occupied units in each time frame. The vertical axis is set to the same values (0 – 6,000) in both charts to provide a clearer visual comparison of the number of individuals that moved into owner and renter occupied units.
The chart to the left portrays the average household size (AHS) of both family and non-family households. The average household size in the city of Greenfield has been similar to the state of Indiana in the 10-year period with the exception of 2020 where both the state and the city experienced a decrease in the AHS from 2015.
From 2000-2009, many individuals moved into the city in owner occupied units (3243) more than twice the number in the previous time frame. The number of individuals that moved into the city as owner occupied householders grew by slightly under 2,000 in 2010-2014, in this period Greenfield received the largest quantity of people moving into the city for both owner occupied and renter occupied units in the six time frames, with 4,079 individuals moving in renter occupied units from 2010-
2014. The increase of householders moving into renter occupied units was particularly drastic in 2010-2014 in comparison to the previous time frame, whereas only 280 moved into renter occupied units from 20002009 in comparison to 4,079 from 2010-2014. The increase was less drastic in these two timeframes for owner occupied units but significant for renters who moved into the city.
The following charts provide insight into the housing stock and its characteristics. Greenfield had a high occupancy rate in 2020 with 96.4% of housing units occupied. Of Greenfield’s 9,488 occupied housing units, 62% are owner-occupied (also known as the homeownership rate) and 38% are renter-occupied. The home ownership rate is high in Hancock County at 80%, much greater than the City’s occupancy rate (62%). The housing vacancy rate is comparable to the county, with 3.6% of homes vacant in the City and 3.3% in the County.
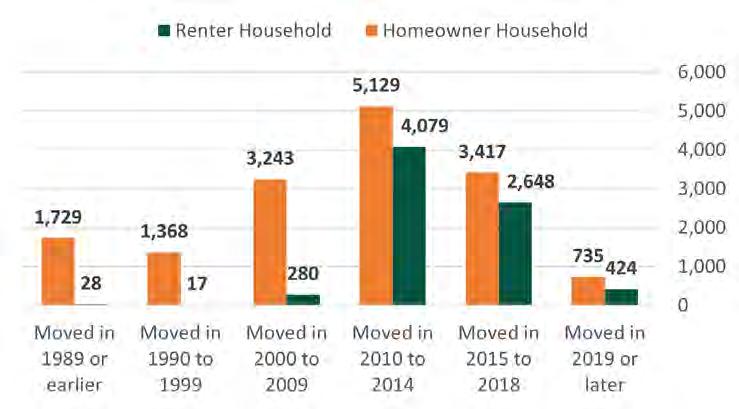
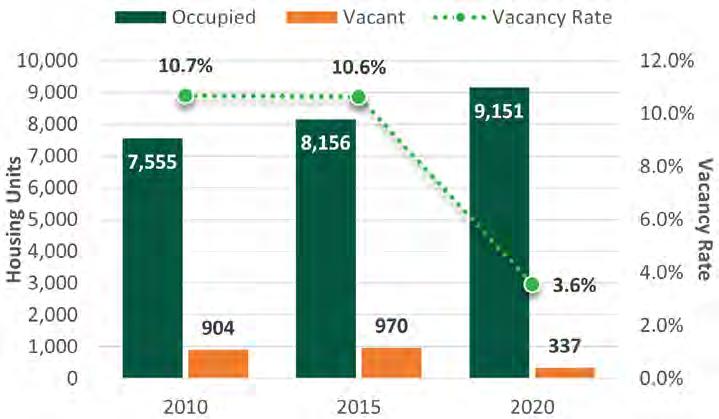
The 3 charts below portray the proportion of all the housing types at 4 geographies, the city, the county, Indianapolis MPO, and the state of Indiana. The first two charts shown side by side show the percentage of housing stock of each housing type with single family houses removed in the second chart to provide a clearer depiction of the composition of the housing typologies other than single family houses in the housing stock at each respective geography because single family housing represents a large proportion of housing in all 4 geographies. The city of Greenfield has a much lower percentage of single-family housing than Hancock County. The second largest type of housing in the city is small apartment buildings at 7.5% which is a higher percentage of the proportion of total housing stock than the 3 other geographies.
The graph below depict the housing stock by decade built that give insight into when the city had large periods of increased construction of housing to accommodate forecasted or current growth at the time. The chart below shows Greenfield in relation to the 3 geographies with the graph below it being the same graph but instead only comparing
the city to the state. The city experienced the largest quantities of housing built during the 1990s and the 2000s 10-year time periods.
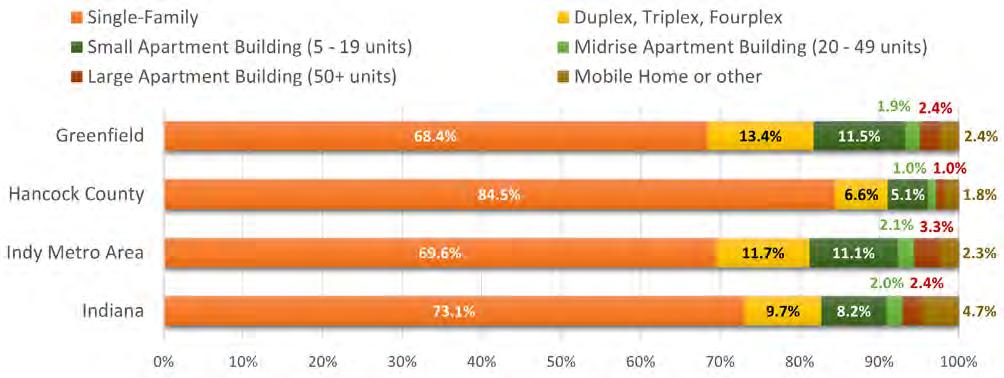
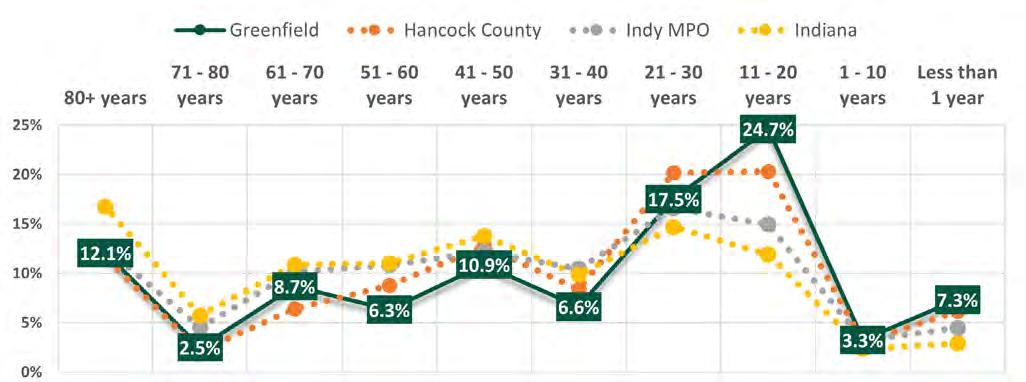
The median home values (adjusted for inflation) show that home values in the city of Greenfield have followed a similar trend to the state’s MHV’s in the 10-year period, whereas Hancock County median home values adjusted for inflation are higher than both the city and state throughout the decade.
The median household income (adjusted for inflation) in the city of Greenfield has followed a similar trend to the state of Indiana, increasing slightly above the state MHI from 2013-2016 and now in 2020 is very close to the state.
Figure 5-64: Median Home Value (inflation-adjusted in 2020 dollars)
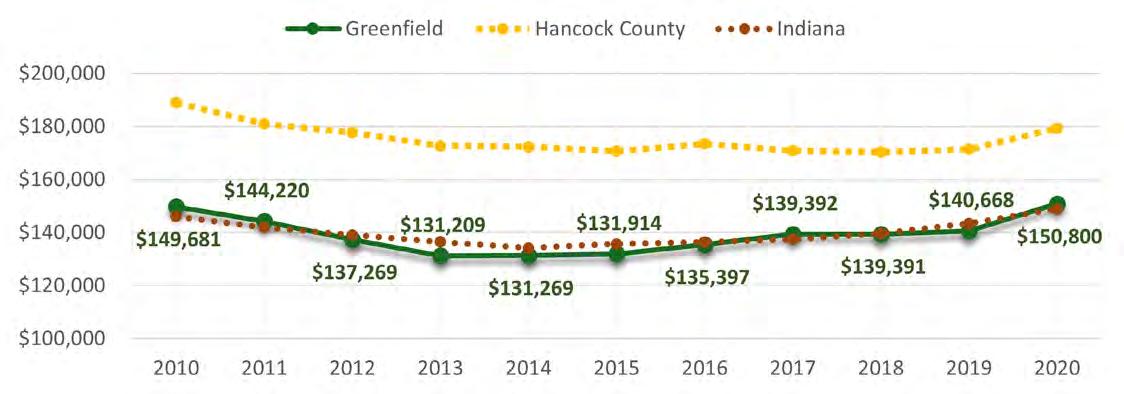
Source: US Census Bureau, ACS 5-Year Estimates
Figure 5-65: Median Household Income (inflation-adjusted in 2020 dollars)
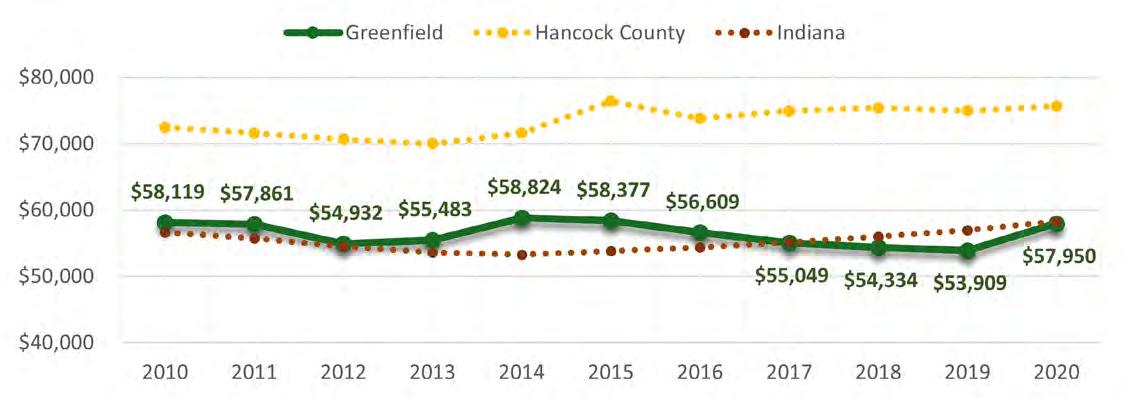
Source: US Census Bureau, ACS 5-Year Estimates
This appendix explores the different industries, workforce characteristics, employment, and earnings across the Greenfield population and the Greenfield workforce, varying across different backgrounds. By looking at these existing conditions, future economic strategies can be established to foster a healthy and vibrant economy in Greenfield.
Using the shift-share analysis as a basis, the strongest industries in Greenfield are:
A shift-share analysis uses data from the number of workers in each industry to find its location quotient, which is used to signal whether an industry is more or less specialized toward a certain industry than the broader, encompassing economy (often compared to the state). These location quotients (LQs) are then compared with another point in time to uncover broad trends in the economy, which is indicative of whether an industry is growing or declining in the local economy (Greenfield). If the LQ decreased, then the industry is declining, and vice versa.
Additionally, if the LQ value is above one (1), then the local industry is more specialized (i.e. stronger) than the broader, encompassing industry (Indiana), and if the value is below 1, then the industry is less specialized (i.e. un- or under-developed) than the broader economy. These LQ values and change are plotted on a chart (see next page) to help better communicate how the economy has changed since 2010.
The numbers beside each industry show how many people that industry employed in 2020.
By splitting the table into four quadrants, it is clear to see which industries are thriving and which would need assistance. Manufacturing, public administration, accommodation and food services, and professional, scientific, and technical services all are strong industries within Greenfield and have shown growth over the past 10 years. Health care and social assistance has remained stable in size; however, this industry continues to thrive within Greenfield. On the other end, there are many smaller industries that are underdeveloped in the City. For example, construction is an underdeveloped industry, but it has grown since 2010. The quadrants that show “Undeveloped but Growing Industry” and “Strong but Shrinking Industry” could be focus areas for economic development, whether that be helping an industry grow or retaining a large but shrinking industry such as retail trade.
Created using data from the US Census Bureau, ACS 5-Year Estimates
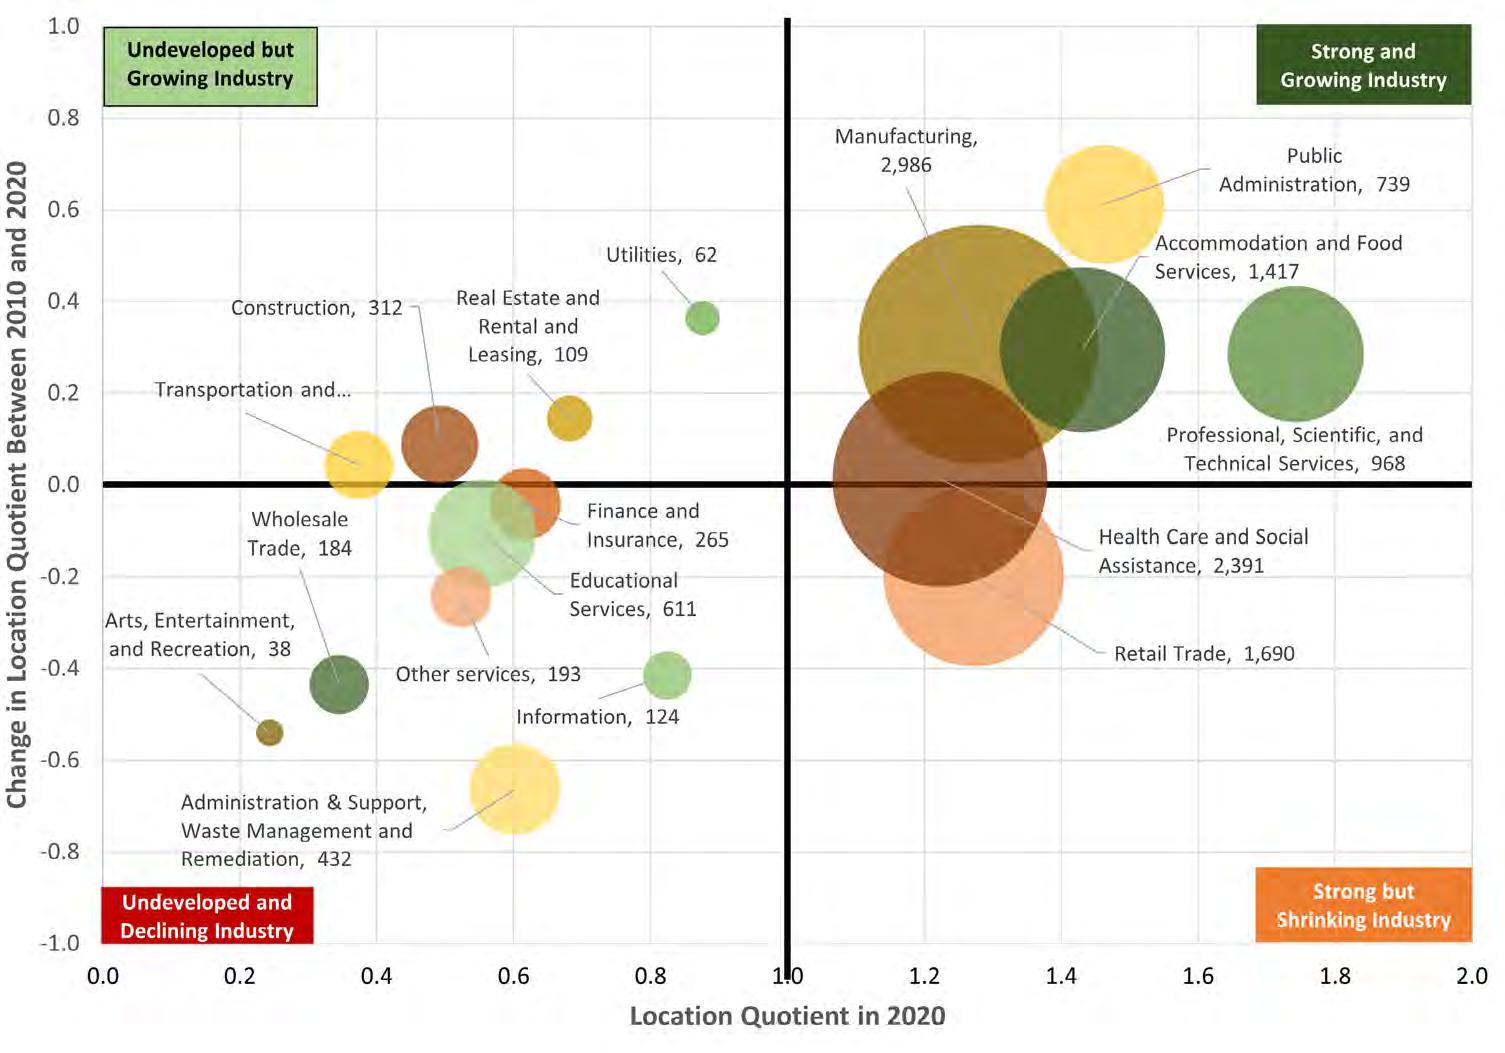
Name of Industry
Future economic development efforts may want to put a greater focus on the educational services industry, rather than the transportation/warehousing industry. There are three main reasons for this:
1. The educational services industry could improve local schools, quality of life, educational opportunities by attracting highly skilled talent,
2. The educational services industry does not necessarily require as much land as the transportation/warehousing industry,
3. The City would be in direct competition with economic development efforts around the Mt. Comfort Corridor, which has a competitive advantage of attracting TW businesses using the Indianapolis Regional Airport.
Within Hancock County, ten major employers were determined based on the number of employees in these establishments. Out of these ten employers, six are located within Greenfield. This demonstrates that Greenfield is a prominent point of economic activity within Hancock County.
Out of the four major employers not within Greenfield, two are part of the Transportation and Warehousing (TW) industry and two are part of the Educational Services (ES) industry. Referencing the previous shift-share analysis, the TW and ES industries are both less specialized than the state economy, however, the TW has become more specialized to Greenfield while the education industry has become less specialized.
This data from the US Census Bureau encompasses only residents of the City, not the entire workforce (e.g. people who commute into Greenfield). According to data from the US Census Bureau, as well as the previous shift-share analysis, it is evident that a large number of residents are employed in the health care and social assistance industry. Out of the 11,048 employed residents 16 years and older, 1,688 (15%) are employed in this industry. Manufacturing also contributes to a large share of employment, accounting for 14% of total employment.
As aforementioned, this data only encompasses residents of Greenfield. According to US Census Bureau data, the management, business, science, and arts occupations have the largest shares of employment of Greenfield residents. Notably, though, there is a relatively even distribution of the different types of occupational jobs, which indicates that residents as a whole have a diverse set of skills and range of experiences. Broadly speaking, this also indicates relatively little occupational specialization of the local economy which could mean a greater ability to transition between jobs.
According to the US Census Bureau definitions, employment by industry describes the kind of business in which a person is employed. Meanwhile, employment by occupation describes the kind of work a person does at their job. For example, someone could be employed in the ‘health care and social assistance’ industry and hold a ‘sales and related’ occupation. This means their job responsibilities are most likely revolve around selling healthcare-related services or products.
Figure 5-67: Major Employers in Hancock County
Rows in green indicate the employer or the employer’s main operations are located within Greenfield city limits. Employer Industry Employees
5-68: Greenfield Residents’ Industry
(2020)
Source: Hancock Economic Development Council (August 2024).
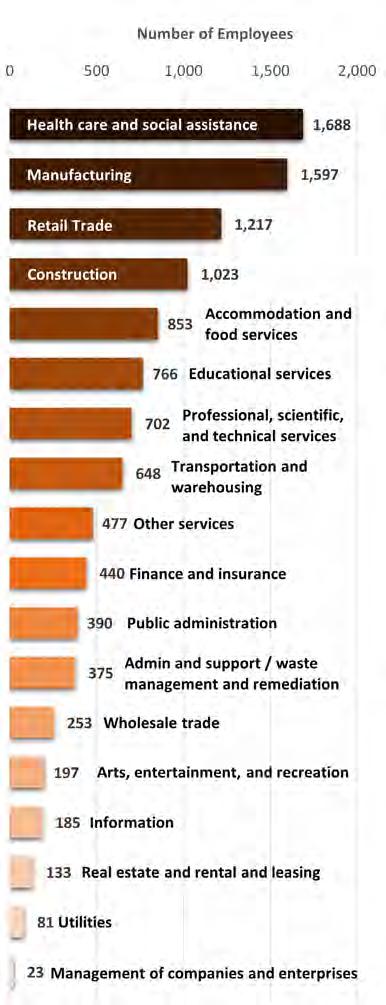
5-69: Greenfield Residents’ Employment Occupation (2020)
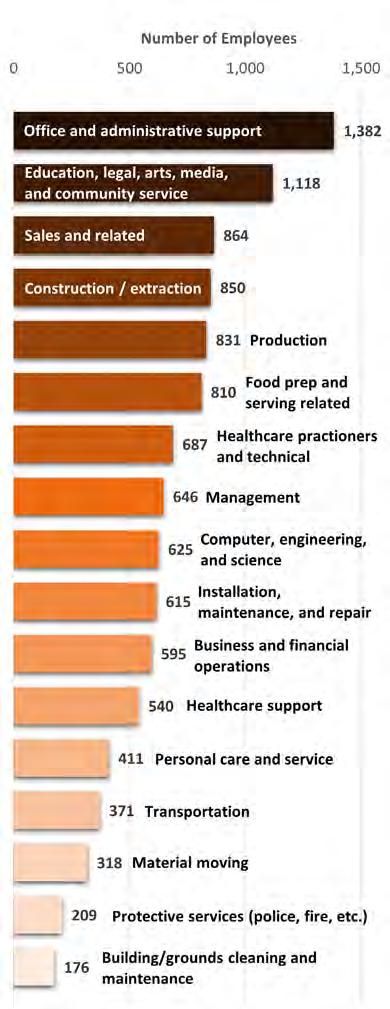
US Census Bureau, ACS 5-Year Estimates
Worker education is valuable to consider when looking at the employment patterns of a community. By looking at the educational attainment with employment status, patterns may emerge that can reveal more characteristics to Greenfield’s residents currently in the workforce.
A slight majority of residents (25+ years old) in the workforce have attended college (54.7%). No matter whether they received a diploma, most of those individuals (71.6%) are employed. If they received a Bachelor’s or higher degree, that percentage increases to 77.9%. For residents who never attended college, only half 50.3% of are employed.
In Greenfield, a vast majority of residents in 2022 (89.5%) commuted to work with an automobile, according to ACS 5-year estimates. Some commutes, however, have been replaced with working from home, which grew from 2.3% of commutes in 2010 to 7.8% in 2022. All other forms of transportation used for commuting account for 2.8% of commutes, such as walking, biking, taxis, motorcycles, etc.
The absence of other transportation modes for commuting can be attributed to the majority of residents working outside of Greenfield, according to the US Census Bureau’s OnTheMap webservice. In 2022, nearly four-fifth of (79.6% or 9,771) Greenfield residents commuted to jobs outside the City, while more than 10,000 people living elsewhere commuted into Greenfield (see graphic to the right). Only 2,500 residents commuted to jobs within Greenfield, representing 20.4% of employed residents and 18.6% of the City’s workforce (i.e. people employed in Greenfield no matter their residence).
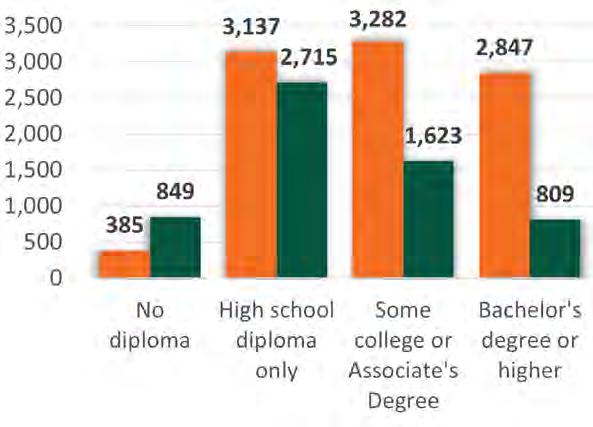
US Census Bureau, ACS 5-Year Estimates
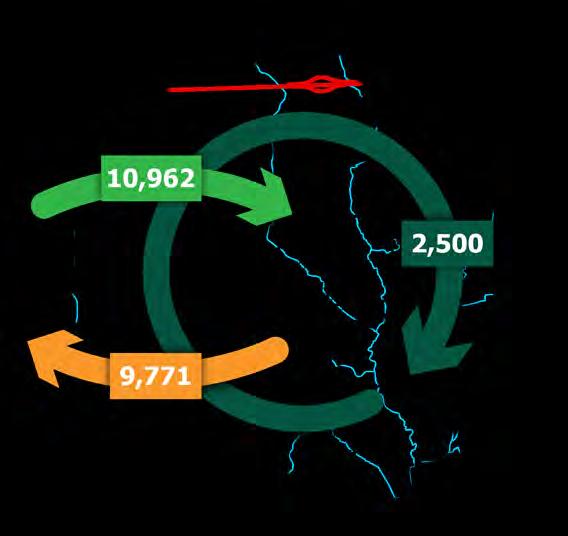
Source (s): US Census Bureau, ACS 5-Year Estimates
Source: US Census Bureau, OnTheMap
Discovering the median annual earnings of Greenfield residents, especially relatively to Hancock County and Indiana, can give a good perspective of Greenfield’s economy in the scope of larger land areas. Furthermore, looking at earnings as a function of sex and industry can reveal nuances in the median annual earnings cross sectionally.
The median income of civilian population 16 years and over is $42,028. This means 50% of residents earn more and 50% earn less than the median. The chart to the right shows that Greenfield has a slightly higher median earnings relative to the State, however, it has a lower median than Hancock County. Furthermore, there is an apparent wage gap between female and male residents across all three areas, with the largest difference in earnings in Greenfield.
The industry with the highest median earnings in Greenfield is finance and insurance at $59,904, almost $18,000 more than the overall median earnings ($42,028). Referring to the chart, Employment by Industry,” the three largest industries employing Greenfield’s residents are health care and social assistance, manufacturing, and retail trade. Respectively, the median earnings for residents in these industries are $32,971; $47,522; and $37,979. Only the manufacturing industry is higher than the overall median earnings, meaning two of the largest industries offer lower-wage jobs than other industries. It is important to note that most residents (79.6%) work in jobs outside of Greenfield, which could present an economic development opportunity to employ residents within the City if comparable jobs can offer higher wages.
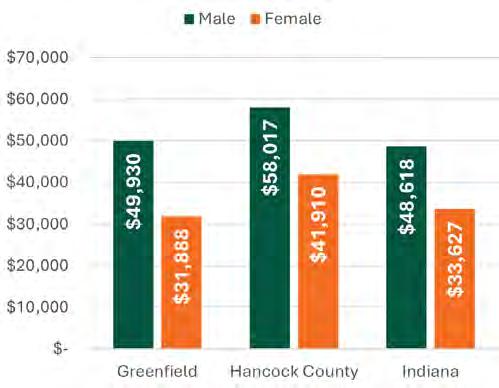
5-74: Earnings by Industry (2020)
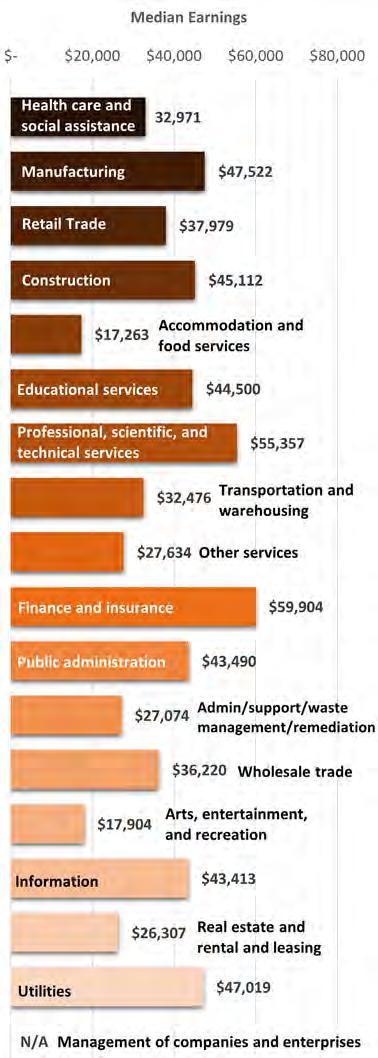
Source: US Census Bureau, ACS 5-Year Estimates


Indiana Comprehensive Plan 4
Percent of Households with No Vehicles (2020) Legend
Percent of Housing Units Built After 2013 (up to 2020)
Percent of People Below Poverty Level (2020)
Percent of Population 25+ Years Old with a Bachelor’s Degree or Higher (2020)
Percent of Employed Residents (16+ Years Old) Commuting Outside Place of Residence (2020)
Greenfield, Indiana Comprehensive Plan
Percent Change in Population Between 2010 and 2020
Percent of Housing Stock that is Single-Family Homes (2020)

Per Capita Income (2020)

Housing Vacancy Rate (2020)
City of Greenfield, Indiana | Comprehensive Plan Our Roadmap to 2055