


Verline Dotson
Terri England
Christine Fisher
Marcia Futel
Anthony Hobson
Jalissa Hutchins
Micah Kamrass
Gary Lindgren
Crystal Perkins
Laura Sanregret
Bishop Ennis Tait
Sallie Westheimer
H.James Williams, PhD
Ben Lindy, President
Eve Bolton
Brandon Craig
Carolyn Jones
Kareem Moncree-Moffett, PhD
Mike Moroski
Mary Wineberg
Thank you for your trust in Cincinnati Preschool Promise and our vision to provide high-quality preschool for our youngest learners. Your continued investment in Cincinnati Preschool Promise enables us to give preschoolers the solid foundation needed to succeed.
This annual report looks back on our 2021-22 outcomes. We are proud of our accomplishments and celebrate our progress, knowing we still have more to do. Our view of kindergarten readiness has expanded to include the whole child. Research has shown that preschoolers with a firm educational foundation at the beginning of their educational journey tend to thrive from preschool to kindergarten and beyond. Social-emotional learning, individual development, and performance on traditional measures, such as the Kindergarten Readiness Assessment in literacy and math, are essential measures that guide our work.
We thank City of Cincinnati taxpayers for continuing your investment in Cincinnati Preschool Promise and Cincinnati Public Schools. We also proudly acknowledge the staff, Board, stakeholders, community partners and our Community Providers who are doing fantastic work to make our success what it is today.
We ask you to continue the journey with us.
O’dell M. Owens, M.D. Cincinnati Preschool Promise Board Chair

Ben Lindy Cincinnati Public Schools Board Chair

To ensure equitable access to high-quality preschool so that every Cincinnati child is prepared for kindergarten.
Our region values preschool as an integral part of a child’s education and as an important support for working families. The community acknowledges that the best outcomes are possible with continuous access to high-quality education, beginning with preschool, and ongoing engagement throughout a child’s educational experience. This is especially true for children with the greatest need. Kindergarten readiness, and third grade reading are short-term benefits of increased participation in preschool. The longerterm benefits, from middle school through high school, will produce a more qualified workforce and community.

Cincinnati Preschool Promise is possible thanks to a significant investment from taxpayers. In 2016, and again in 2020, a five-year Cincinnati Public Schools levy was approved with overwhelming support. The levy allocated $33 million per year to strengthen K-12 education and $15 million per year to expand access to quality preschools.

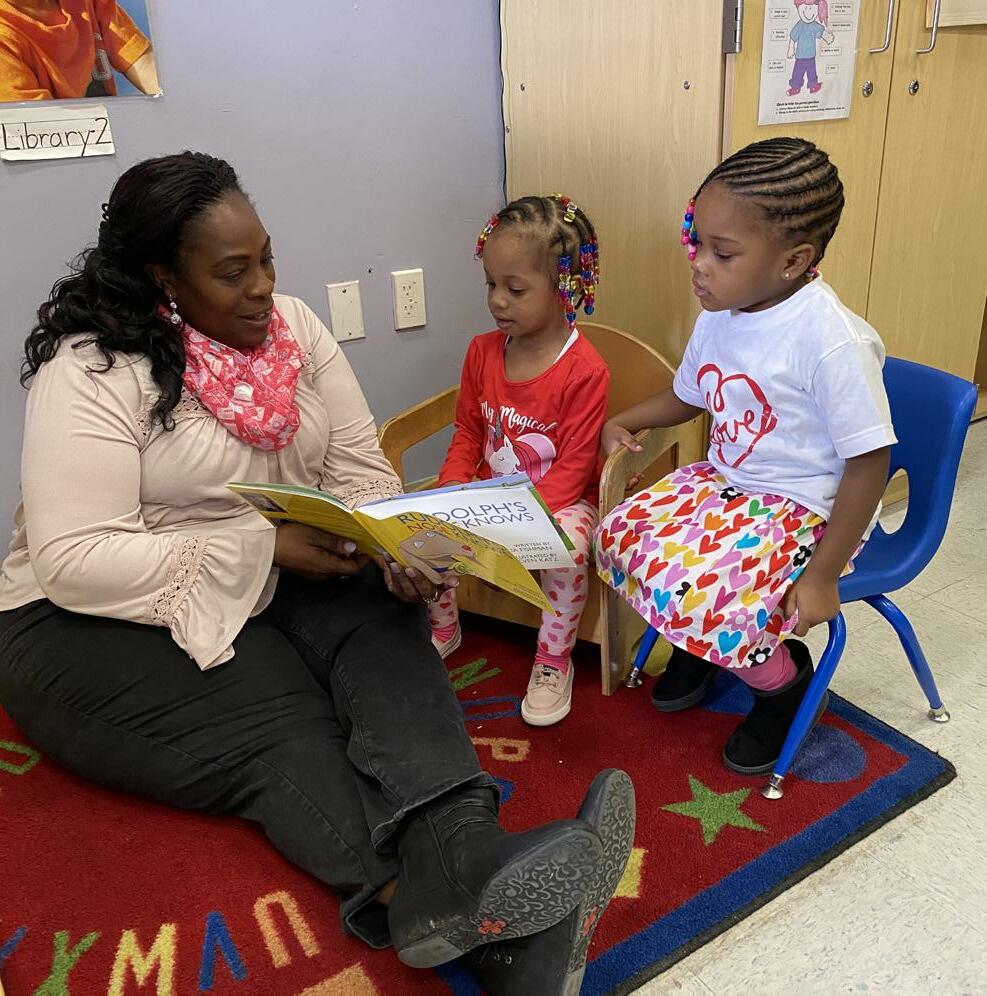
We expand ACCESS to affordable quality preschool for Cincinnati children and families.
=
73%
We BUILD part nerships with Providers to increase high-quality programs.
We CONTRIBUTE to an equitable early childhood community to sustain high-quality programs and results.
Preschoolers ready for kindergarten.
23
of preschoolers who received tuition assistance through the Cincinnati Preschool Promise showed up for kindergarten ready to learn. As measured by the 20212022 Overall Ohio Kindergarten Readiness Assessment Revised (KRA-R).
93%
Community-based Preschools earned 3-stars or more on Ohio’s SUTQ rating system, creating the capacity for 310 preschoolers to access high-quality learning experiences.
62
of parents surveyed would not have been able to afford the full cost of preschool without tuition assistance from Cincinnati Preschool Promise.
New teachers were awarded Teacher Promise Grants from the Cincinnati Preschool Promise encouraging them to continue their careers in early childhood education and reducing the turnover rate at community preschools.
Research shows children who attend high-quality preschool are more likely to enter kindergarten prepared to learn, graduate from high school, and thrive in college and life. According to the National Association for the Education of Young Children, highquality preschools support a child’s physical, social, and emotional development, language literacy, and thinking or cognitive skills1. Strong, early learning experiences can build a strong foundation for the future.
The Cincinnati Preschool Promise expands access to high-quality preschool by removing many families’ financial barriers. The Tuition Assistance program enables us to extend access beyond financial support from other federal, state, local, and private funding sources. That’s because sometimes those funding sources aren’t enough. More than 93% of parents and caregivers report that they would not have been able to afford preschool or only some of the costs of preschool without the Cincinnati Preschool Promise’s financial support.
In the 2021-2022 school year, CPP and CPS provided Tuition Assistance to 922 preschoolers at 135 high-quality preschool sites. This represents an increase in enrollment in the Tuition Assistance Program by 19%, following a year where preschool enrollment dropped nationwide by as much as 25% because of the Pandemic2. The average investment was $7,100 per child. Tuition Assistance was also offered for an Extended Learning Session (ELS) from June to August to maximize the opportunities for classroom instruction and mitigate Covid-19–related interruptions in learning. In 2022, CPP provided Tuition Assistance for 538 returning preschoolers at 84 community Provider sites during the Extended Learning Session.
Since 2017, when the Tuition Assistance program began, more than 7,955 preschool students were provided access to a high-quality preschool education.
Families can apply for Tuition Assistance anytime and are encouraged to enroll throughout the academic year from August to May. The Tuition Assistance program supports families who:
• Have preschoolers aged three or four years old by September 30;
• Live within the CPS district boundaries;
• Live at-or-below 300% of the Federal Poverty Level (FPL), which equates to about $79,500 for a family of four.


Community Providers eligible to participate in the CPP Tuition Assistance program are Family Child Care, single and multi-center sites, and Parochial Schools within the CPS district. Each Provider must have achieved a quality rating of 3, 4, or 5 stars in Ohio’s Step Up to Quality (SUTQ) system, earning them a CPP designation as “highquality.” As members of the CPP network and an essential part of delivering quality early childhood education, Tuition Assistance Providers commit to:
• Comply with CPP’s Equity Policy;
• Adopt a spirit of transparency in reporting outcomes and data-sharing;
• Participate in an annual external evaluation;
• Attend provider briefings; and
• Adhere to all CPP policies and procedures beyond the already-stringent requirements of licensure and the SUTQ system.
Our Tuition Assistance program also helps Community Providers maintain or increase their high-quality ratings and maximize access to high-quality preschool by filling their classrooms. CPP’s Year 5 Evaluation Report shows that providers designated as high-quality and participating in Tuition Assistance can better provide higher wages, benefits, and more for the early childhood educators they employ.
The Ohio Kindergarten Readiness Assessment Revised (KRA-R) is used to measure school readiness based on Ohio’s Early Learning and Development Standards.
TA participants were more frequently Approaching or Demonstrating readiness on the overall KRA-R compared to Non-CPP kindergarteners by 13.9 percentage points among Black/African American kindergarteners, 16.9 percentage points among Hispanic kindergarteners, and 16.6 percentage points among Multi-Racial/Other kindergarteners.”
After a hiatus last year because of Covid-19, the KRA-R was administered to first time kindergarteners this year. On the overall KRA-R, Kindergarteners who received tuition assistance (TA) from CPP as preschoolers were more frequently Approaching or Demonstrating readiness at 73% compared to Non-CPP Participants at 63.4%. An analysis (or summary) of KRA-R performance on language and literacy, math, and overall kindergarten readiness can be found in the Cincinnati Preschool Promise’s Year 5 Evaluation.
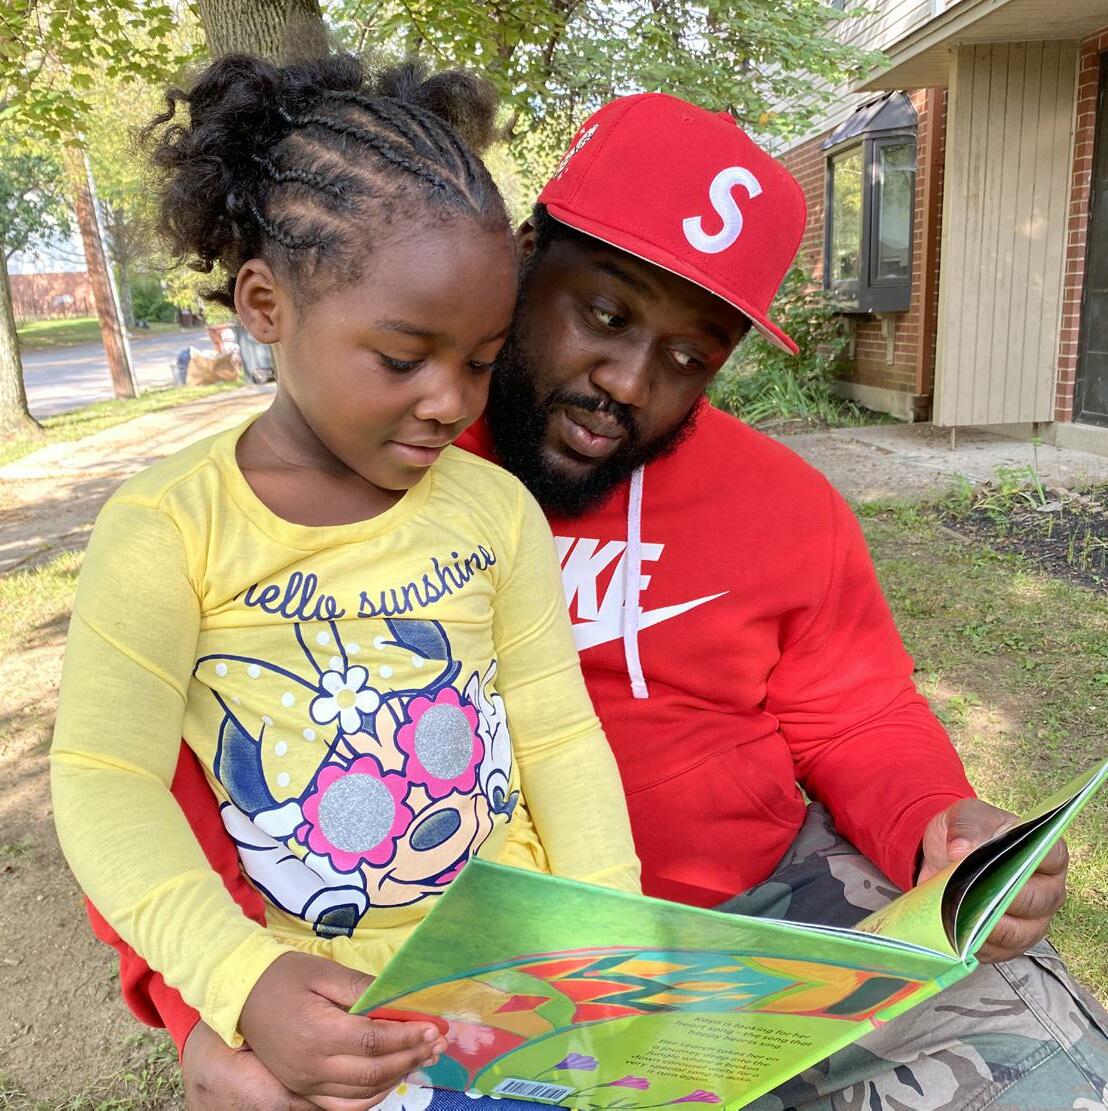
Deontre Davis is a millennial father who realizes the importance of preschool for his children. As a former preschooler, Deontre grew up next door to his preschool provider, Robyn Perkins, in Winton Terrace. He credits her with making learning fun and wants his daughter, Deonna, to have a similar experience. Deonna is a bright four-year-old who loves reading and writing assignments. When asked why she likes preschool, Deonna says she wants to go to school every day so she can learn with her friends. Deontre knows his daughter is in good hands because he trusts Ms. Robyn and knows she will give Deonna a high-quality education.
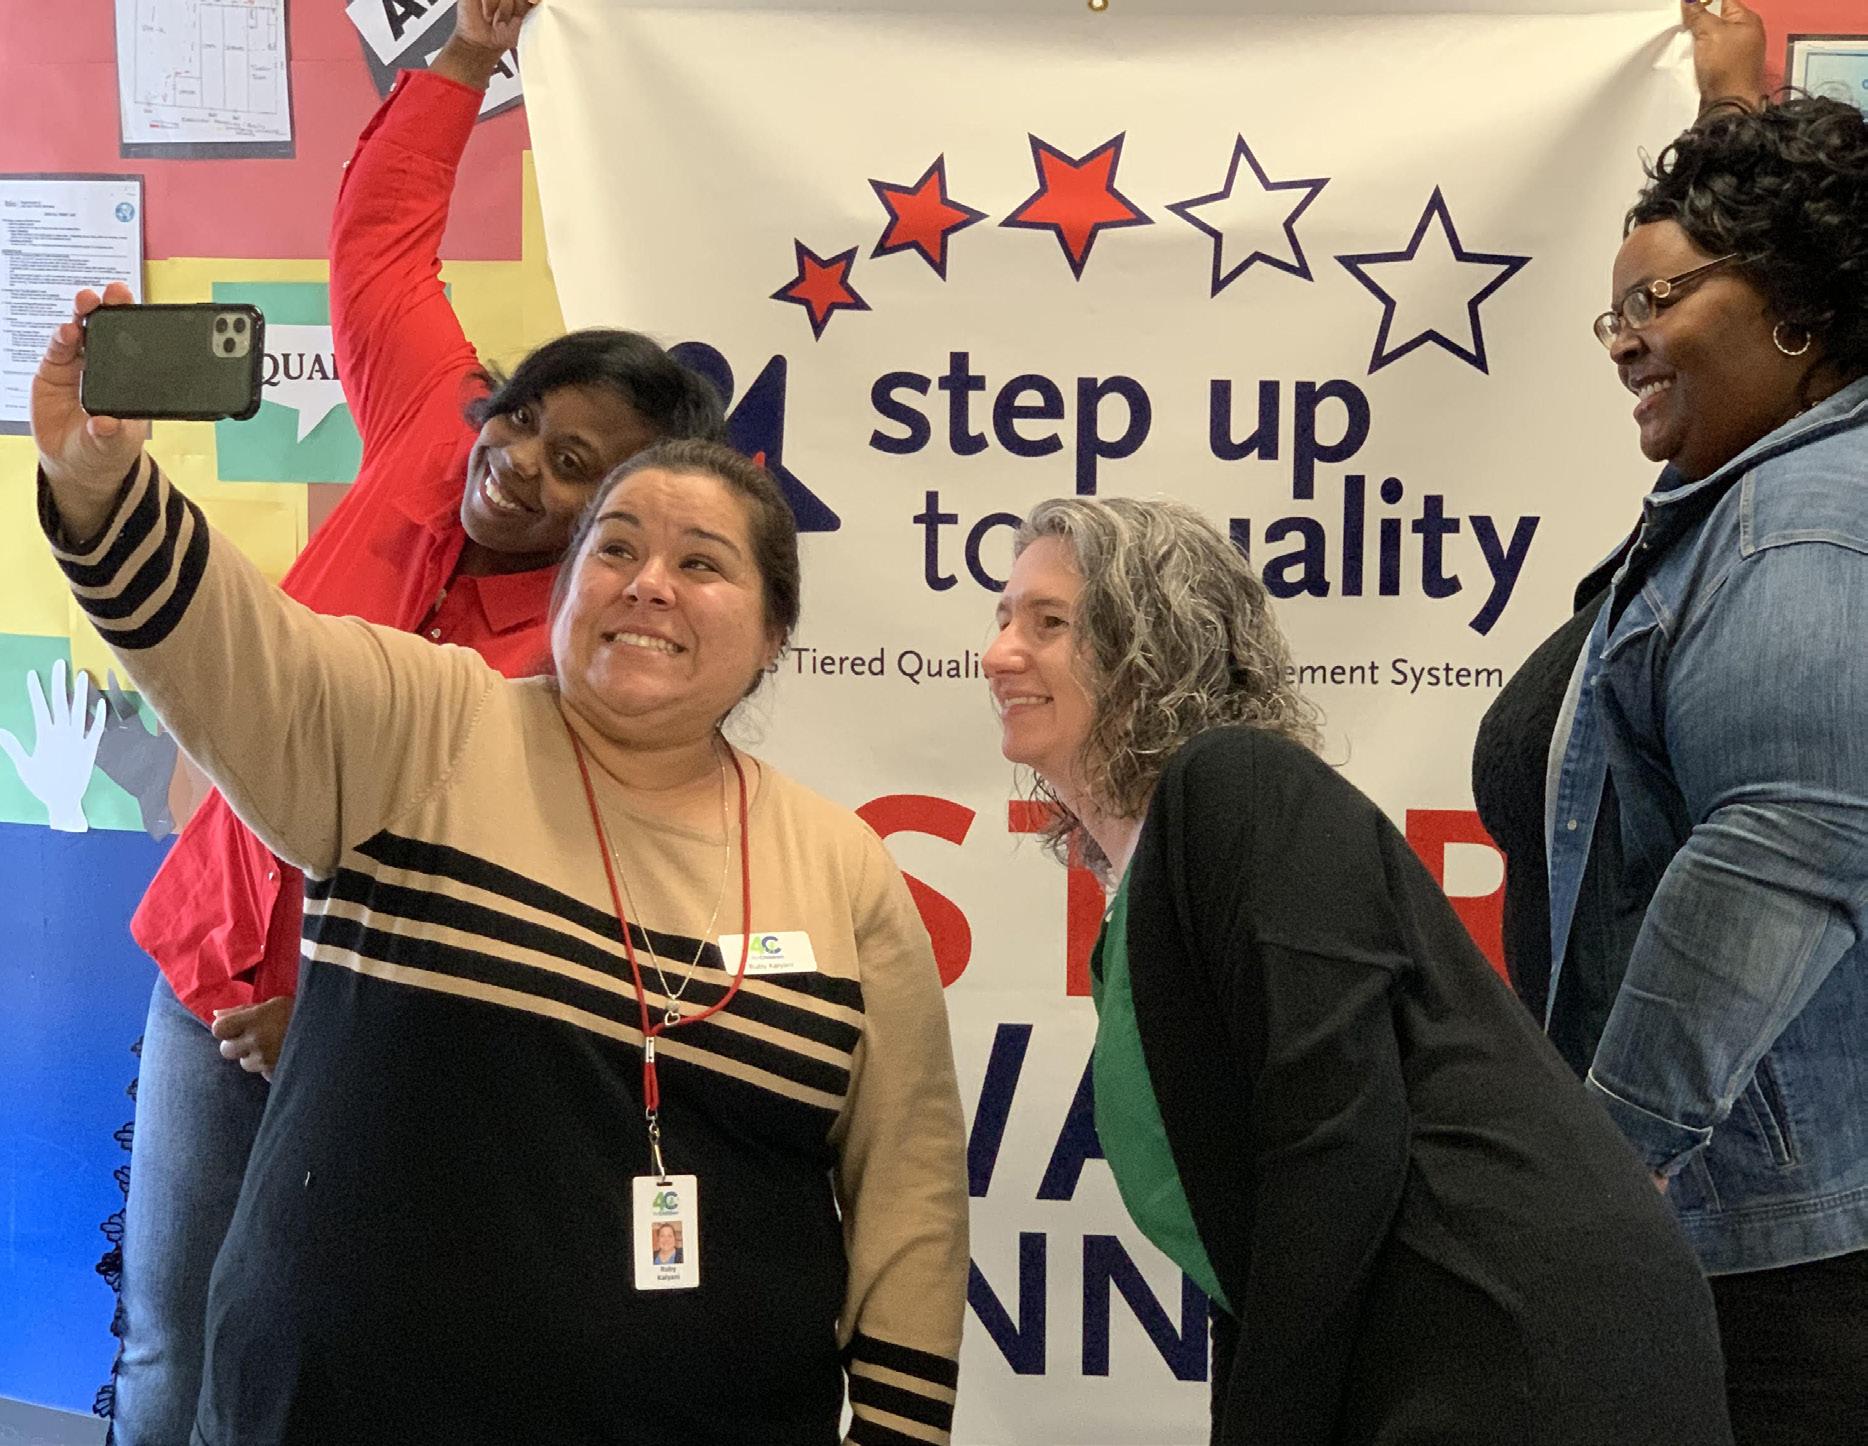
Quality Improvement (QI) initiatives support
Community Providers working to reach three or more stars on Ohio’s Step Up to Quality (SUTQ) five-star rating system. SUTQ recognizes and promotes research-based learning and development programs that exceed licensing, health, and safety regulations, leading to improved outcomes for children.
Providers seeking a high-quality rating of 3 or more stars are eligible to receive:
Coaching
Curriculum and assessment tools
Developmentally appropriate materials
Professional Development sessions
Providers are investing in building quality daily, but it can take significant time to gain or increase a quality rating. That’s why our QI program is essential to ensure the accessibility and availability of high-quality preschool seats. It helps more providers reach high-quality faster, extend Tuition Assistance to more families, and expose more students to the benefits of a quality preschool education.
The Cincinnati Preschool Promise shared the impact of our Quality Improvement initiatives with Ohio’s Publicly Funded Child Care and Step Up to Quality Study Committee. Quality is a priority for parents when selecting a preschool. High-quality preschool sites are better able to provide equitable wages for staff and retain teachers. Financial support and resources have significantly increased the number of quality seats in neighborhoods to meet the needs of families and children better. CPP’s outcomes affirm strategic investments in quality
to make preschool affordable and accessible.
American Legacy Theatre
Beech Acres Parenting Center
Children’s Funding Project Cincinnati Recreation Commission Cincinnati State Technical & Community College Dress for Success
Ellequate GreenLight Fund Cincinnati Groundwork Ohio
Hamilton County Job and Family Services Human Services Chamber of Hamilton County KDDK Legacy Group

Leadership Council for Nonprofits Linton Chamber Music Mayo Home for Youth Development Project LIFT
Refined Vision Media Santa Maria Cincinnati
Southwest Ohio Association for the Education of Young Children
The Literacy Lab Union Institute and University United Way of Greater Cincinnati University of Cincinnati- Advancement and Transition Services Urban League of Greater Southwestern Ohio The Voice of Your Customer


Women’s Fund of the Greater Cincinnati Foundation YWCA of Greater Cincinnati


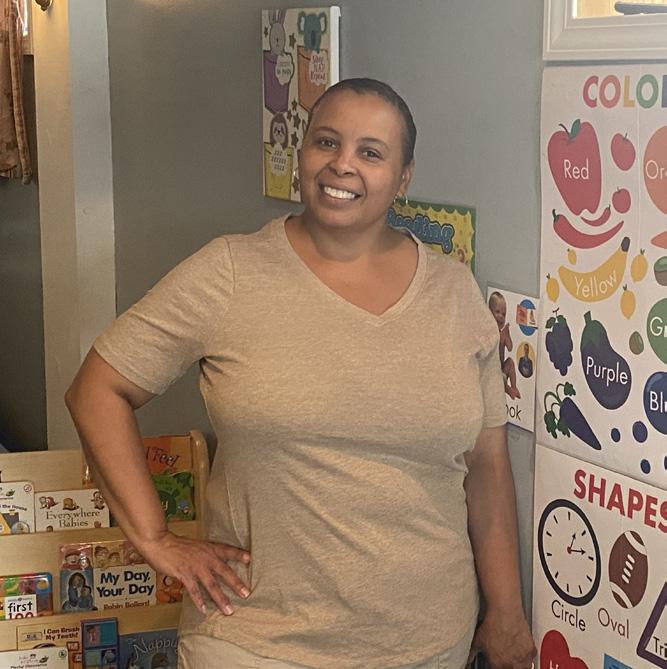
Robyn Perkins, 25 years as a Family Child Care Provider. Southwest Ohio Association for the Education of Young Children; 2021 Family Childcare Provider of the Year.
Sherry Johnson, 26 years as a Family Child Care Provider. Serving special needs preschoolers.

A skilled and committed early childhood education workforce must have a high-quality preschool. Recruitment, retention, and wage parity for preschool teachers have been an ongoing challenge that has reached a crisis level during the COVID-19 pandemic. The complexities and costs associated with establishing wage equity are growing. Earning a minimum base pay of $15 per hour is not enough to achieve and sustain excellence in preschool education. That’s why helping community-based Providers and lead teachers cover the costs that can make or break efforts to gain and maintain a high-quality program is a priority for CPP. We help supplement the costs of quality through two wage pilot programs: the Teacher Promise Grant (TPG) and the Staff Support Fund.
Our Teacher Promise Grant supports and contributes to the retention of lead teachers at 3, 4, and 5- star community-based preschools participating in the Tuition Assistance program. Eligible lead teachers receive direct payments of up to $4,000 in TPG funding in a given year. As a condition of the award, recipients must remain teaching in a community preschool and continue their professional development. The grant money can be used in any way needed, and many teachers report using the funds for continuing education and family expenses. In the 2021-2022 program year, 62 Lead Teachers at 36 preschools received Teacher Promise Grants.
The need for the Staff Support Fund expanded to help unrated, 1, and 2-star preschools retain staff as they pursue a high-quality rating by participating in our Quality Improvement program (QI). Through the SSF, Preschools can access $3,000 per lead teaching position in their center or family child care program to support preschool teachers. Funds must be used to: offer retention, recruitment, or advancement bonuses; offset costs for health insurance or other benefits; supplement teachers’ wages; or paying for formal education in a degree-granting program in early childhood education.
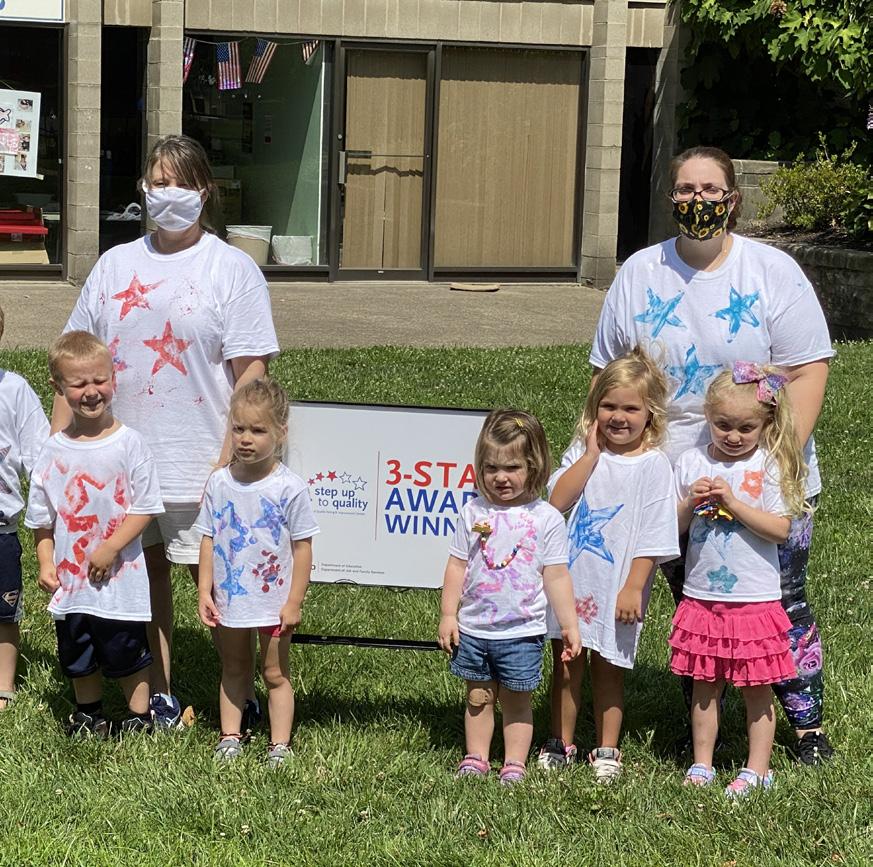
Nationwide, advancements in expanding the accessibility and affordability of the early learning ecosystem are at risk because it is challenging to recruit and retain qualified teachers. We have seen drastic reductions in the number of preschool classrooms and the preschool class size. To address these challenges, CPP has prioritized new initiatives and collaborative strategies to sustain equitable access to high-quality preschools, including the following:
• Cost of Quality Committee Meetings bringing together CPP’s Board Members, Early Childhood Education leaders, teachers, workforce specialists, and educational entities to brainstorm short-term and long-term solutions and effective practices
• Supporting 4C for Children’s Career Navigator motivates and helps people become early childhood educators
of teachers receiving TPG said the grant impacted
staying with their employer. (as reported in CPP’s Year 5 Evaluation by INNOVATIONS)
• Partnering with the Early Childhood Education program at Cincinnati State Technical and Community College to offer Teacher Completion Grants to students working in community preschools in the CPP network
• Joining The Literacy Lab to launch
Leading Men Fellowship (LMF) in Cincinnati. LMF empowers and equips young men of color, ages 18-24, with opportunities in the field of education by serving as a Pre-K literacy tutor to help close the literacy gap within underserved and marginalized communities
•Sponsoring 1-year memberships in the Southwest Ohio Association for the Education of Young Children (SWOAEYC). Through conferences, workshops, meetings, publications, community education, research, and cooperation with related organizations, SWOAEYC works for better programs and services for young children as the regional affiliate of the National Association for the Education of Young Children.

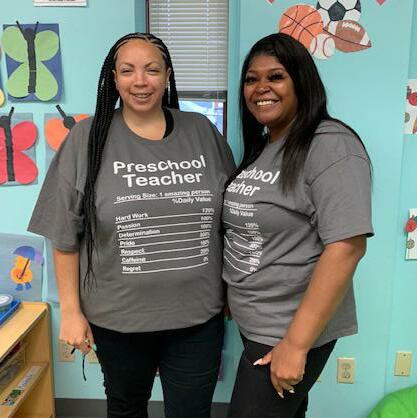
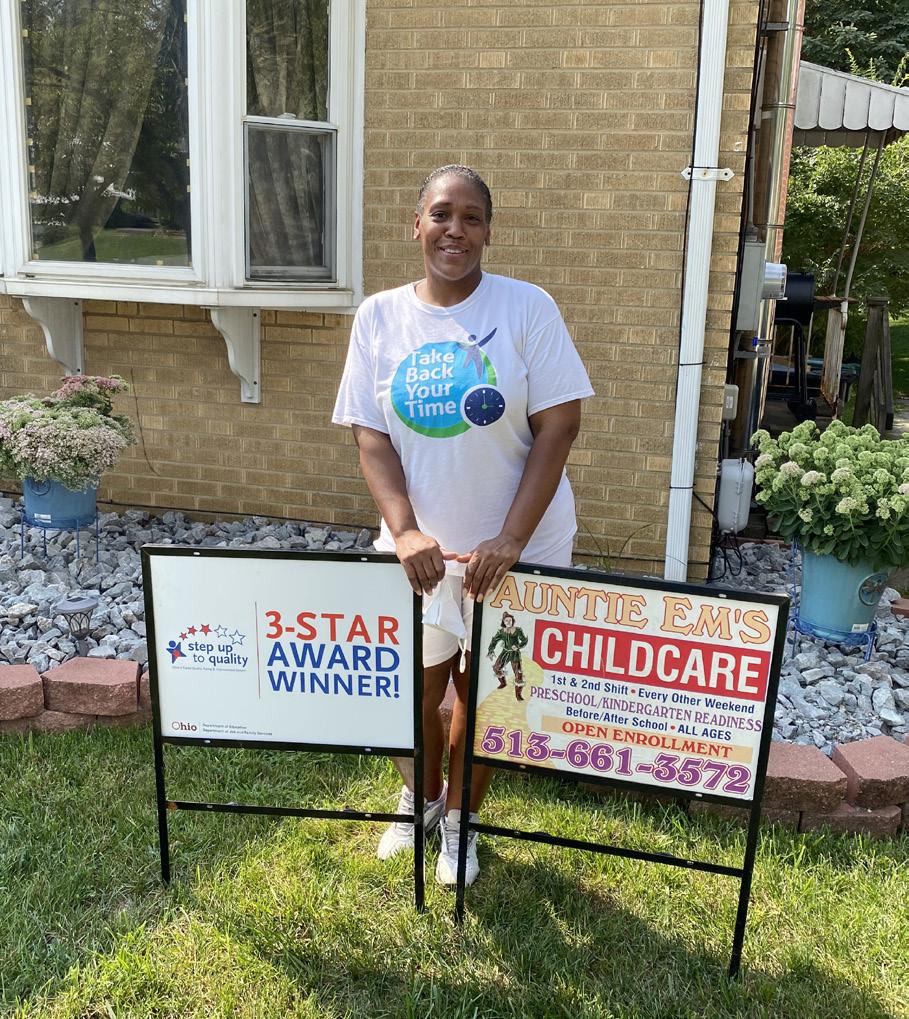
When Steven and Vanessa King opened Where The Sidewalk Ends Academy five years ago, their goal was to start building a family legacy in early childhood education. Vanessa took her experience in banking and her husband’s 12 years as a Teacher’s Assistant at North Avondale Montessori to launch their business. It is a natural outgrowth of their combined interests and addresses the preschool needs of both their family and community.
The King’s passion for impacting the youth in their community and significantly improving the skills of young African American preschoolers is evident in everything they do. For example, they fully embrace nearby resources like a playground and zoo as part of their out-of-classroom learning.
Mimi Singleton, Lead Teacher, and Vanessa King, Administrator, Where The Sidewalk Ends

Vanessa’s mother, Mimi Singleton, is also a family business member as a Lead Teacher and a proud Cincinnati Preschool Promise Teacher Promise Grant recipient. Previously, she worked as a social worker in foster care at Hamilton County Jobs & Family Services. Mimi knows the importance of social-emotional support in helping children that may be in traumatic situations. She uses her grant to reinvest in the preschool by offering innovative programming that exposes children to new educational experiences.
The Kings eventually want to open a center that will hold 120 children, their magic number for future growth. In addition, they are focused on expanding their preschool to embrace more children in the Avondale community.
Cincinnati Preschool Promise’s support has enabled Where The Sidewalk Ends to become a successful, multi-generational small business. They are keeping the promises of equitable wages for teachers and preparing children for kindergarten by providing a high-quality preschool experience.
Community Preschool Providers start the day with a virtual coffee and connect with their peers. Then, an energetic group of Community Preschool Providers use, this time to discuss emerging issues in early childhood education, network in a Provider-only space, and share effective practices with members of the CPP network. No topic is off-limits in these sessions, from family engagement tips to new digital tools to support learning.
The Character Effect CPP has partnered with Beech Acres Parenting Center to bring The Character EffectTM to the CPP network of community preschools. The Character EffectTM, an evidenced-based, social & emotional learning program, improves the well-being of teachers and students alike. It starts with reminding teachers of their ‘why,’ helping them identify their character strengths, and focusing on self-care. All program components are customized to meet the needs of Providers identified through individual surveys, focus groups, and annual evaluation recommendations.
This collaboration between CPP, the African American Chamber, and its members gives young learners a ‘smart start’ by providing educational materials for students to use outside their preschool classrooms. Recognizing that every environment presents an opportunity for learning, preschool teachers and parents requested the resources to support that
learning outside the classroom. The generous contributions of U.S. Union Savings and Guardians Savings Bank provided 1,000 backpacks filled with supplies for CPP preschoolers at our first Back-to- Preschool Jam.
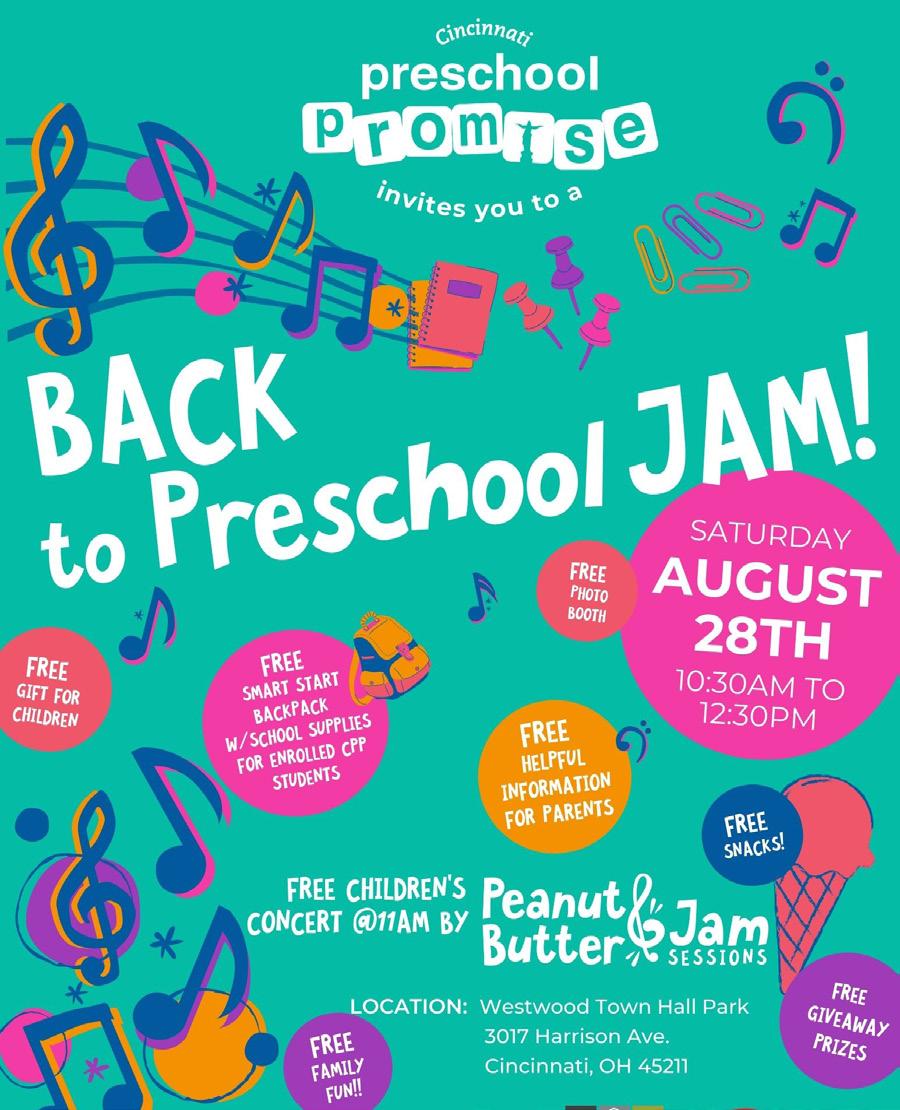
Musical Journeys with Peanut Butter & Jam
As the inaugural winner of Cincinnati Promise’s Pitch Night, Linton Chamber Music’s Peanut Butter & Jam Sessions offers invaluable early childhood music education to CPP children through this innovative community partnership. Preschool students in different CPP provider classrooms receive weekly early childhood music instruction as part of the PB&J Musical Journeys newly piloted program to enhance and strengthen learning to increase kindergarten readiness.
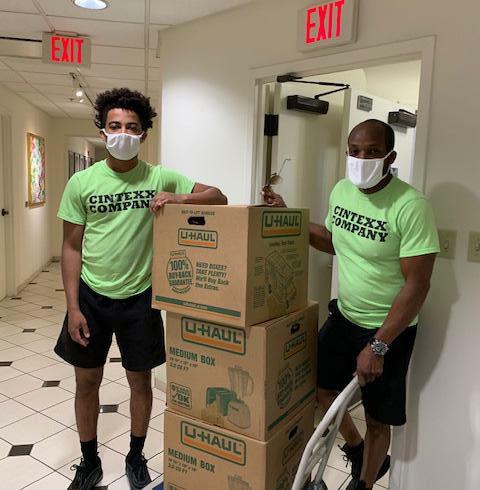
With the generous support of the Black Giving Circle at The Greater Cincinnati Foundation, CPP launched a businessfocused workshop series for Family Child Care programs. Providers received personalized instruction from a team of certified business advisors to create business plans and access resources to help sustain and grow their early childhood education business.
The Council convenes community preschool Providers who have a direct voice in influencing CPP decisions and priorities by lending their expertise to drive CPP’s mission. Council Members include representatives from family child care, single, and multi-site programs who are thought leaders in early childhood education. Recommendations from the Council are incorporated into CPP’s annual work plan and strategic goals.
CPP’s competitive submission process for individuals, nonprofits, and businesses to pitch creative ideas that bring new initiatives to CPP focused on innovation in early childhood education. Any concept, strategy, or partnership that supports CPP’s mission of ensuring equitable access to high- quality preschools is welcome. Linton Chamber Music’s Peanut Butter & Jam Sessions won the first Pitch Night and brought music education to CPP classrooms in the 2021-2022 school year. The Children’s Home’s Kindergarten-Supporting Partnerships to Assure Ready Kids (K-SPARK) initiative is the second Pitch Night winner in March 2022. K-SPARK is an evidence-based home visitation program that promotes early literacy and learning for preschool children.
For the last two years, the Pandemic has required the Cincinnati Preschool Promise to creatively look for opportunities for innovation and improvement to drive our mission and keep the promise of equitable access to high-quality preschool. Emerging concerns include:
· the social, emotional, and behavioral health needs of preschoolers, · the increased costs to operate a preschool, and · the changing landscape of measuring educational outcomes. If the Pandemic taught us anything, it is the strength of perseverance and the value of resilience. Families have overcome numerous challenges to ensure their children are enrolled and regularly attending preschool. In addition, community Providers prioritized health and safety in maintaining high-quality learning spaces for our preschoolers. It has been a challenging time, yet the focus remains on meeting the needs of the families and children in the community.
The Cincinnati Preschool Promise defines equity as a shared community responsibility for addressing the opportunity gaps that exist within our society and impact our students’ ability to reach their full potential. In the pursuit of our mission to expand access to high-quality preschool, we take strides to counteract the contemporary and historical impact of bias, prejudice, and discrimination” that have led—and continue to lead—to these gaps in opportunity and outcome.
We focus on equity in three areas:
1. Representational equity as the proportional participation in Cincinnati Preschool Promise’s programs;

2. Resource equity as the distribution of Cincinnati Preschool Promise resources in order to close equity gaps; and
3. Equity-mindedness as the demonstration of an awareness of and willingness to address equity equity issues among Cincinnati Preschool Promise leaders and staff.
Our Board of Managers and staff commit to driving equity in our organization, initiatives, and the diverse community we serve. Equity is advanced by taking the following steps in our internal structures, spending, policies, and procedures, and as we design and implement programming to meet our goals:
• Allocating the organization’s financial, material, and human capital equitably
• Eliminating, wherever possible, policies and practices that perpetuate these inequities
• Ensuring that new CPP initiatives, policies, or procedures do not create inequities;
• Identifying, developing, and applying policies and practices that have demonstrably made a positive difference for teachers and Providers from historically disadvantaged backgrounds
• Support building relationships among Providers, in order to break down historic barriers and uplift the sector.
C
24 Hour Child Care From The Heart
3T Learning Academy LLC 11
A Mother’s Love 24HR Childcare
ABC DayCare
Above and Beyond Early Learners Academy
Alouette Learning Center
Alphabet Junction, Inc
Angela F. Lyshe-Thierry
Angela Kirkland
Anitra Latham
Beautiful Beginnings Childcare
Bee Brilliant Childcare
Best Early Development Center LLC
Bethel Christian Academy, Inc.
Big Adventures Learning Center Corp
Bobren’s Tiny Tots Co.
Busy Bee Toddler Care and Learning Center
C.A.R.E Home Childcare
CAA - Discovering Minds Learning Center
CAA - Life Learning Center
CAA - Millvale
CAA - Ted Berry
Calvary Kids Learning Carmelia Montgomery
Carmen Riddle
Carolyn Franklin Chalies Howard Champion Childcare
Cherish Your Children Childcare
Children of Hope Learning Center
Childrens World LLC
Childtime Children’s Center
Cincinnati Scholar House Child Development Center
Color Us Blended Family Childcare
Corban Learning Center
Corrinda Ibrahim
Corryville Catholic
CoStars Early Education Center
Westwood
Cozy Care Nursery School & Childcare
Creative Environment For Youths LLC
Creative Imaginations Childcare LLC
CWFF Child Development Center
Cynthia Kahr
Daddy’s Daycare - Linn Street
Daddy’s Daycare CDC Millvale Court
Darlene Hill
Denise Thompson Destiny Childcare and Development Center
Divine Daycare Center Inc.
Donna Davis
Dornetta Williams
Ebony’s Learning Center, LLC
Elite Early Learning Center
Empower Learn Create, Inc.
Erica Parks Essential Learning Academy
Exploring Excellence Learning Center Corp
Faith Love Hope Childcare
Frances Moore
Funsize Imagination Childcare LLC Generation Hope Childcare and Preschool
Gingerbread House Childcare LLC
God’s Little Angels Learning Center Golden Rule Daycare LLC
Gray’s Creative Learning Daycare
Happy Hearts & Bright Minds Child Care Center
Holy Family School
IBC
Imaginations at Work
Immanuel Child Development Center
In God’s Hands Christian Youth Center
Inspired Kids Learning Center LLC
InVision Child Care
Jacqueline Hall-Beckett
Janet Rolley
L
Jasmine Davis
JoeQuita Stephens
Just 4 Kids 2 Learning Center
Just 4 Kidz Academy
Kampusland Inc.
Karen Jones
Karla’s Kiddie Kingdom LLC
Katrina’s Family Child Care
Kendra Pugh
Keneice’s Loving Arms Child Care LLC
Kennedy Heights Montessori
Kenyetta L. Hightower
Kiara Jenkins
Kiddy Kare Learning Center
Kids Fun Zone Childcare, LLC
Kids Home Away From Home Childcare
Kids Play 513 LLC
Kila’s Angels Learning Academy
Kimberly Cubit Kimberly Lowe Kimberly Satcher
LaLa’s Lil One’s Learn & Play
LaRoy Holloway
Latoya Dixon
Latoya’s Daycare LLC
Learning Grove - CityLink
Learning Grove - East Walnut Hills
Learning Grove - Future Environments
Learning Grove - Price Hill
Learning Grove - Schiff I
Learning Grove - William Mallory Early Learning Center
Learning Grove - YWCA
Leonna Larkins
Little Dreamers Childcare
Little Footprints Learning Center
Little Kings and Queens Learning Center LLC
Little Promises (Operated by Cincinnati Urban Promise)
Little Steps Daycare Center LLC
Little Treasures Under Ms Chris’ Care
M
Loving Kindness Education & Learning Center
Lynn Burnam
Maimouna Ba
Mame’s Daycare
Maria Bradley
Marshette Riggs-Smith
Mary’s Little Lambs Learning Center
Mini Miracles Learning Center
Monica Thomas Monica Watts
Morgan Phillips
Ms. Kay’s All Star Childcare
Mt. Washington Baptist Day Care & Preschool
Mylestones Early Learning Nannas House
Nanny’s Multi Level Learning Centers, INC.
Nature w/ Nurture Preschool & Day School, LLC New Horizons Next Generation Early Learning Center
Nicole Burns
North Bend Learning Center Nurse Julie’s Daycare
Pamela Boykins
Pamela Elliott Patricia Blanchard Patricia Russell
Peggy Glasper
Peggy’s Precious Angels Pleasant Ridge Presbyterian Preschool
Rabiah Shakir
Rainbow Room Preschool Learning Center
Ready Set Learning Center
Red Brick Childcare LLC
Regina Buchannon Robyn Perkins
Romero Academy at Resurrection
Family Services, LLC
Rose Martin
Saint William School
Samantha Jackson
Shannon Browner
Sharhonda Johnson
Sheila Solomon
Sheree Williams
Sherry Johnson
Shining Stars Learning Center of Cincinnati
Shree Little Dreamers
Simpy’s Playhouse and Learning Center
Sister/Sister Childcare
Sky’s The Limit Learning Center
Small Kids Adventures Learning Center LLC
Sonya Woods
St. Cecilia School
St. Francis de Sales School
St. James Child Development Center
St. Joseph
St. Lawrence Preschool
Stacey Gibson
Susan Lemons
Teefah’s Learning Center
Tender Tots Daycare
The BeeHive Child Care
The Children’s Home
The Learning Playhouse
The Little Daisy House
The Little Tree House of Knowledge
The Miracle Seeds
The Salvation Army Learning Center
The Tot Spot at Seymour
These Precious Hands Child Development Center
Tiny Steps Development Center Inc
Tonja Rowe
Tonya Harris
Tonya Moore
TOTally Kids Learning Center
Tracy Savage
UC - Arlitt
Venessa Brogden
Venetta Hazel
Vicky’s Tender Heart Childcare
Vonda Cathey
Water Lily Learning Center, LLC
Waverly’s Hope Child Care LLC Wesley Education Center
Westwood United Methodist Church
Where The Sidewalk Ends Academy
YMCA - Christ Child
YMCA - Gamble Nippert
YMCA - Valley Yolanda Champion
Yolanda’s Day Care Young Scholars Academy
Your Learning Treehouse LLC
Youthland Academy of Beekman Youthland Academy of Cheviot Youthland Academy of Pleasant Ridge
Youthland Academy of Price Hill Yvonne Steele
Zion Temple Christian Academy
 Tanya Del Valle Senior Administrative Assistant
Brittnii Pina Quality Improvement Manager

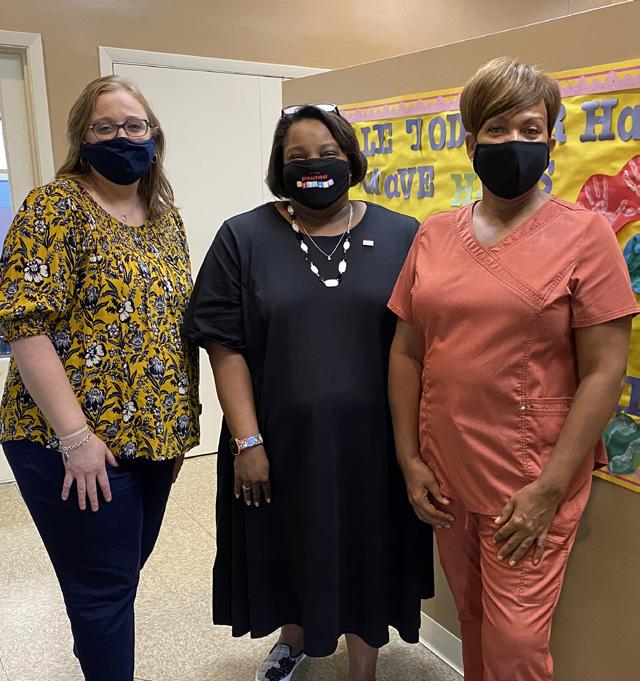

 Sydney Gardner Outreach Specialist


 Jacob Staley Outreach Specialist



The mission of Cincinnati Preschool Promise (CPP) is for families to have equitable access to high quality preschools so that every Cincinnati child is prepared for kindergarten. CPP combines private and public preschool settings within the Cincinnati Public School (CPS) district boundary This evaluation includes data from private preschool Providers and CPS about preschool progress, kindergarten readiness, teacher supports, quality improvement, and stakeholder experiences to examine the effectiveness of CPP programs, operations, and impact on the community.
• Launched the Peanut Butter & Jam music program pilot in 6 preschools for which the evaluation showed the program impacted preschool progress and whole child readiness
• Continued to offer resources to ensure that Providers are informed and supported to retain quality staff and maintain high-quality preschools
• Continued to provide and expand SUTQ training opportunities for teachers and Providers which help Providers maintain or advance to a high-quality rating
• INNOVATIONS and CPP established a working relationship with the Institute for Policy Research (IPR) and Ohio Department of Job and Family Services (ODJFS) to obtain data (count of children by Federal Poverty Level, count of children receiving/eligible for Publicly Funded Child Care, copayments, preschool seat capacity) to more precisely measure CPP’s reach, access, and opportunities in quality gap neighborhoods which will be integrated into the Year 6 evaluation
The Kindergarten Readiness Assessment Revised (KRA R) was used to evaluate the impact of CPP TA participation on kindergarten readiness against Non CPP participants (hereafter Non CPP kindergarteners)
Overview of the 2021-22 Kindergarten Readiness Assessment Revised Performance
CPP TA participants (CPP community and CPS preschool) outperformed Non CPP kindergarteners, where 73.0% of CPP TA participants (N = 582) were Approaching or Demonstrating readiness on the overall KRA-R in 2021-22 compared to 63.4% of Non CPP kindergarteners (N = 1,982). Language and Literacy subtest results revealed that the percentage of CPP TA participants On Track for literacy by the third grade was 45.4% compared to 41.4% of Non CPP kindergartners.
Social Foundations subtest results showed that CPP TA participants scored 2.3 points higher than Non-CPP kindergarteners and average CPP TA participant scores were 272.0 points compared to 269.8 points for Non CPP kindergarteners.
Overall KRA R Performance Levels by
TA Participation
Percentage On Track in Language and Literacy by CPP TA Participation (2021-22)
TA Participants (N=582)
Kindergartners
TA Participants (N=582)
TA participation benefits
socioeconomic status
Non-CPP Kindergartners (N=1,982)
white kindergarteners to
extent
white
a higher concentration of families
Participants with a lower SES status
defined
the Kindergarten Readiness section
Overall KRA-R Performance Levels by Race, SES, and CPP TA Participation
TA participation was a statistically significant
of KRA R performance in 2021 22 when controlling for gender, race, and SES. CPP TA participation increased the odds of Demonstrating readiness by 38.8% and increased the odds of being On Track for Language and Literacy by 41.9% when statistically controlling for the other predictors.
For the second year, the evaluation incorporated the Teaching Strategies GOLD ® (TS GOLD®) 1 preschool progress measure to understand the impact of high quality preschool on CPP preschoolers receiving TA (CPP community and CPS preschool). Preschoolers (N = 355) from participating CPP preschools showed universal improvement across all TS GOLD® domains from the fall 2020 (pre-assessment) to s pring 2021 (post-assessment).
GOLD®
A total of 907 preschoolers enrolled and received CPP TA in 2021 22, a 19.3% increase from 2020 21. Enrollment experienced setbacks due to COVID 19 during the 2019 20 and 2020 21 school years but has recovered in 2021 22. The average monthly TA reimbursement per preschooler was $600 in 2021 22.
of Preschoolers Enrolled in CPP TA Preschools
CPP Providers who are 3, 4, or 5 star rated by Ohio’s Step Up To Quality (SUTQ) quality rating system are approved to receive TA reimbursements from CPP for eligible preschoolers enrolled in their programs. The number of CPP Providers that have been approved to receive TA reimbursements has increased each year of the program. In 2021 22, there were 139 TA Providers in the CPP network, a net increase of 25 high quality Providers and 80 high quality preschooler seats added since 2020 21. The 76 TA Providers in quality gap areas represent 1,037 high quality seats, an increase of 75 high quality seats since last year. Quality gap areas are defined as areas where the number of preschool aged children exceeds the available high quality seats by 100 seats or more.
Quality Improvement (QI) Providers are unrated or have a 1 or 2 SUTQ star rating. Through CPP, QI Providers receive tangible support and coaching to improve quality. CPP QI Providers can be converted to a TA Provider upon earning a 3-, 4-, or 5-star SUTQ rating. In 2021-22, 23 Providers converted from QI preschools to TA preschools. To date, 91 QI Providers have converted to TA preschools, increasing the number of high-quality preschool seats in the CPP network.
Program Year # of Providers # in Quality Gap Neighborhoods Providers Added # of Providers # in Quality Gap Neighborhoods
2017 18 40 16 26 13
# Converted to TA1
2018 19 57 26 17 106 53 10
2019 20 83 42 26 135 60 25
2020 21 114 63 31 119 45 33
2021 22 139 76 25 87 33 23
Note. Data retrieval date and selection process may lead to variation of totals reported by INNOVATIONS and CPP. 1Total number includes QI Providers that were active within the same fiscal year in which they converted to TA and inactive QI Providers that returned to the network as a TA approved Provider.
CPP supported teachers and Providers through two wage initiatives: Teacher Promise Grants (TPG) and Staff Support Fund (SSF). CPP provides TPG up to $4,000 directly to individual teachers. CPP awards SSF to preschools, with the amount determined by the number of staff. These programs aim to increase recruitment, retention, and supplement wages. To date, 190 lead preschool teachers at 89 TA preschools and 95 staff positions at 46 QI preschools have been supported through these wage initiatives. Of the 86 lead preschool teachers receiving TPG in 2021 22, 82 recipients completed 12 months of service – a retention rate of 95.3%
Peanut Butter and Jam Pilot Preschoolers who attended the PB&J music program pilot showed improvement in observed behavior across 10 domains of measurement according to 95% of Providers and teachers who provided feedback. In addition, preschoolers attending PB&J made improvements from fall to spring in five domains measured by the preschool assessment, TS GOLD®.
During the months of June August 2021, CPP offered an Extended Learning Session (ELS) for preschoolers who were enrolled and active at a CPP TA Provider during the 2020 21 academic year. The ELS was continued to help close learning gaps that resulted from disruptions of the COVID 19 pandemic and to support preschoolers’ education in preparation for kindergarten A total of 487 preschoolers enrolled in the ELS in the summer of 2021
(academic year 2020 21), a 35% increase from the prior year. The ELS has been beneficial to preschoolers living in SES 1 (higher poverty) neighborhoods as indicated by their stronger academic performance in kindergarten (KRA R, Acadience Reading) compared to similar peers who did not participate in the ELS. The ELS was offered again in 2022 and 538 preschoolers enrolled. The Year 6 Evaluation will report updates on ELS participation in 2022.
Parent Perspectives on Preschool Tuition Assistance Allows Families to Access and Afford High-Quality Preschool: Of parent survey respondents, 73.3% could not have afforded the cost of preschool and 20.0% could only have afforded some of the cost without TA. “Cost” was also identified as a top barrier to preschool enrollment by parents and Providers.
All of the cost
Most of the cost
Some of the cost
None of the cost
Parents Value Quality Preschool and Well Trained Teachers: All (100%) TA and QI parents surveyed reported that a quality early educational experience was “important” or “very important” for their child. Kindergarten preparation, safety, and social skill development have been ranked within the top three aspects of quality preschool since 2020; however, highly educated teachers were more highly ranked as meaningful aspects of quality preschool this year than in the previous two years.
Prospective Providers and Prospective Parents INNOVATIONS engaged prospective parents and Providers, who are parents of preschool aged children and preschool Providers who are not formally connected to CPP but reside within CPP’s service area (CPS District footprint).
Safety and Transparency are Crucial to Prospective Parent Trust in Preschool: Prospective Providers reported a “safe environment” (90.5%) and “trust in the Provider” (85.7%) as the top two reasons families enroll at their preschools. Many (59.0%) prospective parents reported “safety of preschool facilities” as a concern about enrolling their child in preschool. One-on-one meetings with teachers/directors, secure buildings, and safety policies would help increase prospective parent trust in Providers.
Prospective Parent Reported Ways Providers Can Gain Parental Trust in Preschool (N=100)
Meet One-on-One with Teacher/Director
Secure Building
Safety Policies
Classroom Observation
Background Checks
Provider Has Years of Experience
Meet Families Enrolled in the Preschool
43.0%
61.0% 62.0% 62.0% 64.0% 66.0% 69.0%
All (100%) TA and QI parents surveyed in 2022 were “satisfied” or “very satisfied” with their preschoolers’ preschool. Nearly all (86.7%) TA parents reported being highly satisfied with their experience with the CPP “application process”, “tuition assistance”, and “preschool center options”. TA teachers and Providers were “satisfied” or “very satisfied” with “SUTQ support” (84.4%). The highest rated area of satisfaction for QI teachers and Providers was “professional development opportunities” with 88.9% responding “satisfied” or “very satisfied”. The majority of TA (75.8%) and QI (90.0%) teachers and Providers view CPP as a partner.
Recommendations, Next Steps, and Opportunities:
Continued Steps for Cincinnati Preschool Promise
• Continue Initiatives that Positively Impact Preschool Children, Teachers, and Providers (e.g., Tuition Assistance, Teacher Promise Grants, Staff Supports)
• Focus on Expansion and Equity in Quality Gap Neighborhoods
• Define Kindergarten Readiness to Include the Whole Child (e.g., social emotional, physical, cognitive)
• Support Teacher Recruitment and Retention Efforts and Pipeline Development
• Develop Resources for Providers to Recruit Families and Serve the Needs of Children
Additional Considerations for Cincinnati Preschool Promise and Partners
• Consider Expanding Enrichment Opportunities Such as the Peanut Butter and Jam Pilot and Extended Learning Session Program: Many preschoolers who participated in the Peanut Butter and Jam pilot and the Extended Learning Session Program showed improvements and readiness in key domains of learning and development as measured by the TS GOLD® and KRA-R CPP should consider continuing and expanding enrichment opportunities that support whole child development and school readiness.
• Consider an Attendance Initiative Pilot: Early education literature associate regular preschool attendance with improved outcomes for children Local assessment data also support the benefits of children attending preschool regularly (90% of days, 2 years). CPP should consider piloting an attendance initiative to support regular attendance for preschool children Increasing awareness among parents of the benefits of preschool and daily attendance would need to be a critical component of the program to ensure success. This initiative may be timely given COVID 19. The pandemic changed many families’ routines and thereby impacted preschool attendance patterns for many children.
For more information, see the Cincinnati Preschool Promise Program Evaluation Report
Overall impact of CPP on early childhood education Providers, teachers, preschoolers, and families:
• Made high quality preschool affordable for nearly 8,000 preschoolers who received tuition assistance
• Supported 285 teachers’ wages and benefits through Teacher Promise Grants and Staff Support Funds
• Added 99 high-quality Tuition Assistance (TA) Providers to the CPP Provider Network
• Assisted 91 Quality Improvement (QI) Providers with earning a 3, 4, or 5 SUTQ star rating
• Provided the Extended Learning Session from 2020 22 to support year round learning and COVID 19 related learning loss for more than 1,100 preschoolers and their families
• Academic trends show the benefits of investing in high quality preschool. CPP TA participants who live in high risk neighborhoods have shown higher academic performance and kindergarten readiness compared to similar peers not participating in CPP
Parents, teachers, and Providers have been highly satisfied with their CPP experience and support. Parents have reported being “very satisfied” or “satisfied” with their experience with the CPP “application process”, “tuition assistance”, and “preschool center options” since 2020. Teachers’ and Providers’ satisfaction with the supports they have received from CPP has increased over the past three years. Satisfaction with “SUTQ support” increased by 31.4% between 2020 and 2022 while satisfaction with “staff incentives” increased by 24.1% across those years. Providers were also “satisfied” or “very satisfied” with the “staff support” received from CPP which increased by 32.7%. Small qualitative sample sizes may have skewed the results.
Parent Satisfaction
CPP


Additional KRA R Outcomes
Kindergarten
(KRA R) Outcomes by Selected
Demographics of Participants Enrolled in CPP TA Preschools (Prior Years)
QI Providers
to TA Providers
Outcomes by Extended Learning Session (ELS)
Kindergarten
The Cincinnati Preschool Promise (CPP) makes it possible for families to have equitable access to high quality preschool in private settings within the Cincinnati Public Schools (CPS) district boundary.

Our region values preschool as an integral part of a child’s education and as an important support for working families. The community acknowledges that the best outcomes are possible with continuous access to high quality education, beginning with preschool, and ongoing engagement throughout a child’s educational experience. This is especially true for preschoolers with the greatest need. Kindergarten readiness and third grade reading are short term benefits of increased participation in preschool. The longer-term benefits, from middle school through high school, will produce a more qualified workforce and a community in which all residents have an opportunity to thrive.
The mission and vision of Cincinnati Preschool Promise are guided by its Equity Policy, which establishes equitable policies in the areas of workforce development and support, program design, Provider types and locations, and ensuring racial, ethnic, and gender diversity.
The Equity Policy states that:
• Cincinnati Preschool Promise will work to stabilize a skilled and qualified workforce, particularly in those classrooms serving Cincinnati’s most historically disadvantaged preschoolers.

• Efforts to foster a highly skilled preschool teaching workforce will include support for historically disadvantaged teachers.
• Program design will consider impacts on ethnic and racial diversity and maintain or expand it in any way possible.
• Cincinnati Preschool Promise will work with a wide variety of Provider types (in home, parochial, public, and private or non profit centers), that are geographically dispersed and culturally and linguistically relevant to the preschoolers in their care. These needs include, but are not limited to preschoolers:
from non English speaking backgrounds
who have experienced trauma and adverse conditions (ACEs)
with special education needs
residing in quality gap neighborhoods
• Cincinnati Preschool Promise will ensure that its work supports these Providers, and when possible, avoids increasing disparities among Providers of different types. For example, Cincinnati Preschool Promise recognizes that many family childcare Providers are women from underrepresented minority backgrounds (e.g., Black/African American, Hispanic/Latino)
While focusing on the needs of these partners and others with similar backgrounds, it is important to address challenges, inequities, and opportunities in the field, while providing a wide range of preschool options for young children and families in Cincinnati
A goal of Cincinnati Preschool Promise (CPP) is to expand access to high-quality preschool to more preschool age children within the Cincinnati Public Schools boundary. Parents and Providers shared how CPP and preschool has positively impacted their children and families:
• “For our family, it’s allowed us to work full time. Our son has grown so much, he is social, he has so many friends, and can write his name. He’s looking at cameras and practicing photography. I couldn’t provide that enrichment. We could not have afforded and given him that opportunity without CPP. My youngest is a baby and now I know he will be able to go to preschool.” TA Parent
• “[CPP] gives the parent ease, so they don’t have to worry about the money. They can go to a place they can trust.” TA Teacher
• “A lot of children would not have the opportunity to attend preschool without CPP. One example, [a family] needed a longer day program and would not have been able to continue at the program without CPP tuition assistance.” TA Teacher
• “Preschoolers receiving tuition assistance are more likely to attend preschool.” TA Provider
• “Many families like having multiple preschool options that may better fit their needs.” – TA Provider

Cincinnati Preschool Promise (CPP) provides opportunities for preschoolers to benefit from local preschool programs through Tuition Assistance (TA) and Quality Improvement (QI) programs CPP makes it possible for preschoolers to have equitable access to high quality preschool1 by providing supports, such as TA funding, to families. CPP also supports professional development for preschool teachers and Providers. This report examines the impact of CPP programs, including benefits for preschoolers and returns for the city of Cincinnati, through quantitative and qualitative evaluations conducted by CPP’s external program evaluator, INNOVATIONS in Community Research and Program Evaluation of Cincinnati Children’s Hospital Medical Center.
The quantitative evaluation was based on agency level and participation data provided by CPP and academic data provided by Cincinnati Public Schools (CPS) and was designed to address the following key areas:
• Kindergarten Readiness of CPP Participants Compared to Non-CPP Participants
• Preschooler Development and Progress as Measured by Preschool Assessments
• Benefits of Extended Learning Session (ELS)
• Enrollment of Preschoolers in CPP Programs
• Preschool Aged Children Not Enrolled in CPP
• Providers Participating in CPP
• Providers Not Engaged with CPP
• Preschooler Access to High Quality Preschool Because of CPP TA Funding
• Utilization of TA Funding
• Availability and Utilization of High Quality Preschools
• Cost and Affordability of Quality Rated Preschools
• Importance of CPP’s Teacher Grants for Recruitment and Retention
• Satisfaction with Job Fit, Environment, Pay and Benefits
• Results of Peanut Butter and Jam (PB&J) Program Pilot
• Preschooler Experience Survey (Qualitative Report)
• Student Teacher Perspectives on Future Employment in Early Childhood Education (Qualitative Report)
• Provider Marketing and Enrollment Support Needs (Qualitative Report)
• Aspects of Parental Trust in Preschool Providers (Qualitative Report)
1 The CPP defines high quality preschool as a preschool that has received three , four , or five stars on Ohio’s Step Up To Quality (SUTQ) quality rating system for child care Providers. High quality preschools within the CPS footprint who meet CPP’s Provider guidelines can participate in CPP’s TA program.
The qualitative evaluation included focus groups and surveys with parents, teachers, and Providers participating in TA and QI programs as well as prospective parents and Providers could participate in CPP in the future. Select findings from the qualitative evaluation are included in this report The standalone qualitative evaluation report entitled Parent, Teacher, and Provider Insights on Early Learning and Cincinnati Preschool Promise 2021 22 addresses the following key areas:
• Awareness of CPP
• Understanding of CPP Benefits
• Barriers to Enrolling or Engaging with CPP
• Impact of Tuition Assistance on Families
• Parent Perspectives on Quality and Kindergarten Readiness
• Barriers to Accessing Preschool and CPP Funding
• Stakeholder Satisfaction with CPP Interactions and Supports
• Effectiveness of Providers Communicating to Families about CPP
• Teacher Recruitment, Retention, and Pay
Key findings are summarized below. Additional results, details, and definitions about CPP programming and the evaluation methodology are described within the main sections of the report.
Key Findings from the Year 5 Evaluation: Kindergarten Readiness
• CPP TA participants were more frequently (73.0%) Approaching or Demonstrating readiness on the overall KRA R compared to Non CPP participants (63.4%).
• Language and Literacy subtest results revealed that the percentage of CPP TA participants On Track for literacy by third grade was 45.4% compared to 41.4% of Non CPP participants.
• In 2021 22, preschoolers assessed showed preschool progress (i.e., maintained proficiency or improved on the Teaching Strategies GOLD® (TS Gold®) from Fall to Spring) at high frequency within the Social Emotional (84.8%), Physical (93.0%), Language (87.3%), Cognitive (84.2%), Literacy (90.4%), and Math (82.5%) domains of measurement.
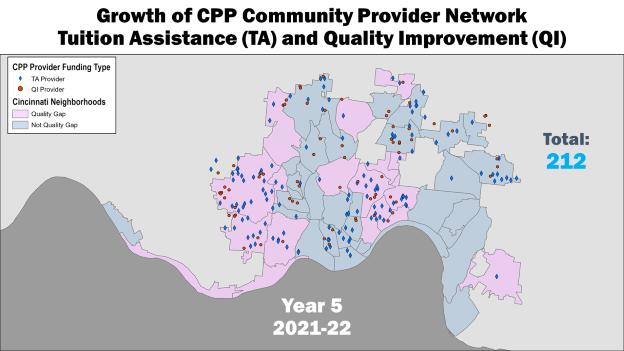
• As of June 2022, there were 212 Providers in the CPP Community Provider network representing 3,622 quality and high quality seats, which is an increase from the previous year.
• In 2021 22, 907 preschoolers received CPP TA and were enrolled in high quality preschools, an increase of 19.3% from 2020-21 to 2021-22.
• As of June 2022, there were 139 TA Provider sites, a net increase of 25 compared to June 2021 The new TA Providers represent a net increase of 80 additional high quality seats for preschoolers.
• In 2021 22, 23 CPP QI Providers reached high quality and converted to TA preschools
• As of June 2022, there were 87 QI Provider sites, 33 of which were in quality gap neighborhoods.
• A total of 487 children enrolled in the ELS program which operated from June 2021 through August 2021. On average, ELS students attended 82.8% of their scheduled school days, with 50.6% having an attendance of 90% or higher.
• Data pending the release of the Wage Analysis Report
• To date, CPP has supported 190 lead preschool teachers at 89 Providers with the Teacher Promise Grant. Lead preschool teachers can receive up to $4,000 per year.
• To date, CPP has supported 95 staff positions at 46 QI preschools with a Staff Support Fund of up to $3,000 per lead teacher not to exceed $18,000 per site.
• Preschoolers attending Peanut Butter and Jam sessions showed improvement in observed behavior across 10 domains of measurement according to 95% of Providers and teachers who provided feedback.
• Preschoolers attending Peanut Butter and Jam sessions made improvements from Fall to Spring in five domains with complete data measured by the TS GOLD® preschool assessment.
• Parents, teachers, and Providers from more than 50 unique preschool locations participated in focus groups, key informant interviews, or surveys.
• Parents receiving TA were asked “Would you have been able to afford preschool if you had not received CPP TA?” A total of 73.3% said “none of the cost” and 20.0% responded “some of the cost.”
• Highly educated teachers were more highly ranked as meaningful aspects of quality preschool this year than in the previous two years when TA parents ranked kindergarten preparation, safety, and social skills development as the top three aspects of quality preschool
• The diverse panel met monthly and represented both TA and QI stakeholders. The panel included two (2) Providers, two (2) teachers, two (2) parents, one (1) community consultant, and CPP’s Data and Evaluation Manager
• Panel members shared feedback on the 2022 evaluation plan, preschooler survey items, preschool attendance, participant outreach strategies, Provider and teacher wages, parent engagement, and other related topics
INNOVATIONS recommends that CPP consider the following next steps and opportunities to continue to ensure equitable access to quality preschool education in Cincinnati. Note that some of the recommendations and next steps may be implemented with existing resources and capacity while others will require long term planning, funding strategies, and partnerships.
• Continue to Offer Programs and Supports that Make a Positive Impact on Children, Teachers, and Providers: CPP should continue to increase access and enrollment in quality preschool. Children who enrolled in CPP have greater outcomes in kindergarten readiness (KRA R in CPS) compared to those who are not enrolled in preschool. Teachers and Providers benefit from teacher grants and other supports that support recruitment, retention, and satisfaction.
• Support Pipeline Development and Succession Planning for Teachers: Feedback from Providers indicates difficulty in hiring and retaining quality staff. Feedback from 80% of TA parents surveyed indicated that parents believe that a quality preschool has welltrained teachers.
• Expand the Peanut Butter and Jam Program: Preschoolers in select sites who attended Peanut Butter and Jam showed improvement in observed behavior across 10 domains of measurement according to 95% of Providers and teachers who provided feedback. In addition, preschoolers attending PB&J made improvements from Fall to Spring in five domains measured by the preschool assessment, TS GOLD®
• Focus on Equity: CPP’s Board Equity Policy states a strong commitment to ensuring preschoolers with the fewest resources benefit from CPP. To do this, CPP can further enhance parent resources and information, especially in quality gap neighborhoods as this was identified as a consistent barrier to enrollment.
• Define Kindergarten Readiness to Include the Whole Child: Social Emotional, Physical, and Cognitive domains are critical to a child’s kindergarten readiness as well as academic preparedness. CPP should continue to examine preschool outcomes that address these domains to gauge program effectiveness.
• Consider an Attendance Initiative Pilot: Early education literature and assessment data from local preschoolers associate regular preschool attendance with improved outcomes in kindergarten. CPP should consider piloting an attendance initiative to support parents in promoting regular attendance for all preschoolers. This initiative may be timely as COVID-19 may have impacted preschool attendance for some preschoolers.
The Kindergarten Readiness Assessment Revised (KRA R) was used to evaluate the impact of CPP TA participation on kindergarten readiness against Non CPP participants The KRA R measures academic readiness and literacy skills as well as Social Foundations (socio emotional development), Mathematics, and Physical Well Being and Motor Development. The KRA R is administered to all kindergartners in the state of Ohio, including those within the CPS district, beginning as early as July 1 and ending no later than the twentieth day of instruction during the academic year.
The following analysis focus on the KRA R composite score (overall KRA R score) and the Language and Literacy subtest score. The composite scaled score (overall score) on the KRA R is determined by a kindergartener’s set of skills and behaviors across four subtests. The KRA R measures readiness through performance levels: Emerging Readiness (Scores of 0 257), Approaching Readiness (Scores of 258 269), and Demonstrating Readiness (Scores at or above 270). A scaled score of 263 and above on the Language and Literacy subtest indicates that a kindergartener is On Track for literacy in third grade. The Social Foundations, Mathematics, and Physical Well-Being and Motor Development subtests do not have scaled scores that correspond to performance levels to assess a kindergartener’s skills and behaviors within these specific areas. Other KRA-R subtest scores may be examined in the future to evaluate the impact of CPP TA participation on the subtests.
A cohort of CPP community and CPS preschool expansion participants funded by CPP TA (hereafter referred to as CPP TA participants) was examined to understand the status of kindergarten readiness as assessed by the KRA R A total of 1,658 children who attended a CPP TA Provider program during the 2019-20 and/or 2020-21 school year met the age cutoff for the 2021 22 kindergarten cohort (child reached age five by September 30, 2021). Parental consent for 1,627 (98.1%) CPP TA participants was obtained for matching with CPS KRA R scores, if available. Fourteen CPP TA participants matched to incomplete KRA R tests. Preschoolers with missing or incomplete KRA R scores were excluded from the analyses. Reasons a child would not match to a KRA R score include enrollment in a school outside of the CPS district and inconsistent identifying information (e.g., name spelling, date of birth, race) across data sources.
A total of 582 CPP TA participants with consent completed the KRA R at a CPS kindergarten in 2021 22. CPP TA participant KRA R scores were compared to 2021 22 KRA R scores of 1,982 Non CPP participants; a cohort of CPS kindergartners who did not attend a CPP community Provider or CPS preschool (hereafter Non CPP kindergarteners)
Regarding QI participants, a total of 14 QI participants who were eligible for kindergarten in 2021 22 had parental consent for matching with CPS KRA-R scores. Seven QI participants matched to KRA R scores; therefore, analysis of QI participant KRA R scores were not performed due to the sample size being below the minimum reporting sample size of 10 (as determined by CPS and FERPA guidelines). Efforts to collect QI participant consent forms will continue in order to understand QI participant preparation for kindergarten.
Socioeconomic characteristics were determined for all CPS kindergarteners who were administered the KRA-R in 2021-22, including the CPP TA participants. Residential addresses of kindergarteners were geocoded to determine their census tract. Considering the changing socioeconomic landscape of Cincinnati over the past decade, socioeconomic status (SES) quartile ratings were used as a proxy for income Social factors have also been updated to align with more current metrics. Five SES indicators from the 2019 American Community Survey (ACS)
Year Estimates were used to rank census tracts by socioeconomic risk: (1) median family income; (2) percent of the population 25 years of age or older with less education than a high school diploma; (3) percent of workers in unskilled and semiskilled occupations; (4) percent of children (under the age of 18) living in married couple, family households; and (5) percent of housing units with more than one person per room. SES characteristics for Cincinnati city and metropolitan area census tracts were estimated using the methodology detailed in The Social Areas of Cincinnati (5th Ed.; Maloney & Auffrey, 2013).2 Ranked census tracts were divided into quartiles (SES 1 4), where lower SES quartiles have a higher concentration of families with socioeconomic risk factors.3
Figure 1 contains 581 geocoded CPP TA participants that attended preschool between 2019-20 and 2020-21 and completed the KRA-R in 2021-22 within CPS. One CPP TA participant was not plotted due to a lack of SES data. Participants were plotted and color-coded by SES quartile. The plotted points represent the addresses of CPP TA participants at the time of kindergarten.
Figure 1. Geocoded CPP TA 2021-22 KRA-R Cohort by SES Quartile
quartiles defined
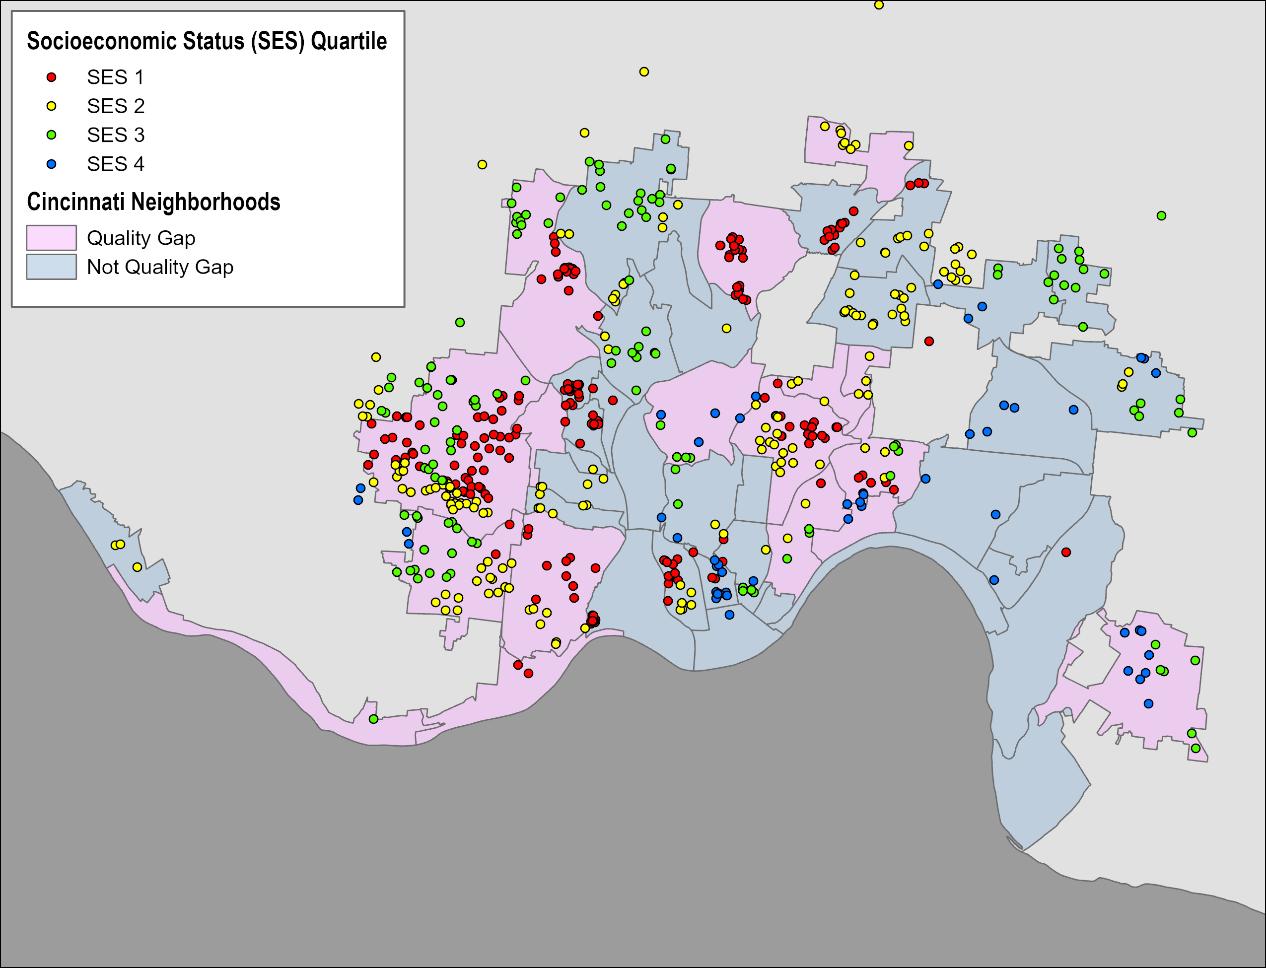
The demographic characteristics of the 2021 22 KRA R cohort are shown in Table 1. Notable differences can be seen in the distribution of race, where CPP TA participants are disproportionately Black/African American (75.8%) compared to Non CPP kindergartners (52.2%). Other differences were present between cohorts within White and Hispanic kindergarteners. The remaining racial distributions were relatively similar. The distribution of SES quartiles varied where 66.9% of CPP TA participants lived in low SES (SES 1 or SES 2) communities compared to 58.5% of Non CPP kindergartners. CPP TA participants were comprised of fewer children from SES 4 communities (9.3%) than Non CPP kindergartners (15.3%).
Gender Female 51.4% 49.4%
Male 48.6% 50.6%
Race Black/African American 75.8% 52.2%
White 10.8% 26.4%
Hispanic 5.8% 10.0%
Asian 0.3% 1.0%
American Indian 0.0% 0.2%
Native Hawaiian/Pacific Islander 0.2% 0.2%
Multi-Racial 7.0% 10.0%
SES Quartile SES 1 35.1% 32.3%
SES 2 31.8% 26.2%
SES 3 23.7% 25.9%
SES 4 9.3% 15.3%
SES Unknown 0.2% 0.4%
KRA R outcomes for 2021 22 kindergarteners are illustrated below in Figures 2 and 3. CPP TA (N = 582) participants outperformed Non CPP (N = 1,982) kindergartners, where 73.0% of CPP TA participants were Approaching or Demonstrating readiness on the overall KRA R in 2021 22 compared to 63.4% of Non CPP kindergartners (Figure 2).
Figure 2. Overall KRA-R Performance Levels by CPP TA Participation (2021-22)
0% 10% 20% 30% 40% 50% 60%
27.0%
33.6%
CPP TA Participants (N=582) Non-CPP Kindergartners (N=1,982) Emerging Approaching Demonstrating
Language and Literacy subtest results revealed that the percentage of CPP TA participants On Track for literacy by the third grade was 45.4% compared to 41.4% of Non CPP kindergartners (Figure 3). Social Foundations subtest results showed that CPP TA participants scored 2.3 points higher than Non CPP kindergarteners and average CPP TA participant scores were 272.0 points compared to 269.8 points for Non CPP kindergarteners (subtest range: 202 298 points).
Figure 3. Percentage On Track in Language and Literacy by CPP TA Participation (2021-22)
CPP TA Participants (N=582)
Non-CPP Kindergartners (N=1,982)
Figures 4 5 show that CPP TA benefitted Black/African American, Hispanic, and Multi Racial/Other kindergartners more than White kindergartners. CPP TA participants were more frequently Approaching or Demonstrating readiness on the overall KRA R compared to Non CPP kindergarteners by 13.9 percentage points among Black/African American kindergarteners, 16.9 percentage points among Hispanic kindergarteners, and 16.6 percentage points among Multi Racial/Other kindergarteners (Figure 4).
Sample sizes
Multi
Likewise, CPP TA participants were more frequently On Track on the KRA R Language and Literacy subtest compared to Non CPP kindergarteners by 11.5 percentage points among Black/African American kindergarteners, 7.5 percentage points among Hispanic kindergarteners, and 3.7 percentage points among Multi Racial/Other kindergarteners (Figure 5).
Note. Sample sizes for CPP TA participants are 441 Black/African American, 63 White, 34 Hispanic, and 44 Multi Racial/Other. Sample sizes for Non CPP kindergartners are 1,035 Black/AfricanAmerican, 523 White,199 Hispanic, and 225 Multi Racial/Other.
Figures 6-7 displays that CPP TA participation was linked to stronger KRA-R performance than no CPP participation, primarily within lower SES quartiles (SES 1-2). CPP TA participants who live in higher SES census tracts (most notably SES 4) did not exhibit the same advantage against their peers.
CPP TA participants were more frequently Approaching or Demonstrating readiness on the overall KRA-R compared to Non-CPP kindergarteners by 19.7 percentage points among SES 1 and 14.8 percentage points among SES 2 (Figure 6).
Similarly, CPP TA participants were more frequently On Track on the KRA R Language and Literacy subtest compared to Non CPP kindergarteners by 12.5 percentage points among SES 1 and 14.5 percentage points among SES 2 (Figure 7).
Note. Sample sizes for CPP TA participants are 204 SES 1, 185 SES 2, 138 SES 3, and 54 SES 4. Sample sizes for Non CPP kindergartners are 640 SES 1, 519 SES 2, 513 SES 3, and 303 SES 4.
KRA R results were further evaluated by both race and SES (Figures 8 9). Due to small sample sizes (N<10) for select SES and race groups, some comparisons were not included in the figures below. Sample sizes for each group can be viewed in Table 2.
Among Black/African American kindergarteners, CPP TA participants were Approaching or Demonstrating readiness on the overall KRA R at a higher percentage than Non CPP kindergartners within all SES quartiles (Figure 8). Among White kindergarteners, CPP TA participants only outperformed Non CPP kindergarteners within SES 1 and 2. Outcomes for Hispanic and Multi Racial/Other kindergarteners were limited due to small sample sizes. SES 1 Hispanic kindergarteners with CPP TA participation showed an advantage over their Non CPP peers as did Multi Racial/Other kindergarteners with CPP TA participation within SES 1 and SES 3.
CPP TA
KRA-R Language and Literacy subtest outcomes closely mirrored those of the overall KRA-R. Black/African American kindergarteners with CPP TA participation were On Track in Language and Literacy at a greater frequency than their Non CPP peers within SES 1 3 but not SES 4. (Figure 9). A higher percentage of White kindergarteners with CPP TA participation were On Track compared to Non CPP participants within SES 1 and 2. Additional relationships in favor of CPP TA participants were found among Hispanic and Multi-Racial/Other kindergarteners within SES 1. For more data from the KRA R analysis, see Appendix A B
Figure 9. Percentage On Track in Language and Literacy by Race, SES, and CPP TA Participation
Percentage On Track in Language and Literacy by Race, SES, and
TA Participation
CPP TA Participants
Non-CPP Kindergartners
Note.
Table 2. KRA-R Cohort Sample Sizes for CPP TA Participants and Non-CPP Kindergartners by Race and SES
Race
Black/African American
326 232 67
4
52 88 189 194 Hispanic
Racial/Other
19 21
5
185
50 19 7
55 73 35
519 513 303
Logistic regression analyses were used to predict KRA-R outcomes using gender, race, SES, and CPP TA participation. A sample of 2,556 CPS kindergarteners from the 2021-22 KRA-R cohort were included in the analyses, excluding cases with missing predictor data (i.e., missing SES). Two models were created: one to predict kindergarteners Demonstrating readiness on the overall KRA R (i.e., composite scores at or above 270) and the other to predict kindergarteners On Track in Language and Literacy (i.e., Language and Literacy subtest scores at or above 263).
Results from the first model indicated that gender, race, SES, and CPP TA participation were all statistically significant predictors for Demonstrating readiness on the KRA R. Most notably, CPP TA participation increased the odds of Demonstrating readiness by 38.8% when statistically controlling for the other predictors. The second model yielded similar results. Gender, race, SES, and CPP TA participation were all statistically significant predictors for being On Track in Language and Literacy. CPP TA participation increased the odds of being On Track by 41.9% when statistically controlling for the other predictors.
The logistic models showed that race is a strong predictor of KRA R performance (Table 3). Controlling for other predictors, the odds of White kindergarteners Demonstrating readiness were 208.4% higher than Black/African American kindergarteners, 705.4% higher than Hispanic kindergarteners, and 95.9% higher than Multi-racial/Other kindergarteners. Likewise, the odds of White kindergarteners being On Track in Language and Literacy were 157.5% higher than Black/African American kindergarteners, 914.8% higher than Hispanic kindergarteners, and
105.5% higher than Multi racial/Other kindergarteners. The odds of Black/African American kindergarteners Demonstrating readiness and being On Track in Language and Literacy were 161.1% higher and 294.1% higher than Hispanic kindergarteners, respectively. Lastly, the odds of Multi racial/Other kindergarteners Demonstrating readiness were 311.2% higher than Hispanic kindergarteners and 57.5% higher than Black/African American kindergarteners, while their odds of being On Track were 393.9% higher than Hispanic kindergarteners and 25.3% higher than Black/African American kindergarteners.
Table 3. Percentage Difference in Odds of Demonstrating Readiness on the KRA-R and Being On Track in Language and Literacy: Comparisons by Race
Odds for White Kindergarteners
Odds for Black/African American Kindergarteners
Odds for Hispanic Kindergarteners
Odds for Multiracial/Other Kindergarteners
% Difference in Odds of Demonstrating Readiness
% Difference in Odds of being On Track in Language and Literacy Comparison
208.4% higher than 157.5% higher than Black/African American 705.4% higher than 914.8% higher than Hispanic 95.9% higher than 105.5% higher than Multiracial/Other
67.6% lower than 61.2% lower than White 161.1% higher than 294.1% higher than Hispanic 36.5% lower than 20.2% lower than Multiracial/Other
87.6% lower than 90.1% lower than White 61.7% lower than 74.6% lower than Black/African American 75.7% lower than 79.8% lower than Multiracial/Other
48.9% lower than 51.3% lower than White 57.5% higher than 25.3% higher than Black/African American 311.2% higher than 393.9% higher than Hispanic
The findings for SES demonstrated the impact of social and economic factors on kindergarten readiness (Table 4). Controlling for all other predictors, the odds of an SES 4 kindergartener Demonstrating readiness were 42.7% higher than SES 3, 82.1% higher than SES 2, and 184.6% higher than SES 1. Additionally, the odds of an SES 4 kindergartener being On Track were 33.8% higher than SES 3, 84.3% higher than SES 2, and 162.7% higher than SES 1 when controlling for other predictors.
Table 4. Percentage Difference in Odds of Demonstrating Readiness on the KRA-R and Being On Track in Language and Literacy: Comparisons by SES
Calculation
Odds for SES 1 Kindergarteners
Odds for SES 2 Kindergarteners
% Difference in Odds of Demonstrating Readiness
% Difference in Odds of being On Track in Language and Literacy Comparison
36.0% lower than 29.8% lower than SES 2 49.9% lower than 49.1% lower than SES 3 64.9% lower than 61.9% lower than SES 4
56.3% higher than 42.5% higher than SES 1 21.7% lower than 27.4% lower than SES 3 45.1% lower than 45.8% lower than SES 4
Odds for SES 3 Kindergarteners 99.4% higher than 96.3% higher than SES 1 27.6% higher than 37.7% higher than SES 2 29.9% lower than 25.3% lower than SES 4
Odds for SES 4 Kindergarteners
184.6% higher than 162.7% higher than SES 1 82.1% higher than 84.3% higher than SES 2 42.7% higher than 33.8% higher than SES 3
Evidence of the progress that preschoolers enrolled in CPP are making can be observed during their first years of early education. A preschool progress measure, the Teaching Strategies GOLD® (TS GOLD®), was incorporated into the evaluation to understand the impact of a high quality preschool experience on CPP preschoolers receiving TA INNOVATIONS examined the overall pre (fall) and post assessment (spring) scores of CPP preschoolers assessed 4
TS GOLD® is a formative assessment administered multiple times per year through which teachers document observations of a preschooler’s developmental level and growth along multiple domains of learning. This assessment was selected due to its common administration to TA preschoolers attending CPS and Head Start Providers. TS GOLD® documents a preschooler’s development as Below, Meeting, or Exceeding expectations along six domains: Social Emotional, Physical, Language, Cognitive, Literacy, and Mathematics.
Deidentified TS GOLD® scores were acquired for 2021 22 preschoolers. The cohort included preschoolers who attended select CPP community preschools or CPS preschools. TS GOLD® results were summarized by domain (Social Emotional, Physical, Math, Language and Literacy). Preschool progress was defined as when a preschooler maintained or exceeded expectations on TS GOLD® subtest(s) within the domain or improved on the TS GOLD® from Fall to Spring. Measures of preschool progress are summarized below:
Preschool Assessment Scores for 2020-21
Deidentified preschool assessment data were obtained from 33 CPP TA Providers representing 67 classrooms throughout the CPS footprint. Of these classrooms, 43.3% were within the CPP Community Provider network. As seen in Figure 10, preschoolers (N = 355) from CPP participating preschools showed universal improvement across all TS GOLD® domains from the Fall 2020 to Spring 2021. By Spring, preschoolers were Meeting or Exceeding expectations at a frequency of 82.5% or higher. Mathematics showed the largest amount of growth from Fall to Spring with an increase of 49.1 percentage points, followed by Literacy with an increase of 40.4 percentage points.
TS GOLD® - Fall to Spring 2021-22 (N = 355)
Cincinnati Preschool Promise
throughout the Cincinnati area with representation in quality gap
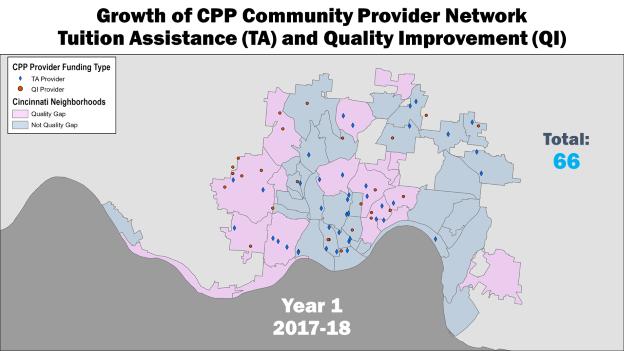
As defined in the RAND report5, quality gap neighborhoods are areas where the number or preschool aged children exceeds the available high quality seats by 100 seats or more. As of June 30, 2022, there were 212 Providers in the CPP network representing 3,622 quality and high quality seats
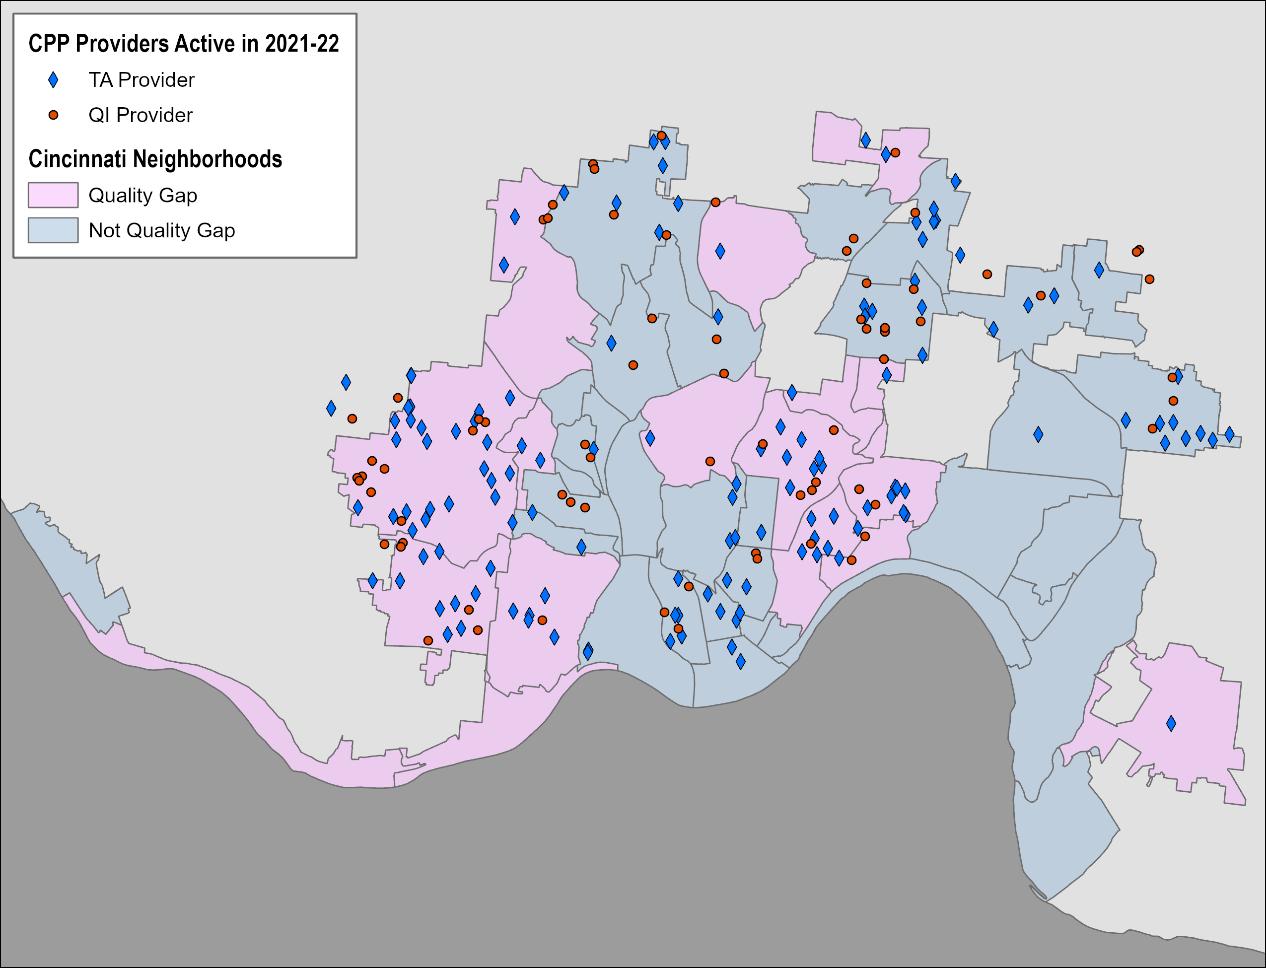
(Figure 11). There were a total of 110 Providers in quality gap
(Table 5). Additional analyses of high quality seat capacity
CPP’s Year 6 Evaluation.
Table 5. Total CPP Providers and Seats
Preschool Seats
Figure
CPP Tuition
Lynn A.,
Courtney Ann Kase, Robert C. McDaniel, and Eric W. Rademacher. "Options for investing in access to high quality preschool in Cincinnati"
quality seats are seats in preschools that have a 3, 4, or 5 Ohio SUTQ star rating. Quality seats are seats in preschools that are either unrated or have a 1 or 2 Ohio SUTQ star rating.
CPP Providers who are 3, 4, or 5 star rated by Ohio’s Step Up To Quality (SUTQ) child care quality rating system are approved to receive Tuition Assistance (TA) reimbursements from CPP for eligible preschoolers enrolled in their programs. The number of CPP Providers that have been approved to receive TA reimbursements has increased each year of the program (Figure 12).
The number of preschoolers enrolled receiving CPP TA reimbursements increased from 2020 21 to 2021 22 by 19.3% (Figure 13). Enrollment experienced set backs due to COVID 19 during the 2019 20 and 2020 21 school years but has recovered in 2021 22
Figure 13. Number of Preschoolers Enrolled in CPP TA Preschools
Preschoolers included in count if enrolled with at least 1 day of attendance. Enrollment may have been affected by COVID 19 during the 2019 20 and 2020 21 school years.
Preschoolers enrolled in TA preschools were 50.9% female, mostly African American/Black (69.3%), and typically live in homes where English is the primary language (85.6% of 708 with spoken language data) The majority (93.5%) of preschool children reside in a permanent residence and many (68.4%) have a total of 4 or fewer household members. A group of preschoolers had their income requirement waived (33.6%) A preschooler may have their income requirement waived if they have already met the income requirements for the Ohio Department of Education (requiring 200% FPL or below), Publicly Funded Child Care
FPL or below), or Head Start (requiring 185% FPL or below)
the
Appendix C.
for prior years can be viewed
not have their income requirement waived, 61.0% were from households with an income that is less than 100% of the Federal Poverty Level (FPL) (Table 6). Additional
Gender
Female 458 50.5% 51.5%
Male 432 47.6% 48.5%
Gender Unknown 17 1.9%
Race
African American/Black 629 69.3% 70.3%
White 67 7.4% 7.5%
Hispanic 136 15.0% 15.2%
American Indian/Alaskan Native 9 1.0% 1.0%
Asian or Pacific Islander 5 0.6% 0.6%
Other 49 5.4% 5.5%
Race Unknown 12 1.3%
Language Spoken at Home English 606 66.8% 85.6%
Spanish 74 8.2% 10.5%
French 2 0.22% 0.3%
Other 26 2.9% 3.7%
Language Unknown 199 21.9%
Housing Status Lives in a Permanent Residence 846 93.3% 93.5%
Foster Care 10 1.1% 1.1%
Homeless 13 1.4% 1.4%
Unaccompanied Youth 0 0.0% 0.0%
Other 36 4.0% 4.0%
Housing Status Unknown 2 0.2%
Household Size 2 Residents 153 16.9% 16.9%
3 Residents 224 24.7% 24.7%
4 Residents 243 26.8% 26.8%
5 Residents 147 16.2% 16.2%
More than 5 in Household 140 15.4% 15.4%
Household size Unknown 0 0.0%
Eligibility Tier <100 367 40.5% 61.0% 100 130 67 7.4% 11.1% 131 200 125 13.8% 20.8%
250 29 3.2% 4.8% 251 300 14 1.5% 2.3%
Income Requirement Waived 305 33.6%
2021 22,
TA
approved (Figure 14).
approval rate remains similar
presented
20
rates.
The figure indicates that the primary reasons for denial
reasons for application denial
2021 22 were due to the child being too young for enrollment (35.5%) or their address was not located in the district
Figure 14. Number of Approved CPP TA Applications per Year
Figure 15. Reason for Denied CPP TA Applications per Year
Too Young
Old
High
The average attendance rate (total days attended/total days scheduled) for 2021 22 CPP TA preschoolers was 85.4%. Figure 16 indicates that attendance rates have remained stable from year to year, apart from 2019 20 when COVID 19 shutdowns went into effect during the latter half of the school year.
Figure 16. CPP TA Preschooler Attendance Rates
Attendance rates are calculated by dividing CPP TA preschoolers’ total days attended by their total days scheduled.
The total amount of TA reimbursed to Providers in 2021 22 was $5 26 million (Figure 17). The average annual TA reimbursement per preschooler was $4,519 (Figure 18) and the average monthly TA reimbursement per preschooler was $600 (Figure 19).
17. Total CPP TA Dollars/Year (per School Year)
Figure 18. Avg Annual CPP TA Dollars (per Preschooler)
Figure 19. Avg Monthly CPP TA Dollars (per Preschooler)
Tuition Assistance Providers are located throughout the Cincinnati area with representation in quality gap areas. There were 114 Tuition Assistance Provider locations in 2020 21 and 139 in 2021 22, a net increase of 25 additional high quality Providers added since last year (Table 7). The new TA Providers represent a net increase of 80 additional high quality seats for preschoolers, according to data submittedby TAProviders on their most recent CPP application. There are now 76 TA Providers in quality gap areas representing 1,037 high quality seats, an increase of 75 high quality seats since 2020 21 (Figure 20).
Total Number of TA Providers TA Providers in Quality Gap Neighborhoods Net Increase in TA Providers
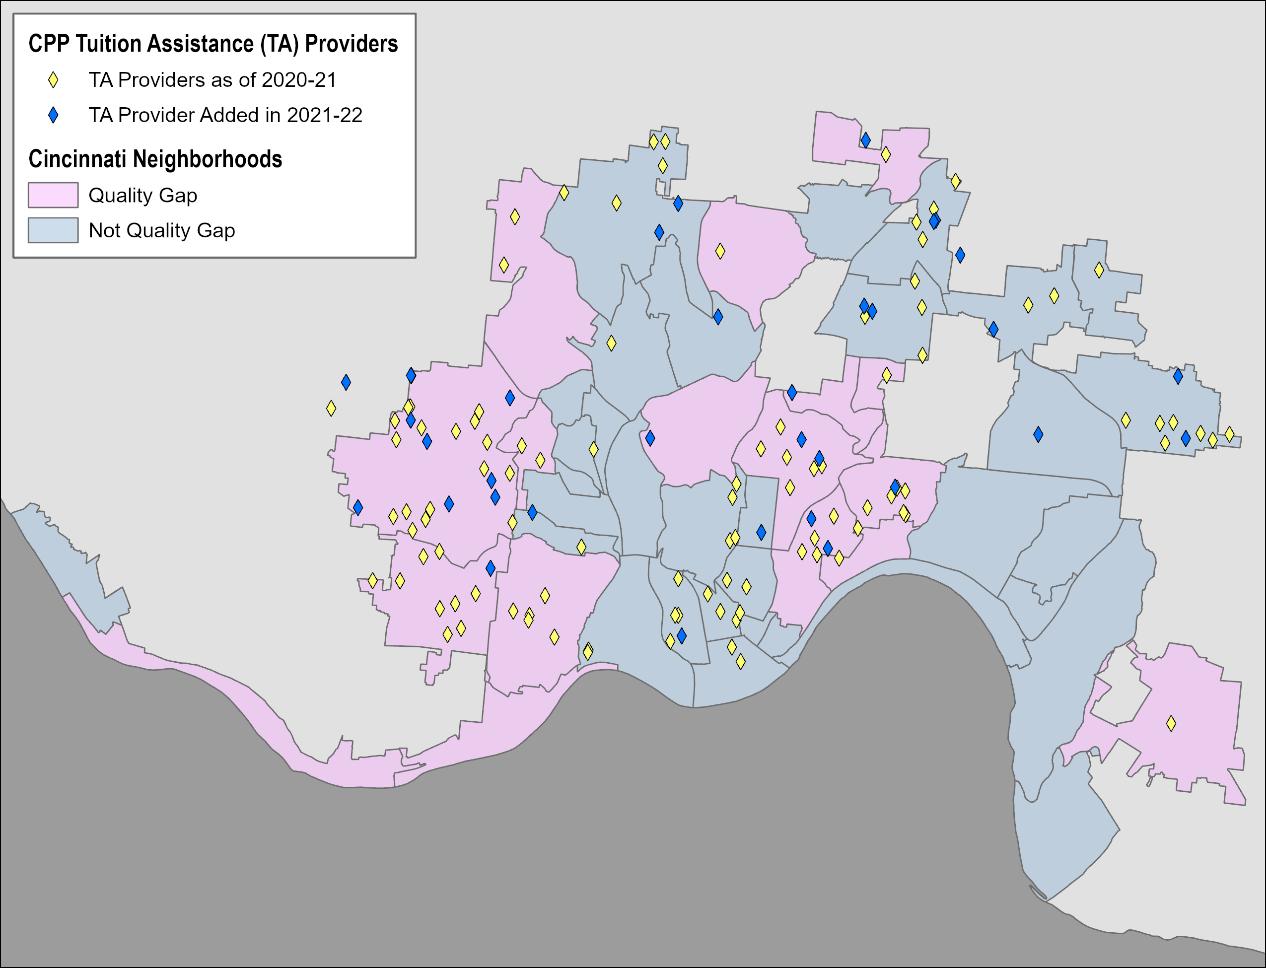
Number of TA Providers as of 2017 18 40 16
Number of TA Providers as of 2018 19 57 26 17
Number of TA Providers as of 2019 20 83
Number of TA Providers as of 2020 21 114
26
31
Number of TA Providers as of 2021 22 139 76 25
Figure 20. CPP Tuition Assistance (TA) Providers Added in 2021 22
Quality Improvement (QI) Providers are either unrated or have a 1 or 2 SUTQ star rating. Through CPP, approved QI Providers received tangible support and coaching to improve quality and increase the number of high quality preschool seats in the CPP network
CPP’s network of approved QI Providers included 87 preschools during the 2021 22 academic year (Figure 21).
Figure 21. Number of CPP QI Approved Providers per Year
CPP QI Providers can be converted to a TA Provider upon earning a three , four , or five star SUTQ rating. QI Providers who are still working to reach a high quality star rating are described as non converted for the purpose of the following analysis During fiscal year 2021 22, CPP converted a total of 23 Providers from QI preschools to TA preschools (Figure 22). Among the converted, 14 were Active QI Providers during the fiscal year and 9 were Inactive QI Providers from a prior fiscal year that returned as a TA approved Provider.
22. Number of CPP QI Providers Converted to TA Providers per Year
Fiscal Year
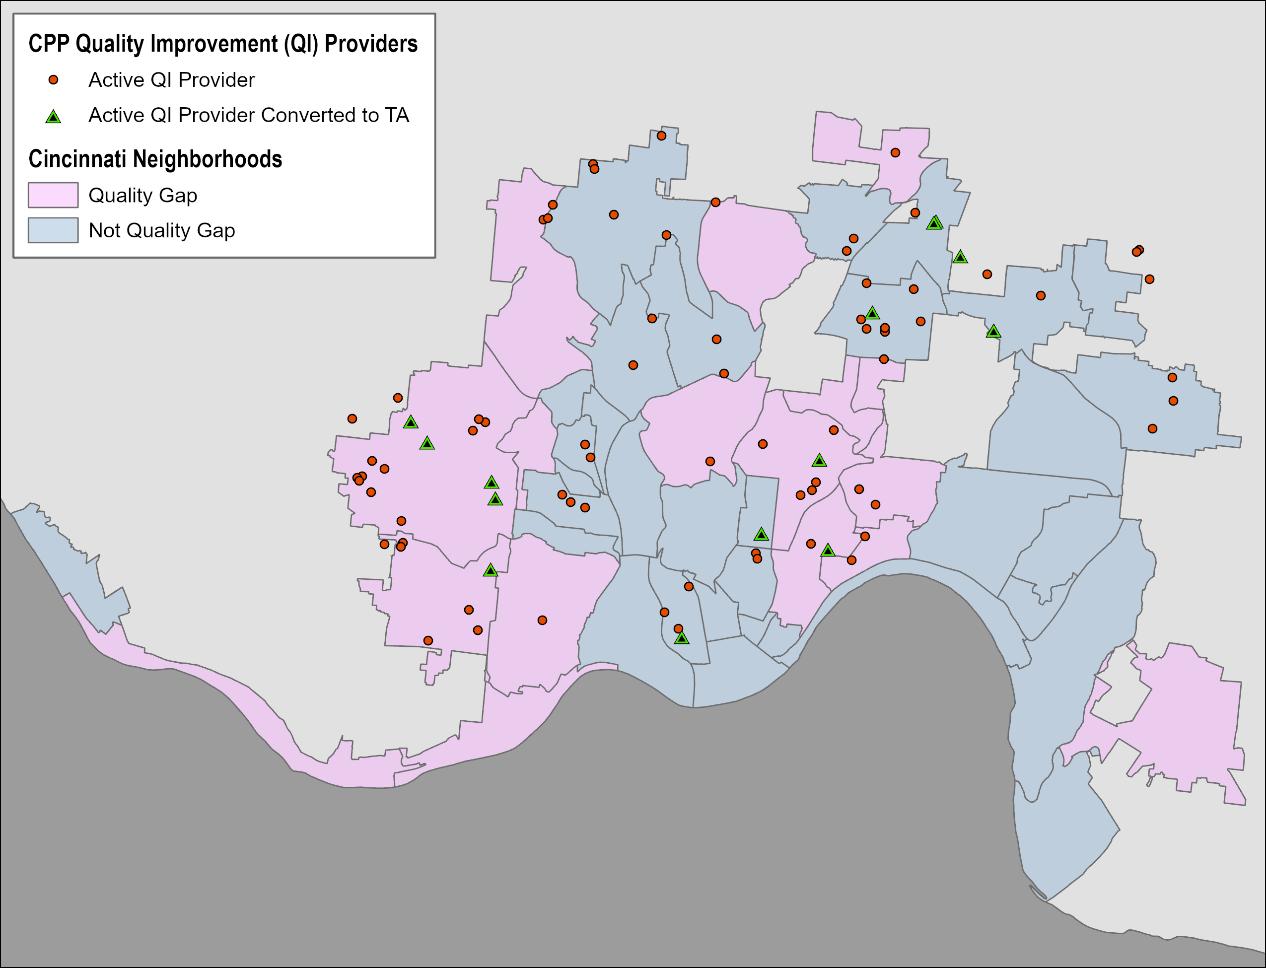
INNOVATIONS examined factors that impact teacher recruitment, retention, and pay to understand opportunities for actions and policies that may improve access to high quality preschool by ensuring teachers and Providers have adequate support and pay.
CPP provides Teacher Promise Grants (TPG) of up to $4,000 directly to individual preschool teachers at TA preschools as a method to supplement teacher wages and support retention and recruitment. To date, CPP has supported 190 lead preschool teachers at 89 TA preschools. Of the 86 lead preschool teachers receiving TPG in 2021 22, 82 recipients completed 12 months of service a retention rate of 95.3%.
A total of 12 TA teacher survey respondents identified as lead teachers. Eight (66.7%) indicated that they had received a TPG. Of those receiving a TPG, seven (87.5%) “agreed” or “strongly agreed” that the TPG had an impact on them staying with their employer.
CPP awards Staff Support Funds (SSF) to preschools, with the amount determined by the number of staff. This program aims to support staff wages, health benefits, and education. To date, CPP has supported 95 staff positions at 46 QI preschools with a SSF of up to $3,000 per lead teacher not to exceed $18,000 per site.
Through focus groups and surveys, QI Providers who received SSF from CPP were asked to share how the funds were used in their preschools. Two of seven QI Provider participants reported that have received SSF and used them to increase wages for staff and provide staff benefits. Other QI Provider participants shared that they haven’t applied or planned to apply for SSF soon.
Additional data are pending the release of the 2021 22 Wage Analysis Report.
Cincinnati Preschool Promise offered an Extended Learning Session (ELS) for preschoolers who were enrolled and active at a CPP TA Provider during the 2020 21 academic year to continue supporting the preschoolers’ education in preparation for kindergarten. Preschoolers who were not enrolled and active at a CPP TA Provider during the 2021 22 academic year were not eligible to participate. The ELS took place during the months of June 2021 August 2021. CPP recognized the importance of an ELS during 2020 when the COVID 19 pandemic disrupted learning for most children. The ELS continued to be offered this year in response to positive parent feedback and demand for the ELS shown in 2020. A total of 84 CPP TA Providers participated in ELS in 2021. A total of 487 preschoolers enrolled in an ELS program in the summer of 2021 (academic year 2020 21). On average, ELS preschoolers attended 82.8% of their scheduled school days, with 50.6% having an attendance of 90% or higher. Demographic characteristics of the ELS cohort were similar to those of the general sample (Table 9).
Demographic Group
Count Percent Valid Percent
Gender Female 255 52.4% 52.5%
Male 231 47.4% 47.5%
Gender Unknown 1 0.2%
Race African American/Black 379 77.8% 78.8% White 31 6.4% 6.4% Hispanic 34 7.0% 7.1% Asian or Pacific Islander
0.6% 0.6% American Indian/Alaskan Native
0.4% 0.4% Other
Race Unknown
Language Spoken at Home English
6.6% 6.7%
1.2%
78.6% 89.7% Spanish
7.0% 8.0% Other
Language Unknown
Housing Status Lives in a Permanent Residence
2.1% 2.3%
12.3%
94.3% 94.3%
Household Size
Foster Care
1.0% 1.0%
1.0% 1.0% Homeless
Unaccompanied Youth
Housing Status Unknown
Residents
Residents
Residents
Residents
More than 5 in Household
size Unknown
3.7% 3.7%
0.0% 0.0% Other
0.0%
21.1% 21.1%
27.9% 27.9%
25.5% 25.5%
14.4% 14.4%
11.1% 11.1%
(Continued).
Tier
of
Enrolled in ELS Preschools for 2020-21
62.9%
8.0%
22.9%
3.6%
2.5%
Requirement Waived
total TA reimbursement paid to Providers between June 2021 and August 2021 was $767,509. From June through August 2021, the average TA reimbursement per student was $1,586 and the average monthly TA reimbursement per preschooler was $569. As of June 30, 2022, there have been 86 ELS Providers to date as highlighted in the map below, 84 of which were active in 2021 (Figure 24).
24. CPP Extended Learning Session (ELS) Preschools as of June 30, 2022

A total of 110 CPP TA participants who participated in the ELS (hereafter ELS participants) had parental consent and matched to a complete KRA R score at CPS in 2021 22. Assessment scores of ELS participants were compared to 2021 22 KRA R scores of 472 Non ELS participants; a cohort of CPP TA participants that did not participate in ELS in 2020 21.
ELS participants were less frequently Approaching or Demonstrating readiness on the overall KRA R (69.4%) than Non ELS participants (74.2%; Figure 25). Fewer ELS participants were On Track in Language and Literacy (34.3%) than Non ELS participants (48.8%; Figure 26).
60%
50%
40.9%
Figure 25. Overall KRA-R Performance Levels by ELS Participation 26.5%
Non-ELS* (N=472) ELS (N=110)
Emerging Approaching
50%
40%
30%
20%
10%
0%
47.9% 34.5%
Non-ELS* (N=472) ELS (N=110)
*CPP TA participants that did not participate in ELS
The impact of ELS participation told a different story when viewed within the lens of dosage. That is, ELS participants who attended 90% or more of their scheduled days showed stronger performance in relation to those below 90% attendance (Figures 27 28). Furthermore, ELS participants with 90% attendance or higher were Approaching or Demonstrating readiness at a rate of 75.5% compared to 73.5% of Non ELS students. The percentage of ELS participants with 90% attendance or higher On Track in Language and Literacy was 42.2% compared to 47.9% of Non ELS students.
Figure 27. Overall KRA-R Performance Levels by ELS Participation and Percent of Scheduled Days Attended
Figure 28. Percentage On Track in Language and Literacy by ELS Participation and Percent of Scheduled Days Attended
47.9% 42.2% 29.2%
(N=472)
Non-ELS* (N=472) ELS Attended 90% or More (N=45)
ELS Attendance Less than 90% (N=65)
Figures 29 30 display KRA R performance within the context of SES, ELS participation, and dosage. A noticeable advantage was present among SES 1 ELS participants with 90% attendance or higher (89.5% Approaching or Demonstrating; 42.1% On Track) compared to Non ELS (67.9% Approaching or Demonstrating; 38.2% On Track). A minor advantage was present among SES 2 ELS participants with 90% attendance or higher in Language and Literacy but not for KRA R overall. Specifically, 53.8% of those with 90% attendance or higher were On Track compared to 52.7% of Non ELS. Relationships for SES 3 and 4 were limited due to small sample sizes.
Note. Data are omitted if sample size is below 10. Sample sizes for Non ELS students were 165 SES 1, 148 SES 2, 116 SES 3, and 42 SES 4. Sample sizes for ELS Students with 90% attendance or higher were 19 SES 1, 13 SES 2, 6 SES 3, and 7 SES 4. Sample sizes for ELS Students less than 90% attendance were 20 SES 1, 24 SES 2, 16 SES 3, and 5 SES 4.
Note. Data are omitted if sample size is below 10. Sample sizes for Non ELS students were 165 SES 1, 148 SES 2, 116 SES 3, and 42 SES 4. Sample sizes for ELS Students with 90% attendance or higher were 19 SES 1, 13 SES 2, 6 SES 3, and 7 SES 4. Sample sizes for ELS Students less than 90% attendance were 20 SES 1, 24 SES 2, 16 SES 3, and 5 SES 4
KRA R outcomes by Race, ELS participation and percent of scheduled days attended are not shown due to small ELS sample sizes for White, Hispanic, and Multi Racial/Other students (N < 10). Additional findings can be viewed
Year 6 Evaluation will report the
total of ELS Providers
have participated
2020 as well as KRA R outcomes for ELS participants that participated
completed a KRA-R at CPS during the 2022
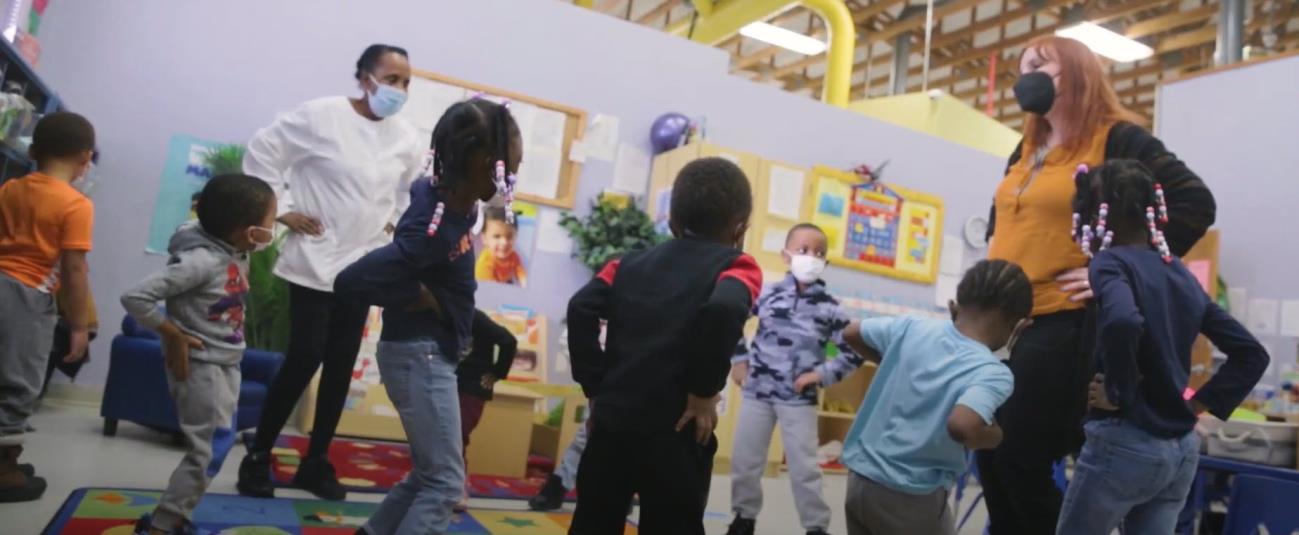
In 2021, CPP held a Pitch Night event to identify a service that could impact one of four focus areas: kindergarten readiness, improving community schools, early childhood education workforce, and COVID 19 recovery. Peanut Butter & Jam (PB&J) was the winner of Pitch Night PB&J is an interactive music program designed for preschoolers to learn through singing classical nursery songs, dancing, and working with musical instruments. Research has shown that music programs can have a beneficial impact on the development of children’s executive functions (e.g., planning, working memory, inhibitory control) and academic skills and may influence academic performance outcomes.7 Research has also shown improvement of children’s behavior and social skills after participating in music and movement programming.8
PB&J provided special in school programming to six preschools through the partnership with CPP. The program lasted for a duration of 30 weeks with one visit per week for a total of 30 hours of programming per classroom between October 2021 and May 2022.
Preschoolers attending PB&J showed improvement in observed behavior across all domains of measurement according to 95% of Providers and teachers who provided feedback (Table 11). Survey items spanned 10 domains of measurement related to the TS GOLD© domains and responses were tallied across respondents. Participants were asked to endorse each item based on the question, “Please indicate if the PB&J program has made a positive impact on your preschoolers in the following domains.” Respondents could select “yes” or “no” Results by item and domain are listed in Table 11. Summary scores by domain are: 1) Social Emotional 96.4%, 2) Physical 100.0%, 3) Language 98.4%, 4) Cognitive 95.8%, 5) Literacy 83.0%, 6) Mathematics 95.5%, 7) Science and Technology 100.0%, 8) Social Studies 96.7%, 9) The Arts 97.7%, 10) English Language Acquisition 100.0%.
Manages feelings
Follows limits and expectations
Takes care of own needs appropriately
90.91%
100.00%
90.91%
Forms relationships with adults 11 100.00%
Responds to emotional cues
100.00%
Interacts with peers 11 100.00%
Makes friends 11 100.00%
Participates cooperatively and constructively in group settings 11 100.00%
Balances needs and rights of self and others
90.91%
Solves social problems 10 90.91%
Average for Domain
Demonstrates traveling skills
Demonstrates balancing skills
Demonstrates gross motor manipulative skills
Demonstrates fine motor strength
Uses fingers and hands
Average for Domain
Listens to and understands increasingly complex language
Comprehends language
Follows directions
Uses language to express thoughts and needs
Uses an expanding expressive vocabulary
Speaks clearly
Uses conventional grammar
Tells about another time or place
Average for Domain
96.36%
100.00%
100.00%
100.00%
100.00%
100.00%
Average for Domain
100.00%
100.00%
90.91%
100.00%
100.00%
100.00%
100.00%
100.00%
100.00%
Uses appropriate conversational and other communication skills 10 90.91%
Engages in conversation
100.00%
Uses social rules of language 11 100.00%
Average for Domain
Cognitive
Demonstrates positive approaches to learning
Average for Domain 10.82 98.36%
# of Yes Responses %
100.00%
Attends and engages 11 100.00%
Persists
Solves Problems
Shows curiosity and motivation
Shows flexibility and motivation
Remembers and connects experiences
90.91%
81.82%
100.00%
100.00%
100.00%
Recognizes and recalls 11 100.00%
Makes connections 11 100.00%
Uses classification skills 10 90.91%
Uses symbols and images to represent something not present 9 81.82%
Thinks symbolically 11 100.00%
Engages in sociodramatic play 11 100.00%
Average for Domain
Literacy
Average for Domain 10.54 95.82%
# of Yes Responses %
Demonstrates phonological awareness, phonics, word recognition 10 90.91%
Notices and discriminates rhyme 10 90.91%
Notices and discriminates alliteration
Notices and discriminates discrete units of sound
Applies phonics to concepts and knowledge of word structure
Demonstrates knowledge of the alphabet
Identifies letter sound correspondence
Retells stories and recounts details from informational texts
Average for Domain
Mathematics
Understands spatial relationships
81.82%
100.00%
72.73%
81.82%
72.73%
72.73%
Average for Domain 9.13 83.00%
# of Yes Responses %
90.91%
Demonstrates knowledge of patterns 11 100.00%
Average for Domain
Average for Domain 10.5 95.45%
Uses tools and other technology to perform tasks
Average for Domain
Social Studies
Demonstrates knowledge about self
# of Yes Responses
100.00%
Average for Domain 11 100.00%
# of Yes Responses %
100.00%
Shows basic understanding of people and how they live
Average for Domain
The Arts
Explores the visual arts
Explores musical concepts and expression
90.00%
100.00% Explore changes related to familiar people or places
Average for Domain 10.33 96.67%
# of Yes Responses %
90.91%
100.00%
100.00% Explores drama through actions and language 11 100.00%
Explore dance and movement concepts
Average for Domain
Average for Domain 10.75 97.73%
# of Yes Responses %
Demonstrates progress in listening to and understanding English 11 100.00%
Demonstrates progress in speaking in English 11 100.00%
Average for Domain
Domain Totals
Average for Domain 11 100.00%
10.47 95.36%
Survey participants also provided the following qualitative feedback about the program:
“The exposure to music and song was amazing. They worked on patterns and rounds. The kids were so excited to see the teacher each week. One of the kids went to the end of the year performance and she said it was so much fun. The kids’ circle listening skills got better from the beginning to the end.” CPP teacher
“Peanut Butter and Jam exposes our children to a variety of music. The songs encourage repetition and help build memory. Children express themselves through dance and movement; there is an increase in confidence and imagination.” CPP Provider
“PB & Jam Sessions mean a great deal to my class and provide a valuable service to the community as well. Children are offered an opportunity to engage with instruments and hear music that stimulates the brain for learning. Children love music and learn through movement. This program is truly an asset to any early childhood education program. The children are always excited to see Ms. Elizabeth each week and practice musical skills that contribute to their development and kindergarten readiness.” CPP teacher
“PB & Jam is a great way for our kids to explore music and movement. I believe the exposure to music has a wonderful impact on our community.” CPP Provider
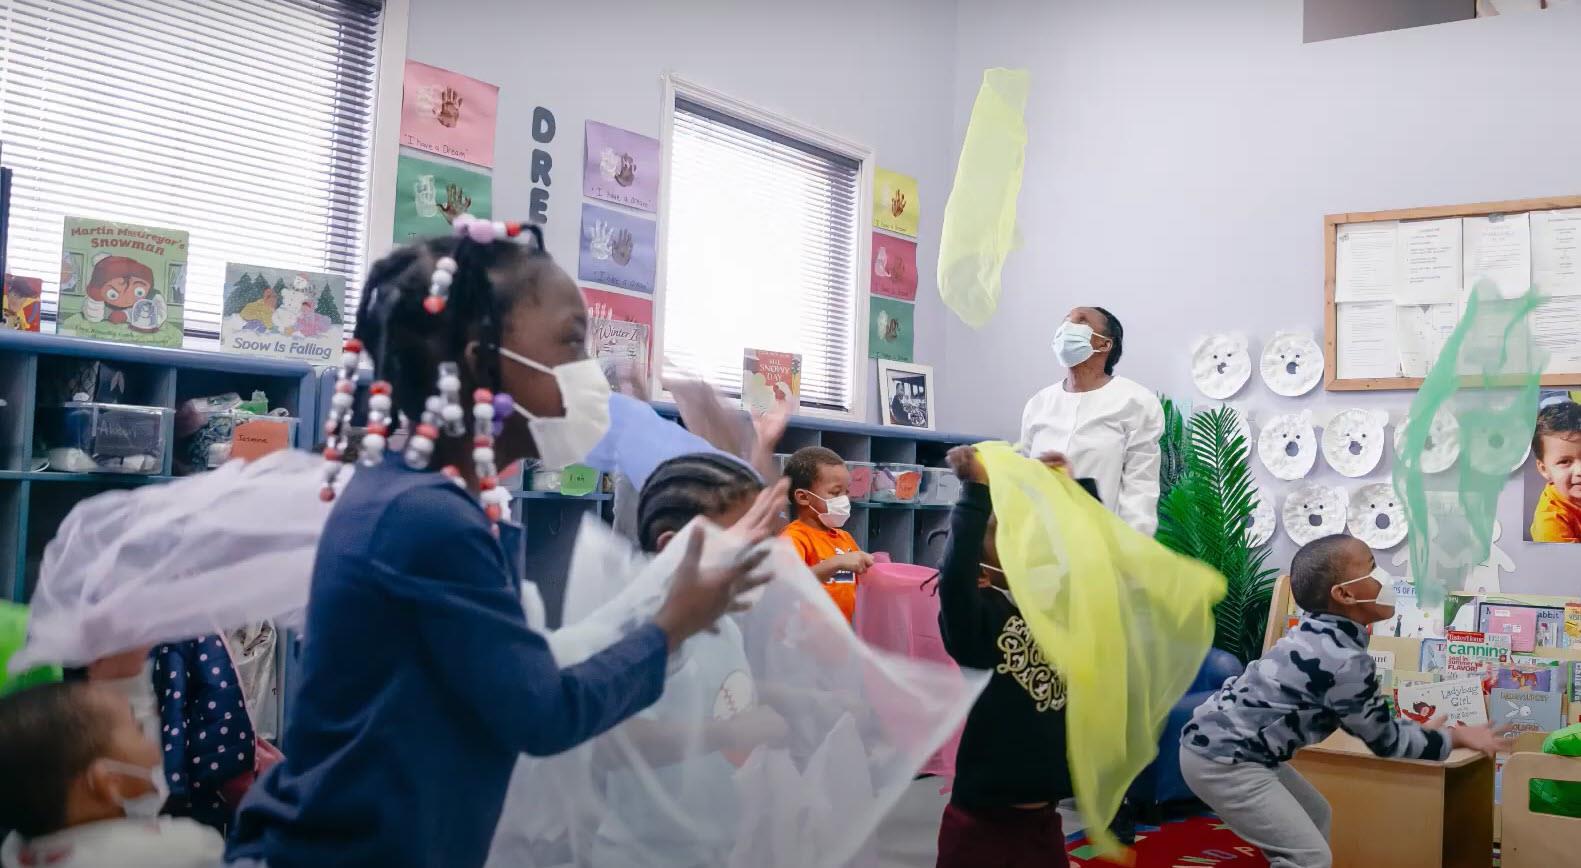
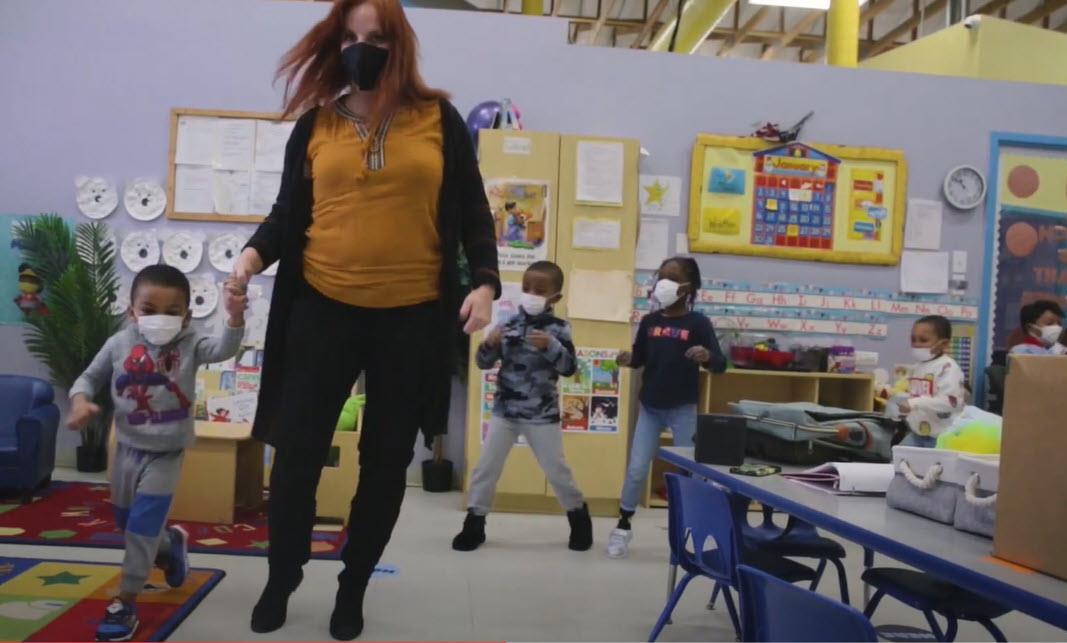
“The children have been listening, following directions, and working cooperatively through music and movement. The group performances impacted the community by inviting families to experience what the children are learning. I am pleased and impressed with Ms. Elizabeth and the program she provides.” CPP teacher
“Peanut Butter and Jam Sessions have brought joy to the children’s faces, [provided] opportunities for the children to learn to follow multi step directions using songs and movement in nontraditional ways. It also has helped to calm children and they learn to work with other children by sharing and taking turns. We absolutely love it. It also helps the teachers to incorporate more music and learning.” CPP Provider
The second part of the PB&J evaluation examined 26 program participants’ progress in six domains of the TS GOLD® preschool assessment. These preschoolers made improvements from Fall to Spring in five domains of measurement according to the TS GOLD® preschool assessment (Table 12).
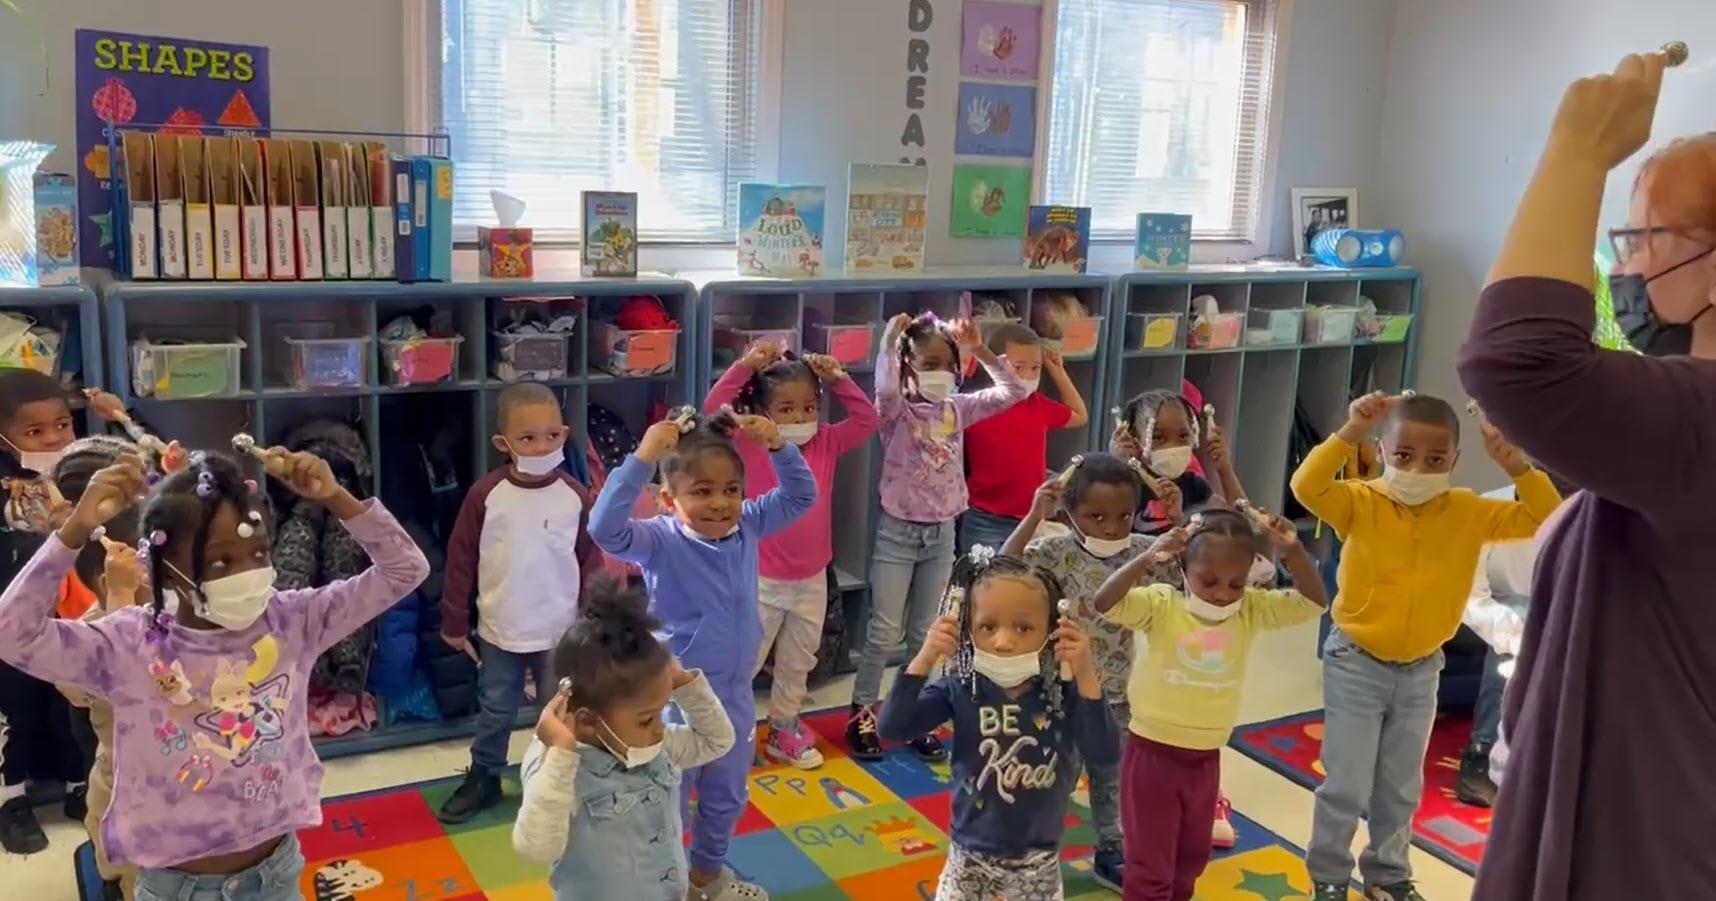
Domain
Social-Emotional
test was
was used
INNOVATIONS conducted focus groups with 60 preschool parents, teachers, and Providers during the spring of 2022. An additional 185 surveys were collected from these stakeholder groups. Focus group and survey participants included individuals from Tuition Assistance (TA) and Quality Improvement (QI) preschools in the CPP Community Provider network. Prospective parents and Providers who were not formally connected to CPP, but the majority of whom work/reside within the Cincinnati Public Schools (CPS) District geographic footprint, also participated in focus groups and surveys. Participants representedmore than 50 unique preschool programs.
Parents were asked, “Would you have been able to afford preschool if you had not received CPP tuition assistance?” and 73.3% said, “none of the cost” and 20.0% responded, “some of the cost” (Figure 31).
Figure 31. Would You Have Been Able To Afford Preschool If You Had Not Received CPP Tuition Assistance? (N=15)
All of the cost
of the cost
of the cost None of the cost
Parents, teachers, and Providers made the following comments about the impact of receiving TA:
• “I wouldn't have been able to afford a quality preschool program.” TA Parent
• “It lets us choose which preschool is best for us. [My son] has a late birthday, so we could not use public preschool. CPP allowed us to enroll him in a center before public preschool would accept him, so this closed a gap for us.” TA Parent
• “It was very expensive, with the tuition assistance, we can afford it.” TA Parent
• “TA children are more apt to attend preschool.” TA Provider
• “Some families like having multiple options that may better fit their needs.” TA Provider
Prospective parents identified “social skill development” (89.0%), “safe environment” (84.0%), and “motor skill development” (83.0%) as the top three aspects of a quality early educational experience (Figure 32). Parents commented that quality means “the teachers are prepared, and they have the credentials to do the job,” “they are following some sort of curriculum,” and “curriculum, schedule, and structure.”
Kindergarten preparation, safety, and social skills development have been ranked within the top three aspects of quality preschool since 2020; however, highly educated teachers were more highly ranked as meaningful aspects of quality preschool this year than in the previous two years.
Figure 33. TA Parents on Meaning of Quality Preschool (N=15)
Before Enrolling in CPP Rank Order
Kindergarten Preparation
Educated
Learning Social Skills
Learning Motor Skills
Preparation
Learning Social Skills
or 5-Star
Learning Motor Skills
INNOVATIONS continued to receive input on the external evaluation process this year by engaging CPP stakeholders in an Evaluation Advisory Panel. Six new panel members were invited to participate in monthly virtual meetings held from February through June 2022. The CPP Evaluation Advisory Panel consisted of two Providers, two teachers, and two parents connected to TA and QI preschools. One community consultant and CPP’s Data and Evaluation Manager, both of whom served on the Evaluation Advisory Panel in 2021, also participated on the panel Participants were compensated for their time and expertise
Many topics were discussed including the following:
• 2021 evaluation reports
• 2022 evaluation plan
• Survey administration and outreach strategies
• Preschooler survey items
• Preschool attendance, barriers, and supports
• Provider and teacher wages and benefits
• Parent engagement in learning outside of the classroom
Preschool Attendance: Panel members who were part of the CPP Evaluation Advisory Panel reported that most parents they knew send their children to preschool on a consistent basis; children rarely miss but those who do usually miss because of health reasons or family vacations. Panel members were not sure if an incentive program would help motivate parents of preschoolers. Some panelists suggested that positive personal stories about children making academic and social emotional gains from attending preschool regularly may help encourage parents to send their children regularly.
Wages and Benefits: Panelists shared their perspectives that inadequate wages and benefits are two of the top issues impacting teacher recruitment and retention. Participants stated that the pay and benefits discrepancies between home based and center based preschools are “wide and unfair.” There were also discussions about the barriers that home Providers face with being able to afford to grow their preschools and pay their staff a living wage (i.e., at least $15/hour) with benefits due to low voucher and tuition payments for their preschool programs. Providers and teachers shared that wage incentives such as the Teacher Promise Grant and Staff Support Fund are important to their retention and preschool program sustainability; however, they thought that the additional paperwork could be a barrier for some teachers and Providers, especially those who do not know how to navigate a computer well. One participant suggested that expanding direct teacher cash incentives to QI teachers to grow individually could help push the preschool forward to become high quality.
Participant Input and Ideas: Panel members also reviewed evaluation materials such as the preschooler survey. Their ideas informed the development of the final items and survey administration. The experiences shared and knowledge learned from the Evaluation Advisory Panel were invaluable and will have an ongoing impact on INNOVATIONS’ evaluation efforts and strategies.
INNOVATIONS recommends that CPP consider the following next steps and opportunities to continue to ensure equitable access to quality preschool education in Cincinnati. Note that some of the recommendations and next steps may be implemented with existing resources and capacity while others will require long term planning, funding strategies, and partnerships.
• Continue to Offer Programs and Supports that Make a Positive Impact on Children, Teachers, and Providers: CPP should continue to increase access and enrollment in quality preschool. Children who enrolled in CPP have greater outcomes in kindergarten readiness (KRA R in CPS) compared to those who are not enrolled in preschool. Teachers and Providers benefit from teacher grants and other supports that support recruitment, retention, and satisfaction.
• Support Pipeline Development and Succession Planning for Teachers: Feedback from Providers indicates difficulty in hiring and retaining quality staff. Feedback from 80% of TA parents surveyed indicated that parents believe that a quality preschool has welltrained teachers.
• Expand the Peanut Butter and Jam Program: Preschoolers in select sites who attended PB&J showed improvement in observed behavior across 10 domains of measurement according to 95% of Providers and teachers who provided feedback. In addition, preschoolers attending PB&J made improvements from Fall to Spring in five domains measured by the preschool assessment, TS GOLD®
• Focus on Equity: CPP’s Board Equity Policy states a strong commitment to ensuring preschoolers with the fewest resources benefit from CPP. To do this, CPP can further enhance parent resources and information, especially in quality gap neighborhoods as this was identified as a consistent barrier to enrollment.
• Define Kindergarten Readiness to Include the Whole Child: Social Emotional, Physical, and Cognitive domains are critical to a child’s kindergarten readiness as well as academic preparedness. CPP should continue to examine preschool outcomes that address these domains to gauge program effectiveness.
• Consider an Attendance Initiative Pilot: Early education literature and assessment data from local preschoolers associate regular preschool attendance with improved outcomes in kindergarten. CPP should consider piloting an attendance initiative to support parents in promoting regular attendance for all preschoolers. This initiative may be timely as COVID-19 may have impacted preschool attendance for some preschoolers.
Additional KRA R analyses were conducted on a cohort of 233 CPP preschoolers with parental consent using data obtained from the SugarCRM database owned by MetrixIQ. SugarCRM is the database that stores information collected by CPP. Relationships were examined between KRA R and preschool attendance, eligibility tier, parent/guardian employment status, Provider quality rating, and Provider pandemic site status.
Preschool attendance rates (total days attended/total days scheduled) were calculated for the 2019-20 and 2020-21 academic years. Figures A1-A2 illustrate higher performance on the KRAR for kindergartners with preschool attendance rates of 90% or higher in 2020-21 (during 4-yearold preschool) but not 2019 20 (during 3 year old preschool). CPP preschoolers with attendance rates at or above 90 percent in 2020 21 more frequently Demonstrated readiness (26.9%) and were On Track in Language and Literacy (37.2%) compared to those with attendance rates below 90 percent (25.0% and 19.3%, respectively).
The analysis of preschool attendance data also indicated that attendance rates were generally lower when members of the KRA R cohort were in 3 year old preschool (2019 20). During 3 year old preschool, the average attendance rate was 62.7% (SD=19.2%) with only 9.1% having an attendance rate at or above 90%. In contrast, the average attendance rate during 4 year old preschool was 84.8% (SD=15.5%) with 48.4% with attendance rates at or above 90%.
Figure A1. Overall KRA-R Performance Levels of CPP Participants by Preschool Attendance*
0% 10% 20% 30% 40% 50% 60% 70% 80% 90% 100%
37.5%
Attendance ≥ 90% (N=16) Attendance < 90% (N=159)
Attendance ≥ 90% (N=78)
27.7%
Attendance < 90% (N=83)
3-Year Old Preschool (2019-20) 4-Year Old Preschool (2020-21)
Preschool Attendance of KRA R Cohort by Year
Emerging Approaching Demonstrating
*Comprised of CPP preschooler data collected from the SugarCRM database owned by MetrixIQ.
60%
50%
40%
30%
20%
10%
31.3%
41.5% 37.2%
25.0% 0%
Attendance ≥ 90% (N=16)
Attendance < 90% (N=159)
Attendance ≥ 90% (N=78)
Attendance < 90% (N=83)
3-Year Old Preschool (2019-20) 4-Year Old Preschool (2020-21)
Preschool Attendance of KRA R Cohort by Year
*Comprised of CPP preschooler data collected from the SugarCRM database owned by MetrixIQ.
Eligibility tiers were calculated using family income data collected by CPP. Kindergarteners of families greater than or equal to 100% FPL were Demonstrating readiness (Figure A3) at a frequency of 31.1% and were On Track in Language and Literacy (Figure A4) at a frequency of 46.7% compared to 24.6% and 30.8% of kindergarteners of families less than 100% FPL, respectively
Figure A3. Overall KRA R Performance Levels of CPP Participants by Eligibility Tier*
0% 10% 20% 30% 40% 50% 60%
30.8% 24.4%
44.6% 44.4% 24.6% 31.1%
<100% FPL (N=65)
≥100% FPL (N=45) Emerging Approaching Demonstrating
*Comprised of CPP preschooler data collected from the SugarCRM database owned by MetrixIQ.
Figure A4. Percentage On Track in Language and Literacy of CPP Participants by Eligibility Tier*
46.7%
50%
40%
30%
20%
10%
0%
30.8%
60% <100% FPL (N=65)
≥100% FPL (N=45)
*Comprised of CPP preschooler data collected from the SugarCRM database owned by MetrixIQ.
Employment data were examined to determine the work status of parents and guardians. Data showed that kindergarteners with at least one employed guardian were Demonstrating readiness at a rate of 25.4% (Figure A5) and were On Track in Language and Literacy at a rate of 34.3% (Figure A6) compared to 22.9% and 37.1% of those with unemployed guardians, respectively.
Figure A5. Overall KRA-R Performance Levels of CPP Participants by Guardian Employment Status*
60%
50%
40%
30%
20%
10%
0%
31.4% 32.8%
45.7% 41.8% 22.9% 25.4%
Unemployed (N=35)
At Least 1 Employed Guardian (N=134)
Emerging Approaching Demonstrating
*Comprised of CPP preschooler data collected from the SugarCRM database owned by MetrixIQ.
Figure A6. Percentage On Track in Language and Literacy of CPP Participants by Guardian Employment Status*
60%
50%
40%
30%
20%
10%
0%
37.1% 34.3%
Unemployed (N=35)
At Least 1 Employed Guardian (N=134)
*Comprised of CPP preschooler data collected from the SugarCRM database owned by MetrixIQ.
All TA Providers have obtained SUTQ ratings between 3 and 5 stars. KRA R performance was compared between kindergarteners by the star rating of their most recently attended CPP Provider. Due to small sample sizes, 3 and 4 Star Provider attendees were combined into one group (N=39). Results indicated that KRA R performance levels (Figure A7) differed unexpectedly between 5 star Provider attendees (22.2% Demonstrating) and 3 and 4 Star Provider attendees (33.3% Demonstrating). However, the combined percentages of Approaching and Demonstrating did not differ (69.6% for of 5 Star Provider attendees and 69.2% for 3 and 4 Star Provider attendees). Furthermore, On Track percentages (Figure A8) showed a minimal difference between 5 Star Provider attendees (36.1%) and 3 and 4 Star Providers attendees (35.9%). The sample examined below was extremely homogeneous with 83.3% most recently attending a 5 star Provider. Thus, these findings should be interpreted with caution.
60%
50%
40%
30%
20%
10%
0%
30.8% 30.4% 35.9%
47.4% 33.3% 22.2%
Attended 3 or 4 Star Provider (N=39)
Attended 5 Star Provider (N=194)
Emerging Approaching Demonstrating
*Comprised of CPP preschooler data collected from the SugarCRM database owned by MetrixIQ.
Figure A8. Percentage On Track in Language and Literacy of CPP Participants by Star Rating* (2021-22)
60%
50%
40%
30%
20%
10%
0%
35.9% 36.1%
Attended 3 or 4 Star Provider (N=39)
Attended 5 Star Provider (N=194)
*Comprised of CPP preschooler data collected from the SugarCRM database owned by MetrixIQ.
To date, 49 TA Providers have provided instruction without extended closure during the pandemic (i.e., pandemic sites). Pandemic sites were required to obtain a special state license, maintain a reduced classroom size, and extended cleaning protocols, etc CPP preschoolers that attended a pandemic site performed better (27.5% Demonstrating and 39.6% On Track) than preschoolers that did not attend a pandemic site (21.8%% Demonstrating and 33.8% On Track; Figures A9 A10). These findings illustrate the impact of the COVID 19 pandemic on 2019 20 and 2020 21 preschoolers whose instruction was interrupted, consequently affecting their assessment scores upon entry into kindergarten in 2021 22.
Figure A9. Overall KRA-R Performance Levels of CPP Participants by Pandemic Site Status*
60%
50%
40%
30%
20%
10%
0%
31.0% 29.7%
47.2% 42.9% 21.8% 27.5%
Not a Pandemic Site (N=142)
Is a Pandemic Site (N=91)
Emerging Approaching Demonstrating
*Comprised of CPP preschooler data collected from the SugarCRM database owned by MetrixIQ.
Figure A10. Percentage On Track in Language and Literacy of CPP Participants by Pandemic Site Status*
60%
50%
40%
30%
20%
10%
0%
33.8% 39.6%
Not a Pandemic Site (N=142) Is a Pandemic Site (N=91)
*Comprised of CPP preschooler data collected from the SugarCRM database owned by MetrixIQ.
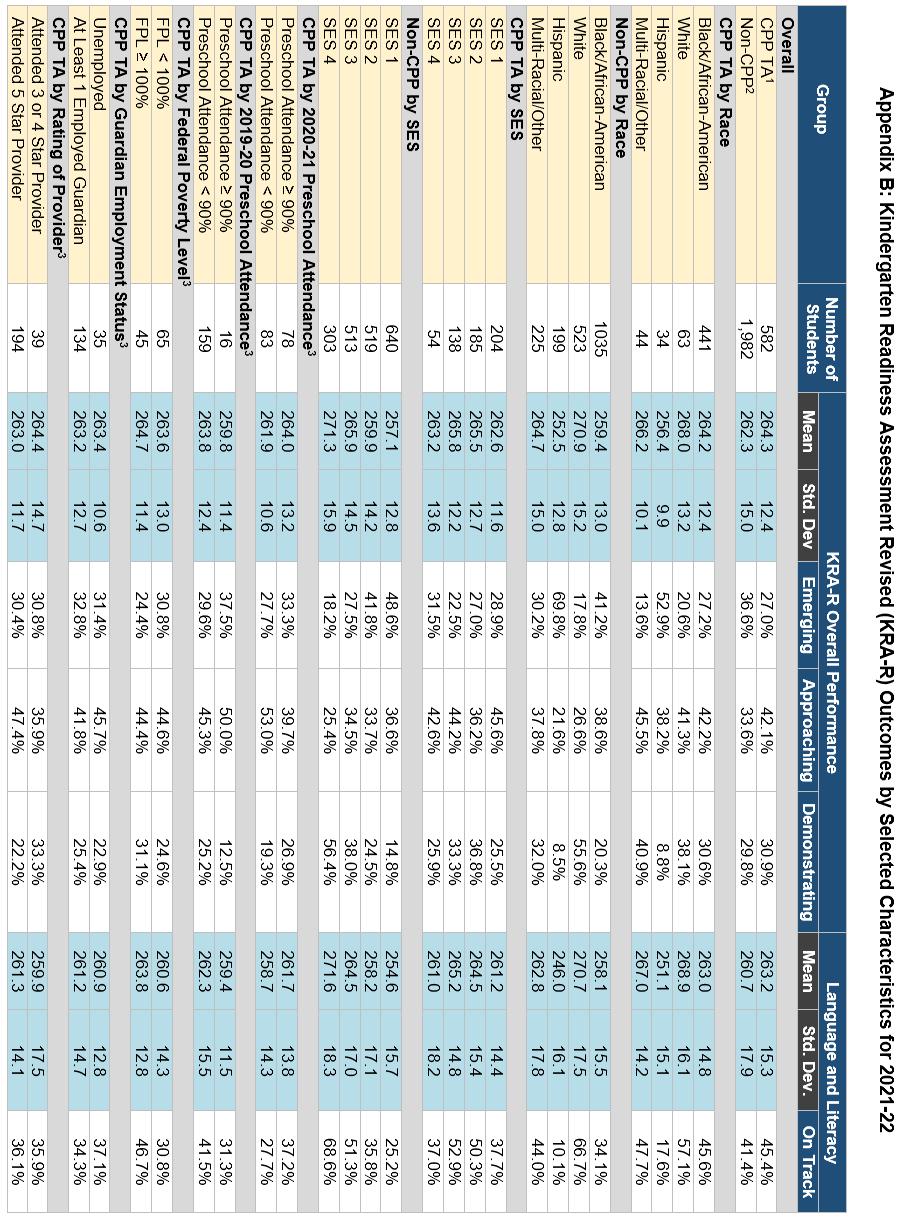
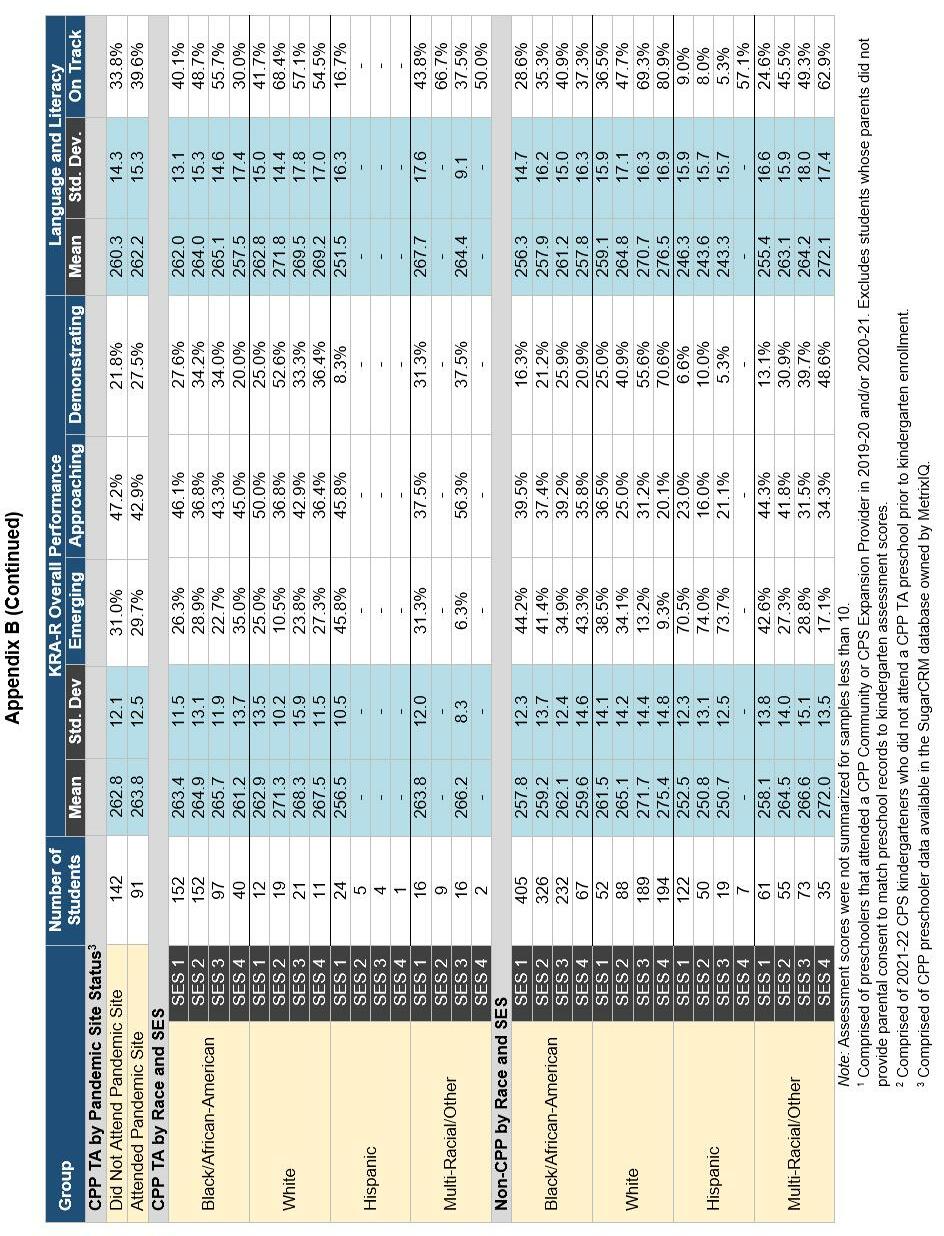
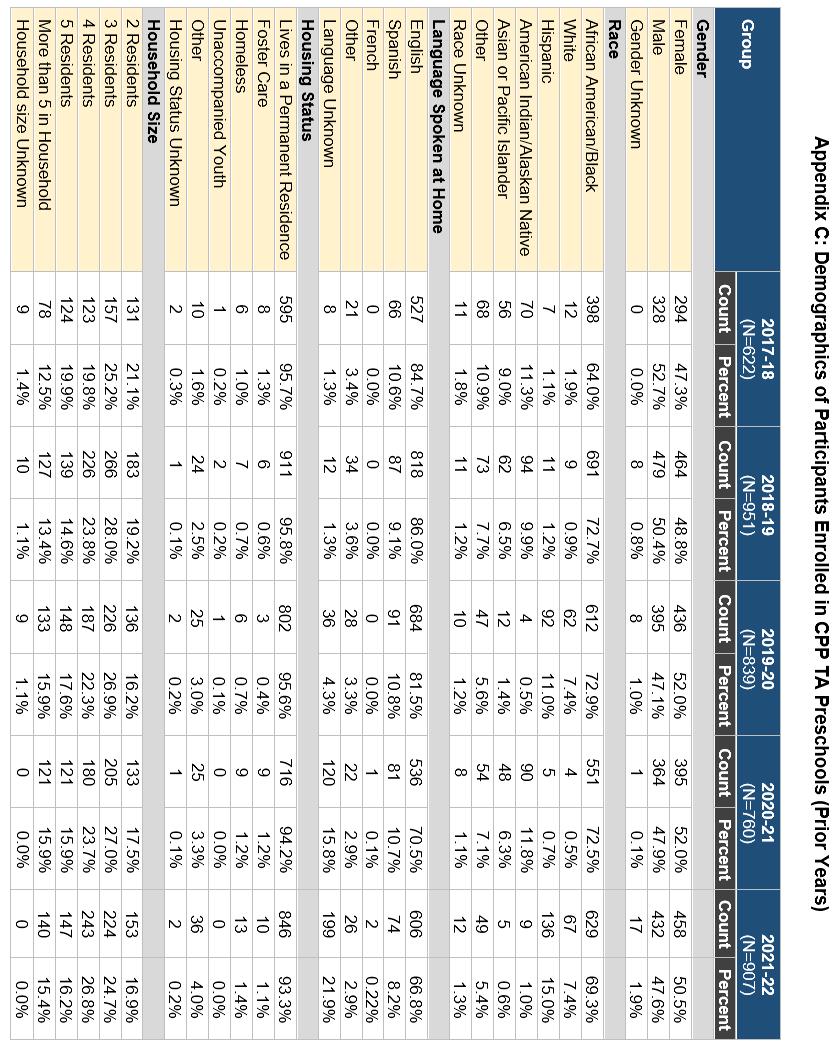

3T Learning Academy LLC 11 1/12/2022
Darlene Hill 10/20/2021
Donna Davis 2/1/2022
Funsize Imagination Childcare LLC 3/16/2022
Generation Hope Childcare and Preschool 11/9/2021
Gingerbread House Childcare LLC 8/11/2021
Gray's Creative Learning Daycare 8/10/2021
Happy Hearts & Bright Minds Child Care Center 3/15/2022
Imaginations at Work 8/26/2021
Jasmine Davis 10/4/2021
Kimberly Satcher 9/16/2021
Little Promises (Operated by Cincinnati Urban Promise) 8/12/2021
Maria Bradley 2/25/2022
Romero Academy at Resurrection Family Services, LLC 2/22/2022
Shannon Browner 5/9/2022
Sheila Solomon 12/10/2021
Sheree Williams 2/3/2022
Shining Stars Learning Center of Cincinnati 12/6/2021
Teefah's Learning Center 1/28/2022
Tender Tots Daycare 9/27/2021
These Precious Hands Child Development Center 1/30/2022
Tracy Savage 6/30/2022
Youthland Academy of Cheviot 2/22/2022
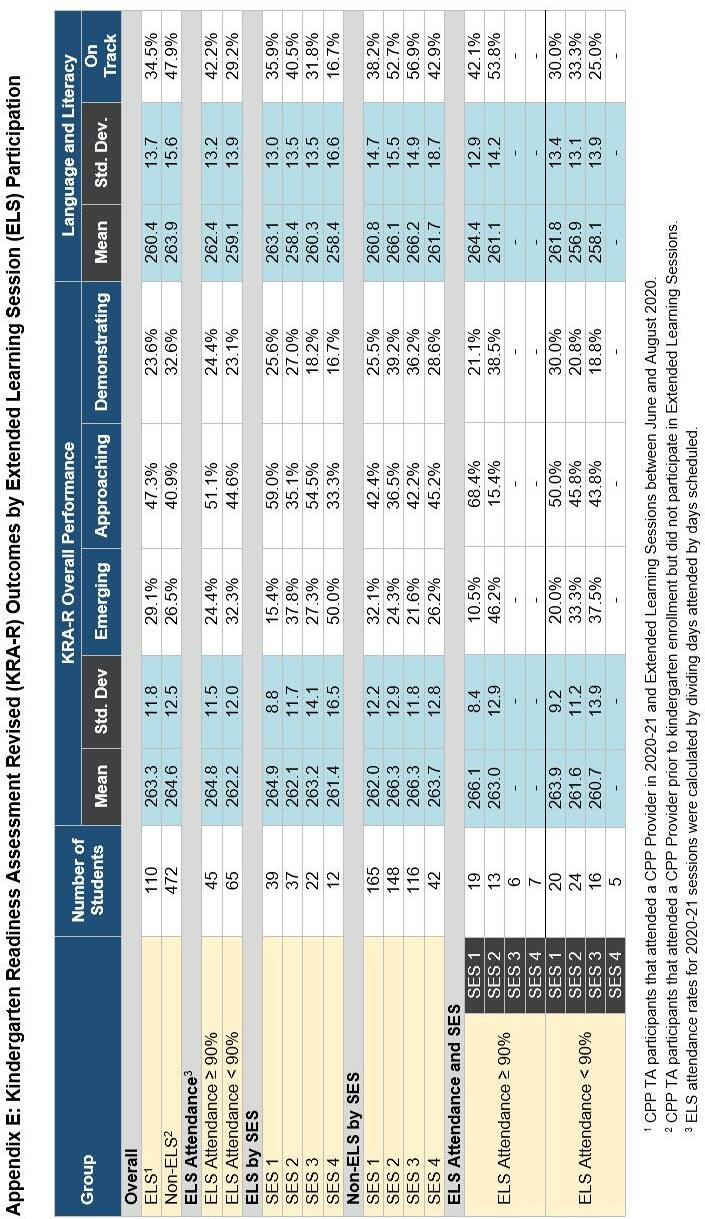

Report
Prospective Stakeholders - Evaluation and Results
Parent and Provider Awareness of CPP
of CPP Benefits
Perspectives on Preschool Quality
Barriers to Preschool Enrollment and CPP Engagement
Strategies to Engage Prospective Stakeholders
Parent and Provider Feedback for CPP
Impact of COVID 19 on Parents and Providers
Tuition Assistance Stakeholders Evaluation and Results
Impact of Tuition Assistance on Families
Perspectives on Preschool Enrollment, Quality, and Attendance
Barriers to Accessing Preschool and CPP Funding
Satisfaction with CPP Communication and Experience
for CPP
of COVID 19
Quality Improvement Stakeholders – Evaluation and Results
Perspectives on Preschool Enrollment, Quality, and Attendance
Barriers to Accessing Preschool and CPP Funding
Satisfaction with CPP Interactions and Supports
Impact of Statewide SUTQ Changes on Providers
of COVID 19
Preschooler Survey Results
Teacher and Provider Recruitment, Retention, and Pay
Environment Satisfaction
Fit Satisfaction
and Benefits Satisfaction
of Wages on Teacher Recruitment
Barriers to Paying Teachers Higher Wages
to Recruit Quality Teachers
to Retain Quality Teachers
Teacher Wage Changes in Response to Labor Shortages and Inflation
Emerging Teacher Perspectives on Early Childhood Education Profession

Key Findings, Next Steps,
Appendix A. Impact of Tuition Assistance on Families
Appendix B. Parent Understanding of Quality Preschool
Appendix C. Barriers to Accessing Preschool and CPP Funding
Appendix D. Barriers to Daily Preschool Attendance
Appendix E. Steps to Improve Student Attendance
Appendix F. Ways to Support Providers with Preschooler Recruitment
Appendix G. Stakeholder Satisfaction with CPP Interactions and Supports
Appendix H. Effectiveness of Providers Communicating with Families about CPP
Appendix I. Opportunities for Improvement
Appendix J. Ways CPP Could Expand Supports During COVID-19
Appendix K. Supports to Increase Teacher Retention
Appendix L. Impact of Stabilization Grants
Appendix M: Stakeholder Needs and Expectations
Appendix N. Stakeholders’ CPP Experience

Ensuring that Cincinnati Preschool Promise (CPP) is improving access to high-quality preschools and putting more preschoolers on a path to success requires having data to evaluate progress and impact. This report examines preschool parent, teacher, and Provider perspectives and experiences with CPP and early education and offers CPP, as well as the Greater Cincinnati community, insight into the ways in which the initiative could expand and enhance its supports and efforts in our region.
The CPP external evaluator, INNOVATIONS in Community Research and Program Evaluation (INNOVATIONS), conducted focus groups with 60 preschool parents, teachers, and Providers during the spring of 2022 An additional 185 surveys were collected from these stakeholder groups. Focus group and survey participants included individuals from Tuition Assistance (TA) and Quality Improvement (QI) preschools in the CPP Community Provider network. Prospective parents and Providers who were not formally connected to CPP, but most of whom reside within the Cincinnati Public Schools (CPS) District geographic footprint, also participated in focus groups and surveys. Participants represented more than 50 unique preschool programs.
All participants in the evaluation were asked to share their experiences with early learning and preschool, barriers to preschool enrollment, perspectives on high quality early learning and preschool, and ways in which CPP could further support early learning within their family or preschool. Other topics addressed included preschool attendance; teacher recruitment, retention, and pay; student teacher perspectives on future employment in early childhood education; aspects of parental trust in Providers; transportation to preschool; Provider marketing and enrollment support needs; preschoolers’ experience in preschool; satisfaction with CPP; and the impact of COVID-19. Focus group and survey data were analyzed and summarized
Parents
• Tuition Assistance is Key to High Quality Preschool Access and Affordability

• Safety and Transparency are Crucial to Parental Trust in Providers
• Parents Value Highly Educated Teachers
• Parents Need More Information about the Impact of Regular Preschool Attendance on Kindergarten Readiness
• Prospective Parents Need More Information about CPP
• Parents are Highly Satisfied with Their CPP Experience
• CPP Funds Impact Preschool Quality and Teacher Recruitment and Retention
• Marketing and Advertising Support Would Help Providers with Preschooler Recruitment and Enrollment
• Teachers Desire Direct Communication from CPP Recruitment, Retention, and Pay
• Inadequate Pay and Benefits Negatively Impact the Field

• COVID 19 Continued to Negatively Impact Stakeholders This Year
INNOVATIONS recommends that CPP consider the following next steps and opportunities to continue to ensure equitable access to quality preschool education in Cincinnati. Note that some of the recommendations may be implemented with existing resources and capacity while others will require long-term planning, funding strategies, and partnerships.
• Educational Opportunities for Prospective Parents: Help parents of preschool age children who are not yet enrolled in preschool select a quality preschool that meets their needs. Increase awareness of when and how to apply to preschool and the relationship between preschool, academic achievement, and later life success.
• Provider-Parent Communication Support: Provide Providers with practical strategies and recommendations to support effective parent communication. Providers could benefit from resources, tools, technology, and information to enhance their communication with parents.
• Develop Resources for Providers to Recruit Teachers and Families: Providers would benefit from teacher recruitment resources that highlight valued CPP supports for recruiting and retaining teachers (e.g., teacher grants, professional development, etc.) Resources and supports to help Providers recruit new children into preschool are also desired (e.g., advertising, online Provider application, etc.).
• Consider New Ways to Engage Stakeholders Throughout the Year: It will benefit CPP to regularly engage stakeholders to inform them about new supports and programs CPP will also get feedback about challenges in the field and have real time responsiveness to issues central to CPP’s mission.
• Advocate for the Unique Needs of Family Child Care Providers
• Continue Advocating for Preschool Teacher Wages and Benefits
• Consider Building Capacity for Inclusion of Future CPS Students Enrolled in Preschools Located Outside the CPS Footprint
• Expand Professional Development and Educational Opportunities for Stakeholders
The Cincinnati Preschool Promise (CPP) is a non profit organization working to ensure equitable access to high quality preschools so that all children in Cincinnati are prepared for kindergarten. To assist CPP with gaining a deeper understanding of its stakeholders’ needs, the initiative’s impact, and opportunities to enhance the impact, the CPP external evaluator, INNOVATIONS in Community Research and Program Evaluation (INNOVATIONS), conducted a mixed methods evaluation The evaluation included focus groups and surveys to collect information from eight stakeholder groups about their experiences and perspectives with early learning and CPP. Participants were preschool parents, teachers, and Providers enrolled in Tuition Assistance (TA) and Quality Improvement (QI) preschools within the CPP Community Provider network as well as prospective parents and Providers located within or near the Cincinnati Public Schools (CPS) footprint who are not members of the CPP Community Provider network or enrolled in preschool.
The prospective stakeholder focus group and survey items were designed to address the following key evaluation areas:
• Awareness of CPP
• Understanding of CPP Benefits
• Barriers to Enrolling or Engaging with CPP
The TA and QI focus group and survey items focused on evaluating CPP in the following key evaluation areas:
• Impact of Tuition Assistance on Families

• Parent Perspectives on Quality and Kindergarten Readiness
• Barriers to Accessing Preschool and CPP Funding
• Stakeholder Satisfaction with CPP Interactions and Supports
• Effectiveness of Providers Communicating to Families about CPP
Additional questions were asked to understand factors that impact teacher recruitment, retention, and pay; student teacher perspectives on future employment in early childhood education; aspects of parental trust in Providers; transportation to preschool; Provider marketing and enrollment support needs; and preschoolers’ experience in preschool.
Focus group and survey responses were compiled into this report which reflects the perspectives of the participant sample. Results for prospective, TA, and QI stakeholders were reported separately, as each group received different supports and had different levels of engagement with CPP. Trend data were reported where available. Findings were used to make recommendations for CPP and its early childhood education community partners.
Learning and understanding prospective stakeholders’ views and experiences with early learning will help CPP make informed decisions that are congruent with prospective stakeholders’ values and needs. The knowledge may also help CPP increase prospective stakeholders’ trust and engagement with the initiative, which will allow CPP to expand its Provider network and access to quality preschool. Throughout the prospective stakeholders’ section of the report, prospective parents will be referred to as “parents” and prospective Providers will be referred to as “Providers.” A total of 12 parents and 11 Providers participated in focus groups. Surveys were completed by 100 parents and 21 Providers. The results of the focus groups and surveys are summarized below.
Half (51.0%) of parents were Black/African American and 33.0% were white. Most (75.0%) parents had one or two children with an average age of 4.8 years. Nearly three out of five (62.0%) parents reported a household income below $50,000 (Table 1). Among Providers, 76.2% reported five or more years working at their current preschool (Table 2). Nine (42.8%) Providers reported a three , four , or five star Step Up To Quality (SUTQ) rating through Ohio’s Child Care Quality Rating System, and 13 (61.9%) Providers had seat vacancy for 3 to 4 year olds. Additional preschool characteristics are reported in Table 3.

Table 1. Prospective Parent Demographics (N=100)
Survey Item Response
Language
Household Education
Than High school
Employment Status
Household Income
Furloughed/Laid off
0.0%
Unemployed
1.0%
12.0% Other
Less than $20,000
34.0% $20,000-$34,999 14 14.0% $35,000-$49,999
14.0% $50,000-$74,999
13.0% $75,000-$99,999
7.0% $100,000 or more 18 18.0%
Number of Children One 40 40.0% Two 35 35.0%
Three or More 25 25.0%
Incomplete responses and/or
Survey Item Response Count Percentage
Years as a Teacher
Less than 1 year
1-3 years
Years at Current Preschool
0.0%
19.0%

9.5% 5-10 years 3 14.3% 10+ years 12 57.1%
3-5 years
Education Level
Less than 1 year
0.0% 1-3 years
19.0% 3 5 years 1 4.8% 5 10 years 5 23.8% 10+ years 11 52.4%
Race White/Caucasian 6 28.6% Black/African American 14 66.7% Hispanic/Latino
Do Not Wish To Report
High School/GED
Some College
Associates Degree
Bachelor’s Degree
4.8%
0.0%
9.5%
23.8%
4.8%
52.4%
Master’s Degree
Incomplete responses and/or missing
Data interpretation
4.8% Other CDA
4.8%
Table
Survey Item
Preschool Typea
A

B
Site Center
Site Center
SUTQ Star Ratingb
Star
Stars
Stars
Stars
Stars
Staff Education
High School/GED
College
Degree
Degree
Degree
Majority of Preschool Children’s Race
Financial Assistance Attendees Receive (Select All That Applye)
Seat Vacancy for 3-4 Year Old Children
Head Start
c
d
American
Seats
Seats
Seats
Seats
Reported
Incomplete responses and/or missing data excluded from calculations.
Data interpretation and generalizability is limited given small sample size.
19.0%
52.4%
19.0%
9.5%
14.3%
38.1%
4.8%
19.0%
0.0%
23.8%
28.6%
19.0%
23.8%
23.8%
4.8%
33.3%
61.9%
4.8%
4.8%
85.7%
0.0%
9.5%
9.5%
33.3%
23.8%
9.5%
28.6%
4.8%
Type A and Type B Providers are Family Child Care Providers who serve children in their homes.
Step Up To Quality (SUTQ) is a five star quality rating system for child care Providers in Ohio.
Publicly Funded Child Care (PFCC) is a childcare voucher program for parents in Ohio.
Ohio Department of Education (ODE) is responsible for licensing early care and education programs.
Respondents could select more than one choice. Cumulative total may exceed 100%.
Less than half (46.8%) of parents had heard of CPP prior to completing the survey. Results were similar to 2021 findings where 47.3% of parent were aware of CPP. Parents who were familiar with CPP first learned about the initiative through “family and friends” (11.7%) or a “CPP staff member or other Provider” (11.7%) (Figure 1). “Other” (6.4%) ways parents reported first learning about CPP were through the “newspaper”, “Cincinnati Children’s Hospital”, and “email”.
Most (81.0%) Providers had heard about CPP prior to completing the survey. This is a slight decrease from 2021 when 85.7% of participating Providers had heard about CPP. The top two ways Providers first heard about CPP were by “word of mouth” (38.1%) and “CPP staff member” (9.5%). “Other” (19.0%) ways Providers reported first learning about CPP were “4C for Children” and “email”.
0% 10% 20% 30% 40% 50%
40.4% 11.7% 11.7% 10.6% 6.4% 5.3% 5.3% 3.2% 1.1% 1.1%
Feedback from parents suggested that parents need more information about the beneficial programs and services that CPP provides to families. Parents made the following comments:
• “I found out about it from a friend, but she didn’t give me much information and I just never looked into it.”
• “I care about education but knew nothing of this.”
• “How do I get assistance?”
Although most Providers were aware of CPP before they participated in an evaluation activity, only 10 (47.6%) reported that they knew the steps to take to join the CPP network. Comments indicated that some Providers aren’t fully aware of CPP’s benefits and how to receive them. Related comments from Providers included:
• “I am unsure of where CPP is now and what it provides.”

• “Do they have mentors to help Providers?”
• “Do they have meetings that are open to the public?”
Four (19.0%) Providers reported that they have received resources, training, or information from CPP through 4C for Children and the CPP Provider application. Providers attended trainings for SUTQ and received supplies from CPP. Many Providers were connected with or receiving information, training, or programming from other local early learning initiatives and organizations including “4C for Children” (95.2%) and “The Children’s Home” (28.6%) (Figure 2). The CPP supports that would benefit Providers who are experiencing challenges at their preschools are described in the Stakeholders’ Barriers to Enrolling or Engaging with CPP section.
80%
60%

95.2% 28.6% 23.8% 19.0% 19.0% 9.5% 4.8% 4.8%
0%
Parents were asked, “What should CPP do to inform parents about CPP preschools and encourage them to consider a CPP Provider for their child?” Parents reported that CPP should “offer preschool site visits during school hours” (68.0%) and let parents “meet teachers and other staff” (68.0%) (Table 4). Parents also made the following comments about increasing awareness of CPP benefits:
• “Send out mailers or find some other way to make parents know that this even exists.”
• “Partner with elementary schools. Parents have different age children. Sending flyers or paperwork with the older school age children.”
• “Social media or somewhere on the website to opt in for automatic emails with updates about what they have been doing or what they are offering.”
Table 4. What Should CPP Do to Inform Parents About CPP Preschools and Encourage Them to Consider a CPP Provider for Their Child? (N=100)
Item Percent
Offer Preschool Site Visits During School Hours 68.0%
Meet Teachers and Other Staff 68.0%
Information Session About Tuition Assistance 59.0%
Opportunity to Review Curriculum 50.0%
Opportunity to Review Safety Protocols 50.0%
Meet Families Current Enrolled in a CPP Preschool 43.0%
Table 5 shows the ways in which CPP can promote and connect Providers with the supports and programs it offers. The top two responses were “information about grant opportunities” (76.2%) and “virtual trainings” (61.9%)
Table 5. Ways CPP Can Promote and Connect Prospective Providers with Supports and Programs Offered (N=21)
Item Percent

Information about Grant Opportunities 76.2%
Virtual Trainings 61.9%
Virtual Information Sessions about CPP 47.6%
Support to Maintain SUTQ Rating 42.9%
Opportunity to Meet CPP Providers 42.9%
Coaching/Mentoring 33.3%
Support Applying for Licensing 33.3%
Opportunity to Meet CPP Staff 28.6%
INNOVATIONS asked parents about their families’ early learning and preschool experiences, values, and preferences to better understand the reasons they have not enrolled their preschooler in preschool. Almost all (99.0%) parents said a quality early educational experience is “important” or “very important” for their child(ren) and 73.0% are “satisfied” or “very satisfied” with their child’s(ren’s) early learning and preschool experiences thus far (see Appendix for related comments). Only 54.6% of parents were aware of the research that shows that preschoolers who attended preschool regularly were 149.0% more likely to be ready for kindergarten compared to preschoolers who were absent more than 10.0% of days1 .
Parents identified “social skill development” (89.0%), “safe environment” (84.0%), and “motor skill development” (83.0%) as the top three aspects of a quality early educational
experience (Figure 3). Parents commented that quality means “the teachers are prepared, and they have the credentials to do the job”, “they are following some sort of curriculum”, and “curriculum, schedule, and structure”.
Figure 3. Prospective Stakeholders Perspectives about Quality Preschool
84.0% 89.0%
80%
0%
95.2% 90.5% 85.7% 81.0% 81.0% 61.9%
83.0%
Safe Environment Social Skill Development Kindergarten Readiness Motor Skill Development Credentialed Teachers SUTQ Star Rated
Prospective Parent (N=100)

Prospective Provider (N=21)
Like their perspectives on quality, parents reported “social emotional growth” (95.0%) and “safe and positive learning environment” (91.0%) as the top two aspects of early learning and preschool that they value (Figure 4).
Figure 4. Aspects of Early Learning and Preschool Valued by Prospective Parents (N=100)
Social Emotional Growth
Safe and Positive Learning Environment
Academics
Well-Qualified Teachers Motor Skill Develop
Outdoor Play Learning
Diverse and Inclusive Environment
Meaningful Family Engagement
95.0%
91.0%
85.0%
82.0%
81.0%
75.0%
73.0%
Half (50.5%) of parents preferred “public preschool” for their preschool aged child while 37.1% preferred “private preschool”, 5.2% preferred “church based preschool”, and 6.2% preferred “home” for early learning. The “other” (1.0%) respondent indicated that they did not have a preference (Figure 5). The majority (70.4%) of parents preferred a “full day program” rather than a “part day program” (29.6%) and 69.4% desired a program that offers
hours. Two out of five (41.8%) parents reported that preschoolers need two years of preschool to be prepared for kindergarten (Figure 6).
Figure 5. Preferred Place for Early Learning (n=97)

Preschool
Preschool
Figure 6. Years of Preschool Needed to Be Kindergarten Ready (n=98)
Year
Years
Years None
When asked about their preschool aged child’s current early learning environment, 32.3% of parents indicated that their child receives “family member care” while 30.3% are enrolled in “full day preschool”. Other types of early learning environments that parents reported included “playgrounds and museums”, “home”, “daycare”, and “speech and occupational therapy” (Figure 7).
Figure 7. Current Early Learning Environment of Prospective Parents' Children (n=99)
Member Care
Preschool
Preschool
The top three reasons parents enrolled their preschool aged child in their current early learning environment were “education is important” (62.0%) “safe and nurturing environment” (48.0%), and “need to work” (48.0%) (Figure 8). Other reasons were that “the program aligns with my parenting and teaching style” and “allows for both of my children to attend the same program”.
20%
0%
Figure 8. Prospective Parent Reasons for Current Enrollment Program or Arrangement (N=100)
62.0% 48.0% 48.0% 46.0% 46.0% 40.0% 30.0% 16.0% 10.0%
Consistent with findings from 2021, the top two reasons Providers believe that families enroll in their preschools are because they offer a “safe and nurturing environment” (90.5%) and parents “trust in the Provider” (85.7%) (Figure 9).
Figure 9. Prospective Provider Reasons Families Enroll at Their Preschool (N=21)
100%
80%
60%

40%
20%
0%
90.5% 85.7% 81.0% 81.0%
61.9% 57.1% 57.1% 52.4% 42.9%
Parent Concerns and Barriers to Enrollment
Looking to the future, almost half (49.0%) of parents have selected a preschool for their preschool-age child to attend starting in the fall of 2022. Of the 50 parents who have not
selected a preschool, the top factor preventing them from selecting a preschool was they are “on a waitlist for their program of choice” (38.0%) (Figure 10). “Other” (26.0%) reasons parents have not selected a preschool included “cost”, “we don’t know where to look and programs contacted haven’t called back”, “need IEP”, “need help enrolling”, “child is autistic”, and “the preschool she could attend gets out before I get off work and does not have transportation available”.
Figure 10. Factors Preventing Prospective Parents From Selecting a Preschool for Their Child to Attend in the Fall of 2022 (n=98)
Wait-List For Program of Choice
COVID-19

Other
Child Stays Home w/ Family
Child is Going to Kindergarten
Available Seats Do Not Align…
Child is Going to Babysitter
Parents reported a variety of concerns and barriers to enrolling their preschool age child in preschool with “COVID 19” (63.0%) being the top concern followed by “safety” (59.0%) (Figure 11).
Figure 11. Prospective Parent Concerns About Enrolling Their Child in Preschool (N=100)
Forty percent (40.0%) of parents identified “financial/cost of tuition” as the top barrier to preschool enrollment (Figure 12). Providers (76.2%) also believed that “financial/cost of tuition” hinders families’ ability to enroll their preschool aged child in preschool followed by “work and other caregiver’s schedules” (42.9%), “lack of trust or safety concerns” (38.1%), and “transportation” (38.1%) During focus groups, two Providers commented that “language barriers prevent parents from enrolling” and one Provider shared that “parents don’t realize
they have to register early and then can’t get in”. In addition, parents reported that “preschool operating hours” (35.0%), “transportation” (26.0%), and “preschool location” (23.0%) were barriers to enrollment. One in three (33.0%) parents reported “no barriers” to preschool enrollment for their family (Figure 12).
Figure 12. Prospective Parent Barriers to Preschool Enrollment (N=100)
35.0% 33.0%
23.0%
17.0%
10%

6.0%
To increase parental trust in preschool Providers, many (69.0%) parents shared that meeting one on one with their preschooler’s teacher or director would be helpful (Figure 13). Parents provided additional feedback on ways in which Providers can gain their trust in preschool programs:
• “Open house”
• “Being able to visit the classroom to see how my child is doing at any time”
• “A live video feed”
• “Transparency, certifications, open-door policy”
• “Safety, communication, fenced playground, low child-teacher ratio”
Figure 13. Prospective Parent Reported Ways Providers Can Gain Parental Trust in Preschool (N=100)
Meet One-on-One with Teacher/Director
Provider Has Years of Experience Background Checks Classroom Observation Safety Policies Secure Building
Meet Families Enrolled in the Preschool
62.0% 64.0% 66.0% 69.0%
Seventy five percent (75.0%) of parents reported that TA would help resolve the “financial/cost of tuition” barriers to preschool enrollment (Figure 14).
Figure 14. Barriers TA Would Help Resolve Among Prospective Parents (N=100)
Financial/Cost of Tuition
Access to Desired Preschool
Convenient Location of Preschool
Support Obtaining Documentation for Enrollment
Provider Challenges and Barriers Engaging with CPP
Providers reported a variety of challenges including “space for 3 4 year olds” (38.1%), “staff training and education” (33.3%), and “enrollment/filling open seats” (28.6%) (Figure 15). These challenges align with the top three areas Providers indicated CPP supports would be most helpful in meeting their needs in order to join the CPP network (Figures 16). In addition, Providers were asked, “If CPP could provide financial support to you, what type of financial support would be most helpful” and “teacher wage grants” (71.4%) was the top most helpful financial support selected (Figure 17). These findings align with focus group comments from Providers about challenges with “finding staff with experience”
Figure 15. Prospective Provider Challenges (N=21)
Space for 3-4 Year Olds

Staff Training/Education
Open Seats
Capacity
and Compliance
Management/Reporting Parent Engagement
Enrollment Documentation from Parents
Administering Child Assessments
Ability to Meet SUTQ Criteria
28.6% 33.3% 38.1%
Figure 16. CPP Supports Helpful in Meeting Prospective Providers' Needs (N=21)
Teacher Educational Resources

Professional Development Opportunities
Tuition Assistance Enrollment Help
Learning Materials
Step up to Quality Quality Improvement Coaching Technology Training/Access
Budgeting/Financial Training
Licensing Compliance/Compliance Issues
Banking/Electronic Funds Transfers
Figure 17. Most Helpful Financial Supports for Prospective Providers (N=21)
Teacher Wage Grants
Teaching Materials Technology and Software Quality Assistance Grants
Substitute Teacher Support
Outdoor/Gross Motor Equipment
Staff Training
Rent/Utilities
To understand how CPP could support Providers with their enrollment challenges, Providers were asked, “If CPP could provide support to drive recruitment and enrollment in your preschool, what supports would be most helpful?” Table 6 summarizes Providers’ responses to various types of support. Providers also estimated how much time they might need CPP’s support for recruitment activities and stated the following:
“A day”
“A month”
-3 hours per week initially”
“2 hours a day”
“6 hours”
weeks”
Somewhat helpful Slightly helpful Not at all helpful
Co branded materials (n=18)
CPP hosted recruitment fair at preschool (n=17)
Door-to-door recruitment material
distribution by CPP (n=17)
Not applicable
16.7% 33.3% 5.6% 16.7% 11.1% 16.7%
11.8% 29.4% 23.5% 5.9% 17.6% 11.8%
5.9% 47.1% 17.6% 5.9% 11.8% 11.8%
Assistance developing a preschool website (n=18) 22.2% 33.3% 0.0% 0.0% 22.2% 22.2%
Assistance creating a Facebook page (n=15)
Development of an online application (n=17)

Using smartphones and QR codes for recruitment (n=16)
Advertising (n=17)
13.3% 13.3% 6.7% 0.0% 40.0% 26.7%
23.5% 29.4% 17.6% 0.0% 11.8% 17.6%
18.8% 6.3% 6.3% 25.0% 25.0% 18.8%
17.6% 29.4% 17.6% 17.6% 11.8% 5.9%
Providers offered additional ideas about ways in which CPP could help them with recruiting new preschoolers:
• “Reaching those families who don't know where to find quality child care options to meet the needs of working parents.”
• “Send us families that have expressed interest in quality care.”
• “Help with ideas to recruit new families.”
• “We have full enrollment. We need more space.”
Providers made the following comments when asked, “What is the top thing that impacts your participation or stops you from applying to be a CPP Provider?”
• “The time it would take to enroll in the program to only help a few children.”
• “I did not want to go through the process, it felt overwhelming.”
• “I do not have enough information about what’s true and not true to make a decision.”
Results showed the best way for CPP to communicate information to parents (72.8%) and Providers (85.7%) is through “email”. When asked, “Where should CPP share information to reach more families with young children who are not currently enrolled in preschool?” parents reported “social media” (69.0%), “doctor’s office” (55.0%), and “library” (48.0%) (Figure 18). Providers reported “flyers” (66.7%) and “webinars” (47.6%) as the top two places where CPP should share information to reach more Providers not currently involved with CPP (Figure 19). Additional ways that Providers have had success with sharing information about their preschools included “KinderCare app”, “Facebook”, “Brightwheel”, “word of mouth”, and “daily take home folders”.
Figure 18. Where Should CPP Share Information to Reach More Families (N=100)
40% 50% 60% 70% 80%
0% 10% 20%
69.0% 55.0% 48.0% 41.0% 33.0% 32.0% 31.0% 28.0% 19.0% 19.0% 15.0%
Providers gave the following feedback about how CPP can improve its communication efforts with them and other preschool Providers:
• “Provide information on black radio stations and local news.”

• “Send newsletters to our emails.”
• “Hold open forum meetings, like a focus group, through Teams.”
• “Use social media and get providers involved in spreading the word.”
• “Have a phone tree to get providers involved, share how it can benefit programs.”
Parents made these comments when asked, “What is the most important thing(s) CPP should know about your child and family's needs and expectations about early learning and preschool?”:
• “I think all parents are very passionate about their kids and want the best for them, especially being so young. So just getting the information out there and helping us know what resources are available will be helpful for our kids to be successful and productive in society.”
• “I have a child that is autistic, nonverbal, and has sensory integration dysfunction. It has been so hard finding a school to trust and cater to his needs like I do. It’s scary.”
• “It’s important to know every family. Circumstances are different and having flexibility may help attract more families.”
• “Making it feel just as important as kindergarten. Feeling involved and investing in the experience, similar to elementary school.”
• “Transparency. Having clear and concise information so we can make a decision on our own.”
Providers were asked, “What is the most important thing(s) CPP should know about your preschool (i.e., needs, future plans, experience with CPP, etc.)?” and offered the following feedback:
• “I would like support with the improvement of my center and future needs to help grow my preschool.”
• “It is likely that we would not participate because the CPP process for application and reporting is time consuming and because we would not have many children who qualify.”
• “We have a three year waiting list. We need more space.”
• “We are a quality program with long term staff that should be compensated better for their hard work and dedication to our field.”
Providers (N=21)

reported
parents had about enrolling their preschool-age child in
increase compared to 2021, when 40.9% of parents indicated that COVID-19 was a concern for enrollment. COVID-19 also prevented 13.0% of parents from selecting a preschool for their child to attend in the fall of 2022 which
is a decrease from results in 2021 when 20.5% of parents indicated COVID 19 prevented them from selecting a preschool.
Parents also made the following comments regarding COVID 19:
• “With COVID, there were concerns. Like do we send them, are they safe, are they going to do everything they say they are going to do. I just worry.”

• “I think one of the barriers I faced was COVID 19. I would sometimes see kids that were sick. I worried about the handwashing and the masks. Those types of things really made me hesitant to continue to bring my child to a daycare.”
• “COVID and my son being too young to be vaccinated is the number one barrier for us.”
• “I want my child to be vaccinated for COVID 19 before I send them to school.”
For Providers, the pandemic impacted operating hours with 47.6% reporting their preschool operating hours had changed over the past year due to COVID-19. Few Providers (28.6%) reported having trouble filling open seats; however, 13 (61.9%) Providers stated that they had vacant seats for 3-4 year olds at the time of survey administration Nearly one in four (23.8%) Providers reported challenges with staffing capacity and finding staff with experience.

INNOVATIONS conducted focus groups with eight parents, eight teachers, and 10 Providers receiving TA from CPP. INNOVATIONS also collected surveys from 15 TA parents, 13 TA teachers, and 21 TA Providers. Providers that participate in CPP’s TA program are high quality and have received a three, four, or five star rating from Ohio’s SUTQ system. The results from the TA focus groups and surveys are summarized below.
More than half (55.1%) of all TA participants were Black/African American and 44.9% were white. Almost all (93.3%) TA parents reported having just one preschool aged child (Table 7). The most common education level of TA teachers and Providers was a bachelor’s degree (44.1%). Twenty one (61.8%) teachers and Providers also reported that they have obtained an early childhood education certification (Tables 8 9). Teachers and Providers represented all types of child care programs with 32.3% from Family Child Care Providers (previously Type A and Type B Home Providers), 29.4% from Single Site Centers, 35.3% from Multi-Site Centers, and 2.9% from School-Based Parochial Centers
Table 7. Tuition Assistance Parent Demographics (N=15) Survey Item Response Count
Race
White/Caucasian
Black/African American
Ethnicity Hispanic/Latino
Household Education Level
Hispanic/Latino
Less Than High school
School/GED
College
Degree
Degree
Degree
Employment Status
time
time
Home Parent
Number of Children

26.7
73.3
20.0
80.0
13.3
20.0
13.3
26.7
20.0
60.0
13.3
Survey Item Response
Years of Experience
Less than 1 year
years
5 years
10 years
years
Years at Current Preschool
Less than 1 year
3 years
5 years
10 years
years
Race White/Caucasian
American
Education Level
High School/GED
College
Degree
Bachelor’s Degree
Degree
Early Childhood Certifications
Employment Status
time
Incomplete responses and/or missing data excluded from calculations.
interpretation and generalizability
limited given small sample size.
15.4
30.8
7.7
46.2
15.4
15.4
38.5
30.8
69.2
30.8
15.4
23.1
0.0
61.5

0.0
0.0
38.5
0.0
15.4
92.3
7.7
Survey Item
Years of Experience
Less than 1 year
years
5 years
10 years
years
Years at Current Preschool
Less than 1 year
3 years
5 years
10 years
years
Race White/Caucasian
Black/African American
Education Level
High School/GED
College
Degree
Bachelor’s Degree
Degree
Early Childhood Certifications CDA
Employment Status
time
time
14.3
14.3
4.8
19.0
47.6
9.5
19.0
4.8
19.0
47.6
42.9
57.1
0.0
4.8
19.0
23.8
33.3
14.3
4.8
52.4

19.0
9.5
95.2
4.8
0.0
Parents were asked, “Would you have been able to afford preschool if you had not received CPP TA?” and 73.3% said, “none of the cost” and 20.0% responded, “some of the cost” (Figure 20)
All of the cost Most of the cost Some of the cost None of the cost
Parents, teachers, and Providers made the following comments about the impact of receiving TA:
• “For our family, it’s allowed us to work full time. Our son has grown so much, he is social, he has so many friends, and can write his name. He’s looking at cameras and practicing photography. I couldn’t provide that enrichment. We could not have afforded and given him that opportunity without CPP. My youngest is a baby and now I know he will be able to go to preschool.” TA Parent
• “I wouldn't have been able to afford a quality preschool program.” – TA Parent
• “It lets us choose which preschool is best for us. [My son] has a late birthday, so we could not use public preschool. CPP allowed us to enroll him in a center before public preschool would accept him, so this closed a gap for us.” TA Parent
• “It was very expensive, with the tuition assistance, we can afford it.” TA Parent

• “[CPP] gives the parent ease, so they don’t have to worry about the money. They can go to a place they can trust.” TA Teacher
• “A lot of children would not have the opportunity to attend preschool without CPP. One example, [a family] needed a longer day program and would not have been able to continue at the program without CPP TA.” TA Teacher
• “TA children are more apt to attend preschool.” TA Provider
• “Some families like having multiple options that may better fit their needs.” TA Provider

Parents’ knowledge and opinions about what makes a preschool program high quality and the importance of a preschool education for kindergarten readiness can influence their decision to enroll their preschooler in preschool and to prioritize daily preschool attendance.
Since 2020, TA parents have reported kindergarten preparation and a safe, nurturing environment as the top two reasons for preschool enrollment (Figure 21). Parent comments indicated other reasons they decided to enroll their preschooler in a preschool in the CPP Community Provider network (or preschool in general):
• “I believe children can learn as early as possible; we believe that in our family. Fortunately, CPP offers tuition assistance, and we have a preschool close to our home. It helps us send our child to school.”
• “For me, I let him join the preschool, I want him to learn English more and communicate with children and know how to play. He was very shy.”
• “I wouldn’t have been able to afford a quality preschool program without the tuition assistance. My child is safe and learning.”
• “I wanted my daughter to be able to learn skills before kindergarten and learn social skills and be with other kids her age, not just family.”
Table 10 shows the supports that Providers believe would be most helpful in driving recruitment and enrollment at their preschools. Providers also estimated how much time they might need CPP’s support for recruitment activities and stated the following:
1 hour per week
1-2 hours
2 days per week
2 hours
3 days in August
5 hours/week
8 hours per month
appreciate any amount of time.
are short of
twice about two or three hours.
Extremely helpful Very helpful
38.9% 33.3% 5.6% 5.6% 5.6% 11.1%
helpful Slightly helpful Not at all helpful Not applicable Co-branded materials (n=18)
CPP hosted recruitment fair at preschool (n=18)
Door-to-door recruitment material distribution by CPP (n=19)
Assistance developing a preschool website (n=19)
Assistance creating a Facebook page (n=19)
Development of an online application (n=19)

Using smartphones and QR codes for recruitment (n=19)
Advertising (n=19)
33.3% 33.3% 22.2% 0.0% 11.1% 0.0%
31.6% 26.3% 21.1% 10.5% 10.5% 0.0%
42.1% 10.5% 5.3% 5.3% 5.3% 31.6%
42.1% 10.5% 0.0% 10.5% 5.3% 31.6%
42.1% 31.6% 5.3% 5.3% 0.0% 15.8%
42.1% 26.3% 10.5% 5.3% 5.3% 10.5%
63.2% 15.8% 5.3% 10.5% 5.3% 0.0%
All (100%) TA parents reported that a high quality early educational experience was “important” or “very important” for their child. Kindergarten preparation and highly
educated teachers were the top two aspects of quality preschool reported by parents both before and after enrolling their child in a preschool within the CPP Community Provider network. The percentage of parents reporting help with fees and social skills development as meaningful aspects of quality preschool after enrolling in CPP increased by 40.0% and 26.7%, respectively (Table 11). Kindergarten preparation, safety, and social skills development have been ranked within the top three aspects of quality preschool since 2020; however, highly educated teachers were more highly ranked as meaningful aspects of quality preschool this year than in the previous two years.
Kindergarten Preparation 73.3%
Highly Educated Teachers 66.7%
Kindergarten Preparation
80.0% Highly Educated Teachers
80.0% Child Learning Social Skills 3, 4, or 5-Star Rated Provider 53.3%
Safe Environment 60.0%
Child Learning Social Skills 53.3%
Child Learning Motor Skills 46.7%
Help with Fees 13.3%
73.3% Safe Environment
66.7% 3, 4, or 5-Star Rated Provider
53.3% Child Learning Motor Skills
53.3% Help with Fees
All (100%) TA teachers and Providers were aware that preschoolers who attend preschool regularly are significantly more likely to be ready for kindergarten and have much greater success later in life compared to preschoolers who do not attend regularly. However, only half (53.3%) of TA parents were aware of this connection All (100%) parents reported that this knowledge makes them more likely to send their preschooler to preschool every day. Statements made during focus groups indicated that the majority of Providers have few issues with regular attendance and 58.1% reported that they take steps to improve attendance including offering incentives like gift card raffles, calling parents when a child misses school, offering transportation, and reminding parents of the importance of preschool attendance for kindergarten readiness. According to parents, 92.9% “agree” or “strongly agree” that their preschooler’s preschool encourages them to have their preschoolers attend preschool every day.
All (100%) parents reported that having their preschooler attend preschool daily is important with 40.0% reporting their preschooler misses an average of “zero days” each month and 20.0% reporting their preschooler misses an average of “1 2 days” each month. Teachers and Providers reported 15.2% and 60.6% of preschoolers miss an average of “zero days” or “1 2 days” each month, respectively. These findings are similar to results reported last year Participants were asked to identify the barriers that prevent preschoolers from attending daily More than half (66.7%) of parents reported between one to four barriers to preschool attendance (mean = 1.7). Over the past three years, “health related issues” were reported as the top barrier to daily preschool attendance (Figures 22 and 23). Regarding transportation

to regular
parents reported that they drive their own car to drop their preschooler
at preschool.
in five (20.0%) parents also reported that they walk their preschooler to preschool. On average, it takes parents 12.1 minutes to take their preschooler to preschool.
the impact of COVID 19 on preschool attendance, 40.0% of parents reported
19 as a barrier that prevented their preschooler from attending
from parents indicated that some

school
Figure 23. TA Teachers & Providers Barriers to Daily Attendance
When asked, “What could CPP do to help your family (or other families) attend preschool every day” TA parents participating in the focus groups suggested transportation supports such as gas cards and bus passes; however, some Providers shared that they have not experienced much success with improved attendance when parents received these supports in the past. One parent suggested “covering more schools with the CPP program so that families can find a preschool close to their home.” Teachers and Providers also shared ideas for improving preschooler attendance:
• “Some kind of incentive or a gift card. A little incentive can go a long way. Helping parents know what schools are closest to their house. [Provide] an umbrella or raincoat.”

• “Provide gift cards.”
• “Deliver boxes of food to parents.”
Surveys also asked respondents to select the supports that they felt would help increase daily preschool attendance. Trend data show that the top responses from 2020 2022 were “financial incentive for attendance” and “transportation” (Figures 24 and 25).
TA Parent
that Would Help
Parents were asked, “What barriers have you faced when accessing preschool?” One in four (26.7%) said they have not personally faced any barriers to preschool access. For TA parents who have faced barriers, the inability to afford preschool has been the top trending barrier to preschool access since 2020 (Figure 26). Parents
also asked, “What barriers have you heard that other parents with preschool aged children
faced when accessing preschool” and “could not afford preschool”
(40.0%). Parents reported “opportunities for classroom observations” (66.7%), “opportunities to meet one on one with their child’s teacher or preschool director” (60.0%), and “Provider has years of experience” (60.0%) as the top three ways that Providers can build parental trust in their preschool program (Figure 27). Parents also reported additional factors that create trust in a Provider:
• “I watch the teachers engage with them and cameras.”
• “At the beginning I was afraid, but after monitoring using ClassDojo app, I trust the Provider.”
• “Let families know everything that happens at school. Hold parent teacher conferences.”
for Other
2021 (N=59) 2022 (N=34)

Parents also offered their thoughts regarding preschool age children who have not been enrolled in preschool and potential concerns that their parents may have about preschool:
• “It might be trust or it might be the distance or teacher qualifications or the reputation of the center or the hours.”
• “Because they have to pay money. It’s not like public school.”
• “I don’t think [CPP] is widely advertised and people think they are over the income and won’t qualify to get assistance. It’s also hard to ask for help. I want to be able to afford this amazing preschool, but I don’t want to admit that I need help or that it’s going to be a hard process to apply.”
Figure 26. TA Parent Barriers to Accessing Preschool 2020-2022
29.0% 42.0%
26.7%
12.5% 6.3% 0.0%
(N=93) 2021 (N=48) 2022 (N=15)

0.0% 0.0%
Figure 27. Ways TA Providers Can Gain Parental Trust (N=15)
Meet one-on-one with teacher/director Classroom observation
Provider has years of experience
Meet families enrolled in the preschool Secure building
Background checks Safety policies
2.0%
46.7% 46.7% 46.7% 53.3% 60.0% 60.0% 66.7%
The majority (73.3%) of parent survey respondents reported that they have not experienced any barriers to accessing CPP TA. Low percentages of parents facing barriers to accessing CPP TA is a positive trend that has been documented since 2020 (Figure 28).
CPP continued to offer a variety of services and programs to support teachers and Providers with professional development, continuing education, coaching, wage supplements, and COVID-19 cleaning supplies A total of 12 TA teachers identified themselves as lead teachers on the survey, making them eligible to receive the Teacher Promise Grant (TPG). Of this total, 66.7% lead teachers reported having received the TPG while 25.0% had not and another 8.3% were unsure. TA teachers who reported “no” were asked, “What prevented you from applying for the TPG” and their reasons included “I just received the information”, “never heard of it”, and “it’s in the works right now”. Eleven TA Providers also reported that they are lead teachers and have received the TPG. Teachers and Providers expressed great satisfaction with the TPG process and support provided. Other areas in which Providers reported challenges with accessing CPP services and programs were “communication about ReadyRosie” and “delays in receiving classroom supplies from their wish list”.
Parents’, teachers’, and Providers’ satisfaction with “phone”, “email”, “in person”, and “newsletters/flyers” communication has remained steady over the past three years. Figures 29 and 30 show the results for TA stakeholders who responded “satisfied” or “very satisfied” about each type of communication. Parents rated their satisfaction with their Provider’s communication regarding CPP
teachers
ommunicating with CPP
their satisfaction

Parents gave overwhelmingly positive feedback about their Provider’s communication with multiple parents saying that their Provider is “doing an excellent job” . Survey results showed that 73.3% of parents were “satisfied” or “very satisfied” with their Provider’s communication. Providers reported that they share information about CPP with parents on their preschool application and through emails, flyers, phone calls, text messages, social media, newsletters, and in person communication. Parents were asked about the effectiveness of teachers’ and Providers’ communication about CPP as well as the types of information they wish to receive from their preschool or CPP. They offered the following feedback:
• “Their communication is very effective. I get reports from the center about my child. They give me resources, books, and activities.”
• “I just get the information at the beginning when I registered my son there. They told me about the feedback session. That’s it. No other information.”
• “For summer programs, I think CPP provides something. I’d like to know about it. Are there any other services provided? I know there is a website, but is there more information? This would be helpful for families.”
• “Better communication about the changes in payment amount.”
• “We use an app. I get pictures daily. The teacher will text a picture and show her during the day. CPP will send postcards in the mail, birthday cards, events, workshops. I love the communication both from the school and CPP.”

There was a consensus during focus groups
CPP’s communication with teachers and Providers has been satisfactory. Teachers and Providers shared the following statements about ways that CPP could improve its communication efforts:
• “CPP gives too much information to parents about TA dollar amounts that Providers receive. Parents have made inappropriate comments about how much money I’m getting because of their child.”
• “I tell parents about CPP sponsored programs, but it’s hard to communicate to parents because Providers don’t receive information from CPP to share with parents.”
• “At the time for signing back up, there was not enough advanced notice.”

• “Key information like required classes should be called out at the beginning of the newsletter.”
• “What about other agencies and services that [CPP] works with that our parents may need help from? I’d like to know what other things they offer other than money. Do they help educate parents or have supports for parents that might have a struggling child? Is there support in other ways to help parents get their child ready for school?”
also reported being
process”,
preschoolers’ CPP
with their experience with the CPP
center options” since 2020
0%
89.0%
73.3%
Preschool Center Options Tuition Assistance Application Process Provider Communication
2020 (N=93) 2021 (N=48) 2022 (N=15)
Teacher and Provider Satisfaction with CPP Experience Teachers’ and Providers’ satisfaction with the supports they have received from CPP has increased over the past three years. Satisfaction with “SUTQ support” increased by 31.4% between 2020 and 2022 while satisfaction with “staff incentives” increased by 24.1% across those years. Providers were also “satisfied” or “very satisfied” with the “staff support” received from CPP which increased by 32.7%. Satisfaction ratings for “professional development opportunities” also remained consistent with the previous year (Figure 32). Stakeholders shared that they desire more flexible training opportunities (e.g., on-demand, self-paced, virtual, and in-person) and new topics such as mental health, stress management, and child development for parents When asked how CPP supports were beneficial, one Provider said, “I love the free resources. They add quality to my program. I feel like I can support my staff better by providing them with bonuses and trainings and then we’re able to provide better quality education for my students.” See the Appendix for additional comments.

Figure 32. TA Teachers and Providers Responding "Very Satisfied" or "Satisfied" with CPP Supports 2020 2022
(N=34)

support data were collected from Providers only (N=21).
Not applicable
responses were excluded from analysis.
Results showed that TA stakeholders have had overall positive experiences with CPP and stakeholders feel that they have greatly benefited from the initiative’s programs and services. Many (75.8%) teachers and Providers see CPP as a partner and have been satisfied with their CPP partnership. Suggestions about ways that CPP could be a better partner included more frequent check ins, emailing teachers directly, assistance with explaining the TA application and absence policy to parents, and clear communication about training and funding opportunities and requirements (see the Appendix for quotes). Additionally, survey trends suggest that parents are generally pleased with the amount of TA received as a low percentage of parents reported “increased tuition assistance” as an area in which CPP could improve (Figure 33).
Figure 33. TA Parent Reported Areas of Improvement for CPP 20202022
Increased Tuition Assistance
Centers in Area Advertising

Nearly one in two (46.7%) TA parents reported feeling hesitant to send their child to preschool due to the COVID 19 pandemic. However, parents felt supported by CPP throughout the pandemic:

• “Yes, [we received] Books Alive, ABC Mouse, free internet, and ReadyRosie.”
• “A book every month.”
• “My son went last year. I don’t know how the funding works, but we were able to get a spot even though the class size was cut in half. They provided supplemental things we could do at home, daily Facetime/Zoom with the kids.”
• “I’m thankful that they still had the funding during the pandemic.”
• “Coat drive, laptop information, and food. I’m not sure if this was from the preschool or CPP.”
In response to the financial challenges that the COVID 19 pandemic exacerbated for preschools, grants and stabilization funds for operating costs and workforce recruitment and retention were made available from ODJFS and other sources. Almost all (90.5%) TA Providers applied for these funds in the past year with 16 (88.9%) reporting that the grant funds supplemented their CPP funds. Only two (11.1%) TA Providers said the grant funds supplanted their CPP funds, likely because they did not have any TA eligible preschoolers enrolled during that time which was mentioned during the focus groups. The grant funds helped Providers remain open due to decreased enrollment, purchase COVID 19 tests and protective supplies, fund their payrolls, improve their preschools with new classroom materials, among other benefits (See the Appendix for quotes).
INNOVATIONS engaged stakeholders from QI preschools in the CPP Community Provider network. The QI preschools are unrated, one, or two-star rated preschools that receive SUTQ supports and coaching through CPP and its partners to improve the preschools’ quality rating. High-quality rated Providers are eligible to enroll CPP preschoolers and accept CPP TA funding Understanding QI stakeholders’ perspectives and experiences with early childhood education and CPP is important because there are many QI Providers in the Cincinnati community that enroll numerous preschoolers in their programs. As CPP’s vision is to make equitable, high quality preschool accessible for all children, QI Providers are an integral part to achieving that vision as they partner with CPP to improve their quality rating.
Focus group and survey invitations and reminders were sent via email, phone calls, flyers, and the CPP Provider newsletter. Even though few QI stakeholders registered to participate, small focus groups and interviews were held with those who accepted the invitation including two parents, three teachers, and six Providers. Surveys were completed by five parents, three teachers, and seven Providers. Results from the focus groups and surveys are summarized below. Since participation was voluntary, participants could refuse to respond to the questions. Missing data were excluded from calculations. Findings should be interpreted with caution due to the small sample size.
All (100%) 10 QI teachers and Providers were employed full-time and six reported that they have worked at their current preschool for five or more years. Nine QI teachers and Providers have completed some college or obtained a bachelor’s or master’s degree and six have 10 or more years of experience (Table 12). Six QI teachers and Providers were Type A or Type B Family Child Care Providers, three were at Single Site Centers, and one was at a School Based Parochial Center. Parent demographics were excluded to protect participant confidentiality.
Table 12. Quality Improvement Teacher and Provider Demographics (N=10)*
Survey Item
Years of Experience
than 1 year
years
5 years
10 years
years
Years at Current Preschool
than 1 year
3 years
5 years
10 years
years
American
0.0
10.0
20.0
10.0
60.0
0.0
20.0
11.1

33.3
10.0
Education Level
High School/GED
Some College
Degree
Bachelor’s Degree
Master’s Degree
Early Childhood
Employment Status
time
responses and/or missing data excluded from calculations.
interpretation and generalizability
limited given small sample size.
60.0

0.0
20.0
10.0
0.0
100.0
INNOVATIONS surveyed QI parents to understand the reasons why they enrolled their preschooler in preschool. All (100%) five QI parents said they enrolled their preschooler in preschool because they “need to work”. Three (60.0%) parents selected their preschooler’s current preschool because it’s “located close to their home or job” . One parent reported that the preschool’s alignment with their religious beliefs was a deciding factor in their enrollment choice. Four (80.0%) QI parents were aware that their preschool Provider partners with CPP. Providers made the following comments about the reasons they have heard from families about why they decided to enroll in a preschool in the CPP Community Provider network or preschool in general:
• “Parents want a smaller, more intimate environment.”
• “Parents enrolled children in order to prepare them for kindergarten.”
• “Being around other children helps them grow. Also, just getting them ready for kindergarten.”
• “They just feel more comfortable with the surroundings, with the atmosphere, with being at home with the more one on one type of help that they need.”
• “Most of my placements I’ve had since they were babies, so as they grew and the parents saw the progress that they were having with me, they kept them here.”
Table 13 shows the supports that QI Providers believe would be most helpful in driving recruitment and enrollment at their preschools. Providers voiced their interest in having CPP support them with marketing and recruiting new preschoolers to their preschool and estimated the amount of time that they might need CPP’s support:
2 hours
Extremely helpful Very helpful
Somewhat helpful Slightly helpful Not at all helpful
Not applicable
Co branded materials (n=6)
CPP hosted recruitment fair at preschool (n=6)
Door-to-door recruitment material
distribution by CPP (n=6)
Assistance developing a preschool website (n=6)
Assistance creating a Facebook page (n=6)
Development of an online application (n=6)

Using smartphones and QR codes for recruitment (n=6)
Advertising (n=6)
50.0% 33.3% 16.7% 0.0% 0.0% 0.0%
16.7% 50.0% 33.3% 0.0% 0.0% 0.0%
33.3% 50.0% 16.7% 0.0% 0.0% 0.0%
33.3% 50.0% 16.7% 0.0% 0.0% 0.0%
33.3% 33.3% 33.3% 0.0% 0.0% 0.0%
33.3% 66.7% 0.0% 0.0% 0.0% 0.0%
33.3% 50.0% 16.7% 0.0% 0.0% 0.0%
50.0% 50.0% 0.0% 0.0% 0.0% 0.0%
A high quality early educational experience was “very important” to all (100%) five QI parent respondents. A “safe environment” was the top aspect of quality preschool reported by five (100%) QI parents followed by “child learning social skills” (80.0%). Focus group feedback about what quality preschool means to parents aligned with the survey results:
• “Since enrolling my child in preschool, academics are less of a priority. A warm, safe environment comes first.”
• “Safety. Teachers have proper education about training.”
• “My kids are school ready. Learning through play. Building social skills that they will need later.”
• Making sure that they daycare is not only SUTQ on paper, but they are actually doing what they say they are doing.”
All (100%) QI teachers and Providers were aware that preschoolers who attend preschool regularly have greater success in life than those who do not attend regularly; however, only two of five (40.0%) QI parents were aware of this connection. When asked, “Does this knowledge make you more likely to send your child to preschool every day?”, four (80.0%)
QI parents responded “yes”. Four (40.0%) teachers and Providers reported that their preschools are taking steps to improve attendance including communication about the importance of daily attendance for kindergarten readiness, sharing children’s progress, calling parents when their child misses preschool, and working with parents’ work schedules.
All (100%) QI parents “agree” or “strongly agree” that their preschooler’s preschool encourages daily preschool attendance.
Daily preschool attendance was important to all five (100%) parents with one (20.0%) reporting their preschooler misses an average of “0 days”, three (60.0%) reporting their preschooler misses an average of “1 2 days” , and one (20.0%) reporting their preschooler misses an average of “3 4 days” each month. Similarly, teachers and Providers reported that 10.0% of preschoolers miss “zero days” while 80.0% of preschoolers miss “1 2 days” on average each month. Half (50.0%) of the teachers and Providers believed that “health related issues” and “child stays home with family” were barriers preventing preschoolers from attending preschool daily. Only one (20.0%) QI parent reported a barrier to daily preschool attendance which was COVID-19.
Parents, teachers, and Providers identified supports for addressing the barriers to daily preschool attendance. Two QI parents suggested “gas cards” could help make transportation less of a barrier to preschool attendance. Given that QI parents said that their preschoolers attend most days, “flexible start times”, financial incentives for daily attendance”, and “childcare assistance for other children” were not reported as supports that would help increase their preschoolers’ preschool attendance. Furthermore, all (100%) five parents reported that they drive their preschooler to preschool in their own vehicle with travel time ranging between three to 15 minutes (mean = 7.6 minutes). According to 80.0% of QI teachers and Providers, “financial incentives for attendance” could help increase daily preschool attendance (Figure 34). Other ideas about ways in which CPP could help preschoolers attend every day included:
• “Transportation is the biggest issue for a lot of people.”
• “CPP could provide training on child development and how it’s important for parents to make sure their kids are hitting those milestones.”
• “If their basic needs are not met, preschool is not a priority.”
• “Explain why it’s important. What if my child attends only two times per week?”


Three of five (60.0%) QI parents reported that they have not faced any barriers to accessing (i.e., enrolling) a preschool for their preschooler. “Could not afford preschool”, “lack of quality options”, and “lack of trust” were barriers that two parents experienced when trying to access a preschool for their preschooler. When asked, “What barriers have you heard that other parents have faced when accessing preschool?”, the top response was “could not afford preschool” (80.0%). Providers also shared their perspectives on barriers that make accessing preschool a challenge for families:
• “COVID 19. Either family members have it or vaccine reluctance.”
• “Non-traditional work hours don’t fit into the hours of the preschool.”
• “Need to have preschool with hours after 5pm.”
• “Language can be a barrier. Providers need translators for non-English speaking parents and children.”
• “Parents who work from home end up keeping the children home with them.”
Regarding trust in Providers, four (80.0%) QI parents said that a “secure building”, “safety policies”, and “opportunities for classroom observations” would help parents gain trust in Providers. Additional parent feedback on factors that create trust in a preschool Provider included:
• “Holding a parent open houses and education nights for potential new parents and preschoolers to see the preschool. Classroom observations to get a feel for the class and teachers.”
• “Strong communication between school and parents. Teachers who create a loving environment and understand my child’s needs.”
CPP offers a variety of programs and services that support QI teachers and Providers as professionals and with program quality improvement. Of the 10 QI teacher and Provider respondents, 90.0% identified as their preschool’s director/owner with 50.0% also identifying as lead teachers. Two (33.3%) QI Providers reported that they have received staff support
funds (SSF) from CPP, using the funds to “increase wages” (28.6%) and “provide benefits” (14.3%) for staff. Reasons QI Providers have not received SSF were because they were not aware that the funds were available, haven’t applied, or plan to apply soon.
Figure 35 shows QI teachers’ and Providers’ general awareness of CPP programs and services. Focus group participants initially reported no issues with accessing CPP supports and benefits. However, through discussion, one Provider shared that “some Providers are not aware” of the CPP Provisional TA program and “paperwork is a slight barrier” of the program. This Provider also said that she found the program to be “very beneficial”. Another Provider expressed a challenge with “three star classes are only during the day when I have kids. It’s not feasible to attend. The paperwork and meetings are too much to get to three stars.”
Figure 35. QI Teachers and Providers Awareness of CPP Programs/Services (N=10)
Professional Development
Coaching Support
Learning Materials
Provisional Tuition Assistance…
Outdoor/Gross Motor Equipment
Teacher/Educational Resources

Substitute Teacher
20.0%
30.0%
50.0%
50.0%
60.0%
60.0%
0.0%
Most (90.0%) QI teachers and Providers “agreed” or “strongly agreed” with the statement, “I view CPP as a partner.” The best ways for CPP to get information to QI teachers and Providers is through “email” followed by “paper mail” and “text messages” . A teacher commented that they would like CPP to “check in every so often” and a Provider said, “I still would like to receive written communication by mail. Sometimes I receive so many emails that I miss communication.”
Three (60.0%) QI parents reported first learning about CPP through their teacher or Provider and one (20.0%) learned about CPP from family and friends. One (20.0%) QI parent had not heard about CPP before participating in the survey. Providers indicated that they share information about CPP through printer flyers, text messages, and in person communication with parents.
All (100%) five QI parents were “satisfied” or “very satisfied” with their preschooler’s preschool and teachers. Parents liked that the preschool offers a safe, caring environment in which their preschooler can learn. They also liked that the teachers are warm, attentive, and
communicators. One parent stated that they would like “daily or weekly communication about their preschooler’s behavior
When asked to describe the benefits of being part of the CPP Community Provider network, QI teachers and Providers said:
• “Having more access to coaching than when I was not in the program.”
• “I appreciate the staff support, coaching, and supplies.”
• “The biggest benefit was new furniture and supplies. It changed the environment and focus. The new curriculum has been an amazing tool to have. It has helped our kids.”
• “Resources, SUTQ support, CDA classes.”
The highest rated area of satisfaction for QI teachers and Providers was “professional development opportunities” with 88.9% responding “satisfied” or “very satisfied” (Figure 36). Six of nine (66.6%) teachers and Providers were “satisfied” or “very satisfied” with the “coaching support” they have received. Five of six (83.3%) QI Providers also rated their interactions with their CPP coach as “satisfied” or “very satisfied” for “following up”, “frequency of contact”, “level of expertise”, and “responsiveness”. Awareness of CPP programs and services could have impacted satisfaction ratings even though a “not applicable” response option was listed for respondents who were not knowledgeable about every area.
36. QI Teachers and Providers Responding "Satisfied" or "Very Satisfied" with CPP Experience (n=9)
early 2022,
Ohio
Services (ODJFS)
Ohio’s
at

making the renewal of a Provider’s star rating easier through
ratings” for existing Providers as well as “pre-star payments” for new, unrated Providers that accept Publicly Funded Child Care (PFCC) Discussions about suspending SUTQ
have also occurred. Providers made
the following comments about the impact that these discussions have had on them and the services they provide:
• “Some reluctance on going beyond the first star. I’m waiting for the requirements to stabilize.”
• “I’m concerned about having staff leave and losing stars due to the loss. You have to replace the staff member with someone who has similar credentials or you lose your stars.”

• “We halted because we’re not sure if there will be new forms.”
COVID 19 was a factor that affected preschool attendance as indicated by focus group and survey comments related to health and safety concerns and quarantining. COVID 19 made one QI parent hesitant to send their preschooler to preschool. Providers were very appreciative of CPP’s supports (e.g., cleaning supplies, learning supplies, safety posters) during the COVID-19 pandemic. Parents and Providers also suggested other ideas for supporting stakeholders should a crisis event like the COVID-19 pandemic occur in the future:

• “Trainings on how to handle the changes.”
• “Grief counseling for children who have lost relatives.”
• “Extra devices and headsets for online learning.”
• “Offer some sort of financial assistance or offer human help in the form of filling out paperwork or substitutes.”
• “Making sure that centers can still pay their staff when closed. Cleaning and safety supplies.”
Teachers were asked to administer a 10 item survey to preschoolers in their 3 and 4 year old classrooms. Preschoolers were instructed to raise their hand if they agreed with the statement about their preschool experience. Three practice questions about siblings were asked to help the preschoolers understand how to respond and to show them that they may respond differently than their classmates. The survey items and administration process were developed in collaboration with the CPP Evaluation Advisory Panel, which was a group of CPP stakeholders that provided input on the external evaluation process. Data entry and summary were supported by CPP summer interns.
A total of 249 preschoolers responded to the survey. Respondents were from 13 preschools comprised of 23 TA classrooms and one QI classroom. Given the preschoolers’ ages, some of them may not have fully understood the questions or responded to every question. However, it was important to have their voices included in this report. Survey responses are summarized in Table 14
Table 14. Preschoolers Showing Agreement with Aspects of Preschool Experience (N=249)
Survey Item
Count (%)


I have a sister. 156 (62.7%)
I have a brother. 154 (61.8%)
I do not have a sister or brother. 42 (16.9%)
I like playing with friends at school. 233 (93.6%)
I like to play outside at school. 234 (94.0%)
I feel safe at school. 234 (94.0%)
School teaches me to be nice (or kind). 222 (89.2%) School teaches me to “take turns”. 223 (89.6%) Coming to school makes me happy. 222 (89.2%)

Teachers asked preschoolers to tell them, “What is your favorite thing about coming to school?” Select responses are listed below.
• “Playing with bubble machine and singing, songs at circle time, playing with toys, dancing with Ms. Q”
• “Playing with magnets, playing in the kitchen area, playing with blocks and toys, going to school, drawing”
• “Playground, playing with friends, getting a Minnie Mouse Band-Aid, writing in my journal”
• “Doing work, playing with friends, going outside, reading books together”
• “Playing with friends, science experiments, gym, playing block building, Legos, kitchen, outside playground, making art for family, writing in my journal”
• “Reading, playing with friends, going outside, going to the park, Easter Egg Hunt, playing outside with friends”
• “Food, toys, drawing, playing in the water, painting clouds, playing with friends”
Given the concerns with staffing shortages and turnover voiced by many Providers, TA and QI teachers and Providers were asked to share their perspectives and experiences with teacher recruitment, retention, pay, and benefits. Focus group and survey data related to these topics as well as stakeholders’ satisfaction with their work environment, job fit, pay, and benefits give insight into the current staffing challenges in early childhood education and ways in which teachers and Providers could be better supported to recruit and retain them.
Stakeholders responded to survey items by selecting a response option on a 5 point Likert scale ranging from 1 = strongly disagree to 5 = strongly agree. Scores were averaged for each item with an average value greater than three indicating satisfaction and a value below three indicating dissatisfaction. Results are presented below by Provider program type. Missing data were excluded from analyses.
Stakeholders represented Single Site Centers, Multi Site Centers, Type A, Type B, and School Based Parochial preschools (Table 15). Due to the low response rate from QI teachers in 2022, their responses from 2021 and 2022 were combined and reported in Tables 15, 16, 18, 20, and 22.
SchoolBased Parochial TA (N=34) 10 (29.4%) 12 (35.3%) 5 (14.7%) 6 (17.6%) 1 (2.9%) QI (N=16)* 4 (25.0%) 2 (12.5%) 3 (18.8%) 6 (37.5%) 1 (6.3)% Total (N=50) 14 (28.0%) 14 (28.0%) 8 (16.0%) 12 (24.0%) 2 (4.0%)
Stakeholder Group Single Multi Site Type A Type B
*Data interpretation and generalizability is limited given the small sample size. Data include six QI teachers who participated in 2021, representing one Single Site Center, two Multi Site Centers, one Type A, and two Type B preschools.
Results showed that on average, teachers and Providers are satisfied with their work environment (Tables 16 and 17). However, both TA and QI teachers and Providers had an average score below three in the area of work related stress, indicating that they are dissatisfied with amount of work related stress they have experienced. Dissatisfaction with work related stress was also reported in 2021 by TA and QI Providers. These findings are important because results revealed that work environment satisfaction impacts teachers’ and Providers’ decision to stay with their current employer.

TA Teacher Average Rating N=13
QI Teacher Average Rating N=9

My workload is manageable 3.85 4.25
The children I teach are well behaved 3.31 3.56
I have little work-related stress 2.77 2.89
I am happy at work 4.08 4.44
I receive effective coaching 3.77 3.89
I receive on going professional development 4.23 4.00
I have a strong relationship with my preschool director 3.92 4.50
My facility is adequate 4.15 4.38
I have time for lesson planning 3.46 4.00
I am comfortable with the student-teacher ratio 4.15 3.86
My work environment is pleasant 3.77 4.63
I am satisfied with my work environment 3.85 4.63
My satisfaction with my work environment impacts my decision to stay with my employer 3.85 4.50
TA Provider Average Rating N=21
QI Provider Average Rating N=7
My workload is manageable 4.16 3.71
The children I teach are well behaved 3.48 3.86
I have little work related stress 2.95 2.57
I am happy at work 4.33 4.29
I receive effective coaching - 4.43
I receive on going professional development 4.60 4.29
I have a strong relationship with my preschool director 4.48 3.86
My facility is adequate 4.52 4.14
I have time for lesson planning 3.55 2.71
I am comfortable with the student teacher ratio 4.19 3.71
My work environment is pleasant 4.57 4.43
I am satisfied with my work environment 4.33 4.17
My satisfaction with my work environment impacts my decision to stay with my employer 4.38 4.00
On average, all respondents were satisfied with their job fit which is notable because results indicated that job fit satisfaction impacts retention (Tables 18 19).
TA Teacher Average Rating N=13
QI Teacher Average Rating N=9
I want to continue working in early childhood education 4.31 4.75
My actual job duties match my job expectations 4.00 4.44
I have the education and training needed to do my job well 4.23 4.75
I have a positive impact on children in my preschool 4.31 4.89
I am satisfied with my job fit 3.85 4.56
My satisfaction with my job fit impacts my decision to stay with my current employer 4.00 4.11
I want to continue working in early childhood education
TA Provider Average Rating N=21
QI Provider Average Rating N=7
4.65 4.14

My actual job duties match my job expectations 4.50 4.00
I have the education and training needed to do my job well 4.45 4.14
I have a positive impact on children in my preschool 4.60 4.43
I am satisfied with my job fit 4.53 4.14
My satisfaction with my job fit impacts my decision to stay with my current employer 4.68 4.00
Teachers’ and Providers’ focus group feedback and survey data revealed that they are not satisfied with their pay and benefits (Tables 20 21). Anecdotal evidence suggested that teachers and Providers strongly believe that they are well deserving of higher pay, whether earned through vouchers or direct parent payments.
I receive an adequate salary
3.08a 3.44b
I receive adequate benefits (medical, retirement, other) 3.54 c
I am satisfied with my pay and benefits
My satisfaction with my pay and benefits impacts my decision to stay with my employer
2.85 3.00

3.69 3.78
a Respondents reported that a salary between $15.00 25.00 per hour or $35,000 55,000 per year would be considered as a living wage for teachers, which equates to approximately $20.00 per hour on average.
b Only two respondents indicated that their salary was not adequate and reported that they consider $15.00 and $17.75 per hour to be a living wage
c Data excluded due to low sample size.
I receive an adequate salary
3.10a 2.50b
I receive adequate benefits (medical, retirement, other) 2.80 2.17
I am satisfied with my pay and benefits
3.15 2.17
My satisfaction with my pay and benefits impacts my decision to stay with my employer 3.63 3.17
a Respondents reported that a salary between $15.00 20.00 per hour or $45,000 60,000 per year would be a satisfactory wage, which equates to approximately $20.00 per hour on average.
b Respondents reported that $12.00 45.00 per hour (mean = $22.33) would be a satisfactory wage.
Teachers and Providers were also asked about the types of benefits they receive. Results showed that QI teachers and Providers are less likely to receive benefits compared to TA teachers and Providers, a finding that was documented in 2021 as well. For example, seven (53.8%) TA teachers reported that they receive medical and dental benefits while two (22.2%) QI teachers reported that they receive these same benefits (Table 22).
% QI Teacher Receiving Benefit (N=9)

% TA Provider Receiving Benefit (N=21)
% QI Provider Receiving Benefit (N=7)
Medical 7 (53.8%) 2 (22.2%) 7 (33.3%) 1 (14.3%)
Dental 7 (53.8%) 2 (22.2%) 6 (28.6%) 0 (0.0%)
Retirement 8 (61.5%) 2 (22.2%) 10 (47.6%) 0 (0.0%)
Paid time off 12 (92.3%) 5 (55.6%) 10 (47.6%) 2 (28.6%)
Performance Bonus 3 (23.1%) 3 (33.3%) 6 (28.6%) 1 (14.3%)
Other 1 (7.7%) 1 (11.1%) 4 (19.0%) 0 (0.0%)
Teachers were asked if they had received a TPG. Of the 12 lead teachers who responded, eight (66.7%) indicated that they had received a TPG. Of those receiving a TPG, seven (87.5%)
agreed
or
strongly agreed
that the TPG had an impact on them staying with their employer. Teachers reported using TPG funds to pay for classroom supplies, activities, toys, and bills.
Providers were asked if they have reduced or adjusted wages for teachers who receive the TPG and the majority reported that they have not because they view the TPG as additional funds to increase teachers’ income and assist them with continuing their education. Five (62.5%) teachers said they view the TPG as a wage supplement, but 75.0% said the TPG is not enough to retain teachers. Other supports teachers would like in addition to the TPG to help retain them included parent support, bonuses, classroom supply stipends, time off, help with difficult behaviors and cognitive delays, and more pay (See Appendix for quotes).
Nearly half (46.2%) of Providers have used the TPG as a promotional or recruitment tool for hiring or retaining teachers as described by the following quotes:
While interviewing for Lead Preschool teachers I share the information regarding the TPG and let them know trainings must be completed as part of the grant.
We have used it for retention.
TPG money helps our program pay higher wages. This includes self-payments to Type B Family Childcare Providers such as myself that does multiple duty roles (Administrator/Lead Teacher) and make payment increases to substitute caregivers.
My employee was contemplating obtaining additional employment, but the grant was able to supplement their income.
Helps with retention.
By using it as an incentive.
Two of seven QI Providers stated that they have received SSF. As described above in the QI Barriers to Accessing CPP Funding section, QI Providers reported using SSF to “increase wages for staff” (28.6%) and “provide staff benefits” (14.3%) Reasons QI Providers have not received SSF were because they were not aware that the funds were available, haven’t applied, or plan to apply soon.

Tuition assistance has continued to have a positive impact on preschool quality and access. Providers receiving TA reported that they used the funds for “classroom materials” (66.7%), “SUTQ requirements” (66.7%), “improve their facility” (57.1%), “supplement teacher wages” (57.1%), “professional development opportunities” (57.1%), “durable outdoor equipment” (38.1%), and “hire more teachers/staff” (23.8%).
Inadequate pay and benefits for teachers and Providers continue to be key issues in the field of early childhood education These issues affect staff recruitment and retention, preschool quality, access, expansion, professionalizing the field, work environment culture, and stability, which ultimately impacts preschoolers, families, and the broader community. Teachers and Providers strongly expressed that the pay and benefits available to most preschool teachers and Providers do not align with their job responsibilities or the importance of their service. Findings from focus groups indicated that $15 per hour is not a sufficient wage for Family Child Care Providers. Type B Family Child Care Providers also felt that the distribution of Ohio’s stabilization grants was “unfair and needs to change” because Type A Providers received “$16,000 grants but Type B only received $4,000”. Moreover, teachers and Providers believed that higher wages would be helpful for recruiting and retaining teachers; however, Providers said that they “can’t pay what they don’t have”. One Provider stated that “CPP should lobby for more money for subsidized programs”. With almost all other employers offering higher wages than in the past to attract new employees, some Providers have lost staff and others are concerned that they will lose staff or not be able to hire new staff because they cannot compete with the higher paying employers. Looking forward to the upcoming year, TA Providers’ greatest concerns are with “staffing” (52.4%), “home or site repairs” (19.0%), “Publicly Funded Child Care (PFCC) amounts” (14.3%), and “other reasons” (14.3%) which include staff and parent mood and enrollment of TA qualified students. Quotes related to the key evaluation questions are documented below by stakeholder type. Most quotes are from Providers as they typically have the greatest influence on or understanding of teacher recruitment, retention, and pay within their preschools.
• “Wages that are not just comparable to early childhood education but also what's offered in other types of positions/jobs like restaurants, grocery, etc.”
• “$15 is not enough for family childcare Providers.”
• “$15 is entry level.”
• “$15 would be helpful, but we also need wage increases for the Providers who are paying the teachers.”
• “$15 maybe enough to recruit, but maybe not quality [teachers].”
• “You can’t pay what you don’t have.”
• “Increases in teacher pay hurts the entire payroll because then I have to increase all other staff pay.”
• “Can’t afford right now.”
• “Help with pay if parents drop out unexpectedly.”
Teachers and Providers were asked, “What is the best way to recruit quality teachers?” and provided the following suggestions:
• “More publicity, why it’s beneficial to join a school that works with CPP.”
• “Sign on bonuses”
• “Recruit from high school”
• “Attach more information with postcards for Providers and families”
• “CPP should lobby for more money for subsidized programs”
• “Interactive video about what it’s like to be a teacher and what’s expected.”

• “I think getting out into the community and providing the information about the grants and trainings.”
• “Promoting at colleges/universities, provide an understanding of how important preschool education is, it’s not babysitting, encouraging teachers to get into the field.”
Teachers and Providers were asked, “What is the best way to retain preschool teachers?” and shared the following ideas:
• “Making sure our mental state is ok, self-care days. Some sort of financial incentives would be helpful, even if the school doesn’t have 3 stars, would help incentivize teachers to help the centers earn those 3 stars.”
• “Need to be able to provide guaranteed benefits and childcare supports for teachers.”
• “I think the grant helps because a lot of salaries are minimal and helps get people to stay. The grant makes you feel appreciated.”
• “More support in classrooms. Contacts from other disciplines (medical, behavioral, social work, etc.) to provide resources and guidance for difficult situations or behaviors.”
• “Ensure that the atmosphere is pleasant and positive and that the teachers are not overburdened.”
Twelve (57.1%) TA Providers raised teacher wages in response to labor shortages or inflation. Reasons for raising teacher wages included:
• “We received grants in response to Covid 19 and have adjusted wages/bonuses accordingly.”
• “We needed to hire aides and be competitive with the job market.”
• “We have found it necessary to increase wages in order to keep the quality employees we currently have and also to attract others looking to get into early childhood education.”
• “Using the (stimulus) grants helped us raise teacher wages. [We’re] so very thankful.”

• “Trying to increase enrollment for preschool.”
• “To retain staff and to get teachers to apply and work for the agency.”
• “It was made by our upper management department.”
• “It was impossible to hire anyone at $12/hr. We did have more interest at $13.”
• “I spoke with the Preschool Board. We offered retention bonuses too.”
• “Due to labor shortages and inflation, I offer monthly bonuses as well as benefits such as 401K, vacation, sick, and COVID pay.”
• “When grant money is received, it helps promote higher wages across the board.”
• “$15 per hour is now becoming customary.”
• “We made this decision because the state is not paying enough to up the pay.”
Reasons for not raising teacher wages included:
• “We are giving them a retention bonus.”
• “Waiting on my employee to finish her CDA process, then I will give a raise.”
• “That is up to the agency, not the link individual site.”

• “I give a bonus.”
• “Grants have been provided through the state of Ohio. ”
Two students enrolled in the Cincinnati State early childhood education student teaching placement program were interviewed about their perspectives and experiences as emerging early childhood education teachers Their feedback is useful to helping CPP understand the ways in which they can support the early childhood education to preschool teacher employment pipeline.
• Both students were attracted to the early education field as a career choice because of their positive experiences engaging with children in their youth.
• Students were satisfied with their student-teaching placement experiences and believed they made a positive impact on the children in their preschool placement.
• They reported that they had the education, training, and support to do their job well and received strong mentorship from program and placement staff.
• They received limited information about the CPP stipend that was available to early childhood student teachers at Cincinnati State. They also were unsure how the stipend was applied (e.g., to their tuition).
• They agreed that the stipend amount, $2,000, was good amount to support them through their student teaching placement.
• Suggestions for improving the student-teaching placement program and how to better prepare emerging teachers for teaching in a preschool setting included: o training on how to navigate conflicts with co-workers and parents, o effective communication about developmental delays or learning challenges, o managing difficult child behaviors, o clarity of expectations between the program and preschools that hold different accreditations, and o resources for transitioning into the field.
• One interviewee reported that they plan to continue their education to become a preschool through fifth grade educator while the other aspires to continue working in early childhood and eventually become an in home preschool Provider.

• Pay and benefits are imperative to recruiting and retaining teachers.
• There are challenges with heavy workloads and resource availability in different work environments (i.e., learning centers vs. public schools).
• Adequate staffing, center organization, and staff supports are important to recruiting new teachers to preschool education.
• Role playing during the interview process may help identify quality teachers.
• Tuition Assistance is Key to High-Quality Preschool Access and Affordability: 73.3% of TA parents would not be able to afford preschool at all without TA. Other parents said they could not afford to enroll their preschooler in a high quality program without TA. Cost of tuition was a barrier to enrollment for 40% of prospective parents.
• Safety and Transparency are Crucial to Parental Trust in Providers: One-on-one meetings with teachers/directors, classroom observations, secure buildings, and safety policies would help increase parent trust in Providers. Parents have identified a safe environment as a top aspect of a quality early educational experience since 2020.
• Parents Value Highly Educated Teachers: Highly educated teachers emerged as a top aspect of quality for which 69.0% of prospective and 80.0% of TA parents value in a preschool.
• Parents Need More Information about the Impact of Regular Preschool Attendance on Kindergarten Readiness: Only 54.6% of prospective parents, 53.3% of TA parents, and two of five (40.0%) QI parents were aware of the connection between regular preschool attendance and kindergarten readiness.
• Prospective Parents Need More Information about CPP: Less than half (46.8%) of prospective parents had heard of CPP prior to completing the survey and 38.0% reported that they are on a waitlist to enroll their preschooler in the fall of 2022.
• Parents are Highly Satisfied with Their CPP Experience: Parents expressed high satisfaction with their preschooler’s Provider and teacher. Most parents have strong communication with their Provider with many receiving daily or weekly updates through text messages, preschooler reports, and virtual communication applications.

• CPP Funds Impact Preschool Quality and Teacher Recruitment and Retention: 66.7% of Providers use TA funds to maintain and improve their SUTQ star rating. 87.5% of teachers receiving TPG said the grant had an impact on them staying with their employer. 46.2% of Providers have used the TPG as a promotional or recruitment tool for hiring or retaining teachers.
• Marketing and Advertising Support Would Help Providers with Preschooler Recruitment and Enrollment: All Providers ranked “developing an online application” in their top three ways CPP could help Providers with recruitment and enrollment.
• Teachers Desire Direct Communication from CPP: Pertinent information that’s typically communicated directly to Providers is sometimes not relayed to teachers.

• Inadequate Pay and Benefits Negatively Impact the Field: Teachers and Providers are dissatisfied with their pay and benefits, which has a negative impact on retention and recruitment among other important aspects of preschool education. The top concern for TA Providers in the coming year is “staffing” (52.4%).
• COVID-19 Continued to Negatively Impact Stakeholders This Year: Parents reported that COVID 19 made them hesitant to send their child to preschool. Providers continued to experience challenges with hiring teachers, although less than reported in 2021.
Recommendations and next steps are provided based on this qualitative evaluation and the major themes that emerged from the discussions with parents, teachers, and Providers. Some recommendations may be implemented in the short term with existing resources and capacity while others may require expanded resources and supports to be implemented over the long term.
• Educational Opportunities for Prospective Parents: Help parents of preschool age children who are not yet enrolled in preschool select a quality preschool that meets their needs. Increase awareness of when and how to apply to preschool and the relationship between preschool, academic achievement, and later life success.
• Provider-Parent Communication Support: Provide Providers with practical strategies and recommendations to support effective parent communication. Providers could benefit from resources, tools, technology, and information to enhance their communication with parents.
• Develop Resources for Providers to Recruit Teachers and Families: Providers would benefit from teacher recruitment resources that highlight valued CPP supports for recruiting and retaining teachers (e.g., teacher grants, professional development, etc.). Resources and supports to help Providers recruit new children into preschool are also desired (e.g., advertising, online Provider application, etc.).
• Consider New Ways to Engage Stakeholders Throughout the Year: It will benefit CPP to regularly engage stakeholders to inform them about new supports and programs. CPP will also get feedback about challenges in the field and have real time responsiveness to issues central to CPP’s mission.
• Advocate for the Unique Needs of Family Child Care Providers: Family Child Care Providers expressed unique needs and challenges with operating a small business and
low fees. Family Child Care Providers also want to be recognized for the quality standards they meet as SUTQ star rated Providers and the value they bring to the field of early childhood education.

• Continue Advocating for Preschool Teacher Wages and Benefits: State level policy change is still needed to help preschool teachers and Providers earn a living wage with adequate benefits. Communicate advocacy efforts and progress being made at the local, state, and federal levels.
• Consider Building Capacity for Inclusion of Future CPS Students Enrolled in Preschools Located Outside the CPS Footprint: Some Providers reported that their location (outside of the CPS footprint) prevents them from participating in CPP, but the students they serve enroll in CPS kindergarten. A first step to building capacity for preschools outside of the CPS footprint is to track which preschools serve a large contingent of students who attend CPS after preschool.
• Expand Professional Development and Educational Opportunities for Parents, Teachers, and Providers: Parents may benefit from educational opportunities to learn more about SUTQ. Teachers and Providers reported that they would like to receive more information about navigating tough conversations with parents (e.g., child development delays, behavioral challenges, attendance issues, safety concerns, etc.), and managing preschooler’s health and behavioral needs.

The Appendices provide additional stakeholder quotes that were not included in the main report.
• “I wouldn't have been able to afford a quality preschool program.”
• “For me it's helped me a lot because the school where my child is very expensive, and since it's close to our home, we prefer to put our child there. But because it's too expensive, I cannot afford it since I'm also student, I can't work like full time job, so it helps me a lot.”
• “It lets us choose which preschool is best for us. [My son] has a late birthday, so we could not use CPS preschool. CPP allowed us to enroll him in a center before CPS would accept him, so this closed a gap for us.”
• “It made preschool affordable it opened up a door for them and to do other activities.”
• “It was very expensive, with the tuition assistance, we can afford it.”
• “For our family, it’s allowed us to work full time. Our son has grown so much, he is social, he has so many friends, and can write his name. He’s looking at cameras and practicing photography. I couldn’t provide that enrichment. We could not have afforded and given him that opportunity without CPP. My youngest is a baby and now I know he will be able to go to preschool.”
• “Huge Impact. Parents have a great place to send their kids without worrying about the cost. Our center provides food, so they don’t have to worry about food.”
• “Gives the parent an ease so they don’t have to worry about the money, they can go into a place they can trust.”
• “Diversity Preschool Promise connection let us be more diverse, rather than just saying it, we are diverse.”
• “A lot of children would not have the opportunity to attend preschool without CPP. One example, needed a longer day program, would not have been able to continue at the program without CPP TA.”
• “TA children are more apt to attend preschool.”
• “Some families like having multiple options that may better fit their needs.”
• “Without CPP children would not be in preschool.”
• “The details provided to parents provide them with a sense of security of knowing the kids were in a quality school.”
• “I just don’t want a babysitter; I want him to learn and use his brain. I want to spend quality time with him at the end of the day and not just focus on teaching.”
• “When I thought about quality, I just thought they would be on top of what they are giving to my child and when she goes to the kindergarten evaluation, she would know what she needed to know.”
• “Educating the parent is most valuable to me. I learned that social emotional learning is key to kindergarten readiness.”
•
“Safety, teachers have proper education and training.”
• “Actually making sure that the daycare is not only step up to quality on paper, but they are actually doing what they say are doing.”
• “My kids are school ready learning through play. Building social skills that they will need later.”
• “Academic is less of a priority. A warm, safe environment comes first.”
• “The teachers are prepared. They have the credentials to do a good job.”
• “The ratio impacts quality a lot. They are following some sort of curriculum or plan. Like how are they putting things together and that they are actually using it.”
• Curriculum, schedule, or structure. A plan for the day.”
• “Having children learn to deal with people in society at a young age and understanding right and wrong as a student and child.”
• “Emotional well-being and regulation skills.”
• “I homeschool.”
•
“Families see the opportunities that we give the children, open ended art and exploring outside, daily communication (photos/texts/daily notes or discussion) providing a way to communicate, Validating their concerns.”
• “The care that we give to the children, they can tell by the child’s reaction when they come to school hesitant or they don’t want to go home."
•

“Defined by how the kids react - are they safe, are they playful, are they happy?”
• “Most of the parents care if their kids are in a safe environment and happy, academics is a second.”
• “Longevity of staff.”
• “Most of my families do not ask about the rating.”
• “Nurturing environment, strengths based curriculum.”

• “Parents want their child to know ABCs, counting, writing, and sounds.”
• “Academic, social interaction with children their age, learning to share, manners, taking turns, and social emotional development.”
• “Teacher qualifications, certifications, environment, curriculum, reputation. I piloted SUTQ 15 years ago.”
• “It means a lot to families. They want their children to learn and be safe.”
• “Assessments, conferences, engagement with curriculum, and learning through play.”
• “A developmentally appropriate curriculum.”
• “Individualized curriculum, understanding how children learn best, and hands on play based learning.”
• “Sickness (asthma)”
• “I think with getting to know a new school, it’s helpful to have a parent group to meet you. You literally go in with blind trust. A current parent to guide you and help you through the process. Lack of connection with the parent community can be a barrier.”
• “Preschools that are only half day – who can pick up their child during the middle of the day. 3 hours is not very long.”
• “I don’t think there have been any barriers.”
• “None.”
• “Location. They don’t have any locations outside of the Cincinnati area.”
• “Finding a preschool to accommodate child’s healthcare needs.”
• “Lack of staffing. It was so low at one point, they could only accept so many kids because of the ratio of teachers to kids.”
• “In the past, I’ve had problems with waiting lists.”
• “Transportation is not an issue for me, it’s the hours with work. So I either need the school to have transportation if it’s only a half day program or have longer hours.”
• “Transportation and the time. The school starts at 8 a.m. but I have to work at 7 a.m. I work from home but it’s just me, so I have to get him there and pick him up. They also close a lot. They have teacher and staff development days and he has to be home with me while I am working and it’s hard sometimes.”
• “School and work.”
• “Timeframe of enrollment.”
• “Waitlists/space available in part time inclusive programs.”
• “Bus services”
• “If bus transportation would wait for the child to come outside or at least go to the center and physically get the child because daycare teachers need to stay inside with the other children.”

• “For instance, most private preschools by us didn't offer transportation. The public school does but it is only to 3 and I cannot leave work in the middle of the day to pick up/drop off my child. So, if the hours were different or if the school offered more options for bussing, that would be ideal. We currently do an all day private preschool so we can transport ourselves with their hours.”
• “Bus system or extended hours that align with the work day.”
• “The main one from my parents is transportation, not being able to make it to certain centers 5 star centers are too far away.”

• “Separated parents sharing custody, child is with one parent for a long time and miss going to childcare.”
• “Some parents are not aware that there is assistance available and wait until there is an issue.”
• “Parents sleep in and don’t care.”
• “Children outside the CPS footprint can’t participate. It would be beneficial to accept other children.”
• “Transportation, clean clothes, stays home with older siblings, attendance policy.”
• “COVID 19. Either family members have it or vaccine reluctance.”
• “Non traditional work hours don’t fit into the hours of the preschool.”
• “Need to have preschool with hours after 5pm.”
• “Language can be a barrier. Providers need translators for non English speaking parents and children.”
• “Parents who work from home end up keeping the children home with them.”
• “Parents can’t afford to pay with hours getting cut or getting laid off.”
• “Transportation.”
• “Families can’t afford preschool.”
• “Language barriers prevent parents from enrolling and finding employment.”
• “Parents don’t realize they have to register early and then can’t get in.”
• “Deadlines, potty training, and affordability.”
• “Parents don’t know about Preschool Promise.”
• “Hours of operation and costs,”
• “Availability.”
• “Lack of options.”
• “Stay at home mom, if she’s acting like she doesn’t want to get up, sometimes I just say forget it and keep her home, especially if I don’t have something else to do.”
• “Transportation. My schedule starts at 6:45 in the morning, so I have someone that has to take her to school.”
• “No issue right now, but if I did, I’d be struggling. I don’t want him to have that burden of missing because of me. Transportation is a consideration I didn’t have before my personal health issues. I would advocate for however it works, our parents do need that support.”
• “My daughter has chronic asthma and allergies. Some days I have to keep her home when she has trouble with coughing and breathing – she can’t go to school like that.”
• “Apart from normal absence, I don’t think I have any barriers. The school is close to my house, we can walk.”
• “No barriers other than just an appointment or something.”
• “For other families, transportation issues or not being able to afford it.”
• “I haven’t had any barriers.”
• “None. We only miss if sick or because of COVID.”
• “Family caring about education and not a 'sitter' as they call us.”
• “CPP children are there more than Head Start or voucher children, the need is stronger maybe [miss] one or two days a month, because of illness or the parent happened to get the day off and they wanted to spend time with their child.”
• “Spring break – older children are out of school, so they keep the younger child home, too expensive to bring everyone to drop off if coming by bus.”
• “Transportation and weather, if it rains and they take the bus, they are less likely to come to school.”
• “COVID restrictions.”
• “Sickness or not getting enough sleep.”

• “Family vacation or something like that.”
• “Parents understanding how important early childhood education is."
• “A lot of parents work from home and keep their child at home.”
• “I have one parent who doesn’t bring her kids on Fridays.”
• “The only time my kids won’t show is if they’re sick.”
• “Attendance is consistent.”
• “Children scheduled to attend, attend.”

• “Only if the child is sick.”
• “Some parents lose vouchers and can’t send their child.”
• “We call and check on the students when they are out and express the benefits of school. We ask what we can do to help.”
• “We are talking to the parents.”
• “Opening transportation possibilities.”
• “Encourage parents to bring their kids to school, having special activities planned for the children.”
• “Communicating directly with families.”
• “Calling and checking up on families.”
• “We try to make sure they are washing their hands, keep them healthy and safe, not spreading germs.”
• “I always ask if there’s anything that I can help with.”
• “We offer transportation, and we encourage our families on the importance of education and how it's preparing them for when they enter as a kindergartner.”
• “We encourage parents to bring their children and tell them how beneficial attendance is.”
• “We are having face to face conversations with parents.”
• “Speaking with parents about the benefits of attendance.”
• “Offer incentives like raffles.”
• “I remind my parents of the importance of preschool. That children that attend preschool are more successful later in life.”
• “I have gas card drawings for good student attendance.”
• “Continue to remind our parents that great attendance makes a difference Calling and asking if the child is okay.”
• “Calls to parents.”
• “If we see a child’s attendance declining, we send out letters that says attendance is important and it lists why we need them there.”
• “I have an interview process. I let them know what is required of them to continue to be in my care.”
• “We do a courtesy call. We don’t do it at our cutoff time, but we do it if we know the child hasn’t been there for two days. We call and ask what’s going on.”

• “No problem with attendance, but the program is part time. I offer extended day for working parents. There are a lot of grandparents that watch the children.”
• “Advertisement. Encouraging the positives of family childcare like low [teacher student] ratio, especially as we compete with the public school system.”
• “Childcare dictionary and partnering with CPS.”
•
Create a flyer, so we can put it with our enrollment packet.”
• “Don't really know.”
•
Families who have 5 year olds who aren't ready to attend kindergarten need financial support to stay one more year.”
•
Have somebody come on site and help parents fill out paperwork. Advertise openings for us.”
• “Help us with advertising, not just applying CPP flyers and signs but maybe add program names to the signs, newsletters, and flyers.”
•
If they sponsored a day for onsite enrollment where the family could speak directly with a CPP representative.”
• “Incentives and transportation.”
• “Market community programs.”
•
More publicity, handouts, and brochures.”
• “Provide marketing materials and events.”
• “Right now we are getting plenty of calls, but we don’t have enough staff.”

• “The biggest problem I have with enrollment is that there are children outside the Cincinnati Public district that are needing preschool assistance. I know recruiting is my biggest issue but outside of the limited district, I have no new ideas.”
• “I feel like a lot of times because we are in home, they feel like, “Oh well, that's daycare” . They don't really see the value lately. We've been letting the parents come in, like if they have a day off or something, to see what their kids are doing. They see they're not just playing here; we have a structured time where we're doing preschool I think having someone from CPP support that would be helpful.”
• “I think the way CPP has been marketed that it’s like free childcare for some and that’s just not the case. I think if they could market family childcare Providers so parents understand they will receive the same benefits as they would at Cincinnati Public, it would be easier for us to advertise for preschoolers.”
• “Continue with advertising and possibly splitting up advertising by area.”
Parent satisfaction with their preschooler’s preschool and teacher TA Parents
• “Everything. The teachers care, the principal cares, there's opportunities for parents/guardians to have events at school and see where our kids are learning and there's conferences to go over what our children are learning and how they're doing.”
• “Good communication with parents, teaching quality is very great, knows and talk to kids 1 on 1 and the children love the teachers. Very good on keeping things organized, safe, clean, and feels like a family.”
• “I am able to go into the school and meet people that are with my child all day also they keep me informed about my child's day.”

• “I love the Open Door Policy for the parents.”
• “I love the quality of education that my child received during her 2 years at Artlitt, safe and nurturing environment.”
• “Secure building and great communication.”
• “They are extremely nice and well educated. My daughter loves her school and peers. Always excited to learn and I can see a difference in her education.”
• “They go outside every day, despite the weather! They follow the children's interests they don't push 'academic' subjects. They have a gross motor space in the building and a natural playground they visit twice a week. Huge emphasis on getting the preschoolers moving. Very low student to teacher ratios.”
• “Very caring, very professional, and safety.”
• “Willingness to talk to me about my child.”
• “So kind, calm, encouraging. Always paying attention to what the children are currently interested in. Follows their interests to spark things found in the classroom. Pays close attention to what is happening in the classroom at all times. Helps children explore social emotional health and navigate social situations.”
• “She is very easy to talk to and gives me feedback that shows she really cares.”
• “She is patient and communicative about how our daughter is doing and what she's learning/working on getting better. She is also accessible if there's ever a question or concern on our end.”
• “She always lets me know how my child is doing. She stays on top of concerns or issues. I trust she takes care of my daughter.”
• “Love the interaction with my child and other children, very wise, organized, experienced, communication is great. Understand my child very well, great mentor, goes out the way to help out parents in need, and part of my support system.”
• “I like how engaged my child’s teachers are in her learning and growth process.”
• “The attention given to my son is very appreciated and well received by him. More direction will help him to be more focus. He trusts her and the feedback.”
• “The teachers are warm and nurturing, my children have friends, and they love to learn new things.
• “They truly care about my child and her growth.
• “Safe environment.”
• “Safe environment, fun, and resourceful.”
• “I really like the family oriented environment, very welcoming. I like that the staff are knowledgeable and can teach my child the things needed to prepare for kindergarten.”
• “She is warm and attentive to their individual needs and provides a loving and stable environment for my children.
• “She so caring and loving.
• “I really like that my child's Provider communicates thoroughly with me. I like that the staff are patient with my child. My child has learned so much in so little time.”
• “I’m satisfied because I know what is going on there. I would go somewhere better but I’m just in a whole process with him right now. He doesn’t really talk much. He’s very different from the other kids I see, so sending him to certain places or environments, I don’t think he would be ready yet.”
• “I would definitely prefer somewhere else. Cost is a barrier This is our third daycare. I liked the other one better. It’s really the communication. We drop our kids off at the door, I don’t actually interact with any teacher. I just feel like I never know what’s going on unless something bad happens. Then you get a call from the director.”
• “I actually like it because they are a part of Step Up To Quality.”
• “I’m comfortable with where my child is now and I think he is as well since he has been there since he was eight weeks old. But I also think with him being there so long that he might be a little too comfortable so maybe it’s time to make an adjustment so that he can continue growing socially and adapting to new things.”
• “They help me get more training, so I can be a better teacher to my students.”
• “CPP shows that we are appreciated.”
• “Supports help me grow as a teacher.”
• “CPP allows us to grow as a teacher and supports our professional development needs.”
• “My coach is very knowledgeable and professional.”
• “My coaching has been exceptional.”
• “Whenever I have any questions on any level regarding SUTQ staff are very responsive.”
• “They help to keep the program at a quality standard.”
• “The SUTQ coaching has been invaluable as we navigate a new curriculum. The training offered is helpful as well.”
• “The professional development opportunities offered support early childhood. I always receive support when needed.”

• “The coaching is a great opportunity for our teachers to receive support outside of the program with someone who helps with looking at the classroom or situation differently.”
• “The benefits include personal coaching, updates on policies, help with enrollment, free Professional development courses, assistance with SUTQ, also great incentives for the teachers, and help with marketing.”
• “The benefits have been endless!”
• “Staff incentives.”
• “Offering of free trainings & coaching.”
• “Love the trainings!”
• “It helps maintain a good teaching and working environment with my daycare.”
• “I love the free resources. They add quality to my program. I feel like I can support my staff better by providing them with bonuses and trainings to then be able to provide better quality education for my students.”
• “Helpful when you have a reliable coach.”
• “CPP helps teachers provide quality care & education to our children.”
• “CPP provides coaching and free training. CPP helps improve my program with quality improvement, tuition assistance, and coaching.”
• “CPP has provided many opportunities for my program to be beneficial in many ways. They offer TA funding and TPG that help supplement income, help purchase needed materials and improvement opportunities needed through resources that help students succeed in learning. CPP has coaching opportunities and provides incentives for staff. Also, they provide access to programs that promote quality such as 4C's for Children.”
• “Coaching is so important for teachers to be able to help the children with social/emotional issues!”
• “Coaching has been helpful since I am a new Director.”
• “I did not finish the application because I had to get insurance information together. No communication with CPP staff.”
• “If I needed to communicate with them, they were there.”
Ways CPP could better support Providers: TA Providers
• “To be honest, CPP is the best and if there is anything lacking or missing it is not because of a lack of support on their end but lack of time on mine.”
• “Still in my first year, so I'm learning about CPP from my Business Manager.”
• “Self paced, online trainings. More administrator trainings. Trainings that assist (especially) white teachers on how to teach their black students better. Communication/ culture/values/behavior management/kindergarten readiness beyond academics.”
• “Need in person learning. Zoom has to go.”
• “More incentives.”
• “Help with pay if parents drop out unexpectedly.”
• “Funding for hiring coaches or teachers for the children who need extra support throughout the day.”

• “CPP could support me better by helping me find CPP eligible children. One suggestion would be to offer opportunities for other children outside the CPS district to participate.”
• “Continue tuition pay and TPG during the summer months if we're still providing care for preschoolers approved by CPP.”
• “I love the support I have from my coach. I have had some tough situations come up and she is always a text, call, or email away. I am excited about the materials my program will be getting from Lakeshore. Materials can be expensive so being able to have access to things for free for my preschoolers is priceless!”
• “The professional development is always important. I need to better about staying informed and checking the website more for information pertaining to.”
• “CPP helps and encourages me to continue teaching.”
• “The supports have always come through when I needed them.”
• “The only thing I was not aware of is the substitute pool. I would like more information on that service.”
• “I heard a great deal about CPP in the beginning, but I have not heard much recently. I’m not really sure what could be done other than more communication.”

• “I thought CPP was only for schools in the city of Cincinnati. I would not qualify or has this changed?”
• “I would like to know exactly what I would be signing up for. Are there penalties or paperwork required? I would like them to be open and upfront.”
• “I say very effective, I get reports from the center about my child. They give me resources, books, activities.”
• “I just get the information at the beginning when I registered my son there. They told me about the feedback session. That’s it, no other information.”
• “Yes, they gave me information in the beginning.”
• “We use an app, pictures daily, teacher will text a picture and show her during the day. Preschool Promise will send postcards in the mail/birthday card, events, and workshops. I love the communication. Great communication throughout the day. Both from the school and Preschool Promise.”
• “The payment amount better communication about the changes in payments.”
• “For the summer program, I think CPP provides something. I’d like to know about. Are there any other services that are provided? I know there is a website but is there more information? This would be helpful for families.”

• “I believe very effective. They had the flyer for this focus group printed out and told her how to sign up.”
• “Using different types of ways to communicate.”
• “More on Preschool Promise: how do they pick out the daycares that they work with? Stuff like that will be helpful.”
• “Not enough communication at all. Parents need more information coming from the director.”
• “Need to be informed about expectations.”
• “Other parents don’t understand star ratings, so they don’t mean anything to them.”
• “Cover more schools with the Preschool Promise program so that families can find a preschool close to their home, providing transportation could help, every family should be able to get their child into preschool.”
• “Funding ends for the summer. I was shocked. Is there a way to support it throughout the summer?”

• “Not sure. Emails are good but when there are too many of them then they get ignored.”
• “Daily or weekly behavior sheets.”
• “No improvement needed.”
• “I have no problems with communication.”
• “Continue to share more information about who they are and what they stand for to show how it can benefit families.”
• “You are doing a great job at being a great partner.”
• “I went to take a training that was emailed to me and at the last minute was canceled. They stated it would be rescheduled for March and it never was or any communication that it was going to be.”
• “Have better communication with the teachers that are in the CPP by emailing or mailing them information.”
• “Find ways to make sure teachers know more about CPP and what they do to help families. I know of teachers that know nothing about it.”
• “Communication with the teachers and not just our director because she doesn't communicate with us on anything.”
• “Being easy to access ”
• “Email [teachers] not just directors.”
• “All good. Just continue.”
• “Nothing more.”
• “Advertising and more information to share with families about CPP.”
• It’s actually good.”
• “Monthly check ins but otherwise you do a great job!
• “Help with clear communication regarding student applications and what are considered excused absences.”
• “CPP is the best. I am not sure exactly how the market is on their end for enrollment. I believe they are getting the information out there because they provide the programs with enrolment information. But if there could be anything done to boost enrollment that would be great.”
• Cincinnati Preschool Promise can help be a better partner by continuing to communicate to find out about my preschool needs.”
• “Everything is great with your communication with me.”
• “Keep asking for our feedback. Make sure to really use the information gathered.”
• “Keep supporting the Providers.”

• “Provide a place for respite for child and family. Call and check on family when absent from school and community.”
• “Online learning.”
•
More activities and books sent to children, zoom meetings for parents with more information, help with after school projects. Health plans to keep kids safe while away but still connected and learning and having fun.”
•
Homework for children missing school.”
•
Have school Monday through Friday.”
•
Care packages, phone calls to kids to keep morale up, and constant/consistent communication with parents of what's happening and why.”
• “Support group for parents, monthly zoom meetings.”
• “CPP should reach out to individual families to understand their needs. Some families may need extra devices or headsets for online learning.”
• “Virtual meetings.”
• “Provide materials.”
• “Cleaning supplies and classroom supplies. During COVID-19, our art supplies were depleted.”
• “Continue the push to get children registered for preschool promise and extend the program during the summer months.
• “Check in on us and see what's going on and what we can probably do as a team to improve where we need to improve at.”
• “Offer some sort of financial assistance or offer human help in the form of filling out paperwork or substitutes.”

• “Remember we are human. Give out incentives.”
• “Call, check in on us, PPP supplies, food boxes.”
•
Continue to give incentives to the parents on keeping the children enrolled.”
•
Continue to offer supplies that are in demand such as masks, thermometers, gloves, sanitizer, paper towels, toilet paper, etc. This was a blessing in my preschool program.”
• “Continue with the extension of funding.”
• “Access to funding.”
•
How to find qualified teachers!
•
I can't think of anything everyone was very helpful as they could've been.
•
I felt very supported by CPP during COVID.”
•
Provide webinars and follow up calls to support us in understanding and implementing the rapidly changing rules. Provide hard to get supplies such as sanitizer, masks, and cleaning wipes.”
•
Very helpful each summer when the parents do not have to pay the full fee. Each year
CPP has been so stupendous in getting those funds to reduce children staying home alone.”
•
Making sure that Providers know where to access supplies such as safety and food supplies.”
•
Making sure that centers can still pay their staff when closed. Cleaning and safety supplies.

• “Wages that are not just comparable to early childhood education but also what's offered in other types of positions/jobs like restaurants, grocery, etc.”
• “Preschool teachers love what they do or they wouldn't do it because the pay is horrible and if you are a single mother, you will never be able to support yourself or your children even with the preschool promise grant. A mandatory pay hike for preschool teachers is the only way employers are going to cough up the money they say they don't have.”
• “Pay and more support in the classroom. More support for the challenging behaviors.”
• “More support in classrooms. Contacts from other disciplines (medical, behavioral, social work, etc.) to provide resources and guidance for difficult situations or behaviors.”

• “More support in the classroom with social and emotional needs for the children. Lower the teacher to student ratio. Having more time off throughout the year. This job is hard, and your mind needs breaks, and vacations just as though you’re in a public school setting. We can’t take a vacation when others are out. Being shorthanded makes it even more difficult to take time off. When you want a vacation it's almost harder to leave than to just stay and teach because you need to make sure the lessons are understandable for the substitute teacher, if you’re lucky enough to get one. We have to make sure all lessons are ready for when we return or the classroom will be in better or worse shape than when you left. We need mental breaks too.”
• “More money and more help with children that have issues.”
• “I feel well supported.”
• “Improve how we are talked to by directors.”
• “Change our hourly wage.”
• “Pay, materials, and feeling appreciated. A lot of times we aren't included in teacher discounts because we don't have school IDs.”
• “Better pay, more trainings, a learning ear, and mental health days.”
• “Ensure that the atmosphere is pleasant and positive and that the teachers are not overburdened.”
• “We paid for payroll, which freed up funds for other experiences like hatching 10 out of 12 chicken eggs with our students.”
• “To pay overhead operating cost.”
• “The grant funds helped my preschool with financial opportunities, resources, and materials, outdoor play equipment, music equipment, electronics for children, etc.”
• “Technology & staff retention.”
• “SUTQ requirements.”
• “Purchase materials and provide bonuses.”
• “The majority of the funds have been used or allocated towards staff retention along with COVID testing and prevention equipment.”
• “It helps in so many ways for both staff and materials used for the preschool.”
• “It helped us cover costs for trainings and salary when we had smaller class sizes.”
• “I was able to purchase more materials and equipment for childcare.”
• “I was able to expand my playground, pay myself, and buy more supplies for the children.”
• “Helped with operation costs and retention bonuses.”
• “Helped keep it open. I had decreases in enrollments due to COVID. Trying to keep numbers low to not spread the virus. I got three infants that keep a runny nose and cough.”
• “Defray costs of PPE and testing supplies, sign on bonuses, and premium pay.”
• “Buying new materials, increasing wages, outside improvements/repairs, family engagement.”

• “Because of the pandemic, a lot of kids will probably have social anxiety so maybe doing an introduction class with the parents and teachers that they kids will be with during the day might help,”
• “Continue to inform parents about all the resources and services they offer.”
• “Cost is a big factor, but we are willing to pay more for preschool programs that are tailored to our child’s unique learning needs and abilities.”
• “A lack of preschool options that accommodate attachment parenting styles.”
• “Her first year of school so I want to make sure the environment is a place she will be comfortable.”
• “How long the waiting time will be? How diverse the class is? How much is tuition? How far the preschool is from my location? Is there a summer program?”
• “I don’t qualify for assistance, and it should be free to all who want their child to attend the program.”
• “I expect my children to want to go to class every day. If my child starts coming home and not overall enjoying the day, then there is a problem in the classroom.”
• “I think since they are fragile of growing emotionally, socially, and even physically. Bringing in doctors, dentists, nutritionists, and therapists to support them and their families or offering services or resources while young can go a long way to produce children who will be successful and productive to society.”
• “I am concerned about my child’s safety. There have been a lot of childcare centers on the news for abuse of children. Her safety is my number one priority.”
• “For me personally, your child is going to learn more than just the basic things that you think of preschool. STEM, things that get your creative juices flowing. There’s so much more to learn than just numbers and colors.”
• “Funding ends for the summer. I was shocked. Is there a way to support it throughout the summer?”

• “The expectation of what they will learn in school. How to deal with certain behaviors of children in schools.”
• “Some kids are not socially ready for kindergarten, but we don’t get funding for them to continue preschool so parents are forced to send them to kindergarten and end up repeating kindergarten or first grade.”
• “I need trainings during daytime or self paced options.”
• “It would be beneficial to have funding for children starting at 2.5 years.”
• “Parents need training about child development.”
• “Expand access to non CPS families.”
• “Create a Provider Directory for the public.”
• “The CPP site is difficult to navigate.”
• “Host neighborhood parent events so parents can network with other parents. For example, a carnival or book bag giveaway.”
• “We need time for self-care, doctors’ appointments, and training.”
• “They can’t just give materials and money to get quality.”
• “I would like support with the improvement of my center and any future needs to grow my preschool.”
• “It is likely that because the CPP process for application and reporting is time consuming and because we would not have many children who would qualify, it is likely that we would not participate.”
• “Too many hoops to join.”
• “We have a three year waiting list. We need more space.”

• “Do you think they will be expanding beyond the centers that they have? I looked at their website and there are none that are close to me. Something to consider would be offering it outside of Cincinnati Public Schools. We were in the district but had to relocate due to a housing situation. We could really benefit from it but based on where I live, I can’t drive that far, so having a center closer would be helpful.”
• “I’m so grateful for Preschool Promise. Without this funding, my child would not be in preschool, much less one of the best preschools in the area!”
• “Preschool is very supportive of getting kindergarten ready. Would appreciate more support in finding a kindergarten school.”
• “Absolutely loved it thank you for supporting my child and our first year as preschool parents.”
• “I am so happy and grateful to be a part of the program.”
• “I hate that no taxes come out of it, then I owe a bunch at tax time. I would rather it be taken out and just get a lower amount.”
• “I love the extra income. It pays for my work shoes and clothes along with classroom supplies and toys.”
• “It's has been such a blessing to be part of this program and my children also benefit from the grant funds when needed. Thanks again!”
• “Preschool Promise really helps me out with getting things for my classroom. Without it I might night be able to afford the things for my classroom.”
• “Thank you for the assistance money we do receive; it does help.”
• “I appreciate the monthly training classes for the teachers.”
• “Can CPP help out with tuition applications, copying paper, and ink?”
• “CPP has been a valuable asset to my program.”
• “Everyone I spoke to has been very open and helpful considering I didn't join the CPP team until COVID-19.”

• “I have enjoyed my partnership with Cincinnati Preschool Promise. CPP has helped my program in many ways to be successful. I look forward to continuing my partnership with CPP.”
• “I love working with Brandy who is always responsive.”
• “It has exceeded my expectations!”
• “My experience with CPP and the staff has been nothing but great. As a Provider, I feel that it is CPP that has recognized our worth in early education and has supported that value in many ways. Thank you for ALL you do, have done, and are willing to do.”
• “We have loved seeing how happy parents were with realizing they could afford to send their children to preschool.”

The Master Agreement for Preschool Expansion Services calls for Cincinnati Preschool Promise (the Preschool Expansion Organization, or “PEO”), to annually report data related to students served, community providers supported, and costs expended. This report is due to the Cincinnati Public School District and the United Way of Greater Cincinnati in July of each year. The data included herein have been compiled to fulfill this requirement. The Master Agreement calls for:
On July 15 of each year commencing July 15, 2017, the PEO shall provide an annual report on the services to be provided pursuant to this contract to the United Way and the School District. At a minimum, the annual report shall include:
A summary profile of the students who benefitted from Tuition Assistance, including data reflecting income level, race, and geographic participation
A summary profile of the Community Providers that have received Quality Improvement funding and the progress such Providers have achieved in increasing the Provider’s Star rating.
Breakdown of the costs expended by the PEO, including the amounts spent on Tuition Assistance, Quality Improvement, administrative costs, and other costs.
Financial results for the fiscal year ending on June 30, 2022, are expected in August 2022. When final results are available, they will be shared with the CPS Budget, Finance, and Growth Committees in order to meet our reporting requirements.
The data reported here will also inform Cincinnati Preschool Promise’s comprehensive 2021 2022 Annual Report to the Community, which will be released in the fall of 2022.
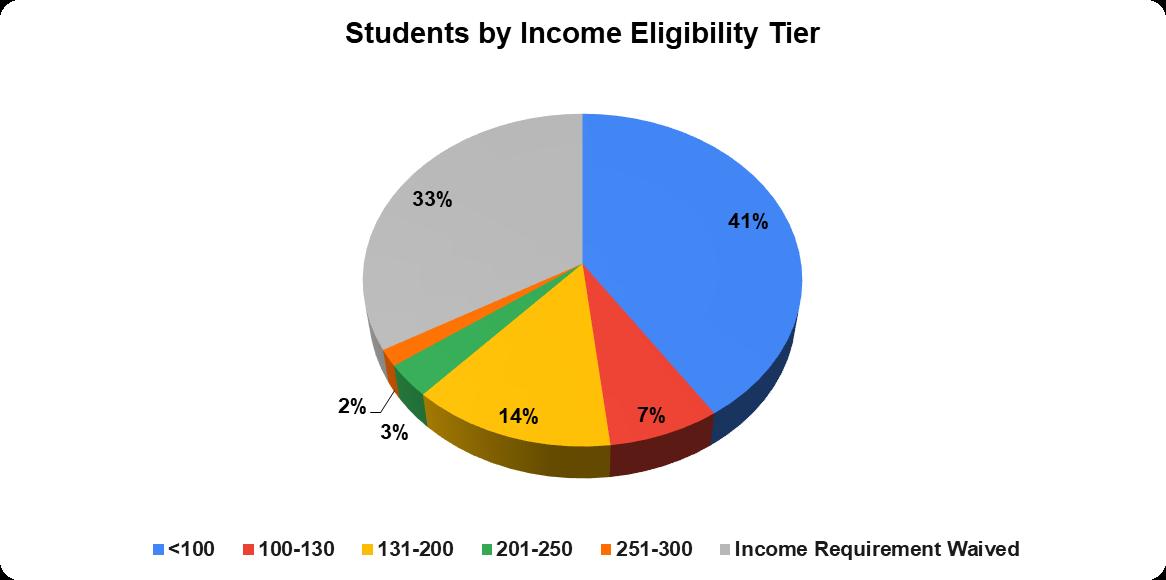

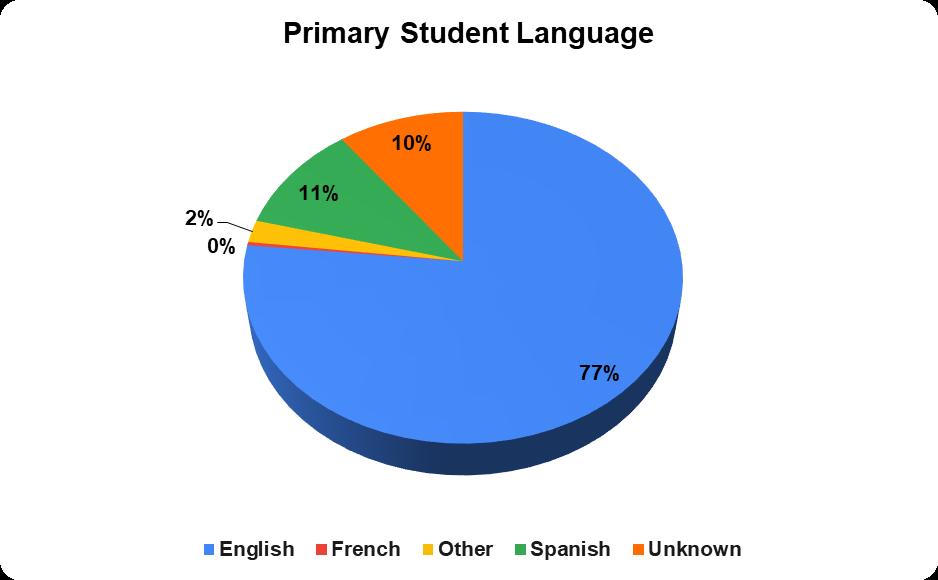
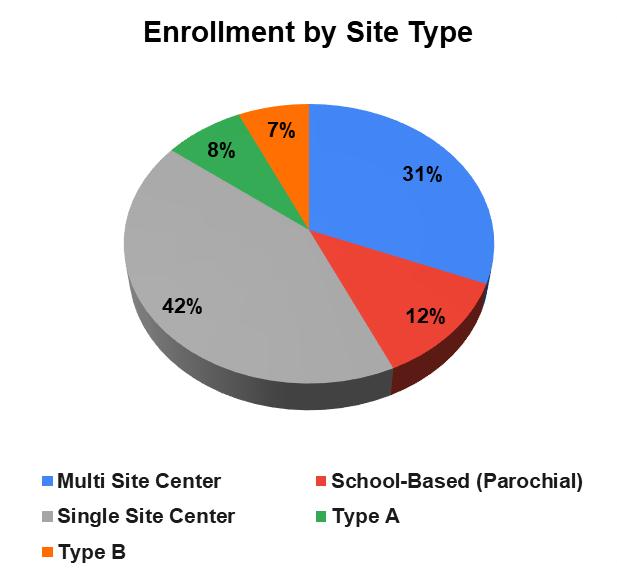
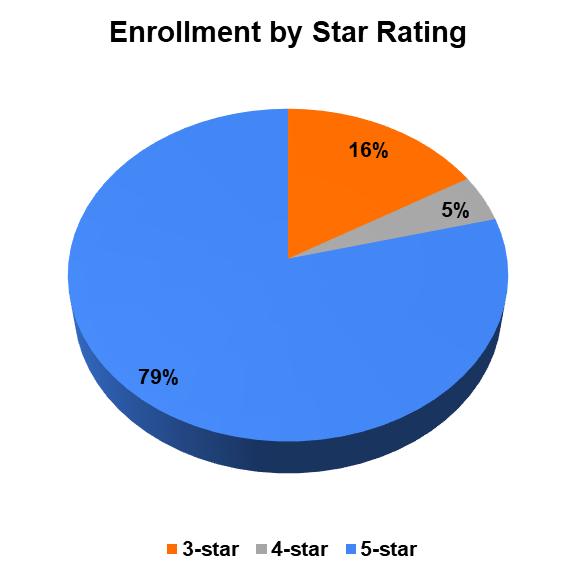
In what neighborhoods did 2021 22 students live?
Neighborhood Number of Students Quality Gap Neighborhood? % Per Neighborhood
Avondale 55 Yes 6%
Bond Hill 35 No 4%
Camp Washington 1 No 0%
Carthage 5 No 1%
Cheviot 13 No 1%
Clifton 12 Yes 1%
College Hill 17 No 2%
Columbia Tusculum 1 No 0%
Columbia Twp. 1 No 0%
Corryville 5 No 1%
Downtown 29 No 3%
East Price Hill 48 Yes 5%
East Walnut Hills 7 Yes 1%
East Westwood 15 Yes 2%
English Woods 7 No 1%
Evanston 28 Yes 3%
Golf Manor 11 No 1%
Hartwell 9 Yes 1%
Hyde Park 7 No 1%
Kennedy Heights 7 No 1%
Lower Price Hill 64 No 7%
Madisonville 13 No 1%
Millvale 7 No 1%
Mt. Airy 27 Yes 3%
Mt. Auburn 8 No 1%
Mt. Washington 14 Yes 2%
North Avondale 13 Yes 1%
North Fairmount 10 No 1%
Northside 10 No 1%
Oakley 6 No 1%
Other 5 No 1%
Over the Rhine 20 No 2%
Paddock Hills 5 No 1%
Pendleton 10 No 1%
Pleasant Ridge 21 No 2%
Roselawn 17 No 2%
Sayler Park 5 No 1%
Sedamsville 1 No 0%
Silverton 7 No 1%
South Cumminsville 2 No 0%
South Fairmount 12 No 1%
Villages at Roll Hill 18 No 2%
Walnut Hills 19 Yes 2%
West End 26 No 3%
West Price Hill 78 Yes 8%
Westwood 174 Yes 19%
Winton Hills 17 Yes 2%
Total 922 100%
showing
number
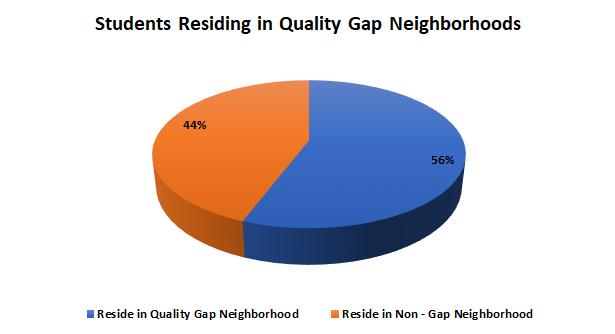
In what neighborhoods did students attend preschool?
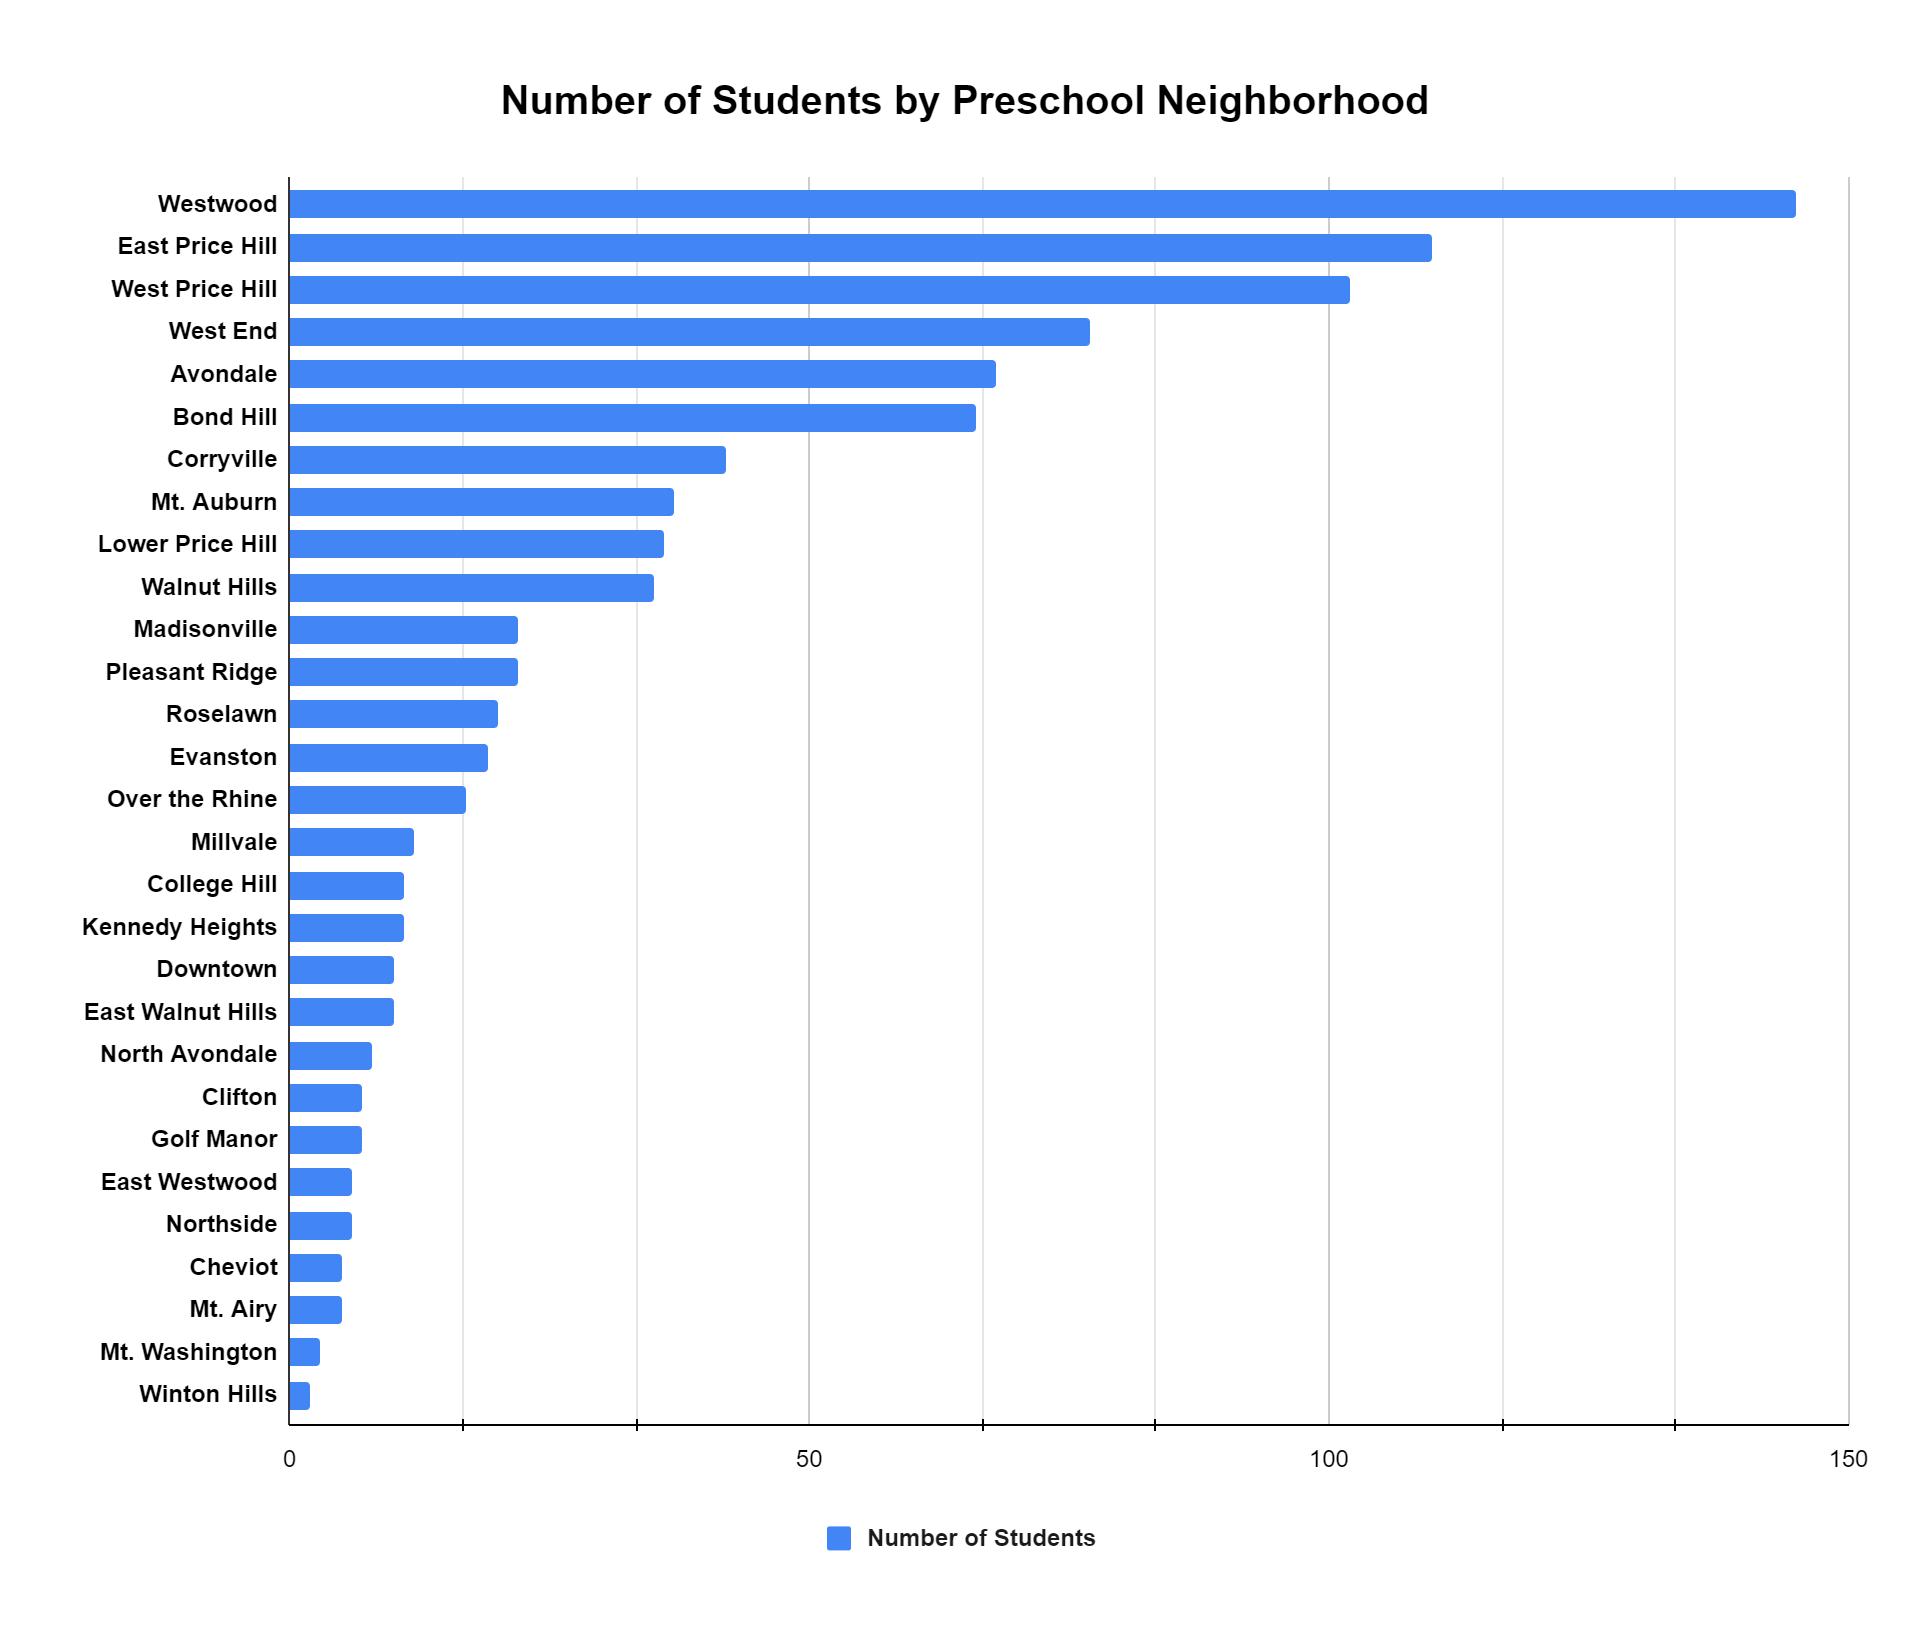
Neighborhood
Percent
Avondale 68 7.38%
Bond Hill 66 7.16%
Cheviot 5 0.54%
Clifton 7 0.76%
College Hill 11 1.19%
Coryville 42 4.56% Downtown 10 1.08%
East Price Hill 110 11.93%
East Walnut Hills 10 1.08%
East Westwood 6 0.65%
Evanston 19 2.06%
Golf Manor 7 0.76%
Kennedy Heights 11 1.19%
Lower Price Hill 36 3.90%
Madisonville 22 2.39% Millvale 12 1.30%
Mt. Airy 5 0.54%
Mt. Auburn 37 4.01%
Mt. Washington 3 0.33%
North Avondale 8 0.87%
Northside 6 0.65%
Over the Rhine 17 1.84%
Pleasant Ridge 22 2.39%
Roselawn 20 2.17%
Walnut Hills 35 3.80%
West End 77 8.35%
West Price Hill 102 11.06%
Westwood 145 15.73%
Winton Hills 2 0.22%
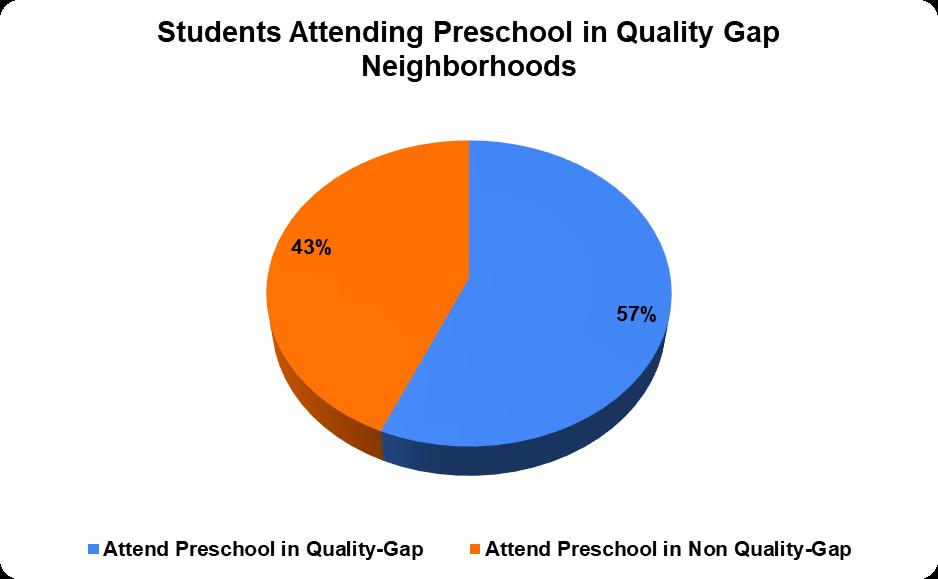
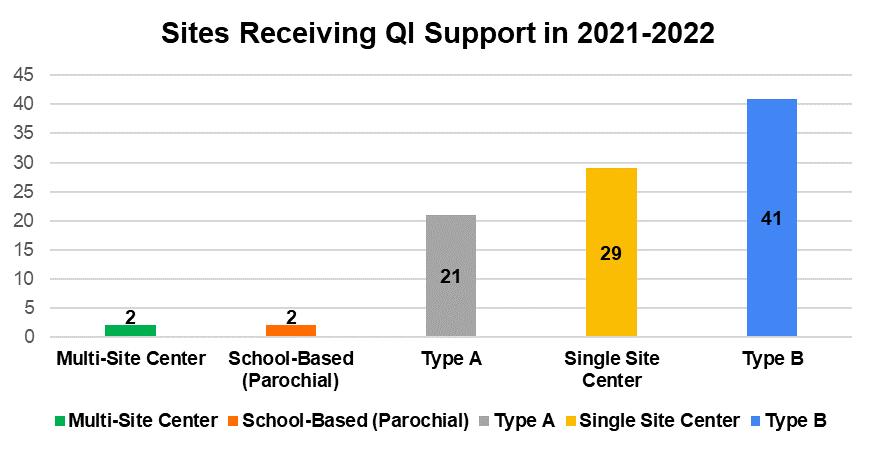
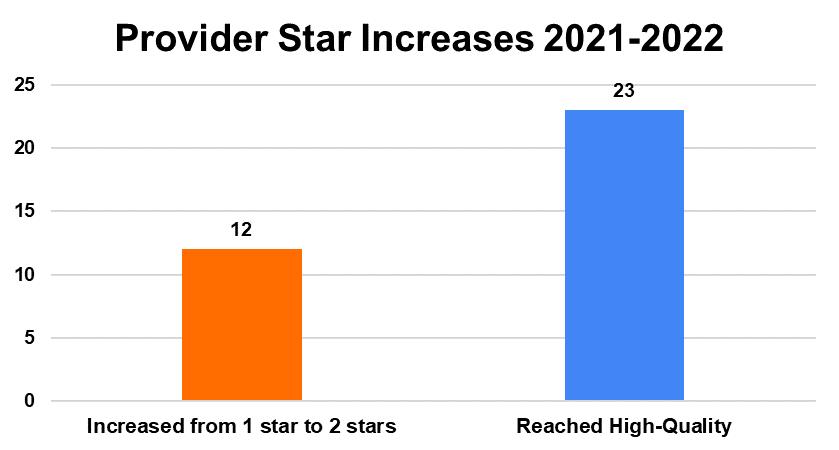
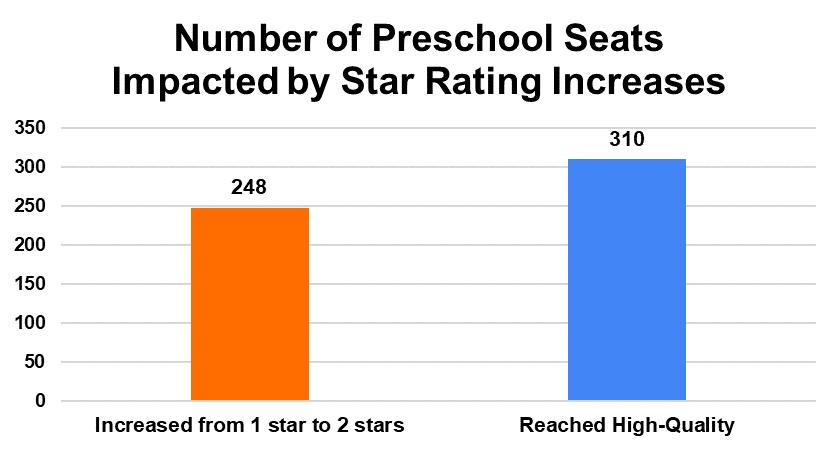

In which neighborhoods were the 2021 22 Quality Improvement Providers located, and how many seats were located in each neighborhood?
Neighborhood Number of Providers
Total Preschool Seats (including seats converted to High Quality)
Seats Converted to High Quality Quality Gap Neighborhood?
Avondale 6 124 20 Yes
Bond Hill 11 188 31 No
Carthage 2 36 No
Cheviot 2 36 24 No
Clifton 4 91 6 Yes
College Hill 6 70 6 No
East Price Hill 1 6 Yes
East Walnut Hills 1 21 Yes
English Woods 1 12 No
Evanston 3 18 6 Yes
Golf Manor 1 18 18 No
Hartwell 2 18 6 Yes
Lower Price Hill 3 24 No
Madisonville 5 94 6 No
Millvale 2 94 No
Mt. Airy 3 24 Yes
Mt. Auburn 2 18 No
North Fairmount 2 18 No
Northside 3 54 No
Pleasant Ridge 3 30 12 No
Roselawn 1 18 18 No
Silverton 3 24 No
Spring Grove Village 2 27 12 No
Springfield Twp. 1 6 No
Walnut Hills 4 70 32 Yes
West End 4 46 12 No
West Price Hill 4 46 20 Yes
Westwood 21 260 103 Yes
Winton Hills 1 6 Yes
Total 104 1,497 332
*Total includes 9 Quality Improvement Providers who converted to Tuition Assistance in 2021- 2022 but reached high quality in prior fiscal years.
Preschool Seats at
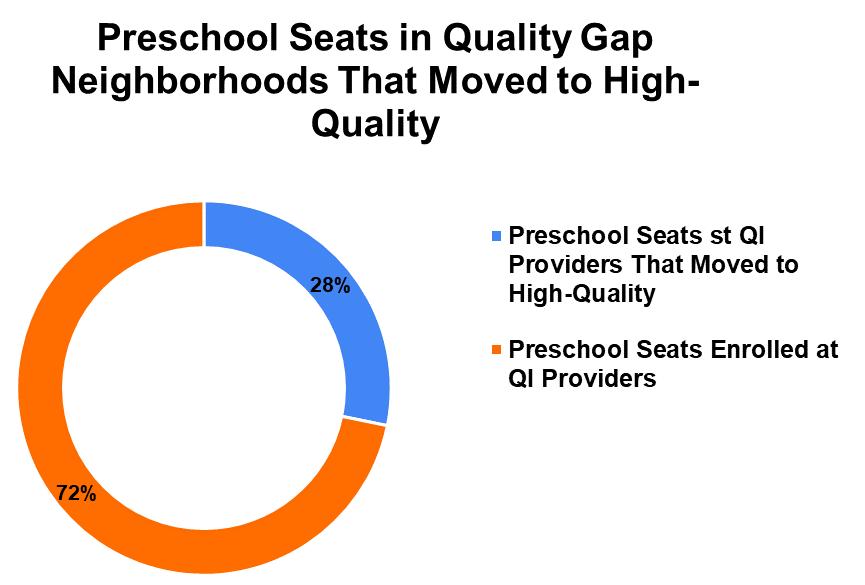
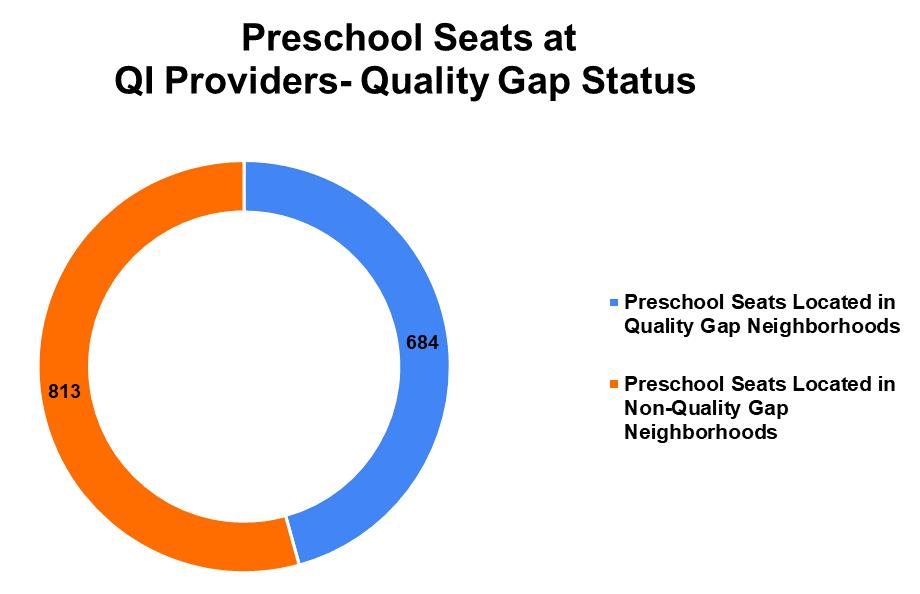
Located
Gap
Quality
Seats at
that
Seats*
In the 2021-22 school year, 62 new Lead Preschool Teachers from 38 Tuition Assistance Sites received Teacher Promise Grants (TPG) in the amount of up to $4,000/year.
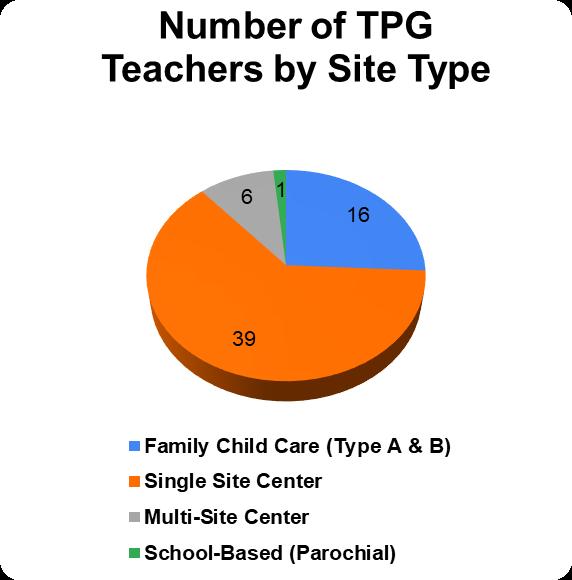
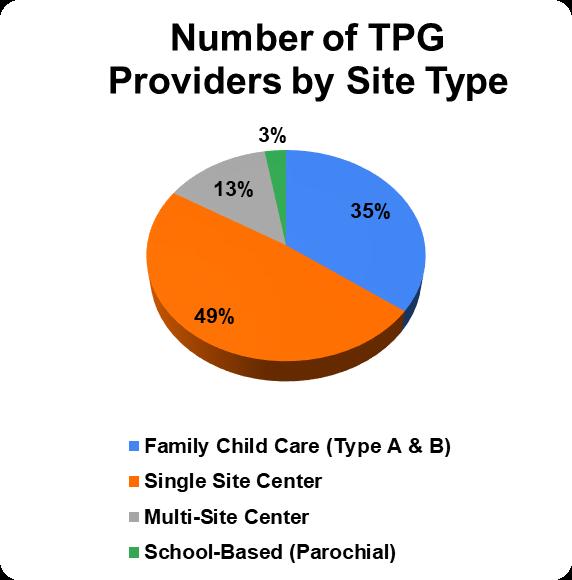
50 Teacher Promise Grant recipients continued to receive support through 2021-2022.
What
type?
How
In the 2021-22 school year,
Quality Improvement
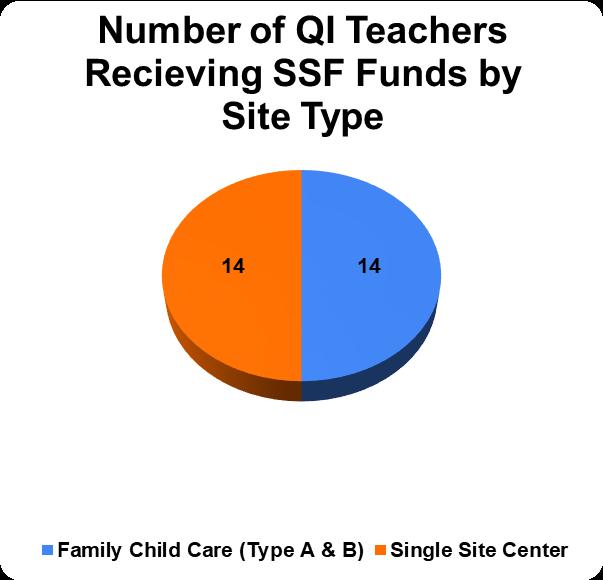
Support Fund
sites were awarded the
28 Lead and Assistant Preschool Teachers. Sites were awarded grants up to $3,000 per Lead teacher
Support Fund to provide support
to exceed $18,000 per site.
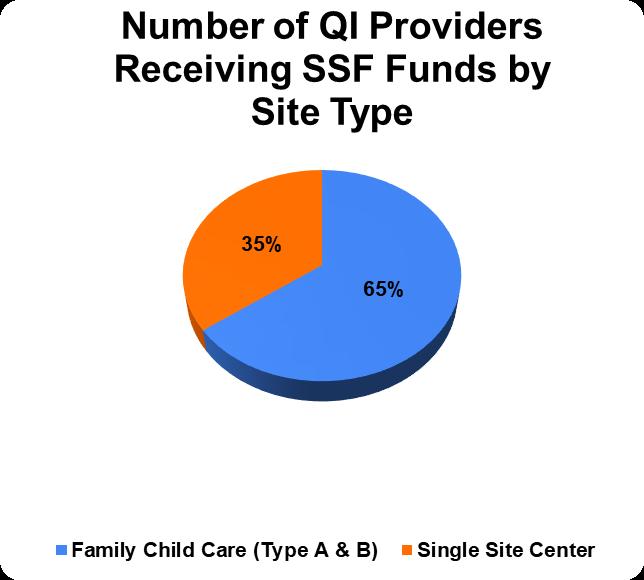



Do you want to do something satisfying and of great service to our community? Then join us! CPP needs volunteers to serve as CPP Ambassadors to support Community Providers, preschoolers, and their families in meaningful ways. CPP makes being a volunteer easy and fun! We have a place for everyone at any skill level. The only qualification required is your desire to help. Our opportunities for involvement are flexible and rewarding. Both individuals and organizations are welcomed as CPP Ambassadors and can fill various volunteer roles including, the following.
• Connectors – introduce CPP to organizations and groups that share our commitment to our stakeholders, including preschoolers, families, caregivers, teachers, and small business owners
• Outreach Team – attend community events, parades, festivals, & fairs to distribute info and share your excitement about CPP
• Marketing Matchmakers – share CPP with your clients, constituents, or membership by inviting a CPP speaker to address the group, distributing an e-message, or displaying info on-site
• Social Media – like, share, and post CPP information on your social media account and share with your networks
• Promise Readers – read your favorite children’s book and create a video to support preschoolers reading at home
Please consider joining us and asking your friends, associates, membership, and partnering organizations to join us as CPP Ambassadors. Customized training and CPP swag is offered to support your efforts. If you would like more information about Cincinnati Preschool Promise and what we are doing in the community, check out our website at www.cincy-promise.org or email marketing@cincy-promise.org
Select Cincinnati Preschool Promise when you shop Amazon. Amazon donates 0.5% of the price of eligible purchases. Sign in to smile.amazon.com on your desktop or mobile phone browser and designate Cincinnati Preschool Promise as your charitable organization.
