
Bungendore Market Update 2nd Half 2025

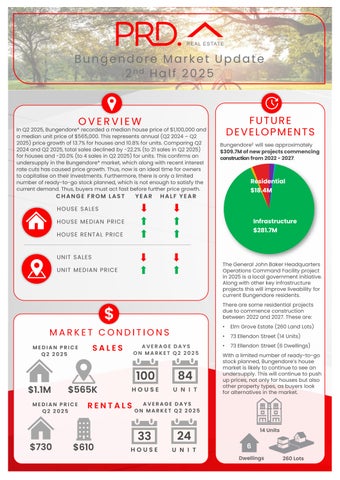
In Q2 2025, Bungendore* recorded a median house price of $1,100,000 and a median unit price of $565,000.This represents annual (Q2 2024 – Q2 2025)price growth of 13.7% for houses and 10.8%for units. Comparing Q2 2024and Q2 2025,total sales declined by -22.2%(to 21sales in Q2 2025) for houses and -20.0% (to 4 sales in Q2 2025)for units. This confirms an undersupply in the Bungendore* market, which along with recent interest rate cuts has caused price growth. Thus,now is anideal time for owners to capitalise on their investments. Furthermore, there is only a limited number of ready-to-go stock planned, which is not enough to satisfy the current demand. Thus,buyers must act fast before further price growth. 100 $1.1M $565K


Bungendore£ will see approximately $309.7Mofnewprojectscommencing constructionfrom2022-2027


HOUSE SALES
FROM LAST HOUSE MEDIAN PRICE HOUSE RENTAL PRICE
PRICE
HALF YEAR

MEDIAN PRICE Q2 2025

MEDIAN PRICE Q2 2025
AVERAGE DAYS ON MARKET Q2 2025
AVERAGE DAYS ON MARKET Q2 2025


The General JohnBaker Headquarters Operations Command Facility project in 2025is a local government initiative. Along with other key infrastructure projects this will improve liveability for current Bungendore residents.
There are some residential projects due tocommence construction between 2022and 2027. These are:
• Elm Grove Estate (260 Land Lots)
• 73Ellendon Street (14 Units)
• 73Ellendon Street (6 Dwellings)
With a limited number of ready-to-go stock planned, Bungendore’s house market is likely to continue tosee an undersupply. This will continue topush up prices, not only for houses butalso other property types, as buyers look for alternatives in the market.


AVERAGE VENDOR DISCOUNT*
Average vendor discount reflects the average percentage difference between the first list price and final sold price. A lower percentage difference (closer to 0.0%) suggests that buyers are willing to purchase close to the first asking price of a property.


Average house vendor discounts between Q2 2024and Q2 2025have widened slightly, from a discount of -5.4% to -5.9%. Similarly, vacantland discounts have also widened, from -1.9% to -3.5% in Q2 2025. House and land buyers are benefiting from slightly higher discounts that 12 months prior, which is welcomed news due to higher property prices. Now is in ideal time for buyers to enter the market.


The suburb of Bungendore has outperformed the wider Queanbeyan-Palerang Local Government Area (LGA) in median house price for the past 5 years. This continued to be the case in 2025#,with both houses and vacant land seeing significant price growth compared to the wider LGA; which remained relatively steady.
Most of the homes sold in Bungendore* across 2024/25# were split between the most affordable price bracket of less than$949,999(34.3%) and the premium price point, of $1.25Mand above (23.4%). Vacantland had most sales split between the more affordable and middle-priced brackets of $400,000- $499,999(36.0%) and $500,000$599,999(32.0%). Overall, this indicates there is a home for every budget in Bungendore*.
MARKET COMPARISON
Bungendore House
Queanbeyan-Palerang LGA House Bungendore Vacant Land Queanbeyan-Palerang LGA Vacant Land
The market comparison graph provides a comparative trend for median price of houses and units over the past 5 years. The main LGA chosen was based on their proximity to the main suburb analysed, which is Bungendore.


2024/25 #


than$399,999
$400,000 to $499,999
$500,000 to $599,999
$600,000to $699,999
$700,000and above
RENTAL GROWTH 2025€
House rental yields in Bungendore¥ was 3.3%as of June 2025, which is slightly below with the Queanbeyan-Palerang LGA (3.6%) and the Canberra Metro (3.5%). That said, median house rental price increased by 4.3% in the past 12 months to Q2 2025,at $730per week. In the same timeframe the number of houses rented decreased, by -28.6% (to 15 houses) in Q2 2025. This suggests a significant undersupply in the house rental market, which is beneficial for investors, even if the median house sale price (thus entry price) have increased in the past 12 months.
2-bedroom houses have provided investors with +9.6%rental growth annually, achieving a median rent of $548per week.
Bungendore¥ recorded a vacancy rate of 2.3% in June 2025, well above the QueanbeyanPalerang LGA average of 1.1% and Canberra Metro’s 1.5%. Vacancy rates have fluctuated in the past 12months, but overall showed a declining pattern, which indicates aneven tighter rental market. Furthermore, a 2.3%vacancy rate is still below the Real Estate Institution of Australia’s healthy benchmark of 3.0%, indicating quicker occupancy rates of rental homes in Bungendore¥
RENTAL VACANCY RATES 2025

Bungendore (2621)
Queanbeyan-Palerang LGA Canberra Metro REIA 'Healthy' Benchmark

Bungendore (2621)¥

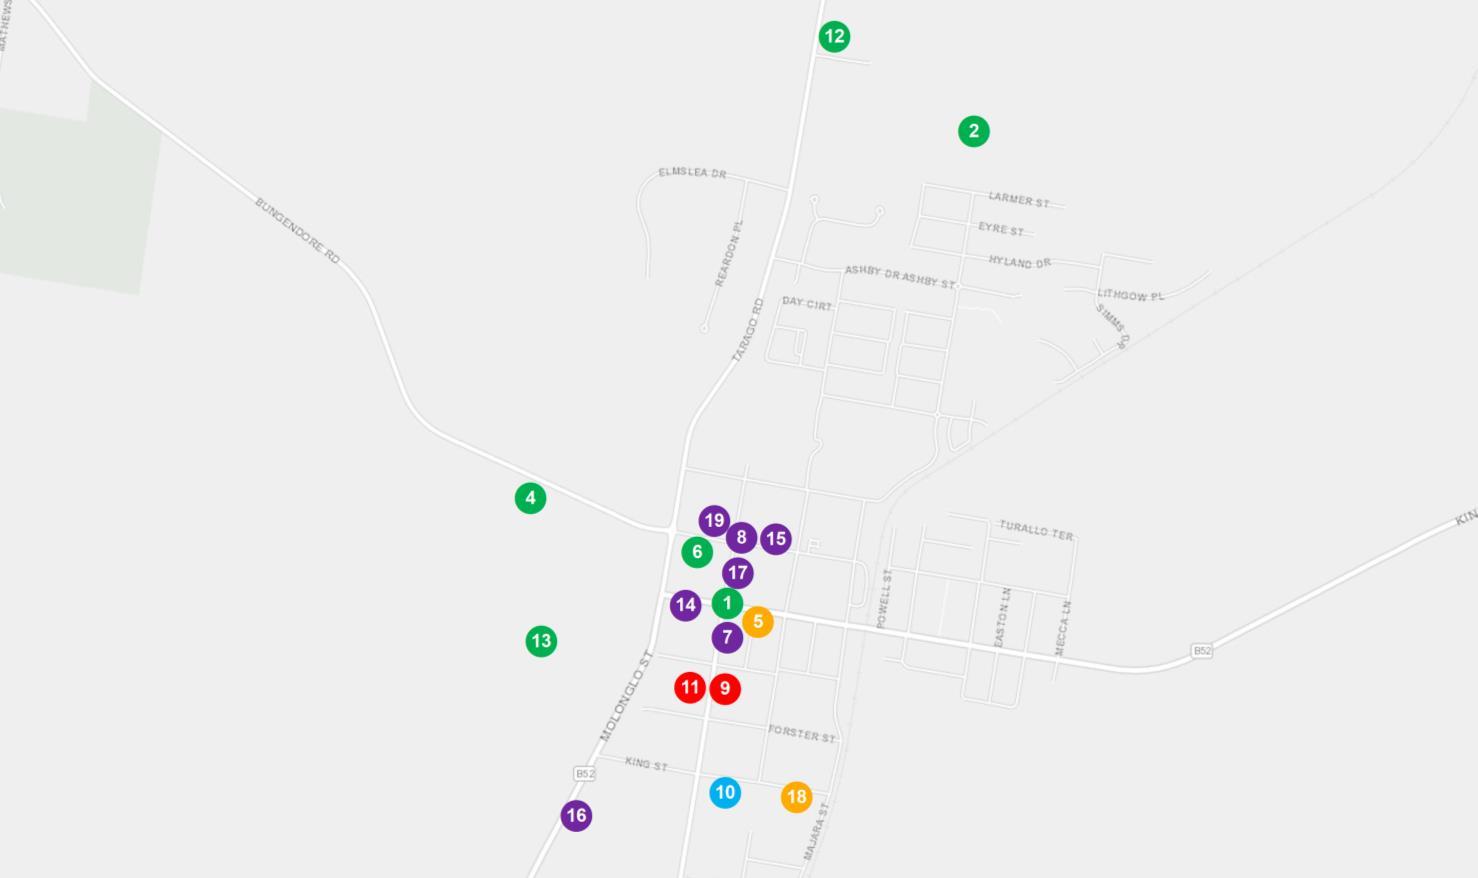
PROJECT DEVELOPMENT MAP 2022-2026 ₳

BUNGENDORE

RESEARCH SERVICES
Our research services span over every suburb, LGA,and state within Australia; captured in a variety of standard and customised products, andinclude:
• Advisory and consultancy
• Market analysis including profiling and trends
• Primary qualitative and quantitative research
• Demographic and target market analysis
• Geographic information mapping
• Project analysis including product and pricing recommendations
• Rental and investment return analysis
OUR KNOWLEDGE
Access to accurate and objective research is the foundation of all good property decisions.
OUR PEOPLE
Our research team is made up of highly qualified researchers who focus solely on propertyanalysis.


REFERENCES
* Bungendore sales market data and key indicators encapsulates aggregate property market conditions within the suburb of Bungendore.
** Estimated values are based on construction value provided by the relevant data authority and does not reflect commercial and/or re-sale value.
# 2024/25encapsulates sales transactions for the 2024 full year (01/01/2024 – 31/12/2024)and 1st half 2025 (01/01/2025 – 30/06/2025).
€ Annual rental growth is a comparison between Q2 2024 (01/04/2024 – 30/06/2024) and Q2 2025 (01/04/2025 – 30/06/2025) house median rent figures.
¥ Bungendore rental market data encapsulates aggregate property conditions within the postcode of 2621.
§ Rental yields shown are as reported as of June 2025.
₳ Project development map showcases a sample of upcoming projects only, due to accuracy of addresses provided by the data provider for geocoding purposes.
£ Projects refers to the top developments within the suburb of Bungendore.
µ Estimated value is the value of construction costs provided by relevant data authority, it does not reflect the project’s sale/commercial value.
ψ Commencement date quoted for each project is an approximate only, as provided by the relevant data authority, PRD does not hold any liability to the exact date.
Source: APM Pricefinder, Cordell Connect database, SQM Research, Esri ArcGIS.
Disclaimer: PRD does not give any warranty in relation to the accuracy of the information contained in this report. If you intend to rely upon the information contained herein, you must take note that the information, figures and projections have been provided by various sources and have not been verified by us. We have no belief one way or the other in relation to the accuracy of such information, figures and projections. PRD will not be liable for any loss or damage resulting from any statement, figure, calculation or any other information that you rely upon that is contained in the material.
Prepared by PRD Research. © All medians and volumes are calculated by PRD Research. Use with written permission only. All other responsibilities disclaimed. © Copyright PRD 2025.
