
Toowoomba Market Update 2nd Half 2025


FROM LAST

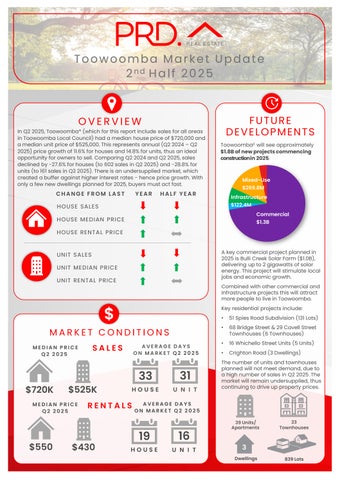
In Q2 2025, Toowoomba* (which for this report include sales for all areas in Toowoomba Local Council) had a median house price of $720,000and a median unit price of $525,000.This represents annual (Q2 2024 – Q2 2025)price growth of 11.6%for houses and 14.8%for units, thus anideal opportunity for owners to sell Comparing Q2 2024and Q2 2025,sales declined by -27.6% for houses (to 602sales in Q2 2025)and -28.8% for units (to 161 sales in Q2 2025). There is an undersupplied market, which created a buffer against higher interest rates - hence price growth. With only a few new dwellings planned for 2025, buyers must act fast. 33 $720K $525K

PRICE Q2 2025
AVERAGE DAYS ON MARKET Q2 2025
Toowoomba£ will see approximately $1.8Bofnewprojectscommencing constructionin2025
Q2 2025
AVERAGE DAYS ON MARKET Q2 2025


A key commercial project planned in 2025is Bulli Creek Solar Farm ($1.0B), delivering up to 2 gigawatts of solar energy. This project will stimulate local jobs and economic growth.
Combined with other commercial and infrastructure projects this will attract more people to live in Toowoomba.
Key residential projects include:
• 51 Spies Road Subdivision (131 Lots)
• 68 Bridge Street & 29Cavell Street Townhouses (6 Townhouses)
• 16 Whichello Street Units (5 Units)
• Crighton Road (3 Dwellings)
The number of units and townhouses planned will not meet demand, due to a high number of sales in Q2 2025.The market will remain undersupplied, thus continuing to drive up property prices.


AVERAGE VENDOR DISCOUNT*
Average vendor discount reflects the average percentage difference between the first list price and final sold price. A lower percentage difference (closer to 0.0%) suggests that buyers are willing to purchase close to the first asking price of a property.


Average vendor discounts between Q2 2024and Q2 2025 have remained at a premium, increasing to a premium of 2.0% for houses and 5.4% for units. Market conditions in Toowoomba* still favourowners, as the buyers must offer above the first list price. Interestingly unit average vendor premiums are higher than houses, due to many buyers needing to look at units because of low house stock.
The Toowoomba Local Government Area (LGA) has historically been more affordable than Greater Brisbane in both house and unit median prices. 2025#sawthis trend continued, which is beneficial to first home buyers.
The dominant proportion of houses sold in Toowoomba* in 2024/25#were in the premium price bracket above $850,000(25.4%), in good news for owners. Most of the units sold were in the middle-price bracket between $450,000to $549,999(28.3%),thus more opportunities for first home buyers. The most affordable options are still available, with 24.8%of houses sold below $549,999and 14.6%of units sold below $349,999. With a variety of price brackets still available, there is a home for every buyer’s needs and budget in Toowoomba*.
MARKET COMPARISON
Toowoomba LGA House
Greater Brisbane House Toowoomba LGA Unit Greater Brisbane Unit
The market


than $349,999 $350,000 to $449,999
$450,000 to $549,999
$550,000 to $649,999
$650,000 and above
RENTAL GROWTH 2025€
House rental yield in Toowoomba¥ was 4.1%as of June 2025, higher than Brisbane Metro’s 3.2%. This was paired with a 5.8% increase in median house rental price in the past 12months, at $550 per week, and a -4.2% decrease (to 543houses in Q2 2025)in the number of houses rented.
Average days onthe market declined by -5.0% in the past 18months, to a historical low level of 19 days. Combined, this suggests an undersupplied and highly competitive rental market. This is beneficial forinvestors looking for a more affordable investment option thanBrisbane Metro.
2+ bedroom houses have provided investors with +9.8%rental growth annually, achieving a median rent of $450per week.
Toowoomba¥ recorded a vacancy rate of 0.5% in June 2025,which is on par with Toowoomba LGA average (0.5%) but below Brisbane Metro’s average (0.9%). Vacancy rates in Toowoomba¥ remained stable in the past 12 months, thus a resilientt rental market. Further, a 0.5% vacancy rate is significantly below the Real Estate Institute of Australia’s healthy 3.0%benchmark. This presents quicker occupancy of rental homes and thus a sustainable investment environment.
RENTAL VACANCY RATES 2025

Toowoomba (4350) Toowoomba LGA Brisbane Metro REIA 'Healthy' Benchmark

RENTAL YIELD 2025
§

Toowoomba¥
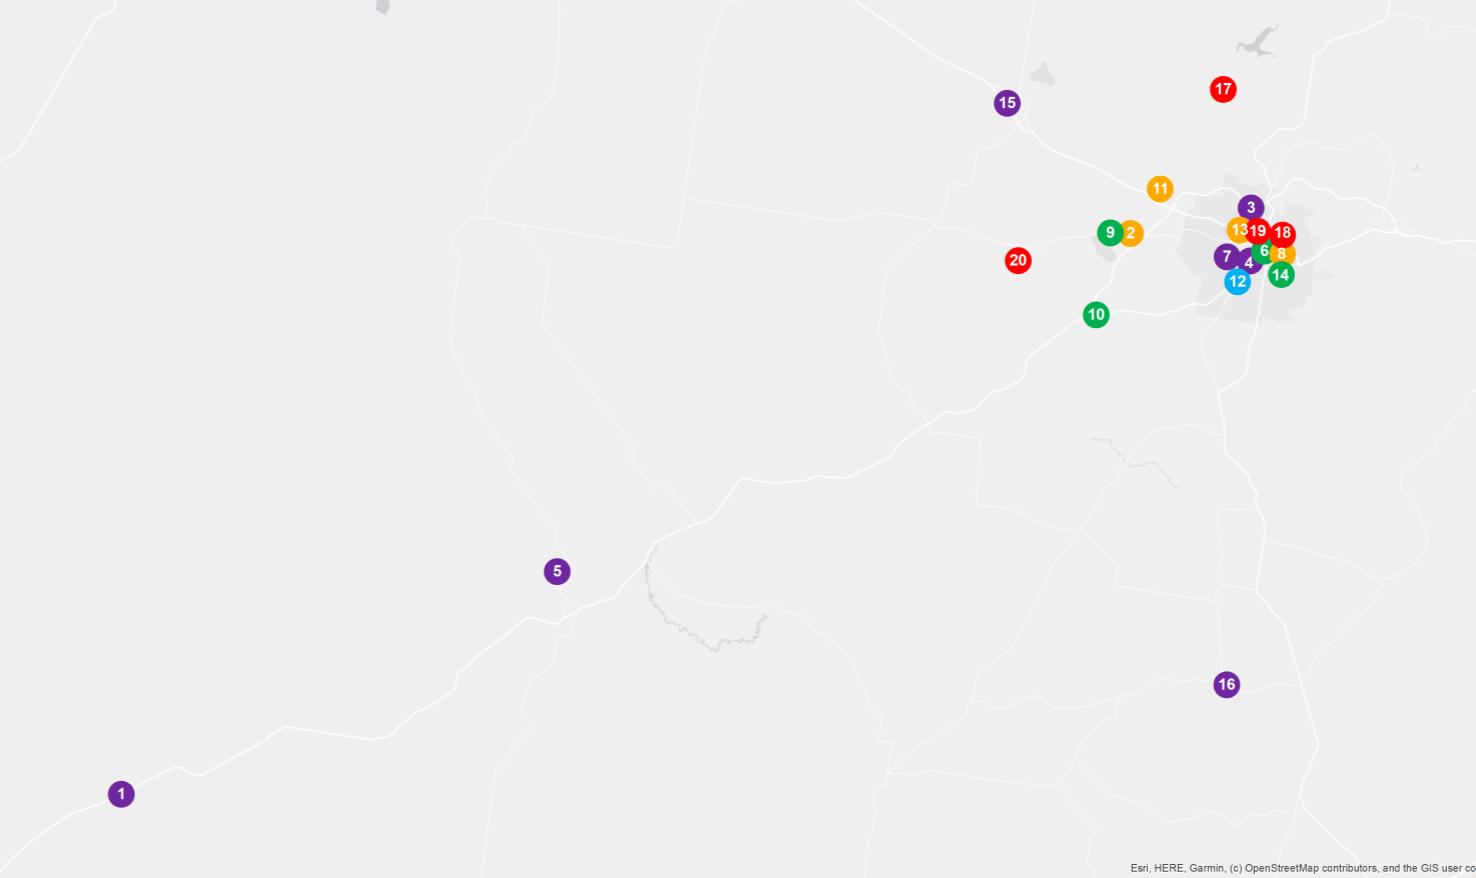
PROJECT DEVELOPMENT MAP 2025 ₳


RESEARCH SERVICES
Our research services span over every suburb, LGA,and state within Australia; captured in a variety of standard and customised products, andinclude:
• Advisory and consultancy
• Market analysis including profiling and trends
• Primary qualitative and quantitative research
• Demographic and target market analysis
• Geographic information mapping
• Project analysis including product and pricing recommendations
• Rental and investment return analysis
OUR KNOWLEDGE
Access to accurate and objective research is the foundation of all good property decisions.
OUR PEOPLE
Our research team is made up of highly qualified researchers who focus solely on propertyanalysis.


REFERENCES
* Toowoomba sales market data and key indicators encapsulates aggregate property market conditions within the Toowoomba Local Government Area.
** Estimated values are based on construction value provided by the relevant data authority and does not reflect commercial and/or re-sale value.
# 2025 encapsulates sales transactions for Q2 2025 (01/04/2025 – 30/06/2025) only, other years encapsulates sales transactions for the full year (i.e 01/01 to 31/12 of the relevant year).
€ Annual rental growth is a comparison between Q2 2024 (01/04/2024 – 30/06/2024) and Q2 2025 (01/04/2025 – 30/06/2025) house median rent figures.
¥ Toowoomba rental market data encapsulates aggregate property conditions within the postcode of 4350.
§ Rental yields shown are as reported as of June 2025.
₳ Project development map showcases a sample of upcoming projects only, due to accuracy of addresses provided by the data provider for geocoding purposes.
£ Projects refers to the top developments within the Toowoomba Local Government Area.
µ Estimated value is the value of construction costs provided by relevant data authority, it does not reflect the project’s sale/commercial value.
ψ Commencement date quoted for each project is an approximate only, as provided by the relevant data authority, PRD does not hold any liability to the exact date.
Source: APM Pricefinder, Cordell Connect database, SQM Research, Esri ArcGIS.
Disclaimer: PRD does not give any warranty in relation to the accuracy of the information contained in this report. If you intend to rely upon the information contained herein, you must take note that the information, figures and projections have been provided by various sources and have not been verified by us. We have no belief one way or the other in relation to the accuracy of such information, figures and projections. PRD will not be liable for any loss or damage resulting from any statement, figure, calculation or any other information that you rely upon that is contained in the material.
Prepared by PRD Research. © All medians and volumes are calculated by PRD Research. Use with written permission only. All other responsibilities disclaimed. © Copyright PRD 2025.