
Ashmore Market Update 2nd Half 2025

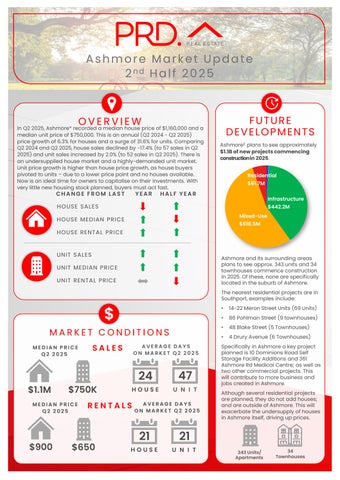
In Q2 2025, Ashmore* recorded a median house price of $1,160,000and a median unit price of $750,000.This is an annual (Q2 2024- Q22025) price growth of 6.3% for houses and a surge of 31.6%for units. Comparing Q2 2024and Q22025, house sales declined by -17.4% (to 57sales in Q2 2025)and unit sales increased by 2.0% (to 52sales in Q22025). There is an undersupplied house market and a highly-demanded unit market Unit price growth is higher than house price growth, as house buyers pivoted to units – due to a lower price point and no houses available. Now is an ideal time for owners tocapitalise ontheir investments. With very little new housing stock planned, buyers must act fast.

FROM LAST HOUSE MEDIAN PRICE HOUSE RENTAL PRICE


Ashmore£ plans tosee approximately $1.1Bofnewprojectscommencing constructionin2025
HALF
SALES
RENTAL PRICE

MEDIAN PRICE Q2 2025
$1.1M $750K
MEDIAN PRICE Q2 2025
AVERAGE DAYS ON MARKET Q2 2025
24
47 $650 HOUSE UNIT
AVERAGE DAYS ON MARKET Q2 2025


Ashmore and its surrounding areas plans to see approx. 343units and 34 townhouses commence construction in 2025. Of these, none are specifically located in the suburb of Ashmore.
The nearest residential projects are in Southport, examples include:
• 14-22 Meron Street Units (69 Units)
• 86 Pohlman Street (9 townhouses)
• 48 Blake Street (5 Townhouses)
• 4 Drury Avenue (6 Townhouses)
Specifically in Ashmore a key project planned is 10 Dominions Road Self Storage Facility Additions and 361 Ashmore Rd Medical Centre; as well as two other commercial projects. This will contribute to more business and jobs created in Ashmore.
Although several residential projects are planned, they do not add houses; and are outside of Ashmore. This will exacerbate the undersupply of houses in Ashmore itself, driving up prices.

21 21 $900 34 Townhouses 343Units/ Apartments

AVERAGE VENDOR DISCOUNT*
Average vendor discount reflects the average percentage difference between the first list price and final sold price. A lower percentage difference (closer to 0.0%) suggests that buyers are willing to purchase close to the first asking price of a property.


Average vendor discounts between Q2 2024and Q2 2025 have widened to -1.5% for houses, but tightened to a smaller premium of 0.4% for units. Although there seems to be a two-speed market (a discount and a premium), when compared to 12months prior (Q2 2024) market conditions in Ashmore* is increasingly favourable forbuyers. However, with very little new houses planned, buyers must act fast.
The suburb of Ashmore has historically offered a slightly more affordable median prices for both houses and units when compared tothe Gold Coast Local Government Area (LGA) for the past 5 years. This trend continued into 2025# , with units recording faster price growth thanhouses.
Most of the homes sold in Ashmore* in 2025# were in the most affordable price bracket of less than $999,999(31.2%) for houses, and less than $599,999(33.5%)for units. This is in opportunity for first-home buyers. However, the premium market still showed a strong presence, with 25.6%of houses sold above $1.3M and 12.6%units sold above $900,000.This benefits owners wishing to capitalise on their investments. There are also ample options in the middle price brackets, ensuring there is a home for varying budgets.
MARKET COMPARISON
$1,000,000
The market comparison graph provides a comparative trend for median price of houses and units over the past 5 years. The main LGA chosen was based on their proximity to the main suburb analysed, which is Ashmore.


PRICE BREAKDOWN 2025


than $599,999
$600,000 to $699,999
$700,000 to $799,999 $800,000 to $899,999
$900,000 and above
Ashmore (4214) House Gold Coast LGAHouse Ashmore (4214) Unit Gold Coast LGAUnit
RENTAL GROWTH 2025€
House rental yields in Ashmore¥ was 3.9%as of June 2025,higher thanGold Coast Main (3.8%) and Brisbane Metro (3.2%). This is paired with a 5.9%growth in median house rental price over the past 12 months to Q2 2025,at $900per week. At the same time, the number of houses rented decreased, by -15.8% (to 117 houses in Q22025). This indicates anundersupplied house rental market in Ashmore¥ , which suggests there is still room for investors to enter the market.
4+ bedroom houses have provided investors with a significant +9.6% rental growth annually, achieving a median rent of $1,000per week.
Ashmore¥ recorded a vacancy rate of 1.0% in June 2025,below the Gold Coast Main’s average of 1.7% but slightly above Brisbane Metro’s average of 09%. Vacancy rates have decreased in the past 12 months, from1.2% in June 2024, indicating a tighter rental market. Further, a 1.0% vacancy rate is still well below the Real Estate Institution of Australia’s healthy benchmark of 3.0%, indicating a quicker occupancyof rental homes in Ashmore¥. This creates a conductive environment for investors, even with a higher entry price in the past 12months to Q2 2025.
RENTAL VACANCY RATES 2025

Ashmore (4214) Gold Coast Main Brisbane Metro REIA 'Healthy' Benchmark

RENTAL YIELD 2025§

Ashmore¥
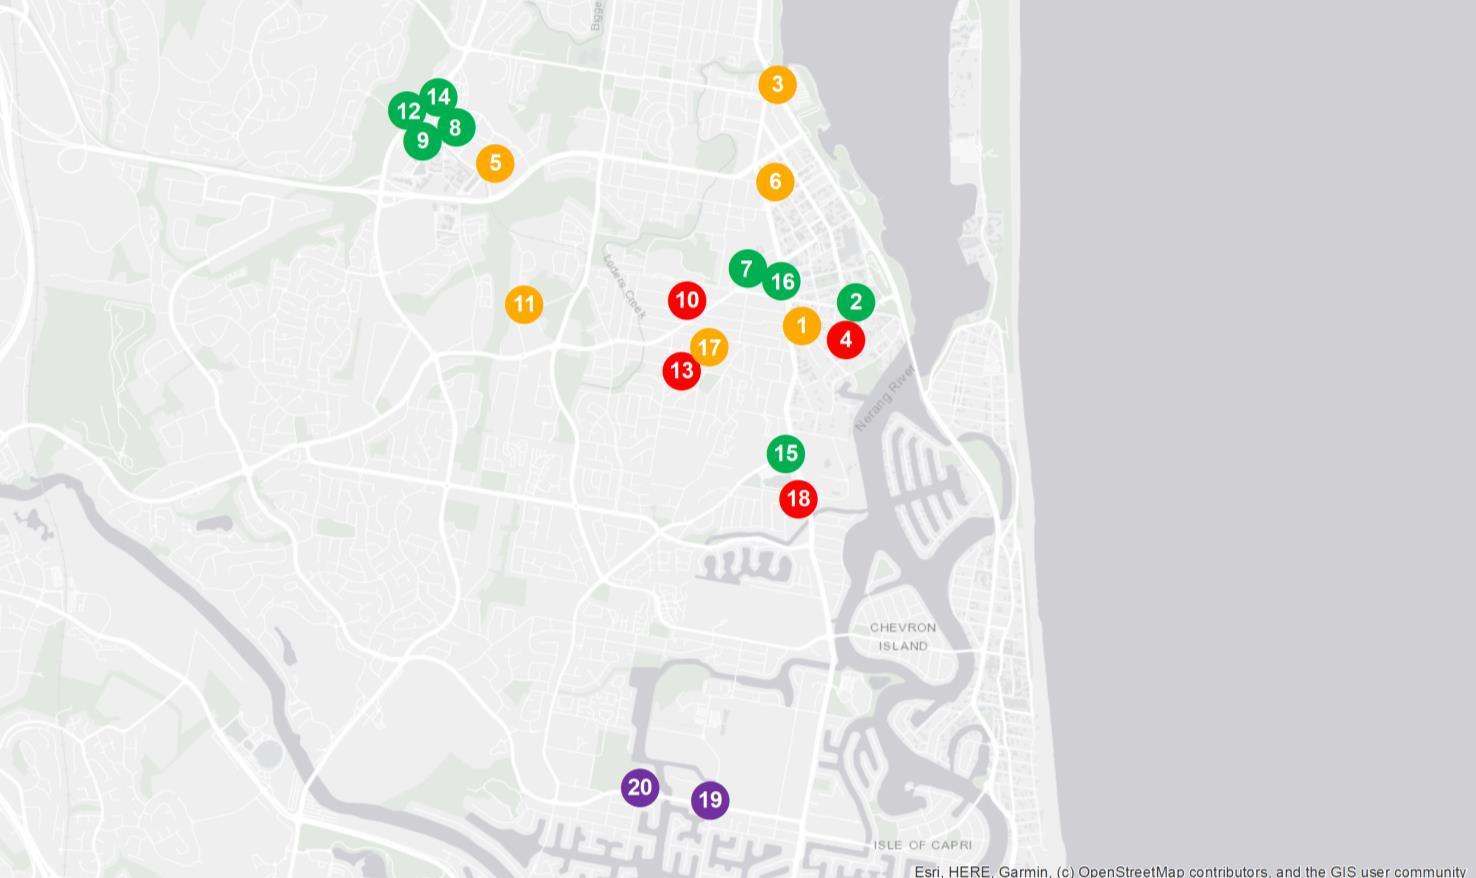
PROJECT DEVELOPMENT MAP 2025 ₳


RESEARCH SERVICES
Our research services span over every suburb, LGA,and state within Australia; captured in a variety of standard and customised products, andinclude:
• Advisory and consultancy
• Market analysis including profiling and trends
• Primary qualitative and quantitative research
• Demographic and target market analysis
• Geographic information mapping
• Project analysis including product and pricing recommendations
• Rental and investment return analysis
OUR KNOWLEDGE
Access to accurate and objective research is the foundation of all good property decisions.
OUR PEOPLE
Our research team is made up of highly qualified researchers who focus solely on propertyanalysis.


REFERENCES
* Ashmore sales market data and key indicators encapsulates aggregate property market conditions within suburbs of Ashmore and Molendinar.
** Estimated values are based on construction value provided by the relevant data authority and does not reflect commercial and/or re-sale value.
# 2025 encapsulates sales transactions for 1st Half 2025 (01/01/2025 – 30/06/2025) only, other years encapsulates sales transactions for the full year (i.e 01/01 to 31/12 of the relevant year)
€ Annual rental growth is a comparison between Q2 2024 (01/04/2024 – 30/06/2024) and Q2 2025 (01/04/2025 – 30/06/2025) house median rent figures.
¥ Ashmore rental market data encapsulates aggregate property conditions within the postcode of 4214.
§ Rental yields shown are as reported as of June 2025.
₳ Project development map showcases a sample of upcoming projects only, due to accuracy of addresses provided by the data provider for geocoding purposes.
£ Projects refers to the top developments within the suburbs of Ashmore, Benowa, Southport, and Bundall.
µ Estimated value is the value of construction costs provided by relevant data authority, it does not reflect the project’s sale/commercial value.
ψ Commencement date quoted for each project is an approximate only, as provided by the relevant data authority, PRD does not hold any liability to the exact date.
Source: APM Pricefinder, Cordell Connect database, SQM Research, Esri ArcGIS.
Disclaimer: PRD does not give any warranty in relation to the accuracy of the information contained in this report. If you intend to rely upon the information contained herein, you must take note that the information, figures and projections have been provided by various sources and have not been verified by us. We have no belief one way or the other in relation to the accuracy of such information, figures and projections. PRD will not be liable for any loss or damage resulting from any statement, figure, calculation or any other information that you rely upon that is contained in the material.
Prepared by PRD Research. © All medians and volumes are calculated by PRD Research. Use with written permission only. All other responsibilities disclaimed. © Copyright PRD 2025.