
Kyogle Market Update 2nd Half 2025

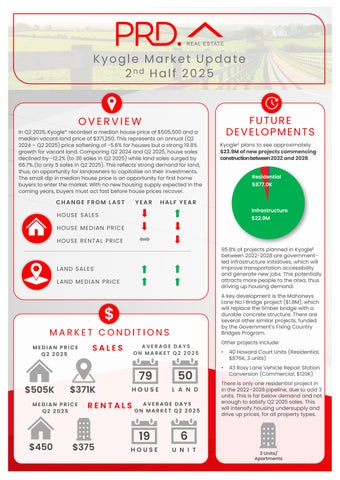
In Q2 2025, Kyogle* recorded a median house price of $505,500and a median vacant land price of $371,250.This represents an annual (Q2 2024– Q2 2025)price softening of -5.6% for houses buta strong 19.8% growth for vacant land Comparing Q2 2024and Q2 2025, house sales declined by -12.2% (to 36 sales in Q2 2025)while land sales surged by 66.7% (to only 5 sales in Q2 2025). This reflects strong demand for land, thus, an opportunity for landowners to capitalise ontheir investments. The small dip in median house price is an opportunity for first home buyers to enter the market. With no new housing supply expected in the coming years, buyers must actfast before house prices recover.
YEAR HALF YEAR CHANGE FROM LAST


Kyogle£ plans to see approximately $23.9Mofnewprojectscommencing constructionbetween2022and2028

HOUSE SALES
HOUSE MEDIAN PRICE
HOUSE RENTAL PRICE
LAND SALES
LAND MEDIAN PRICE

MEDIAN PRICE Q2 2025

$505K $371K
MEDIAN PRICE Q2 2025
AVERAGE DAYS ON MARKET Q2 2025
79
50 $375 HOUSE UNIT 19 6 $450
AVERAGE DAYS ON MARKET Q2 2025

95.8%of projects planned in Kyogle£ between 2022-2028are governmentled infrastructure initiatives, which will improve transportation accessibility and generate new jobs. This potentially attracts more people to the area, thus driving up housing demand.
A key development is the Mahoneys Lane No.1Bridge project ($1.8M), which will replace the timber bridge with a durable concrete structure. There are several other similar projects, funded by the Government’s Fixing Country Bridges Program.
Other projects include:
• 40 Howard Court Units (Residential, $876K,3 units)
• 43Roxy Lane Vehicle Repair Station Conversion (Commercial, $120K)
There is only one residential project in in the 2022–2028pipeline, due to add 3 units. This is far below demand and not enough to satisfy Q2 2025sales. This will intensify housing undersupply and drive up prices, forall property types.

AVERAGE VENDOR DISCOUNT*
Average vendor discount reflects the average percentage difference between the first list price and final sold price. A lower percentage difference (closer to 0.0%) suggests that buyers are willing to purchase close to the first asking price of a property.


Average vendor discounts between Q2 2024and Q2 2025 have remained relatively stable, at -5.6% for houses. The house market conditions in Kyogle* still favourbuyers, as sellers are willing to accept below the initial listing prices. Together with a slightly softer median house price in Q2 2025, this creates a unique opportunity for buyers. For owners, Q2 2025discounts are tighter than throughout 2024, thus final sale prices are closer to asking price.
The suburb of Kyogle has historically offered slightly more affordable house prices compared with the Kyogle LGA, while vacantland prices were onpar. This continued in 2025#,with prices trending in the same direction.
Most of the houses sold in Kyogle* in 2025#,were in the premium price brackets, with 30.7% of houses sold above $650,000,benefiting owners. This was followed by 25.6%of sales in the middle price range, of $450,000 to $549,999.In contrast, most of land sold were in the most affordable price point (less than $199,999)and more affordable price range ($200,000to $299,999); accounting for 28.6%of sales. This is positive news for first home buyers, despite median land price increasing in the past 12months.
MARKET COMPARISON
The market comparison graph provides a comparative trend for median price of houses and vacant land over the past 5 years. The main LGA chosen was based on their proximity to the main suburb analysed, which is Kyogle.


PRICE BREAKDOWN 2025


$200,000 to $299,999
$300,000 to $399,999
$400,000 to $499,999
$500,000 and above
RENTAL GROWTH 2025€
House rental yields in Kyogle¥ were 2.6%as of June 2025, which is lower than NSW North Coast (3.6%) and Gold Coast main (3.8%). Thatsaid, median house rental price in Kyogle¥ remained stable in the past 12months toQ2 2025, at $450per week. During this period, the number of houses rented declined significantly, by -53.3% (to only 7 rentals in Q2 2025). The unit market showed the same pattern. The rental market in Kyogle¥ is undersupplied , which is beneficial to investors – especially as Kyogle¥ has a more affordable median house price than Gold Coast.
2-bedroom houses have provided investors with +6.1%rental growth annually, achieving a median rent of $435per week.
Kyogle¥ recorded a vacancyrate of 1.4% in June 2025, above NSW North Coast’s 1.0% but below Gold Coast Main’s 1.7%. Vacancy rates have decreased slightly in the past 12months since June 2024,indicating an even tighter rental market Further, a 1.4%vacancy rate is below the Real Estate Institution of Australia’s healthy benchmark of 3.0%, indicating a quicker occupancy of rental homes. This confirms a sustainable and conductive investment environment in Kyogle¥ .
RENTAL VACANCY RATES 2025

Kyogle (2474) North Coast NSW Gold Coast Main REIA 'Healthy' Benchmark


× Kyogle* Large Dwelling Sales
× Kyogle* Large Dwelling Median Price
× Kyogle* Rural Land Sales
× Kyogle* Rural Land Median Price
In the past 12months to 2025# ,Kyogle* experienced a split market across property types. Large dwellings recorded a significant annual median price decline to$615,000, creating a timely opportunity for first home buyers. In contrast, rural land median price rose by 10.4% to $530,000,thus offering favourable conditions forowners looking to capitalise on their investments. Interest in large dwellings have declined significantly in the past 12months, recording only 17 sales in 2025#.This is the lowest number of sales in the past five years, in part due to current economic conditions.
In 2025#, the dominant proportion of large dwelling sales were in the premium price bracket above $750,000(46.2%). Middle price range also performed strongly, with 38.5%large dwellings sold between $550,000to $649,999.This is quite encouraging for owners who are looking to sell, considering median house price has softened overall (in the past 12 months to 2025#). Rural land sales were most active in the middle-price bracket between $450,000 to $549,999(50.0%), while the premium market of above $650,000and $550,000–$649,999ranges each accounted for25% of sales. Overall, house and land sales occurred across multiple price brackets, offering buyers greater choice.
The market comparison graph provides a comparative trend for large dwelling and rural land
(over 2 hectares) over the past 5years in Kyogle*.


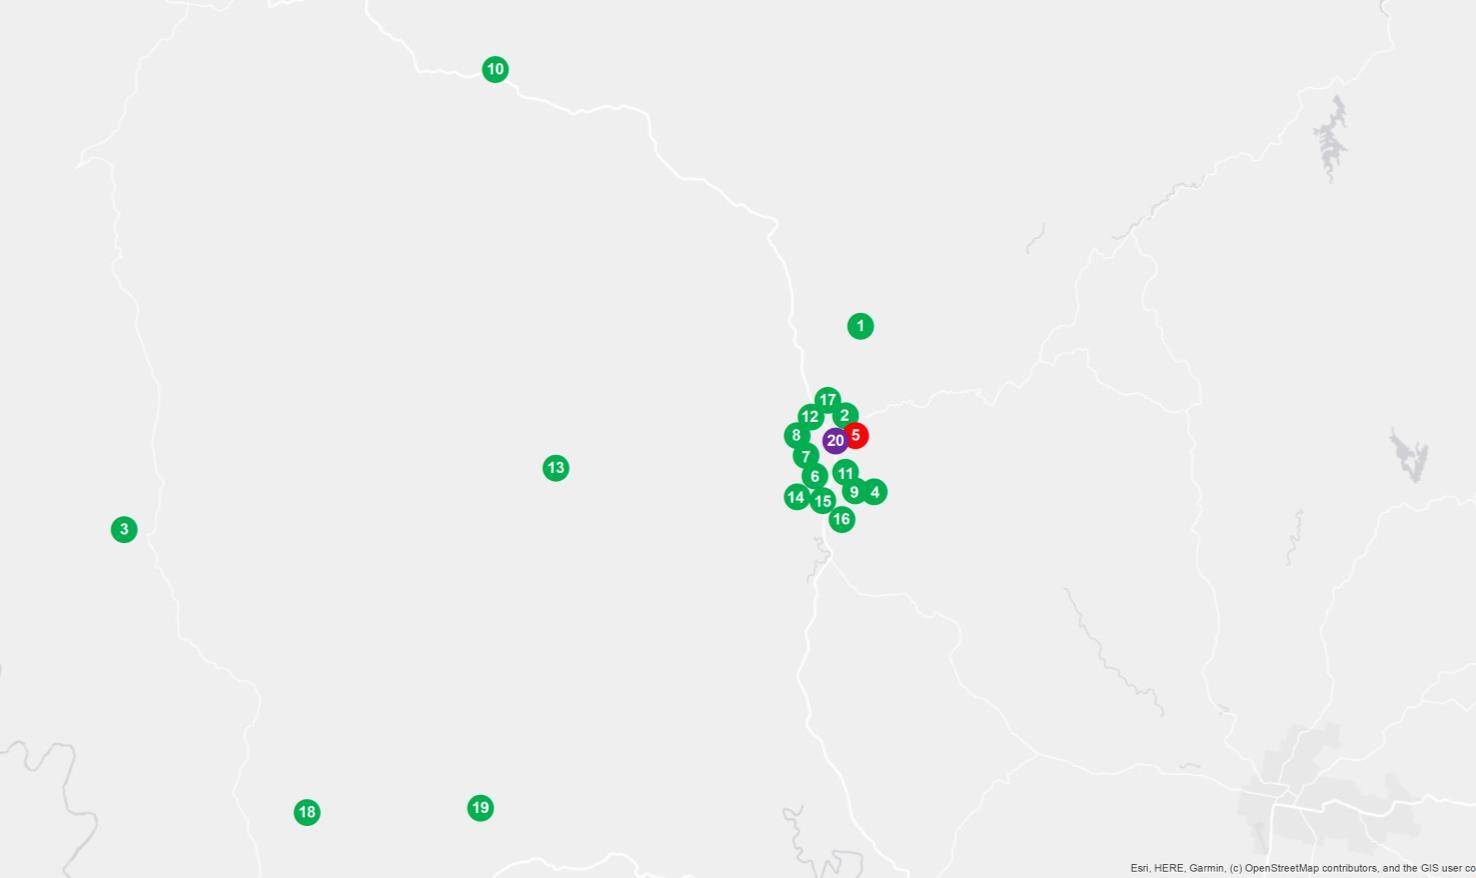
PROJECT DEVELOPMENT MAP 2022 TO 2028 ₳


RESEARCH SERVICES
Our research services span over every suburb, LGA,and state within Australia; captured in a variety of standard and customised products, andinclude:
• Advisory and consultancy
• Market analysis including profiling and trends
• Primary qualitative and quantitative research
• Demographic and target market analysis
• Geographic information mapping
• Project analysis including product and pricing recommendations
• Rental and investment return analysis
OUR KNOWLEDGE
Access to accurate and objective research is the foundation of all good property decisions.
OUR PEOPLE
Our research team is made up of highly qualified researchers who focus solely on propertyanalysis.


REFERENCES
* Kyogle sales market data and key indicators encapsulates aggregate property market conditions within the postcode of 2474, general residential properties only.
** Estimated values are based on construction value provided by the relevant data authority and does not reflect commercial and/or re-sale value.
*** Kyogle large dwelling and rural residential data encapsulates aggregate property conditions within the postcode of 2474 for General Residential + Large Lot Residential over 20,000 sqm.
# 2025 encapsulates sales transactions for 1st Half 2025 (01/01/2025 – 30/06/2025) only, other years encapsulates sales transactions for the full year (i.e 01/01 to 31/12 of the relevant year)
€ Annual rental growth is a comparison between Q2 2024 (01/04/2024 – 30/06/2024) and Q2 2025 (01/04/2025 – 30/06/2025) house median rent figures.
× Data encapsulates for Rural land and Large Dwellings with over 2 hectares in square metreage measurement only.
¥ Kyogle rental market data encapsulates aggregate property conditions within the postcode of 2474.
§ Rental yields shown are as reported as of June 2025.
₳ Project development map showcases a sample of upcoming projects only, due to accuracy of addresses provided by the data provider for geocoding purposes.
£ Projects refers to the top developments within the suburb of Kyogle.
µ Estimated value is the value of construction costs provided by relevant data authority, it does not reflect the project’s sale/commercial value.
ψ Commencement date quoted for each project is an approximate only, as provided by the relevant data authority, PRD does not hold any liability to the exact date.
Source: APM Pricefinder, Cordell Connect database, SQM Research, Esri ArcGIS.
Disclaimer: PRD does not give any warranty in relation to the accuracy of the information contained in this report. If you intend to rely upon the information contained herein, you must take note that the information, figures and projections have been provided by various sources and have not been verified by us. We have no belief one way or the other in relation to the accuracy of such information, figures and projections. PRD will not be liable for any loss or damage resulting from any statement, figure, calculation or any other information that you rely upon that is contained in the material.
Prepared by PRD Research. © All medians and volumes are calculated by PRD Research. Use with written permission only. All other responsibilities disclaimed. © Copyright PRD 2025.
