
Casino Market Update 2nd Half 2025

In Q2 2025, Casino* recorded a median house price of $487,000and a median unit price of $402,500.This is an annual (Q2 2024- Q2 2025) growth of 10.7% for houses, but a softening of -4.8% forunits. Comparing Q2 2024and Q22025, house sales grew by 8.3%(to 65 sales in Q2 2025) while unit sales surged by 128.6%(to 16 sales in Q2 2025).Despite the surge in unit sales, its volume remain small compared to houses. Price growth and higher sales suggest demand for houses is strong Units are now slightly more affordable for buyers; butwith limited ready-to-sell dwellings planned buyers must act fast before property prices increase.
CHANGE FROM LAST


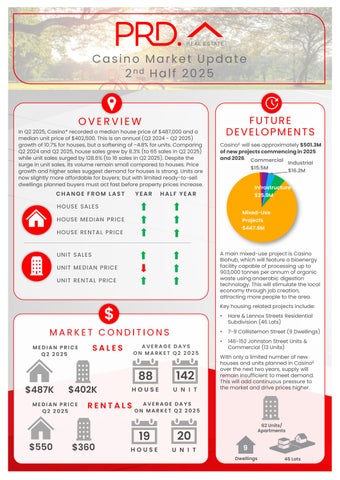
Casino£ will see approximately$501.3M ofnewprojectscommencingin2025 and2026
YEAR HALF YEAR
HOUSE SALES
HOUSE MEDIAN PRICE
HOUSE RENTAL PRICE UNIT SALES
UNIT MEDIAN PRICE UNIT RENTAL PRICE

MEDIAN PRICE Q2 2025
$487K $402K
MEDIAN PRICE Q2 2025
AVERAGE DAYS ON MARKET Q2 2025
88

Projects

A main mixed-use project is Casino Biohub, which will feature a bioenergy facility capable of processing up to 903,000tonnes per annum of organic waste using anaerobic digestion technology. This will stimulate the local economy through job creation, attracting more people to the area.
Key housing related projects include:
• Hare & Lennox Streets Residential Subdivision (46 Lots)
• 7-9 Callistemon Street (9 Dwellings)
• 146-152 JohnstonStreet Units & Commercial (13Units)
With only a limited number of new houses and units planned in Casino£ over the next two years, supply will remain insufficient to meet demand. This will add continuous pressure to the market and drive prices higher. 142
AVERAGE DAYS ON MARKET Q2 2025


AVERAGE VENDOR DISCOUNT*
Average vendor discount reflects the average percentage difference between the first list price and final sold price. A lower percentage difference (closer to 0.0%) suggests that buyers are willing to purchase close to the first asking price of a property.


Average vendor discounts between Q2 2024and Q2 2025 have tightened to -4.3% for houses but widened to -5.0% for units. Market conditions in Casino* still favourbuyers, with sellers willing toaccept below the first listed price. Unit average vendor discounts peaked in Q2 2025, making it anideal time to enter the market. Thatsaid, with little amount of new stock planned, this may not last long.
The suburb of Casino has historically provided a more affordable market for units than the wider Richmond Valley Local Government Area (LGA), while the median house price is generally on par. This continues in 2025# , with the LGA’s median unit price exceeding the Casino suburb’s median house price. This makes Casino a more affordable entry point forbuyers.
The dominant proportion of homes sold in Casino* in 2025# were in the most affordable brackets of less than $349,999(27.7%) for houses and less than $324,999 (26.0%) for units, in good news for fist home buyers. The premium price brackets are also strong for house (9.7% of sales above $650K) and units (20.0% of sales above $475K). Thus,there is a home forevery budget in Casino*.
MARKET COMPARISON
Casino (2470) House
Richmond Valley LGA House Casino (2470) Unit Richmond Valley LGA Unit
The market comparison graph provides a comparative trend for median price of houses and units over the past 5 years. The main LGA chosen was based on their proximity to the main suburb analysed, which is Casino.


PRICE BREAKDOWN 2025


$325,000 to $374,999
$375,000 to $424,999
$425,000 to $474,999
$475,000 and above
RENTAL GROWTH 2025€
House rental yields in Casino¥ were 3.5% as of June 2025,on par with NSW North Coast (3.6%) but higher than Sydney Metro (2.7%) average. This is paired with a median house rental price growth of 10.0%in the past 12 months to Q2 2025,at $550per week, and a significant decline of -61.5% in the number of housed rented (to only 20houses in Q2 2025). This indicates a clear undersupplied house rental market in Casino¥, thus the need for more investors.
3 bedroom houses have provided investors with +9.5% rental growth annually, achieving a median rent of $520per week.
Casino¥ recorded a vacancy rate of 0.6% in June 2025,below the New SouthWales North Coast’s average of 1.0% and Sydney Metro’s 1.6%. Vacancy rates have decreased in the past 12 months, which suggests an even tighter rental market. Furthermore, a 0.6% vacancyrate is well below the Real Estate Institution of Australia’s healthy benchmark of 3.0%, indicating quicker occupancy of rental homes in Casino¥. There is a conducive environment forinvestors, even if the median house price (thus entry price) has increased in the past 12 months to Q2 2025.
RENTAL VACANCY RATES 2025


PROJECT DEVELOPMENT MAP 2025 & 2026 ₳


RESEARCH SERVICES
Our research services span over every suburb, LGA,and state within Australia; capturedin a variety of standard and customised products, andinclude:
• Advisory and consultancy
• Market analysis including profiling and trends
• Primary qualitative and quantitative research
• Demographic and target market analysis
• Geographic information mapping
• Project analysis including product and pricing recommendations
• Rental and investment return analysis
OUR KNOWLEDGE
Access to accurate and objective research is the foundation of all good property decisions.
OUR PEOPLE
Our research team is made up of highly qualified researchers who focus solely on property analysis.


REFERENCES
* Casino sales market data and key indicators encapsulates aggregate property market conditions within the suburb of Casino.
** Estimated values are based on construction value provided by the relevant data authority and does not reflect commercial and/or re-sale value.
# 2025 encapsulates sales transactions for the 1st half of 2025 (01/01/2025 – 30/06/2025) only, other years encapsulates sales transactions for the full year (i.e 01/01 – 31/12 of the relevant year).
€ Annual rental growth is a comparison between Q2 2024 (01/04/2024 – 30/06/2024) and Q2 2025 (01/04/2025 – 30/06/2025) house median rent figures.
¥ Casino rental market data encapsulates aggregate property conditions within the postcode of 2470.
§ Rental yields shown are as reported as of June 2025.
₳ Project development map showcases a sample of upcoming projects only, due to accuracy of addresses provided by the data provider for geocoding purposes.
£ Projects refers to the top developments within the suburb of Casino.
µ Estimated value is the value of construction costs provided by relevant data authority, it does not reflect the project’s sale/commercial value.
ψ Commencement date quoted for each project is an approximate only, as provided by the relevant data authority, PRD does not hold any liability to the exact date.
Source: APM Pricefinder, Cordell Connect database, SQM Research, Esri ArcGIS.
Disclaimer: PRD does not give any warranty in relation to the accuracy of the information contained in this report. If you intend to rely upon the information contained herein, you must take note that the information, figures and projections have been provided by various sources and have not been verified by us. We have no belief one way or the other in relation to the accuracy of such information, figures and projections. PRD will not be liable for any loss or damage resulting from any statement, figure, calculation or any other information that you rely upon that is contained in the material.
Prepared by PRD Research. © All medians and volumes are calculated by PRD Research. Use with written permission only. All other responsibilities disclaimed. © Copyright PRD 2025.