
Bremer Valley Market Update 2nd Half 2025

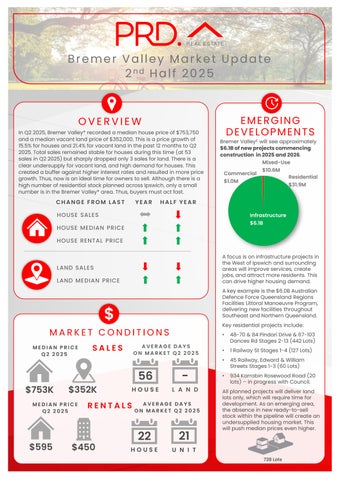
In Q2 2025, Bremer Valley* recorded a median house price of $753,750 and a median vacantland price of $352,000.This is a price growth of 15.5% for houses and 21.4%for vacantland in the past 12 months to Q2 2025. Total sales remained stable for houses during this time (at 53 sales in Q2 2025)but sharply dropped only 3 sales for land. There is a clear undersupply for vacantland, and high demand for houses. This created a buffer against higher interest rates and resulted in more price growth. Thus,now is anideal time for owners tosell. Although there is a high number of residential stock planned across Ipswich, only a small number is in the Bremer Valley* area. Thus,buyers must actfast.
YEAR HALF YEAR CHANGE FROM LAST


Bremer Valley£ will see approximately $6.1Bofnewprojectscommencing construction in2025and2026.
HOUSE SALES
HOUSE MEDIAN PRICE
HOUSE RENTAL PRICE
LAND SALES
LAND MEDIAN PRICE

MEDIAN PRICE Q2 2025

$753K $352K
MEDIAN PRICE Q2 2025
AVERAGE DAYS ON MARKET Q2 2025
56
AVERAGE DAYS ON MARKET Q2 2025

A focus is on infrastructure projects in the West of Ipswich and surrounding areas will improve services, create jobs, and attract more residents. This can drive higher housing demand.
A key example is the $6.0BAustralian Defence Force Queensland Regions Facilities Littoral Manoeuvre Program, delivering new facilities throughout Southeast and Northern Queensland
Key residential projects include:
• 48-70 & 84Pindari Drive & 67-103 Dances Rd Stages 2-13 (442 Lots)
• 1 Railway St Stages 1-4 (127 Lots)
• 45 Railway, Edward & William Streets Stages 1-3 (60 Lots)
• 934Karrabin Rosewood Road (20 lots) – in progress with Council.
All planned projects will deliver land lots only, which will require time for development. As an emerging area, the absence in new ready-to-sell stock within the pipeline will create an undersupplied housing market. This will push median prices even higher.


AVERAGE VENDOR DISCOUNT*
Average vendor discount reflects the average percentage difference between the first list price and final sold price. A lower percentage difference (closer to 0.0%) suggests that buyers are willing to purchase close to the first asking price of a property.


House
Average vendor discounts between Q2 2024 and Q2 2025 have swung from premiums to a discount of-1.0% for houses. Market conditions in Bremer Valley* has shifted to favour buyers, as sellers are accepting just below the initial listing prices. Q2 2025 records the highest discount since 2024, creating an opportunity for buyers amidst higher median house price in the past 12months to Q2 2025.
The suburb of Bremer Valley has historically presented a slightly more affordable market compared to the wider Ipswich Local Government Area (LGA), in both house and vacantland median prices for the past 5 years. 2025# saw this continue, although there were some expensive land sales for large parcels sales over 20,000sqm
The dominant proportion of houses sold in Bremer Valley* across 2025# were in the middle price bracket between $700,000to $799,999(37.8%) for houses and $337,500to $362,499(52.6%) for vacantland. The most affordable price point is available, with 7.2%houses sold less than $599,999and 5.3% vacantland sold less than $312,499.The premium market is active, with 17.1% of houses sold above $900k,benefiting owners and their investments.
MARKET COMPARISON
Bremer Valley (4340) House
Bremer Valley (4340) Vacant Land
Ipswich City LGA House
Ipswich City LGA Vacant Land
The market comparison graph provides a comparative trend for median price of houses and vacant land over the past 5years. The main LGA chosen was based on their proximity to the main suburb analysed, which is Bremer Valley.


PRICE BREAKDOWN 2025


Less than$599,999
$600,000to $699,999
$700,000to$799,999
$800,000 to $899,999
$900,000 andabove


Less than$312,499
$312,500 to $337,499
$337,500 to $362,499
$362,500 to $387,499
$387,500 andabove
RENTAL GROWTH 2025€
House rental yields in Bremer Valley¥ were 4.0%as of June 2025, on par with Ipswich City (4.0%) but higher than Brisbane Metro (3.2%). This is paired with an 82% growth in median house rental price in the past 12months to Q2 2025, to$595 per week; along with a -3.8% decline (to 77rentals in Q2 2025)in the number of houses rented. This confirms there is an undersupplied rental market in Bremer Valley¥ , suggesting there is still room for investors to enter the market
4+ bedroom houses have provided investors with +7.3%rental growth annually, achieving a median rent of $590per week.
Bremer valley¥ recorded a vacancy rate of 0.1% in June 2025,well below Ipswich LGA’s 0.7% and Brisbane Metro’s 0.9%. Vacancy rates have decreased in the past 12 months since June 2024, suggesting aneven tighter rental market. Further, a 0.1%vacancy rate is well below the Real Estate Institution of Australia’s healthy benchmark of 3.0%, thus quicker occupancy of rental homes. Although property sale prices have increased, it is still more affordable thanBrisbane Metro; and with a lower vacancy rate Bremer valley¥ is an attractive investment option.
RENTAL VACANCY RATES 2025

Bremer Valley (4340) Ipswich City LGA Brisbane Metro REIA 'Healthy'

¥

BremerValley
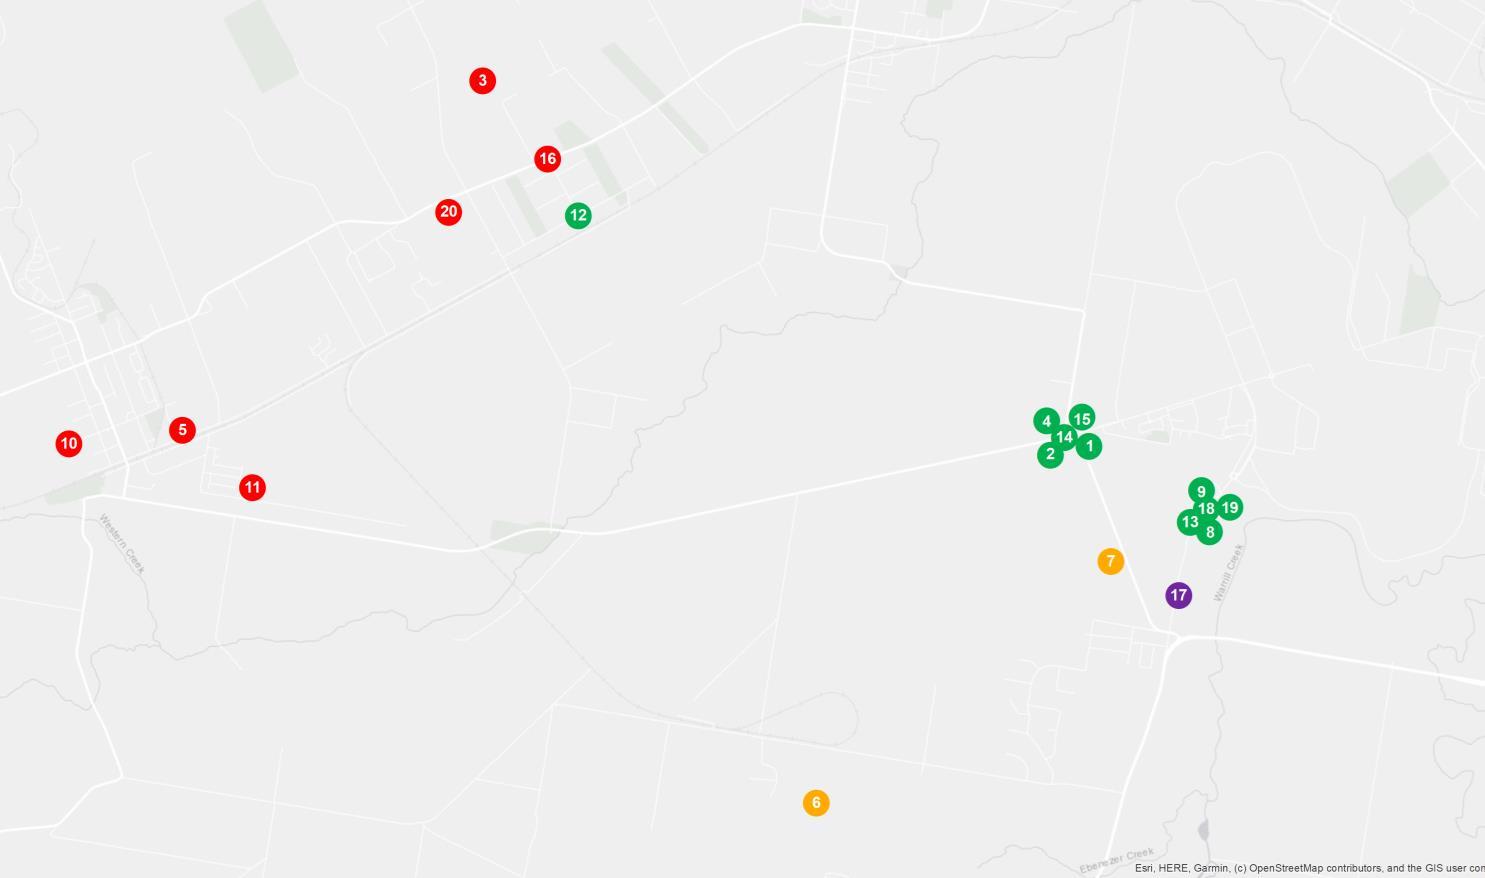
PROJECT DEVELOPMENT MAP 2025 & 2026 ₳

BREMER VALLEY


RESEARCH SERVICES
Our research services span over every suburb, LGA,and state within Australia; captured in a variety of standard and customised products, andinclude:
• Advisory and consultancy
• Market analysis including profiling and trends
• Primary qualitative and quantitative research
• Demographic and target market analysis
• Geographic information mapping
• Project analysis including product and pricing recommendations
• Rental and investment return analysis
OUR KNOWLEDGE
Access to accurate and objective research is the foundation of all good property decisions.
OUR PEOPLE
Our research team is made up of highly qualified researchers who focus solely on propertyanalysis.


REFERENCES
* Bremer Valley sales market data and key indicators encapsulates aggregate property market conditions within the suburbs of Rosewood, Calvert, Grandchester, Thagoona, Walloon and Mount Walker.
** Estimated values are based on construction value provided by the relevant data authority and does not reflect commercial and/or re-sale value.
# 2025 encapsulates sales transactions for 1st Half 2025 (01/01/2025 – 30/06/2025) only, other years encapsulates sales transactions for the full year (i.e 01/01 to 31/12 of the relevant year)
€ Annual rental growth is a comparison between Q2 2024 (01/04/2024 – 30/06/2024) and Q2 2025 (01/04/2025 – 30/06/2025) house median rent figures.
¥ Bremer Valley rental market data encapsulates aggregate property conditions within the postcode of 4340.
§ Rental yields shown are as reported as of June 2025.
₳ Project development map showcases a sample of upcoming projects only, due to accuracy of addresses provided by the data provider for geocoding purposes.
£ Projects refers to the top developments within the suburbs of Rosewood, Thagoona, Mount Marrow, Ebenezer, Lanefield, Lower Mount Walker, Tallegalla, Ashwell, Wallloon, Amberley and Jeebropilly
µ Estimated value is the value of construction costs provided by relevant data authority, it does not reflect the project’s sale/commercial value.
ψ Commencement date quoted for each project is an approximate only, as provided by the relevant data authority, PRD does not hold any liability to the exact date.
Source: APM Pricefinder, Cordell Connect database, SQM Research, Esri ArcGIS.
Disclaimer: PRD does not give any warranty in relation to the accuracy of the information contained in this report. If you intend to rely upon the information contained herein, you must take note that the information, figures and projections have been provided by various sources and have not been verified by us. We have no belief one way or the other in relation to the accuracy of such information, figures and projections. PRD will not be liable for any loss or damage resulting from any statement, figure, calculation or any other information that you rely upon that is contained in the material.
Prepared by PRD Research. © All medians and volumes are calculated by PRD Research. Use with written permission only. All other responsibilities disclaimed. © Copyright PRD 2025.