PAPER making!
The e-magazine for the Fibrous Forest Products Sector
Produced by: The Paper Industry Technical Association

Publishers of: Paper Technology International®

Volume 9 / Number 2 / 2023

Produced by: The Paper Industry Technical Association
Publishers of: Paper Technology International®
FROM THE PUBLISHERS OF PAPER TECHNOLOGY INTERNATIONAL® R T P O P T
Volume 9, Number 2, 2023
FEATURE ARTICLES:
1. Testing: Determining the shape of a paper sample in in-plane compression test.
2. Tissue: The value of data for environmental sustainability assessment.
3. Decarbonisation: High-temperature heat pumps for selected industry sectors.
4. Environment: Conversion of paper waste & rejects into materials & energy.
5. Bio-Energy: Emission factors of industrial boilers burning biomass-derived fuels.
6. Pulping: Achieving optimal paper properties: a new approach for kraft pulping.
7. Wood Panel: Engineered transparent wood composites: a review.
8. Driving: Driving tips for the summer.
9. Proofreading: Tips for effective proofreading.
10. Speed Reading: How to absorb information quickly and effectively.
11. Delegation: How to delegate tasks to your team.
12. Safety Hazards: Prevention of slips, trips and falls.
SUPPLIERS NEWS SECTION:
News / Products / Services:
Section 1 – PITA Corporate Members: ABB / VALMET


Section 2 – PITA Non-Corporate Members
Section 3 – NON-PITA SUPPLIER MEMBERS
mycon GmbH

Advertisers: ABB & VALMET
DATA COMPILATION:
Events: PITA Courses & International Conferences / Exhibitions

Installations: Overview of equipment orders and installations between April and June
Research Articles: Recent peer-reviewed articles from the technical paper press
Technical Abstracts: Recent peer-reviewed articles from the general scientific press
The Paper Industry Technical Association (PITA) is an independent organisation which operates for the general benefit of its members – both individual and corporate – dedicated to promoting and improving the technical and scientific knowledge of those working in the UK pulp and paper industry. Formed in 1960, it serves the Industry, both manufacturers and suppliers, by providing a forum for members to meet and network; it organises visits, conferences and training seminars that cover all aspects of papermaking science. It also publishes the prestigious journal Paper Technology International® and the PITA Annual Review , both sent free to members, and a range of other technical publications which include conference proceedings and the acclaimed Essential Guide to Aqueous Coating.

The article presents a new technique for analyzing phenomena occurring during the measurement of the strength properties of paper in the conditions of compression of the tested samples with forces acting in the paper plane. The technique is based on collecting data on the current distance of the clamps holding the tested sample and the force exerted on the sample using a universal testing machine and on the simultaneous recording of image sequence of the sample during the measurement. Next, the resulting images are subjected to processing and analysis, the purpose of which is to extract information about the shape of the sample edge in all phases of the measurement. Its advantage is the ability to determine the deflection arrow of the sample and describe its shape using the selected function given by the analytical parametric formula. It will be helpful in further research on the development of an analytical model describing the phenomena occurring during paper compression, and a method to determine the mechanism of paper destruction and the corresponding maximum force that destroys a paper sample.
Contact information:
1. Centre of Papermaking and Printing, Lodz University of Technology, Wólczanska 221, 95-003 Łódz, Poland.
2. Department of Strength of Materials, Lodz University of Technology, Stefanowskiego 1/15, 90-537 Łódz, Poland.
Appl. Sci. 2023, 13, 1389.
https://doi.org/10.3390/app13031389
Creative Commons Attribution 4.0 License
The Paper Industry Technical Association (PITA) is an independent organisation which operates for the general benefit of its members – both individual and corporate – dedicated to promoting and improving the technical and scientific knowledge of those working in the UK pulp and paper industry. Formed in 1960, it serves the Industry, both manufacturers and suppliers, by providing a forum for members to meet and network; it organises visits, conferences and training seminars that cover all aspects of papermaking science. It also publishes the prestigious journal Paper Technology International® and the PITA Annual Review , both sent free to members, and a range of other technical publications which include conference proceedings and the acclaimed Essential Guide to Aqueous Coating.
Article
PawełPełczy´nski
1 CentreofPapermakingandPrinting,LodzUniversityofTechnology,Wólcza´nska221,95-003Łód´z,Poland
2 DepartmentofStrengthofMaterials,LodzUniversityofTechnology,Stefanowskiego1/15, 90-537Łód´z,Poland
* Correspondence:pawel.pelczynski@p.lodz.pl;Tel.:+48-426313816
Abstract: Thearticlepresentsanewtechniqueforanalyzingphenomenaoccurringduringthe measurementofthestrengthpropertiesofpaperintheconditionsofcompressionofthetested sampleswithforcesactinginthepaperplane.Thetechniqueisbasedoncollectingdataonthe currentdistanceoftheclampsholdingthetestedsampleandtheforceexertedonthesampleusing auniversaltestingmachineandonthesimultaneousrecordingofimagesequenceofthesample duringthemeasurement.Next,theresultingimagesaresubjectedtoprocessingandanalysis,the purposeofwhichistoextractinformationabouttheshapeofthesampleedgeinallphasesofthe measurement.Itsadvantageistheabilitytodeterminethedeflectionarrowofthesampleand describeitsshapeusingtheselectedfunctiongivenbytheanalyticalparametricformula.Itwillbe helpfulinfurtherresearchonthedevelopmentofananalyticalmodeldescribingthephenomena occurringduringpapercompression,andamethodtodeterminethemechanismofpaperdestruction andthecorrespondingmaximumforcethatdestroysapapersample.
Keywords: strengthpropertiesofpaper;analysisofdigitalimages;modellingoftheshapeofapaper sample;deflectionarrow
Citation: Pełczy´nski,P.;Szewczyk, W.;Bie´nkowska,M.;Kołakowski,Z. ANewTechniqueforDetermining theShapeofaPaperSamplein
In-PlaneCompressionTestUsing ImageSequenceAnalysis. Appl.Sci. 2023, 13,1389.https://doi.org/ 10.3390/app13031389
AcademicEditor:MilenaPavlíková
Received:21December2022
Revised:11January2023
Accepted:16January2023
Published:20January2023
Paperisanorthotropicmaterialcommonlyusedfortheproductionofcorrugated andcellularcardboard,fromwhichavarietyofpackagingisthenproduced[1,2].Their usefulnessisdeterminedbythestrengthproperties,whichdependtoalargeextenton thepropertiesofthepaperitself[3–9].Atthesametime,itisdesirabletominimizethe weightofthepackagewhilemaintainingtherequiredstrength.Inordertoavoidtimeconsuming,experimentalselectionofthematerialcompositionofthecardboardfrom whichthepackagingismade,itisincreasinglyusedtopredicttheirstrengthproperties bymeansofcalculationsthattakeintoaccountthepropertiesofthepapersusedintheir production[10–14].Oneoftheimportantpropertiesistheresistancetoedgecrushing measuredinthecompressiontestatshortfastening—SCT[15].Duetotheorthotropyofthe paper,resistancetocrushingisdeterminedintwomaindirections,namelyMD(machine direction)andCD(crossdirection).

Copyright: ©2023bytheauthors.
LicenseeMDPI,Basel,Switzerland. Thisarticleisanopenaccessarticle distributedunderthetermsand conditionsoftheCreativeCommons
Attribution(CCBY)license(https:// creativecommons.org/licenses/by/ 4.0/).
However,thetestdoesnottakeintoaccountthephenomenonofbucklingofthetested sample,whichoccurswhenusinglongersampleattachmentlengthsandiscommonlyobservedincorrugatedcardboardpackaging.Analysisofthecompressivestrengthofvarious materialsinthebucklingstatehasbeenofinteresttoresearchersformanyyearsbecause itisofgreatimportanceforestimatingtheloadcapacityofmechanicalstructures[16–19]. However,thestudyofpaperpropertiesinthisareawasusuallylimitedtosimplecompressiontestsandwasnotcombinedwithsimultaneousobservationoftheshapeofthe compressedsamples.
Modernmethodsofprocessingandanalyzingdigitalimagesmakeitpossibleto observechangesintheshapeofbodiessubjectedtoexternalforcesonthebasisofthe
analysisoftheirseriesofimages[20,21].Thankstoadvancesinelectronics,itisnow possibletorecordsequencesofimagesofprocessesoccurringduringstrengthtestsof variousmaterialsinreal-time.Theseriesofimagesobtainedinthiswaycanbereviewedin anyway,focusingonthesignificantphenomenaoccurringduringtheexperiment,andcan alsobesubjectedtoautomaticanalysis,thepurposeofwhichisaquantitativedescription ofagivenprocess.AnexampleofsuchasolutionistheLensovisionsystemforrecording thesurfaceofmaterialssubjectedtomechanicaltesting.ThankstotheuseofDigitalImage Correlation[22,23]inthesquareareasofsuccessiveimagesinthesequence,theyallowfor preciseestimationoflocaldeformationsoftheobservedsurfaces.Visionsystemsarealso usedinpapermakingandprintingtodetectdefectsandassessthequalityofproduced paperorprint[24].Thisispossiblethankstotheuseofadvancedalgorithmsfordetecting defectsvisibleinsubsequentimagesoftherecordedsequence,andoftenalsoalgorithms forautomaticrecognitionofthetypeofdefect.Implementationoftheseoperationsinreal timerequirestheuseofcomputerswithhighcomputingpower.Thisallowstocontrol theproductionlinebasedontheinformationreceivedandimprovetheparametersofthe productionprocessorrejectadefectiveproduct.
Observingtheshapeofpapersamplesduringthecrushingresistancetestallowsfor associatingchangesintheshapeofthesamplewiththemagnitudeoftheforceactingonit duringthetest.Tomakethispossible,itisnecessarytorecordimagesofthesamplebeing testedandsynchronizetheresultingseriesofimageswithdatafromthemachine.
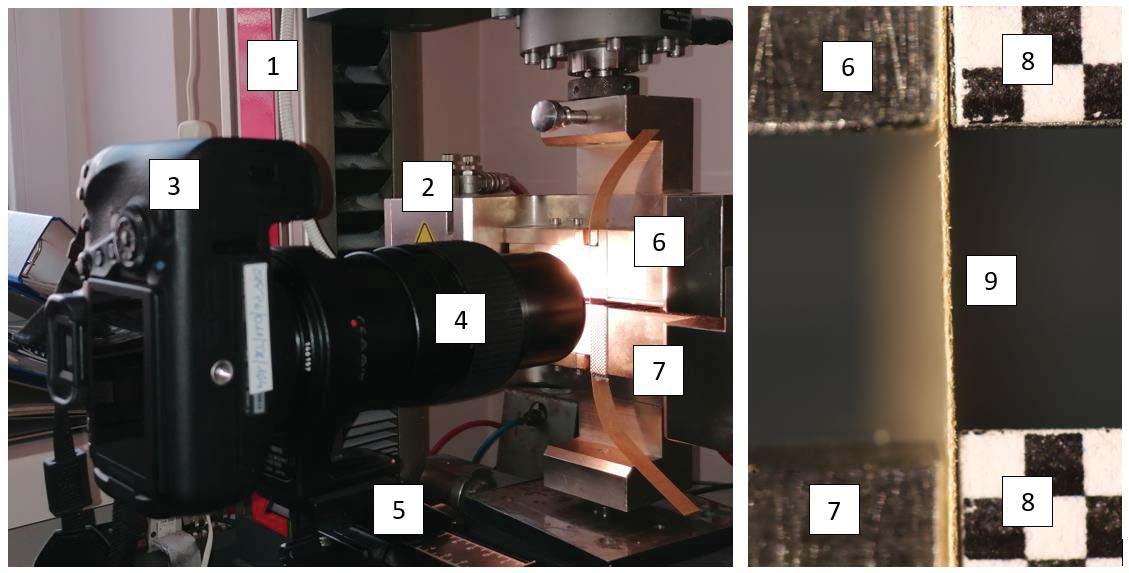
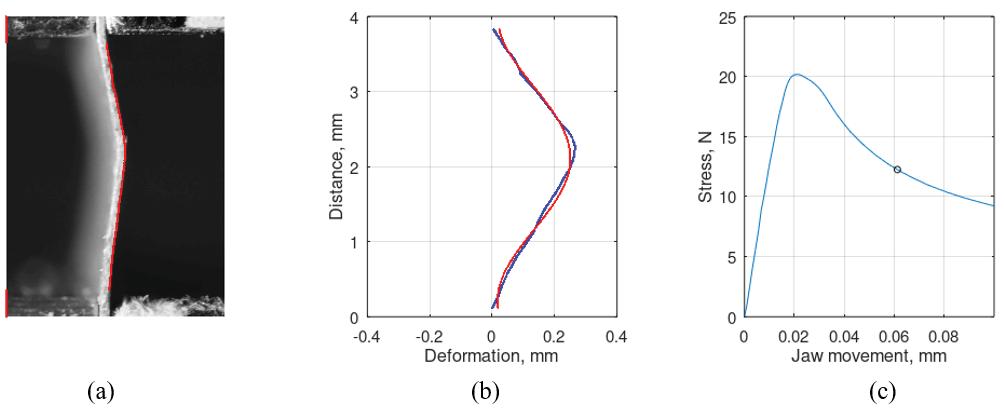
Theuseofdigitalimageanalysismethodsinmeasuringthecrushingresistanceofpaperrequiredsolvingtheproblemofsynchronizationofmeasurementinauniversaltesting machinewiththerecordingofimagesofthetestedsamples.Inordertosimultaneously recordthedisplacementofthemovinghandleofthetestingmachineandtheforceacting onthecompressedsampleandtheimagesofthesampletobetested,themeasuringsetup showninFigure 1awasprepared.
Thestandconsistsofatestingmachine(1)ZwickRoellZ010,anSCTtestholder (2),acameraplacedonatripod(3)—aCanonEOS6DMarkIIfull-frameDSLRwitha CanonMP-E65mmf/2.81–5 × Macrolens(4)andanilluminatorprovidingconstant illuminationwiththepossibilityofadjustingitsdirection(notvisibleinthephoto).This
allowstoachievegoodcontrastbetweentheedgeofthepapersampleunderexamination andthebackground.Inordertoadjustthesharpnessoftheimage,thecameraisattached tothetripodviaasettingsledge(5).Thismakesitpossibletoadjustthepositionofthe cameraintwohorizontalaxes—parallelandperpendiculartotheopticalaxisofthecamera. Thecameralensallowstomanuallychangethescaleofreproductionintherangeof 1to5,whichgivesthesizeoftherecordedfragmentofthepapersampleintherangeof 7.2mm × 5.8mm to36mm × 24mm.Inthepreparedmeasuringsetup,magnificationsin therangeof4to5wereused.
Patternsofcheckerboard(8)withalengthofasinglesquareof1mm(Figure 1b) werestickedtothefixed(6)andmovable(7)clampsofthetestingmachine.Itallowed totrackthemovementofthehandle(6)andtodeterminethespatialresolutionofthe recordedimages.
Themeasurementbeginsbyplacingthetestedpapersample(9)intheSCTholders ofthetestingmachine,settingthedesiredfocallengthofthelensandpositioningthe camerainsuchawaythatthesampleandthecheckerboardfragmentscontainingatleast twointersectionsbetweenitsfieldsareinthefieldofvision.Next,theforcevalueis reset,therecordingofthesequenceofphotosisstartedandafterrecording3–4images,the measurementisinitiatedinthemachine.Themeasurementendswhenthesetdisplacement ofthemovablehandleisreached.Duringtheentiremeasurement,arecordingofthe sequenceofimagesofthesampleisperformedalongwithfragmentsofhandleswith stickedcheckerboards.
Thedevelopedmeasurementtechniqueconsistsofaseriesofoperationsthatmust beperformedinordertoobtaincorrectmeasurementresultsandtheiranalysis.Theflow diagramoftheentiremeasurementisshowninFigure 2.Thetestedmaterialandprocessed dataarepresentedinthefigurebymeansofgrayrectangles.Operationsincludedinthe measurementprocessareshowninlightbluerectangleswithroundedcorners.
Therecordedsequenceofimageswassubjectedtopre-processingandanalysis.Preprocessingconsistedofthefollowingstages:


• conversionofaseriesofRAWimagestoTIFFformatwithoptionalreducingthesize ofadigitalimagetoreducedatavolume,
• extractinginformationabouttherecordingtimeofeachphotointhesequencewithan accuracyof1/100ofasecond,
• conversionofcolorimagestograyscale,


• croppingobtainedimagestothefollowingregions:theexaminedpapersample,the checkerboardonthemovablehandle,andthecheckerboardonthefixedhandle,
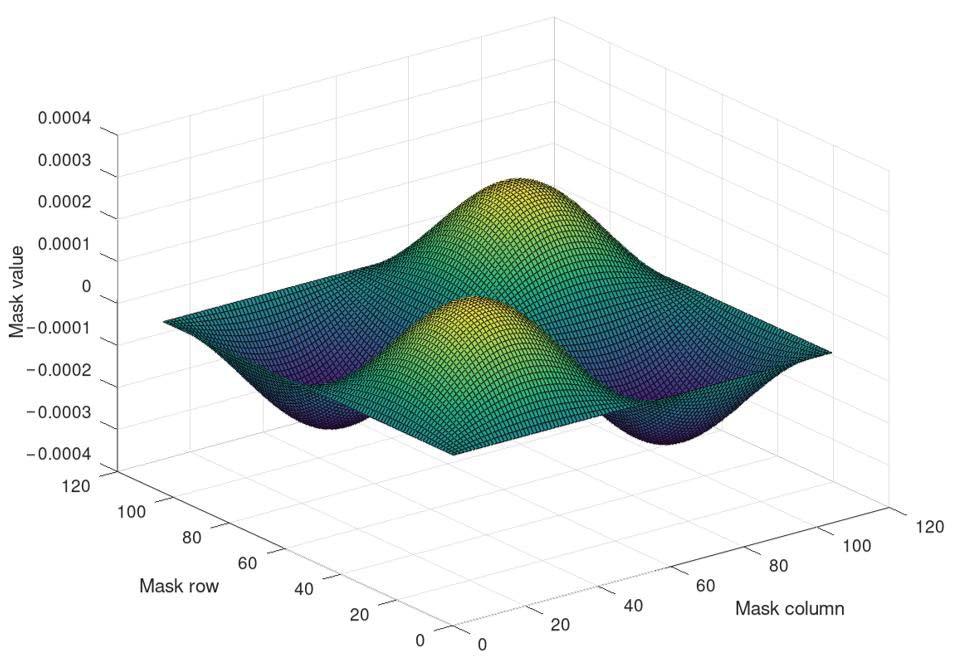
• linearfilteringofthesampleimagebymeansofafilterthatenhancestheverticaledges intheimage;itsmaskisshowninFigure 3,
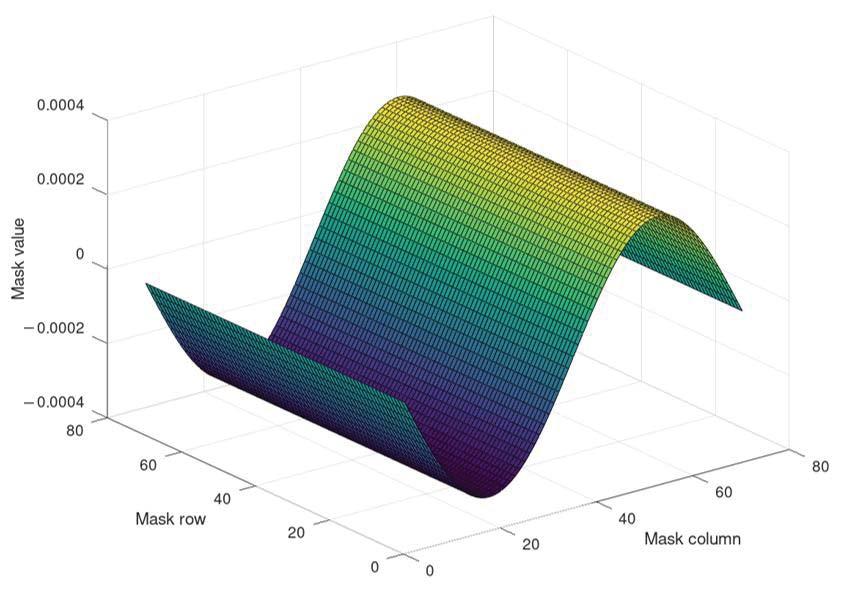
• linearfilteringofcheckerboardimagesusingafilterthatemphasizesthecornersof thecheckerboardfieldsintheimage;itsmaskisshowninFigure 4.
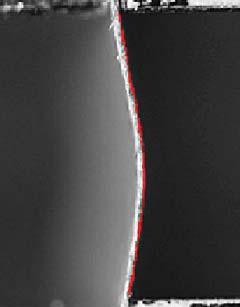
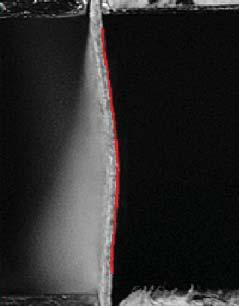
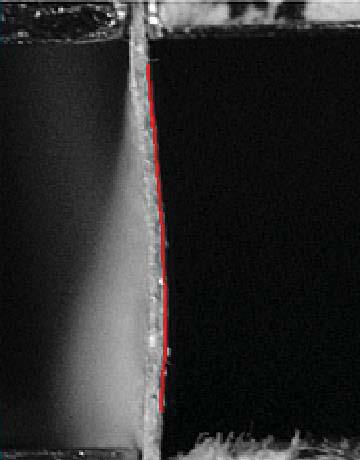
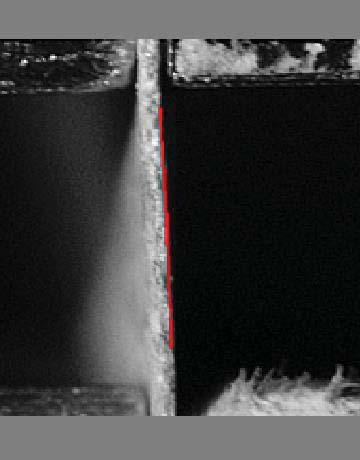
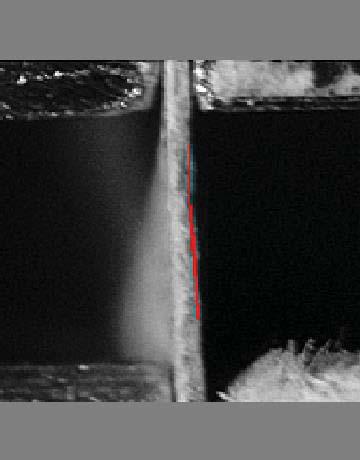
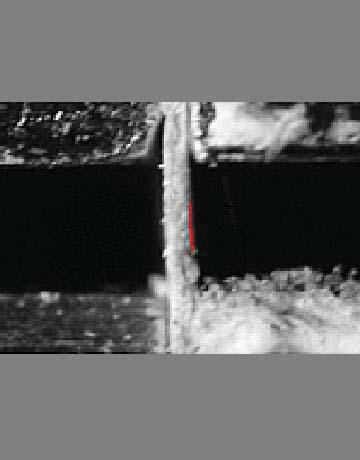
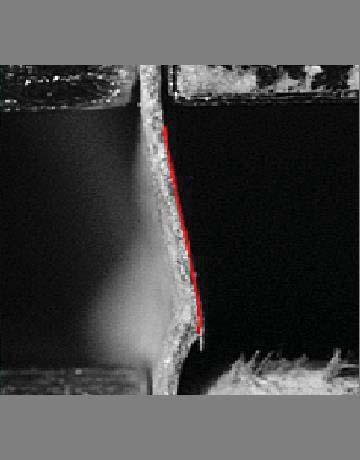
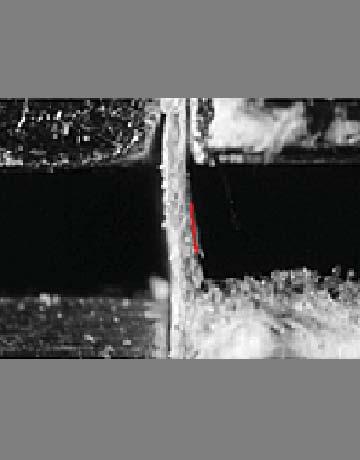
TheresultsoffilteringthesampleimageareshowninFigure 5a.Figure 5bshows theimageofthesampleitselfwiththedetectededgesofthesample:left(green)andright (red).Detectingtheleftedgeisverydifficultduetothelowcontrastintheimage,hencein furtheranalysisitwasdecidedtorelyonthedetectionoftherightedge.Thiscannotbe generalizedtoallcases.Thecontrastdependsonthedirectionandlightingofthesample. Inthefuture,choosingtherightfiltermaskshouldbeanoptionfortheanalysisalgorithm.


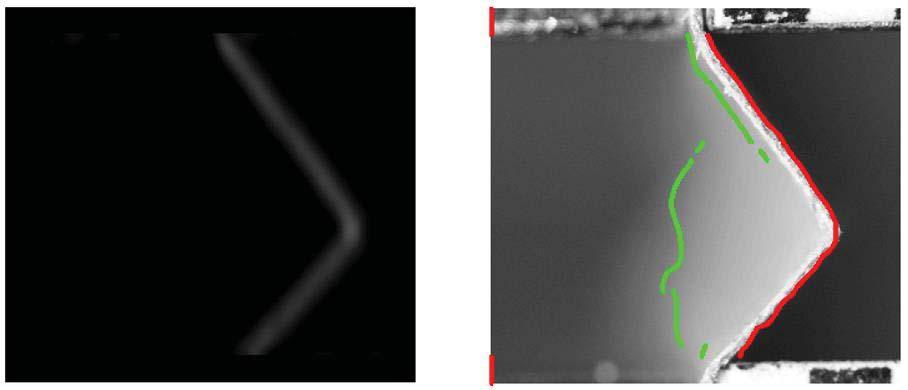
(a)Theresultoffilteringtheimageofthepapersampleduringthemeasurement,(b)the imageofthesamplewiththedetectedleftedgemarkedingreenandtherightedgeinred.
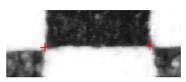
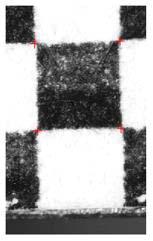
Figure 6 showstheresultoffilteringthecheckerboardimagesplacedonbothhandles ofthetestingmachineandtheplaceswherethecornersmarkedwithreddotsweredetected. Todetectthecornersbetweenthewhiteandblackfields,regardlessoftheirorder,filtering wasrepeatedtwicewiththefiltermaskrotated90degrees.Next,intheobtainedimages, theplacesofthecornersweredetectedindependentlybydetectingthemaximainthe imagesafterthefilteringandtheresultinginformationfrombothimageswascombined.
Figure6. Theresultoffilteringthecheckerboardimageonthemoving(a,b)andstill(d,e)handle andimagesofthehandlesthemselves(c,f)withthecornerdetectionpointsmarkedinred.Pictures (b,e)showtheresultoffilteringwithafilterwithamaskrotatedby90◦


Thecoordinatesetsofthepointsofthedetectededgesandcornerswereinputinformationtothealgorithmfortheanalysisofimagedata.Theimagecoordinateswereconverted tometriccoordinates(mm)basedoninformationaboutthespatialresolutionoftheimages andthearbitrarilyassumedplaceofthebeginningofthecoordinatesystem(associated withtheplacewherethesampleishandledinastillholder).
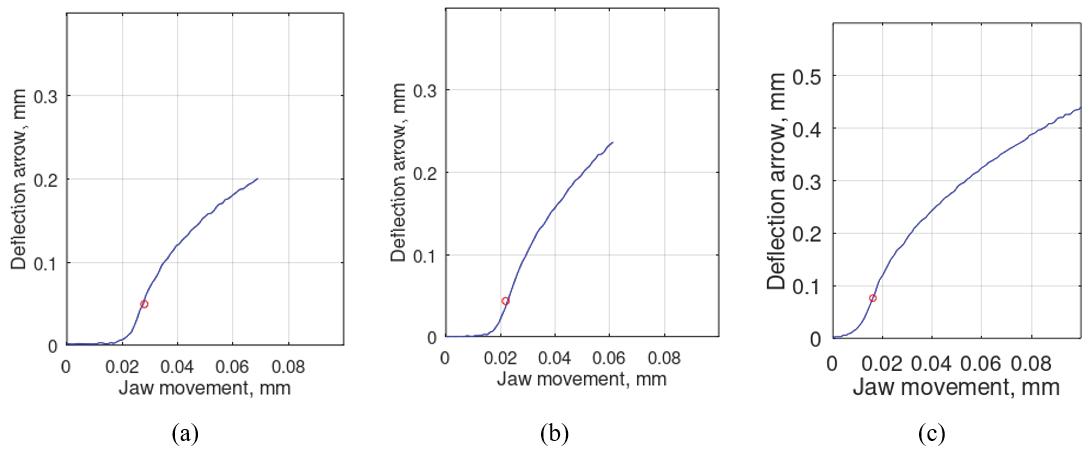
Theshapeoftheedgeofthetestsampleinsubsequentimagesoftherecordedsequence isshowninFigure 7.
Theapparentmovementofthelowerendofthesampleedgeistheresultoflimiting theanalysisfieldtotheareaofcorrectedgedetectionintheimage.Theassumedorigin ofthecoordinatesystem,associatedwiththeedgeofthestillhandle,isbelowthebottom edgeoftheimage.
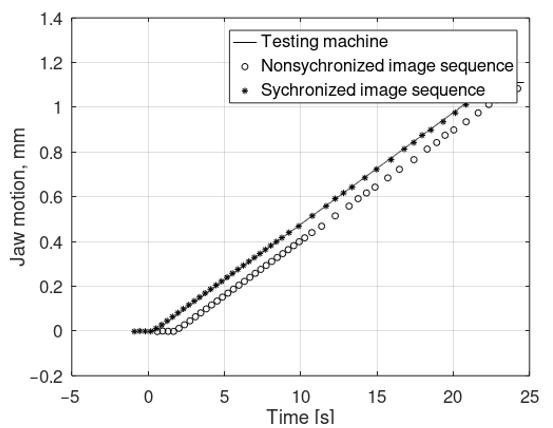
Theaveragevaluesofthecoordinatesofthecornersofthemovableandstationary checkerboardwereusedtodeterminethedisplacementofthehandleatthemomentsof recordingindividualphotos.Basedonthisinformation,thetimeofphotorecordingasa functionofthetimeofmeasurementdataacquisitioninthetestingmachinewasestimated, asshowninFigure 8.Theresultwasthesynchronizationofdatarecordingtimesfromtwo differentsources.
2.5.EstimationofDeformationParametersoftheTestedPaperSample
Themeasurementdataobtainedasaresultofthepre-processingandanalysisofthe imageswerefurtheranalyzedinordertodeterminethevalueofso-calledthedeflection arrowofthepapersampleandtheparametersofthesinusoidalfunctionmodellingthe shapeofthesampleedges.Thisisprecededbyarotationofthecoordinatesystemofthe machinetopositiontheedgeofthesampleatthebeginningofthetestinaverticaldirection. Thisoperationisperformedonthebasisofthecoordinatesofthesamplemountinginthe machineholders.Afterthiscorrection,thedeflectionarrowisdefinedasthedifferencein thehorizontalcoordinateoftheplacesofattachmentofthesampleinthehandlesandthe placeofthegreatestdeflectionofthesample.
Theshapeofthesampleisthenmodelledusingasinusoidalfunctionofimagecoordinates x =f(y):
x = C + A · sin 2 π y Pr + ϕ ,(1)
where:
C-constant—theshiftrelativetothebeginningofthecoordinatesystem(itcanchangein subsequentphotosasaresultof,forexample,cameravibrations,itisnotimportantin measuringthedeflectionofthesample),
A—amplitudeofthesinewavefunctionmodellingthedeflection, Pr—theperiodofthesinewavemodellingthedeflection(attheinitialstageofmeasurement, beforethebucklingofthesample,itcannotbedeterminedaccurately),
ϕ —theinitialphaseofthesinewavemodellingthedeflection(notrelevantfromthepoint ofviewofdeflectionanalysis,butmustbeavariableinordertomatchthemodelwellwith themeasurementdata).
Thedesiredvaluesoftheparametersofthesampleshapemodellingfunctionare searchedintheoptimizationprocedurethatminimizesthe SSESh errorbetweenthemeasurementdataandthemodellingresult.TheerrorisdescribedbyEquation(2):
SSESh = ∑ i x i C A · sin ( 2 · π · y i Pr + ϕ ) 2 ,(2)
where:
i—indexofthepointattheedgeofthetestsample, xi —thehorizontalcoordinateofthe i-thpointattheedgeofthesample, yi —theverticalcoordinateofthe i-thpointontheedgeofthesample.
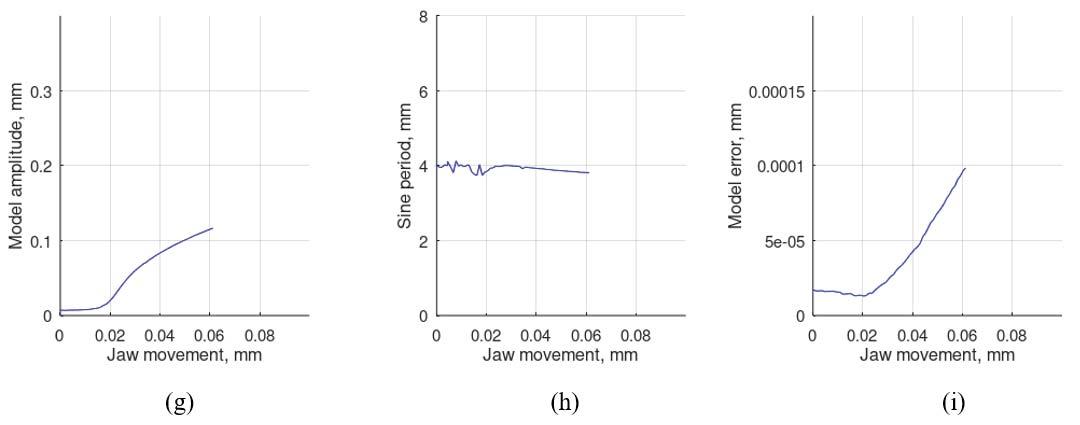
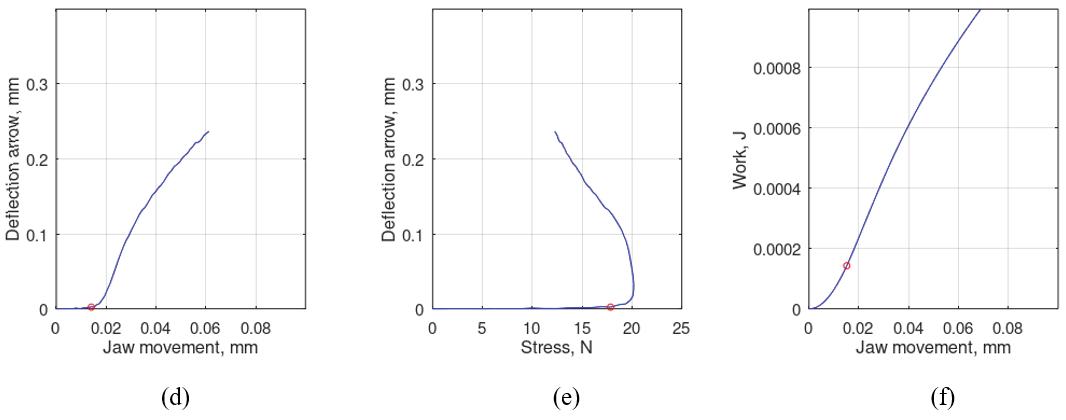
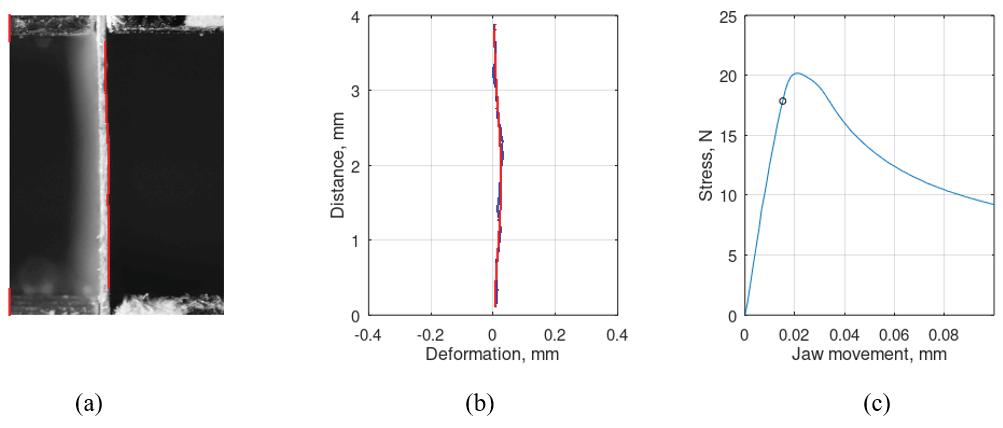
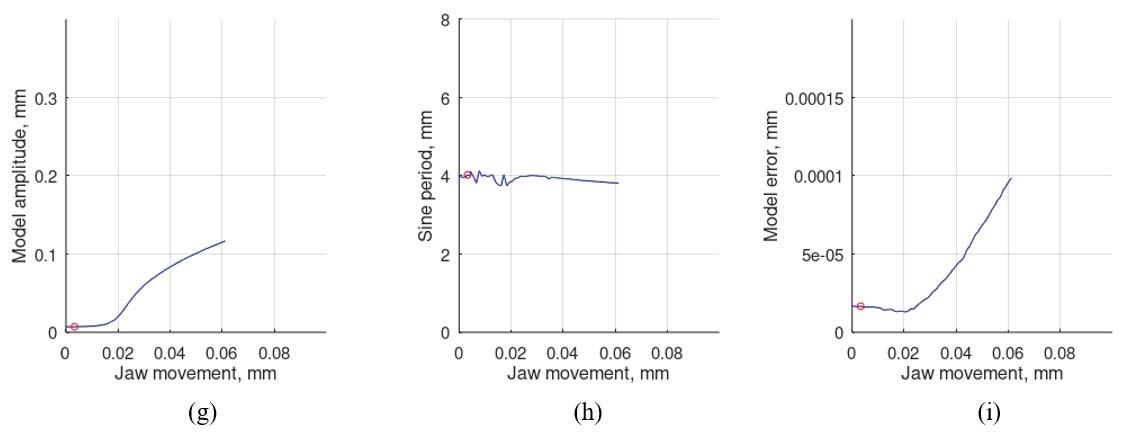
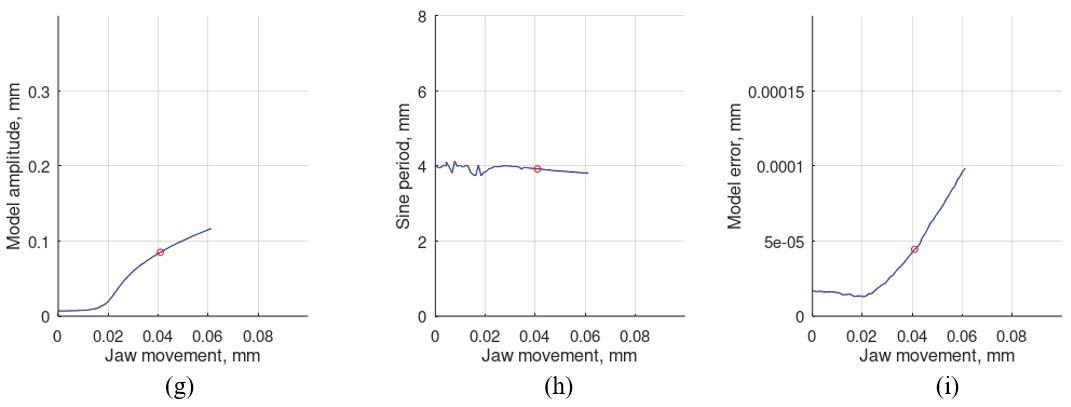
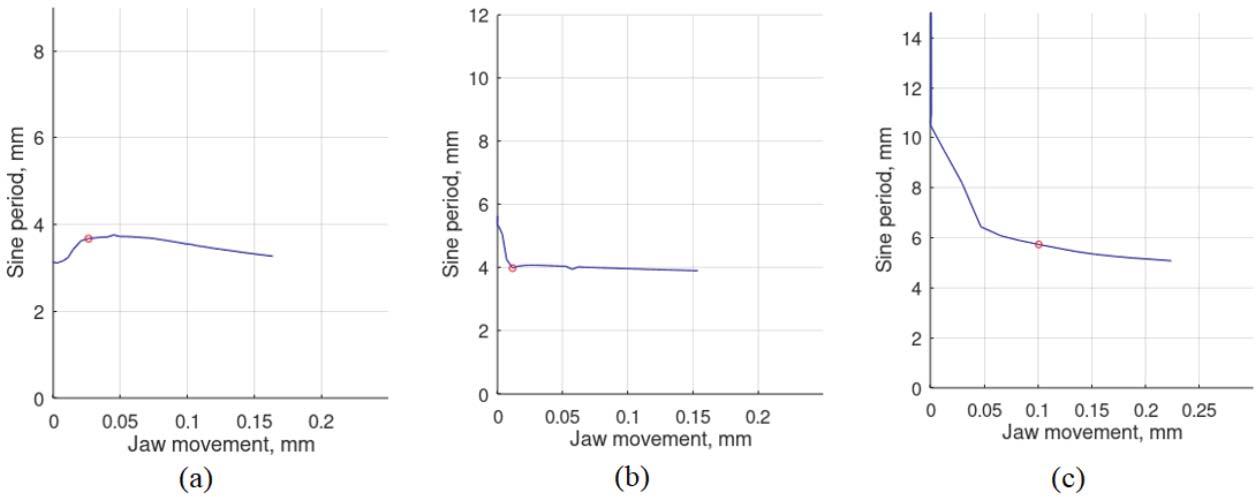
TheresultsofthemeasurementsrecordedduringtheMDcrushingtestofthepackagingpaperandtheanalysisoftheimagesrecordedatthattimeandthemodellingofthe sampleshapeusingthefunctiongivenbytheFormula(1)areshowninFigures 8–10.
appearanceofthesamplebuckling.
Meaningoftheindividualchartsineachdrawing:
(a)—animageofthesamplewiththeedgedetected,
(b)—theshapeofthedetectededgeinthecoordinatesystemdeterminedonthebasis oftheindicatedpointsofattachmentofthesample,
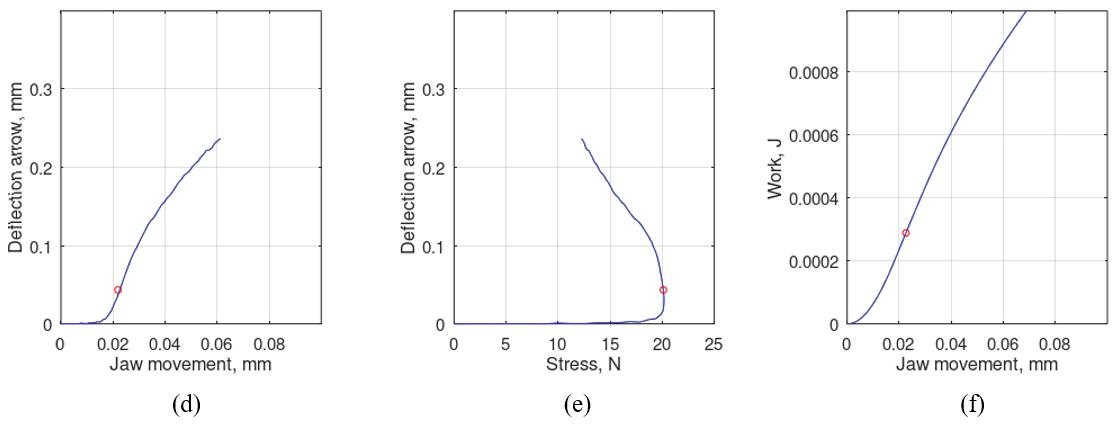
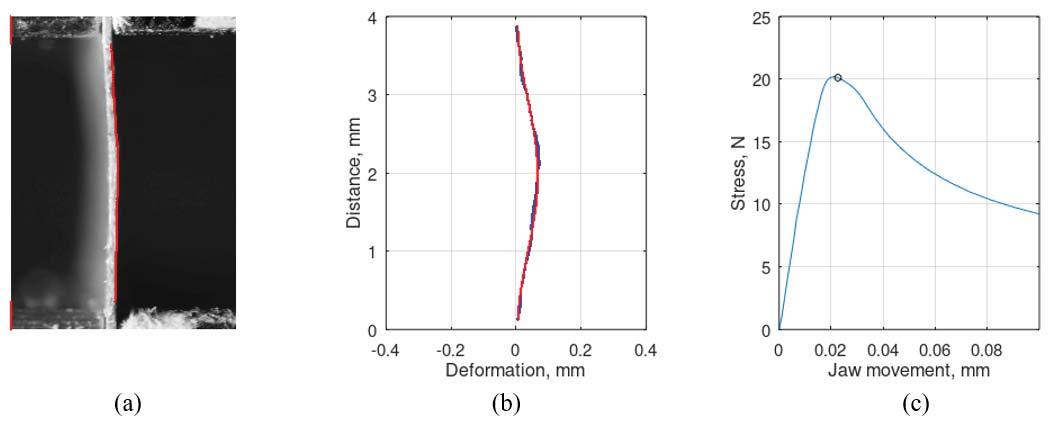
(c)—theshapeoftheforcecurveasafunctionofdisplacementofthehandlewiththe markedplaceofrecordingoftheshownimage,
(d)—thevalueofthedeflectionarrowasafunctionofdisplacementofthe movablehandle,
(e)—thevalueofthedeflectionarrowasafunctionofforce,
(f)—workondeformationofthesampleasafunctionofdisplacementofthehandle,
(g)—theamplitudevalueofthesinewavefunctionmodellingtheshapeofthesample asafunctionofdisplacementofthehandle,
(h)—theperiodofthesinusoidalfunctionmodellingtheshapeofthesampleasa functionofdisplacementofthehandle,
(i)—thevalueofthesampleshapemodellingerrorasafunctionofthe handledisplacement.
Around,redmarkeronthebackgroundofcurvesrepresentingindividualfunctional dependenciesshowstheobtainedvaluesinthediscussedphaseofthecompressionprocess.
Figure 9 showsthestateofthesampleatthetimeoftransitionfromthepurecompressionphasetothebucklingphaseofthesample.Inthemomentsprecedingthisstate, modellingtheshapeofthesamplewithasinusoidalfunctiondoesnotmakesense.Therefore,graphsfrom(g)to(i)inFigure 9 beginwiththeplacemarkedwithadot.
Figure 10 showsthestateofthesamplewhenthemaximumforceisreached.Upto thispoint,theapproximationoftheshapeofthesampleusingthefunctiondescribedby theFormula(1)ischaracterizedbyasmallerrorvalue,whichmeansthatthebucklingtakes theshapeofasinusoiduntilthemaximumforceisreached.
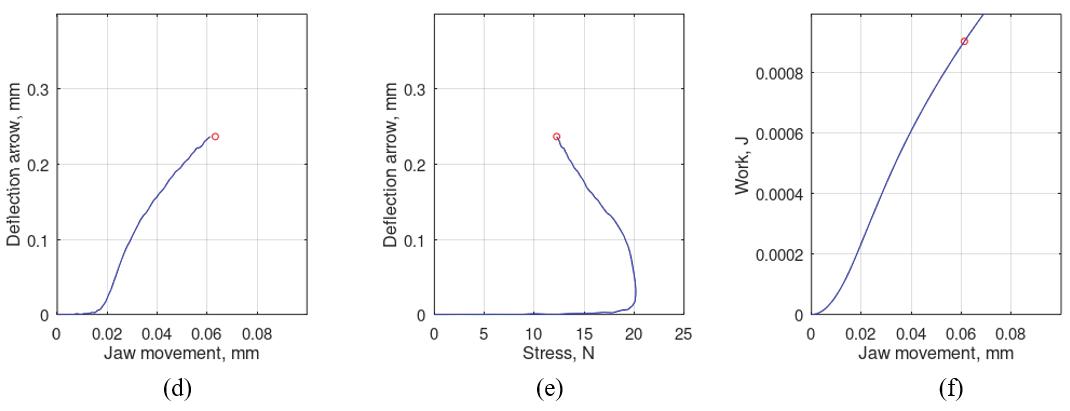
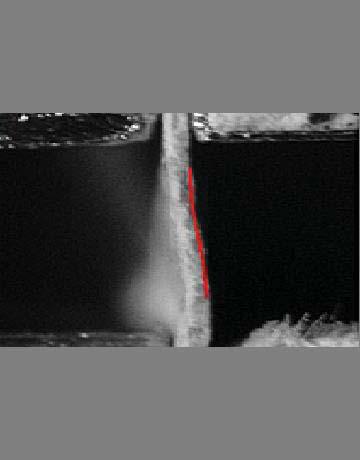
Figure 11 showstheconditionofthesampleafteritsdestruction.Inthisstate,the approximationofthesampleshapeusingthefunctiondescribedbytheFormula(1)isnot veryaccurate,asindicatedbytheincreasingvalueofthemodellingerror.Thesampletakes ashapesimilartotwosectionsconnectingtheconnectionpoints.
3.Results
Theresultsofmeasurementsmadewithsampleclampinglengthsfrom0.7mmto 5mmarepresented.Ameasurementexperimentwasperformedtostudythebehaviorof samplesofpackagingpapercrushedinthedirectionofMD.Thesamplewas15mmwide, asinatypicalSCTtest.ThestandardclampinglengthintheSCTtestis0.7mm.However, differentvaluesofthesampleconnectionlengthwereused:0.7mm,1.3mm,2mm,3mm, 4mmand5mm.Thethicknessofthepaperwas0.14mm.
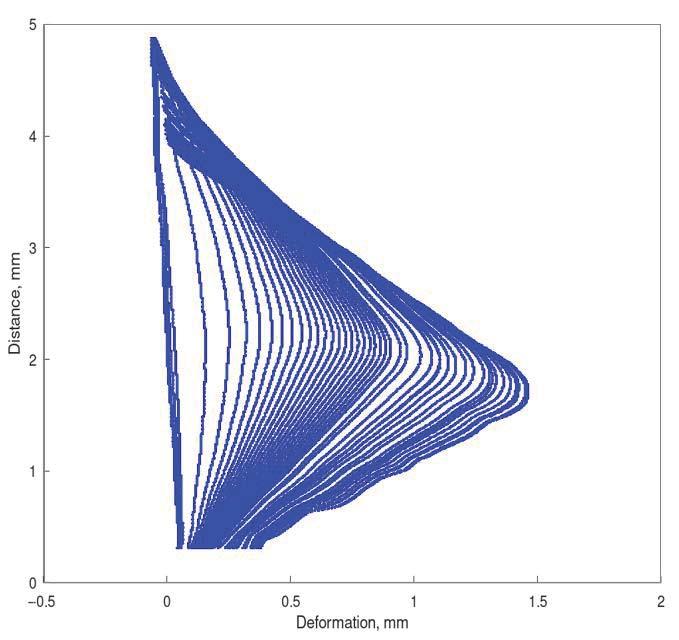
Figure 12 showstheshapeofacurverepresentingthedependenceofthecompressive forceofapapersampleonthedisplacementofthemovablehandlewithfasteninglengths from0.7mmto5mm.
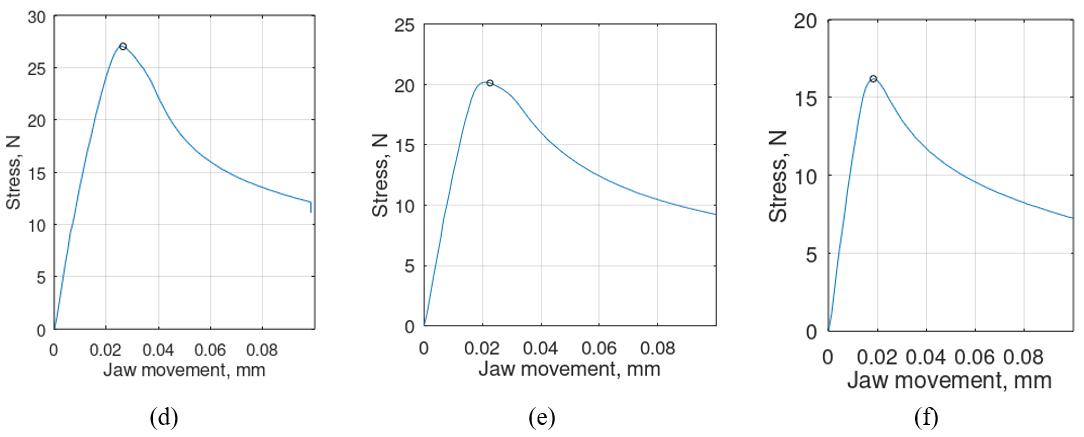
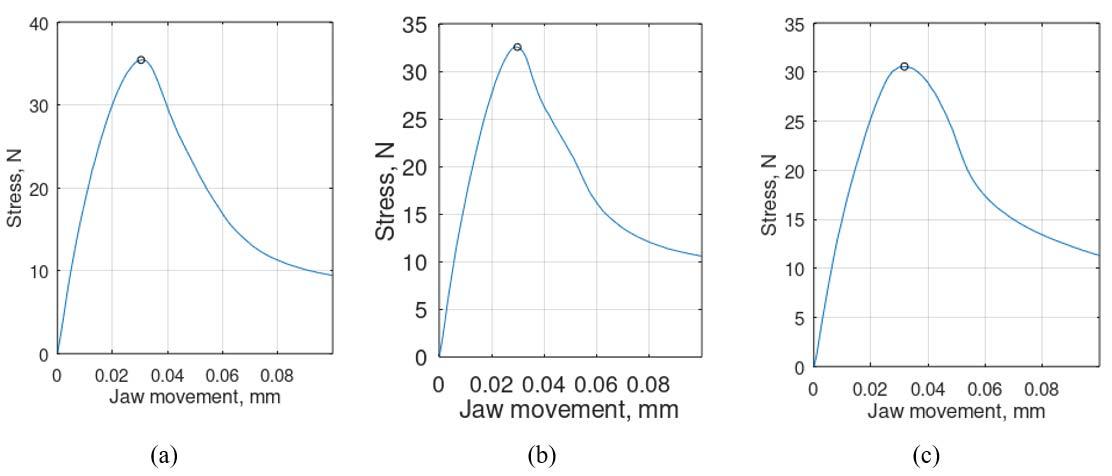
Asthelengthofthefasteningincreases,atendencytodecreasethemaximumforce occurringduringthetestisobserved.Curvesforalengthof0.7–5mmincreaserapidlyuntil themaximumvalueisreached,andthenfallsharply,butwithasmallergradient.Table 1 showsthemaximumvaluesofthecompressiveforceasafunctionoftheclampinglength.
Atthesametime,itcanbeseeninFigure 13a–cthatwithfasteninglengthsoflessthan 3mmatthemomentofreachingthemaximumforcenobucklingisobserved.Withlonger lengthsoffastening,thebucklinghastheshapeofasinusoidfragment.
4.Discussion
Theresultsofthemeasurementsmadeitpossibletodrawanumberofconclusions. Foralengthof0.7mm,thepaperfibersdelaminatedandcrushednearthefixedlower handleofthemachine.Inthiscase,theratioofthelengthofthesampletoitsthicknessis L/g=5.Forlengthsof1.3and2.0mm,destructionshallalsooccurnearthelowerhandle withvisiblehorizontaldisplacementofthesamples.Forthesecases,wehaveL/g=9.3 andL/g=14.3,respectively.Forthefasteninglengthsof3.0(L/g=21.4)and4.0mm (L/g=28.5),thedestructionofthesamplestakesplaceinthecentralpartandthesample takestheshapeoftheletterV.Notethatpaperedgesentertangentiallyintobothhandles. However,foralengthof5mm(L/g=35.7),theV-shapeisveryclearlyvisible,inparticular therefractionitself.Thesampleattheplacesofattachmenttobothhandlestakestheshape asforjoint-likesupport.
Inthetheoryofthin-walledstructures,thefollowingclassificationisassumed:when L/g>25–30,whereLisasmalleroveralldimension,theplatesarethin-walled;when 5<L/g<25theplatesareofmediumthickness,whileL/g ≤ 5theplatesarethick[16,17]. Accordingtothisclassification,theclampinglengthL=0.7mmcorrespondstothickplates, andforL=1.3,2.0,3.0,4.0platesofmediumlength,andforL=5.0thinplate.Forplatesof mediumthickness,modificationsaremadeinrelationtothinplates[18,25,26].
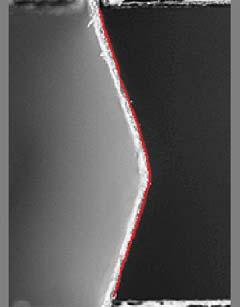
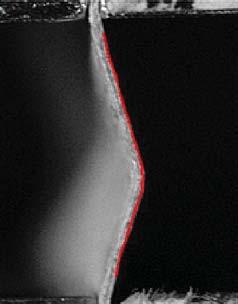
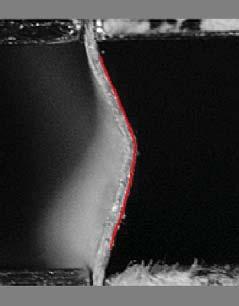
Figure 15 showsdiagramsofchangesinthedeflectionarrowofthesampleasa functionofdisplacementofthemovablehandleofthetestingmachinewiththeplace wherethemaximumforceisreached.
Thecorrectnessofdeterminingthedeflectionarrowusingthedevelopedimageanalysistechniquewascheckedbycomparingmeasuredsampleshorteningwiththeanalytically determinedvalueusingtheformulagivenin[16]:
Figure 16 showsacomparisonofthemeasuredandtheoreticallycalculatedshortening ofthepapersamplewithaclampinglengthof4mmand5mmasafunctionofits deflection.Aslightdifferencebetweenthemeasuredandcalculatedvaluesmayresultfrom theadopteddestructionmodel,whichdoesnotreflectallthephenomenaoccurringduring thetest,ortheinaccuracyofdeterminingthedeflectionarrowbyimagingmethods.
approximatingtheshapeofthetestsampleasafunctionofdisplacementofthemovable handleofthetestingmachine.Estimatingtheperioduntilbucklingoccursisnotjustified, sincetheshapeoftheedgeofthesampledoesnotresembleasinusoid.Fromthemoment themaximumforceisreached,thevalueoftheperiodstabilizesatalevelcomparableto thelengthofthefastening.
5.Conclusions
Ameasurementtechniquewasdeveloped,basedonthesimultaneousmeasurement ofthedependenceofthecompressiveforceonthedisplacementofthemovablehandleofa universaltestingmachineandtherecordingofaseriesofimagesofacompressedsample ofthetestedmaterial.Thistechniquehasanumberofadvantagesoverthetraditional approachofrecordingonlyjawmovementandtheforcecurveduringthetest.Itenables non-contactmeasurementofthevalueofthedeflectionarrowofthesampleduringthetest andgivestheopportunitytoobserveitsshape.Thisallowstheshapeofthetestedpaper samplestobemodelledwithdifferentcurves,e.g.,asinusoidalfunction.Thankstothis, itbecomespossibletodeterminetherelationshipbetweenthedeflectionarrowandother variables,e.g.,force,displacementofthehandleofthetestingmachineorworkcarriedout onthesample.
Visualizationofchangesintheshapeofthesampleinsubsequentphasesofthetest togetherwiththequantitiesmeasuredusingauniversaltestingmachinefacilitatesthe predictionofthemodelofdestructionundergivenconditionsandgivesthepossibility ofitsquantitativeverificationbydeterminingthemodellingerroroftheshapeitselfor theparametersdeterminedonitsbasis.Asanexampleofsuchapossibility,theeffectsof approximatingtheshapeofthesampleusingthesinusoidalfunctionandtheerrorgraph ofthisapproximationallowingtoestimatethelimitsofapplicabilityoftheproposedmodel areshown.Thedevelopmentofamodelofpaperdestructionduringcompressionisof greatimportanceforpredictingthestrengthpropertiesofcorrugatedboardandcardboard packagingproducedfromit.Thiswillallowforsavingsintermsofpackagingproducts intransportandreducingtheconsumptionofpaperrawmaterialsfortheproduction ofcardboard.
Inorderforthedevelopedmeasurementtechniquetobefullyusefulintestingthe strengthpropertiesofpaper,theprocessofregistrationandpre-processingofsample imagesmustbeoptimized.Inparticular,theprocedureusedtodetecttheopticaledge ofthesampledoesnotallowforitscorrectdetectioninthevicinityoftheattachmentto
theUTMholder.Itisplannedtomaskthehandlewithblackstickers.Theauthorsare alsolookingforoptimalimagesizesettings,whichwillmaximizethenumberofimages recordedduringtheexamination.Furtherresearchisalsoplannedtodevelopananalytical modeldescribingthephenomenaoccurringduringpapercompressionandmethodsfor determiningthemechanismofpaperdestructionandthecorrespondingmaximumforce thatdestroysapapersample.
AuthorContributions: Conceptualization,W.S.;methodology,W.S.andP.P.;software,P.P.;validation, P.P.andM.B.;formalanalysis,Z.K.;investigation,Z.K.;resources,M.B.;datacuration,M.B.andP.P.; writing—originaldraftpreparation,P.P.,Z.K.andW.S.;writing—reviewandediting,P.P.,W.S.,M.B. andZ.K.;visualization,P.P.;supervision,W.S.;projectadministration,W.S.Allauthorshavereadand agreedtothepublishedversionofthemanuscript.
Funding: Thisresearchreceivednoexternalfunding.
InstitutionalReviewBoardStatement: Notapplicable.
InformedConsentStatement: Notapplicable.
DataAvailabilityStatement: Thedatapresentedinthisstudyareavailableonrequestfromthe correspondingauthor.Thedataisnotpubliclyavailableduetothehighdegreeofcomplexityoftheir organization.Theauthorshavenotyetdevelopedanappropriatestandardfortheirstorage.
ConflictsofInterest: Theauthorsdeclarenoconflictofinterest.
1. Rzepa,S.Parametrypapieru.InProceedingsoftheSympozjumMondiPackaging“FromFibretoCorrugatedBoard”, ´ Swiecie, Poland,1–2December2004.
2. Bai,J.;Wang,J.;Pan,L.;Lu,L.;Lu,G.Quasi-staticaxialcrushingofsinglewallcorrugatedpaperboard. Compos.Struct. 2019, 226,111237.[CrossRef]
3. Czechowski,L.;Bie´nkowska,M.;Szewczyk,W.Paperboardtubesfailureduetolateralcompression—Experimentalandnumerical study. Compos.Struct. 2018, 203,132–141.[CrossRef]
4. Kołakowski,Z.;Szewczyk,W.;Bie´nkowska,M.;Czechowski,L.Newmethodforevaluationofradialcrushstrengthofpaper cores. Mechanika 2018, 24,169–173.[CrossRef]
5. Gajewski,T.;Garbowski,T.;Staszak,N.;Kuca,M.Crushingofdouble-walledcorrugatedboardanditsinfluenceontheload capacityofvariousboxes. Energies 2021, 14,4321.[CrossRef]
6. Yu-Ping,E.;Wang,Z.-W.Plateaustressofpaperhoneycombasresponsetovariousrelativehumidities. Packag.Technol.Sci. 2010, 23,203–216.[CrossRef]
7. Abbès,B.;Guo,Y.Q.Analytichomogenizationfortorsionoforthotropicsandwichplates:Applicationtocorrugatedcardboard. Compos.Struct. 2010, 92,699–706.[CrossRef]
8. Semple,K.E.;Sam-Brew,S.;Deng,J.;Cote,F.;Yanm,N.;Chen,Z.;Smith,G.D.PropertiesofcommercialKraftpaperhoneycomb furniturestockpanelsconditionedunder65and95percentrelativehumidity. For.Prod.J. 2015, 65,106–122.[CrossRef]
9. Kmita-Fudalej,G.;Szewczyk,W.;Kołakowski,Z.Calculationofhoneycombpaperboardresistancetoedgecrushtest. Materials 2020, 13,1706.[CrossRef][PubMed]
10. Fadiji,T.;Ambaw,A.;Coetzee,C.J.;Berry,T.M.;Opara,U.L.Applicationoffiniteelementanalysistopredictthemechanical strengthofventilatedcorrugatedpaperboardpackagingforhandlingfreshproduce. Biosyst.Eng. 2018, 174,260–281.[CrossRef]
11. Li,X.;Wang,J.;Chuang,C.;Gao,D.;Lu,G.;Lu,L.;Wang,Z.Mathematicalmodelsforpredictingthequasi-staticstress characteristicsofcorrugatedpaperboardwithsinusoidalcorealongthelongitudinalcompression. Int.J.Mech.Sci. 2018, 149, 136–149.[CrossRef]
12. Kubiak,T.;Kolakowski,Z.;Swiniarski,J.;Urbaniak,M.;Gliszczynski,A.Localbucklingandpost-bucklingofcomposite channel-sectionbeams—Numericalandexperimentalinvestigations. Compos.PartB 2016, 91,176–188.[CrossRef]
13. Mou,X.-N.;Lu,L.-X.;Zhou,Y.-L.Evaluationofin-planecompressivedensificationstrainofhoneycombpaperboard. Adv.Mech. Eng. 2020, 12,1–11.[CrossRef]
14. Smardzewski,J.;Prekrat,S.Modellingofthinpaperhoneycombpanelsforfurniture.InProceedingsoftheInternational ConferenceAmbienta,WoodisGood—WithKnowledgeandTechnologytoaCompetitiveForestryandWoodTechnologySector, Zagreb,Croatia,12October2012;pp.179–186.
15. PN-ENISO3035:2011;TekturaFalistaOznaczanieOdporno´scinaZgniataniePłaskie.PolskiKomitetNormalizacyjny:Warsaw, Poland,(PolishStandard);2011.
16. Murray,N.W.;Khoo,P.S.Somebasicplasticmechanisminthelocalbucklingofthin-walledsteelstructures. Int.J.Mech.Sci. 1981, 23,703–713.[CrossRef]
17. Królak,M.(Ed.) StanyZakrytyczneiNo´sno´s´cGranicznaCienko´sciennychD´zwigarówo ´ ScianachPłaskich(CriticalStatesandUltimate CapacityofThin-WalledGirderswithFlatWalls);PWN,Warszawa-Łód´z:Daimlera,Poland,1990.
18. Reddy,J.N. MechanicsofLaminatedCompositePlatesandShells:TheoryandAnalysis,2nded.;CRCPress:BocaRaton,FL,USA,2004. [CrossRef]
19. BinKamarudin,M.N.;MohamedAli,J.S.;Aabid,A.;Ibrahim,Y.E.BucklingAnalysisofaThin-WalledStructureUsingFinite ElementMethodandDesignofExperiments. Aerospace 2022, 9,541.[CrossRef]
20. Gonzalez,R.C.;Woods,R.E. DigitalImageProcessing,3rded.;PrenticeHall,SE:Hoboken,NJ,USA,2007;ISBN978-0-13-168728-8.
21. Pełczy´nski,P.;Szewczyk,W.;Bie´nkowska,M.Single-CameraSystemforMeasuringPaperDeformationsBasedonImageAnalysis. Metrol.Meas.Syst. 2021, 28,509–522.[CrossRef]
22. Considine,J.M.;Scott,C.T.;Gleisner,R.;Zhu,J.Y.Useofdigitalimagecorrelationtostudythelocaldeformationfieldofpaperand paperboard.InProceedingsofthe13thFundamentalResearchSymposium,Cambridge,UK,11–16September2005;pp.613–630.
23. Stanier,S.A.;Blaber,J.;Take,W.A.;White,D.J.Improvedimage-baseddeformationmeasurementforgeotechnicalapplications. Can.Geotech.J. 2016, 53,727–739.[CrossRef]
24. Online;ProcemexMachineVisionApplicationsinPulpandPaperIndustryOfferDifferentSolutionsforPulpFurnish,Pulp bale,andRollQualityInspection.Availableonline: https://www.procemex.com/machine-vision-applications (accessedon 7January2023).
25.Volmir,A.S. NonlinearDynamicsofPlatesandShells;SciencePublishingHouse:Moscow,Russia,1972;p.432.(InRussian)
26. Kolakowski,Z.;Jankowski,J.Someinconsistenciesinthenonlinearbucklingplatetheories—FSDT,S-FSDT,HSDT. Materials 2021, 14,2154.[CrossRef]
Disclaimer/Publisher’sNote: Thestatements,opinionsanddatacontainedinallpublicationsaresolelythoseoftheindividual author(s)andcontributor(s)andnotofMDPIand/ortheeditor(s).MDPIand/ortheeditor(s)disclaimresponsibilityforanyinjuryto peopleorpropertyresultingfromanyideas,methods,instructionsorproductsreferredtointhecontent.
To manage their increasingly ambitious environmental agendas successfully, companies need better and more versatile data, yet the elements and mechanisms through which businesses and the environment benefit from data remain poorly understood. A single-case-study setting was designed for examining the perceived value of data for environmental sustainability as seen by the customers of a tissue-paper supplier. The findings, from material collected during interviews with customers in 2022, showcase the multifaceted nature of data's value for business operations and associated ability to support decisions and activities that encourage environment-informed choices and environmental improvements. Also, fully exploiting data's potential for environmental sustainability requires greater volume and detail of product-specific data, transparency of value chains and environmental impacts, and data's better management and sharing. The emerging insight related to the value of data strengthens understanding of how companies could, with data, support their customers' environmental performance.
Contact information:
1 Department of Forest Sciences, University of Helsinki, Helsinki, Finland
2 University of Graz, Institute of Systems Sciences, Innovation and Sustainability Research, Graz, Austria
3 Department of Information and Service Management, Aalto University School of Business, Espoo, Finland
Corp Soc Responsib Environ Manag. 2023;1 –14.
https://doi.org/10.1002/csr.2541
Creative Commons Attribution NonCommercial No Devis License
The Paper Industry Technical Association (PITA) is an independent organisation which operates for the general benefit of its members – both individual and corporate – dedicated to promoting and improving the technical and scientific knowledge of those working in the UK pulp and paper industry. Formed in 1960, it serves the Industry, both manufacturers and suppliers, by providing a forum for members to meet and network; it organises visits, conferences and training seminars that cover all aspects of papermaking science. It also publishes the prestigious journal Paper Technology International® and the PITA Annual Review , both sent free to members, and a range of other technical publications which include conference proceedings and the acclaimed Essential Guide to Aqueous Coating.
Received:17November2022Revised:25May2023Accepted:27May2023
DOI:10.1002/csr.2541
1DepartmentofForestSciences,Universityof Helsinki,Helsinki,Finland
2UniversityofGraz,InstituteofSystems Sciences,InnovationandSustainability Research,Graz,Austria
3DepartmentofInformationandService Management,AaltoUniversitySchoolof Business,Espoo,Finland
Correspondence
PäiviLuoma,DepartmentofForestSciences, UniversityofHelsinki,Latokartanonkaari 7,00014Helsinki,Finland.
Email: paivi.luoma@helsinki.fi
Fundinginformation
TheMetsämiestenSäätiöFoundation, Grant/AwardNumber:21VE049KE; Kaute-säätiö,Grant/AwardNumber: 20220113
Abstract
Tomanagetheirincreasinglyambitiousenvironmentalagendassuccessfully, companiesneedbetterandmoreversatiledata,yettheelementsandmechanisms throughwhichbusinessesandtheenvironmentbenefitfromdataremainpoorly understood.Asingle-case-studysettingwasdesignedforexaminingtheperceived valueofdataforenvironmentalsustainabilityasseenbythecustomersofatissuepapersupplier.Thefindings,frommaterialcollectedduringinterviewswithcustomersin2022,showcasethemultifacetednatureofdata'svalueforbusinessoperationsandassociatedabilitytosupportdecisionsandactivitiesthatencourage environment-informedchoicesandenvironmentalimprovements.Also,fullyexploitingdata'spotentialforenvironmentalsustainabilityrequiresgreatervolumeand detailofproduct-specificdata,transparencyofvaluechainsandenvironmental impacts,anddata'sbettermanagementandsharing.Theemerginginsightrelatedto thevalueofdatastrengthensunderstandingofhowcompaniescould,withdata,supporttheircustomers'environmentalperformance.
customervalue,environmentalsustainability,forestindustry,tissuepaper,valueofdata
Companieshaveambitiousinternalobjectivesforenvironmentrelatedsustainability,connectedwithclimate-changemitigation,circulareconomy,andbiodiversityprotection.Atthesametime,they mustcontendwithgrowingdemandsofexternalstakeholdersfor transparentandaccountableactivities(ComasMartí&Seifert, 2013).
Customersdesiretraceabilityofproducts'valuechainsandevidence fortheenvironment-relatedclaimsmade(Ruschetal., 2022),and investorslikewiseaskforbusinesstransparencyanddatathatattest togenuineenvironmentalimprovementsandsustainability(Herzig& Schaltegger, 2006).Regulators,inturn,seekverifiedcomplianceand eliminationofgreenwashing(EuropeanCommission, 2020).
Theseexternalpressures,incombinationwiththeinternallysetobjectives,callforcompanies'bettermanagementoftheirsustainability agendasbyallmeansattheirdisposal,includingversatileuseofdata tosupportsettingtheobjectives,identifyingimprovementopportunities,implementingappropriateactions,andseeingthatobjectivesare met(Buschetal., 2022).
Inthisconnection,dataondiverseaspectsofbusinessactivities, serviceandproductlifecycles,andrelatedenvironmentalimpactscan informenvironment-linkedsustainabilityeffortswhentheintegration, discovery,andexploitationofsaiddata(Miller, 2013)producevaluableinsightinsupportofenvironmentalsustainability(Song etal., 2018).Thisisthecase,forexample,whendatarevealingthe carbonfootprintofaproductareavailableandinfluencecustomers'
Thisisanopenaccessarticleunderthetermsofthe CreativeCommonsAttribution-NonCommercial-NoDerivs License,whichpermitsuseanddistributioninany medium,providedtheoriginalworkisproperlycited,theuseisnon-commercialandnomodificationsoradaptationsaremade.
©2023TheAuthors. CorporateSocialResponsibilityandEnvironmentalManagement publishedbyERPEnvironmentandJohnWiley&SonsLtd. CorpSocResponsibEnvironManag.
purchasedecisions(Pinheiroetal., 2022;Ruschetal., 2022).Other examplesinvolvedatasharingbetweensuppliersandcustomers;for instance,detailingthecontentandoriginoftheproductcanhelpall partiesunderstandandmanagepotentialbiodiversityissuesandother environmentalrisksalongthesupplychain(Contadoretal., 2021).In addition,companiesneeddataforprovingtheirenvironmentalperformancetocustomers,investors,andregulatorswhodemandevidence ofprogressonclearlydefinedpathwaystosignificantreductionin greenhouse-gasemissionsandwhorequirecompliancewiththeEU's newCorporateSustainabilityReportingDirective(ScienceBasedTargetsInitiative, n.d.;EuropeanCommission, 2021).Whencultivated intoinformationand,further,intoknowledge,datacansupportbetter, moreenvironment-awaredecisionsbyincumbentcompaniesandby theircustomersandsuppliers.
Theintersectionofenvironmentalsustainabilityanddigitaltransformation,encompassingincreasingavailabilityandutilizationofdata, hasrecentlycapturedscholars'moreintenseinterest(see,e.g.,Bai etal., 2020;Cardinali&DeGiovanni, 2022).Digitalizationandrelated dataarenowrecognizedasgatewaystosupportingclimate-change mitigation,circulareconomy,andotherenvironment-linkedgoals (DiMariaetal., 2022;Georgeetal., 2021;Liuetal., 2022),withgeneraldiscussionpointingtotheirpotentialroleinashifttoward sustainability – reducedresource-intensity,greaterenergy-efficiency, wastereductions,anddecreasedCO2 emissions(e.g.,Chiarini, 2021; Kerin&Pham, 2020;Niehoff, 2022).Specificdigitaltechnologies facilitatingactivitiessuchascollectionandutilizationofdata,alongsidetheso-calledIndustry4.0ingeneral,arerecognizedasprospectivemeansofsupportingmoresustainablebusinessstrategiesthat incorporatenewbusinessmodels,manufacturingpractices,and supply-chainsolutions(deSousaetal., 2018;Guptaetal., 2021).
Makingdata-drivendecisionsisincreasinglyrelevantnotonlyin companies'internalactivitiesbutalsointheirlargervaluechains, bringinginsuppliersandcustomers(Dubeyetal., 2019;Gebhardt etal., 2021;Goldetal., 2010).Dataneedsaregrowingmoreprecisely elucidated,andgreaterdetailisrequired – thedatamustcover numerousfacetsofproductlifecyclesandvaluenetworks.These requirementsnecessitateconsiderableexpansioninthequantitiesof dataneededbutalsoemphasizetherequisiteofsuccessfullymanagingandutilizingthedata(Gandolfo&Lupi, 2021).Thusfar,though, potentiallyvaluableenvironmentalsustainabilitydatahaveremained scatteredandunder-utilized(Ruschetal., 2022).Efficientmeansof collecting,managing,andutilizingsaiddatainbusinessdecisionmakingarestillemerging,andcommondefinitions,methods,andrules ofthegameforutilizingandsharingdataarelargelyabsent(Busch etal., 2022;EliasMotaetal., 2020).
Inthiscontext,thevaluethatversatileproductlife-cycleand value-networkdataofferforrealizingenvironmentalgainsispoorly understood,andcompanieslackunderstandingofthedata'sultimate valueforbusinessesandtheircustomers.Theseshortcomingsrender itdifficulttoprioritizedata-linkeddevelopmentneedsandarticulate casesforinvestinginrelatedinnovationandcapabilitydevelopment. Itisdifficulteventopointtoempiricalfoundations,sincelittle researchhasexaminedthedetailsoftheelementsandmechanisms
viawhichdataresourcescreatevalueforenvironmentalsustainability. Althoughresearchhaspinpointedcollaborationascrucialtoanymove towardsustainability,ourreviewofpertinentliteratureidentifiedno studiesaimedatsystematicunderstandingofhowacompanycould, withtheuseofdata,serveitscustomers'pursuitoftheirenvironmentalsustainabilitytargets.Inaddition,thereisarecognizedneedfor furtherempiricalresearchspecificallygearedtorevealinghowdigital transformationsupportsreachingenvironmentalgoals(Beltrami etal., 2021;O'Rourke&Lollo, 2021;Ruschetal., 2022).
Thepurposebehindthispaperistohelpfillthatgapbyexamining data'svalueforenvironmentalperformanceasperceivedbythedirect customersofaleadingEuropeantissuepapersupplier.Inastudyfrom theperspectiveofenvironmentalsustainability,weexploredtheterritoryofcustomers'expectations/needsandhowtheyareshifting.Settingouttouncovercriticalelementsandmechanismsofdata'svalue inthiscontext,weaddressedthefollowingresearchquestion: Howis thevalueofdataforenvironmentalsustainabilityperceivedamongbusinesscustomersofatissuepapersupplier?
Wechosetofocusonthevaluechainbehindtissuepaper becauseofitsassociatedcomplexdemandsforenvironmentalsustainability,fromarangeofstakeholders:customers,investors,regulators,andothers(Ghosal, 2015;Toppinenetal., 2017).Thesedemands casttherapidlygrowingneedforenvironmental-performance-related dataintohighreliefalso.Thebodyofdatarequiredcomprisesmyriad detailsthatacompanymaycollect,produce,process,andsharein relationtoitsactivities,products,andvaluechains(alltheway throughtocustomersanddisposal)thatcouldshedlightontheirenvironmentalimpactsandtheimprovementopportunities.Inpreviousliteratureontheforestcompanies(Mäkelä, 2017)itisfoundthatthese companiesreportontheenvironmentalperformanceoftheirsupply chainonlyverylittle.Hence,relyingonsecondarysourcesavailablein reportingdatafromthecompaniesthemselvesisnotlikelytoproduce sufficientlyin-depthinsightsfromthecustomerinterfacetofacilitate solidanalysis,callingforcollectionofprimarydata.Thecasecompany, MetsäTissue,hadrecognizedaneedtomakebetteruseofdatato enhanceitsenvironment-relatedperformanceinthebusinessof tissue-papermanufacture,anditsoughttounderstandhow,alongside itscustomers,itcouldenhanceitsutilizationofdataforenvironmental sustainability.ThefindingspresentedhereareoutputfromajointprojectwithMetsäTissuecarriedoutinJanuarytoJune2022that includedeightinterviewswithdirectcustomersofMetsäTissue engagedinretailandprofessionalsales.
Thisempiricallyunderpinnedstudy'scontributiontotheoryis twofold.First,weidentifiedthediscreteelementsoftheenvironmentalsustainabilityvaluethatcustomersperceiveindata,and,second, ourworkmakesthemultifacetednatureofdata'svalueinsupportof environment-informeddecisionsandenvironmentalimprovements explicit.Theresultingsenseofthevalueheldbydatacontentandthe possibleusespointstothenecessityofreliableproduct-specificand environment-relateddatatosupportbetterinformeddecisionswithin companiesandalongtheirvaluechains.Thework'scentralcontributiontopracticeisinstrengtheningourunderstandingofhowcompaniescouldseizedata'spowertoenhancetheircustomers'
environmentalperformance.Thefindingsofthisempiricalstudyprovidein-depthinsights,whichsofarwereonlyrarelypresentedinliterature.Thearticleisstructuredtopresenttheconceptualbackground oftheresearch,thenoutlinetheresearchdesignandapresentation ofthemostimportantfindings.Wethendelveintotheirimplications withthediscussionsectionandarticulationofourgeneral conclusions.
Consideringenvironmentalsustainabilityhasbecomeaprerequisite foranybusinessthatwantstomeetstakeholderexpectationsand guaranteeitsoperations'long-termsuccess.Fromabusinessperspective,themainaiminstrivingforenvironmentalsustainabilityisto reducethenegativeenvironmentalimpactsofcorporateactivities whilestrengtheningone'seconomicperformanceandalsofactoringin socialeffects(Khanetal., 2021).Pursuitofsustainabilitymaybemotivatedbydemandsfromregulators,owners,markets,andotherstakeholdersjustasmuchastheexpectedeconomicbenefitsandthe organization'sethicscommitments(Baumgartner&Rauter, 2017). Simultaneously,corporatesustainabilityhasbecomeamorestrategylinkedissue,involvingnotonlylegalcompliancebutalsogaininga competitiveedgeandmanagingthebusiness'sreputation(Engert etal., 2016).Companiesaimtointegrateenvironmentalconsiderationsintotheiractivitiesacrossbusiness-functionboundaries,from productdesignandsupply-chainmanagementtobusinessdevelopmentandsales(Meueretal., 2020).Inaddition,somestakeholders demandthatcompaniestakeresponsibilityforsustainablepractices throughoutthesupplychain(Sarkisetal., 2021;Sodhi&Tang, 2019).
Increasingavailabilityofdata,enabledbydigitalization,ischanginghowbusinessesoperate,thusaffectingopportunitiestoinfluence environmentalsustainability.Datacanbedefinedasobjectivefacts abouteventsandobservationsofthestateoftheworld(Davenport& Prusak, 1998)orassymbolsthatrepresentpropertiesofobjects, events,andtheirenvironments(Ackoff, 1989).Itisonlyafterthe transformationofdataintoknowledgebymeansofunderstanding saiddataincontextandelaboratingonthevaluablepatternsuncoveredthattherelevantdatacanfunctionmaximallyforenvironmental sustainability(Ackoff, 1989;Rowley, 2007).
Datacanaddvaluebydrivingtransparency,optimization,learning,anddeeperunderstandingofsuchfactorsascustomerneeds (Chenetal., 2015).Data'svaluewithspecificregardtoenvironmental sustainabilityliesintheabilitytobringenvironmentalconsiderations intostrategicandoperativedecision-makinginanevidence-based mannerforbusinessfunctionssuchasproductdesign,production planning,supply-chainmanagement,andbusinessmodels'development(deSousaetal., 2019;Langley, 2022).Dataaffordinnovative waystoimproveefficiencyand,furthermore,monitorandoptimize processesandproductperformances(Niehoff, 2022).Thissourceof informationisrecognizedalsoforitspotentialinbuildingtransparency amongstakeholders(Ruschetal., 2022).Theabilityofdatatoaidin settingplausibleenvironmentaltargets,identifyingimprovement
opportunities,carryingoutactions,andmonitoringthedevelopment onvariousfrontsmakesdata-informedoperationshighlyattractivein conjunctionwithorganizations'worktowardambitiousobjectives theyhavesetforthemselvesinrelationtoenvironmentalsustainability,whichaddressclimate-changemitigation,circulareconomy,and biodiversityprotection.Forcompanies,theuseofdataoffersparticularvalueforbringingenvironmentalconsiderationsintostrategicand operativedecision-makingacrossabroadspanofbusinessfunctions, fromproductdesigntosupply-chainmanagement(deSousa etal., 2019;Langley, 2022).
Inthisconnection,abodyofdatathatcoversdiverseaspectsof businessactivitiesandofproductandservicelifecycles,including relatedenvironmentalimpacts,canyieldknowledgeforenvironmental sustainability.Varietyofdatacouldsupportbusinessesintheirenvironmentaleffortsbyilluminatingmultipleaspectsofthoselifecycles andtherelatedmaterialflowsandemissions,suchthattheycanbetterassessenvironmentalimpactsandidentifyimprovementopportunities(Nascimentoetal., 2019;Tsengetal., 2018).Inaddition,data thatrevealpatternsinhumanbehaviorandneedscouldfacilitate effortstopinpointopportunitiesforsustainableconsumption,sound procurementchoices,andnewbusinessmodels,whilealsoproviding technicalinputonthesystems'performancethatmayaidinsystemic improvements(Guptaetal., 2021;Luomaetal., 2021).Possibledata sourcesrangefromcompanies'internalprocessestoexternalsupplychainpartnersandcustomers(Hartmann, 2016;Rantaetal., 2021). New,bettermeansofaccessingandapplyingenvironment-related dataarebeingdevelopedconstantly.Forinstance,smartalgorithms, connecteddevices,andBigDatacansupportresource-andenergyefficientproductionandconsumption(Bohnsacketal., 2022);blockchaintechnologiesservetrackingofmaterials'paththroughsupply chains;waste-to-resourcemarketplacesmaybeestablished;anddigitaltwinsanddigitalproductpassportsassistintracingproductlife cycles.
Creatingcustomervalue – withdata'spotentiallycrucialcontributiontothis – isaprerequisiteforbusinesssuccess(Flintetal., 1997; Graf&Maas, 2008;Porter, 1996).RobertWoodruff(1997,p.142) definescustomervalueasthe “customer'sperceivedpreferencefor andevaluationofthoseproductattributes,attributeperformance,and consequencesarisingfromusethatfacilitate(orblock)achievingthe customer'sgoalsandpurposesinusesituations.” Whichattributes, consequences,andgoals/purposesaredesiredgetsaffectedbythe product-usesituationandcanchangeovertime.Forinstance,users' accumulatedexperiences,perceptions,preferences,andevaluations (bothindividual-levelandsocial)affectvaluecreation(Helkkula etal., 2012;Woodruff, 1997).Also,customersassessvaluerelativeto theirownresourcesandprocesses,andtheyconsiderresources'integrationandsharingbetweenprovidersandcustomers(Rintamäki& Saarijärvi, 2021).Thisfactorisespeciallytopicalinthecaseofdata: thevaluecreationisadynamicprocess(Grönroos, 2008;Tzokas& Saren, 1999)whereinproviderandcustomercreatevaluetogether throughtheirinteraction(Ballantyne, 2004;Grönroos&Voima, 2013). Muchhingesoncombinationsofforces.Customers'strategicfocus andoperationprocessesaswellasregulationandtechnology,for
example,maytriggerchangesincustomer-experiencedvalue(Flint etal., 1997).Anticipatingwhatcustomerswillperceiveasvaluable,in theircontextandintheirterms,isseenascriticaltomaintainingcustomervalueinacontinuouslychangingworld(Huretal., 2013; Rantalaetal., 2019;Rintamäki&Saarijärvi, 2021).
Thepulpandpaperindustry,withthetissue-paperindustrybeingno exception,facescomplexdemandsforenvironmentalsustainability, fromawiderangeofdirections.Thesedemandsaredrivenbymore extensiveawarenessofsustainabilitybycustomersandotherstakeholders,tighteningregulatorylimits,andglobalizationoftheindustry itself(Ghosal, 2015;Toppinenetal., 2017).Themulti-tiersupply chains,whichfeatureforestmanagementandharvesting,manufacturing,logistics,retailsales,anduseoftheproducts,havecrucialimplicationsforenvironmentalsustainability(Vidaletal., 2010).Thisindustry useswood-basedfiber,water,energy,andchemicals,allinsignificant amounts(Lipiäinenetal., 2022).Hence,climatechange,resourceefficiency,andsustainableforestmanagementhavebeenamongthe topicsprioritizedontheindustry'senvironmentalagenda(Ranängen& Zobel, 2014;Tuppuraetal., 2016).
Tissue-typepapers,suchas(forhomeandaway-from-homeuse) papertowelsandtoiletpaper,areputtocleaning-relatedandpersonal useinhouseholds'day-to-daylifeandprofessional-salescustomers' routineoperations(e.g.,cleaningandfacilitymanagement,industrial production,andpublic-sectorwork).Demandforthemisrising steadilyinresponsetochangesinconsumptionpatterns.Bothvirgin andrecycledfibersareamongthemainraw-materialinputs,andthe goodsaretypicallyproducedrelativelyclosetotheconsumptionsites, forshorttransportationdistances.Thetissue-paperindustry'sturnoverinEuropecomestoroughly10billioneurosannually,accounting for25%oftheglobalmarketforthesepapers(EuropeanTissue Symposium, n.d.).About75%ofthevaluearisesthroughretailsales, andtherestcomesfromaway-from-homeandB-to-Bmarketssuch ashotelandrestaurant,hospital,andofficeuse(EuropeanTissue Symposium, n.d.).
Againstthisbackground,wechoseonecompanytorepresent firmswithinthisexpandingindustryofferinguniqueandin-depth insightsintovaluecreationbasedondata.Thecasecompanychosen forstudyincombinationwithitsretail-andprofessional-salescustomerswasMetsäTissue,oneofthelargesttissue-papersuppliersin Europe(EuropeanTissueSymposium, n.d.),whichhasnineproduction units,inFinland,Sweden,Germany,Poland,andSlovakia.With1.2billioneurosin2022sales,MetsäTissuealoneemploysapproximately 2500people.ThecompanyispartofMetsäGroup,aFinnishforestindustryentitythatprovidesabroadrangeofwood-basedproducts toglobalmarkets.ThemanagementteamatMetsäTissuerecognized aneedtomakebetteruseofdatainsupportofenvironmentalsustainability,andthecompany'smanagerswerereadytoworkwiththeir
customerstounderstandthepotentialvalueofdatamorefully.Therefore,thecasecompanywasreceptivetotheideaofthistimelyanalysis(Gray, 2018).Wesawgreatvalueinanon-anonymouscaseofthis nature,fortheopportunity – rareinforest-businessresearch – to afforddeeperunderstandingoftheemergingconvergenceof environmental-sustainabilityanddatawork.Thisisespeciallyvaluable sincebothoftenareperceivedascomplexandabstractareaswithlittlesoundempiricalresearch.
AmongMetsäTissue'scustomersareretailersbutalsovariousclientsengagedinprofessionalsales(suchasdistributorsofofficesupplies).Improvingenvironmentalperformanceisnotonlyatoppriority forMetsäTissuebutalsocrucialforitscustomers,whichfacemountingpressureforenvironmentalsustainabilityfromtheirownstakeholdersand,hence,seekproofofenvironmentalimprovementsinthe associatedsupplychains.ExplicitdemandsforMetsäTissuearise from,forexample,customers'commitmentstoreducingtheir greenhouse-gasemissionsinlinewithspecificscience-basedtargets (ScienceBasedTargetsInitiative, n.d.).Inaddition,thecompanyhas directlycommittedtovariedsustainabilitytargets,amongthemhaving entirelyfossil-freemillsandproductsby2030(MetsäTissue, n.d.). OperatingprimarilyinEurope,italsomusthonorEU-levelregulatory requirementsforcorporateenvironment-relatedreportingandtransparency(e.g.,EuropeanCommission, 2022).
Toadvanceunderstandingofthecustomer-perceivedvalueofdatafor environmentalsustainability,wechosetoconductaninductivesinglecasestudy,foraqualitativedesignwhereintheanalysisisstrongly groundedinempiricaldata(Gioiaetal., 2013).Casestudiesareattuned todevelopingconceptualcontributionsandnuancedaccountsofthe phenomenoninareal-worldcontext(Gray, 2018;Vossetal., 2002), especiallyinfieldswithrelativelylittlepriorattentionfromempirical science(Bansaletal., 2018).Theexploratoryapproachweapplied (Gray, 2018)enabledustounpackthecomplexphenomenonofthe perceivedvaluefromtheangleofthecasecompanyanditscustomers byuncoveringitsuniquefeaturesandpatterns(Bernardetal., 2017). Theapproachaddedvaluefortheparticipantstoo,astheprocess unfolded:sparkingofinsightinrealtimestrengthenedscholarlyunderstandingofthecontextfurther(Bansaletal., 2018).Furthermore,this wayofengagingenabledscientificandpracticalunderstandingofthe phenomenontoinformeachother(Bansaletal., 2018).Withitscollaborativemethod,thestudygenuinelystrengthenedMetsäTissue's environment-relateddatacapabilitiesasrelevantindividualsfromits sustainability,marketing,data-management,andcorporatefunctions werebroughtintotheproject.
Thefullprocesswasdesignedasasix-month(January–June 2022)collaborativeresearchprojectwithaworkinggroupthatcomprisedfivemembersofthesustainability,marketing,anddatamanagementfunctionsandasteeringgroupwithfourcorporate-level managers.Inaddition,theregionalvice-presidentsforsalesand selectedkey-accountmanagerswereinvolvedintheprocess,bothvia
thesales-groupmeetingsandwhenthecustomerinterviewswere beingpreparedforandconducted.
Theprojectfollowedathree-stageprocess(showninFigure 1)in whichthefirststagefocusedonsettingobjectivesfortheworkand obtainingcommitmentfrominformants/researchparticipantsat MetsäTissue.Thisphase'sproblemformulationincludedninebackgrounddiscussionswithkeyinternalinformants,twoworking-group meetings,andameetingofthesteeringgroup.Phase2broughtcustomersintothepicture,toengageingeneratingjointunderstanding ofdata'svalueforenvironmentalsustainabilitybymeansofinterviews.Additionally,thatphaseutilized,forpreparationforthecustomerinterviews,twoworking-groupmeetings,asales-group meeting,andonesteering-groupmeetingaswellas,forreflectionon theinterimresults,ajointmeetingoftheworkinggroupandthesales group.Theworkinthefinalphaseassessedtheopportunitiesand challengesidentifiedinthecustomerinterviews,sharedthefindings withcustomers,andarticulatedlessonsfromtheprocessforfuture businessdevelopmentandcustomerengagement.Phase3featured twofurtherworking-groupmeetingsandonemeetingeachofthe salesandthesteeringgroup.Inaddition,aninternalworkshopwas held,andtheteamsolicitedtheinternalparticipants'anonymousinput onthelessonsfromtheprocess.
MetsäTissue'scustomersdifferedintheircommitmenttoenvironmentalsustainability,notallhadsofarspecificallyprioritized developingtheirdatasourcesanddatamanagement,andsomelacked resourcesatthetimeofthestudytodevotetosuchmatters.We directedourattentiontothesetofcustomersthatseemedprepared todiscussthetopic.Focusingonthosecustomercompaniesreadyto discussthecoretopicfacilitatedcollectingvalid,reliablefutureorientedinsightastorapidlyevolvingneeds,thusenablingthecompanytotackletheseneedsproactivelyanddevelopthecapabilities required.Thetechniquefacilitateddelvingbeyondcommonlycited factors(e.g.,carbon-footprintdata)andformingvitalknowledgefor thefuture.
Potentialintervieweeswerechosenonthebasisoftheirsystematic workonsustainabilityandforhavingexpressedinterestindiscussing theutilizationofdataforenvironmentalsustainabilitywiththeirsuppliers.Prospectiveinterviewees(involvedinretailandprofessional sales)wereidentifiedincooperationwithMetsäTissue'svicepresidentsresponsibleforregionalsalesanditskey-account
Interviewee Roleatthe companyCompany'ssalestype
AManaging director
BSustainability manager
Professional(cleaning-and hygiene-productsupplier)
Professional(supplierofcleaning, hygiene,andofficeproducts)
CSustainability director Retail
DSalesdirectorProfessional(cleaning-and hygiene-productsupplier)
ESustainability director
Professional(officesupplier)
FSustainability director Retail
GSustainability manager
Professional(officesupplier)
H1a Sustainability manager Retail
H2a Sustainability specialist
Sameasabove aInformantsH1andH2,fromthesamecustomercompany,participatedin ajointinterview.
managers.Attentionwasgiventoinvolvingcustomersfromallsix regionswherethecompanydoesbusiness(Europeanmarkets),forelicitingviewsfrommultiplemarkets.Potentialintervieweeswerethen contactedbythecorrespondingkey-accountmanagers,andtheir interestinparticipatingwasconfirmed.Theindividualscontacted representedthecustomerentity'sbusiness-managementorsustainabilityfunction(thisdependedonthesizeofthecompany).Somecustomers,facingpressuresfrominflationandsupply-chaindisturbances atthetimeofthestudy,couldnotprioritizethetopicatthetimeof thestudy.Intheend,nineinformants,fromeightcustomercompanies,participatedintheinterviews.TheyarelistedinTable 1
Allextractsreproducedbelowarefromtheinterviewsheldwith customersinphase2(inApriltoMay2022),whichwereaudiorecordedandtranscribed(yieldingaround50,000wordsoftext).They werecarriedoutintheformofinteractiveMicrosoftTeamssessions adheringtoaprotocoldevelopedforpurposesofsystematicdatacollection.Toenhancecomparabilityfurther,oneoftheresearchersfacilitatedtheinterviews,encouragingparticipantstoexpresstheir thoughtsonthethreemainopenquestionsguidingtheconversation. Accordingly,theprocess,whichwascarriedoutineitherEnglishor Finnishandtook38–58minperinterview,focusedonthesecentral
FIGURE1 Atimelineoftheworkand itsphases. TABLE1 Theinformantsofthestudyandtheirroles.issues:(1)whichdriverswereshapingtheneedforanduseofdataat thecompanies;(2)whatkindofspecificdata,forwhatspecificneed, wasperceivedtobethemostvaluable;and(3)whatpotentialbusinessvaluesaiddatarepresented.
Inadditiontotheleadresearcher,oneortworepresentativesof MetsäTissuewerepresentforallinterviews:thecustomer'skeyaccountmanagerandasustainabilityspecialist.Theyweretherenot toparticipateactivelybuttohearthecustomer'sneedsandthoughts. Beforeallsessions,wemadethebackgroundandrationaleforthe interviewexplicitinrelationtoservingbothresearchinterestsand thecompany'seffortstoimproveintherelevantarea,andweassured theparticipantsofconfidentiality,togiveroomforopendialogalso addressingsensitiveissuesandpossiblycontroversialtopics.We madesuretoaddressanyquestionsorconcernstheinformantsmight havehadabouttheprocedureortheuseoftheresults.Ourdataset comprisesoneinterviewpercompany,withthemaindecision-maker whodealtwiththedemandsimposedonsuppliersforenvironmental sustainability.Foroneoftheinterviews,tworepresentativesofthe customerfirmwerepresent,andtheresthadoneinterviewee.
OurempiricalresearchemployedinductivelyorientedandcontentdrivendatastructuringandanalysisinformedbytheGioiamethodology(Gioiaetal., 2013;Magnani&Gioia, 2023).Aninductivemethod forsystematicallyanalyzingqualitativedatainamannerthatmaintainsopennesstodiscoveringnewconceptsandideas,itoffersthe furtherbenefitofenablingtheinformants'voicestofeatureprominentlyinthereportingontheresearch(Fontana, 2020;Fontana etal., 2021;Gioiaetal., 2013).Thistechniqueissuitedwelltoexploringtheconstructsandthemesassociatedwithdata'sperceivedvalue forenvironmentalsustainability,anditsupportsrichresultselucidatingtheconceptsidentifiedfromthedata.Asourresearchobjective wastoprobetheinterviewees'perceptionsaboutthevalueofdata, ourempiricaldatacorpuscontainsonlyprimarydatafromtheinterviewsconductedinphase2.Anyfurtherdatasources,likepublicly availablereports,werenotconsideredsincethecontentspresentedin thereareunfitforthisresearchproject.
Ourcodingandanalysisyieldednotadefinitivelistoraranking ofvalueattributesbutasetofexamplesthathighlightinterestingperceptionsgroundedinempiricaldatafromanevolvingfieldwherein severalkeyconceptsarestilltobedefined.Weusedfeaturesofthe MicrosoftOfficesuitethatfacilitatedataanalysisbyallowingthe wordingusedbytheinformantstoguidehowweorganizedand codedthedata.Thistoolsupportedtheteam'seasyiterationoverthe originaldata,therebyhelpingguaranteedeepinsightastothecharacteristicsofthedata.
Thefirststagebuiltondevelopingfirst-ordercodes(concepts) fromtheresearchdatawhilestayingrelativelyclosetotheoriginal material.Thesecondstageledtoprocessingtheseintosecond-order codes(themes)and,further,intoacoherentsetofaggregatedimensions.Forthefirst-ordercoding,thefullbodyofresearchdatawas
assessed,suchthatwecouldidentifyvalue-relatedaspectsbyusing opencodingthatreliedontheinformants'discourse.Here,one researcherperformedtheanalysis,andanothercheckedthecodingto verifythereliabilityoftheassessment.Similaraspectsthatemerged werecombinedtoconstitutethesetofconcepts,orfirst-ordercodes. Inthesecondphase,theresearchersstartedgroupingthosecodesby themeinaccordancewiththeirsimilaritiesbyiteratingbetweenthe first-ordercodesandtherawinterviewtranscripts;thisallowedusto identifythemesthatwerefirmlygroundedinthedata.Viaseveral iterations,asetofthemesdeveloped.Finally,thelatter,oursecondorderconstructs,wereorganizedintomoreabstractaggregatedimensionsusefulforexplainingthephenomenon.Forfullerunderstanding oftheperceivedvalueofdataforenvironmentalsustainability,we examinedtherelationshipsamongtheelementsidentifiedandconsultedtheliteraturetosupportfurtherreflectiononthefindings (Gioiaetal., 2013).Wecouldthenemploythisstructurefordescribing thefindingsindetailandstrengthentheresultingdescriptionwithfurtherquotesfromtheinformants.
Ourfindings,presentedbelowinlinewiththestructureoftheGioia analysisdepictedinFigure 2,shedlightonhowthestudy'sinformants perceivedthevalueofdataforenvironmentalsustainability.The viewsoftheinformantsrevealthatdata'sperceivedvalueforenvironmentalperformancehastwofundamentalelements:First,theintervieweescalledattentiontospecifictraitsofthedataandrelateddata managementrequired:availabilityofreliabledetail-levelproductspecificdataandincreasedtransparencyofproductvaluechains, coupledwiththeestablishmentofviablesystemsfordatamanagementandintegrationsolutionsthatsupportmanagingandsharingthe relateddata.Second,theyidentifiedvarioususesfordatathatshould encourageenvironment-associatedimprovements.Amongtheseuses arethecreationofaddedvalueforthecustomers'owncustomers (i.e.,thesecondtier)andforconsumers,contributiontobetterbusinessdecisions,andguaranteedcompliancewithregulations(also strengtheningstakeholdertrust).Thesectionsbelowexamineinformants'viewsofthesevariouselementsindetail.
Informantsstressedthecustomers'needfordetailedproduct-specific dataandincreasingtransparencyofthefullproductvaluechainsand theirenvironmentalimpacts.Whileasignificantportionofthevarious environmentalimpactsiscreatedoutsidethecustomer'sactivities,the customercompaniesare,toanincreasingextent,deemedresponsible forthevaluechainsintheirentirety.Suchdatawouldequipthemto
choosemoresustainableproductalternatives,setenvironmentrelatedpoliciesfortheirproductportfolio,complywithregulations thatareinthepipeline,andeducatetheirowncustomersinmoresustainablepurchasing.Therefore,theparticipantsneedaccesstocomprehensivedata,withfinergranularity,pertainingtotheproducts' materialsandtheiroriginespecially,asinformantF,aretailer'ssustainabilitydirector,noted: “Thereisaneedforincreasinglydetaileddata [ ]thescope,quantity,andthemesofdataareexpandingallthetime;all thetime,therearenewdatathatneedtobecollected. ” Forinstance, awarenessofthemanufacturingconditionscanrevealopportunities forenvironment-relatedimprovements.
Inthecaseofthetissue-papermarket,thetransparencyenvisionedwouldentailsomeabilitytotracethejourneyofthepaper fromtheforestandthemilltouse – andeventothesecondandthird cyclesintheproduct's “life,” whendoingsoisfeasible.Thissupports understandingtheproduct'ssustainabilityalongitsentirejourney. However,theinformantsrecognizedhowtrickyitistomakecomprehensiveproduct-specificdataavailable.Acknowledgingthechallenges,oneinformantpointedout, “Itismoreaboutstartingthe process[thanhaving100%correctnumbers].Juststartaskingandnudgingthenextlevelofcompanies[beforeyouinthechain]togatherthat data” (B,asustainabilitymanagerforacustomersellingto professionals).
Pertheinterviewees,thedataavailableforeachproductshould notbegeneraloraveragesbutthatproduct'sactualcontext-specific data,enablingcomparisonbetweendistinctproductsandfindingof sustainablealternatives.InformantC,workingasthesustainability directorforacustomercarryingoutretailsales,stressed, “Iwouldlike tohavedataontheproductandacomprehensiveview[of]itsvarious sustainabilityimpacts:theproductinthecenter,andthenithasdata attributes ” Morespecifically,theintervieweesexpressedadesirefor products'contentdetails,datarelatedtotheirorigin,andquantificationofenvironmentalimpacts.Relevantproduct-contentdatawould covertheproduct'smaterialsandcomposition(e.g.,anyrecycled material),correspondingdetailsforthepackaging,andeven “product recipes” revealingthechemicalsused.Theorigindatashouldidentify thesourcesofatleasttheproduct'smostcriticalmaterials,sothat issuessuchaspossiblebiodiversityriskscanbeidentified.Finally,the environmental-impactdatashouldaddresscarbonfootprintsatthe veryleast,buttheinformantsdetectincreasingfocusalsoon biodiversity-relateddata.Circular-economydatatooareofinterest, thoughtheywerenotemphasizedintheinterviews(therewasprobablyasenseoflimitedapplicabilityofcircularityinthetissue-paper domain).
Informantssoughtreliabilityandcomparabilityofproduct-specific andenvironment-relateddataboth,tosupportgreaterenvironmental sustainability.Incurrentconditions,thedata'sreliability,particularlyin thecaseofproduct-specificdetails,isseenasachallenge.Whilesome standardsforlife-cycleassessmentandmethodsofcalculatingcarbon footprintshavebeendeveloped,theproduct-relatedenvironmental dataavailabletodayaretypicallynotcomparable;thebackground assumptions,definitionofboundaries,andothervariationsrenderthe datapracticallyunusable.Informantsalsocitedaneedfor
transparencyofthedatasources(e.g.,clearstatementsofwhether thecalculationsappliedproduct-specificstandardizedimpactassessmentswithrealdataversusaveragedataforalargerproductgroup), andtheysawanincreasingneedforthirdpartiestoverifyand improvethequalityoftheenvironment-relateddata.
Theintervieweesstressedthatpracticaldata-managementsystems andintegrationmechanismsformanagingandsharingenvironmentrelatedproductandbusinessdataarerequiredforefficientcollection, management,anduseofdatatosupportenvironmentalsustainability. Theyconcludedthattheirrespectivecompanies'existingdatamanagementsystemsarenotsuitedtomanagingtheburgeoningvolumesofproduct-specificdataorservingsolidmanagementdecisions rootedinup-to-dateenvironment-relateddata.Theaim,asoneinformantdescribedit,shouldbe “thedata[comingoutof]thesystemwith thepushofabutton,suchasthefinancialdata,sothatwecouldcheck withthemanagementteamonceaquarterwherewearegoinginterms ofouremissiontargetsforthisyear” (H1,sustainabilitymanagerfora retail-salescustomer).Informantspointedoutthattheirproductmanagementsystemswerecreatedforpurposesverydifferentfrom workingwithsustainabilitydata;therefore,managingenvironmentrelateddatarequireslargeamountsofmanualeffort: “Itisveryprecise datathatisneeded,butourinformationsystemsdonotnecessarilysupportthatdata;[forthatreason]wehavetodoalotofmanualwork” (F, theretail-entitysustainabilitydirectorquotedabove).Theinformants articulatedaneedextendingbeyondtheircompany'sboundaries,for effortlesssharingofdataalongtheirsupplychains.InplaceofthecurrentpracticeinvolvingquestionnairesandExcelsheetssharedby e-mail,establishmentofjointdataplatformsandinterfacesbetween data-managementsystemswerecitedasopportunitiesforefficiently sharingofdata,decreasingtheduplicationofwork,andimprovingthe data'squality.
Informantssawthedatadescribedaboveasapromisingtoolfor respondingefficientlytotheirowncustomers'andtoconsumers' environment-relatedquestionsanddatarequests:consumers “keep askingmorequestionsanddemand[ ]transparency – theywantto knowwheretheproductscomefrom,whereandhowtheyaremanufacturedandunderwhatconditions,andhowtheenvironmenthasbeen takenintoaccount” (H1,speakingfromtheperspectiveofaretailcustomer'ssustainabilitymanager).Asthingsstand,addressingthese questionsandrequestsistime-consumingsincethedataarescattered acrossvarioussystems,mustbespecificallyrequestedfromsuppliers,
ormightnotbeavailableatall.Someinformantsstatedthat,rather thanrespondtotheserequestsonanadhocbasis,theymustproactivelypreparethemselvesforimpendingdataneeds.Forinstance, informantB(theprofessionalcustomer'ssustainabilitymanager) stated, “We'retryingtolookintoourcrystalballs,tryingtobelooking aheadandseethecustomerdemands[ ]sothatwhen[our]customers ask[for]somedata,wecansay, ‘Yes,wehavethat ’” Informantsalso sawthepowerofenvironment-relatedperformancedataforbringing relatedattributesintothesalesdiscussionswithsecond-tiercustomersalongsidepriceanddirectlybroadeningtheperspectivebehind consumers'purchasedecisions.Severalintervieweesclaimedtohave noticedashiftintheircustomers'focus,frompricetowardsustainability,andthatvendorsarebringingenvironmentaldatatothetable tosupportsalespitches:forinstance,theinformantquotedabove emphasizedthat “salesrepswouldlovenothaving[pricebe]theonly focusinacustomermeeting, ” stressingthat “wehaveothervaluesto bringtothetable ” E-commercewasrecognizedasenhancingthe opportunitiestobringenvironmentaldataintocustomers'andconsumers'decisionprocess.Itwasidentifiedequallyasapotential sourceofdataonconsumerbehavior/preferencesandasarouteto encouragingenvironment-friendlypurchasingpatterns.
Armedwithenvironmental-performance-relateddata,vendorscan alsobetterservetheircustomers'worktowardsustainability-basedbusinessgoals,suchasmeetingemission-andpackaging-relatedtargets. Oneinformantmentionedinfographicsasanespeciallyimpactfulwayto concretizehowmuchsingle-useplasticacustomercouldavoidby switchingtoamoresustainablealternative.Byactivelyidentifying, recommending,andprovidingsustainableproductalternatives,vendors canhelptheircustomersreducetheiremissionsandimprovetheir engagementwiththeenvironment.InformantBofferedtheexampleof “lookingtoacustomer'scompanymissionandsay[ing], ‘I'veseenthatyou haveagoalhere – youwanttoreducethis.IknowhowIcanhelpyouwith that ’” Thistiesinwiththepreviouspoint:grantingone'sowncustomers andtheendconsumersaccesstothedataissaidtopromotelearning thatfavorsmoreenvironmentallyinformeddecisions.Theinformants recognizedthemselvesasplayinganimportantroleineducatingtheir owncustomers,andtheyacknowledgedthatthemoreenvironmentally awarethosecustomersare,thebetterthedecisionsthatarelikelytofollow. “Ifthey[customers]haddataabouttheirhandtowelsortheirtoilet roll,andtheexactconsumptionandtheexactcarbonfootprintandanythingelsethatwouldreinforcethatdecision,Ionlythinkitcreatesamuch morecompellingargument,whichthenadecisionwillbemadefrom, ” statedinformantD(salesdirectorforaprofessional-salesentity).Via data,thewaytheythinkaboutproductsmightchange,andtheycould benudgedtowardmoresustainablepurchasingdecisions.
Additionally,theintervieweessawdataasvaluableforstrengtheningcredibilityincustomers'eyes.Datatransparencyincommunication withcustomersandendusersisperceivedasbuildingmutualtrustand helpingconvincebothestablishedandnewclients.Avendorthatprovidesenvironmentaldataforitsproductsandoperationsislikelytogain thestatusofatrustedadvisertoitscustomers.Also,customersdeeming anygivenvendorcommittedtoenvironmentalissueshingesonactive provisionofdata,asinformantAnoted: “Themorewecandemonstrate
topotentialclientsourenvironmentalcredibility,themorewecangrowour business” (managingdirector,professional-salescustomer).
Theparticipantsregardedavailabilityofreliableproduct-specificand otherenvironment-relateddataasabletodrivebetterbusinessdecisionsandtarget-settingrelatedtotheircompanies'environmental sustainability.Theyrecognizedsaiddataasnecessaryinputtoviable businesstargets(whetherforcarbonreductionorproduct-portfolio improvements)andtocompanypolicies(e.g.,onpackagingandrawmaterialpurchases).Thesedataarerequiredalsoforawell-reasoned foundationforinvestmentlogicandtoaidinassessingbusinessdecisions: “Decisionsmustbebasedondatasothatweknowwhattherelevantissuesareandwhatkindofstrictbutappropriategoalsweshould aimfor” (informantH1).
Inaddition,dataaidinsteeringtheworktowardtheenvironmentaltargetssetandsupporttrackingofprogress.Measuringhowwell thetargetsaremetandreportingtothemanagementonthecompany'senvironmentalperformancecallsforreadilyavailable,up-todate,andverifiableenvironment-relateddata.Informantsexplained thatdataarecrucialforgenuinelyguidingbusinessactivitiestoward thetargetsand,furthermore,enablingleaderstomakeachangeof coursewhenneeded.IntervieweeH1providedanillustrationhere too: “Wehavescience-basedclimategoalsandacarbon-neutralitytarget year,sodataisessentialsothatwecanmonitorandseewhereweare going[ ].Ifwedon'thavedata,orifweonlygetdataonceayear,it's verydifficulttoleadthatworkintherightdirection ”
Datathataregenuinelyproduct-specificandclearlyconnectedto environmentfactorsalsoassistinenrichingunderstandingofthe company'ssupplychains,andtheinformantsidentifiedsupply-chain transparencyasanincreasinglyimportanttopic.Commitment toscience-basedclimatetargets,forexample,obligescompaniesto makesuretheirsuppliersarecommittedtoclimate-relatedimprovements.Theysawdataasdemonstrablyenablingnotonlybetterrisk managementbutalsoidentificationofimprovementandcollaboration opportunitiesinthesupplychains: “Whenwehavebetterdataonwhat kindofpartnerAisinrelationtopartnerB,thenwecouldmoveforward withthatpartner,A,becauseithastriedtodothingsbetter” (C,the aforementionedsustainabilitydirectorforaretailcustomer).
Datamayalsosupportcompany-internalinnovationandlearning. Someinformantscitedthisfacetoftheirapproachtosustainabilityas especiallyimportant.Theydidnotspecifywhatinnovationemerging viathedatamightlooklike,however,andtheynotedthatbuildingon thedataishardestforpioneers.
Participantsreadilyacknowledgedenvironment-relateddata'svalue forsupportingtheirabilitytorespondtoregulatoryrequirements,
helpingthemtocomplymoreeasilywithstricterrequirementsfor datacollectionandreporting.Inthemarketswheretheoperationsof theinformants'companieswereconcentrated,EUregulationisimpellingever-increasingrequirementsforproduct-andenvironmentrelateddata: “It'sahugeregulatorytsunami[fromtheEU]andtheneed fornewdataandreporting” (informantF).AmongthetopicalregulatoryinstrumentsmentionedarethenewCorporateSocialResponsibilityDirective,expandingthereportingrequirements;theproposed directiveoncorporate-sustainabilityduediligence,callingforcompaniestotakeresponsibilityfortheirglobalvaluechains;andacirculareconomypackagetighteningtherestrictionsappliedtoenvironmental claims,tolimitgreenwashing.
Theinformantssawhigh-qualitydataasalsoaffordingacoherent andcrediblepictureofthecompany'senvironmentalperformance.At listedcompaniesespecially,gainingthetrustofinvestorsdemands this: “Idon'tseeitaspossibletogetveryfarbyrepeatingsetphrases [relatedtothecompany'senvironmentalperformance].Thedatareally needtobeoutthereforinvestorstoo,sothattheybelievethatyourstory iscoherentandcredible” (H1).Partofthecommunicationwithinvestorsisparticipationinthird-partysystemsforratingcorporateresponsibilityperformance,suchasEcoVadis's.Thistoocallsfor extensiveprovisionofdata.
Insum,theintervieweesperceivedenvironment-relateddataof consistentlyhighqualityashelpingconcretizethingsandavoid greenwashinginsustainabilitycommunications.Dataattesttothe legitimacyofwhatthecompanyissayingandarenecessaryfor avoidingamarketfloodedwithgreenwashing: “ It'sgoodtohave somereallygoodstrongdatasothatpeoplecanseeit'snotgreenwashing ” (A,fromtheperspectiveofamanagingdirector).Informants recognizedaneedfordigestible,simplecustomer-facingcommunicationaboutdatathatmaintainsafocusedmessage: “ Whenyouget specificwithpeople'sexactusage,thenthat'swhenitbecomesreally powerful ” (D,thesalesdirectorquotedabove).Notonlycustomers butalsoemployeesaskforconcreteexamplesofwhatthecompany hasdonefortheenvironment(forexample,howmuchplasticwaste hasbeenavoided).Inaddition,someinformantslistedattractingtalentasanotherpotentialsourceofvaluecultivatedviathedata: “ Employeesalsostarttoexpectacertainlevelfromtheiremployer, suchthattheytooneedtogetdatatoprovethat – notjustsentences likewhatisbeingdonebutthekindofdatathatmakesthembelieve thatweareactuallydoingthings ” (H2,asustainabilityspecialistwith aretail-salescustomer).Inaddition,datacanexertaneffectonpublicopinion.Thisdovetailswiththefindingsrelatedtodata'spower todrivelearning.Oneinformantstressedtheimportanceofbringingtherightinformationtothepublicsothat,forinstance,old assumptionscanbedismantled.
Whenaskedaboutthemonetaryvalueofdatasupportiveofenvironmentalsustainability,theinformantswereunabletoquantify it.Thistypeofdatawasaddressedsimplyinqualitativeterms,asthe futureofthebusiness,crucialforbusinessgoals,keytocreatingnew clientrelationships,andthedifferencebetweengainingandlosing business.
Theprojectparticipantsfoundthatsuccessfullysupportingbusinesses'environmentalsustainabilitynecessitatesmeetingseveralconditionsrelatedtothecontentandreliabilityofdataandhowthedata aremanagedandshared.Thepresenceofthesecharacteristics enablesutilizingthedatainawiderangeofdecisionsand activities – inthebusinessitself,initsvaluechains,andamong stakeholders – thatsupportenvironmental-consideration-based choicesandoperationsthatentailimprovements.Thespectrum extendsfromintroducingenvironment-linkedattributesforpurchasingchoicestotrackingprogresstowardsetenvironmentaltargets.We canconnecttheseelementstotwolevelsinthehierarchyofperceivedcustomervaluethatWoodruff(1997)identifiesasessential whencustomersareassessingthevalueofproducts:thecharacteristics,whichhecalls “attributesandattributeperformances,” andthe usesofdata,whichhedescribesas “desiredconsequencesinusesituations.” Whilethathierarchywasdevelopedprimarilywithregardto products,ourfindingsindicatethatitmesheswellalsowithassessing thevalueofdataforcustomers.
Importantly,Woodruff'shierarchyhasathirdlevel:customers' goalsandpurposes.Theseaffectthedesiredconsequencesinusesituationsand,furtherdowntheline,theattributesandattributeperformances.Inouranalysis,theclusteringofthedecisionsandactivities thatdatacouldsupportrevealedthehigher-levelgoalsandpurposes oftheinformantsandtheirorganizationsfortheutilizationofdatafor environmentalsustainability.First,datacanserveasaresource enablingcreationofaddedvalueforthetier-2customersand,inturn, consumers.Second,theinformantsperceiveddataasabletosupport betterenvironmental-factor-informedbusinessdecisionsandimprove themanagementofcorporateresponsibility.Also,thereisrecognized valueindataforsupportingregulatorycomplianceasEUrulesgrow stricterandforgainingstakeholdertrust(whichinfluencesdrawingin investors,attractingtalent,andswayingpublicopinion).Whilethe importanceofthegoalsvariessomewhatamongtheinformants,the firsttwoofthesegoalswerestronglyemphasized.
Thefindingsrevealanapparentneedforgreaterquantitiesand detailofproducts'value-chaindataandrelatedenvironmental impacts,toprovidetransparencyandrevealtheenvironmentalperformanceoffullsupplychains;thisconclusionisconsistentwithpriorliterature(EliasMotaetal., 2020;Gandolfo&Lupi, 2021;Rusch etal., 2022).Researchhasfoundthistypeofdatatobeincreasingly crucialformeetingtransparencyneedsandcomplementingsustainabilityreportingincommunicationofcompanies'sustainabilitycommitmentsandeffortstostakeholders(Engertetal., 2016;Stewart etal., 2018).Likewise,manyofthechallengesemphasizedbythefindingsinrelationtodataavailabilityandreliabilityarerecognizedwellin theliterature.Gapsorinaccuraciesineventhesimplestsupply-chain data,suchasfactorylocations,areamongthefactorsidentifiedashinderingtheiruse,andanotherislimitedcomparabilityofproduct-
specificenvironmentaldataacrossbuyersandsuppliers(Comas Martí&Seifert, 2013;O'Rourke&Lollo, 2021).
Ourfindingsrenderitobviousthat,iftheenvironment-related dataaretocreatevalueforenvironmentalperformance,theymust guideavarietyofactivitiesanddecisions – significantlybetterthan theydoatpresent.Environment-criticaldecisionsaremadeinnumerousbusinessfunctions,fromdesigntooperations,andspanallthe waytoconsumers.Ifutilizedwell,environment-relateddatawouldbe flexiblyappliedtomeetmultipleneeds,servingquarterlymanagement updates,specificationofprocurementpolicies,provisionofconsumerfacingdetailsoftheenvironmentalimpactsoftheirconsumption,and soforth.Companiesarestartingtointegrateenvironmentaldatainto theirproduct-andsupply-chainmanagementsystems;however,most stilllackefficientwaystocollect,manage,andutilizeenvironmentrelateddata.Thestateofaffairsappearsnottohaveadvancedfrom thatidentifiedinpriorliterature(O'Rourke&Lollo, 2021;Ren etal., 2019).
Thefindingsimplythatthefocusinapplyingenvironment-linked dataisshiftingfromcompany-levelcompliance-drivenannualreportingtomultifacetedutilizationofdatainworkaffordingsustainable productvaluechainsandproductportfolios,coupledwithendeavors tonudgeconsumerstowardsustainablepurchasingchoices.Creating valueofthisnaturefromdatathroughoutandbetweenproductvalue chainscallsfortheproducts'providersandtheircustomerstococreatemeaningfulandeasilyverifiableenvironment-relateddataand valuethroughinteractionaimedatdata'sversatileutilization.Regardingvaluecreationasaco-creativeandinteractiveprocessconducted betweensuppliersandcustomersreflectsthecontemporarywayof thinkingaboutcustomervalue(Ballantyne, 2004;Grönroos& Voima, 2013).Thisprocessisdynamicalso(Flintetal., 1997),shifting asassociatedpriorities,regulations,anddataneedschange.Ourfindingsattesttodata'smultidimensionalnatureanddependencyonthe contextofmakinguseofthedata;thisconclusionissupportedalso byearlierstudies(Macdonaldetal., 2016;Tzokas&Saren, 1999).
Ourmainpracticalcontributionliesinstrengtheningtheunderstandingofhowcompaniescould,withdata,bettersupporttheircustomers'environmentalsustainability.Withacustomer-driven approachtothevalueofdata,companiescanbetterprioritizetheir data-developmentinitiativesinlinewiththecustomers'developing needsandcontinuouslydelivercustomer-recognizedvalue.The insightpertainingtotheperceivedcustomervalueofdatacouldserve tomotivateandguidecompanies'furtherexplorationofopportunities inthisdomain,alongsideothervaluechains'contexts.Also,thereisa recognizedneedtoanticipatewhatcustomerswillconsidervaluable, fromtheirstandpointandintheirterms,ifcompaniesaretocontinue creatingvaluefortheircustomersinaconstantlychangingworld (Rantalaetal., 2019;Rintamäki&Saarijärvi, 2021).Througha forward-lookingapproachtocustomerexpectationsandneeds, effortsfocusedonenvironment-relateddatacouldshiftfrom
compliancetomorestrategicuseofdata – thatis,tobringingthecustomersvalue.Companieswouldbenefitsimultaneouslyfromsystematiccultivationofsolidcapabilitiesrelatedtoenvironmental performancedata,alsotobetterapproachcorporatesustainability fromanemployeeengagementperspectiveandreaprelatedbenefits (Karatas-Ozkanetal., 2022).Suchendeavorsinvolvedatamanagementsystemsbutalsoskillsinanalyzingdataandpractices wherebytheplayersutilizedatatosupportenvironmentallyinformed decisions.Advancesofthisnatureareanecessarycomponentfora strongbackbonetodata'sutilizationandforovercomingthechallengesidentifiedfromourresearchmaterial – mostprominently,dataaccountabilityandincompletenessproblems,limitedcoverageofthe valuechains,thedifficultyofgatheringthedatarequired,andlackof commondefinitionsandmethods.Today,incontrast,handling(internalorexternal)environmental-performance-relateddatarequestsis labor-intensive,andthedata-managementsystemsdonotsupport efficientcollection,management,orsharingofdata.Hence,anydata sitidle,lackingvalueforthebusinessandtheenvironmentboth. Diversetouchpointsforproduct-specificdataalongvaluechains(data interfaces,dataplatforms,approachableuserinterfaces,etc.)would enableefficientsharingandimprovedata'susabilityinmanytypesof relevantbusinessdecisions.
Ourworkisnotwithoutitslimitations.First,theanalysiswasbased ontheviewsexpressedbytheinformants.Allretail-andprofessionalsalescustomersparticipatinginthestudyassignedhighpriorityto environmentalsustainabilityandsawopportunitiesfordatatosupport it.Forthisreason,thefindingsreflectperspectivesondata'svalueprimarilywithincompaniesthatcouldbecalledpioneersofenvironmentalsustainability.Second,thecustomersinvolveddisplayedvariation, especiallywithregardtotheutilityofdataforbringingvalue.Their perspectivesdependedonsuchcontextualelementsasthecustomer company'sownershipandmarkets.Third,thevalueofdataislikelyto beperceiveddifferentlyfrompersontopersonwithinanygivencompany,andindividualshaveboththeirowngoalsandshared,collective ones(Macdonaldetal., 2016).Theissuesandopinionsraisedbythe informantscanbeseenasspecificallytopicalforthematthetimeof theresearch,andonecouldexpectthesetoshiftasfociofinterest evolveandasprioritiesamongvariousdevelopmentneedsshiftover time.Inaddition,itshouldbenotedthatthreeoftheinterviewswere conductedinalanguagenotnativetotheinterviewees.Thoughrecognizingthepotentialdownsidetothis,wewantedtheresearchteam tobeproperlyengagedthroughoutthedata-collectionprocess.
Forbroaderunderstandingofhowcompaniesmay,withdata, supporttheircustomersinworkingtowardenvironmentalsustainability,researchcouldexploreseveralareasforfurtherstudy.Scholarship couldbenefitfromconcreteempiricalcasesofdatasupportingbetter environmentallyinformeddecisions(bybothhumansandAI)forbusinessesandtheirlargervaluechainsviaassessmentoftherelated environmentalandbusinessvalue.Researcherscouldalsocultivate
understandingofhowdata-derivedinsightaddressingconsumers' behaviorandpreferencescouldserveeffortstoencourage environment-relateddecisionsandassociatedimprovements.Increasingdemandsandstandardsforsustainabilityreportingmightalsopave thewayformoretransparencyanddetailsregardingreportedcompanymakingthesereportssuitableandreliablesourcesofdataalso forresearch.Expandingtheviewtoanalyzinghowvaluefromdata canbeco-createdbetweensuppliersandcustomersandhowthat valueissharedamongtheactorswouldbeworthwhile.Herein, researchrootedinmarketingresearchcouldprovideinspiration (e.g.,Mubusharetal., 2021).Finally,awiderperspective overall
encompassingmatterssuchassocialsustainability – would bewelcome.
Ourstudyrespondedtoaneedforexploringdata'svalueinthecontextofenvironmentalsustainabilityasperceivedbythecustomersof thecasecompanyandforexaminingexactlyhowthedatasupport value(forthebusinessesinvolvedandinenvironmentalterms).We wereabletohighlightvitalelementsandmechanisms.Byassessing thecharacteristicsandpossibleusesofdatathatcouldfacilitatesustainabilityalongsidethelinktocustomers'goals,weshedlightonthis valueasamultifacetedconceptevenwhenattentionisrestrictedto thecustomers'perspective.Wefoundthat,asourinformants highlighted,diversedecision-makingpointsinbusinessoperationsand consumers'lifecouldbenefitfrombetteravailabilityofreliable environment-relateddata.Clearly,theneedtocultivatesustainabilitysupportingvaluefromdataisconstantlygrowing,asareassociated expectations – business-function-internally,throughoutthecompanies'valuechains,andamongtheirstakeholders.Thebusinessworld urgentlyrequiresfarbettercapabilitiesofworkingwithenvironmentrelateddata,coveringdatamanagement,practices,andskillsinanalyzingandutilizingdata.
TheMetsämiestenSäätiöFoundation[grantnumber21VE049KE]and Kaute-säätiö[grantnumber20220113]aregratefullyacknowledged forfundingPäiviLuoma'sworkinthisresearch.
PäiviLuoma https://orcid.org/0000-0003-3250-3502
RomanaRauter https://orcid.org/0000-0001-5742-2886
Ackoff,R.(1989).Fromdatatowisdom. JournalofAppliedSystemsAnalysis, 16,3–9.
Bai,C.,Dallasega,P.,Orzes,G.,&Sarkis,J.(2020).Industry4.0technologiesassessment:Asustainabilityperspective. InternationalJournalof ProductionEconomics, 229,107776. https://doi.org/10.1016/j.ijpe.
2020.107776
Ballantyne,D.(2004).Pathwayslesstraveledtovaluecreation:Interaction,dialogueandknowledgegeneration. TheJournalofBusinessand
IndustrialMarketing, 19,97–98. https://doi.org/10.1108/ 08858620410523972
Bansal,P.,Smith,W.,&Vaara,E.(2018).Newwaysofseeingthrough qualitativeresearch.
Baumgartner,R.,&Rauter,R.(2017).Strategicperspectivesofcorporate sustainabilitymanagementtodevelopasustainableorganization. JournalofCleanerProduction, 140,81–92. https://doi.org/10.1016/j. jclepro.2016.04.146
Beltrami,M.,Orzes,G.,Sarkis,J.,&Sartor,M.(2021).Industry4.0andsustainability:Towardsconceptualizationandtheory. JournalofCleaner Production, 312,127733. https://doi.org/10.1016/j.jclepro.2021. 127733
Bernard,H.R.,Wutich,A.,&Ryan,G.W.(2017). Analyzingqualitativedata: Systematicapproaches.SAGEPublicationsInc.
Bohnsack,R.,Bidmon,C.,&Pinkse,J.(2022).Sustainabilityinthedigital age:Intendedandunintendedconsequencesofdigitaltechnologies forsustainabledevelopment. BusinessStrategyandtheEnvironment, 31,599–602. https://doi.org/10.1002/bse.2938
Busch,T.,Johnson,M.,&Pioch,T.(2022).Corporatecarbonperformance data:Quovadis? JournalofIndustrialEcology, 26,350–363. https:// doi.org/10.1111/jiec.13008
Cardinali,P.,&DeGiovanni,P.(2022).Responsibledigitalizationthrough digitaltechnologiesandgreenpractices. CorporateSocialResponsibility andEnvironmentalManagement, 29,984–995. https://doi.org/10. 1002/csr.2249
Chen,D.,Preston,D.,&Swink,M.(2015).Howtheuseofbigdataanalyticsaffectsvaluecreationinsupplychainmanagement. JournalofManagementInformationSystems, 32,4–39. https://doi.org/10.1080/ 07421222.2015.1138364
Chiarini,A.(2021).Industry4.0technologiesinthemanufacturingsector: Arewesuretheyareallrelevantforenvironmentalperformance? BusinessStrategyandtheEnvironment, 30,3194–3207. https://doi.org/10. 1002/bse.2797
ComasMartí,J.,&Seifert,R.(2013).Assessingthecomprehensivenessof supplychainenvironmentalstrategies. BusinessStrategyandtheEnvironment, 22,339–356. https://doi.org/10.1002/bse.1749
Contador,J.,Satyro,W.,Contador,J.,&Spinola,M.(2021).Taxonomyof organizationalalignment:Implicationsfordata-drivensustainableperformanceoffirmsandsupplychains. JournalofEnterpriseInformation Management, 34,343–364. https://doi.org/10.1108/JEIM-02-20200046
Davenport,T.,&Prusak,L.(1998). Workingknowledge:Howorganizations managewhattheyknow.HarvardBusinessSchool.
deSousa,L.,Jabbour,A.,Jabbour,C.,Foropon,C.,&Filho,M.G.(2018). Whentitansmeet – Canindustry4.0revolutionisethe environmentally-sustainablemanufacturingwave?Theroleofcritical successfactors. TechnologicalForecastingandSocialChange, 132,18–25. https://doi.org/10.1016/j.techfore.2018.01.017
deSousa,L.,Jabbour,A.,RojasLuiz,J.,RojasLuiz,O.,Jabbour,C., Ndubisi,N.,CaldeiradeOliveira,J.,&Junior,F.(2019).Circulareconomybusinessmodelsandoperationsmanagement. JournalofCleaner Production, 235,1525–1539. https://doi.org/10.1016/j.jclepro.2019. 06.349
DiMaria,E.,DeMarchi,V.,&Galeazzo,A.(2022).Industry4.0technologiesandcirculareconomy:Themediatingroleofsupplychainintegration. BusinessStrategyandtheEnvironment, 31,619–632. https://doi. org/10.1002/bse.2940
Dubey,R.,Gunasekaran,A.,Childe,S.,Papadopoulos,T.,&Helo,P.(2019). Supplierrelationshipmanagementforcirculareconomy:Influenceof externalpressuresandtopmanagementcommitment. Management Decision, 57,767–790. https://doi.org/10.1108/MD-04-2018-0396
EliasMota,B.,CerqueiradeSousaGouveiaCarvalho,A.,Azevedo RodriguesGomes,M.,&FerreiraDiasBarbosa-Povoa,A.(2020).Businessstrategyforsustainabledevelopment:Impactoflifecycleinventoryandlifecycleimpactassessmentstepsinsupplychaindesignand
planning. BusinessStrategyandtheEnvironment, 29,87–117. https:// doi.org/10.1002/bse.2352
Engert,S.,Rauter,R.,&Baumgartner,R.(2016).Exploringtheintegration ofcorporatesustainabilityintostrategicmanagement:Aliterature review. JournalofCleanerProduction, 112,2833–2850. https://doi. org/10.1016/j.jclepro.2015.08.031
EuropeanCommission.(2020).CommunicationfromtheCommission totheEuropeanParliament,theCouncil,theEuropeanEconomic andSocialCommitteeandtheCommitteeoftheRegions,Anew CircularEconomyActionPlan
ForacleanerandmorecompetitiveEurope.
EuropeanCommission.(2021).ProposalforaDirectiveoftheEuropean ParliamentandoftheCouncilamendingDirective2013/34/EU,Directive2004/109/EC,Directive2006/43/ECandRegulation(EU)No 537/2014,asregardscorporatesustainabilityreporting.
EuropeanCommission.(2022).ProposalforaDirectiveoftheEuropean ParliamentandoftheCouncilonCorporateSustainabilityDueDiligenceandAmendingDirective(EU)2019/1937.
EuropeanTissueSymposium.(n.d.).Factsandfiguresontissue[WWW Document].URL https://europeantissue.com/about-tissue/fact-andfigures/
Flint,D.,Woodruff,R.,&Gardial,S.(1997).Customervaluechangein industrialmarketingrelationships:Acallfornewstrategiesand research. IndustrialMarketingManagement, 26,163–175. https://doi. org/10.1016/S0019-8501(96)00112-5
Fontana,E.(2020).Managingdiversitythroughtransgenderinclusionin developingcountries:Acollaborativecorporatesocialresponsibility initiativefromBangladesh. CorporateSocialResponsibilityandEnvironmentalManagement, 27,2548–2562. https://doi.org/10.1002/csr.
1975
Fontana,E.,Atif,M.,&Gull,A.A.(2021).Corporatesocialresponsibility decisionsinapparelsupplychains:Theroleofnegativeemotionsin BangladeshandPakistan. CorporateSocialResponsibilityandEnvironmentalManagement, 28,1700–1714. https://doi.org/10.1002/csr.
2139
Gandolfo,A.,&Lupi,L.(2021).Circulareconomy,thetransitionofan incumbentfocalfirm:Howtosuccessfullyreconcileenvironmental andeconomicsustainability? BusinessStrategyandtheEnvironment, 30,3297–3308. https://doi.org/10.1002/bse.2803
Gebhardt,M.,Kopyto,M.,Birkel,H.,&Hartmann,E.(2021).Industry4.0 technologiesasenablersofcollaborationincircularsupplychains:A systematicliteraturereview. InternationalJournalofProduction Research, 60,6967–6995. https://doi.org/10.1080/00207543.2021.
1999521
George,G.,Merrill,R.,&Schillebeeckx,S.(2021).Digitalsustainabilityand entrepreneurship:Howdigitalinnovationsarehelpingtackleclimate changeandsustainabledevelopment. EntrepreneurshipTheoryand Practice, 45,999–1027. https://doi.org/10.1177/10422587198
99425
Ghosal,V.(2015).Businessstrategyandfirmreorganization:Roleof changingenvironmentalstandards,sustainablebusinessinitiativesand globalmarketconditions. BusinessStrategyandtheEnvironment, 24, 123
144. https://doi.org/10.1002/bse.1815
Gioia,D.,Corley,K.,&Hamilton,A.(2013).Seekingqualitativerigorin inductiveresearch. OrganizationalResearchMethods, 16,15–31. https://doi.org/10.1177/1094428112452151
Gold,S.,Seuring,S.,&Beske,P.(2010).Sustainablesupplychainmanagementandinter-organizationalresources:Aliteraturereview. Corporate SocialResponsibilityandEnvironmentalManagement, 17,230–245. https://doi.org/10.1002/csr.207
Graf,A.,&Maas,P.(2008).Customervaluefromacustomerperspective: Acomprehensivereview. JournalfürBetriebswirtschaft, 58,1–20. https://doi.org/10.1007/s11301-008-0032-8
Gray,D.(2018). Doingresearchinrealworld (Fourthed.).SagePublications.
Grönroos,C.(2008).Servicelogicrevisited:Whocreatesvalue?Andwho co-creates? EuropeanBusinessReview, 20,298–314. https://doi.org/ 10.1108/09555340810886585
Grönroos,C.,&Voima,P.(2013).Criticalservicelogic:Makingsenseof valuecreationandco-creation. JournaloftheAcademyofMarketing Science, 41,133–150. https://doi.org/10.1007/s11747-012-0308-3
Gupta,H.,Kumar,A.,&Wasan,P.(2021).Industry4.0,cleanerproduction andcirculareconomy:Anintegrativeframeworkforevaluatingethical andsustainablebusinessperformanceofmanufacturingorganizations. JournalofCleanerProduction, 295,126253. https://doi.org/10.1016/J. JCLEPRO.2021.126253
Hartmann,P.(2016).Capturingvaluefrombigdata – Ataxonomyofdatadrivenbusinessmodelsusedbystart-upfirms. InternationalJournalof Operations&ProductionManagement, 36,1382–1406. https://doi.org/ 10.1108/IJOPM-02-2014-0098
Helkkula,A.,Kelleher,C.,&Pihlström,M.(2012).Characterizingvalueas anexperience. JournalofServiceResearch, 15,59–75. https://doi.org/ 10.1177/1094670511426897
Herzig,C.,&Schaltegger,S.(2006).Corporatesustainabilityreporting:An overview.InS.Schaltegger,M.Bennett,&R.Burritt(Eds.), Sustainabilityaccountingandreporting (pp.301–324).Springer. https://doi.org/ 10.1007/978-1-4020-4974-3_13
Hur,W.-M.,Kim,Y.,&Park,K.(2013).Assessingtheeffectsofperceived valueandsatisfactiononcustomerloyalty:A “green” perspective. CorporateSocialResponsibilityandEnvironmentalManagement, 20,146–156. https://doi.org/10.1002/csr.1280
Karatas-Ozkan,M.,Özgören,Ç.,Yamak,S.,Ibrahim,S.,Tunalıoglu,M.N., Pinnington,A.,Nicolopoulou,K.,&Baruch,Y.(2022).Dualnatureof therelationshipbetweencorporatesocialresponsibilityandhuman resourcemanagement:Ablessingoracurse? CorporateSocialResponsibilityandEnvironmentalManagement, 29,1578–1594. https://doi. org/10.1002/csr.2305
Kerin,M.,&Pham,D.T.(2020).Smartremanufacturing:Areviewand researchframework. JournalofManufacturingTechnologyManagement, 31,1205–1235. https://doi.org/10.1108/JMTM-06-2019-0205
Khan,S.,Razzaq,A.,Yu,Z.,&Miller,S.(2021).Industry4.0andcircular economypractices:Anewerabusinessstrategiesforenvironmental sustainability. BusinessStrategyandtheEnvironment, 30,4001
4014. https://doi.org/10.1002/bse.2853
Langley,D.J.(2022).Digitalproduct-servicesystems:Theroleofdatain thetransitiontoservitizationbusinessmodels. Sustainability, 14,1303. https://doi.org/10.3390/su14031303
Lipiäinen,S.,Kuparinen,K.,Sermyagina,E.,&Vakkilainen,E.(2022).Pulp andpaperindustryinenergytransition:Towardsenergy-efficientand lowcarbonoperationinFinlandandSweden. SustainableProduction andConsumption, 29,421–431. https://doi.org/10.1016/j.spc.2021. 10.029
Liu,Q.,Trevisan,A.,Yang,M.,&Mascarenhas,J.(2022).Aframeworkof digitaltechnologiesforthecirculareconomy:Digitalfunctionsand mechanisms. BusinessStrategyandtheEnvironment, 31,2171–2192. https://doi.org/10.1002/BSE.3015
Luoma,P.,Toppinen,A.,&Penttinen,E.(2021).Theroleandvalueofdata inrealisingcircularbusinessmodels – Asystematicliteraturereview. JournalofBusinessModels, 9,44–71. https://doi.org/10.5278/jbm. v9i2.3448
Macdonald,E.,Kleinaltenkamp,M.,&Wilson,H.(2016).Howbusiness customersjudgesolutions:Solutionqualityandvalueinuse. Journalof Marketing, 80,96–120. https://doi.org/10.1509/jm.15.0109
Magnani,G.,&Gioia,D.(2023).UsingtheGioiamethodologyininternationalbusinessandentrepreneurshipresearch. InternationalBusiness Review, 32,102097. https://doi.org/10.1016/j.ibusrev.2022.102097
Mäkelä,M.(2017).Trendsinenvironmentalperformancereportinginthe Finnishforestindustry. JournalofCleanerProduction, 142,1333–1346. https://doi.org/10.1016/j.jclepro.2016.11.177
MetsäTissue.(n.d.).MetsäTissue's2030sustainabilityobjectives[WWW Document].URL https://www.metsagroup.com/metsatissue/sustainabil ity/metsatissues-2030-sustainability-objectives/ Meuer,J.,Koelbel,J.,&Hoffmann,V.(2020).Onthenatureofcorporate sustainability. OrganizationandEnvironment, 33,319–341. https://doi. org/10.1177/1086026619850180
Miller,H.(2013).Fromdtodecisions:Avaluechainforbigdata. ITProfessional, 15,57
59. https://doi.org/10.1109/MITP.2013.11 Mubushar,M.,Rasool,S.,Haider,M.I.,&Cerchione,R.(2021).Theimpact ofcorporatesocialresponsibilityactivitiesonstakeholders'valuecocreationbehaviour. CorporateSocialResponsibilityandEnvironmental Management, 28,1906
1920. https://doi.org/10.1002/csr.2168
Nascimento,D.L.M.,Alencastro,V.,Quelhas,O.L.G.,Caiado,R.G.G., Garza-Reyes,J.A.,Lona,L.R.,&Tortorella,G.(2019).Exploringindustry4.0technologiestoenablecirculareconomypracticesina manufacturingcontext:Abusinessmodelproposal. Journalof ManufacturingTechnologyManagement, 30,607–627. https://doi.org/ 10.1108/JMTM-03-2018-0071
Niehoff,S.(2022).Aligningdigitalisationandsustainabledevelopment? Evidencefromtheanalysisofworldviewsinsustainabilityreports. BusinessStrategyandtheEnvironment, 31,2546–2567. https://doi. org/10.1002/bse.3043
O'Rourke,D.,&Lollo,N.(2021).Incentivizingenvironmentalimprovementsinsupplychainsthroughdata-drivengovernance. California ManagementReview, 64,47
66. https://doi.org/10.1177/ 00081256211049827
Pinheiro,M.,Jugend,D.,deSousa,L.,Jabbour,A.,Jabbour,C.,&Latan,H. (2022).Circulareconomy-basednewproductsandcompanyperformance:Theroleofstakeholdersandindustry4.0technologies. BusinessStrategyandtheEnvironment, 31,483–499. https://doi.org/10. 1002/bse.2905
Porter,M.(1996). Whatisstrategy? (pp.61–78).HarvardBusinessReview. Ranängen,H.,&Zobel,T.(2014).Revisitingthe “how” ofcorporatesocial responsibilityinextractiveindustriesandforestry. JournalofCleanerProduction, 84,299–312. https://doi.org/10.1016/j.jclepro.2014.02.020
Ranta,V.,Aarikka-Stenroos,L.,&Väisänen,J.M.(2021).Digitaltechnologiescatalyzingbusinessmodelinnovationforcirculareconomy Multiplecasestudy. Resources,ConservationandRecycling, 164,paper 105155. https://doi.org/10.1016/j.resconrec.2020.105155
Rantala,T.,Ukko,J.,Saunila,M.,Puolakoski,H.,&Rantanen,H.(2019). Creatingsustainablecustomervaluethroughdigitality. WorldJournal ofEntrepreneurship,ManagementandSustainableDevelopment, 15, 325–340. https://doi.org/10.1108/WJEMSD-08-2018-0077
Ren,S.,Zhang,Y.,Liu,Y.,Sakao,T.,Huisingh,D.,&Almeida,C.(2019).A comprehensivereviewofbigdataanalyticsthroughoutproductlifecycletosupportsustainablesmartmanufacturing:Aframework,challengesandfutureresearchdirections.
JournalofCleanerProduction, 210,1343–1365. https://doi.org/10.1016/J.JCLEPRO.2018.11.025
Rintamäki,T.,&Saarijärvi,H.(2021).Anintegrativeframeworkformanagingcustomervaluepropositions.
JournalofBusinessResearch, 134, 754
764. https://doi.org/10.1016/j.jbusres.2021.05.030
Rowley,J.(2007).Thewisdomhierarchy:RepresentationsoftheDIKW hierarchy.
JournalofInformationScience, 33,163–180. https://doi.org/ 10.1177/0165551506070706
Rusch,M.,Schöggl,J.,&Baumgartner,R.(2022).Applicationofdigital technologiesforsustainableproductmanagementinacirculareconomy:Areview. BusinessStrategyandtheEnvironment, 32,1159–1174. https://doi.org/10.1002/bse.3099
Sarkis,J.,Kouhizadeh,M.,&Zhu,Q.(2021).Digitalizationandthegreening ofsupplychains. IndustrialManagement&DataSystems, 121,65–85. https://doi.org/10.1108/IMDS-08-2020-0450
ScienceBasedTargetsInitiative.(n.d.).Howitworks[WWWDocument]. URL https://sciencebasedtargets.org/how-it-works
Sodhi,M.,&Tang,C.(2019).Researchopportunitiesinsupplychaintransparency. ProductionandOperationsManagement, 28,2946–2959. https://doi.org/10.1111/POMS.13115
Song,M.,Fisher,R.,Wang,J.,&Lian-Biao,C.(2018).Environmentalperformanceevaluationwithbigdata:Theoriesandmethod. Annalsof OperationsResearch, 270,459–472. https://doi.org/10.1007/s10479016-2158-8
Stewart,R.,Fantke,P.,Bjørn,A.,Owsianiak,M.,Molin,C.,Hauschild,M.,& Laurent,A.(2018).Lifecycleassessmentincorporatesustainability reporting:Global,regional,sectoral,andcompany-leveltrends. BusinessStrategyandtheEnvironment, 27,1751–1764. https://doi.org/10. 1002/bse.2241
Toppinen,A.,Pätäri,S.,Tuppura,A.,&Jantunen,A.(2017).TheEuropean pulpandpaperindustryintransitiontoabio-economy:ADelphistudy. Futures, 88,1–14. https://doi.org/10.1016/j.futures.2017.02.002
Tseng,M.,Tan,R.,Chiu,A.,Chien,C.,&Kuo,T.(2018).Circulareconomy meetsindustry4.0:Canbigdatadriveindustrialsymbiosis? Resources, ConservationandRecycling, 131,146–147. https://doi.org/10.1016/j. resconrec.2017.12.028
Tuppura,A.,Toppinen,A.,&Puumalainen,K.(2016).Forestcertification andISO14001:Currentstateandmotivationinforestcompanies. BusinessStrategyandtheEnvironment, 25,355–368. https://doi.org/ 10.1002/bse.1878
Tzokas,N.,&Saren,M.(1999).Valuetransformationinrelationshipmarketing. AustralasianMarketingJournal, 7,52–62. https://doi.org/10. 1016/s1441-3582(99)70202-8
Vidal,N.,Bull,G.,&Kozak,R.(2010).Diffusionofcorporateresponsibilitypracticestocompanies:Theexperienceoftheforestsector. JournalofBusiness Ethics, 94,553–567. https://doi.org/10.1007/s10551-009-0281-z
Voss,C.,Tsikriktsis,N.,&Frohlich,M.(2002).Caseresearchinoperations management. InternationalJournalofOperations&ProductionManagement, 22,195–219. https://doi.org/10.1108/01443570210414329
Woodruff,R.(1997).Customervalue:Thenextsourceforcompetitive advantage. JournaloftheAcademyofMarketingScience, 25,139–153. https://doi.org/10.1007/BF02894350
Howtocitethisarticle: Luoma,P.,Rauter,R.,Penttinen,E.,& Toppinen,A.(2023).Thevalueofdataforenvironmental sustainabilityasperceivedbythecustomersofatissue-paper supplier. CorporateSocialResponsibilityandEnvironmental Management,1
14. https://doi.org/10.1002/csr.2541
Volume 9, Number 2, 2023
To reach the goals of long-term energy and climate policy, the contribution of the industrial sector is important. Upgrading low temperature industrial waste heat using electric high-temperature heat pumps (HTHPs) can improve the overall energy-efficiency and mitigate CO2 emissions by replacing fossil fuels. The pulp and paper and the food and beverage industries use significant quantities of heat up to 200°C and therefore have a high potential for the application of HTHPs. In order to assess the role of HTHPs, a technoeconomic bottom-up cost optimization model is developed building on the Swiss TIMES Energy system Model (STEM). We present an advanced modeling framework including energy and material flows, with a high temporal resolution and a segregation of the temperature level of the process heat. The results show that HTHPs are cost-effective up to a temperature of 150°C. Switzerland has the economic potential to deploy of about 100 MWth in the pulp and paper industry and 900 MWth in the food and beverage industry by 2050. Incentivizing the exploitation of this significant potential will require very high CO2 prices of several hundred €/tCO2 or additional policies to overcome investment barriers by supporting investment and flexible system-serving operation of heat pumps.
Contact information:
1. Energy Economics Group, Laboratory for Energy System Analysis, Paul Scherrer Institute, Switzerland
2. Energy and Environment Division, Paul Scherrer Institute, Switzerland
3. Laboratory for Physical Chemistry, Department of Chemistry and Applied Biosciences, ETH, Zurich, Switzerland
4. Laboratory for Energy Systems Analysis, Paul Scherrer Institute, Switzerland
5. Chair of Energy Systems Analysis, Department of Mechanical and Process Engineering, ETH, Zurich, Switzerland
Energy Policy 173 (2023) 113383. https://doi.org/10.1016/j.enpol.2022.113383
Creative Commons Attribution 4.0 International License
The Paper Industry Technical Association (PITA) is an independent organisation which operates for the general benefit of its members – both individual and corporate – dedicated to promoting and improving the technical and scientific knowledge of those working in the UK pulp and paper industry. Formed in 1960, it serves the Industry, both manufacturers and suppliers, by providing a forum for members to meet and network; it organises visits, conferences and training seminars that cover all aspects of papermak ing science. It also publishes the prestigious journal Paper Technology International® and the PITA Annual Review , both sent free to members, and a range of other technical publications which include conference proceedings and the acclaimed Essential Guide to Aqueous Coating.
journal homepage: www.elsevier.com/locate/enpol


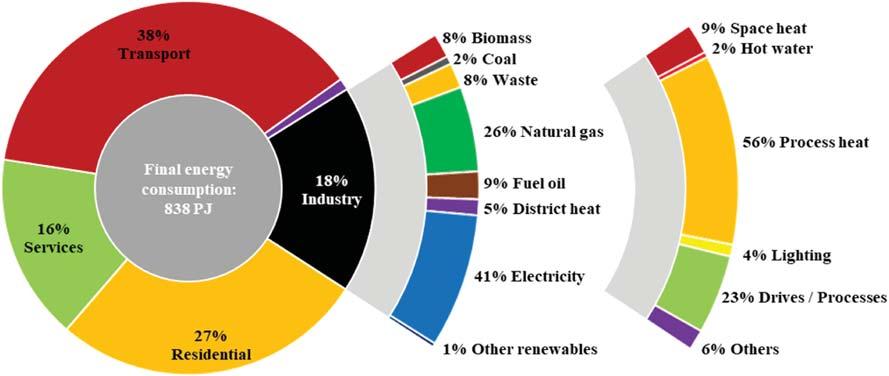
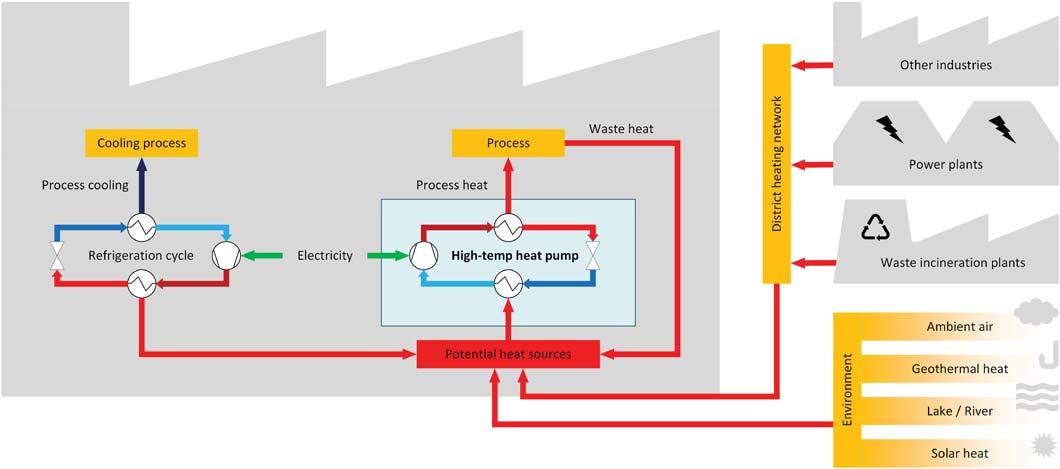
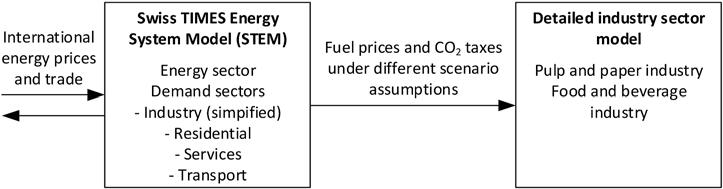
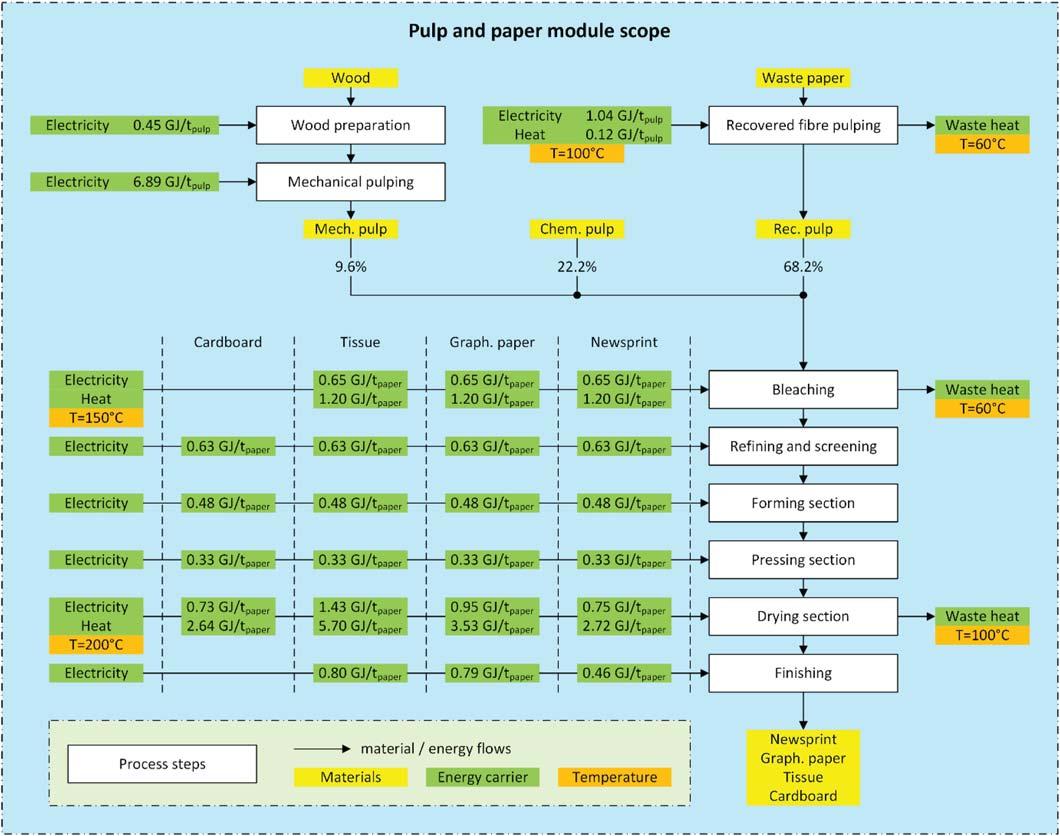
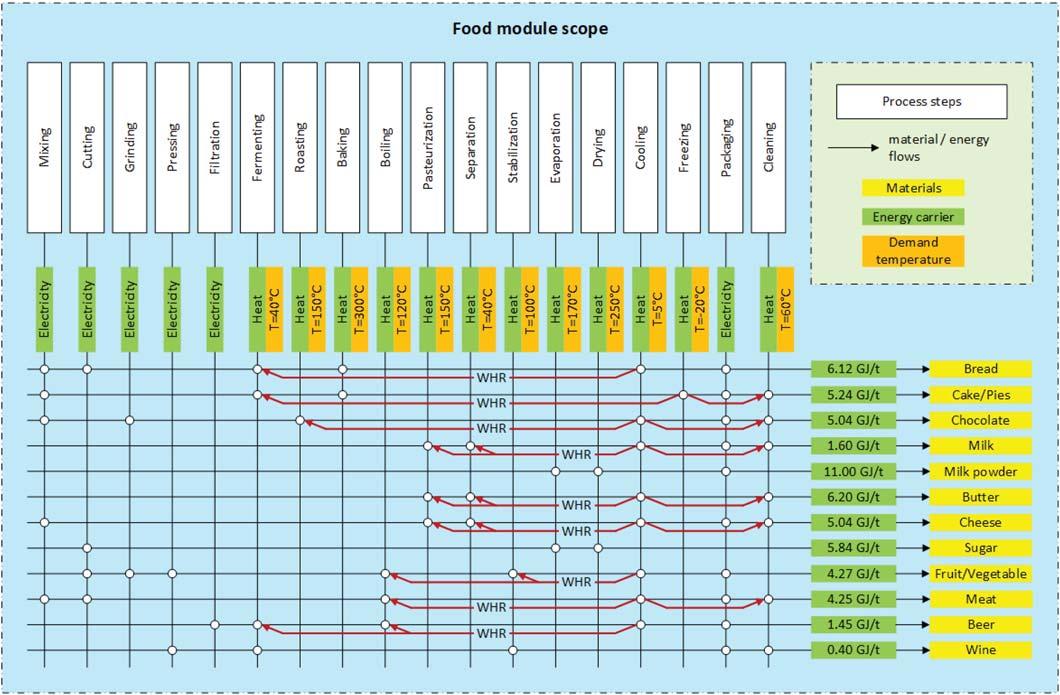
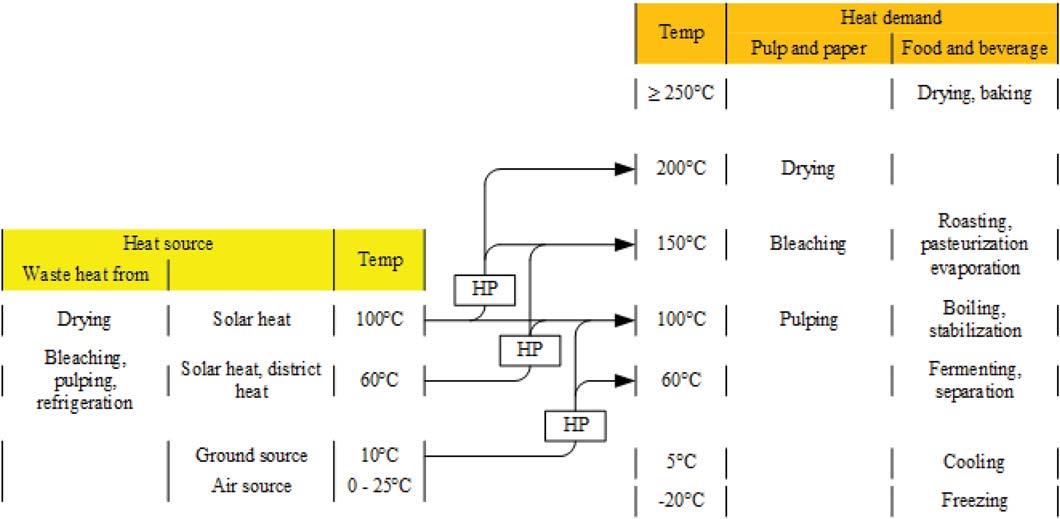
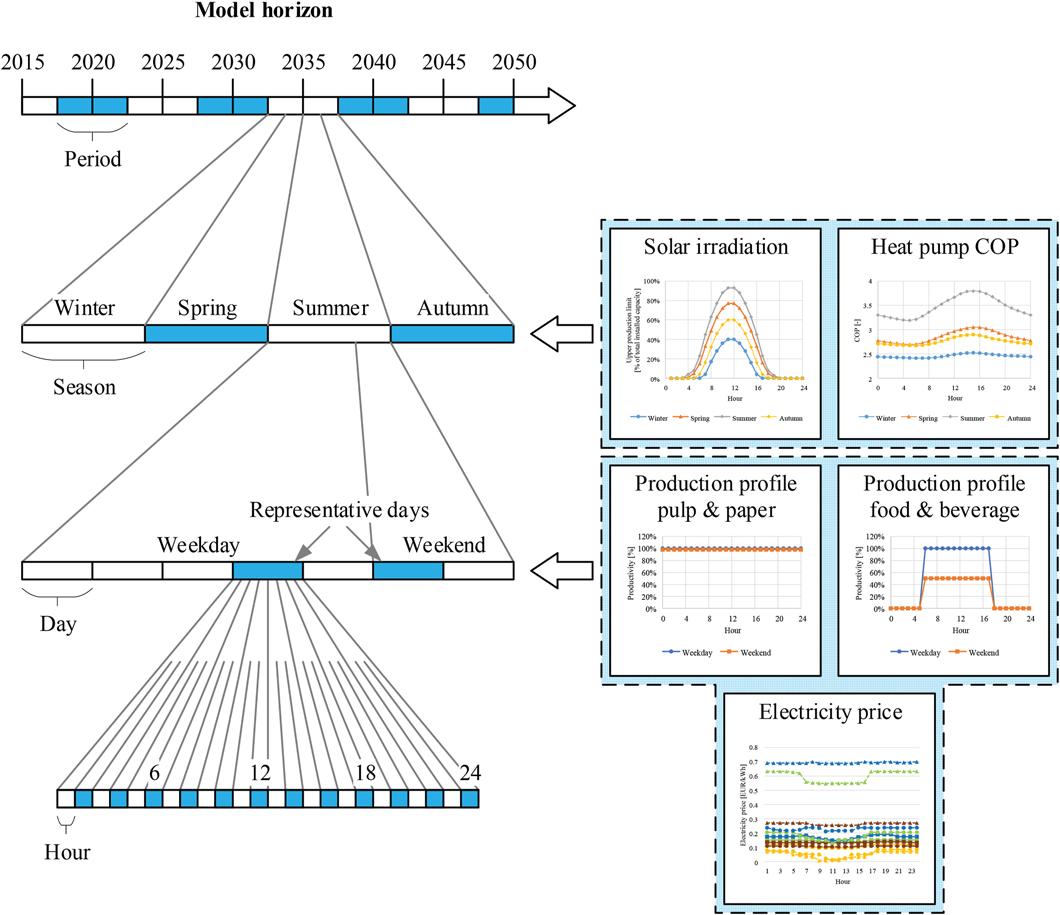
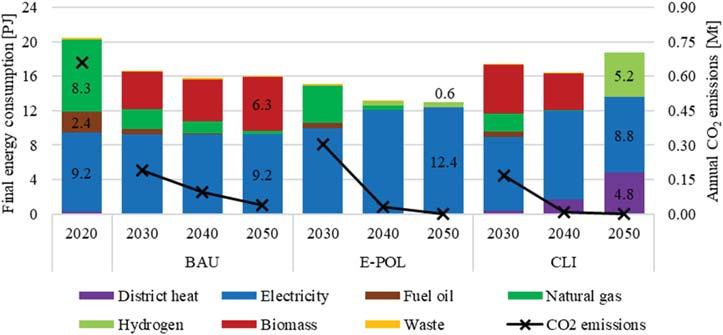
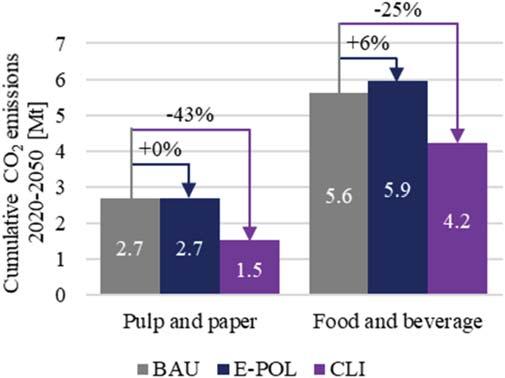
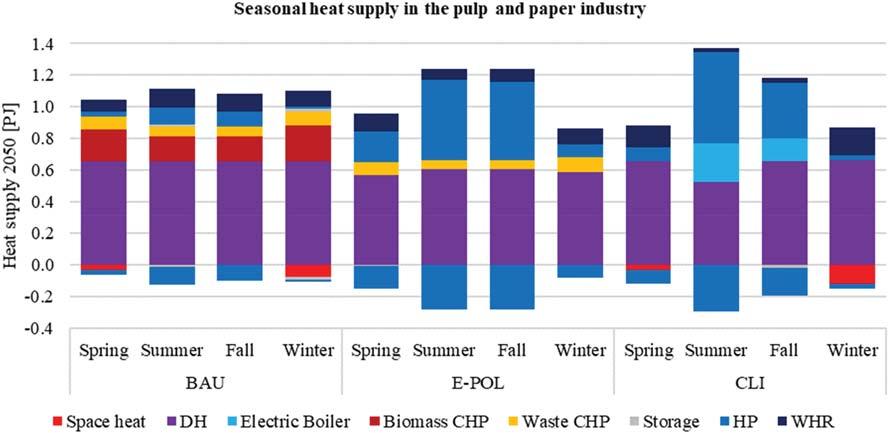
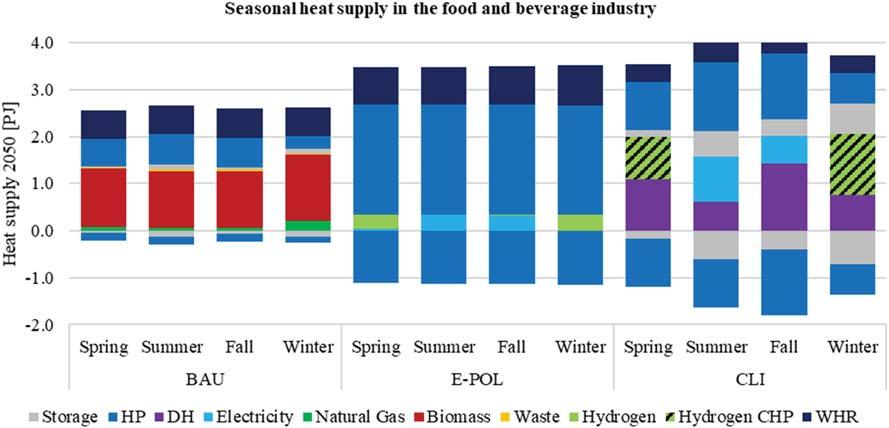
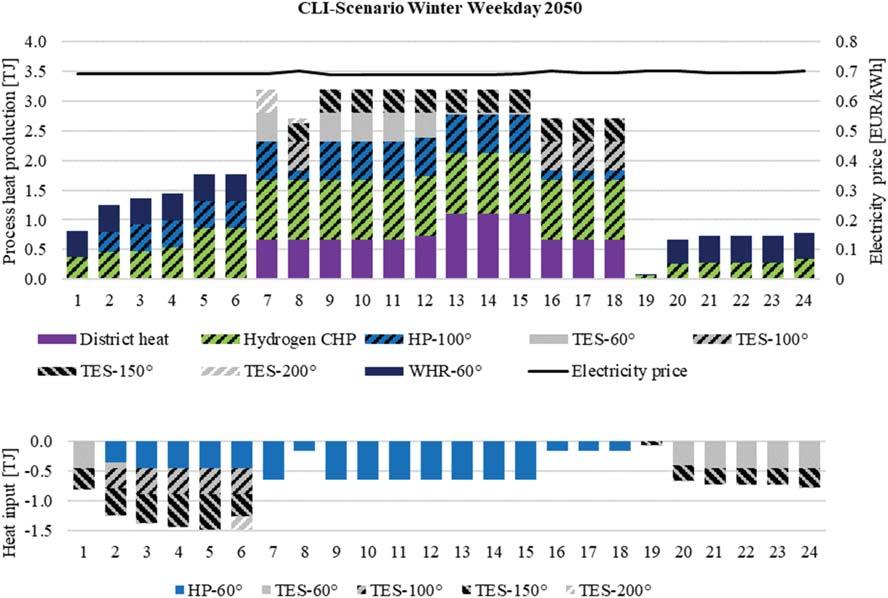
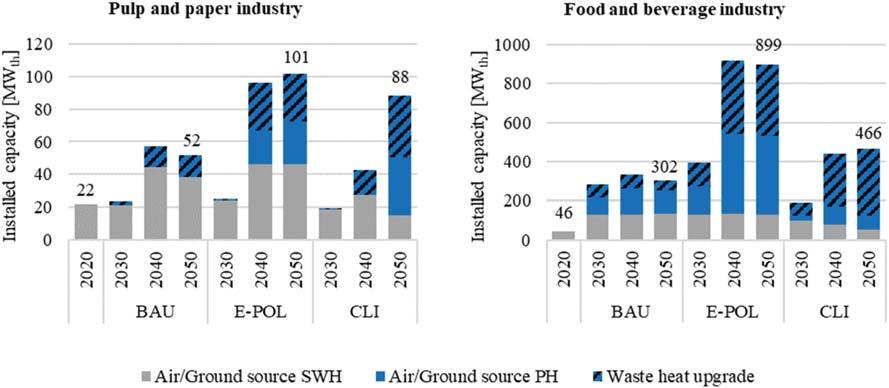
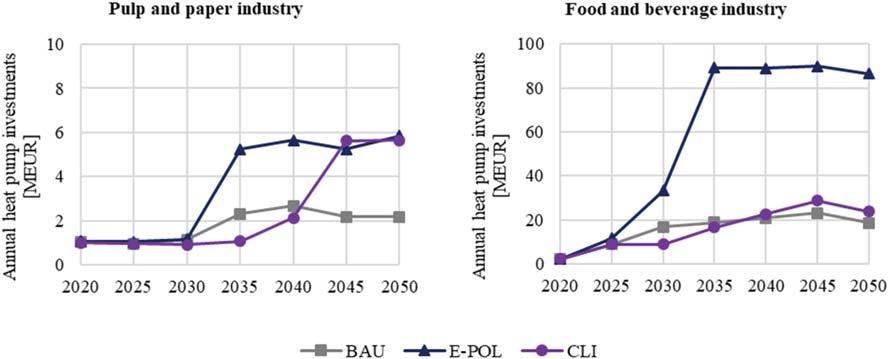
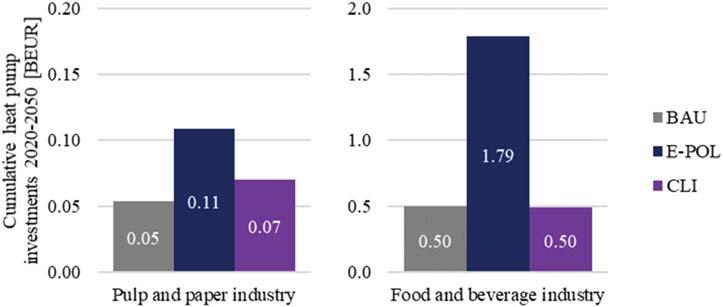
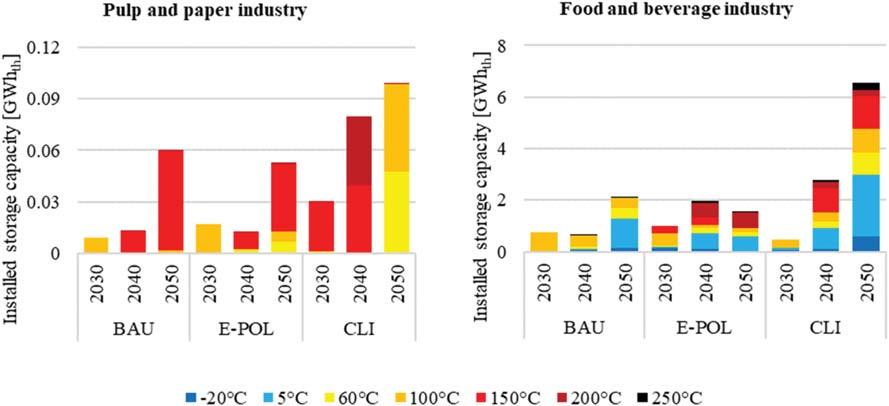
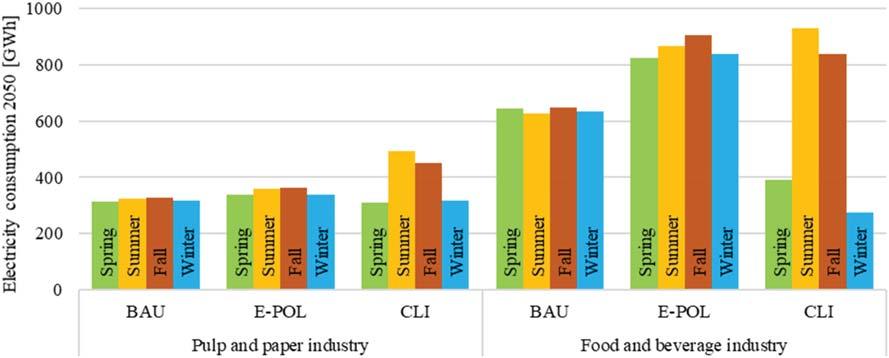

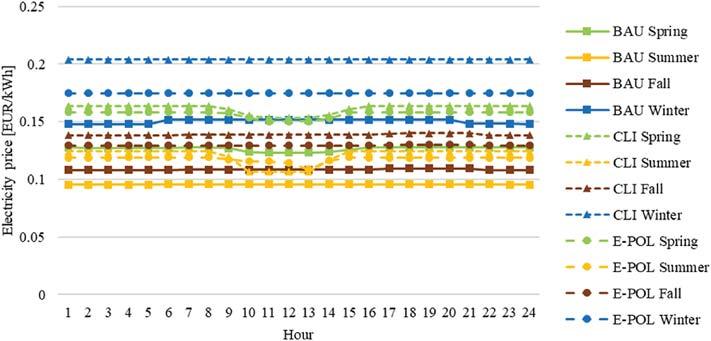
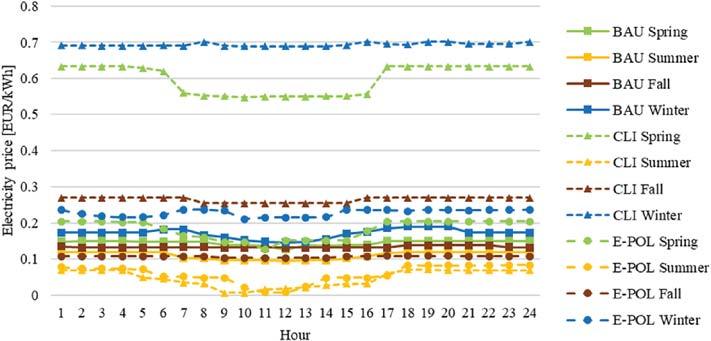
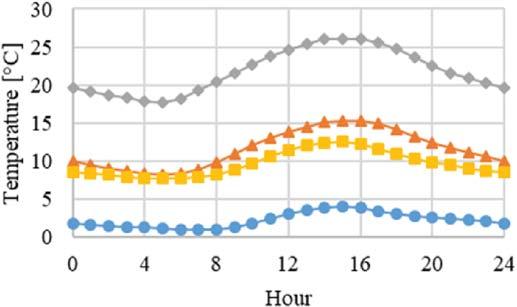
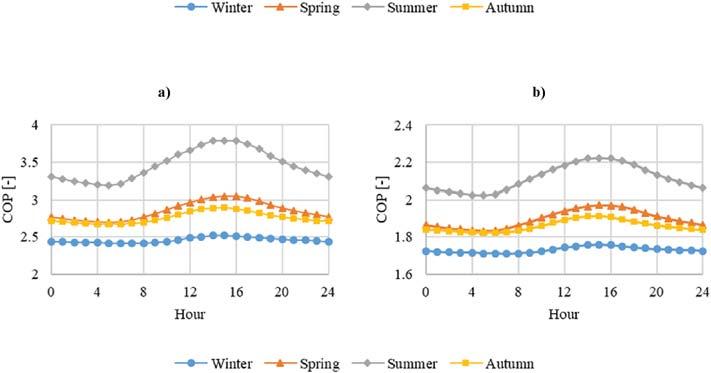
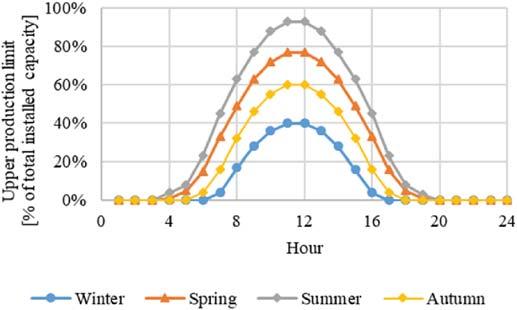
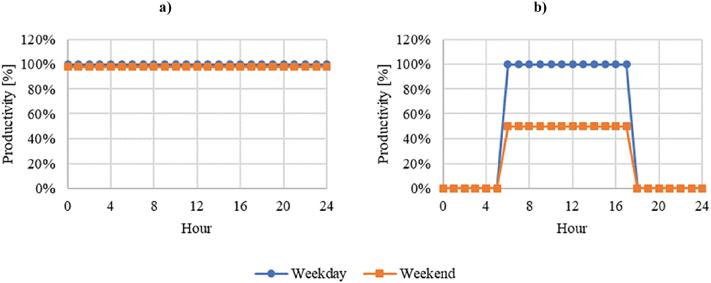
Volume 9, Number 2, 2023
The pulp and paper industry (PPI) is a major contributor to the global economy, but it also poses a challenge for waste disposal, as it generates large amounts of several waste streams. Among these, paper rejects are generated during the papermaking process and could account for up to 25% of the produced paper. Moreover, hundreds of millions of tons of paper are produced annually that end up in landfills if not burnt or recycled. Furthermore, the PPI significantly contributes to climate change and global warming in the form of deforestation and water and air pollution. Therefore, the impact of this industry on the sustainability of natural resources and its adverse environmental health effects requires special attention. This review focuses on discussing the sustainable routes to utilize paper waste and rejects from the PPI towards a circular economy. At first, it discusses the industry itself and its environmental impact, followed by the possible sustainable approaches that can be implemented to improve papermaking processes as well as waste management systems, including paper recycling. The literature indicates that paper recycling is crucial because, if appropriately designed, it significantly lowers greenhouse gas emissions, water and resources consumption, and manufacturing costs. However, several concerns have surfaced about the different chemicals that are used to improve recycling efficiency and recycled paper quality. Furthermore, paper recycling is limited to up to seven times. This review, therefore, goes on to highlight several sustainable waste management routes for paper waste utilization other than recycling by emphasizing the concept of converting paper waste and rejects into energy and high-value materials, including biofuels, biohydrogen, biomethane, heat, nanocellulose, hydrochar, construction materials, and soil amendments. Both the benefits and shortcomings of these waste management routes and their applications are discussed. It becomes clear from this review that sustainable management solutions for paper waste and rejects are implementable, but further research and development are still needed.
Contact information:
1. Environmental Health and Safety Program, College of Health Sciences, Abu Dhabi University, Abu Dhabi 59911, United Arab Emirates
2. Department of Mechanical Engineering, Al Ghurair University, International Academic City, Dubai 37374, United Arab Emirates
Sustainability 2023, 15, 6915.
https://doi.org/10.3390/su15086915
Creative Commons Attribution 4.0 International License


The Paper Industry Technical Association (PITA) is an independent organisation which operates for the general benefit of its members – both individual and corporate – dedicated to promoting and improving the technical and scientific knowledge of those working in the UK pulp and paper industry. Formed in 1960, it serves the Industry, both manufacturers and suppliers, by providing a forum for members to meet and network; it organises visits, conferences and training seminars that cover all aspects of papermaking science. It also publishes the prestigious journal Paper Technology International® and the PITA Annual Review, both sent free to members, and a range of other technical publications which include conference proceedings and the acclaimed Essential Guide to Aqueous Coating.
Review
HatemAbushammala 1, * ,MuhammadAdilMasood 1 ,SalmaTaqiGhulam 1
1 EnvironmentalHealthandSafetyProgram,CollegeofHealthSciences, AbuDhabiUniversity,AbuDhabi59911,UnitedArabEmirates
2 DepartmentofMechanicalEngineering,AlGhurairUniversity,InternationalAcademicCity, Dubai37374,UnitedArabEmirates
* Correspondence:hatem.abushammala@adu.ac.ae;Tel.:+971-0-25015290
Citation: Abushammala,H.; Masood,M.A.;Ghulam,S.T.;Mao,J. OntheConversionofPaperWaste andRejectsintoHigh-Value MaterialsandEnergy. Sustainability 2023, 15,6915.https://doi.org/ 10.3390/su15086915
Received:18January2023
Revised:3April2023
Accepted:17April2023
Published:20April2023
Abstract: Thepulpandpaperindustry(PPI)isamajorcontributortotheglobaleconomy,butitalso posesachallengeforwastedisposal,asitgenerateslargeamountsofseveralwastestreams.Among these,paperrejectsaregeneratedduringthepapermakingprocessandcouldaccountforupto25% oftheproducedpaper.Moreover,hundredsofmillionsoftonsofpaperareproducedannuallythat endupinlandfillsifnotburntorrecycled.Furthermore,thePPIsignificantlycontributestoclimate changeandglobalwarmingintheformofdeforestationandwaterandairpollution.Therefore,the impactofthisindustryonthesustainabilityofnaturalresourcesanditsadverseenvironmentalhealth effectsrequiresspecialattention.Thisreviewfocusesondiscussingthesustainableroutestoutilize paperwasteandrejectsfromthePPItowardsacirculareconomy.Atfirst,itdiscussestheindustry itselfanditsenvironmentalimpact,followedbythepossiblesustainableapproachesthatcanbe implementedtoimprovepapermakingprocessesaswellaswastemanagementsystems,including paperrecycling.Theliteratureindicatesthatpaperrecyclingiscrucialbecause,ifappropriately designed,itsignificantlylowersgreenhousegasemissions,waterandresourcesconsumption,and manufacturingcosts.However,severalconcernshavesurfacedaboutthedifferentchemicalsthat areusedtoimproverecyclingefficiencyandrecycledpaperquality.Furthermore,paperrecycling islimitedtouptoseventimes.Thisreview,therefore,goesontohighlightseveralsustainable wastemanagementroutesforpaperwasteutilizationotherthanrecyclingbyemphasizingthe conceptofconvertingpaperwasteandrejectsintoenergyandhigh-valuematerials,including biofuels,biohydrogen,biomethane,heat,nanocellulose,hydrochar,constructionmaterials,andsoil amendments.Boththebenefitsandshortcomingsofthesewastemanagementroutesandtheir applicationsarediscussed.Itbecomesclearfromthisreviewthatsustainablemanagementsolutions forpaperwasteandrejectsareimplementable,butfurtherresearchanddevelopmentarestillneeded.
Keywords: paperwaste;paperreject;pulp;wastemanagement;recycling;circulareconomy
Copyright: ©2023bytheauthors. LicenseeMDPI,Basel,Switzerland. Thisarticleisanopenaccessarticle distributedunderthetermsand conditionsoftheCreativeCommons Attribution(CCBY)license(https:// creativecommons.org/licenses/by/ 4.0/).
Paperisproducedfromthecellulosepulpfibersobtainedfromwoodpulping.Itwas firstproducedinChina,spreadtoEurope,andhassincebeenmanufacturedalloverthe world[1].Overtheyears,papermanufacturingprocesseshavechangedintermsofthe techniquesandchemicalsused,butwoodremainsthemostwidelyusedsourceoffibersin theindustry[2].Despitedigitization,paperisstillconsumedinoffices,magazines,and newspapers.Italsocontributesto31%ofthepackagingmarketglobally[3].Thepulpand paperindustry(PPI)isamajorcontributortotheglobaleconomydespitethelow-profit marginsduetowell-knownchallengesinpricingandfulfillingconsumerrequirements. Thisindustryalsofacesconstantpressuretoreduceemissionsthatcausewaterandair pollution[4].DeforestationisalsoachallengeforthePPI,asroughly4billiontreesare cutdowneveryyeartoserveastherawmaterialforpapermaking[5].Mostoftherecent
strategiesforreducingthiseffectaimtoincreasetheefficiencyofprintingtechniquesand theutilizationofrecycledpaper[6].ThePPIisconsideredamajorwaterpolluterbecause itreleasesmassiveamountsoftoxicsubstancesintowaterbodies.Thewastewaterfrom thePPIcontainsmorethan250toxicchemicalsresultingfromvariousprocessesinwood pulpingandpapermaking,includingorganic,sulfur,andchlorinatedcompoundsand heavymetals,suchaschlorophenols,sulfides,iron,zinc,andmanganese[7,8].ThePPI alsogeneratesvarioustypesofwaste,suchaswoodrejects,blackliquor,paperrejects, andsludge[9].Thelargeamountsofwastepresentachallengeforwastedisposaland canresultinsignificantdamagetowater,air,andsoil.Furthermore,theorganicmatterin wastewatersludge,ifdischargedintowaterbodies,increasesbiochemicaloxygendemand (BOD),causingeutrophication[10].Wastecombustioncanalsocausehealthproblemsin nearbycommunities.Recently,advancedincinerationtechnologieshavebeendeveloped andused,whichemitlessharmfulgases,butthehealtheffectsofincineratorscanstill bedifficulttoevaluatebecauseofthesimultaneouspollutionfrommanyothersources, suchasautomobilesandindustries[11].ThePPIisalsoenergyintensive,whichcanbe improvedbyimplementingenergyconservationtechnologies,usingrenewableenergy,and utilizingthebiomassrejectsoftheindustryasbioenergy[9].
Theincreasedawarenessofenvironmentalissuesandtherapiddepletionofnatural resourceshaspromotedtheinterestofindustriestoreusethewastegeneratedintheir manufacturingprocesses[12–16].Inaddition,strictgovernmentalregulationshavebeen enactedtofacilitatetheutilizationofwastes(reuse,recycling,orconversion),whichwere formerlyburntordisposedofinlandfills,toreducetheirenvironmentalimpactonair,soil, andwaterresources[17].Sustainablewastemanagementisabasicpartofsustainabledevelopment,asmultiplebenefitsinthepublichealth,safety,andenvironmentalsectorscan begained.Sustainablewastemanagementreducesgreenhousegasemissions,improvesthe qualityoflife,preservesnaturalresources,andreducessoilandwatercontamination[18]. Moreover,modernwastemanagementhasamajorgoalofeffectivelyrecoveringenergy fromwastebeforesafelydisposingofit.Forexample,organicwastehasahighenergyrecoverypotential[19],andmunicipalsolidwasteislistedasarenewableenergyresourceby theUnitedStatesEnvironmentalProtectionAgency[20].Therecoveryaspectofsustainable wastemanagementisbasedonahierarchyofwasteprevention,reuse,recycling,recovery, anddisposal.Itisthereforeimportanttomentionthat,beforeincinerationanddisposal,no effortsshouldbesparedtoconvertpaperwasteandrejectsintomaterialsthatcanfunction asstartingmaterialsorfinishedproductsforallpossiblekindsofapplications[21].
Severalreviewsareavailableintheliteratureaboutpaperwaste.Somediscussed specificpaperwastemanagementtechniques,includingsortingandrecycling[22,23], whileothersfocusedontheconversionofpaperwasteintoaspecificproduct,including constructionmaterialsandnanocellulose[24,25].Ourreviewcomprehensivelydiscusses thepossibleroutesfortheefficientconversionofpaperwasteandrejectsintobothhighvaluematerialsandenergy.Firstofall,thereviewstartsbyexplainingpaperproduction fromwood,includingwoodpulpingandpapermaking,anditsimpactontheenvironment whiledescribingpossibleemissions,effluents,andwastes.Itthencontinuestodescribe theprocessofrecyclingpaperwasteandrejectsandtheenvironmentalandeconomic advantages.Itthendiscussesthepossibleroutestoconvertpaperwasteintoenergyand high-valuematerialswhenitisnotpossibletofurtherrecyclepaperintohigh-qualitypaper products.Finally,iteconomicallyandenvironmentallycomparestheserouteswithafocus oncomposting,anaerobicdigestion,andincineration.Overall,thisreviewprovidesa comprehensiveoverviewofpaper’slifecycle—fromwoodtopapertoenergyandother usefulproducts—towardsacirculareconomy.
ThePPIrequiresfourmaininputsforpapermaking:cellulosefibers,chemicals,energy, andwater.Inthepast,theindustryutilizedcottonandlinenragsascellulosesourcesbut latershiftedtowoodforincreasedpaperproductionandquality[26].Celluloseisthemost
abundantbiopolymer,anditisusedforpaper,cardboard,andtextilemanufacturing[27]. Itisalinearhomopolymerofglucoseandrepresentsaround40–60%ofwoodmass.The secondmostabundantbiopolymersonEarthaftercelluloseareligninandhemicellulose, eachrepresentingaround20–30%ofwoodmass[28].Ligninisanetworkedpolymerof phenylpropaneunits,anditisresponsiblefortheresistanceandstiffnessofwoodinliving trees[29].Italsogiveswooditsyellowishtobrownishcolorbecauseitisbrownincolor whenextractedaspowder,whilecelluloseandhemicellulosearewhitetooff-white[28]. Hemicelluloseisabranchedheteropolymerofsevensimplesugars:glucose,galactose, mannose,xylose,arabinose,glucuronicacid,andgalacturonicacid[30].Itactsastheglue betweencelluloseandlignininthestructureofwoodattheanatomiclevel[31].
Theproductionofpaperfromwoodinvolvesseveralsteps:woodpulping,pulp bleaching,purification,beatingandrefining,papermaking,andfinaltreatments[3].Being thefirststepinpapermaking,themaingoalofthepulpingprocessistoremoveligninand hemicellulosewhilekeepingthestructureofthecellulosefibersintacttoformpulp[32].The efficiencyofpulpproductionisdependentonthechemicalcompositionofthewoodand themanufacturingprocessesusedforpulping.Thevariationinthelignincontentofwood significantlyaffectspulpingbecauseligninisthemostrecalcitrantwoodcomponentto remove[33].Woodpulpingmethodscanbechemical,mechanical,orsemi-mechanical[34]. Asthenamesindicate,chemicalpulpinguseschemicalstodissolveligninandhemicellulose toproducethepulpfibers;mechanicalpulpingusesmechanicalprocessessuchasgrinding andrefiningforthatpurpose[35].Thepulpproducedbychemicalmethodsisofahigher qualityandcontainsahigheramountofcellulosefiberscomparedtothemechanically producedpulp.Inotherwords,chemicalpulpingismoreefficientinremovinglignin andhemicellulose,leadingtoapulpwithhighercellulosecontent[36].Chemicaland mechanicalpulpsareadvantageousfordifferentapplications.Forexample,mechanical pulphasexcellentprintingproperties[37].Alongwithpapermaking,chemicalpulpis usedinotherapplications,suchasthetextileindustry,pharmaceuticalindustry,and fuelproduction[38].Kraftpulpingandsulfitepulpingarethemostcommonchemical pulpingmethods,withKraftpulpingbeingthemostcommonlyused[39].In2016,95% ofthepapermillsinNorthAmericausedKraftpulping[40].Environmentallyspeaking, numerouswasteproducts,suchasligninandeffluentsludge,aregeneratedduringKraft pulping[41].Afterwoodpulping,bleachingtakesplacetofurthereliminatetheremaining lignin[40].Itimprovesthewhitenessofmechanicalorchemicalpulpsbyremovingthe chromophoricligningroupsusingchlorineorchlorinedioxide[42].Thebleachedpulp isthenpurifiedbyremovinganyrejectedcellulosefibersviafiltration.Rejectedfibers exhibitsimilarpropertiestobleachedpulpbutdonotholdastrongplaceintheglobal marketduetothepresenceofimpurities.Still,theyaresometimesusedasrawmaterials forcardboardmanufacturing[41].Thepurifiedbleachedpulpthengoesthroughabeating andrefiningprocesstoincreasethesurfaceareaofitsfibers,whichinturnincreasestheir abilitytoholdwaterandformbetterbondsbeforethepapermakingprocess[35].The papermakingprocessismostlyapulpdewateringprocess,inwhichthepulpispassed throughrollersorwiremeshes,whichassistintheremovalofwaterandtheformationof paper.Finally,thenewlyformedpaperispost-treatedbycalendaring,supercalendering, sizing,laminating,impregnating,orsaturatingtosmoothenthesurfaceofthepaperand increaseitsquality[3,43].
ThePPIhasasignificantimpactontheenvironmentasthemainpulpfibersrequired forpapercomefromtrees.Millionsoftreesarecutdownannuallytosufficethematerial uptakeoftheindustry[44],anditisknownthatdeforestationleadstoanincreasein temperaturesglobally,ariseinsealevel,andalossofbiodiversity[6].Moreover,pulping andpapermakingrequiremassiveamountsofwater,andthedischargedwastewater containshighlevelsoftoxicchemicalsthatharmtheenvironment[45].Forinstance, bleachingrequirestheuseofdifferentoxidizingagents,suchaschlorinedioxideandozone, whichareconsideredharmfultotheenvironment.Inordertomitigatetheirenvironmental harm,thepulpissometimesbleachedusingothergreenagentssuchashydrogenperoxide;
theresultingpulpisthenachlorine-freepulp[40,46].Greensolventssuchasionicliquids havealsobeenexploredintheliteratureaspulpingagentstoreplacetheharshchemicals usedinwoodpulping[47–51].WastewaterfromthePPIistreatedeitherbyaerobicor anaerobicbiologicaltreatment,withaerobicbeingthemostcommonlyusedtoreduceits BOD[52].Aerobictreatmentrequiresoxygen,whichissuppliedbyaerationequipment. Anaerobictreatmentiscarriedoutintheabsenceofoxygenandhasseveraladvantages overaerobictreatment,includinglowersludgeproduction,butitisnotcommonlyused inthePPIduetotheformationofhydrogensulfide[53].Themostcommonmethods ofdisposalofthefinalpapersludgearelandfillingandincineration[54].Whenpaper sludgeisincineratedforenergyrecovery,anotherwastestreamofthePPI,knownaspaper sludgeash,isproduced.Whilepapersludgeremainsthemainwastestreamofthepaper industry,papersludgeashisalsoproducedinlargeamounts[54].Papermillsludgesarea mixtureofseveralsubstances,includinginorganicsolids,chemicaladditives,andpaper fibers[55].Fromanenvironmentalviewpoint,incinerationandlandfillingofsludgehavea negativeimpactontheenvironmentduetoairandwaterpollutionandlandusage[56].
Toreduceitsenvironmentalimpact,thePPIexploredpaperwasteasarawmaterialto producepaper,whichseemstobeenvironmentallybeneficial[22].However,manyconcerns havesurfacedaboutthechemicalsthatareaddedtorecycledpapertoimproveprocess efficiencyandproductquality[57].Furthermore,recycledpapermighthavemoreharmful chemicalspresentinitduetocross-contaminationwithotherwastes[23].Moreover, wasterecyclingdoesnotformacompletecycleastheamountofcollectedpaperwaste doesnotmeettherequireddemandsofpaperproductsconsideringthatrecyclingisnot 100%efficient,assomeofthepaperwastedegradesduringtheprocess[23].Recycling alsodoesnotsignificantlyreducethegreenhousegasemissionsofthePPIbecauseitis notusuallyproperlyperformed[58]andisstillanenergy-intensiveprocess[59].Due totheincreaseinglobalrecyclingrates,theamountofpapersludgefromdeinkingand repulpingalsoincreased[60].Deinkingsludgecontainsinkparticles,shortcellulosicfibers, coatings,anddeinkingadditives.Mostdeinkingsludgeisdewateredandincinerated forvolumereductionandenergyrecovery,andverysmallamountsofitareusedforthe manufacturingofcementandbricks[61].Figure 1 showsasummaryofthemainwaste streamsthataregeneratedduringpaper’slifecycle,startingwithwoodpulpingtopaper making,consumption,andrecycling.
Overall,thePPIisamainconsumerofwood,electricity,andwater.Ithasacurrentobjectiveofproducingaffordableandhigh-qualitypulpwhilepreservingnatural resources[62].SeveralpartsoftheworldcannotkeepupwiththewooddemandofthePPI
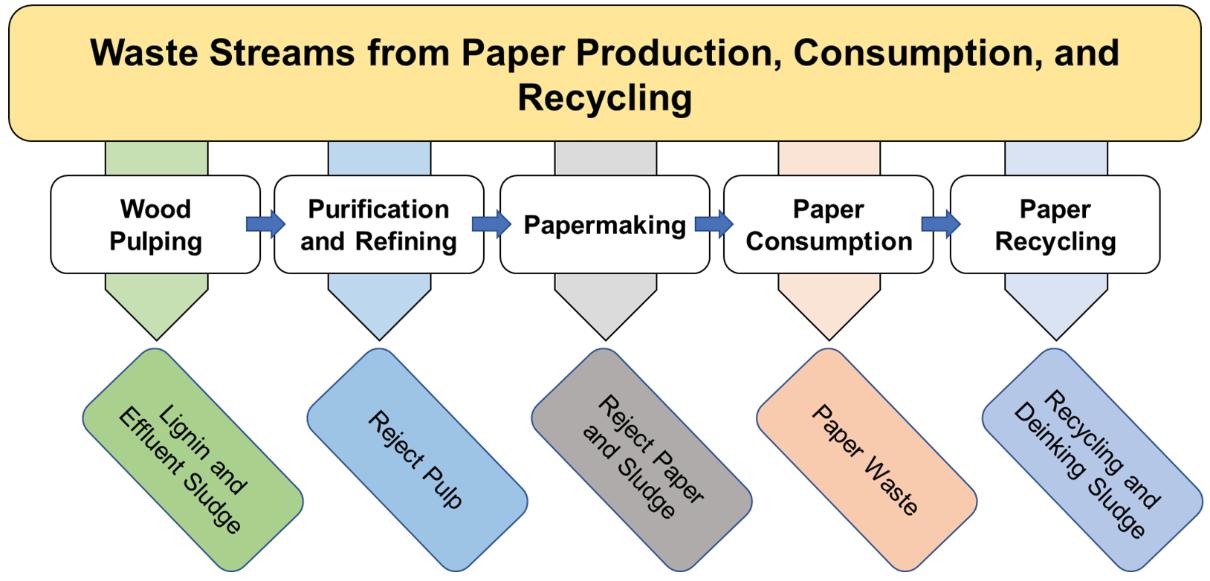
andhaveshiftedtoalternativeoptionssuchasbamboo,wheatstraw,andricestraw[63]. Theproductionofpaperfromnon-woodsourceshasseveraladvantages,suchaseaseof pulpingandthehighqualityofthefibers,whichcanbeusedfortheproductionofspecial typesofpaper[64].Ricestrawhasahighcellulosecontentmakingitanexcellentresource forpaperproduction.Ricestrawcombinedwithwastepapercanproducepaperthatcan beusedaswrappingpaper,artpaper,andwritingpaper[65].Moreover,non-woodfibers obtainedfromagriculturalresiduescansolvetheproblemofagriculturalwastedisposal asitiscommonlyincinerated.Non-woodfibersalsovaryinlength,whichcanbeused toproduceseveraltypesofpaper[66].Teawastefromtheincorrectharvestingofblack tealeaves,whichisdisposedofbylandfilling,canalsobeusedforpapermaking[67]. Pineappleleavesandbananaplantfibersarealsogoodalternativerawmaterialsforpaper productionastheybothhavehighcellulosecontent[68].
3.PaperWasteandRejectsandTheirRecycling
Papercanbevirginpaper,whichisproducedfromvirginpulp,orrecycledpaper, producedfromrecycledwastepaperorreprocessedpulp[3].Paperrecyclingreducesthe burdenontheenvironmentbyminimizingnaturalresourceconsumptionandreducing theamountoftoxicchemicalsreleasedintotheenvironment[59].Paperrecyclingalso playsamajorroleindecreasinggreenhousegasemissionssincefewertreesarecutdown, leadingtomoreCO2 capturedthroughphotosynthesis;papermanufacturingcostsare alsoreducedbecausefewerprocessesarerequired[69,70].Astudyconductedusing materialflowanalysisandlifecycleassessmentonwastepaperrecyclinginSpainshowed thateachtonofvirginpaperemitsaround530kgCO2 eq whileatonofrecycledpaper emitsonlyaround210kgCO2 eq ,reducingCO2 emissionby320kgCO2 eq pertonof paper[71].Recyclingreducespollutioninwaterbodiesby35%andairpollutionby74%. Moreover,itreduceslandspaceusageandconservesnaturalresources[72].Themain sourcesofpaperwasteforrecycledpapermakingareindustries,households,andsmall businesses.Globally,approximatelyhalfofthepaperwasteisrecycled,whereashalfis incineratedorlandfilled[73].Householdsgenerallyareagoodsourceofmixedandgraphic papers,whereastradeandindustriesprovidecorrugatedpaperusedforpackaging.Offices, alongwithprintingandconversionoperations,areasourceofhigh-gradepaper[74,75]. Therearearound50identifiedgradesofwastepaper,andthequalityofwastepaperisa determinantoftheendqualityoftherecycledpaper.However,purityandqualityare negativelyaffectedifdifferenttypesofwastepaperaremixedtogether[72].Wastepaper oftencontainssubstancesintroducedinthecollectionandhandlingprocessesknownas non-papercomponents,suchaslaminatedcovers,staples,cosmeticsamples,andplastic wrapping.Thesecomponentscanberemovedinlimitedamountsduringrecycling,but costincreasesiftheyarepresentinhighamounts.Thishighlightstheimportanceofan efficientwastecollectionandhandlingstage[74].
Thepaperrecyclingprocessinvolvesseveralsteps,includingrepulping,deinking, andrefining.Repulpinginvolvesseparatingthefibersofthewastepaperusingwaterand chemicals.Deinkingandrefiningarenotabsolutelynecessarystepsforpaperrecycling, buttheygreatlyincreasethestrengthandappearanceofthefinalproduct[74].Deinking improvesthevisualqualityoftherecycledpaperbutdoesnotwhitenunbleachedfibers. Therefore,bleachingmaybeneeded.Severalmethodsofdeinkingareused,withthe floatationmethodbeingthemostcommon[74].Thequalityofdeinkedpulpisdetermined byseveralfactors,includingtheprintingmethod,compositionoftheink,andrecycling method.Paperprintedusingxerographicandinkjettechnologywithwater-andtonerbasedinksfurtherincreasetheissuesinrecyclingsystems.Paperprintedbyflexographic andoffsetmethodsshouldnotbetreatedtogetherasbothrequiredifferentdeinking mediums[76].Finally,thedeinkedpulpisrefinedtoprepareitforthepapermaking process[77].Cellulosicfibersundergodifferentchangeswhenrecycled.Afterseveral recyclingprocesses,theyhaveasignificantlylowbondingpotentialcomparedtovirgin fibers.Thislossofbondingcanbemostlyrestoredbyrefining,buteventually,thefiber
lengthdecreases,affectingthestrengthofthepaper[78].Itisimportanttomention thattheeffectsofrecyclingonmechanicalandchemicalpulparedifferent.Thebonding potentialofchemicalpulpsignificantlyreducesduetotherepeateddryingandrewetting processesduringrecycling,whilemechanicalpulpdeteriorateslessanddemonstratesa slightimprovementinbondingpotential[59].Forexample,astudyshowedthatthetensile indexofsheetspreparedfromchemicalpulpdecreasedfrom65to55N.m/gafteronecycle ofrecycling,whilethetensileindexofsheetspreparedfrommechanicalpulpincreased from30to35N.m/gafteronecycleofrecycling[79].Intermsoftheavailabletechnologies forrecycling,oneoftheleadingtechnologiesisinsituprecipitatedcalciumcarbonate (PCC),whichutilizestheCO2 obtainedfromotherindustrieswithnaturallimestoneto producethecalciumcarbonateneededforpaperproduction.Thistechnologyincreasesthe strengthandopacityofpaper,reduceswastewaterdischarge,andsavesenergy,allofwhich resultinlowermanufacturingcostsandminimalharmtotheenvironment[73].Another technologyisdrypaperrecycling,whichisusedtorecyclepaperinofficeswithouttheneed toexportthewastepapertoarecyclingfacility.Drypaperrecyclinginvolvesthreemain steps:separatingthepaperfibersbyapplyingimpactforce,producingasheetofpaperwith thecollectedfibers,andbindingthefiberstogetherusingpowderedbindersandheat[80]. ThistechnologyreducesCO2 emissionsby22%andwaterconsumptionby99%.However, powerconsumptionandenvironmentalburdenaresignificantlyhighconsideringtheuse ofcartridgescontainingbondingagents.Therefore,furtherimprovementsarerequiredto enhanceitsgreenness[81].
Recycledpaperisusedforvariousapplicationssuchasnewspaper,envelopes,office andprintingpaper,cardboard,andinsulation.Theutilizationofrecycledfibersdepends onthequalityrequirementoftheendproduct[82–84].Paperproductioncannotfully dependonrecycledpapersincefreshfibersarerequiredtoaddstrengthtonewlyproduced paperandimprovepaperqualitysincesomewastepapergradescannotbeusedtoproduce high-qualitypaper.Forinstance,newspapersareproducedusingahighpercentage(80%) ofrecoveredfibersand20%ofprimaryfibers,whileprintingpaperandmagazinepaper use100%primaryfibers,whicharechemicallytreatedduetorequiredwhitenessand brightness[4].Moreover,theavailabilityofwastepaperisanissuesincesometypesof paper,suchassanitarypaperandcigarettepaper,disintegratewithuse,whichmakesthem unsuitableforrecycling[85].Furthermore,papercanberecycleduptoseventimes,after whichthecellulosefibersaredeemedunsuitableforpaperproductionandarerejected[4]. Therefore,thereisastrongneedforroutesotherthanrecyclingfortheutilizationofpaper waste,whichisdiscussedbelow.
Onemajorapproachtowardssustainabilityistheconversionofwasteintoenergy andvalue-addedproducts,whichhasshownsignificantdevelopmentrecently.While minimizinglineareconomies,asustainablecirculareconomyshouldencouragethestepsof take,make,use,reuse,andrecycle,asopposedtoalineareconomythatfollowstake,make, use,dispose,andpollute[86].Belowareexamplesofhowpaperwasteandrejectscanbe convertedintoenergyandusefulproducts,includingbiofuels,biohydrogen,biomethane, heat,nanocellulose,hydrochar,constructionmaterials,andsoilamendments.
BioethanolistheonlyfuelsofarthatcanbetransportedinliquidformanddoesnotreleasegreenhousegasesintotheatmospherewhenburnedastheCO2 emittedisusedupby plantsinphotosynthesisaslongasthebiofuelconsumptionrateisnotmorethanthephotosynthesisrate[87].First-generationbioethanolisproducedfromsugarandstarch,whereas second-generationbioethanolisproducedfromwastecontaininglignocellulose.Bioethanol productionrequireshighamountsofcellulose,makingpaperwasteapotentialrawmaterial[88].Thecommercialproductionofbioethanolcurrentlyinvolvesonlyfirst-generation product,whichisproducedbyfoodcropssuchassugarcaneandcornasafeedstock.A
majordrawbackoffirst-generationbioethanolistheusageoffoodcropsforfeedstock, whichresultsinlessavailablefoodandanincreaseinfoodprices.Bioethanoliscurrently themostproducedbiofuelglobally,withtheUnitedStatesproducingthemajorityofit[89].
Toconvertpaperwasteintobioethanol,celluloseandhemicellulosearehydrolyzedto simplesugars,eitherchemicallyorusingenzymes.Enzymatichydrolysisisusedmore commonlyasitismorespecificandmilder[90].Thesimplesugarsarethenconvertedinto bioethanolbyfermentation[91].Mostoftheprocessesthatareusedcurrentlyforbioethanol productionfrombiomassinvolvecertainpretreatmentsbeforehydrolysisandfermentation. Pretreatmentsincludetheusageofacid,alkali,orotherorganicsolvents,andchoosingthe correctpretreatmentiscrucialinbioethanolproductionasitaffectsthecelluloseconversion ratesandenzymeactivity[87].Pretreatmentisessentialtogaingoodyieldsofsugarsfrom celluloseandhemicellulose,anditincreasesthedigestibilityofcellulosicbiomass[92].
Thechosenpretreatmentshouldnotdegradethesugarsintoenzymeactivityinhibitors, useminimalenergy,andrequirefewerchemicals.Forexample,pretreatedpapersludge yields90%ormoresugar,whereasuntreatedsludgeyields20%orless[93].Thepresence ofbarriercomponentssuchasligninandthecrystallineregionsofcellulosedecreasesthe effectivityofenzymes[92].Newspaperandcardboardcontainahighamountofbarrier components,whereashygienepaperandofficepaperhaveminimalamountsofthem[94]. Usingpaperwasteasarawmaterialforbioethanolproductionprovidesanalternateenergy sourceandreducestheusageoffossilfuels,solvingenvironmentalissuessuchasglobal warming.Italsosolvesissuesrelatedtobiofuelproductionfrombiomass,suchasland use,deforestation,threatstoglobalfoodsecurity,andthelimitedamountofavailable biomass[95].Itis,however,notaseffectiveinfightingglobalwarmingasrenewableenergy sourcessuchassolarandwindasitstillemitsgreenhousegases[96].
Paperwastehasanadvantageoverotherlignocellulosematerialsinbioethanolproductionasitdoesnotrequireadditionalpretreatmentssincethemajorityofligninisalready removedinvariouspapermanufacturingprocesses[97].Moreover,thedegradablenature ofpaperwastemakesitsuitableforbioethanolproduction.Inadditiontothat,wastepaper iseasilyavailableatlowcostsandcontainshighlevelsofcarbohydrates.Bioethanolproductionfromwastepaperalsoprovidesanalternativetorecyclingsincerecyclinghasseveral limitations,suchasadditionalenergyusageinrecyclingprocessesandalimitednumberof recyclingcycles[98].Thepapersludgefromthepapermakingprocesscontainsshort-length fibersandhashighamountsoflignocelluloseandcarbohydrates,whichcanalsobeused toproducebioethanolratherthanincineratingordisposingofit.However,thepresenceof ashandcalciumcarbonateblockthebioconversionoffibersastheyincreasethepHvalue ofsludge,makingitunsuitableforenzymeactivity[99].Treatmentsforcalciumcarbonate removalinvolvetheusageofacidsandproduceCO2 ,causingenvironmentalissues.To overcomethisissue,simultaneoussaccharificationandfermentation(SSF)canbeusedto neutralizethecalciumcarbonatepresentinsludgewithoutneedingpretreatments[100].
Thebiohydrogenproducedfrombiomasswasteisarenewablesourceofenergyand doesnothaveanegativeenvironmentalimpact.Ithasthepotentialtoovercomeseveral environmentalissuesandtheglobalenergydemand[101].Amajorbarrierinbiohydrogen productionisthecost,asithascomplicationsintermsofstorage,compression,distribution networks,andlackofdurablefueltechnologies[102].Hydrogenfuelcellsarealsocostlyto setup,delicate,anddonotfunctionforextendedperiodsoftime[103].Thermochemical pulping(TMP)isapapermakingprocessbywhichwoodfibersaretreatedusinghotsteam underpressure.TMPresultsinanaerobically-treatedwastewatertoproducebiohydrogen inaprocesscalleddarkfermentation(Figure 2)[85].Darkfermentationisatemperaturesensitiveprocesssinceaslightshiftintemperaturecansignificantlyincreaseordecreasethe hydrogenyield;hence,thetemperatureofwastewaterhastobecontrolledefficiently[104]. Agroupofresearchersusedrecirculatedtwo-phasedanaerobicdigestiontoproducebiohydrogenandbiomethanesimultaneouslyfrommunicipalsolidwaste, 50%ofwhich was
paperwaste[105].Anaerobicdigestionofpaperisoneofthemajorwastemanagement optionssinceitisnoteconomicallyburdeningandoffersenvironmentalbenefits,producing renewableenergyintheformofbiomethane.Foodwasteandpaperwastecanbedigested anaerobicallyindividually(mono-anaerobicdigestion)orcombined(co-digestion).Codigestionprovidesabetteryieldofmethanecomparedtomono-digestion.Thermophilic (50–60 ◦ C)andmesophilic(30–40 ◦ C)arethetwotemperaturerangesofanaerobicdigestion, withthermophilicbeingbetterduetohighmethanegascontent,lowhydrogensulfide content,andhighrateoforganicmatterdegradation[106].Whenwasteisanaerobically digested,methaneisobtainedinahighpercentage(50–70%),followedbycarbondioxide andothergasessuchashydrogen.Cellulosicwastesgenerallydonotproducehighyields ofbiogasesduetotheirpoorbiodegradability.Toovercomethis,paperwastecanbecodigestedwithotherorganicwastestoincreasegasflammability[107].Astudyconducted byPriadietal.(2014)showedthattheanaerobicdigestionofpapersludgeseededwithcow manureproducedasignificantlyhighyieldofmethane(269mL/g)comparedtotheanaerobicdigestionofpapersludgealone(14.7mL/g).Thetreatmentofwastewateroriginating fromthepaperindustryresultsinlargequantitiesofpapersludgecontainingchlorinated organics,pathogens,andtracesofheavymetals[108].Wastewaterfromindustrialand municipalsourcescanbetreatedbyseveraldifferentanaerobicreactors,suchasanup-flow anaerobicfilter,modifiedanaerobicbaffledreactor(MABR),orup-flowanaerobicsludge blanket(UASB).UASBisthemostcommonlyusedanaerobicreactorformunicipaland industrialwastewatertreatmentsinceitisstableandconsumesenergyefficiently.Using thisreactor,wastewatercontainingorganicmatterreleasedfrompapermakingorrecycling industriescanbeusedtoproducebiomethane[109].
Paperwasteoftenundergoespretreatmentsbeforeanaerobicdigestiontoobtaina higheryieldofbiomethane[110].Mechanicalpretreatmentssuchasshreddinghaveshown noincreaseinbiomethaneproduction.Biologicalpretreatment,ontheotherhand,which consistsoftreatingdifferenttypesofpaperwastewithathermophiliccellulose-degrading consortium,increasesbiomethaneyield[111].Moreover,biogasproductionisdependent onseveraldifferentfactors,suchasthevolatilesolidcontentofthefeedstockandthelevel ofbiologicalactivityinthedigester.Carbonandnitrogenbalanceinfeedingmaterialalso affectsbiogasproduction,withtheoptimalcarbonandnitrogenbalanceratiobeingbetween 25:1and30:1.Inaddition,environmentalfactors,includingtemperatureandpH,determine theobtainedbiogasyield[112].Furthermore,variationsinthepulpproductionprocedures canaltermethaneproductioninanaerobicdigesters.PrimarypulpobtainedfromKraft andsulfitepulpingprovidesahighyieldofmethanewhenanaerobicallydigesteddueto theefficientremovalofligninfromthepulpinpapermakingprocesses.Anotheradvantage
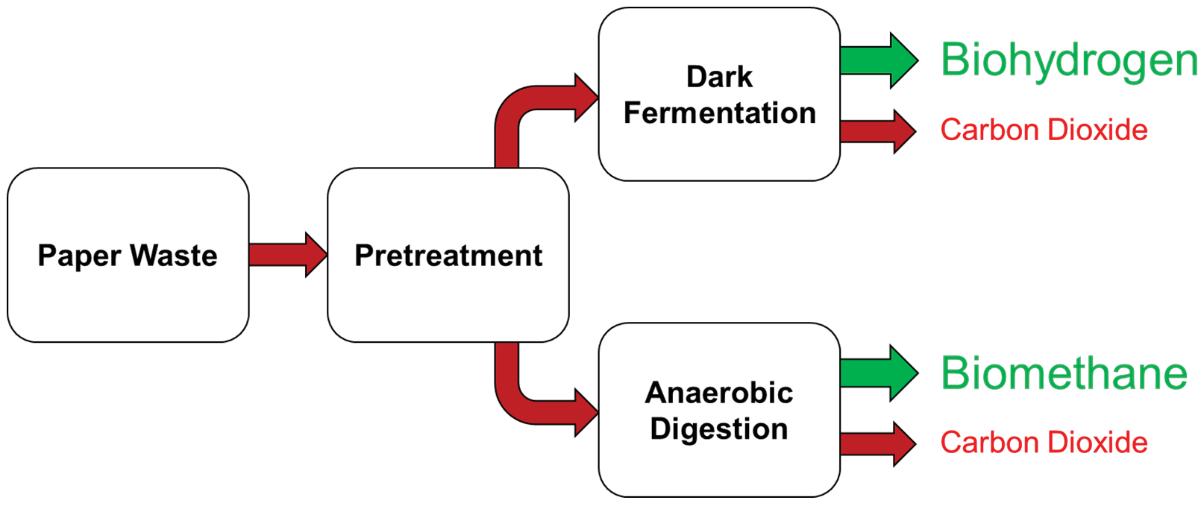
ofusingthesetypesofpulpsisthatmethaneproductionremainsstabledespitetheshiftin rawmaterialorthepulpbeinginthebleachedorunbleachedform[113].
Paperwastehasthreemaindisposalmethods,landfilling,incineration,andcomposting.Landfillingisthemostcommondisposalmethodamongthethree.Theeffectivenessof landfillingisseverelyreducedduetotheextensivelandusage,especiallyincountriessuch asChina,whichisoneofthelargestproducersofsolidwasteglobally[114].Landfilling emitsCH4 assolidwastedecomposesanaerobically.Paperwastecanbeutilizedasrenewableenergyforpowergenerationandminimizesthegreenhousegasemissionsreleased fromlandfilling[115].Inthepast,landfillingsiteswereavailableincloseproximityto urbanareas,whichlimitedthedevelopmentandneedforincinerationfacilitiesincountries suchasCanada.Inadditiontothat,wasteincinerationwasbelievedtocausesignificant harmtohumanhealthandtheenvironmentbylocalcommunities[116].Paperwaste incinerationproducesheat,whichcanbeutilizedorfurtherprocessedtoproduceelectricity.Sometimeswasteisincineratedsolelyforthepurposeofdisinfectionandvolume reduction[117].Wasteincinerationinvolvesthecombustionofsolidwastes,releasing gasesandenergysimultaneously.Incinerationofwastecanreducevolumeby90%and weightby70%.Whileincinerationrecoversahighamountofenergy,italsoreleasesa lotoftoxicpollutantssuchasheavymetals,CO2 ,andpersistentorganicpollutantsinto theenvironment[118].Technologiesforwasteincinerationaredevelopingrapidly.China currentlyusesthreewasteincinerationtechnologies,whicharestrokergrate,fluidizedbed, androtarykiln[114].ThemajorityoftheEuropeanincinerationplantsusemovingtoward gratetechnologyduetoitsadvantages,suchasnotrequiringshreddingorpretreatment, overotherincinerationtechnologies,suchastherotarykilnorfluidizedbeds.However, strokergatetechnologyhashighmaintenancecostscomparedtoothertechnologies.The mainchallengeinincinerationplantsistomaintainaconstanttemperatureinthecombustionchamberandconstantenergyoutput,asincreasedtemperaturecouldcorrodeor decreasethelifeofessentialplantcomponents[119].Wasteincinerationcanfulfillthe energydemandsofsmallerstatesasenergyfromincinerationcanbeusedtogenerate electricityorpowerwatertreatmentplants[120].
Amongdifferentwastedisposaltechniques,landfillingistheworstoptiondueto landusageandthereleaseofgreenhousegases.Incinerationisconsideredabetteroption sincemuchoftheenergycanberecycledbywastecombustion[18].Amongrecyclingand incineration,thebestchoiceisdependentonfactorssuchaswastehandling,lossofquality inpaperreprocessing,andenergyrecoveryefficiency.Inmostcases,incinerationcoupled withadvancedtechnologyisthepreferredmethodofpaperwastemanagement[121].Inthe past,greenhousegasesandheavymetalsreleasedbytheincinerationprocesswereamajor concern.Thiswassolvedbytheintroductionoffluegastreatmentsystems,whichthen causedashiftinfocustomanagethesolidresiduesofwasteincineration[117].Following theincinerationofwaste,bottomash,flyash,andboilerasharecollectedintheformof residues,themajorityofwhichisbottomash.Bottomashcontainsbrick,ceramics,and unburnedorganicmattersuchaswood,plastic,andfibers[122].Bottomashiscommonly disposedofinlandfills,butitcanberecycledtoproduceconstructionmaterialssuchas concreteandcement.However,duetotheleachingofheavymetalsandtoxiccompounds, therecyclingordisposalofbottomashisenvironmentallyconcerning[123].
Paperrecyclingresultsinthecollectionofshortenedfibersintheformofrecycled papersludge,whichisnotsuitableforpaperproduction.Whilerecycledpapersludge hasbeenusedtoproducebioethanol,productionislimitedsincebioethanol,initsfinal form,isalow-costproduct[124].Currently,sludgeisdisposedofthroughincinerationand landfilling,posingenvironmentalhazards.Theconversionofpapersludgeintohigh-value materials,suchascellulosenanoparticles,minimizestheissuesrelatedtopaperwaste
disposal[125].Amongthesenanoparticles,cellulosenanocrystals(CNCs)arecrystalline nano-rodswithathicknessof3–10nmandalengthofafewhundrednanometers.Theyare usuallyextractedfrompulpfibersusinganacid-mediatedprocedure,whichhasalready beenindustrialized.Theycanalsobeextracteddirectlyfromwoodandlignocelluloses usingavarietyofreagentsandprocesses[28,126,127].Cellulosenanofibrils(CNFs),anotherformofcellulosenanoparticles,aresemi-crystallinespaghetti-likenanoparticleswith athicknessof5–30nmandalengthofafewmicrometers.Theyareusuallyproduced bythemechanicalfibrillationofpulpfibersusingawiderangeoftechniques,includingmicrofluidizationandhomogenization[128,129].Thedimensionsandcrystallinityof nanocellulosearedependentonitsoriginandtheusedmethodofextraction[130,131].In additiontotheirhighmechanicalproperties,biodegradability,andhighsurfacearea,CNCs andCNFsarefamousforthepossibilityofmodifyingtheirsurfacesthroughabundanthydroxylgroups[131–134].Duetotheseinterestingproperties,CNCsandCNFshaveshown greatpotentialinawiderangeofapplications,includingflexible electronics[135–137], energyharvestingmaterials[138],watertreatmentmembranes[139],drugdeliverysystems[140–142],tissueengineering[143],biodegradablepackaging[144,145],oilclean-up materials[146],andlightweightcompositesforautomotiveindustries[147].Nanocellulose isusuallyextractedfromwoodpulpandplantfibers.However,severalmethodshave beendevelopedtoproduceitfrompaperwasteandrejects.Themostcommonlyused acidtoobtainCNCsbyhydrolysisissulfuricacid(H2 SO4 )duetoitstendencytostrongly isolateCNCsanddispersethemasastablecolloidsystembyesterificationoftheirsurface hydroxylgroups.Reactiontime,temperature,andacidconcentrationarethemainfactors thatdeterminethepropertiesoftheCNCs[142].Followingacidhydrolysis,CNCsare washedwithwatertohaltthereactionandarethenrecoveredbycentrifugation.Dueto environmentalconcerns,acidhydrolysiscannotbeimplementedinabiorefineryscheme. Toovercomethis,otherroutesofobtainingnanocellulose,suchasenzymatichydrolysis, havesurfaced.Cellulaseisthemostcommonlyusedenzymeclassforenzymatichydrolysis duetoitsabilitytoattackcellulosefiberswithhighselectivity[129].Themaindrawbackof acidhydrolysisisharshconditions,whileenzymatichydrolysistakessignificantlymore time.Therefore,subcriticalwatertreatmenthasbeenexploredbecauseitdoesnotrequire harshconditionsandanextendedperiodoftime[148].TheCNCsandCNFsextracted frompaperwastecanbeusedinthepapermakingprocess.CNFscanbeutilizedasadditivestopromoteadhesionbetweenthefibersandtofillthevoidsinthepaper,which couldresultinimprovedstrengthofthepaperinitsfinalform[149,150].Thisisbecause nanocellulosehasalargesurfaceareaduetoitsnano-sizeandmanyfreehydroxylgroups, promotinghydrogenbondingandstrongerstructureformation[151].Themajorissue withtheextractionofCNCsandCNFsfrompaperwasteisthecalciumcarbonatethat existsinpaperwaste.Itisexpectedthatitinterfereswiththeextractionprocessinterms oftheformationofby-productsandreducesnanocelluloseyieldandpurity[24,152,153]. Still,CNCsandCNFsextractedfrompaperwastehavebeenexploredinawiderange ofapplications[131,152,154].
Papermillsludgehasahighmoisturecontent,whichincreasesdryingandtransportationcostslimitingitsutilization.Highmoisturealsoattractsmicroorganisms,which digesttheorganicfractionofthesludge,resultinginthereleaseofgreenhousegasesinto theenvironment[155].Theorganicfractionofpapersludgeissuitableforhydrothermal carbonizationtoproducecarbon-basedmaterials.Hydrothermalcarbonizationinvolves theconversionofwetbiomasscompoundstohighcarbon-containingsolidproductsin sub-criticalwaterconditions[156,157].Itusuallytakesplaceinatemperaturerangeof 160 ◦ Cto180 ◦ Candself-generatedpressureintherangeof1to3MPaandresultsina materialsimilartocoal,knownashydrochar.Hydrocharhasinterestingproperties,such asimprovedhydrophobicityandbetterdewateringpropertiescomparedtopaperwaste. Whendried,itscalorificvalueincreasescomparedtotheinitialfeedstock.Hydrocharcan
beutilizedassolidfuel,low-costadsorbent,catalyst,andcontaminantremover[158,159]. Hydrocharresultingfrompapermillsludgecarbonizationhaslowerignitiontemperatureandhigherburntemperaturescomparedtobituminouscoal[160].Hydrothermal carbonizationhasadvantagesoverothertreatmentsofasimilarnature,suchaspyrolysis, sinceitdoesnotrequirepriordryingoffeedstockduetowateractingasasolvent,reactant,andcatalyst[161].Duringhydrothermalcarbonization,theorganiccompoundsof wastehydrolyzeintomonomers,whichcanbeturnedintohydrocharandorganicacids byundergoingseveralreactionssuchasdehydration,decarboxylation,condensation,and polymerization[162].Temperatureisthemostcriticalparameterinhydrothermalcarbonization,butthetypeofbiomassusedalsoaffectsthechemicalpropertiesofproduced hydrochar[163,164].Duringhydrothermalcarbonization,afractionofcarbonislostas someoftheorganicmaterialdissolvesintheaqueousphase,andgasisproducedinsmall quantities[165].Thewasteundergoinghydrothermalcarbonizationrequiresminimal treatmentssuchasdewateringandhandlingsincehydrocharissterilizedduringtheprocess[166].Hydrocharfrompaperwastecanbesubjectedtoavarietyofmodificationsto widentherangeofitsapplications[167,168].Thehighashcontentinfeedstockreducesits suitabilityforhydrothermalconversionasitcontributestometalcorrosionandoperating complicationsinprocessingplants.Inaddition,thesolidfuelproducedbyfeedstock containinghighashcontenthaslowgrosscalorificvalueandpossessespoorcombustion properties.Forexample,sludgeobtainedfromaprimaryclarifieratapapermillisnot suitableforhydrothermalcarbonizationduetothehighashcontent,whereasKraftand recyclingpapermillsludgehassignificantlylowerashcontent,increasingtheirpreference forproducingsolidfuel[169,170].
Theincreasedimportanceofusingenvironmentallyfriendly,low-cost,andlightweight materialsintheconstructionindustryhasresultedintheimplementationofwastematerials inconstructionmaterialssinceitbenefitstheenvironmentandmaintainsconstruction standards[25].Therefore,cellulosicfibersobtainedfromnaturalsourcessuchasplantsare commonlyexploredfortheproductionofconstructionmaterials.However,recycledfibers frompaperwasteorothersourceshavenotbeenwidelytested,asonlyafewstudieshave shownsuccessfulimplementationsofrecycledfibersincement-basedcomposites.Products currentlymanufacturedusingrecycledcellulosicfibersincludeplasterboard,insulation materials,andbricks[171].Paperwastesuchasnewspaperandcardboardcanbemixed withcementtoproducepapercrete,whichincreasesthebondingpotentialandstrengthof cement.Theproductionofpapercreteinvolveswastepapersoakedinwatertosoftenthe fibersandthenaddedtocementtoformblocksorusedasmortar.However,thereareno standardmixturesofpapercrete,whichmakesitchallengingtoobserveitspropertiesfrom anengineeringperspective.Papercreteproductiondoesnotrequireexcessiveamounts ofenergyorreleaseby-productsthatareharmfultotheenvironment[172].Accordingto Akinwumietal.(2014),papercreteproducedfromnewspaperdemonstratessignificantly betterstructuralqualities,suchascompressivestrength,comparedtopapercreteproduced withofficepaper.Papercretehashighfireresistancebutalsoabsorbsmorewater.Therefore, itisnotrecommendedtobeusedforouterwallsorwallswhichareneartheground[173]. AstudyconductedbySangrutsameeetal.(2018)investigatedtheusageofdifferenttypesof re-pulpedpaperincementcompositeproduction.Fourtypesofre-pulpedfibersobtained fromnewspaper,officepaper,cartonpaper,andmixedpapersweremixedwithcement indifferentratios,andpropertiessuchascompressivestrength,bulkdensity,thermal conductivity,andwaterabsorptionwereobserved.Compositesproducedfromre-pulped cartonpaperwerefoundtobemosteffectiveastheywerelightweightandhadlowthermal conductivityanddensity.However,theyhadthedrawbackofhavinglowcompressive strengthandhighwaterabsorption[174].Alargefractionofinorganicsubstancesinpaper millsludgemakesitidealfortheproductionofseveralconstructionmaterials,suchas bricks,cement,andinsulation[90].Forexample,cellulosefibersmixedwithcementand
someotheradditivesproducefibercementproductsthathavehighstrength,durability,fire resistance,andgoodappearance.Fibercementproductsareusedindifferentconstruction applications,suchastheproductionoffloors,walls,anddecorations[175].Theusageof cellulosefibersinconstructionmaterialssuchascementcompositeshassomedrawbacks, suchaslowdurabilityinalkalineormineral-richenvironmentsanddegradationdueto agingmechanisms(mainlyalkalinehydrolysisandcellwallmineralization),affectingthe reinforcingroleofcellulosefiberswhenusedascementcomposites[171].
Theconstructionindustryconsumesclaybricksinlargeamountsforbuildings,and theimprovementofthesebricks,suchastheirthermalconductivity,canreduceheatloss throughwalls.Brickmakinginvolvestheusageofpore-makingadditives,whichhelp inproducingbrickswithlowthermalconductivityanddecreaseddensitywhilesaving claymaterial.Paperwastecanbeusedasanadditiveinbrickmakingtomanufacture bricks,whicharelightweight,porous,andhavedecentstrengthalongwithlowthermal conductivity[176].InastudyconductedbyGoeletal.(2021),papermillsludgecompost wasusedinbrickmakinginsteadofpapermillsludgeduetoitslowmoisturecontentand easeofshredding.Whilethisconcepthasnotbeenuseduntilnow,thisstudyprovides guidelinesthatcanbeusefulinthefuturetoelevatetheconceptatacommerciallevel inbrickmaking[177].Recycledaggregatedcementobtainedfromdemolishedbuildings andpapermillsludgecanbeusedtogethertoproduceacontrollow-strengthmaterial, whichisnotconsideredconcreteorcementbutissuitableforbackfillingandhascertain advantagessuchasquickerconstructiontimeandreduceddependencyonequipmentdue toitsself-levelingproperties[178].
Theincinerationofpaperwasteandpapersludgeresultsintwodifferenttypesof residues,whicharebottomashandflyash.Flyashaccountsforlessthanone-quarter ofallresiduesandcontainstoxicsubstances.Bottomash,however,containsfewertoxic substancesincomparisontoflyashand,duetoitslargesolidparticles,issuitablefor usageinconstruction.Bottomashhasbeenpreviouslyusedasaroadfillerandfor cementproduction,butitpresentsamajordrawbacksinceitreleasesheavymetalsinto theenvironment[179].Papersludgeashcanalsobeusedasaclaystabilizer,whichwas previouslydoneusingcommerciallyproducedlimesorcement.Itdoesnotrequireany energyforproductionandprovidesseveraleconomicandenvironmentalbenefits[180].
Themanufacturingofcommercialchemicalfertilizersconsumeslargeamountsof resourcesanddegradestheenvironmentduetomineralextractionandcalcination[181]. Beinganactiveorganicmaterial,papermillsludgecanbepotentiallybeneficialforcrops asasourceofnutrition[182].Theutilizationofpapermillsludgeontropicalacidicsoils decreasesitsaciditybyneutralizingthesoilandincreasesorganicmatterandessential nutrients[55].However,spreadingpapermillsludgeonagriculturallandischallenging, andtheimpactofphysicalandchemicalpropertiesoforganicresiduesmustbetestedon soilfertilityandsitequality.Moreover,papersludgehashighcarbon-to-nitrogenratiosand BOD,whichcausesshort-termnitrogensequestration.Inaddition,papersludgeisdifficult tohandle,transport,store,andcontroltheodorsreleasedfromit.Compostingpaper sludgeminimizestheseissues[183].Compostingoccursbymixingthewastewiththe microorganismsthatarenaturallyfoundinthesoil,suchasbacteria,fungi,andprotozoa. Themicroorganismsconvertthewasteintobiologicallystablehumicsubstances,which constitutetheresultantcompost.Itisthemostadvantageousdisposalmethodsinceit returnsthemacroandmicronutrientsbackintotheecosystem[184].Ahmedetal.(2018) studiedthebiodegradationofdifferenttypesofpaperswhencomposted.Newspaperwith inktookthelongest(21days)todegradewhenburiedinsoil,followedbynewspaper withoutink(18days).Glossypaperandrecycledpaperfullydegradedthequickestamong allfour,astheytook14and16days,respectively.Theadvantagesofusingpaperascompost includetheabsorptionoffreewaterfromfoodmaterials,reducingodors,andproviding asourceofcarbon,whichbenefitssoilslackingorganicmatter[185].Compostingpaper
millsludgeenhancesitsqualityduetothepracticalphysicalpropertiesitpossesses.Paper sludgecompostincreasesplantgrowth,andsludgecontainingcalciumcarbonateisused tolimesoilswithlowerpHandalsoprovidesasourceofZntomarginalsoils[186,187]. Itisalsoeasilystoredwithoutrequiringlargevolumesascomparedtorawpapermill sludge.However,theuseofpapermillsludgeascompostisstillnotwidelywelcomed intheagriculturalfieldduetotheheavymetalspresentinpapermillsludge,whichcan potentiallyleachintothesoil,posingahealthhazard[177].However,astudyconducted byRosazlinetal.(2011)onacompostofrecycledpapermillsludgemixedwithemptyfruit bunchesshowedthatthecompostdisplayedadvantageouspropertiessuchasnotoxicity onplants,100%seedgermination,andhighnutrientcontent.Additionally,theheavymetal concentrationinthecompostwasalsowithinlimits[188].
Overall,andassummarizedinFigure 3,therearedifferentpossibleroutesforthe utilizationofpaperwastetoreturnitsvaluetotheeconomyandreduceitsenvironmental impact.Itisimportanttomentionthatsomeoftheseroutesarealsousedfortheutilization ofotherkindsofwaste,suchaselectronicwaste[189,190].Thegreennessandefficiency oftheconversionofpaperwasteintoenergyaresignificantlydependentontheformof energy(biofuel,biogas,hydrochar,orheat),theconversionmethod(SSF,carbonization, anaerobicdigestion,orincineration),andtheusedprocessingconditions(temperature andothers).Intermsoftheconversionofpaperwasteintohigh-valuematerialssuchas nanocelluloseandsoilamendments,themethodsvarysignificantlyintermsofefficiency andgreennessastheycanbechemical,biological,orphysical,operatingatdifferent severities.Intheliterature,thecomparisonintermsofgreenhousegasemissionshas mostlyfocusedontheincineration,anaerobicdigestion,andcompostingofdifferentwaste streams,includingmunicipalsolidwaste,foodwaste,sewagesludge,andothers[191–193]. Theliterature,ingeneral,considerscompostingtogeneratelessCO2 emission.Anaerobic digestioncomessecond,followedbyincineration.Forexample,onestudyestimated thatthegreenhousegasemissionscausedbycompostingmunicipalsolidwastecouldbe around100kgCO2 eq /tonwaste,comparedtoaround125kgCO2 eq /tonwasteusing anaerobicdigestion,andaround1380kgCO2 eq /tonwasteusingincineration[194].These threemethods,indeed,arestillbetteroptionsthanwastelandfilling[195].Intermsof costandoperation,compostingisalsothecheaperoptionandtheeasiertoestablishand manage[192].However,severalstudieshavehighlightedthattheuseofanintegrated wastemanagementsystemcombiningthedifferentmethodsistherightoptiontorecover themaximummaterialandenergypotentialofwaste[195].
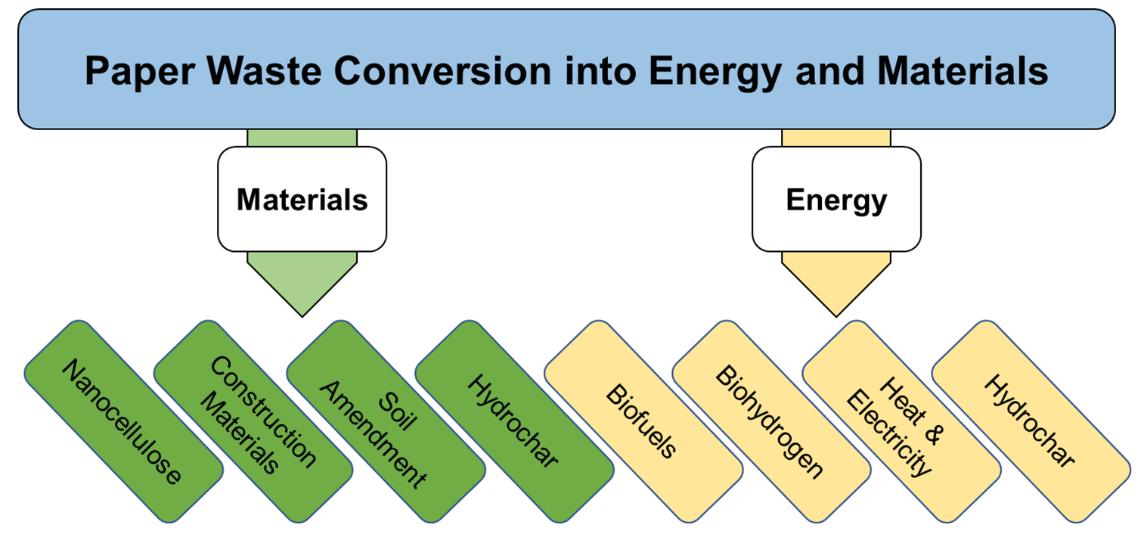
Thepulpandpaperindustry(PPI)usesmassiveamountsofnaturalresourcesand pollutestheenvironment,whichhasraisedmajorconcerns,forinstance,regardingde-
forestation.Additionally,thePPIdischargeswastewaterthatcanpollutewaterbodies. Furthermore,thewasteproducedbythisindustryincludespaperwasteandsludge,which requirepropermanagement.Thesewastesareusuallyburntordumpedinlandfills,which causesavarietyofhealthandenvironmentalissues.Therefore,therecoveryaspectof sustainablewastemanagementisofgreatimportance,whichisbasedonahierarchyof prevention,reuse,recycling,recovery,anddisposal.Afterpreventionandreuse,paper recyclingiscrucial,whichsignificantlylowersgreenhousegasemissionsbecausefewer treesarecutdown,anditalsolowersmanufacturingcosts.Papercanberecycledupto seventimes,afterwhichthecellulosefibersareconsideredunsuitable.
Theotherpossiblesustainablewaystodealwithpaperwasteemphasizedinthis reviewarebasedontheconceptofconvertingpaperwasteintoenergyandhigh-value materials.Underthisconcept,biofuelproductionispossible,aspaperisanimportant sourceofsugarsthatcanbefermentedtobioethanol—analternateenergysource.Other thanbiofuelproduction,biohydrogenandbiomethanecanbeproducedfrompaperwaste assourcesofenergy.Heatandelectricitycanalsobegeneratedfromtheincinerationof paperwaste.Paperwasteandsludgecanalsobeconvertedintohigh-valuematerials minimizingtheissuesrelatedtopaperwastedisposal.Paperwastecanbeusedasraw materialsfortheproductionofcellulosenanoparticles,whichhaveveryadvantageous propertiesandapplications.Papersludgealsocontainsorganicfractionsthataresuitable forhydrothermalcarbonization.Thisprocessinvolvestheconversionofwetbiomassinto ahighcarbon-containingsolidproductknownashydrochar,whichcanbeusedasasolid fuel,low-costadsorbent,catalyst,andcontaminantremover.Anothersustainableuseof paperwasteandsludgeistheproductionofconstructionmaterialssuchasinsulation materials,plasterboard,andbricks.Thelargefractionofinorganicsubstancesinpapermill sludgemakesitidealfortheproductionofconstructionmaterials.Finally,paperwasteand sludgecanbecompostedfortheproductionofsoilamendments,whichcandecreasesoil acidity,increaseitsorganicmatter,andprovideessentialnutrients.Thecompostingofpaper sludgeorwastethatisrichinorganicmattercanbethemostusefuldisposalmethod,as thisprocesscanreturnthemicro-andmacronutrientsbacktotheenvironment.Overall,the aforementionedprocessesandpossibilitiestowardthesustainablemanagementofpaper wasteandsludgehavebothprosandcons.Therefore,futureresearchshouldfocusonthe optimizationoftheavailablepaperwasteutilizationprocessesandonthedevelopmentof newconversiontechnologiesinordertoimprovetheenvironmentalsustainabilityofthe pulpandpaperindustry.
AuthorContributions: Conceptualization,H.A.,M.A.M.,S.T.G.andJ.M.;formalanalysis,H.A., M.A.M.,S.T.G.andJ.M;investigation,H.A.,M.A.M.,S.T.G.andJ.M.;writing—originaldraftpreparation,H.A.,M.A.M.,S.T.G.andJ.M.;writing—reviewandediting,H.A.,M.A.M.,S.T.G.andJ.M.; supervision,H.A.andJ.M.;projectadministration,H.A.Allauthorshavereadandagreedtothe publishedversionofthemanuscript.
Funding: ThisresearchwasfundedthroughaninternalgrantofferedbyAbuDhabiUniversityto Dr.HatemAbushammala (PI)andDr.JiaMao(Co-PI)andanexternalgrantofferedbyMubadalato Dr.HatemAbushammala(PI).
InstitutionalReviewBoardStatement: Notapplicable.
InformedConsentStatement: Notapplicable.
DataAvailabilityStatement: Notapplicable.
ConflictsofInterest: Theauthorsdeclarenoconflictofinterest.
1. Bajpai,P. Biermann’sHandbookofPulpandPaper:RawMaterialandPulpMaking;Elsevier:Amsterdam,TheNetherlands,2018; Volume1.
2. Latha,A.;Arivukarasi,M.;Keerthana,C.;Subashri,R.;VishnuPriya,V.PaperandPulpIndustryManufacturingandTreatment Processes—AReview. Int.J.Eng.Res.Technol 2018, 6,IJERTCON011.[CrossRef]
3. Deshwal,G.K.;Panjagari,N.R.;Alam,T.Anoverviewofpaperandpaperbasedfoodpackagingmaterials:Healthsafetyand environmentalconcerns. J.FoodSci.Technol. 2019, 56,4391–4403.[CrossRef]
4. Ozola,Z.U.;Vesere,R.;Kalnins,S.N.;Blumberga,D.Paperwasterecycling. circulareconomyaspects.RigasTeh.Univ.Zinat.Raksti 2019, 23,260–273.
5. Asrat,T.H.;Bachheti,R.K.;Getachew,M.;Abate,L.EvaluationofpulpandpapermakingpropertiesofCaesalpiniadecapetela. Nord.PulpPap.Res.J. 2022, 37,14–24.[CrossRef]
6. Ezeudu,O.B.;Agunwamba,J.C.;Ezeasor,I.C.;Madu,C.N.Sustainableproductionandconsumptionofpaperandpaperproducts inNigeria:Areview. Resources 2019, 8,53.[CrossRef]
7. Izadi,A.;Hosseini,M.;NajafpourDarzi,G.;NabiBidhendi,G.;PajoumShariati,F.Treatmentofpaper-recyclingwastewaterby electrocoagulationusingaluminumandironelectrodes. J.Environ.HealthSci.Eng. 2018, 16,257–264.[CrossRef]
8. Sharma,P.;Iqbal,H.M.N.;Chandra,R.Evaluationofpollutionparametersandtoxicelementsinwastewaterofpulpandpaper industriesinIndia:Acasestudy. CaseStud.Chem.Environ.Eng. 2022, 5,100163.[CrossRef]
9. Rizaluddin,A.T.Reviewonrenewableenergysourcesbasedonthermalconversioninthepulpandpaperindustry.InProceedings oftheSATREPSConference,Bogor,Indonesia,17November2020.
10. Simão,L.;Hotza,D.;Raupp-Pereira,F.;Labrincha,J.;Montedo,O.Wastesfrompulpandpapermills-areviewofgenerationand recyclingalternatives. Cerâmica 2018, 64,443–453.[CrossRef]
11. Tait,P.W.;Brew,J.;Che,A.;Costanzo,A.;Danyluk,A.;Davis,M.;Khalaf,A.;McMahon,K.;Watson,A.;Rowcliff,K.Thehealth impactsofwasteincineration:Asystematicreview. Aust.N.Z.J.PublicHealth 2020, 44,40–48.[CrossRef]
12. Abushammala,H.;Ghulam,S.T.ImpactofResidents’DemographicsonTheirKnowledge,Attitudes,andPracticestowards WasteManagementattheHouseholdLevelintheUnitedArabEmirates. Sustainability 2023, 15,685.[CrossRef]
13. Dori,Y.J.;Tal,R.T.Formalandinformalcollaborativeprojects:Engaginginindustrywithenvironmentalawareness. Sci.Educ. 2000, 84,95–113.[CrossRef]
14.Pawar,K.;Rothkar,R.V.Forestconservation&environmentalawareness. ProcediaEarthPlanet.Sci. 2015, 11,212–215.
15.MirandaCarreño,R.;BlancoSuárez, Á.Environmentalawarenessandpaperrecycling. Cellul.Chem.Technol. 2010, 44,431–449.
16. Abushammala,H.;Mao,J.WasteIronFilingstoImprovetheMechanicalandElectricalPropertiesofGlassFiber-Reinforced Epoxy(GFRE)Composites. J.Compos.Sci. 2023, 7,90.[CrossRef]
17. Souza,A.G.d.;Kano,F.S.;Bonvent,J.J.;Rosa,D.d.S.Cellulosenanostructuresobtainedfromwastepaperindustry:Acomparison ofacidandmechanicalisolationmethods. Mater.Res. 2017, 20,209–214.[CrossRef]
18. Cherubini,F.;Bargigli,S.;Ulgiati,S.Lifecycleassessment(LCA)ofwastemanagementstrategies:Landfilling,sortingplantand incineration. Energy 2009, 34,2116–2123.[CrossRef]
19. Dominczyk,A.;Krzystek,L.;Ledakowicz,S.Biodryingoforganicmunicipalwastesandresiduesfromthepulpandpaper industry. Dry.Technol. 2014, 32,1297–1303.[CrossRef]
20. Zhang,D.;Huang,G.;Xu,Y.;Gong,Q.Waste-to-energyinChina:Keychallengesandopportunities. Energies 2015, 8,14182–14196. [CrossRef]
21. Finnveden,G.;Ekvall,T.Life-cycleassessmentasadecision-supporttool—Thecaseofrecyclingversusincinerationofpaper. Resour.Conserv.Recycl. 1998, 24,235–256.[CrossRef]
22. Rahman,M.O.;Hussain,A.;Basri,H.Acriticalreviewonwastepapersortingtechniques. Int.J.Environ.Sci.Technol. 2014, 11,551–564.[CrossRef]
23.Pivnenko,K.;Eriksson,E.;Astrup,T.F.Wastepaperforrecycling:Overviewandidentificationofpotentiallycriticalsubstances. WasteManag. 2015, 45,134–142.[CrossRef]
24. Kumar,V.;Pathak,P.;Bhardwaj,N.K.Wastepaper:Anunderutilizedbutpromisingsourcefornanocellulosemining. Waste Manag. 2020, 102,281–303.[CrossRef]
25. Shakir,A.A.;Naganathan,S.;Mustapha,K.N.B.Developmentofbricksfromwastematerial:Areviewpaper. Aust.J.BasicAppl. Sci. 2013, 7,812–818.
26.Clark,T.Plantfibersinthepaperindustry. Econ.Bot. 1965, 19,394–405.[CrossRef]
27. Heinze,T.Cellulose:StructureandProperties.In CelluloseChemistryandProperties:Fibers,NanocellulosesandAdvancedMaterials; Rojas,O.J.,Ed.;SpringerInternationalPublishing:Cham,Switzerland,2016;pp.1–52.[CrossRef]
28. Chen,C.;Kuang,Y.;Zhu,S.;Burgert,I.;Keplinger,T.;Gong,A.;Li,T.;Berglund,L.;Eichhorn,S.J.;Hu,L. Structure–property–function relationshipsofnaturalandengineeredwood. Nat.Rev.Mater. 2020, 5,642–666.[CrossRef]
29. Demuner,I.F.;Gomes,F.J.B.;Gomes,J.S.;Coura,M.R.;Borges,F.P.;Carvalho,A.M.M.L.;Silva,C.M.Improvingkraftpulpmill sustainabilitybylignosulfonatesproductionfromprocessesresidues. J.Clean.Prod. 2021, 317,128286.[CrossRef]
30. Pérez,J.;Muñoz-Dorado,J.;delaRubia,T.;Martínez,J.Biodegradationandbiologicaltreatmentsofcellulose,hemicelluloseand lignin:Anoverview. Int.Microbiol. 2002, 5,53–63.[CrossRef]
31. Yang,X.;Berthold,F.;Berglund,L.A.PreservingCelluloseStructure:DelignifiedWoodFibersforPaperStructuresofHigh StrengthandTransparency. Biomacromolecules 2018, 19,3020–3029.[CrossRef]
32. Laftah,W.A.;WanAbdulRahman,W.A.Pulpingprocessandthepotentialofusingnon-woodpineappleleavesfiberforpulp andpaperproduction:Areview. J.Nat.Fibers 2016, 13,85–102.[CrossRef]
33. Małachowska,E.;Dubowik,M.;Lipkiewicz,A.;Przybysz,K.;Przybysz,P.Analysisofcellulosepulpcharacteristicsandprocessing parametersforefficientpaperproduction. Sustainability 2020, 12,7219.[CrossRef]
34. Rullifank,K.F.;Roefinal,M.E.;Kostanti,M.;Sartika,L.;Evelyn.Pulpandpaperindustry:Anoverviewonpulpingtechnologies, factors,andchallenges. IOPConf.Ser.Mater.Sci.Eng. 2020, 845,012005.[CrossRef]
35. Mao,J.;Heck,B.;Abushammala,H.;Reiter,G.;Laborie,M.-P.AstructuralfibrillationparameterfromsmallangleX-rayscattering toquantifypulprefining. Cellulose 2019, 26,4265–4277.[CrossRef]
36. Das,T.K.;Houtman,C.Evaluatingchemical-,mechanical-,andbio-pulpingprocessesandtheirsustainabilitycharacterization usinglife-cycleassessment. Environ.Prog. 2004, 23,347–357.[CrossRef]
37. Mboowa,D.Areviewofthetraditionalpulpingmethodsandtherecentimprovementsinthepulpingprocesses. BiomassConv. Bioref. 2021.[CrossRef]
38. M’hamdi,A.I.;Kandri,N.I.;Zerouale,A.;Blumberga,D.;Gusca,J.Lifecycleassessmentofpaperproductionfromtreatedwood. EnergyProcedia 2017, 128,461–468.[CrossRef]
39. Jiménez,L.;Angulo,V.;Ramos,E.;DelaTorre,M.J.;Ferrer,J.L.Comparisonofvariouspulpingprocessesforproducingpulp fromvineshoots. Ind.CropsProd. 2006, 23,122–130.[CrossRef]
40. Iglesias,M.C.;Gomez-Maldonado,D.;Via,B.K.;Jiang,Z.;Peresin,M.S.Pulpingprocessesandtheireffectsoncellulosefibersand nanofibrillatedcelluloseproperties:Areview. For.Prod.J. 2020, 70,10–21.[CrossRef]
41. Aguayo,M.G.;FernándezPérez,A.;Reyes,G.;Oviedo,C.;Gacitúa,W.;Gonzalez,R.;Uyarte,O.Isolationandcharacterizationof cellulosenanocrystalsfromrejectedfibersoriginatedinthekraftpulpingprocess. Polymers 2018, 10,1145.[CrossRef][PubMed]
42.Suess,H.U. PulpBleachingToday;DeGruyter:Berlin,Germany;NewYork,NY,USA,2010.[CrossRef]
43. Haile,A.;Gelebo,G.G.;Tesfaye,T.;Mengie,W.;Mebrate,M.A.;Abuhay,A.;Limeneh,D.Y.Pulpandpapermillwastes: Utilizationsandprospectsforhighvalue-addedbiomaterials. Bioresour.Bioprocess. 2021, 8,35.[CrossRef]
44.Chauhan,S.;Meena,B.L.Introductiontopulpandpaperindustry:Globalscenario. Phys.Sci.Rev. 2021, 6,81–109.[CrossRef]
45. Han,N.;Zhang,J.;Hoang,M.;Gray,S.;Xie,Z.Areviewofprocessandwastewaterreuseintherecycledpaperindustry. Environ. Technol.Innov. 2021, 24,101860.[CrossRef]
46. Sharma,N.;Bhardwaj,N.K.;Singh,R.B.P.Environmentalissuesofpulpbleachingandprospectsofperaceticacidpulpbleaching: Areview. J.Clean.Prod. 2020, 256,120338.[CrossRef]
47. Brandt,A.;Gräsvik,J.;Hallett,J.P.;Welton,T.Deconstructionoflignocellulosicbiomasswithionicliquids. GreenChem. 2013, 15,550–583.[CrossRef]
48. Mao,J.;Abushammala,H.;Pereira,L.B.;Laborie,M.-P.SwellingandhydrolysiskineticsofKraftpulpfibersinaqueous 1-butyl-3-methylimidazoliumhydrogensulfatesolutions. Carbohydr.Polym. 2016, 153,284–291.[CrossRef]
49. Abushammala,H.;Hettegger,H.;Bacher,M.;Korntner,P.;Potthast,A.;Rosenau,T.;Laborie,M.-P.Onthemechanismofthe unwantedacetylationofpolysaccharidesby1,3-dialkylimidazoliumacetateionicliquids:Part2—Theimpactofligninonthe kineticsofcelluloseacetylation. Cellulose 2017, 24,2767–2774.[CrossRef]
50. Abushammala,H.Nano-BrushesofAlcoholsGraftedontoCelluloseNanocrystalsforReinforcingPoly(ButyleneSuccinate): ImpactofAlcoholChainLengthonInterfacialAdhesion. Polymers 2020, 12,95.[CrossRef][PubMed]
51. Roselli,A.;Hummel,M.;Monshizadeh,A.;Maloney,T.;Sixta,H.Ionicliquidextractionmethodforupgradingeucalyptuskraft pulptohighpuritydissolvingpulp. Cellulose 2014, 21,3655–3666.[CrossRef]
52. Zhao,L.J.;Zhang,Y.F.;Hong,J.F.;Tu,W.W.PapermakingWastewaterTreatment—ABriefReview. Adv.Mater.Res. 2014, 926–930,4276–4279.[CrossRef]
53.Priya,A.EnvironmentalImpactAssessmentinPulpandPaperIndustry. J.Ecophysiol.Occup.Health 2017, 17,1–3.
54. Mavroulidou,M.;Hassan,S.;Gray,C.;Gunn,M.;Youssef,A.;Garelick,J.Geotechnicalpropertiesofpaperrecyclingwaste streams.InProceedingsoftheECSMGE2019–XVIIEuropeanConferenceonSoilMechanicsandGeotechnicalEngineering, Reykjavik,Iceland,1–6September2019.
55. Abdullah,R.;Ishak,C.F.;Kadir,W.R.;Bakar,R.A.Characterizationandfeasibilityassessmentofrecycledpapermillsludgesfor landapplicationinrelationtotheenvironment. Int.J.Environ.Res.PublicHealth 2015, 12,9314–9329.[CrossRef]
56. Steffen,F.;Janzon,R.;Wenig,F.;Saake,B.Valorizationofwastestreamsfromdeinkedpulpmillsthroughanaerobicdigestionof deinkingsludge. BioResources 2017, 12,4547–4566.[CrossRef]
57. Rigol,A.;Latorre,A.;Lacorte,S.;Barceló,D.Determinationoftoxiccompoundsinpaper-recyclingprocesswatersbygas chromatography–massspectrometryandliquidchromatography–massspectrometry. J.Chromatogr.A 2002, 963,265–275. [CrossRef]
58. vanEwijk,S.;Stegemann,J.A.;Ekins,P.Limitedclimatebenefitsofglobalrecyclingofpulpandpaper. Nat.Sustain. 2021, 4,180–187.[CrossRef]
59. ˇ Cabalová,I.;Kaˇcík,F.;Geffert,A.;Kaˇcíková,D. TheEffectsofPaperRecyclingandItsEnvironmentalImpact;InTech:Rijeka,Croatia, 2011;Volume17.
60.Bajpai,P. RecyclingandDeinkingofRecoveredPaper;Elsevier:Amsterdam,TheNetherlands,2013.
61. Grée,G.C.H.D.d.l.;Yu,Q.L.;Brouwers,H.J.H.UpgradingandEvaluationofWastePaperSludgeAshinEco-LightweightCement Composites. J.Mater.Civ.Eng. 2018, 30,04018021.[CrossRef]
62. Kissinger,M.;Fix,J.;Rees,W.E.Woodandnon-woodpulpproduction:ComparativeecologicalfootprintingontheCanadian prairies. Ecol.Econ. 2007, 62,552–558.[CrossRef]
63. Laftah,W.A.;Rahaman,W.A.W.A.Chemicalpulpingofwastepineappleleavesfiberforkraftpaperproduction. J.Mater.Res. Technol. 2015, 4,254–261.[CrossRef]
64. El-Sayed,E.S.A.;El-Sakhawy,M.;El-Sakhawy,M.A.-M.Non-woodfibersasrawmaterialforpulpandpaperindustry. Nord.Pulp Pap.Res.J. 2020, 35,215–230.[CrossRef]
65. Suseno,N.;Adiarto,T.;Sifra,M.;Elvira,V.Utilizationofricestrawandusedpaperfortherecyclepapermaking. IOPConf.Ser. Mater.Sci.Eng. 2019, 703,012044.[CrossRef]
66. Eugenio,M.E.;Ibarra,D.;Martín-Sampedro,R.;Espinosa,E.;Bascón,I.;Rodríguez,A.Alternativerawmaterialsforpulpand paperproductionintheconceptofalignocellulosicbiorefinery. Cellulose 2019, 12,78.
67. Tutu¸s,A.;Kazaskero˘glu,Y.;Çiçekler,M.Evaluationofteawastesinusagepulpandpaperproduction. BioResources 2015, 10,5407–5416.[CrossRef]
68.Othman,S.A.;Mahazir,N.S.ProductionofPaperFromNon-Wood:AReview. Int.J.Adv.Res.Eng.Innov. 2021, 3,103–110.
69. Gemechu,E.D.;Butnar,I.;Gomà-Camps,J.;Pons,A.;Castells,F.AcomparisonoftheGHGemissionscausedbymanufacturing tissuepaperfromvirginpulporrecycledwastepaper. Int.J.LifeCycleAssess. 2013, 18,1618–1628.[CrossRef]
70. Berglund,C.;Söderholm,P.AnEconometricAnalysisofGlobalWastePaperRecoveryandUtilization. Environ.Resour.Econ. 2003, 26,429–456.[CrossRef]
71. Sevigné-Itoiz,E.;Gasol,C.M.;Rieradevall,J.;Gabarrell,X.Methodologyofsupportingdecision-makingofwastemanagement withmaterialflowanalysis(MFA)andconsequentiallifecycleassessment(CLCA):Casestudyofwastepaperrecycling. J.Clean. Prod. 2015, 105,253–262.[CrossRef]
72. Misman,M.;Alwi,S.W.;Manan,Z.A.State-of-the-artforpaperrecycling.InProceedingsoftheInternationalConferenceon ScienceandTechnology(ICSTIE),GeorgeTown,Malaysia,17–18September2014;pp.1–5.
73. Vu,H.H.T.;Lai,T.Q.;Ahn,J.W.Appropriatetechnologyforthepaperrecycling:Anewparadigm. J.EnergyEng. 2018, 27,81–88. 74.Faul,A.M.Qualityrequirementsingraphicpaperrecycling. Cellul.Chem.Technol. 2010, 44,451.
75. Ervasti,I.;Miranda,R.;Kauranen,I.Aglobal,comprehensivereviewofliteraturerelatedtopaperrecycling:Apressingneedfor auniformsystemoftermsanddefinitions. WasteManag. 2016, 48,64–71.[CrossRef]
76. Dumea,N.;Lado,Z.;Poppel,E.Differencesintherecyclingbehaviourofpaperprintedbyvarioustechniques. Cellul.Chem. Technol. 2009, 43,57.
77. Fricker,A.;Thompson,R.;Manning,A.Novelsolutionstonewproblemsinpaperdeinking. Pigment.ResinTechnol. 2007, 36,141–152.[CrossRef]
78. Hubbe,M.A.;Venditti,R.A.;Rojas,O.J.Whathappenstocellulosicfibersduringpapermakingandrecycling?Areview. BioResources 2007, 2,739–788.
79. Jin,H.;Kose,R.;Akada,N.;Okayama,T.Relationshipbetweenwettabilityofpulpfibersandtensilestrengthofpaperduring recycling. Sci.Rep. 2022, 12,1560.[CrossRef]
80. Nakamura,M.DevelopmentofTheDryPaperRecyclingTechnologywhichRealizesaNewOficePapermakingSystem. Jpn. TappiJ. 2018, 72,786–792.[CrossRef]
81. Ono,Y.;Hayashi,M.;Yokoyama,K.;Okamura,T.;Itsubo,N.Environmentalassessmentofinnovativepaperrecyclingtechnology usingproductlifecycleperspectives. Resources 2020, 9,23.[CrossRef]
82. Chang,J.C.;Beach,R.H.;Olivetti,E.A.ConsequentialeffectsofincreaseduseofrecycledfiberintheUnitedStatespulpandpaper industry. J.Clean.Prod. 2019, 241,118133.[CrossRef]
83. Buist,H.;vanHarmelen,T.;vandenBerg,C.;Leeman,W.;Meima,M.;Krul,L.Evaluationofmeasurestomitigatemineraloil migrationfromrecycledpaperinfoodpackaging. Packag.Technol.Sci. 2020, 33,531–546.[CrossRef]
84. Peretz,R.;Mamane,H.;Wissotzky,E.;Sterenzon,E.;Gerchman,Y.MakingCardboardandPaperRecyclingMoreSustainable: RecycledPaperSludgeForEnergyProductionandWater-TreatmentApplications. WasteBiomassValoriz. 2021, 12,1599–1608. [CrossRef]
85. Dessì,P.;Porca,E.;Lakaniemi,A.-M.;Collins,G.;Lens,P.N.Temperaturecontrolaskeyfactorforoptimalbiohydrogenproduction fromthermomechanicalpulpingwastewater. Biochem.Eng.J. 2018, 137,214–221.[CrossRef]
86. Kalair,A.R.;Seyedmahmoudian,M.;Stojcevski,A.;Abas,N.;Khan,N.Wastetoenergyconversionforasustainablefuture. Heliyon 2021, 7,e08155.[CrossRef]
87. Saeed,O.F.;Muallah,S.TreatmentofWastePaperUsingUltrasoundandSodiumHydroxideforBioethanolProduction. J.Biotechnol.Res.Cent. 2018, 12,108–114.[CrossRef]
88. Darmawan,M.A.;Hermawan,Y.A.;Samsuri,M.;Gozan,M.Conversionofpaperwastetobioethanolusingselected enzymecombination(cellulaseandcellobiase)throughsimultaneoussaccharificationandfermentation. AIPConf.Proc. 2019, 2085,020018.
89. Branco,R.H.;Serafim,L.S.;Xavier,A.M.Secondgenerationbioethanolproduction:Ontheuseofpulpandpaperindustrywastes asfeedstock. Fermentation 2018, 5,4.[CrossRef]
90. Duncan,S.M.;Alkasrawi,M.;Gurram,R.;Almomani,F.;Wiberley-Bradford,A.E.;Singsaas,E.Papermillsludgeasasourceof sugarsforuseintheproductionofbioethanolandisoprene. Energies 2020, 13,4662.[CrossRef]
91. Wan,X.;Liu,J.;Zhang,Y.;Tian,D.;Liu,Y.;Zhao,L.;Huang,M.;Hu,J.;Shen,F.Conversionofagriculturalandforestrybiomass intobioethanol,water-solublepolysaccharides,andligninnanoparticlesbyanintegratedphosphoricacidplushydrogenperoxide process. Ind.CropsProd. 2023, 191,115969.[CrossRef]
92. Abushammala,H.;Hashaikeh,R.EnzymatichydrolysisofcelluloseandtheuseofTiO2nanoparticlestoopenupthecellulose structure. BiomassBioenergy 2011, 35,3970–3975.[CrossRef]
93. Mendes,C.t.V.;Rocha,J.M.;Carvalho,M.G.A.V.Valorizationofresidualstreamsfrompulpandpapermills:Pretreatmentand bioconversionofprimarysludgetobioethanol. Ind.Eng.Chem.Res. 2014, 53,19398–19404.[CrossRef]
94. Ioelovich,M.Wastepaperaspromisingfeedstockforproductionofbiofuel. J.Sci.Res.Rep 2014, 3,905–917.[CrossRef][PubMed]
95.Shi,A.Z.;Koh,L.P.;Tan,H.T.Thebiofuelpotentialofmunicipalsolidwaste. GcbBioenergy 2009, 1,317–320.[CrossRef]
96. Khan,M.A.H.;Bonifacio,S.;Clowes,J.;Foulds,A.;Holland,R.;Matthews,J.C.;Percival,C.J.;Shallcross,D.E.Investigationof biofuelasapotentialrenewableenergysource. Atmosphere 2021, 12,1289.[CrossRef]
97. Prasetyo,J.;Naruse,K.;Kato,T.;Boonchird,C.;Harashima,S.;Park,E.Y.Bioconversionofpapersludgetobiofuelbysimultaneous saccharificationandfermentationusingacellulaseofpapersludgeoriginandthermotolerantSaccharomycescerevisiaeTJ14. Biotechnol.Biofuels 2011, 4,35.[CrossRef]
98. Wang,L.;Sharifzadeh,M.;Templer,R.;Murphy,R.J.Bioethanolproductionfromvariouswastepapers:Economicfeasibilityand sensitivityanalysis. Appl.Energy 2013, 111,1172–1182.[CrossRef]
99. Park,H.;Cruz,D.;Tiller,P.;Johnson,D.K.;Mittal,A.;Jameel,H.;Venditti,R.;Park,S.Effectofashinpapersludgeonenzymatic hydrolysis. BiomassBioenergy 2022, 165,106567.[CrossRef]
100. Mendes,C.V.;Cruz,C.H.;Reis,D.F.;Carvalho,M.G.V.;Rocha,J.M.Integratedbioconversionofpulpandpaperprimarysludgeto secondgenerationbioethanolusingSaccharomycescerevisiaeATCC26602. Bioresour.Technol. 2016, 220,161–167.[CrossRef] [PubMed]
101. Hren,R.;Vujanovi´c,A.;VanFan,Y.;Klemeš,J.J.;Krajnc,D.; ˇ Cuˇcek,L.Hydrogenproduction,storageandtransportforrenewable energyandchemicals:Anenvironmentalfootprintassessment. Renew.Sustain.EnergyRev. 2023, 173,113113.[CrossRef]
102.Zhu,M.-J.;Lin,H.-N.Biohydrogenproductionfromwastebiomass. TrendsRenew.Energy 2016, 2,54–55.[CrossRef]
103. Baloch,M.Y.J.;Talpur,S.A.;Iqbal,J.;Munir,M.;Bajwa,K.;Baidya,P.;Talpur,H.A.ReviewPaperProcessDesignforBiohydrogen ProductionfromWasteMaterialsandItsApplication. Sustain.Environ. 2022, 7,2022.
104. Rogeri,R.C.;Fuess,L.T.;Eng,F.;doValeBorges,A.;deAraujo,M.N.;Damianovic,M.H.R.Z.;daSilva,A.J.StrategiestocontrolpH inthedarkfermentationofsugarcanevinasse:Impactsonsulfatereduction,biohydrogenproductionandmetabolitedistribution. J.Environ.Manag. 2023, 325,116495.[CrossRef]
105. Qin,Y.;Li,L.;Wu,J.;Xiao,B.;Hojo,T.;Kubota,K.;Cheng,J.;Li,Y.-Y.Co-productionofbiohydrogenandbiomethanefromfood wasteandpaperwasteviarecirculatedtwo-phaseanaerobicdigestionprocess:Bioenergyyieldsandmetabolicdistribution. Bioresour.Technol. 2019, 276,325–334.[CrossRef]
106. Xiao,B.;Zhang,W.;Yi,H.;Qin,Y.;Wu,J.;Liu,J.;Li,Y.-Y.Biogasproductionbytwo-stagethermophilicanaerobicco-digestionof foodwasteandpaperwaste:Effectofpaperwasteratio. Renew.Energy 2019, 132,1301–1309.[CrossRef]
107. Ofoefule,A.U.;Nwankwo,J.I.;Ibeto,C.N.BiogasProductionfromPaperWasteanditsblendwithCowdung. Adv.Appl.Sci.Res. 2010, 1,1–8.
108. Priadi,C.;Wulandari,D.;Rahmatika,I.;Moersidik,S.S.Biogasproductionintheanaerobicdigestionofpapersludge. APCBEE Procedia 2014, 9,65–69.[CrossRef]
109. Bakraoui,M.;Karouach,F.;Ouhammou,B.;Aggour,M.;Essamri,A.;ElBari,H.Biogasproductionfromrecycledpapermill wastewaterbyUASBdigester:Optimalandmesophilicconditions. Biotechnol.Rep. 2020, 25,e00402.[CrossRef]
110. Qin,Y.;Wu,J.;Xiao,B.;Hojo,T.;Li,Y.-Y.Biogasrecoveryfromtwo-phaseanaerobicdigestionoffoodwasteandpaperwaste: Optimizationofpaperwasteaddition. Sci.TotalEnviron. 2018, 634,1222–1230.[CrossRef][PubMed]
111. Rodriguez,C.;Alaswad,A.;El-Hassan,Z.;Olabi,A.-G.Mechanicalpretreatmentofwastepaperforbiogasproduction. Waste Manag. 2017, 68,157–164.[CrossRef]
112. Getahun,T.;Gebrehiwot,M.;Ambelu,A.;VanGerven,T.;VanderBruggen,B.Thepotentialofbiogasproductionfrommunicipal solidwasteinatropicalclimate. Environ.Monit.Assess. 2014, 186,4637–4646.[CrossRef][PubMed]
113. Ekstrand,E.-M.;Hedenström,M.;Svensson,B.H.;Yekta,S.S.;Björn,A.Methanepotentialsandorganicmattercharacterization ofwoodfibresfrompulpandpapermills:Theinfluenceofrawmaterial,pulpingprocessandbleachingtechnique. Biomass Bioenergy 2020, 143,105824.[CrossRef]
114. Li,X.;Zhang,C.;Li,Y.;Zhi,Q.Thestatusofmunicipalsolidwasteincineration(MSWI)inChinaanditscleandevelopment. EnergyProcedia 2016, 104,498–503.[CrossRef]
115. Tan,S.;Hashim,H.;Lee,C.;Taib,M.R.;Yan,J.Economicalandenvironmentalimpactofwaste-to-energy(WTE)alternativesfor wasteincineration,landfillandanaerobicdigestion. EnergyProcedia 2014, 61,704–708.[CrossRef]
116. Assamoi,B.;Lawryshyn,Y.Theenvironmentalcomparisonoflandfillingvs.incinerationofMSWaccountingforwastediversion. WasteManag. 2012, 32,1019–1030.[CrossRef][PubMed]
117. Joseph,A.M.;Snellings,R.;VandenHeede,P.;Matthys,S.;DeBelie,N.Theuseofmunicipalsolidwasteincinerationashin variousbuildingmaterials:ABelgianpointofview. Materials 2018, 11,141.[CrossRef][PubMed]
118. Li,C.;Yang,L.;Liu,X.;Yang,Y.;Qin,L.;Li,D.;Liu,G.BridgingtheenergybenefitandPOPsemissionriskfromwasteincineration. Innovation 2021, 2,100075.[CrossRef]
119. Magnanelli,E.;Tranås,O.L.;Carlsson,P.;Mosby,J.;Becidan,M.Dynamicmodelingofmunicipalsolidwasteincineration. Energy 2020, 209,118426.[CrossRef]
120. Pirotta,F.;Ferreira,E.;Bernardo,C.EnergyrecoveryandimpactonlanduseofMaltesemunicipalsolidwasteincineration. Energy 2013, 49,1–11.[CrossRef]
121. Wang,L.;Templer,R.;Murphy,R.J.ALifeCycleAssessment(LCA)comparisonofthreemanagementoptionsforwastepapers: Bioethanolproduction,recyclingandincinerationwithenergyrecovery. Bioresour.Technol. 2012, 120,89–98.[CrossRef][PubMed]
122. Tang,P.;Florea,M.;Spiesz,P.;Brouwers,H.Characteristicsandapplicationpotentialofmunicipalsolidwasteincineration (MSWI)bottomashesfromtwowaste-to-energyplants. Constr.Build.Mater. 2015, 83,77–94.[CrossRef]
123. Luo,H.;Cheng,Y.;He,D.;Yang,E.-H.Reviewofleachingbehaviorofmunicipalsolidwasteincineration(MSWI)ash. Sci.Total Environ. 2019, 668,90–103.[CrossRef][PubMed]
124. Peretz,R.;Sterenzon,E.;Gerchman,Y.;Vadivel,V.K.;Luxbacher,T.;Mamane,H.Nanocelluloseproductionfromrecycledpaper millsludgeusingozonationpretreatmentfollowedbyrecyclablemaleicacidhydrolysis. Carbohydr.Polym. 2019, 216,343–351. [CrossRef][PubMed]
125. Gibril,M.E.;Lekha,P.;Andrew,J.;Sithole,B.;Tesfaye,T.;Ramjugernath,D.Beneficiationofpulpandpapermillsludge: Productionandcharacterisationoffunctionalisedcrystallinenanocellulose. CleanTechnol.Environ.Policy 2018, 20,1835–1845. [CrossRef]
126. Cheng,M.;Qin,Z.;Chen,Y.;Hu,S.;Ren,Z.;Zhu,M.Efficientextractionofcellulosenanocrystalsthroughhydrochloricacid hydrolysiscatalyzedbyinorganicchloridesunderhydrothermalconditions. ACSSustain.Chem.Eng. 2017, 5,4656–4664. [CrossRef]
127. Nechyporchuk,O.;Belgacem,M.N.;Bras,J.Productionofcellulosenanofibrils:Areviewofrecentadvances. Ind.CropsProd. 2016, 93,2–25.[CrossRef]
128. Yi,T.;Zhao,H.;Mo,Q.;Pan,D.;Liu,Y.;Huang,L.;Xu,H.;Hu,B.;Song,H.Fromcellulosetocellulosenanofibrils—A comprehensivereviewofthepreparationandmodificationofcellulosenanofibrils. Materials 2020, 13,5062.[CrossRef]
129. Michelin,M.;Gomes,D.G.;Romaní,A.;Polizeli,M.d.L.T.;Teixeira,J.A.Nanocelluloseproduction:Exploringtheenzymaticroute andresiduesofpulpandpaperindustry. Molecules 2020, 25,3411.[CrossRef][PubMed]
130. Yeganeh,F.;Behrooz,R.;Rahimi,M.TheeffectofSulfuricacidandMaleicacidoncharacteristicsofnano-celluloseproduced fromwasteofficepaper. Int.J.NanoDimens. 2017, 8,206–215.
131. Maslennikov,A.;Peretz,R.;Vadivel,V.K.;Mamane,H.RecycledPaperSludge(RPS)-DerivedNanocellulose:Production, DetectionandWaterTreatmentApplication. Appl.Sci. 2022, 12,3077.[CrossRef]
132. Ghasemlou,M.;Daver,F.;Ivanova,E.P.;Habibi,Y.;Adhikari,B.Surfacemodificationsofnanocellulose:Fromsynthesisto high-performancenanocomposites. Prog.Polym.Sci. 2021, 119,101418.[CrossRef]
133. Abushammala,H.ASimpleMethodfortheQuantificationofFreeIsocyanatesontheSurfaceofCelluloseNanocrystalsupon CarbamationusingTolueneDiisocyanate. Surfaces 2019, 2,32.[CrossRef]
134. Kumar,R.;Rai,B.;Gahlyan,S.;Kumar,G.Acomprehensivereviewonproduction,surfacemodificationandcharacterizationof nanocellulosederivedfrombiomassanditscommercialapplications. ExpressPolym.Lett. 2021, 15,104–120.[CrossRef]
135. Abushammala,H.ProcessforPreparingIndividualCelluloseNanocrystals,andCelluloseNanocrystalsandUseThereof.U.S. Patent20140083416A1,27March2014.
136. Jung,Y.H.;Chang,T.-H.;Zhang,H.;Yao,C.;Zheng,Q.;Yang,V.W.;Mi,H.;Kim,M.;Cho,S.J.;Park,D.-W.High-performance greenflexibleelectronicsbasedonbiodegradablecellulosenanofibrilpaper. Nat.Commun. 2015, 6,7170.[CrossRef]
137. Abushammala,H.;Mao,J.NovelElectricallyConductiveCelluloseNanocrystalswithaCore-ShellNanostructureTowards BiodegradableElectronics. Nanomaterials 2023, 13,782.[CrossRef]
138. Sabo,R.;Yermakov,A.;Law,C.T.;Elhajjar,R.Nanocellulose-enabledelectronics,energyharvestingdevices,smartmaterialsand sensors:Areview. J.Renew.Mater. 2016, 4,297–312.[CrossRef]
139. Norfarhana,A.;Ilyas,R.;Ngadi,N.Areviewofnanocelluloseadsorptivemembraneasmultifunctionalwastewatertreatment. CarbohydratePolymers 2022, 291,119563.[CrossRef]
140. Abushammala,H.;Hashaikeh,R.;Cooney,C.Microcrystallinecellulosepowdertabletingvianetworkedcellulose-basedgel material. PowderTechnol. 2012, 217,16–20.[CrossRef]
141.Lee,S.-H.;Kim,H.-J.;Kim,J.-C.Nanocelluloseapplicationsfordrugdelivery:Areview. J.For.Environ.Sci. 2019, 35,141–149.
142. Zaki,A.S.C.;Yusoff,N.A.;Rohaizad,N.M.;Sohaimi,K.;Mohamed,A.;Salleh,N.H.M.;Termizi,S.Isolationandcharacterization ofnanocellulosestructurefromwastenewspaper. J.Adv.Res.Eng.Knowl. 2018, 5,27–34.
143. Luo,H.;Cha,R.;Li,J.;Hao,W.;Zhang,Y.;Zhou,F.Advancesintissueengineeringofnanocellulose-basedscaffolds:Areview. Carbohydr.Polym. 2019, 224,115144.[CrossRef]
144. Abushammala,H.;Mao,J.ImpactoftheSurfacePropertiesofCelluloseNanocrystalsontheCrystallizationKineticsof Poly(ButyleneSuccinate). Crystals 2020, 10,196.[CrossRef]
145. Azeredo,H.M.Bacterialcelluloseforediblefilmsandcoatings.InProceedingsofthe4thInternationalSymposiumonBacterial Nanocellulose,Porto,Portugal,3–4October2019.
146. Fürtauer,S.;Hassan,M.;Elsherbiny,A.;Gabal,S.A.;Mehanny,S.;Abushammala,H.CurrentStatusofCellulosicandNanocellulosicMaterialsforOilSpillCleanup. Polymers 2021, 13,2739.[CrossRef]
147. Ferreira,F.V.;Pinheiro,I.F.;deSouza,S.F.;Mei,L.H.;Lona,L.M.Polymercompositesreinforcedwithnaturalfibersand nanocelluloseintheautomotiveindustry:Ashortreview. J.Compos.Sci. 2019, 3,51.[CrossRef]
148. Noor,S.;Anuar,A.;Tamunaidu,P.;Goto,M.;Shameli,K.;AbHalim,M.Nanocelluloseproductionfromnaturalandrecyclable sources:Areview. IOPConf.Ser.EarthEnviron.Sci. 2020, 479,012027.[CrossRef]
149. Balea,A.;Merayo,N.;Negro,C.;Delgado-Aguilar,M.;Mutje,P.;Blanco,A.Cellulosenanofibersfromresiduestoimprovelinting andmechanicalpropertiesofrecycledpaper. Cellulose 2018, 25,1339–1351.[CrossRef]
150. Barbash,V.;Yashchenko,O.;Vasylieva,O.PreparationandapplicationofnanocellulosefromMiscanthus× giganteustoimprove thequalityofpaperforbags. SNAppl.Sci. 2020, 2,727.[CrossRef]
151. Li,A.;Xu,D.;Luo,L.;Zhou,Y.;Yan,W.;Leng,X.;Dai,D.;Zhou,Y.;Ahmad,H.;Rao,J.Overviewofnanocelluloseasadditivesin paperprocessingandpaperproducts. Nanotechnol.Rev. 2021, 10,264–281.[CrossRef]
152. Lei,W.;Zhou,X.;Fang,C.;Li,Y.;Song,Y.;Wang,C.;Huang,Z.Newapproachtorecycleofficewastepaper:Reinforcementfor polyurethanewithnanocellulosecrystalsextractedfromwastepaper. WasteManag. 2019, 95,59–69.[CrossRef][PubMed]
153. Putro,J.N.;Santoso,S.P.;Soetaredjo,F.E.;Ismadji,S.;Ju,Y.-H.Nanocrystallinecellulosefromwastepaper:Adsorbentforazo dyesremoval. Environ.Nanotechnol.Monit.Manag. 2019, 12,100260.[CrossRef]
154. Chen,G.;Wu,G.;Alriksson,B.;Wang,W.;Hong,F.F.;Jönsson,L.J.Bioconversionofwastefibersludgetobacterialnanocellulose anduseforreinforcementofCTMPpapersheets. Polymers 2017, 9,458.[CrossRef]
155. Wang,S.;Wen,Y.;Hammarström,H.;Jönsson,P.G.;Yang,W.Pyrolysisbehaviour,kineticsandthermodynamicdataof hydrothermalcarbonization–Treatedpulpandpapermillsludge. Renew.Energy 2021, 177,1282–1292.[CrossRef]
156. Sadish,O.;Sebastian,S.P.;Banu,K.S.P.;Mahendran,R.Hydrocharasanenergyalternativetocoal:Effectoftemperatureon hydrothermalcarbonizationofpaperboardmillsludge. Int.J.Curr.Microbiol.App.Sci. 2019, 8,1668–1675.[CrossRef]
157. Phuthongkhao,P.;Phasin,K.;Boonma,P.;Khunphonoi,R.;Kanchanatip,E.;Suwannaruang,T.;Shivaraju,H.P.;Wantala,K. Preparationandcharacterizationofhydrothermallyprocessedcarbonaceoushydrocharfrompulpandpapersludgewaste. BiomassConvers.Biorefinery 2023.[CrossRef]
158. Assis,E.I.;Chirwa,E.M.;Tichapondwa,S.M.HydrothermalCarbonizationofDifferentRecyclingPaperMillWasteStreams. Chem.Eng.Trans. 2021, 88,43–48.
159. Zhang,Z.;Zhu,Z.;Shen,B.;Liu,L.Insightsintobiocharandhydrocharproductionandapplications:Areview. Energy 2019, 171,581–598.[CrossRef]
160. Saha,N.;Saba,A.;Saha,P.;McGaughy,K.;Franqui-Villanueva,D.;Orts,W.J.;Hart-Cooper,W.M.;Reza,M.T.Hydrothermal carbonizationofvariouspapermillsludges:Anobservationofsolidfuelproperties. Energies 2019, 12,858.[CrossRef]
161. Assis,E.I.;Gidudu,B.;Chirwa,E.M.Hydrothermalcarbonisationofpapersludge:Effectofprocessconditionsonhydrocharfuel characteristicsandenergyrecyclingefficiency. J.Clean.Prod. 2022, 373,133775.[CrossRef]
162. Wang,T.;Zhai,Y.;Zhu,Y.;Li,C.;Zeng,G.Areviewofthehydrothermalcarbonizationofbiomasswasteforhydrocharformation: Processconditions,fundamentals,andphysicochemicalproperties. Renew.Sustain.EnergyRev. 2018, 90,223–247.[CrossRef]
163. Lin,Y.;Ma,X.;Peng,X.;Hu,S.;Yu,Z.;Fang,S.Effectofhydrothermalcarbonizationtemperatureoncombustionbehaviorof hydrocharfuelfrompapersludge. Appl.Therm.Eng. 2015, 91,574–582.[CrossRef]
164. Gupta,D.;Mahajani,S.;Garg,A.Effectofhydrothermalcarbonizationaspretreatmentonenergyrecoveryfromfoodandpaper wastes. Bioresour.Technol. 2019, 285,121329.[CrossRef]
165. Mäkelä,M.;Benavente,V.;Fullana,A.Hydrothermalcarbonizationofindustrialmixedsludgefromapulpandpapermill. Bioresour.Technol. 2016, 200,444–450.[CrossRef]
166. Berge,N.D.;Ro,K.S.;Mao,J.;Flora,J.R.;Chappell,M.A.;Bae,S.Hydrothermalcarbonizationofmunicipalwastestreams. Environ. Sci.Technol. 2011, 45,5696–5703.[CrossRef]
167. Nguyen,L.H.;Nguyen,X.H.;Nguyen,N.D.K.;Van,H.T.;Le,H.N.;Pham,V.D.;Nguyen,N.A.;Nguyen,T.P.;Nguyen,T.H. H2O2modified-hydrocharderivedfrompaperwastesludgeforenrichedsurfacefunctionalgroupsandpromotedadsorptionto ammonium. J.TaiwanInst.Chem.Eng. 2021, 126,119–133.[CrossRef]
168. Nguyen,L.H.;Van,H.T.;Chu,T.H.H.;Nguyen,T.H.V.;Nguyen,T.D.Paperwastesludge—Derivedhydrocharmodifiedby iron(III)chlorideforenhancementofammoniumadsorption:Anadsorptionmechanismstudy. Environ.Technol.Innov. 2021, 21,101223.[CrossRef]
169. Assis,E.I.;Chirwa,E.M.Physicochemicalcharacteristicsofdifferentpulpandpapermillwastestreamsforhydrothermal conversion. Chem.Eng.Trans. 2021, 86,607–612.
170.Gavrilescu,D.Energyfrombiomassinpulpandpapermills. Environ.Eng.Manag.J. 2008, 7,537–546.[CrossRef]
171. Hospodarova,V.;Stevulova,N.;Briancin,J.;Kostelanska,K.Investigationofwastepapercellulosicfibersutilizationintocement basedbuildingmaterials. Buildings 2018, 8,43.[CrossRef]
172.Shermale,Y.;Varma,M.Papercrete:Anefficientuseofwastepaper. RecentTrendsCiv.Eng.Technol. 2015, 15,54–59.
173. Akinwumi,I.I.;Olatunbosun,O.M.;Olofinnade,O.M.;Awoyera,P.O.Structuralevaluationoflightweightconcreteproduced usingwastenewspaperandofficepaper. Civ.Environ.Res. 2014, 6,160–167.
174. Sangrutsamee,V.;Srichandr,P.;Poolthong,N.Re-pulpedwastepaper-basedcompositebuildingmaterialswithlowthermal conductivity. J.AsianArchit.Build.Eng. 2012, 11,147–151.[CrossRef]
175. Pahusuwanno,P.;Chakartnarodom,P.;Ineure,P.;Prakaypan,W.Theinfluencesofchemicaltreatmentonrecycledrejectedfiber cementusedasfillersinthefibercementproducts. J.Met.Mater.Miner. 2019, 29,3.
176. Sutcu,M.;delCozDíaz,J.J.;Rabanal,F.P.Á.;Gencel,O.;Akkurt,S.Thermalperformanceoptimizationofhollowclaybricksmade upofpaperwaste. EnergyBuild. 2014, 75,96–108.[CrossRef]
177. Goel,G.;Vasi´c,M.V.;Katiyar,N.K.;Kirthika,S.;Pezo,M.;Dinakar,P.Potentialpathwayforrecyclingofthepapermillsludge compostforbrickmaking. Constr.Build.Mater. 2021, 278,122384.[CrossRef]
178. Azmi,A.N.;Fauzi,M.A.;Nor,M.D.;Ridzuan,A.R.M.;Arshad,M.F.ProductionofControlledLowStrengthMaterialUtilizing WastePaperSludgeAshandRecycledAggregateConcrete. MATECWebConf. 2016, 47,01011.[CrossRef]
179. Tang,Z.;Li,W.;Tam,V.W.;Xue,C.Advancedprogressinrecyclingmunicipalandconstructionsolidwastesformanufacturing sustainableconstructionmaterials. Resour.Conserv.Recycl.X 2020, 6,100036.[CrossRef]
180. Mavroulidou,M.Useofwastepapersludgeashasacalcium-basedstabiliserforclaysoils. WasteManag.Res. 2018, 36,1066–1072. [CrossRef]
181. Mäkelä,M.;Watkins,G.;Pöykiö,R.;Nurmesniemi,H.;Dahl,O.Utilizationofsteel,pulpandpaperindustrysolidresiduesin forestsoilamendment:Relevantphysicochemicalpropertiesandheavymetalavailability. J.Hazard.Mater. 2012, 207,21–27. [CrossRef]
182. Nafees,M.;Baig,S.A.;Zahid,S.Chemicalcompositionandnutritionalvaluesofpulpandpapermillsludgecompost.2018. Availableonline: https://www.researchgate.net/profile/Nafees-Mohammad/publication/327982232_Chemical_composition_ and_nutritional_values_of_pulp_and_paper_mill_sludge_compost/links/5bb1f70ea6fdccd3cb80b209/Chemical-compositionand-nutritional-values-of-pulp-and-paper-mill-sludge-compost.pdf (accessedon17January2023).[CrossRef]
183. Gopinathan,M.;Thirumurthy,M.Evaluationofphytotoxicityforcompostfromorganicfractionofmunicipalsolidwasteand paper&pulpmillsludge. Environ.Res.Eng.Manag. 2012, 59,47–51.
184.Cooperband,L. TheArtandScienceofComposting;CenterforIntegratedAgriculturalSystems:Madison,WI,USA,2002.
185. Ahmed,S.;Hall,A.;Ahmed,S.BiodegradationofDifferentTypesofPaperinaCompostEnvironment.InProceedingsofthe5th InternationalConferenceonNaturalSciencesandTechnology(ICNST’18)March,Chittagong,Bangladesh,30–31March2018; pp.30–31.
186. Zawadzi´nska,A.;Salachna,P.;Nowak,J.S.;Kowalczyk,W.;Piechocki,R.;Łopusiewicz,Ł.;Pietrak,A.CompostBasedonPulp andPaperMillSludge,Fruit-VegetableWaste,MushroomSpentSubstrateandRyeStrawImprovesYieldandNutritionalValue ofTomato. Agronomy 2021, 12,13.[CrossRef]
187. Wahyuningsih,S.ApplicationofpulpandpapersludgecompostonAnthocephaluscadambaseedlingsinultisolandpeatmedia. IOPConf.Ser.EarthEnviron.Sci. 2020, 415,012021.[CrossRef]
188. Rosazlin,A.;Fauziah,C.;WanRasidah,K.;Rosenani,A.;Kala,D.Assessmentonthequalityofrecycledpapermillsludgemixed withoilpalmemptyfruitbunchcompost. Malays.J.SoilSci. 2011, 15,49–62.
189. Ghulam,S.T.;Abushammala,H.ChallengesandOpportunitiesintheManagementofElectronicWasteandItsImpactonHuman HealthandEnvironment. Sustainability 2023, 15,1837.[CrossRef]
190. Okan,M.;Aydin,H.M.;Barsbay,M.Currentapproachestowastepolymerutilizationandminimization:Areview. J.Chem. Technol.Biotechnol. 2019, 94,8–21.[CrossRef]
191. Moult,J.;Allan,S.;Hewitt,C.;Berners-Lee,M.GreenhousegasemissionsoffoodwastedisposaloptionsforUKretailers. Food Policy 2018, 77,50–58.[CrossRef]
192. Piippo,S.;Lauronen,M.;Postila,H.Greenhousegasemissionsfromdifferentsewagesludgetreatmentmethodsinnorth. J.Clean. Prod. 2018, 177,483–492.[CrossRef]
193. Chan,Y.C.;Sinha,R.K.;Wang,W.Emissionofgreenhousegasesfromhomeaerobiccomposting,anaerobicdigestionand vermicompostingofhouseholdwastesinBrisbane(Australia). WasteManag.Res. 2011, 29,540–548.[CrossRef]
194. Kristanto,G.A.;Koven,W.EstimatinggreenhousegasemissionsfrommunicipalsolidwastemanagementinDepok,Indonesia. CityEnviron.Interact. 2019, 4,100027.[CrossRef]
195. Baldasano,J.M.;Soriano,C.Emissionofgreenhousegasesfromanaerobicdigestionprocesses:Comparisonwithothermunicipal solidwastetreatments. WaterSci.Technol. 2000, 41,275–282.[CrossRef][PubMed]
Disclaimer/Publisher’sNote: Thestatements,opinionsanddatacontainedinallpublicationsaresolelythoseoftheindividual author(s)andcontributor(s)andnotofMDPIand/ortheeditor(s).MDPIand/ortheeditor(s)disclaimresponsibilityforanyinjuryto peopleorpropertyresultingfromanyideas,methods,instructionsorproductsreferredtointhecontent.
ARPIT BHATT,1 VIKRAM RAVI,1 YIMIN ZHANG,1 GARVIN HEATH,1 RYAN DAVIS,2 & ERIC C.D. TAN2.
Boilers are combustion devices that provide process heat and are integral to many industrial facilities. Historically, outside of the pulp and paper industry, most boilers burned fossil fuels, although interest in decarbonization has been leading to an increased use of renewable fuels in boilers. These boilers, including those in the biorefineries, are often large sources of air pollutant emissions, and the characterization of these emissions is critical to obtaining air permits and ensuring protection of the surrounding air quality. Several industrial boilers and new biorefineries allow utilization of biomass-derived fuels (e.g. wastewater sludge, lignin, etc.) produced during their operation as a fuel for the boiler to meet process energy needs. However, there is limited empirical data on emission factors for the burning of unconventional fuels, such as solid-gas mixtures containing biomass residues. To fill this gap, we carry out a comprehensive data survey, collecting information on emission factors for boilers burning either a single or a mixture of solid and gaseous biomassderived fuels. We review multiple hard-to-obtain and unconventional data sources, such as air permit applications, stack test data, and industry-sponsored data collection efforts, to compile emission factors for biomass-derived fuels. We then compare this data with wood residue emission factors from the U.S. Environmental Protection Agency’s AP-42 emission factor database. Our results indicate that the emission factors for boilers burning unconventional fuels vary widely depending on the fuel composition, boiler type, and fuel characteristics. Overall, we find that median emission factors of selected biomass-derived fuels are typically lower than those of wood residue boilers in AP-42. The information collected herein could be useful to permitting agencies and industries utilizing boilers who may want to reduce the carbon impact of their facilities by combusting biomass-derived wastes for process energy needs, for more accurate emission estimation for permitting.
Implications: Emission factors are often used for air permitting, specifically for emission estimation purposes. This study carries out a comprehensive data survey of emission factors burning unconventional biomassderived fuels from underutilized sources such as air permits, stack test data, and industry-led efforts, and compare the results to EPA’s wood residue emission factor database. The results from this study can be used can be used by multiple stakeholders such as air permitting agencies, industries burning biomassderived fuels, and biorefineries, that utilize more advanced boiler technologies. The findings can help mitigate risks to industry owners and operators and helps to avoid delays in obtaining the required air permits that arise due to inappropriate emission estimates in permit applications.
Contact information:
1. Strategic Energy Analysis Center, National Renewable Energy Laboratory, Golden, CO, USA.
2. Catalytic Carbon Transformation and Scale-Up Center, National Renewable Energy Laboratory, Golden, CO, USA
JOURNAL OF THE AIR & WASTE MANAGEMENT ASSOCIATION 2023, VOL. 73, NO. 4, 241 –257. https://doi.org/10.1080/10962247.2023.2166158
Creative Commons Attribution 4.0 International License
The Paper Industry Technical Association (PITA) is an independent organisation which operates for the general benefit of its members – both individual and corporate – dedicated to promoting and improving the technical and scientific knowledge of those working in the UK pulp and paper industry. Formed in 1960, it serves the Industry, both manufacturers and suppliers, by providing a forum for members to meet and network; it organises visits, conferences and training seminars that cover all aspects of papermaking science. It also publishes the prestigious journal Paper Technology International® and the PITA Annual Review , both sent free to members, and a range of other technical publications which include conference proceedings and the acclaimed Essential Guide to Aqueous Coating.
JOURNAL OF THE AIR & WASTE MANAGEMENT ASSOCIATION
2023, VOL. 73, NO. 4, 241–257
https://doi.org/10.1080/10962247.2023.2166158
ABSTRACT
Boilers are combustion devices that provide process heat and are integral to many industrial facilities. Historically, outside of the pulp and paper industry, most boilers burned fossil fuels, although interest in decarbonization has been leading to an increased use of renewable fuels in boilers. These boilers, including those in the biorefineries, are often large sources of air pollutant emissions, and the characterization of these emissions is critical to obtaining air permits and ensuring protection of the surrounding air quality. Several industrial boilers and new biorefineries allow utilization of biomassderived fuels (e.g. wastewater sludge, lignin, etc.) produced during their operation as a fuel for the boiler to meet process energy needs. However, there is limited empirical data on emission factors for the burning of unconventional fuels, such as solid-gas mixtures containing biomass residues. To fill this gap, we carry out a comprehensive data survey, collecting information on emission factors for boilers burning either a single or a mixture of solid and gaseous biomass-derived fuels. We review multiple hard-to-obtain and unconventional data sources, such as air permit applications, stack test data, and industry-sponsored data collection efforts, to compile emission factors for biomass-derived fuels. We then compare this data with wood residue emission factors from the U.S. Environmental Protection Agency’s AP-42 emission factor database. Our results indicate that the emission factors for boilers burning unconventional fuels vary widely depending on the fuel composition, boiler type, and fuel characteristics. Overall, we find that median emission factors of selected biomass-derived fuels are typically lower than those of wood residue boilers in AP-42. The information collected herein could be useful to permitting agencies and industries utilizing boilers who may want to reduce the carbon impact of their facilities by combusting biomass-derived wastes for process energy needs, for more accurate emission estimation for permitting.
Implications: Emission factors are often used for air permitting, specifically for emission estimation purposes. This study carries out a comprehensive data survey of emission factors burning unconventional biomass-derived fuels from underutilized sources such as air permits, stack test data, and industry-led efforts, and compare the results to EPA’s wood residue emission factor database. The results from this study can be used can be used by multiple stakeholders such as air permitting agencies, industries burning biomass-derived fuels, and biorefineries, that utilize more advanced boiler technologies. The findings can help mitigate risks to industry owners and operators and helps to avoid delays in obtaining the required air permits that arise due to inappropriate emission estimates in permit applications.
The industrial sector uses energy in a number of ways, including (1) raising the temperature of materials in the manufacturing process, i.e., process heating (43% share of total energy use), and (2) feeding a boiler that generates steam or hot water (15% share of total energy use) (Office of Energy Efficiency and Renewable Energy 2018). Boilers are typically an essential operation, converting water into steam at desired pressure and temperature conditions (Reynolds 1961). This steam is utilized to fulfill the heat demands of the industrial plant, as a fuel to power turbines for electricity generation, or to power the plant’s heating
PAPER HISTORY
Received September 9, 2022
Revised December 5, 2022
Accepted December 27, 2022
and cooling units to maintain proper operating temperatures (Allen’s Tristate Mechanical 2017). Boilers are used in power plants and industrial facilities, including chemical industries, petroleum refineries, wastewater treatment plants, and pulp and paper industry (Nielsen et al. 2000; Singh et al. 2018). The common types of fuels utilized in industrial boilers include coal, oil, and natural gas. Although the use of fossil-derived fuels in industrial applications is common practice, they contribute to criteria and hazardous air pollutants that impact air quality and human health (Carreras-Sospedra, Williams, and Dabdub 2016; Meyer and Leung 2018; Tucki et al. 2020).
CONTACT Arpit Bhatt arpit.bhatt@nrel.gov Strategic Energy Analysis Center, National Renewable Energy Laboratory, 15013 Denver W Parkway, Golden, CO 80401, USA.
Supplemental data for this article can be accessed online at https://doi.org/10.1080/10962247.2023.2166158
© 2023 The Author(s). Published with license by Taylor & Francis Group, LLC. This is an Open Access article distributed under the terms of the Creative Commons Attribution-NonCommercial-NoDerivatives License (http://creativecommons.org/licenses/by-ncnd/4.0/), which permits non-commercial re-use, distribution, and reproduction in any medium, provided the original work is properly cited, and is not altered, transformed, or built upon in any way.
Although most industrial boilers utilize fossil-based fuels, some industries, like pulp and paper, utilize alternative biomass-based fuels such as black liquor (a waste product from the chemical pulping process) along with bark, wood chips, and production wastes (Energy and Environmental Analysis, Inc. 2005). Biorefineries, which produce biofuels from biomass, also have opportunities to utilize their renewable waste streams as boiler fuels to meet their heat and power needs in an energy self-sufficient manner. For example, biorefineries using biochemical conversion processes yield several biomass-derived waste streams, including lignin, biogas, sludge, and off-gases, which can be used as fuels in boilers. Research has shown that biomass fuels from wood and plant residues are important sources of primary energy, accounting for about 13% of global fuel consumption (Slade, Bauen, and Gross 2014).
The most common type of boiler commercially utilized for biomass combustion is a fluidized bed boiler (Anthony 1995; Singh et al. 2018), with stoker-fired boilers, originally utilized for coal and wood combustion, also being used for biomass combustion as well. Through thermodegradation and oxidation reactions, burning biomass results in emissions of several criteria and toxic air pollutants (Ushakova et al. 2017). These pollutants include carbon monoxide (CO), nitrogen oxides (NOx), sulfur oxides (SOx), hydrocarbons/volatile organic compounds (VOCs), and particulate matter (PM; PM includes filterable PM [PMf] that can be captured on a filter, and condensable PM [PMc], which is in the gas phase when exiting the stack, but rapidly condenses to form submicron particles once exposed to atmospheric conditions). CO emissions are mainly from incomplete combustion of biomass fuels. NOx emissions are predominantly from nitrogen in the fuel (Mitchell et al. 2016), referred to as fuel-bound NOx, but a smaller portion comes from thermal NOx, which produces NOx from nitrogen in the atmosphere reacting within the flame. SO2 emissions from biomass combustion result from sulfur in the fuel, whereas PM is a result of incomplete combustion, the presence of inert material in the fuel, and an improper air/fuel ratio (Jenkins et al. 1998).
Because boilers can be the largest emission sources for certain pollutants within biorefineries (e.g., boilers contribute the largest fraction of some gaseous pollutants, and PM emissions have been attributed to boilers in some studies), it is important to characterize their emissions and develop control strategies to protect air quality when building a new biorefinery with an on-site boiler. To maintain compliance with the National Ambient Air Quality Standards (NAAQS) (EPA 1970), the U.S. Environmental Protection Agency (EPA) sets emission standards for new and modified stationary pollution sources and/or unit operations, such as boilers, under
the New Source Performance Standards (NSPS) and National Emission Standards for Hazardous Air Pollutants (NESHAP) in the form of emission limits (Federal Register 2017; Federal Register, NSPS 2023). The emission limits in the federal standards control the emissions of pollutants, generally defined as a parameter that relates the quantity of a pollutant with the activity associated with release of that pollutant, also known as the emission factor (EPA 2022). In the case of boilers, burning fuel is considered an activity whose emission factor is expressed as the weight of the pollutant (pounds, kilograms, etc.) divided by the heat input capacity of the boiler (British thermal units or standard cubic feet).
Although emission factors have been used in preparing the national and regional emissions inventory and designing emission control strategies, they are often also used for other purposes, such as air permitting. The current data and guidelines published in EPA’s emission factor database (AP-42) address emission factors for boilers burning coal, natural gas, fuel oil, wood, and wood residues (EPA 2009). These emission factors typically represent average emissions based on emission testing and monitoring of data collected during normal operating conditions. Many of the data sources used to calculate the emission factors reported in the AP-42 database were collected 20+ years ago and may not represent the more advanced boiler technologies developed for newly emerging, unconventional fuels (EPA 2009, 2015). Additionally, in some cases (e.g., for boilers using wood residue), the emission factors have low reliability ratings. For example, biorefineries can now utilize biomass waste produced on-site as boiler fuel(s); the existing AP-42 emission factors for wood and wood residues are likely inaccurate for these boilers.
Factors affecting the types and magnitudes of emissions from the boiler include fuel type (e.g., gas, biomass, coal, or a mixture), type of boiler (fluidized bed, stoker, etc.), fuel properties (such as sulfur, nitrogen, ash, and moisture content), and firing practices employed by the facility. For example, a biorefinery that utilizes biomass as a feedstock may pretreat the feedstock using sulfuric acid and ammonia to break down the cellulose for further processing (Davis et al. 2022), resulting in much higher levels of nitrogen and sulfuric acid in the boiler fuel downstream than the typical woody biomass. The emission factors of combusting biomass could be considerably different than those of combusting solid fossil fuels such as coal. This is due to biomass’ higher heterogeneous particle size, higher volatility, higher moisture content and oxygen level, and lower sulfur content and energy density. Moreover, the transport-limited devolatilization characteristics of biomass particles could affect carbon conversion, heat release, pollutant generation, ash formation (from silicon, potassium, etc.), and deposition, among others (Panagiotis 2010).
Previous research has investigated emission factors for boilers that combust a mixture of coal and biofuels (Cao et al. 2008; Cheng et al. 2018; Jetter and Kariher 2009; Jetter et al. 2012), but there is a lack of empirical data on emission factors for boilers that burn unconventional biomass-derived fuels. Such an information gap could pose risks to industry owners (specifically biorefineries) and operators, as they may encounter delays in obtaining the required permits prior to construction and operation due to inappropriate emission estimates in their permit applications.
The goal of this study is to carry out a comprehensive survey to identify available information on empirical emission factors for boilers that burn one or a mixture of biomass-derived fuels. We use several existing sources, including little-known/underutilized sources such as permits/permit applications, stack testing, and industrysponsored collection efforts. The information collected and analyzed can be useful to a broad audience, including federal and state air quality planners, permit writers, industrial facilities utilizing biomass-derived waste fuels, and biofuel industries and investors, who may have a keen interest in utilizing biomass-derived fuels as a source of process energy. Our research aims to leverage previous research that is less known to stakeholders, who could benefit from accessing such information. Although our review does not focus on each individual factor mentioned, the reviewed data implicitly incorporates the variability introduced by these factors.
Emissions inventories are important for air quality management and are utilized by local, state, and federal agencies as well as industries and consultants for projecting air quality impacts. Developing an emissions inventory is essential for supporting the development of air permit applications, determining the permitting requirements for a new source or modification of an existing source, projecting future air quality impacts, characterizing pollution transport, and developing emission control strategies (Bhatt et al. 2022; Komariah et al. 2013). Emissions (typically expressed in tons per year) can be calculated or estimated by one or a combination of the several different approaches (no particular order of importance), including:
(a)Emission measurement based on continuous emission monitoring systems
(b)Emission data from performance tests (e.g., by boiler manufacturers, chemical kinetic data from combustion labs, industries using boilers)
(c)Material balance analysis (e.g., amount of sulfur or nitrogen in the feed and product streams)
(d)Emission factors (e.g., EPA’s AP-42 compilation of emission factors (EPA 1995).
In the absence of emission measurements and data from performance tests, emissions from boilers are often estimated based on emission factors (approach d). An emission factor for a boiler is typically expressed as pounds (lbs) of pollutant per million British thermal units (MMBtu) of the boiler heat input capacity (Eberle et al. 2017; Komariah et al. 2013). EPA has compiled emission factors for approximately 200 emission source categories, which are available in the Compilation of Air Pollutant Emissions Factors (AP-42) database. AP-42 emission factors are developed and compiled using data from multiple source tests, material balance studies, and engineering estimates. The most relevant emission factors for burning biomass fuels in a boiler are those in AP-42 Chapter 1.6: “Wood Residue Combustion in Boilers.” The database provides data quality ratings ranging from A to E (with A being the best) for emission factors to indicate the quality and robustness of the data. A rating of D is assigned when the emission factors are developed based on a small number of facilities, and thus are not necessarily representative of the industry, or when there is evidence of variability within the source population. In the case of wood residue combustion, the emission factors were last updated in 2003, and the ratings for the pollutants range from A to D, depending on the type of feedstocks in the industry population. Ratings for several pollutants are poor (C or D), suggesting relatively high uncertainties in the estimates.
Over the last two decades, continued efficiency improvements in industrial boilers have likely led to decreased emission factors (Bowman et al. 2009). The efficiency improvement could be due to several efforts, including boiler design that takes fuel parameters (moisture, density, size) into consideration to maximize combustion efficiency as well as boiler optimization and tuning (through monitoring of temperature, automatic adjustment of air-to-fuel ratios, and fuel feed rate adjustment) (ACHR News 2016; Bases 2011; Industrial Controls 2021).
We focus on emission factors for six criteria air pollutants (NOx, SO2, CO, VOC, Pb, and PM2.5/PM10) as well as selected hazardous air pollutants (HAPs; including acetaldehyde, formaldehyde, and two acid gases –hydrochloric acid [HCl] and hydrogen fluoride [HF]), which are expected to be the major contributors to total
HAP emissions. Because the emission factors from Chapter 1.6 of the AP-42 database are mainly representative of various wood residues burned in the form of hogged wood, bark, sawdust, shavings, chips, mill rejects, sanderdust, or wood trim, they may not accurately represent emissions from boilers burning unconventional biomass fuels. So, our review starts by analyzing unconventional literature sources, such as technical reports, industry-sponsored surveys, permits and permit applications, and stack testing, that do not appear in typical online search engines and bibliographic databases. Where appropriate, we use a material balance approach to estimate emission factors for certain pollutants. We then compare the emission factors collected from these data sources with those for wood residue combustion in boilers in AP-42. We made the following efforts to identify emission data from boilers that burn unconventional fuels.
We identified specific operational boilers that burn unconventional biomass-derived fuel(s) such as sludge, lignin, biogas, off-gases from the plant, etc. and contacted the facilities and the respective state regulatory agencies for air permits and permit applications. Air permits contain detailed information on the emission factors, boiler fuel, and boiler characteristics, which makes them a preferred source of data when information is not available publicly.
We also contacted regulatory agencies for stack test data tied to boilers that burn unconventional biomass fuels. Stack test data is one of the most preferred data sources for estimating emission factors; however, detailed information on control efficiencies, stream characteristics, and operating capacity of the boiler at the time of testing is required for estimating the uncontrolled emission factors, which is not always available in the stack testing reports.
We reviewed publications on emissions from wood combusting boilers, including data collected by the National Council for Air and Stream Improvement (NCASI), an independent research organization established by a consortium of pulp and paper industry members in North America. The data on emission factors from NCASI includes detailed information on boiler feed and composition along with boiler type, which makes it a useful source for characterizing data.
We analyzed the Compliance and Emissions Data Reporting Interface (CEDRI), a U.S. EPA program designed to manage and collect environmental data
submitted to the agency to meet various reporting requirements, for relevant emission factors.
We connected with Consortium for Research on Renewable Industry Materials (CORRIM), a research organization that focuses on developing life cycle assessment-related data specific to the wood industry. CORRIM conducted a survey and collected data from 16 different wood mills located in the northwest and southeast regions of the United States, of which data for 12 mills contained emissions of aerosol and gaseous pollutants we report in this paper.
We analyzed the emission data from each source obtained, which includes boilers burning either a single biomass fuel or a mixture of solid and gaseous biomass fuels. The statistics show a varying range of values depending on the fuel mixture, process technology utilized, variance in time when the data was reported, and other process parameters. Table 1 summarizes the data obtained from our analysis as compared to EPA’s AP-42 emission factor data. A total of five data sources for emission factors are reported. We also include compliance or permit limits specified in permit applications or stack test data when available.
To ensure consistency, we report uncontrolled emission factors for all data sources. In cases where the original data sources do not specify the emission reduction efficiencies, thereby preventing us from back calculating the uncontrolled emission factors, we use the average emission reduction efficiencies for the specific control technologies reported in EPA’s factsheet to estimate the uncontrolled emission factors. Also, we only report certain air toxics (HAPs) because the emission factors for other hazardous pollutants were several orders of magnitude lower and thus, through engineering judgment, considered to be insignificant. We exclude emission data that (1) utilizes fuels containing a large portion of conventional fuels, such as coal or natural gas; and/or (2) does not provide sufficient information on emission controls or boiler heat input capacity to allow us to estimate emission factors. Details on other data sources and air toxics not included in the main paper are in the Supplementary Information (SI). The following subsections describe the detailed results for all the sources considered.
We obtained stack test data on several air pollutants from boilers burning a mixture of solid biomass and gaseous fuel at two facilities: (a) POET Biorefining
Table 1. Summary of data sources obtained in this research for biomass boiler combustion as compared to AP-42 for wood residue combustion. Timeframe refers to the time when the data were collected, not the years in which the boiler was set up.
EPA’s AP-42 DatabaseData Obtained and Compiled in This Research
EPA’s AP-42 Chapter 1.6: “Wood Residue Combustion in Boiler” (published 2003)
Timeframe: 1975–1995
Source emission testing and sampling records from various wood-fired combustion units
Stack Test Data
POET Biorefining (Project Liberty, Iowa) stack test data (published 2015, 2016, 2017, 2019)
Timeframe: 2015–2019
Wisconsin Electric (We) Energies stack test data and air permit application (published 2019)
Timeframe: 2019
Air Permits
Abengoa Bioenergy Biomass of Kansas (ABBK) air permit and application (published 2011 and 2014)
Timeframe: 2011 and 2014
We Energies stack test data and air permit application (published in 2019)
Timeframe: 2019
NCASI Technical Reports
Comprehensive compilation and review of wood-fired boiler emissions (published 2013)
Timeframe: 2009–2012
Comprehensive compilation and review of wood-fired boiler emissions (published 2015)
Timeframe: 2012 and later
Compilation of “air toxic” and total hydrocarbon emissions data for pulp and paper mill sources: a second update (published 2010)
Timeframe: 2004 and before
Methane and nitrous oxide emissions from biomass-fired boilers and recovery furnaces (published 2012)
Timeframe: 2009
EPA’s CEDRI database
○ Timeframe: Unknown
CORRIM survey on emission factors from wood-fired boilers (published 2017)
○ Timeframe: 2012
(Dutch State Mines [DSM] Advanced Biofuels Project Liberty) in Emmetsburg, Iowa, and (b) Wisconsin Electric (We) Energies Biomass Cogeneration facility in Madison, Wisconsin. Biomass Cogeneration facilities produce heat and electricity using biomass wastes. We use the emissions (pounds per hour [lb/hr]) reported in the stack test data and heat input capacities, when available, to estimate the emission factors in lb/MMBtu.
The POET facility utilizes a solid fuel boiler rated at 290 MMBtu/hr (operated at 267 MMBtu/hr) that burns a mixture of biomass, biogas, digester sludge, filter cake, syrup, biomass fines, and net wrap. The emissions of PM, NOx, and SO2 from the boiler are controlled using baghouse, selective noncatalytic reduction (SNCR) and flue gas desulfurization (FGD), respectively. The stack test data covers the years 2015, 2016, 2017, and 2019, with information on fixed boiler nameplate capacity but different operating boiler heat input capacities (ARI Environmental, Inc. 2015, 2016, 2017; Montrose Air Quality Services, LLC. 2019).
We Energies is a 50-MW biomass-fueled cogeneration facility located next to a paper mill facility in Milwaukee,
Wisconsin. The boiler is a circulating fluidized bed boiler rated to operate at 800 MMBtu/hr that burns a mixture of logging residue, wood, bark, wood waste, forest residues, and wastewater sludge. Natural gas is only used for startup. The emissions of PM and NOx from the boiler are controlled using baghouse and SNCR, respectively. We obtained the data on the recent stack testing performed for the facility in 2019 (Wisconsin Department of Natural Resources 2019a).
Table 2 summarizes the operating information on type of feed, operating capacity, control technologies, and year of air permit (refer to SI for detailed information). Figure 1 shows the emission factors reported from stack test data sources described above.
As shown in Figure 1, the stack-test-derived emission factors for the POET Biorefining pollutants are higher than those for We Energies, except for NOx and CO in 2017 and 2019, where POET has lower emission factors. POET does not report any emissions data for PM10, PM2.5, and HF. The emission factors for PMf, PM10, and PM2.5 are estimated to be similar for We Energies and closely match the data reported in AP-42 (0.5 lb/MMBtu and 0.43 lb/MMBtu for PM10 and PM2.5, respectively).
Because POET Biorefining used a technology in which biomass goes through a series of pretreatment steps
(MMBtu/hr)Boiler FeedControl
267Biomass, biogas, digester sludge, filter cake, syrup, biomass fines, and net wrap Selective
We Energies500Logging residue, wood, bark, wood waste, forest residues, wastewater sludge (NG at startup) SNCR, baghouse2019
(utilizing several chemicals to break cell walls so that basic sugar components can be extracted for the downstream fermentation process), it is likely that many unwanted components (e.g., chemicals, enzyme residues) were added to the fuel streams fed to the boiler, increasing emissions. For POET, the emission factors reported for PM, NOx, and CO vary year to year demonstrating wide ranges (note that emission factors for some years are not available from the data source), whereas emission factors for SO2 and VOC are more consistent, ranging from 0.48–0.6 lb/MMBtu and 0.013–0.019 lb/MMBtu, respectively. One possibility is that the variation in fuel compositions could lead to changes in combustion performance and conditions across different years.
We obtained air permit applications and construction permits for two facilities burning biomass fuels in their boilers: Abengoa Bioenergy Biomass of Kansas (ABBK) and We Energies Biomass Cogeneration Facility. Given that the information on emission controls, boiler feed, and boiler heat input capacity is described in detail in the air permits and application, we use the uncontrolled emission factors directly when explicitly reported.
Abengoa Bioenergy Biomass of Kansas (ABBK)
ABBK (not operational as of 2020) was intended to convert biomass to ethanol with a 22-MW cogeneration process that included a biomass boiler rated at 500 MMBtu/hr burning a mixture of lignin, hydrolysis residual stillage syrup, biomass, biogas, and sludge. The application for an air permit to construct was submitted in 2011 (WLA Consulting, Inc. 2011) and was amended in 2014 for the construction of four emergency engines as a prevention of significant deterioration (PSD)1 permit (Burns & McDonnell 2014). The air permit application includes two sets of emission factors for the biomass-fired stoker boiler, one for a nominal typical scenario and
1Prevention
https://www.epa.gov/nsr/ prevention-significant-deterioration-basic-information for details.
another for a maximum worst-case scenario, based on varying blended fuel composition depending on the plant’s steam demand. A nominal typical fuel blend consists of 41.6% lignin-rich stillage, 27.2% ethanol thin stillage syrup, 24.0% corn stover, 6.8% biogas, and 0.40% wastewater sludge, based on dry ton per day feed rates. The emissions of PM and NOx from the boiler were reduced by using baghouse and SNCR, respectively. A scrubber was used to reduce emissions of SO2, VOC, and sulfuric acid. ABBK does not have any stack test data reported in the public domain.
As stated in “Stack test data” Section, the We Energies Biomass Cogeneration Facility operates an 800-MMBtu/ hr circulating fluidized bed boiler. The permit application (Wisconsin Department of Natural Resources 2019b) from 2019 includes controlled emission factors, which we use, along with average destruction efficiencies for emission controls from EPA’s factsheets, to calculate the uncontrolled emission factors (EPA 2016).
Summary of emission factors from air permits
Table 3 summarizes the operating information on type of feed, operating capacity, control technologies, and year of air permit (refer to SI for detailed information). Figure 2 shows the emission factors reported in ABBK’s and We Energies’ air permit applications.
As shown in Figure 2, the emission factors estimated for ABBK are higher than those for We Energies Cogeneration facility for all the pollutants except HF. The pretreatment chemicals used in ABBK that break down cellulose and hemicellulose in the biomass add nitrogen and sulfur downstream of the process (e.g., in the boiler feed), likely increasing the emission rate of NOx and SO2. In ABBK’s permit applications, the emission factors for the maximum worst-case fuel blend include a 20% safety buffer (on a mass basis) applied to the nominal residual components (ethanol lignin-rich stillage and ethanol thin stillage syrup) used as the boiler fuel. This increase in residual components changes the blended biomass fuel composition, leading to a decrease in the overall ash content in the blended biomass and thus lower PM emission factors than the worst-case
of significant deterioration (PSD) applies to new major sources or major modifications at existing sources of pollutants where the area the source is located is in attainment or unclassifiable with the National Ambient Air Quality Standards (NAAQS). See
Data Source Boiler Capacity (MMBtu/hr)Boiler FeedControl Technology Year of Permit
Abengoa Bioenergy Biomass of Kansas
500Lignin, hydrolysis residual stillage syrup, biomass, biogas, and sludge Selective non-catalytic reduction (SNCR), scrubber, baghouse 2011
We Energies800Logging residue, wood, bark, wood waste, forest residues, wastewater sludge (NG at startup) SNCR, baghouse2019
scenario. The HAP emission factors for ABBK are taken from EPA’s Chapter 1.6: “Wood Residue Combustion in Boilers,” whereas We Energies’ permit only lists an HF emission factor, which is higher than that reported by ABBK.
NCASI is an organization that supports environmental science and data to promote the sustainable use of resources and has technical expertise in developing emission factors for the forest product industry,
including wood products manufacturing and forest management (NCASI 2023 ). The technical reports and white papers published by NCASI provide a wealth of information on emission factors related to wood and forest residue combustion. NCASI reports the average emission factors based on statistical analysis NCASI performed using data from several boiler emission sources including EPA’s emission limits as well as stack tests conducted by boiler facilities. These
emission factors reported by NCASI depend on the sources they considered for their analysis, as reported in the next subsections. Because EPA is a member of NCASI, their reports have been made available to the public in EPA libraries. After screening the full catalog of NCASI reports available in EPA libraries, we identified and reviewed three NCASI technical reports relevant to biomass combustion and analyzed the data on emission factors for boilers that burn unconventional
biomass fuels. Below subsections provide an overview of each NCASI technical bulletin, followed by a summary in Section 4.3.4.
Comprehensive compilation and review of wood-fired boiler emissions (Technical bulletin no. 1013)
NCASI technical bulletin no. 1013 summarizes emission factors developed from statistical analysis of stack test data and associated laboratory reports (NCASI 2013). The majority of data was drawn from (1) EPA-mandated major source boiler maximum available control technology (MACT) and commercial and institutional solid waste incineration units (CISWI) testing conducted in 2009 and 2010, (2) testing conducted by individual facilities from 2009 to 2012, and (3) some pre-2009 emission factor data not previously available in the technical bulletins. The emission factors are believed to best characterize pollutant emissions from industrial wood-fired boilers operating in the 2009–2012 timeframe and can be considered to be replacements of the existing emission factors in EPA’s AP-42 Chapter 1.6. The data utilized to develop the emission factors include boilers burning biomass fuels or combinations of biomass and fossil fuels. The biomass fuels include bark, hog fuel, wood chips, sawdust, sanderdust, and planer shavings, which are similar to the biomass fuels represented in EPA’s AP-42 Chapter 1.6: “Wood Residue Combustion in Boilers.”
Comprehensive compilation and review of combination wood-fired boiler emissions (Technical bulletin no. 1026)
NCASI technical bulletin no. 1026 summarizes emission factors for boilers that burn wood in conjunction with at least one other nontraditional fuel, such as tire-derived fuel, petroleum coke, dewatered pulp mill sludge, or old corrugated container recycling rejects (NCASI 2015). The bulletin contains information on emission factors from individual facilities’ stack testing data. From this bulletin, we chose to analyze the relevant emission factors for five facilities that either burn 100% nontraditional fuel (e.g., sludge) or burn wood in conjunction with other fuels in a boiler. These boilers include:
(a)A fluidized bed boiler (78.7 MMBtu/hr) burning 100% wastepaper sludge, equipped with baghouse and SNCR controls.
(b)A stoker boiler (160.4 MMBtu/hr) burning 39%–59% bark (mass basis), with the remaining fuel being deinking sludge and mechanical pulping sludge, equipped with a wet scrubber control.
(c)A stoker boiler (103.5 MMBtu/hr) burning 80% wood bark and 20% deinking sludge (mass basis), equipped with an electrostatic precipitator control.
(d)A stoker boiler (349.2 MMBtu/hr) burning 71% bark and 29% wastewater residuals (mass basis), equipped with an electrostatic precipitator (ESP) control.
(e)A fluidized bed boiler (210 MMBtu/hr) burning 76% bark, 21% sludge (municipal solid waste), and 3% gas (mass basis), equipped with a baghouse control.
Compilation of “air toxic” and total hydrocarbon emissions data for pulp and paper mill sources: a second update (Technical bulletin no. 973)
The data reported in technical bulletin no. 973 is based on 64 wood-fired boilers, all of which burn inland wood residues (NCASI 2010). In their analysis, NCASI applied advanced statistical techniques to detect outliers, which were then excluded from the reported data. The bulletin does not provide raw data, and only a summary was available. The bulletin contains data on emissions of more than 75 different air toxics. Among these emitted air toxics, the predominant pollutant species are acetaldehyde, formaldehyde, and benzene. The emissions from this source are shown as “NCASI Pulp and Paper” in Figure 3
Figure 3 shows the emission factors for air pollutants from statistical analysis of several sources along with specific emission factors associated with boilers that burn a combination of unconventional fuels.
As shown in Figure 3, the emission factors reported by NCASI across several technical bulletins vary considerably for all pollutants. One explanation for the large variations could be that NCASI reports average numbers based on detailed statistical procedure applied to the data from boilers of several facilities, whose fuel composition information is not always available. Depending on the blend of the fuel (amount of sulfur, nitrogen, ash, etc.) and the boiler type, the emissions of pollutants vary significantly. When fuel composition data for individual facilities are available, it helps us identify factors that may have caused the variations in the emission factors. For example, the highest emission factor for PM is reported for facilities that burn the maximum proportion of wood in the fuel mixture (i.e., 100% bark and wet wood or 71% wood and 29% wastewater residuals), mainly due to the high ash content. For NOx and CO, the emission factors reported in MACT/CISWI testing were the highest, followed by boilers burning 49% wood
and 51% sludge. The reported emission factor for SO2 is highest for boilers burning 49% wood and 51% sludge, which could be because of the high sulfur content in the sludge. The reported VOC emission factors are much lower compared to other pollutants. The emission factors reported by NCASI technical bulletins are based on
data obtained from several biomass combustion sources across years, shown as a mean value. Moreover, the feed composition varies from other data sources, resulting in discrepancies among air pollutant emission factors when compared with each other. This explains why the emission factors reported by NCASI may be several orders of
magnitude higher or lower than either stack test or air permit data, depending on the type of feed, composition and moisture content, and type of boiler.
CORRIM did a survey to collect data on emission factors from 12 wood production facilities in the Pacific Northwest and Southeast United States, with an equal number of facilities surveyed in each region (Puettmann and Milota 2017). The data was collected for the boilers operating in the 2012 calendar year, with a mass weighted average fuel composition of 65.9% hog fuel, 13.5% sawdust, 10.7% shavings, and 9.4% wood and bark. The boiler ages were between 4 and 32 years, with most boilers at the lower end of the age limit and thus likely representing recent technology. The data were reported in pollutant mass emitted per unit fuel consumed (kilogram pollutant / kilogram wood ), which we converted to lb/MMBtu using the high heating value of wood. Figure 4 shows the average emission factors for criteria and select toxic
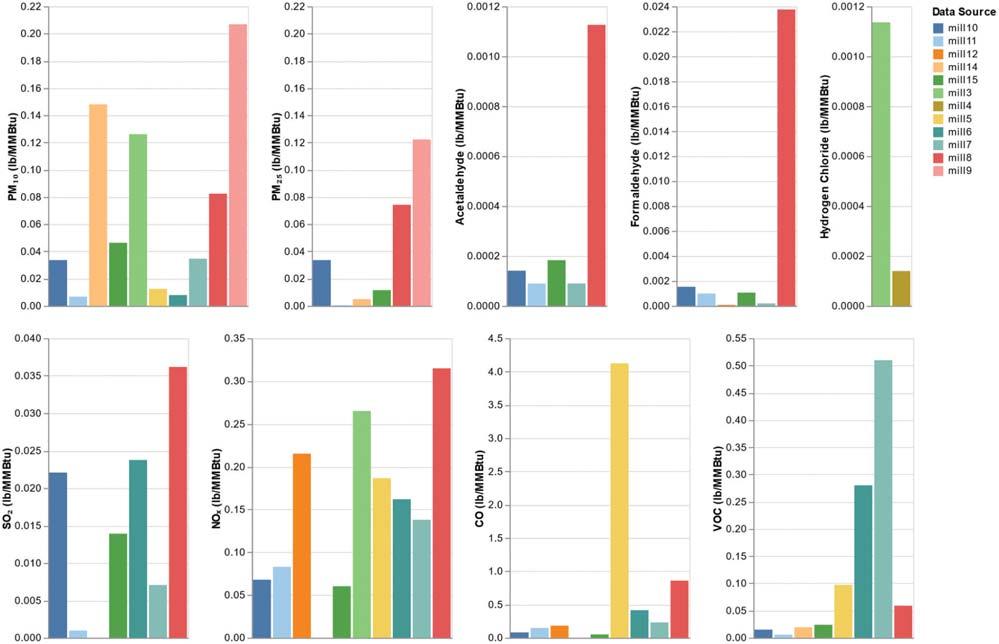
air pollutants. Information on emission control equipment for each mill was not available; thus, all the reported emission factors may not be considered uncontrolled. The very wide range of emission factors is due to the fact that the emission factors reported by CORRIM have a different fuel composition compared to stack test and air permit data source.
EPA developed the Compliance and Emissions Data Reporting Interface (CEDRI) and Web Factor Information Retrieval System (WebFIRE) because federal regulations require facilities to electronically submit emission test data in the form of performance test reports to EPA. WebFIRE is EPA’s online emissions data repository, retrieval, and development tool (https://www.epa.gov/ electronic-reporting-air-emissions/webfire). The WebFIRE database does not provide the necessary information to estimate emission factors and is limited in the pollutants measured. Refer to the SI for details on emission factors reported from the database.
Box plots in Figure 5 show the emission factors from various data sources, including air permits, stack test data, and NCASI technical bulletins, compiled and analyzed in this research. For the aerosol species, the distribution of uncontrolled emission factors is skewed to the right, and the mean emission factor is an order of magnitude greater than the median value. Also shown in Figure 5 are the emission factors currently included in EPA’s AP-42 Chapter 1.6 emission factors (marked as red dots). Interestingly, the emission factors from EPA’s AP-42 are slightly less than the median for filterable PM, but almost same as the median calculated from the data collected for this work for both PM10 and PM2.5. Because condensable PM is smaller than 2.5 microns in diameter, the emissions of the condensable component of PM are very small compared to PM10 and PM2.5.
For the gaseous pollutants, the emission factor for NOx from EPA’s AP-42 is 12% lower than the calculated median. However, the emission factor for CO in AP-42 is higher by a factor of four compared to the calculated median emission factor. The emission factor for SO2 in AP-42 is smaller by a factor 20 compared to the calculated median emission factor, which is due to the high sulfur content in biomass fuels as compared to wood residues. Among the HAPs, the median emission factor
for acetaldehyde aligns well with EPA’s AP-42 database, but the calculated median emission factor for formaldehyde is about a tenth of the emission factor used in EPA’s AP-42 database. The median emission factors for two acid gases, HCl and HF, are only about 59% and 67% of those in AP-42, respectively. There is a large range in the emission factors for HCl, and that is likely due to the type of particulate control technology. Wet scrubbers are highly efficient at capturing HCl compared to dry particulate control technologies. Table 4 compares the emission factors for several pollutants from AP-42 to the range of emission factors and median numbers from the new data sources, disaggregated by type of fuels. Note that the plots in Figure 5 are based on uncontrolled emission factors and thus do not include CORRIM data (control technology information was not available from CORRIM to allow us to calculate uncontrolled emission factors).
The results show that a boiler burning wood and wood residues with high moisture content likely emits more PM than a boiler burning dry fuel, whereas a boiler burning 100% sludge has lower PM emissions than a boiler burning wood residues. For combustion of biomass-derived waste fuels, we find PM emission factors to be higher than wood residues and sludge. Our results show that the
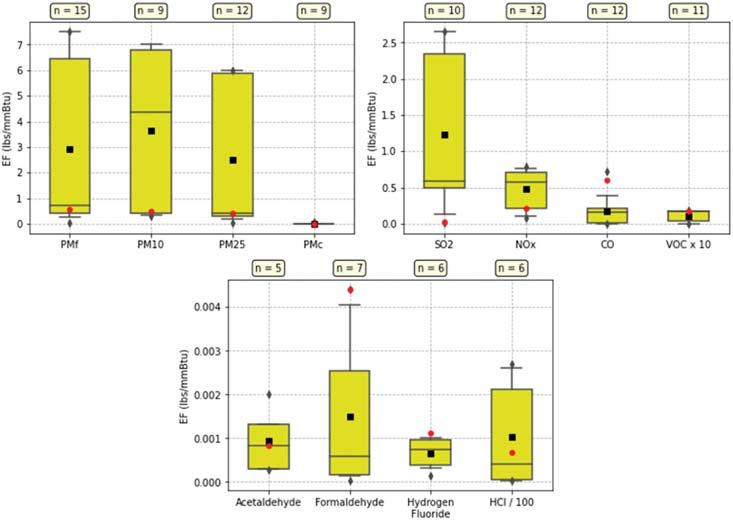
Table 4. Range and median emission factors (lb/MMBtu) from data sources collected herein including air permits, stack test data, and industry research reports as compared to EPA’s AP-42 values, disaggregated by fuel type.
Formaldehyde4.4E-031.0E–03–4.4E-032.5E-031.3E-043.0E–05–5.8E-041.3E-042.0E–04–4.4E-032.3E-03 HCl1.9E-021.6E–03–1.2E-026.9E-036.7E-021.5E–03–2.7E-011.6E-022.6E-012.6E-01
HFn/a1.4E-041.4E-046.4E-048.5E–04–1.0E-039.2E-043.0E-043.0E-04
lb/MMBtu = pounds per million British Thermal Unit, PMf = particulate matter (filterable), PM10 = PM with diameter less than or equal to 10 micrometers, PM2.5 = PM with diameter less than or equal to 2.5 micrometers, SO2 = sulfur dioxide, NOx = nitrogen oxides, CO = carbon monoxide, VOC = volatile organic compounds, H2SO4 = sulfuric acid, NH3 = ammonia, CO2 = carbon dioxide, HCl = hydrogen chloride, HF = hydrogen fluoride, n-a = not available.
[a]Wood and wood residues include bark, dry/wet wood, logging residue, and wood waste, whereas sludge refers to wastewater treatment sludge. Biomass waste includes biomass, biogas, digester sludge, biomass fines, and lignin stillage.
[b]For several pollutants, the range is not reported due to lack of emission factor data from multiple sources. In this case, only a point estimate is included.
[c]A point estimate is included where only one data source is available.
emission factors for PM from wood residues are similar to AP-42, whereas burning sludge produces 54% less emissions as compared to AP-42. When combusting biomass waste, the emission factors are at least 23% higher than the values listed in AP-42. Overall, the emission factors for PM fractions (filterable PM10 and PM2.5) range from 0.2–7.5 lb/MMBtu, as compared to 0.5 and 0.43 lb/MMBtu for PM10 and PM2.5 from AP-42, respectively, whereas the condensable fraction of PM is expected to be relatively small, ranging from 0.005–0.06 lb/MMBtu as compared to 0.017 lb/MMBtu from AP-42. The large difference in variability of emission factors for PM may be attributed to composition of biomass fuel which is not always available in the literature. For example, if the moisture content in the fuel is high, the emission factors for reported PM are likely high as well. Filterable PM10 and PM2.5 have a large coefficient of variation (~180% for both) compared to condensable PM, which has a coefficient of variation of 80%. This is consistent with EPA’s finding that emissions of the condensable fraction of PM were independent of fuel type (EPA 2009).
Although the emission factors for SO2 are closely correlated with the amount of sulfur in the fuel mixture, the reported SO2 emissions vary considerably, ranging from 0.13 lb/MMBtu for wood residues, 0.02–0.51 lb/ MMBtu for a mixture of wood residues and sludge, and 0.49–2.65 lb/MMBtu for biomass waste. The variation in
emission factors for SO2 from different sources is mainly due to the amount of sulfur present in the fuel. The value reported in AP-42 for SO2 is at the low end of the range at 0.025 lb/MMBtu. Most sulfur in the fuel is expected to be emitted as SO2, though a small fraction could end up in ash. Thus, we recommend utilizing a mass balance approach to estimate the emission factor of SO2, as it is closely tied to the amount of sulfur in the fuel.
The reported AP-42 emission factor for NOx is 0.22 lb/MMBtu, which falls in the range from the surveyed data (0.02–0.79 lb/MMBtu). The emission factor of NOx is 3.6 times higher than in AP-42 for wood residues, whereas it could be lower by 45% or higher by 300% as compared to AP-42 when burning a mixture of wood residues and sludge. Similarly, for biomass waste, the emission factor of NOx can be up to 3.5 times higher compared to AP-42. The variability in emission factors for NOx is mainly a factor of combustion characteristics (complete vs incomplete combustion), boiler type, and composition of fuel. Fuel-bound nitrogen plays an important role in the amount of NOx to be formed and emitted. However, boiler manufacturers’ experience appears to indicate that a well-designed and properly tuned boiler should be able to reduce NOx emissions to 0.18–0.28 lb/MMBtu for stoker boilers and 0.15–0.24 lb/MMBtu for bubbling fluidized bed boilers (Bowman et al. 2009).
CO, which is the result of incomplete combustion, and which is inversely proportional to NO x
formation, is estimated to range from 0.002–0.72 lb/ MMBtu based on our surveyed data. Burning wood residues results in the highest CO emission factor, 0.72 lb/MMBtu, which is 20% higher than the value listed in AP-42. Burning a mixture of wood residues and sludge could result in a reduction of CO emissions by a factor of 1.5 as compared to AP-42, whereas burning biomass waste can further reduce CO emissions by a factor of 2.7 compared to AP-42. This is because increasing the air flow for oxidation of CO to CO2 at high temperature is expected to result in high thermal NOx formation.
Our analysis suggests that emission factors of organic compounds align reasonably well with the AP-42 emission factors, with a range of 0.003–0.019 lb/MMBtu. Although the data sources reported higher emission factors for some HAPs, most of them are within the values specified in AP-42, providing a good agreement with the published literature. However, the median emission factor for HCl is much lower than the AP-42 reported data. It should be noted that the secondary data we use has a large variability, with a coefficient of variation of 245%, which is likely due to the use of different particulate control technologies.
This analysis aims to compile and analyze emission factors from uncommon data sources for boilers that burn a single unconventional biomass-derived fuel or a combination of such fuels for which published data is scarce. The only emission factors that are currently available in the public domain and utilized by regulatory agencies are from EPA’s AP42 emission factors for wood residue combustion, which do not necessarily resemble the biomassbased fuels being utilized in industrial boilers. Therefore, using the AP-42 emission factors, could result in inaccurate estimates of potential emissions from industries that utilize boilers that burn unconventional biomass fuels. Given that a chemical facility that includes a biomass fuel boiler will need air permits with detailed emission calculations prior to its construction and operation, this study surveyed a broad knowledge base to identify data that could provide a better understanding of how the emissions in permits/permit documentation, stack testing, and relevant technical reports compare to those from AP-42.
Upon a thorough review of emission factors from several data sources, which provide insights into emission factors for biomass boilers, we analyzed the data
across the most important pollutants likely to be emitted from the boiler. The results suggest that the emission factors are highly variable for several air pollutants, depending on the type of fuel being combusted, the chemical composition of the fuel, and the fuel properties in the boiler. In general, the distribution of the emission factors from the studies reviewed in this work vary based on the type of fuel being combusted, with a right skewed distribution for filterable PM, PM10, PM2.5, SO2, and HCl. The median emission factors for NOx and the three PM components accounting for most of the emitted aerosol mass were about the same as the AP42 emission factors. For SO2, the median emission factor is 20 times higher than the AP-42 emission factor. For CO, the AP-42 emission factor is four times higher than median emission factor and is far outside the 95th percentile data obtained from the new sources. Our analysis also indicates that major toxic air pollutants (HAPs) have a higher AP-42-based emission factor compared to the median emission factor reported in this work. Use of these new emission factors based on fuel composition is likely to provide a better estimate from the complex feedstock combustion in the boilers when emission testing is not feasible.
Although we provide a range of emission factors for a boiler that burns a mixture of biomass fuels, other process parameters should also be accounted for when selecting the best emission factors for each pollutant. These include the type of boiler utilized for combustion, flame temperature, and combustion practices employed at the facility. For example, fuel is combusted in stoker boilers by sitting on fixed grates, whereas fluidized bed boilers utilize inert particles for air to blow through them so that the bed behaves as a fluid. Stoker boilers are typically utilized for large wood-fired units with high steam generation, whereas fluidized bed boilers can handle fuels with more than 70% moisture content because of the larger share of thermal mass represented by hot inert bed particles. Similarly, the flame temperature and good combustion practices have significant effects on the products of combustion. This includes a proper air/fuel ratio, thorough mixing of air and fuel, and initial and sustained ignition of the mixture. Because air has a higher nitrogen content than oxygen, the required volume of air is much larger than the required volume of oxygen for a complete combustion. This affects the emissions of thermal NOx along with CO and CO2. Therefore, additional process parameters should be considered along with feed composition and fuel properties (such as moisture content) when selecting the most appropriate emission factors for the boiler to be evaluated.
The range of emission factors reported in this paper will be useful to permitting agencies, industrial facilities utilizing biomass-derived waste fuels, and biofuel developers and can facilitate estimation of potential to emit, which is required for air permitting purposes. Providing public access to such data would help save time and mitigate risks associated with permit applications being delayed due to inaccurate emission calculations. Although specifics about the boiler configuration, exact fuel properties, and other process parameters are important when selecting emission factors, this paper can be utilized as a starting point for emission estimation. Moreover, as the emission factors from published data sources are a useful starting point, performing detailed kinetic modeling of emissions from combustion of biomass-derived fuels could be a potential option for future research. In addition, obtaining stack test data for new facilities that burn a combination of unconventional biomass-derived fuels can help improve the estimates.
This work was authored by Alliance for Sustainable Energy, LLC, the manager and operator of the National Renewable Energy Laboratory for the U.S. Department of Energy (DOE) under Contract No. DE-AC36-08GO28308. Support for the work was provided by ExxonMobil Research and Engineering Company (EMRE) under Agreement CRD-18-00765. We acknowledge funding from ExxonMobil. The views represented are those of the authors and do not necessarily reflect those of ExxonMobil. We thank Cynthia Randles and her team at EMRE for their valuable comments and inputs to the paper. The views expressed in the article do not necessarily represent the views of the DOE or the U.S. Government. The U.S. Government retains and the publisher, by accepting the article for publication, acknowledges that the U.S. Government retains a nonexclusive, paid-up, irrevocable, worldwide license to publish or reproduce the published form of this work, or allow others to do so, for U.S. Government purposes. We appreciate all the editing help from Susannah Shoemaker. We would like to thank Maureen Puettmann of CORRIM for sharing data on emissions from different (anonymous) boilers that CORRIM collected through a survey.
No potential conflict of interest was reported by the authors.
The work was supported by the ExxonMobil Research and Engineering Company [CRD-18-00765]
Arpit Bhatt, is a Bioenergy Process Analysis Engineer at the National Renewable Energy Laboratory (NREL), USA, and focuses his research on techno-economic analysis, sustainability analysis, and air pollutant emissions modeling of renewable energy technologies.
Vikram Ravi, Ph.D., is a research scientist at the National Renewable Energy Laboratory (NREL), USA. His research activities include using atmospheric modeling and machine learning techniques to assess and quantify air quality and public health co-benefits from biofuel generation and use, vehicle electrification, and decarbonization in the power sector.
Yimin Zhang, is a senior researcher at the National Renewable Energy Laboratory (NREL), USA, and focuses her research on the development and application of life-cycle analysis models, sustainability analysis, and economic impact analysis of lowand zero-carbon technologies and strategies.
Garvin Heath, Ph.D., is an inaugural Distinguished Member of the Research Staff at the National Renewable Energy Laboratory (NREL), USA, specializing in the analysis of environmental impacts of energy systems–renewable and conventional, electricity and fuels.
Ryan Davis is a group manager and senior research engineer in the Economic, Sustainability, and Market Analysis group of the National Renewable Energy Laboratory (NREL), focusing on process modeling and techno-economic analysis for bioenergy technologies.
Eric C. D. Tan, Ph.D., is a Senior Research Engineer in the Catalytic Carbon Transformation and Scale-up Center at the National Renewable Energy Laboratory (NREL), USA. His research activities include performing conceptual process design, techno-economic analysis, and various sustainability assessments.
Arpit Bhatt http://orcid.org/0000-0002-3780-1800
Garvin Heath http://orcid.org/0000-0001-6010-4475
Eric C.D. Tan http://orcid.org/0000-0002-9110-2410
The authors confirm that the data supporting the findings of this study are available within the article and its supplementary materials.
ACHR News. 2016. Advances in boiler construction and design [Internet]. https://www.achrnews.com/articles/ 131381-advances-in-boiler-construction-and-design Allen’s Tristate Mechanical. 2017. How industrial boilers keep plants running efficiently [Internet]. https://www.allenstris tate.com/how-industrial-boilers-keep-plants-running-effi ciently/
Anthony, E. J. 1995. Fluidized bed combustion of alternative solid fuels; status, successes and problems of the technology. Prog. Energy Combust. Sci. 21 (3):239–68, January 1. doi:10. 1016/0360-1285(95)00005-3
ARI Environmental, Inc. 2015. Relative accuracy test audit: Poet biorefining - project liberty solid fuel boiler exhaust.
ARI Environmental, Inc. 2016. Relative accuracy test audit: Poet biorefining - project liberty solid fuel boiler exhaust.
ARI Environmental, Inc. 2017. Relative accuracy test audit: Poet biorefining - project liberty solid fuel boiler exhaust.
Bases, G. 2011. The history of the steam-generating boiler and industry [Internet]. Insulation Outlook. https://insulation. org/io/articles/the-history-of-the-steam-generating-boilerand-industry/
Bhatt, A. H., Y. Zhang, R. Davis, G. Heath, and V. Ravi. 2022. Biorefinery upgrading of herbaceous biomass to renewable hydrocarbon fuels, Part 2: Air pollutant emissions and permitting implications. J. Clean. Prod. 362:132409, August 15. doi:10.1016/j.jclepro.2022.132409
Bowman, J., M. Davidson, J. Penterson, K. Toupin. 2009 Biomass combustion technologies: A comparison of a biomass 50MW modern stoker fired system and a bubbling fluidized bed system [Internet]. Riley Power Inc. http://www.babcockpower.com/pdf/RPI-TP-0218.pdf
Burns & McDonnell. 2014. Prevention of significant deterioration - air quality construction permit application: Source ID No. 1890231.
Cao, G., X. Zhang, S. Gong, and F. Zheng. 2008. Investigation on emission factors of particulate matter and gaseous pollutants from crop residue burning. J. Environ. Sci. 20 (1):50–55, January 1. doi:10.1016/S1001-0742(08)60007-8
Carreras-Sospedra, M., R. Williams, and D. Dabdub. 2016 Assessment of the emissions and air quality impacts of biomass and biogas use in California. J. Air Waste Manag. Assoc. 66 (2):134–50, February 1. doi:10.1080/10962247. 2015.1087892.
Cheng, J., F. Zhou, T. Si, J. Zhou, and K. Cen. 2018. Mechanical strength and combustion properties of biomass pellets prepared with coal tar residue as a binder. Fuel Process. Technol. 179:229–37, October 1. doi:10.1016/j. fuproc.2018.07.011
Davis, R., A. H. Bhatt, Y. Zhang, E. C. D. Tan, V. Ravi, and G. Heath. 2022. Biorefinery upgrading of herbaceous biomass to renewable hydrocarbon fuels, Part 1: Process modeling and mass balance analysis. J. Clean. Prod. 362:132439, August 15. doi:10.1016/j.jclepro.2022.132439
Eberle, A., A. Bhatt, Y. Zhang, and G. Heath. 2017. Potential air pollutant emissions and permitting classifications for two biorefinery process designs in the United States. Environ. Sci. Technol. 51 (11):5879–88, June 6. doi:10. 1021/acs.est.7b00229.
Energy and Environmental Analysis, Inc. 2005
Characterization of the U.S.Industrial/Commercial boiler population [Internet]. Arlington, Virginia. https://www. energy.gov/sites/prod/files/2013/11/f4/characterization_ industrial_commerical_boiler_population.pdf
EPA. 1970. National Ambient Air Quality Standards (NAAQS) | Technology Transfer Network | US EPA [Internet]. https://www.epa.gov/naaqs
EPA. 1995 Compilation of air pollutant emission factors Volume 1: Stationary Point and Area Sources [Internet]. vol. 1, 5th ed. Office of Air Quality Planning and Standards
U.S. Environmental Protection Agency. http://www3.epa. gov/ttn/chief/ap42/index.html#toc.
EPA. 2009. AP-42: Compilation of air emissions factors [Internet]. https://www.epa.gov/air-emissions-factors-andquantification/ap-42-compilation-air-emissions-factors EPA. 2015. Air emissions inventories [Internet]. https://www. epa.gov/air-emissions-inventories
EPA. 2016. Clean Air Technology Center (CATC) technical resources - EPA’s air pollution technology fact sheets [Internet]. https://www3.epa.gov/ttncatc1/cica/atech_e. html#111
EPA. 2022. Basic information of air emissions factors and quantification [Internet]. https://www.epa.gov/air-emis sions-factors-and-quantification/basic-information-airemissions-factors-and-quantification.
Federal Register. 2017. Environmental protection agency, 40 Code of Federal Regulations (CFR) Part 60 - Standards of performance for new stationary sources [Internet]. U.S. Government Publishing Office. https://www.ecfr.gov/on/ 2017-01-03/title-40/part-60
Federal Register, NSPS. 2023. Environmental protection agency, 40 Code of Federal Regulations (CFR) Part 63National emission standards for hazardous air pollutants for source categories [Internet]. U.S. Government Publishing Office. https://www.ecfr.gov/current/title-40/ chapter-I/subchapter-C/part-63?toc=1
Industrial Controls. 2021. The evolution of boiler design & maintenance [Internet]. https://www.industrialcontrolson line.com/training/online/evolution-boiler-design-mainte nance.
Jenkins, B. M., L. L. Baxter, T. R. Miles, and T. R. Miles. 1998 Combustion properties of biomass. Fuel Process. Technol. 54 (1):17–46, March 1. doi:10.1016/S0378-3820(97)00059-3
Jetter, J. J., and P. Kariher. 2009. Solid-fuel household cook stoves: Characterization of performance and emissions. Biomass Bioenergy 33 (2):294–305, February 1. doi:10. 1016/j.biombioe.2008.05.014
Jetter, J., Y. Zhao, K. R. Smith, B. Khan, T. Yelverton, P. DeCarlo, and M. D. Hays. 2012. Pollutant emissions and energy efficiency under controlled conditions for household biomass cookstoves and implications for metrics useful in setting international test standards. Environ. Sci. Technol. 46 (19):10827–34, October 2. doi:10.1021/es301693f.
Komariah, L. N., S. Arita, Novia, S. S. Wirawan, and M. Yazid. 2013. Emission factors of biodiesel combustion in industrial boiler: A comparison to fossil fuel. J. Renewable Sustainable Energy 5 (5):052005, September 1. doi:10.1063/1.4822036
Meyer, N., J. Leung. 2018. Sustainable options for reducing emissions from thermal energy: Showcasing successful outcomes from six case studies [Internet]. Center for Climate and Energy Solutions, October. https://www.c2es.org/docu ment/case-studies-of-renewable-thermal-energy/ Mitchell, E. J. S., A. R. Lea-Langton, J. M. Jones, A. Williams, P. Layden, and R. Johnson. 2016 . The impact of fuel properties on the emissions from the combustion of biomass and other solid fuels in a fixed bed domestic stove. Fuel Process. Technol. 142:115–23, February 1. doi:10.1016/j.fuproc.2015.09.031
Montrose Air Quality Services, LLC. 2019. Relative accuracy test audit: Poet biorefining - project liberty solid fuel boiler exhaust.
NCASI. 2010. Compilation of air toxics and total hydrocarbon emissions data for the pulp and paper mill sourcesa second update. Report No.: Technical Bulletin No. 973, National Council for Air and Stream Improvement, Inc, Research Triangle Park, NC
NCASI. 2013. A comprehensive compilation and review of wood-fired boiler emissions. Report No.: Technical Bulletin No. 1013, National Council for Air and Stream Improvement, Inc, Research Triangle Park, NC.
NCASI. 2015. A comprehensive compilation and review of combination wood-fired boiler emissions. Report No.: Technical Bulletin No. 1026, National Council for Air and Stream Improvement, Inc., Research Triangle Park, NC.
NCASI. 2023. National Council for Air and Stream Improvement, Inc. [Internet]. https://www.ncasi.org/
Nielsen, H. P., F. J. Frandsen, K. Dam-Johansen, and L. L. Baxter. 2000. The implications of chlorine-associated corrosion on the operation of biomass-fired boilers. Prog. Energy Combust. Sci. 26 (3):283–98, June 1. doi:10.1016/ S0360-1285(00)00003-4.
Office of Energy Efficiency and Renewable Energy. 2018. Manufacturing energy and carbon footprints (2018 MECS) [Internet]. Office of EERE. https://www.energy. gov/eere/amo/manufacturing-energy-and-carbon-foot prints-2018-mecs
Panagiotis, G. 2010 Solid biofuels for energy: A lower greenhouse gas alternative. vol. 28. London: Springer. doi:10. 1007/978-1-84996-393-0
Puettmann, M. E., and M. Milota. 2017. Life-cycle assessment for wood-fired boilers used in the wood products industry*. For.
Prod. J. 67 (5–6):381–89, September 1. doi:10.13073/FPJ-D-1600064.
Reynolds, O. 1961. On the extent and action of the heating surface of steam boilers. Int. J. Heat Mass Transf. 3 (2):163–66, September 1. doi:10.1016/0017-9310(61)90087-4
Singh, A., V. Sharma, S. Mittal, G. Pandey, D. Mudgal, and P. Gupta. 2018. An overview of problems and solutions for components subjected to fireside of boilers. Int. J. Ind. Chem. 9 (1):1–15, March 1. doi:10.1007/s40090-017-0133-0
Slade, R., A. Bauen, and R. Gross. 2014. Global bioenergy resources. Nat. Clim. Chang. 4 (2):99–105, Feb 1. doi:10. 1038/nclimate2097.
Tucki, K., O. Orynycz, A. Wasiak, A. Świć, L. Mieszkalski, and J. Wichłacz. 2020. Low emissions resulting from combustion of forest biomass in a small scale heating device. Energies 13 (20):5495. doi:10.3390/en13205495
Ushakova, A., V. Zatsepin, M. Varfolomeev, and D. Emelyanov. 2017. Study of the radical chain mechanism of hydrocarbon oxidation for in situ combustion process. J. Combust. 2017:2526596, March 6. Phuoc TX, editor. doi:10.1155/2017/2526596.
Wisconsin Department of Natural Resources. 2019a. 2019 air emissions inventory summary report: Wisconsin electric power company - Rothschild biomass.
Wisconsin Department of Natural Resources. 2019b. We energies Rothschild biomass cogeneration facility air pollution control construction permit application.
WLA Consulting, Inc. 2011. 2011 updated facility design prevention of significant deterioration air quality construction permit application: Source ID No. 1890231.
PARTH SHAH1,2 HYUN-KYU CHOI1,2 & JOSEPH SANG-IL KWON1,2
The growing demand for various types of paper highlights the importance of optimizing the kraft pulping process to achieve desired paper properties. This work proposes a novel multiscale model to optimize the kraft pulping process and obtain desired paper properties. The model combines mass and energy balance equations with a layered kinetic Monte Carlo (kMC) algorithm to predict the degradation of wood chips, the depolymerization of cellulose, and the spatio-temporal evolution of the Kappa number and cellulose degree of polymerization (DP). A surrogate LSTM-ANN model is trained on data generated from the multiscale model under different operating conditions, dealing with both time-varying and time-invariant inputs, and an LSTM-ANN-based model predictive controller is designed to achieve desired set-point values of the Kappa number and cellulose DP while considering process constraints. The results show that the LSTM-ANNbased controller is able to drive the process to desired set-point values with the use of a computationally faster surrogate model with high accuracy and low offset.
Contact information:
1. Artie McFerrin Department of Chemical Engineering, Texas A&M University, College Station, TX 77843, USA.
2. Texas A&M Energy Institute, Texas A&M University, College Station, TX 77845, US.
Processes 2023, 11, 809.
https://doi.org/10.3390/pr11030809
Creative Commons Attribution 4.0 International License
The Paper Industry Technical Association (PITA) is an independent organisation which operates for the general benefit of its members – both individual and corporate – dedicated to promoting and improving the technical and scientific knowledge of those working in the UK pulp and paper industry. Formed in 1960, it serves the Industry, both manufacturers and suppliers, by providing a forum for members to meet and network; it organises visits, conferences and training seminars that cover all aspects of papermaking science. It also publishes the prestigious journal Paper Technology International® and the PITA Annual Review , both sent free to members, and a range of other technical publications which include conference proceedings and the acclaimed Essential Guide to Aqueous Coating.
Article
ParthShah 1,2 ,Hyun-KyuChoi 1,2 andJosephSang-IlKwon 1,2, *
1 ArtieMcFerrinDepartmentofChemicalEngineering,TexasA&MUniversity,CollegeStation,TX77843,USA
2 TexasA&MEnergyInstitute,TexasA&MUniversity,CollegeStation,TX77845,USA
* Correspondence:kwonx075@tamu.edu;Tel.:+1-(979)-862-5930
Citation: Shah,P.;Choi,H.-K.;Kwon, J.S.-I.AchievingOptimalPaper Properties:ALayeredMultiscale kMCandLSTM-ANN-BasedControl ApproachforKraftPulping. Processes 2023, 11,809.https://doi.org/ 10.3390/pr11030809
AcademicEditor:ZheWu
Received:28January2023
Revised:21February2023
Accepted:24February2023
Published:8March2023
Copyright: ©2023bytheauthors. LicenseeMDPI,Basel,Switzerland. Thisarticleisanopenaccessarticle distributedunderthetermsand conditionsoftheCreativeCommons Attribution(CCBY)license(https:// creativecommons.org/licenses/by/ 4.0/).
Abstract:
Thegrowingdemandforvarioustypesofpaperhighlightstheimportanceofoptimizing thekraftpulpingprocesstoachievedesiredpaperproperties.Thisworkproposesanovelmultiscale modeltooptimizethekraftpulpingprocessandobtaindesiredpaperproperties.Themodelcombines massandenergybalanceequationswithalayeredkineticMonteCarlo(kMC)algorithmtopredict thedegradationofwoodchips,thedepolymerizationofcellulose,andthespatio-temporalevolution oftheKappanumberandcellulosedegreeofpolymerization( DP).AsurrogateLSTM-ANNmodel istrainedondatageneratedfromthemultiscalemodelunderdifferentoperatingconditions,dealing withbothtime-varyingandtime-invariantinputs,andanLSTM-ANN-basedmodelpredictive controllerisdesignedtoachievedesiredset-pointvaluesoftheKappanumberandcellulose DP whileconsideringprocessconstraints.TheresultsshowthattheLSTM-ANN-basedcontrollerisable todrivetheprocesstodesiredset-pointvalueswiththeuseofacomputationallyfastersurrogate modelwithhighaccuracyandlowoffset.
Keywords: pulpdigester;multiscalemodeling;modelpredictivecontrol;machinelearning;long short-termmemory;layeredkMCsimulation
Thepulpandpaperindustry(PPI)isundergoingrapidmodernizationtomeetthe growingdemandforpulpandpaperproductionasshowninFigure 1 [1].Thisdemandcan beattributedtotheincreaseintheuseofpackagingpaperbycompanies,suchasAmazon andWalmart,thegrowingmanufacturingindustryinemergingmarkets,suchasAsiaand Africa,andtheshifttowardsonlineshoppingbyconsumers.Asaresult,thePPIisfocusing onusingadvancedfirst-principlesmodelsandartificial-intelligencetechniquestodevelop digitaltwinsandprocess-controlsystemsforimprovedefficiency,reducedwaste,andsafer operations[2–5].
Paperismadeupofthreesubstances,lignin,hemicellulose,andcellulose,andis typicallyproducedfromwoodchips.Lignin,themaincomponentofthecellwall,isa highlybranchedthree-dimensionalpolymerthatactsasagluetoholdcellulosemicrofibrils together[6].Inordertoseparateligninfromthesecellulosicfibers,aprocesscalled delignificationisusedinalargechemicalreactorcalledapulpdigester[6,7].TheKappa number,ametricthatdescribesthedegreeofdelignification,isusedtoevaluatethe process,whereaKappanumberbelow100forcardboardpapersandbelow60forkraft andbleachablewhitepapersisfavorable[8–10].
Despiteeffortstomanagewasteandrecyclefibers,thePPIstillgeneratesalarge amountofwasteproduct,whichposesasignificantburdenontheindustry[11].Basedon areport,17%ofthetotalglobalwastecomesfrompaperindustries,anddiscardedpaper andpaperboardmakeuproughly26%ofsolidmunicipalwasteinlandfillsites[12,13].
Onepotentialsolutionistomitigatefiberdegradationthroughstrengthmodeling. Bymeetingthespecificstandardsofpaper,theamountofwastegeneratedcanbesignificantlyreduced.However,achievingthestrengthrequirementsandpropertiesofdifferent paperproductscanbechallengingaseachproducthasitsownuniquestrengthstandard. Thetensilestrengthofpaperisanimportantstrengthproperty,andcelluloseisresponsible forformingcrystallinemicrofiberswithexcellenttensilestrength[14].
Thecellulosedegreeofpolymerization( DP )isameasureofthecellulosechainlength andisthemajorfactordeterminingthetensilestrengthoftheproductascelluloseis theload-bearingelementofapulpfiber[15,16].Therefore,agoodpaperproducthas ahighcellulose DP ,whichrepresentshighstrength,andalowKappanumber,which representsabrighterpaper.Asthefinalpaperproductproperties,suchasstrengthand yield,areprimarilydeterminedbymetrics,suchastheKappanumberand DP ,itiscrucial tooptimizethepulpingprocesstoachievethesespecificpropertieswithdesiredvalues.
Kraftpulpingisthemostcommonlyusedchemicalpulpingprocess,accountingfor 80%ofchemicalpulpproducedintheUnitedStates[17].Duringkraftpulping,wood chipsareexposedtoanaqueoussolution,whichremovesbothligninandhemicellulose. Strongalkalinesolvents,suchassodiumhydroxide(NaOH),areaddedtothesolution toincreasethedegreeofdelignification(i.e.,todecreasetheKappanumber).However, thisalsoresultsinthebreakdownordegradationofcellulosetoglucose[18].Toprevent cellulosedegradationandobtainthedesiredpaperproperties,itisessentialtocontrol theoperatingconditions,suchasthebatchcookingtime,NaOHconcentration,andtemperature.Therehavebeenseveralapproachesintheliteraturetodevelopmacroscopic andmesoscopiccomputationalmodelswiththeextendedPurduemodelbeingthemost commonlyused[19–22].
However,thesemodelsonlyconsidermacroscopicequations.Theycannotpredict importantmicroscopicproperties,suchastheKappanumber,fibermorphology, DP , andcell-wallthickness(CWT).Recentstudies[6,7,23,24]havedevelopedmultiscalemodels usingkineticMonteCarlo(kMC)algorithms[25,26]todescribethesemicroscopicproperties andunderstandfiber-to-fiberheterogeneity.Theyalsodesignedamodel-basedcontroller usingreduced-ordermodelsandKalmanfilters[27,28].However,thesestudiesdidnot
discusshowreactionconditionsaffectthecellulose DP .Additionally,therearefewstudies intheliteratureonusingmachine-learning-basedpredictivecontrollersforthepulping processtoobtainoptimaloperatingconditionsandachievedesiredpaperproperties.
Toaddresstheselimitations,weproposethedevelopmentofanovellayeredmultiscale modelthatcombinesthekMCalgorithmandextendedPurduemodelequations.This modelaimstodescribethetemporalevolutionofimportantpaperproperties,suchas theKappanumberandcellulose DP .Bybuildingonapreviouslydevelopedmultiscale model,whichdescribesthedegradationofsolidcomponentsatthemesoscale,wefurther modifyittomodelthedepolymerizationkineticsatthemicroscopiclevel.Specifically, wetakeintoaccountthatthedegradationprocessoccursonamuchfastertimescale thandepolymerization,andthusmultipledepolymerizationeventsoccuroverasingle degradationevent,thereby,resultinginalayeredmultiscalemodel.
Realisticchemicalprocessmodels,suchastheproposedlayeredmultiscalemodel,can betoocomplextobesolvedinreal-timeoperations.Toovercomethischallenge,machine learning(ML)andothersystem-identificationmethodsareemployedtolearnmathematical modelsfromdataanddiscoverpatternswithoutexplicitprogramming[29–32].Inthis work,weconstructasurrogatelongshort-termmemory(LSTM)-artificialneuralnetwork (ANN)modelusinginput–outputdatageneratedfromthemultiscalemodelbyrunningit offlineunderdifferentoperatingconditions[33–36].
WeselecttheLSTM-ANNnetworktohandleacombinationoftime-varying(i.e., temperature)andtime-invariant(i.e.,cookingtimeandNaOHconcentration)inputs, whicharecommonlyencounteredinchemicalprocesses,particularlythepulpingprocess. LSTMsareknownforaccuratelylearningtemporaldependenciesinsequencedata,while ANNsarebetteratextractinginformationfromtime-invariantfeatures[37–39].
Afterobtaininganoptimalnetworkthroughhyperparametertuningandoverfitting analysis,thesurrogatemodelisusedasaninternalevaluatorinanLSTM-ANN-based modelpredictivecontroller(MPC).Thiscontrolleriscomputationallymoreefficientasit utilizesawell-trainedneuralnetworktoobtaintheoptimalinputprofilesandachievethe desiredset-pointvaluesfortheKappanumberandcellulose DP whileconsideringthe processconstraints.Theperformanceoftheclosed-loopcontrollerisdemonstratedthrough arepresentativecase.
Thestructureofthisarticleisasfollows:InSection 2,themathematicalmodelfor thekraftpulpingprocessispresented.InSection 3,thetrainingoftheLSTM-ANNmodel andthedesignofthecontrollerarediscussed.Theresultsofthemultiscalemodeland controllerarepresentedinSection 4.Finally,ourconclusionsarepresentedinSection 5.
Themultiscalemodelingframeworkisdesignedtodescribethetemporalevolutionof microscopicproperties(suchastheKappanumber,cellmorphology,poresizedistribution, CWT,andcellulose DP )andmacroscopicproperties(suchasthetemperatureandconcentrationprofiles).Theproposedmodelisbuiltuponpreviousmultiscalemodels[7,23] developedforthekraftpulpingprocess,andfurthermodifiedthemtotakeintoaccount theeffectofboththedegradationofwoodsolidcomponentsandthedepolymerization ofcelluloseonthetensilestrengthofpaper[14].Thisismotivatedbytheunderstanding thatthesepropertiesplayacriticalroleindeterminingthequalityandstrengthofthefinal paperproduct.
Themultiscalemodelcomprisesthreephases:thesolid,entrapped-liquor,andfreeliquorphasesasillustratedinFigure 2 [40].Thefree-liquorphaserepresentsthebulkliquor surroundingthechipphase,whichcomprisesboththesolidandentrapped-liquorphases. Asthecomponentsofthesolidphasereactwiththoseoftheentrapped-liquorphase,they dissolveandtransformintocomponentsoftheliquorphase.TheextendedPurduemodel isusedtodescribemacroscopicphenomena,suchasenergybalanceandmasstransport, whilemicroscopicproperties,suchastheKappanumberandcellulose DP ,aredescribedby kMCsimulations[19,20].Themultiscalemodelcapturesthedynamicinteractionbetween
thesethreephasesandtheresultingchangesinpropertiesatboththemacroscopicand microscopiclevels.
Thesolidphaseofthemultiscalemodeliscomposedofhighandlow-reactivelignin, cellulose,xylan,andgalactoglucomman.Boththefreeandentrapped-liquorphasesare assumedtoconsistofsixcomponents:activeeffectivealkali(EA),passiveeffectivealkali, activehydrosulfide(HS),passivehydrosulfide,dissolvedlignin,anddissolvedcarbohydrates(CHO).Inthismodel,thedegradationofsolidcomponentstypicallyoccursatthe boundarybetweenthesolidandentrapped-liquorphases.Hardwoodspeciesareconsideredinthisstudy.Thedetailsofthemassandenergybalanceequations,initialconditions, andreactionkineticsofthedegradationofsolidcomponentsareprovidedinourprevious studies[6,7,24,41].
Properties,suchastheconcentrationandtemperature,arecalculatedbyapplying mass/energybalanceequationstothesimulationlattice.Thesimulationlatticeconsistsof aprimarywall,amiddlelamella,andthreesecondarywalllayers.Thewoodstructureand chemicalcompositionofthecellwallaretakenfrom[6,42].Thelengthofasinglelatticesite issetat3.5nm,andthesizeofthetwo-dimensionallatticeisrepresentedbytheproductof horizontalandverticallatticesites, L h × L v .Theaveragethicknessofwoodfibersis 3.8 μm, L h = 3.8 μ/3.5nm=1086,and L v = 800,whichisthecell-walllength.Thecellulosefibers undergodegradationreactionswithaneventtimestepof0.001–0.01min.
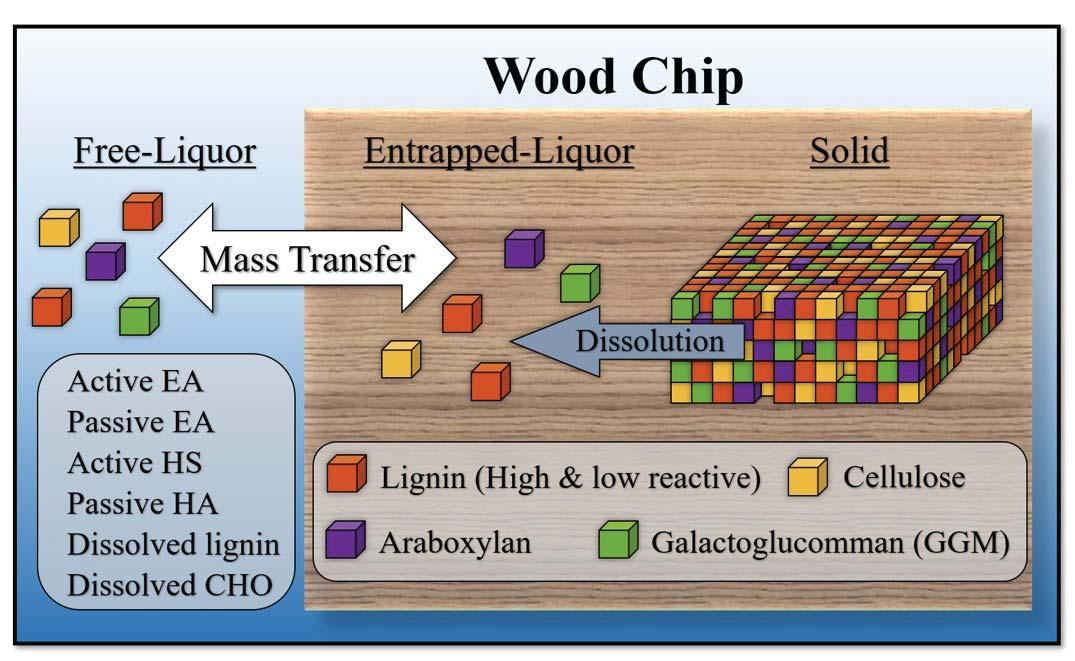
Inadditiontothebulkdissolutionreactions,cellulosefibersalsoexperiencefurther degradationduetodepolymerization;thishappensinthreereactions:peeling-off,stopping, andalkalinehydrolysiswithaneventtimestepof0.0001–0.001min.Itisimportantto notethatdissolutionanddepolymerizationaresignificantlyinfluencedbythesystem parameters,suchasthetemperatureandreactionrates.Therefore,thesemultiscalereactions mustbeconsideredtogether.However,duetothescaledifferencebetweendegradation anddepolymerization(i.e.,about10times),introducingthemolecularscaletothelattice wouldresultina100-timeslargerlattice.Toovercomethis,thesecondkMClayerfor depolymerizationisplacedwithintheexistingonefordegradation.
Inthisway,microandnanoscaleeventsarecapturedbyalayeredkMCalgorithm, andmultipledepolymerizationeventsareexecutedwithinasingledegradation.First, adegradationeventisexecuted.Next,theeventtimesteps Δ t deg arecalculated.Then,
thesimulationlatticeisfrozen,anddepolymerizationeventsareexecuted.Theseevents arerepeateduntil ΣΔ t depoly,t ≥ Δ t deg
Finally,themacroscopicpropertiesareupdatedinthelasttimestep.Thisapproach allowsfortheefficientsimulationofthemultiscalereactionsthatoccurinthekraftpulping process,whilealsoconsideringtheimpactofthesystemparametersonthedissolutionand depolymerizationreactions.
Thefirstreactioninthedepolymerizationkineticsisthepeeling-offreaction,inwhich theend-wisedegradationofacellulosechainoccurs,andoneunitisremovedfromthe reducingendofthecellulosechain.Thisreactionisapseudo-first-orderreactionthat dependsonthecelluloseconcentrationandisrepresentedbythefollowing Equation[43,44]:
d ( C glu ) dt = k 1 · Ccel (1) where C glu istheglucoseconcentration, Ccel isthecelluloseconcentration,and k 1 isthe peeling-offreactionrateconstant.
Thesecondreactioninthedepolymerizationkineticsisthestoppingreaction,inwhich thereducingendgroupofthecellulosechainisconvertedintoastableendgroupleading totheformationofmetasaccharinicacid.Aswiththepeeling-offreaction,thestopping reactionisalsoapseudo-first-orderreactionthatdependsonthecelluloseconcentration andcanberepresentedasfollows:
d ( C MSA ) dt = k 2 Ccel (2)
where C MSA isthemetasaccharinicacidconcentration,and k 2 isthestoppingreaction rateconstant.
Thefinaldepolymerizationkineticsinvolvealkalinehydrolysis,whereglycosidic bondsundergobase-catalyzedcleavage,andthecellulosechainisdividedintotwopieces, thus,resultinginahalf-folddecreaseincellulose DP .Thisisapseudo-first-orderreaction thatdependsonthecelluloseconcentrationasfollows:
d ( Ccel ) dt = k 3 Ccel (3)
where k 3 isthealkalinehydrolysisreactionrateconstant.ThekineticparametersareestimatedbyapplyingtheArrheniusequation,andtherateconstantsaregivenasfollows[43]:
Thealkalinehydrolysisgreatlyimpactsthecellulose DP byreducingitbyhalf.The peeling-offandstoppingreactionsareconsiderednulleventsasnoactiontakesplacewhen the R
eventsareselected.When R H ischosen,the DP isalsoreducedtohalf. TheprobabilitiesforthethreedepolymerizationmechanismsareshowninTable 1 Table1.
Asthedepolymerizationreactionproceeds,thetimeevolutioniscalculatedinasimilar fashionasthatofdissolutionbyusingarandomnumber, ξ ,whichlieswithintherange of ( 0,1 ] :
Thesemicroscopiceventsrepeatuntilmultipleincrementsof Δ t accumulatetoform themesoscopictimestep,atwhichpointupdatestotheconcentrationandtemperature aremade.
TheKappanumber(κ ),ameasureofthelignincontentinpulp,isdescribedasfollows:
(5) where c s i isdefinedastheconcentrationofthesolidcomponent i inawoodchip.Here, i variesfrom1to5andisrepresentedbythefivesolidphasecomponents:highreactive lignin( s 1 ),lowreactivelignin( s 2 ),cellulose( s 3 ),xylan( s 4 ),andgalactoglucomman( s 5 ). Specifically,itisgivenby:
Thedevelopedmultiscalemodelisnowusedtogeneratedataofflinefordifferentoperatingconditionsbyvaryingtheinputprofilesofthetemperature,cookingtime,andNaOH concentration.Thisisconductedinordertoobtainacomprehensivesetofinput–output data.Specificdetailsabouttherangesareprovidedinthenextsection.Thedataisthen utilizedfortrainingtheLSTM-ANNmodel,whichservesasasurrogatemodel.
Theproposedmultiscalemodelisutilizedtogeneratehigh-qualitydatafortraining theLSTM-ANNmodel.Specifically,theoperatingconditions,suchasthecookingtime, NaOHconcentration,andfree-liquortemperature,aresystematicallyvariedoverarange. Themultiscalemodelisevaluatedofflinetoobtain750differentdatasets.Thecooking timerangesbetween60and120minwithincrementsof10min,theNaOHconcentration rangesbetween 50–92wt% withincrementsof3%,andthefree-liquortemperatureranges between390and430Kinatimeseriesmannerwithincrementsof10K.
Atotalof750datasetswereselectedtoensurethatallpossiblepermutationsand combinationsofdifferentinputprofileswerecovered,limitingtheunknownregionswhere theneuralnetworksmighthavetoextrapolateandmakesubparpredictions.Theoutput valuesoftheKappanumberandcellulose DP areobtainedevery3sbythemodel,resulting inavaryingnumberoftime-seriessequencedatacontaining1200–2400samplingpoints perdataset.Itisimportanttonotethat,whilethecookingtimeandNaOHconcentration remainconstantthroughoutthedurationofonesuchmodelrun,thetemperaturevaries overtimeineveryrun.TheoutputsofthemodelarethesequencedataoftheKappa numberandcellulose DP
Inordertoestablisharelationshipbetweenthepastandpresentoutputs,theoutput valuesoftheprevioustimesteparealsoconsideredinthetraininginput.Thewindow length(i.e.,thenumberofpastoutputsconsidered)canbemodified;however,forthiscase, weuseonlythemostrecentvalueattime t topredicttheoutputsattime t + 1.Onceacomprehensivemixofthesedatasetsthatexhaustivelycoversallpossibleoperatingconditions isobtained,thenextstepistotraintheneuralnetworkmodelonthisgenerateddata.
Asthepulpingprocessinvolvesbothtime-seriesandtime-invariantdatacharacteristics,thesemustbehandleddifferentlyforimprovedpredictionaccuracy.Therefore,inthis work,wefocusonusingLSTMnetworkstohandlethetemporalbehaviorofdataandANN tohandlethetime-invariantdata.ThiscombinationofLSTMandANNisusedasthey
cansimultaneouslyhandlebothtypesofinputs,asreportedinpreviousstudies[45–47]. LSTMs,whichareanadvancementofrecurrentneuralnetworks(RNNs),areknownfor accuratelycapturinglong-andshort-termtimedependencies.
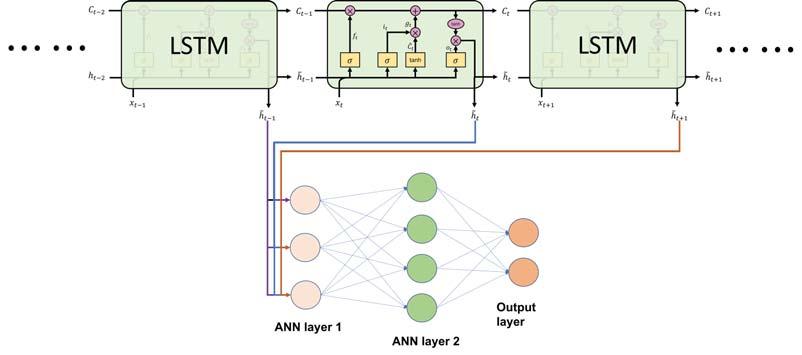
StandardRNNsgenerallysufferfromtheproblemofvanishing/explodinggradients duetothemultiplicationofweightsoverseverallayers[34,48].LSTMsovercomethis problembyusingfeedbackloopsinthehiddenlayersandenforcingaconstanterrorflow throughtheinternalstatesofspecialunitscalledmemorycells.
ByemployingmultipleLSTMlayerswherethehiddenunitsofthepreviouslayerare usedasinputforthenextlayer,complexprocessescanbemodeled,andhiddenhierarchical informationcanbeextracted.ThiscombinationofLSTM-ANNiswell-suitedforprocesses withtime-varyingandtime-invariantdata.TheproposedLSTM-ANNmodelistrained onthedatageneratedbythemultiscalemodeluntiladesiredtestaccuracyofover98% isachieved.
LSTMsareabletomodellong-termsequentialtimedependenciesthroughtheuseof input,output,andforgetgates[49,50].Thesenetworkstakeinthecurrentinputvalue x t , previousoutputvalue h t 1 ,andpreviousunitstate c t 1 asinputsandproduceacurrent outputvalue h t andunitstate c t asoutputs.Incontrast,ANNshaveasetofunitsin thehiddenlayerthatareconnectedtoeveryunitinthepreviousandsubsequentlayers. AcombinedLSTM-ANNnetworkisshowninFigure 3,wheretheinputisrepresentedby x , theoutputisrepresentedby h ,nonlinearactivationfunctionsarerepresentedbyalogistic sigmoid ( σ ( · )) andhyperbolictangent ( tanh ( · )) ,point-wisemultiplicationandaddition arerepresentedby ∗ and + ,andthecellstateisrepresentedby C
ThefigureconsistsofthreeLSTMunitsasarepresentativeexampletoshowtheflow ofdata,whichtransfertheoutputs h t 1 , h t ,and h t +1 totheANNlayers.TheANNlayers thenprocessthetime-invariantinputdatathroughnonlinearactivationfunctionsand connecttotheoutputlayer,representingtheKappanumberandcellulose DP inthiscase. ByusingLSTMlayersfirst,thenetworkisabletoextracttime-varyinginformationdirectly fromtheinputlayer,makingiteasiertoextracttemporaldependencies.
Thecellstate, c ,flowsthroughthechainoftheLSTMblockattimeinstant t ,being optionallymodifiedbythegates,whicharerepresentedbytheequationsbelow:
ThefirstgateinanLSTMnetworkistheforgetgate,representedby f t inEquation(7), whichcontrolstheamountofthecellstatethatisdiscarded.Thesecondgateisthe inputgate,representedby g t inEquations(8)–(10),whichdecidestheamountofinput informationtobestoredinthecellstate.TheupdatedcellstateisdefinedinEquation(11). Theinputlayer,representedby i t ,defineswhichcellstatewillbeupdated,andcandidate valuesforupdatingitarerepresentedby ˆ c t .Thefinalgateistheoutputgate,represented by o t ,whichdefinestheoutputoftheLSTMblock.
Thisgatedeterminestheamountofcellstatethatwillbeoutput,whichisdefinedby Equations(12)and(13).Thetrainableweightsforeachgatelayerarerepresentedby W f , Wi , Wc ,and Wo ,andthebiasassociatedwitheachgatelayerisrepresentedby b f , bi , bc , and bo .Thetrainingprocessandtheimpactofthenetworkhyperparametersontraining andmodelperformancearediscussedin[51,52].Foreaseofunderstanding,theoutput stateoftime-step t inlayer l canbedescribedasfollows:
AfterobtainingtheoutputsfromtheLSTMlayers,thenextlayeristheANNlayer. Thetrainableweightsandbiasesforthislayerarerepresentedby Wa and b a ,respectively. TheoutputoftheANNlayerisdenotedby y andisgivenbythefollowingequations:
Thedataissplitbetween80%trainingand20%testing.Themodelcanbetrained usingtheDeepLearningToolboxinMATLAB,TensorFlow,orPyTorch.Thereareseveral optimizersavailable,suchasRMSProp,SGD,Adam,andAdaGrad;however,forthiswork, theAdamoptimizerwasused[53].Theoptimalstructurewasdeterminedthroughtrial anderrorbyalteringthenetworkhyperparameters,suchasthenumberoflayers,nodes, typesofactivationfunctions,batchsize,anddropoutrate[54].Thetrainingprocesswas consideredcompletewhenthe R 2 valueofthetestpredictionswasmorethan0.98.Oncethe LSTM-ANNmodelwastrained,anMPCwasdesigned,whichusedthetrainedmodelas aninternalevaluatorateveryinstant,insteadofacomplexfirst-principlesmodel,toobtain theoptimalinputprofiles.
MPCiswidelyusedinchemicalplantsandrefineriestocontrolandoptimizethe processwhileconsideringrealplantconstraints[37,55–57].Typically,usinganonlinear MPCisadvantageousasitcanaccuratelyrepresenttheactualprocessdynamics;however,a nonlinearfirst-principlesmodeliscomputationallyexpensiveandcannotbeusedonline fortimelycontrolactions.Manystudieshaveusedstate-spacemodels,suchasN4SID andotherdata-driventechniques,toformareduced-ordermodelforcontrollerpurposes, butthesemethodssufferfromlowaccuracy—mainlywhendealingwithnonlineartimevaryingdata.
Inthiswork,weproposeanLSTM-ANN-basedMPCdesign,whereawell-trained LSTM-ANNmodelisusedtooptimizetheprocessinsteadofthecomplexfirst-principles model.Theprimarygoaloftheoptimizeristoachievethedesiredset-pointvaluesfor
theKappanumberandcellulose DP andobtainoptimalinputprofilesforappropriate controlactions.Thecontrollersolvesaninverseproblembyidentifyinganinputprofile thatprovidestheclosestoutputvaluestothedesiredset-pointvalue.Theseinputscanbe bothconstantortime-varying.Theseinputsarethenappliedtothefirst-principlesprocess model,andtheoptimizationproblemissolvedagainforthenextsetoftimeinstantsina recedinghorizonfashion.
TheLSTM-ANN-basedfeedbackcontrolsystemisdesignedtoregulateboththe Kappanumberandcellulose DP .Thecontrolframeworkincludesanobjectivefunction andprocessconstraintsasillustratedbelow:
where κ istheKappanumber, DP isthecellulosedegreeofpolymerization, T isthefreeliquortemperature, ρ istheNaOHconcentration,and τ isthecookingtimeofthepulping process.ThedesiredKappanumberis κ sp ,andthefinalobtainedKappanumberafterthe pulpingprocessis κ f .
Similarly,thedesiredcellulose DP is DPsp ,andtheobtained DP is DP f .Asper Equation(17),allthreeinputs(cookingtime,concentration,andtemperature)aresettozero afterthecookingtimeisexceeded.Theupperandlowerboundsoftheinputsaredescribed inEquations(18)–(20).Equations(21)and(22)indicatethatthecookingtimeandNaOH concentrationremainconstantthroughoutthepulpingprocess.TheLSTM-ANNmodel, asrepresentedinEquation(24),runsateveryiteration,calculatingtheKappanumberand cellulose DP ,andoptimizingtheinputprofiles.
AsshowninEquation(24),weincludethedependencyoftheKappanumberandDP obtainedfromthemultiscalemodelattime t topredicttheoutputsatthenexttimestep t + 1.Here,weusetheinherentnatureofLSTMmodelstopredictthefuturestateswhen wehavethetruemeasurementvaluesofthepastfromtheprocess,denotedby κ meas and DPmeas [58–60]. Thus,theinputtotheLSTM-ANNmodelincludesthecurrentmeasurement valuesfromtheprocess(i.e.,themultiscalemodel)alongwiththemanipulatedinputs.
TheMPCthensolvestheoptimizationproblemandobtainstheinputprofilesforthe nexttimeinstantstoapplytothemultiscalemodel.Afterapplyingthefirstinputvaluesto themultiscalemodel,themeasurementvaluesoftheKappanumberandDPareobtained forthenextinstant,whichisthenfedtotheLSTM-ANNmodelalongwiththeotherthree inputs.Thisensuresclosed-loopoperationoftheprocess.Theresultsofthiscontrolsystem willbediscussedinthenextsection.
Remark1. Theaccuracyofthecontrolframeworkisheavilydependentonthevarietyandquality ofthedatausedtotrainthemodel.Therefore,itisessentialtorunthemodelwithdifferentsetsof inputprofiles.Additionally,theaccuracyofthecontrollerisalsohighlydependentontheoptimizer chosentosolvetheoptimizationproblem.
Remark2. Itisimportanttonotethat,intheLSTM-ANN-basedcontroller,thepastvaluesofthe outputsarefedinasinputtotheneuralnetworkalongwiththeoperatingconditions(thecooking time,NaOHconcentration,andtemperature).Thus,duringclosed-loopoperation,theoutputs obtainedfromthemultiscalemodelarefedintothesurrogateLSTM-ANNmodelalongwiththe otheroperatingconditionsinordertopredictthefutureoutputsoftheprocessandobtaintheoptimal inputprofiles.AnassumptionhereisthatthemeasurementsoftheKappanumberandDPare availableevery10minfromthemultiscalemodel.
4.ResultsandDiscussion
4.1.MultiscaleModel
Themultiscalemodelisusedtopredictthetemporalevolutionofwoodchipproperties aswellasthespatiotemporalevolutionofthekMClatticeatatemperatureof420Kand aNaOHconcentrationof50wt%.AsshowninFigure 4,theorange,yellow,purple, andgreensitesrepresentlignin,cellulose,xylan,andgalactoglucommaninthesolid phase,respectively,whilethebluesitesrepresenttheentrapped-liquorphase.Asthesolid componentsdissolve,theligninandhemicellulosecontentinthechipsfallsignificantly, andtheentrapped-liquorcontentincreases.
ThepredictiontrendsoftheKappanumberandcellulose DP areshowninFigure 5 TheKappanumberisseentograduallydecreasefrom165to113asdelignificationoccurs inthewoodchips,whilethecellulose DP showsasharpdropatthebeginningofthe pulpingprocessandthenachievestheequilibriumaround1600.Toverifytheaccuracyof themultiscalemodel,itwasvalidatedagainstdataofthreedifferentwoodspecies:Date PalmRachis,PinusRadiata,andEucalyptus[61–63].Themodelwasrunat413Kwith acookingtimeof120minandaNaOHconcentrationof12wt%,andtheresultsareshown inTable 2
Itisseenthat,forallthreedifferentwoodspecies,theset-pointvaluesoftheKappa numberandcellulose DP aresimilartothevaluesfoundintheliterature[61–63],andthe meanerrorislessthan10%.Thissuggeststhatthemultiscalemodelisavalidvirtual experimentforthebatchpulpdigesterprocess,andcanbeusedtogeneratedatafor varyingoperatingconditionsinordertotraintheLSTM-ANNmodelstructure.
Remark3. TheresultsshowninFigure 5 arerepresentative,andthetrendsoftheKappanumber and DP forotherinputprofilesfollowasimilartrend.Itisassumedthatthemultiscalemodel remainseffectiveunderallthesedifferentoperatingconditions.
Throughoptimizationofthenetworkstructure,thebeststructurewasobtainedwith threehiddenlayers,eachcontaining40nodes.Abatchsizeof16andadropoutrateof0.5
wereusedasitwasfoundthatusingadropoutlayerinconjunctionwiththeearlystopping techniquereducedtheoverfittingofthedata[38].Theoptimalnetworkstructurewas chosenfromseveralnetworkconfigurationslistedinTable 3 andincludesaninputlayer, threeLSTMlayers,anANNlayer,afullyconnectedlayer,anoutputlayer,andaregression layer.Thenetworkconfigurationshowninthethirdrow(SerialNo.3)waschosenasit showedahigh R 2 valuewitha0.5dropoutrate.
Table2. Acomparisonofthecellulose DP andKappanumberbetweentheexperimentaldataand modelsimulationattheendofthepulpingprocess(t = t end )forthreedifferentwoodspecies[61–63].
Remark4. Thelistednetworkconfigurationsarenotacomprehensiveset.Duringtheprocessof hyperparametertuning,awiderangeofstructureswithavaryingnumberofnodes,layers,typesof activationfunctions,anddropoutrateswereconsidered.
Thetrainedmodelwastestedon100testdatasetsforaccuracyevaluation.Theparity plotsbetweenthemultiscalemodelandLSTM-ANNmodelfortheKappanumberand cellulose DP attheendofthepulpingprocessareshowninFigure 6.Anupperandlower boundof10%wasaddedtothebisector.Theplotshowsthatthemodelwaswell-trained andhadanaverage R 2 valueof0.9953fortheKappanumberand0.9846forcellulose DP Inordertocomparetheaccuracywhenadeepneuralnetwork(DNN)wasused insteadofanLSTMtotrainthedatawithacombinationoftime-invariantandtime-varying operatingconditions,parityplotsbetweenthemultiscalemodelandDNNmodelareshown inFigure 7.The R 2 valuesfortheKappanumberandcellulose DP areseentobeverylow (lessthan0.8)despitethenetworkstructurehavingthreelayerswith40hiddennodeseach (thesamenumberoftotalnodesastheLSTMmodel).ThisshowsthattheDNNwasunable tocapturethetemporaldependenciesastheLSTMdid,andthustheaforementionedLSTM networkstructurewasselectedforfurtherstudy.Next,thecontrollerresultsarepresented.
Table3. ListofconfigurationsfortheLSTMnetwork.
Asshownintheparityplots,theLSTM-ANNmodeleffectivelyestablishesarelationshipbetweentheoperatingconditionsandtheoutputset-pointvalues.ThisLSTM-ANN modelisthenintegratedintotheMPCdescribedintheprevioussectiontoobtainthe optimalinputprofiles.Theseprofilesarethenusedinthemultiscalemodeltocalculate theKappanumberandcellulose DP inaniterativemannerateachtimestep.Todemonstratethecontroller’scapabilities,thedesiredset-pointvaluesofKappanumber=90and cellulose DP =700wereset.Figure 8 showstheoptimalinputprofilesforthecookingtime, NaOHconcentration,andthefree-liquortemperatureunderMPCoperation.Asexpected, thecookingtimeandNaOHconcentrationremainedconstantthroughouttheprocess, followingtheconstraintssetinEquations(21)–(22).
Figure6. (a)ParityplotfortheKappanumberpredictionforthetestdata(100datasets)attheendof thepulpingprocess t = t end withtheLSTM-ANNmodeland(b)parityplotfor DP predictionforthe testdata(100datasets)attheendofthepulpingprocess t = t end withtheLSTM-ANNmodel.
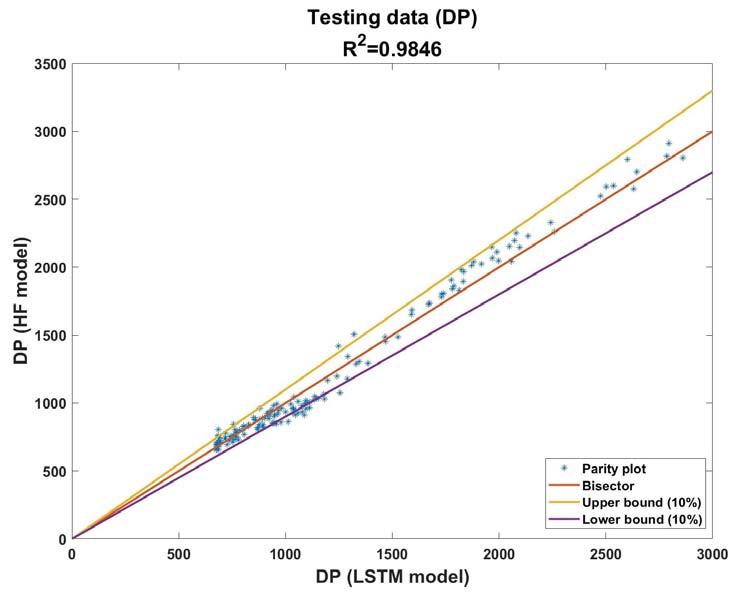
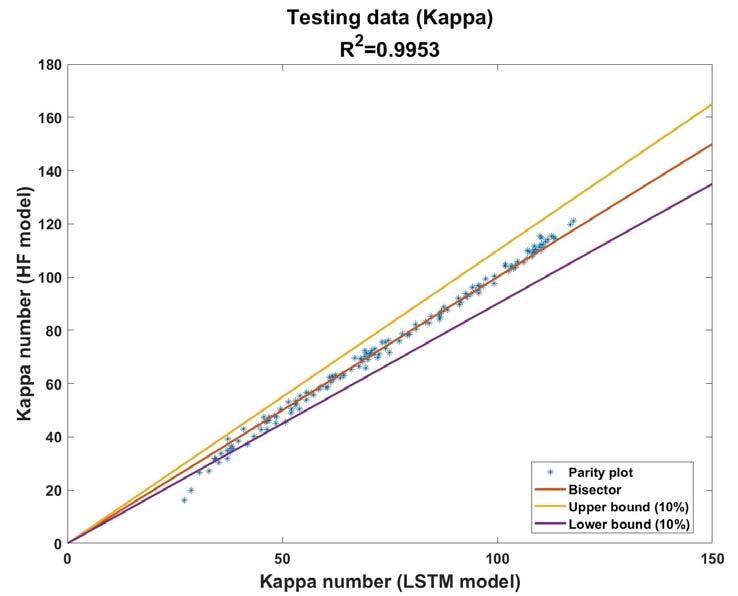
Testing data (Kappa)
Testing data (DP)
plot
Figure7. (a)ParityplotfortheKappanumberpredictionforthetestdata(100datasets)at t = t end withtheDNNmodeland(b)parityplotfor DP predictionforthetestdata(100datasets)at t = t end withtheDNNmodel.
Acookingtimeof80minandaNaOHconcentrationof62wt%wereobtained. Theoptimalfree-liquortemperatureprofilealsovariedbetween390and430Kwithcontrol actionsbeingtakenevery10min.Figure 9 showstheoutputunderMPCoperation.It isseenthatthecellulose DP dropsquicklyinvalueatthestartandthenstabilizesnear thedesiredset-pointvalue.TheKappanumbersteadilydecreasesoverthecourseof theprocess,andattainsavalueclosetotheset-pointvalueof90.Thus,ourframework demonstrateditscapabilitytoobtainoptimalconstantvaluesforthecookingtimeand NaOHconcentrationinadditiontoatime-varyingprofileforthefree-liquortemperature. Remark5. AllthekMCsimulations,MPCcalculations,andneuralnetworktrainingwereperformedonacomputerwithanIntelCorei7–4770CPUwith3.40GHzand16.0GBRAMrunning onaWindows10,64-bitoperatingsystemusingMATLAB2022a.Themultiscalemodeltook around10–15mintorun,whiletheLSTM-ANNmodelwithintheMPCcouldbeexecutedwithin seconds.Ascontrolactionsaretakenevery10min,thisprovidesenoughtimefortheusertoadjust theoperatingconditionsandreruntheMPCforthenextiteration.
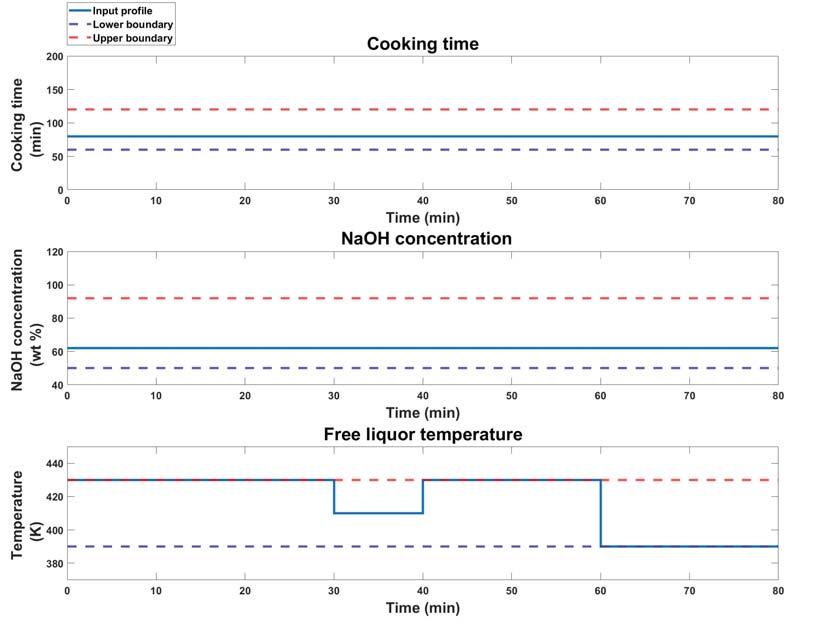
5.Conclusions
Inconclusion,inthisarticle,wepresentedthedevelopmentofalayeredmultiscale modelthatintegratesmassandenergybalanceequationsfromtheextendedPurduemodel withakMCalgorithmtopredictthetemporalevolutionofcrucialpaperproperties,such astheKappanumberandcellulose DP .Themodeldescribesthedegradationofwood chipsassociatedwiththedissolutionofwoodchipcomponentsandthedepolymerization ofcelluloseduetoalkalinehydrolysis,peeling-off,andstoppingreactions.Themultiscale model,whichactsasavirtualexperiment,wasvalidatedandthenusedofflinewith differentsetsofoperatingconditionstoobtainarichsetofdatafortrainingtheLSTM-ANN modelwithan R 2 valueofover0.98.
Finally,aclosed-loopcontrollerwasdesignedusingtheLSTM-ANN-basedneural networktoobtainoptimalprofilesofoperatingconditionsthatareacombinationoftimeinvariantinputs(suchasthecookingtimeandNaOHconcentration)andtime-varying inputs(suchasthefreeliquortemperature).Thecontrollerachievedtargetset-point valuesfortheKappanumberandcellulose DP withminimaloffsetwhileconsidering processconstraints.ThistrainedLSTM-ANNmodelcan,thus,beutilizedinplaceofthe complexfirst-principlesmodeltosignificantlyreducethecomputationtimewhileusingan onlinecontroller.
AuthorContributions: Conceptualization,P.S.,H.-K.C.andJ.S.-I.K.;methodology,P.S.,H.-K.C. andJ.S.-I.K.;software,P.S.andH.-K.C.;validation,P.S.;formalanalysis,P.S.,H.-K.C.andJ.S.-I.K.; investigation,P.S.andJ.S.-I.K.;resources,P.S.,H.-K.C.andJ.S.-I.K.;datacuration,P.S.andH.-K.C.; writing—originaldraftpreparation,P.S.;writing—reviewandediting,P.S.andJ.S.-I.K.;visualization, P.S.,H.-K.C.andJ.S.-I.K.;supervision,J.S.-I.K.;projectadministration,J.S.-I.K.;fundingacquisition, J.S.-I.K.Allauthorshavereadandagreedtothepublishedversionofthemanuscript.
Funding: FinancialsupportfromtheTexasA&MEnergyInstituteandtheArtieMcFerrinDepartment ofChemicalEngineeringisgreatlyacknowledgedbytheauthors.
DataAvailabilityStatement: Thedatapresentedinthisstudyareavailableonrequestfromthe correspondingauthor.Thedataarenotpubliclyavailableduetoprivacyreasons.
ConflictsofInterest: Theauthorsdeclarenoconflictofinterest.
1. VDP-FactsaboutPaper2022.Availableonline: https://papertoexport.com/paper-consumption-worldwide-from-2020-to-2030-2/ (accessedon10January2023).
2. Tsai,W.H.;Lai,S.Y.GreenproductionplanningandcontrolmodelwithABCunderindustry4.0forthepaperindustry. Sustainability 2018, 10,2932.[CrossRef]
3. Pätäri,S.;Tuppura,A.;Toppinen,A.;Korhonen,J.GlobalsustainabilitymegaforcesinshapingthefutureoftheEuropeanpulp andpaperindustrytowardsabioeconomy. For.PolicyEcon. 2016, 66,38–46.[CrossRef]
4. Lawrence,A.;Karlsson,M.;Thollander,P.Effectsoffirmcharacteristicsandenergymanagementforimprovingenergyefficiency inthepulpandpaperindustry. Energy 2018, 153,825–835.[CrossRef]
5. Singh,A.K.;Bilal,M.;Iqbal,H.M.;Meyer,A.S.;Raj,A.Bioremediationofligninderivativesandphenolicsinwastewaterwith ligninmodifyingenzymes:Status,opportunitiesandchallenges. Sci.TotalEnviron. 2021, 777,145988.[CrossRef][PubMed]
6. Choi,H.K.;Kwon,J.S.I.Modelingandcontrolofcellwallthicknessinbatchdelignification. Comput.Chem.Eng. 2019, 128,512–523.[CrossRef]
7. Choi,H.K.;Kwon,J.S.I.Multiscalemodelingandmultiobjectivecontrolofwoodfibermorphologyinbatchpulpdigester. AIChE J. 2020, 66,e16972.[CrossRef]
8. Li,J.;Gellerstedt,G.Onthestructuralsignificanceofthekappanumbermeasurement. Nord.PulpPap.Res.J. 1998, 13,153–158. [CrossRef]
9. Hart,P.W.;Colson,G.W.;Antonsson,S.;Hjort,A.Impactofimpregnationonhighkappanumberhardwoodpulps. BioResources 2011, 6,5139–5150.
10. Alves,A.;Santos,A.;daSilvaPerez,D.;Rodrigues,J.;Pereira,H.;Simoes,R.;Schwanninger,M.NIRPLSRmodelselectionfor KappanumberpredictionofmaritimepineKraftpulps. WoodSci.Technol. 2007, 41,491–499.[CrossRef]
11. Gurnagul,N.;Page,D.H.;Paice,M.G.Theeffectofcellulosedegradationonthestrengthofwoodpulpfibres. Nord.PulpPap. Res.J. 1992, 7,152–154.[CrossRef]
12. Karak,T.;Bhagat,R.;Bhattacharyya,P.Municipalsolidwastegeneration,composition,andmanagement:Theworldscenario. Crit.Rev.Environ.Sci.Technol. 2012, 42,1509–1630.[CrossRef]
13. Haile,A.;Gelebo,G.G.;Tesfaye,T.;Mengie,W.;Mebrate,M.A.;Abuhay,A.;Limeneh,D.Y.Pulpandpapermillwastes: Utilizationsandprospectsforhighvalue-addedbiomaterials. Bioresour.Bioprocess. 2021, 8,1–22.[CrossRef]
14. Fang,Z.;Li,B.;Liu,Y.;Zhu,J.;Li,G.;Hou,G.;Zhou,J.;Qiu,X.Criticalroleofdegreeofpolymerizationofcellulosein super-strongnanocellulosefilms. Matter 2020, 2,1000–1014.[CrossRef]
15. DeSilva,R.;Byrne,N.Utilizationofcottonwasteforregeneratedcellulosefibres:Influenceofdegreeofpolymerizationon mechanicalproperties. Carbohydr.Polym. 2017, 174,89–94.[CrossRef][PubMed]
16. Carvalho,M.;Ferreira,P.;Figueiredo,M.CellulosedepolymerisationandpaperpropertiesinE.globuluskraftpulps. Cellulose 2000, 7,359–368.[CrossRef]
17. Rasi,M.Permeabilitypropertiesofpapermaterials.In ResearchReport/DepartmentofPhysics;UniversityofJyväskylä:Jyväskylä, Finland,2013.
18. Abdelmouleh,M.;Boufi,S.;Belgacem,M.N.;Dufresne,A.;Gandini,A.Modificationofcellulosefiberswithfunctionalized silanes:Effectofthefibertreatmentonthemechanicalperformancesofcellulose–thermosetcomposites. J.Appl.Polym.Sci. 2005, 98,974–984.[CrossRef]
19. Gustafson,R.R.;Sleicher,C.A.;McKean,W.T.;Finlayson,B.A.Theoreticalmodelofthekraftpulpingprocess. Ind.Eng.Chem. ProcessDes.Dev. 1983, 22,87–96.[CrossRef]
20. Andersson,N.;Wilson,D.I.;Germgård,U.Animprovedkineticmodelstructureforsoftwoodkraftcooking. Nord.PulpPap.Res. J. 2003, 18,200–209.[CrossRef]
21.Christensen,T. AmathematicalModeloftheKraftPulpingProcess;PurdueUniversity:WestLafayette,IN,USA,1982.
22. Bhartiya,S.;Dufour,P.;DoyleIII,F.J.Fundamentalthermal-hydraulicpulpdigestermodelwithgradetransition. AIChEJ. 2003, 49,411–425.[CrossRef]
23. Choi,H.K.;Kwon,J.S.I.MultiscalemodelingandcontrolofKappanumberandporosityinabatch-typepulpdigester. AIChEJ. 2019, 65,e16589.[CrossRef]
24. Son,S.H.;Choi,H.K.;Kwon,J.S.I.Multiscalemodelingandcontrolofpulpdigesterunderfiber-to-fiberheterogeneity. Comput. Chem.Eng. 2020, 143,107117.[CrossRef]
25. Pahari,S.;Bhadriraju,B.;Akbulut,M.;Kwon,J.S.I.Aslip-springframeworktostudyrelaxationdynamicsofentangledwormlike micelleswithkineticMonteCarloalgorithm. J.ColloidInterfaceSci. 2021, 600,550–560.[CrossRef][PubMed]
26. Andersen,M.;Panosetti,C.;Reuter,K.ApracticalguidetosurfacekineticMonteCarlosimulations. Front.Chem. 2019, 7,202. [CrossRef][PubMed]
27. Son,S.H.;Choi,H.K.;Kwon,J.S.I.Applicationofoffset-freeKoopman-basedmodelpredictivecontroltoabatchpulpdigester. AIChEJ. 2021, 67,e17301.[CrossRef]
28. Son,S.H.;Choi,H.K.;Moon,J.;Kwon,J.S.I.HybridKoopmanmodelpredictivecontrolofnonlinearsystemsusingmultiple EDMDmodels:Anapplicationtoabatchpulpdigesterwithfeedfluctuation. ControlEng.Pract. 2022, 118,104956.[CrossRef]
29. Dobbelaere,M.R.;Plehiers,P.P.;VandeVijver,R.;Stevens,C.V.;VanGeem,K.M.Machinelearninginchemicalengineering: Strengths,weaknesses,opportunities,andthreats. Engineering 2021, 7,1201–1211.[CrossRef]
30. Venkatasubramanian,V.Thepromiseofartificialintelligenceinchemicalengineering:Isithere,finally? AIChEJ. 2018, 65,466–478. [CrossRef]
31. Bhadriraju,B.;Narasingam,A.;Kwon,J.S.I.Machinelearning-basedadaptivemodelidentificationofsystems:Applicationtoa chemicalprocess. Chem.Eng.Res.Des. 2019, 152,372–383.[CrossRef]
32. Pahari,S.;Moon,J.;Akbulut,M.;Hwang,S.;Kwon,J.S.I.Estimationofmicrostructuralpropertiesofwormlikemicellesviaa multi-scalemulti-recommendationbatchbayesianoptimization. Ind.Eng.Chem.Res. 2021, 60,15669–15678.[CrossRef]
33. Yu,Y.;Si,X.;Hu,C.;Zhang,J.Areviewofrecurrentneuralnetworks:LSTMcellsandnetworkarchitectures. NeuralComput. 2019, 31,1235–1270.[CrossRef]
34.Hochreiter,S.;Schmidhuber,J.Longshort-termmemory. NeuralComput. 1997, 9,1735–1780.[CrossRef]
35. Thompson,M.L.;Kramer,M.A.Modelingchemicalprocessesusingpriorknowledgeandneuralnetworks. AIChEJ. 1994, 40,1328–1340.[CrossRef]
36. Prasad,V.;Bequette,B.W.Nonlinearsystemidentificationandmodelreductionusingartificialneuralnetworks. Comput.Chem. Eng. 2003, 27,1741–1754.[CrossRef]
37. Jeon,B.K.;Kim,E.J.LSTM-basedmodelpredictivecontrolforoptimaltemperatureset-pointplanning. Sustainability 2021, 13,894. [CrossRef]
38. Wu,Z.;Rincon,D.;Luo,J.;Christofides,P.D.Machinelearningmodelingandpredictivecontrolofnonlinearprocessesusing noisydata. AIChEJ. 2021, 67,e17164.[CrossRef]
39. Shah,P.;Sheriff,M.Z.;Bangi,M.S.F.;Kravaris,C.;Kwon,J.S.I.;Botre,C.;Hirota,J.Deepneuralnetwork-basedhybridmodeling andexperimentalvalidationforanindustry-scalefermentationprocess:Identificationoftime-varyingdependenciesamong parameters. Chem.Eng.J. 2022, 441,135643.[CrossRef]
40. Choi,H.K.;Kwon,J.S.I.Multiscalemodelingandcontroloffiberlengthinpulpdigester.InProceedingsofthe2020American ControlConference(ACC),Denver,CO,USA,1–3July2020;pp.4343–4348.
41. Jung,J.;Choi,H.K.;Son,S.H.;Kwon,J.S.I.;Lee,J.H.Multiscalemodelingoffiberdeformation:Applicationtoabatchpulp digesterformodelpredictivecontroloffiberstrength. Comput.Chem.Eng. 2022, 158,107640.[CrossRef]
42. Irle,M.A.;Barbu,M.C.;Reh,R.;Bergland,L.;Rowell,R.M.10WoodComposites. Handb.WoodChem.WoodCompos. 2012, 321–411 [CrossRef]
43. VanLoon,L.;Glaus,M.Reviewofthekineticsofalkalinedegradationofcelluloseinviewofitsrelevanceforsafetyassessment ofradioactivewasterepositories. J.Environ.Polym.Degrad. 1997, 5,97–109.[CrossRef]
44. Pavasars,I.;Hagberg,J.;Borén,H.;Allard,B.Alkalinedegradationofcellulose:Mechanismsandkinetics. J.Polym.Environ. 2003, 11,39–47.[CrossRef]
45. Kim,D.;Kim,M.;Kim,W.Waferedgeyieldpredictionusingacombinedlongshort-termmemoryandfeed-forwardneural networkmodelforsemiconductormanufacturing. IEEEAccess 2020, 8,215125–215132.[CrossRef]
46. Kowsher,M.;Tahabilder,A.;Sanjid,M.Z.I.;Prottasha,N.J.;Uddin,M.S.;Hossain,M.A.;Jilani,M.A.K.LSTM-ANN&BiLSTMANN:Hybriddeeplearningmodelsforenhancedclassificationaccuracy. ProcediaComput.Sci. 2021, 193,131–140.
47. Makris,D.;Kaliakatsos-Papakostas,M.;Karydis,I.;Kermanidis,K.L.CombiningLSTMandfeedforwardneuralnetworks forconditionalrhythmcomposition.In ProceedingsoftheInternationalConferenceonEngineeringApplicationsofNeuralNetworks; Springer:Athens,Greece,2017;pp.570–582.
48. Feng,C.;Chang,L.;Li,C.;Ding,T.;Mai,Z.ControlleroptimizationapproachusingLSTM-basedidentificationmodelfor pumped-storageunits. IEEEAccess 2019, 7,32714–32727.[CrossRef]
49. Schwedersky,B.B.;Flesch,R.C.;Dangui,H.A.Practicalnonlinearmodelpredictivecontrolalgorithmforlongshort-termmemory networks. IFAC-PapersOnLine 2019, 52,468–473.[CrossRef]
50. Gers,F.A.;Schmidhuber,J.;Cummins,F.Learningtoforget:ContinualpredictionwithLSTM. NeuralComput. 2000, 12,2451–2471. [CrossRef][PubMed]
51. Greff,K.;Srivastava,R.K.;Koutník,J.;Steunebrink,B.R.;Schmidhuber,J.LSTM:Asearchspaceodyssey. IEEETrans.NeuralNetw. Learn.Syst. 2016, 28,2222–2232.[CrossRef]
52. Graves,A.;Schmidhuber,J.FramewisephonemeclassificationwithbidirectionalLSTMandotherneuralnetworkarchitectures. NeuralNetw. 2005, 18,602–610.[CrossRef][PubMed]
53.Kingma,D.P.;Ba,J.Adam:Amethodforstochasticoptimization. arXiv 2014,arXiv:1412.6980.
54. Bergstra,J.;Bardenet,R.;Bengio,Y.;Kégl,B.Algorithmsforhyper-parameteroptimization. Adv.NeuralInf.Process.Syst. 2011, 24,2546–2554.
55. Shah,P.;Sheriff,M.Z.;Bangi,M.S.F.;Kravaris,C.;Kwon,J.S.I.;Botre,C.;Hirota,J.Multi-rateobserverdesignandoptimalcontrol tomaximizeproductivityofanindustry-scalefermentationprocess. AIChEJournal 2022, 69,e17946.[CrossRef]
56. Narasingam,A.;Kwon,J.S.Developmentoflocaldynamicmodedecompositionwithcontrol:Applicationtomodelpredictive controlofhydraulicfracturing. Comput.Chem.Eng. 2017, 106,501–511.[CrossRef]
57. Pahari,S.;Moon,J.;Akbulut,M.;Hwang,S.;Kwon,J.S.I.Modelpredictivecontrolforwormlikemicelles(WLMs):Applicationto asystemofCTABandNaCl. Chem.Eng.Res.Des. 2021, 174,30–41.[CrossRef]
58. Zarzycki,K.;Ławry´nczuk,M.LSTMandGRUneuralnetworksasmodelsofdynamicalprocessesusedinpredictivecontrol:A comparisonofmodelsdevelopedfortwochemicalreactors. Sensors 2021, 21,5625.[CrossRef][PubMed]
59. Yunpeng,L.;Di,H.;Junpeng,B.;Yong,Q.Multi-stepaheadtimeseriesforecastingfordifferentdatapatternsbasedonLSTM recurrentneuralnetwork.InProceedingsofthe201714thwebinformationsystemsandapplicationsconference(WISA),Liuzhou, China,11–12November2017;pp.305–310.
60. Sagheer,A.;Kotb,M.TimeseriesforecastingofpetroleumproductionusingdeepLSTMrecurrentnetworks. Neurocomputing 2019, 323,203–213.[CrossRef]
61. Khiari,R.;Mhenni,M.;Belgacem,M.;Mauret,E.ChemicalcompositionandpulpingofdatepalmrachisandPosidonia oceanica–Acomparisonwithotherwoodandnon-woodfibresources. Bioresour.Technol. 2010, 101,775–780.[CrossRef][PubMed]
62. Mishra,S. BleachingofCellulosicPaperFibreswithOzone-EffectontheFibreProperties;InstitutPolytechniquedeGrenoble:Grenoble, France,2010.
63. Mansouri,S.;Khiari,R.;Bendouissa,N.;Saadallah,S.;Mhenni,F.;Mauret,E.Chemicalcompositionandpulpcharacterizationof Tunisianvinestems. Ind.Crop.Prod. 2012, 36,22–27.[CrossRef]
Disclaimer/Publisher’sNote: Thestatements,opinionsanddatacontainedinallpublicationsaresolelythoseoftheindividual author(s)andcontributor(s)andnotofMDPIand/ortheeditor(s).MDPIand/ortheeditor(s)disclaimresponsibilityforanyinjuryto peopleorpropertyresultingfromanyideas,methods,instructionsorproductsreferredtointhecontent.
Volume 9, Number 2, 2023
Wood is a versatile resource due to its inherent properties such as low density, good weight to strength ratio, unique hierarchical structure, microscale pores, and ease of processing, including its biodegradability and renewability. In the building and construction industry, engineered transparent wood (ETW) may serve as a sustainable replacement for glass which is environmentally unfriendly in its manufacture and application. Natural wood is non transparent due to its low optical transmittance, therefore, lignin and chromophores are modified or eliminated, and a polymer is infiltrated in order to achieve transparency. Engineered transparent wood (ETW) exhibits excellent optical properties (transmittance > 80%), high haze (haze > 70%), thermal insulation (thermal conductivity less than 0.23Wm−1 K−1), unique hierarchical structure, good loadbearing performance with tough failure behaviour (no shattering) and ductility. These properties extend wood applications to optical components such as solar cells, screens, windows, magnetic materials, and luminescent and decorative materials. This review details the production of ETW and how the wood density, wood thickness, wood type, wood direction, cellulose volume fraction, extent and type of delignification, polymer type, functionalisation of ETW affect the morphological, functional, optical, thermal, photodegradation and mechanical properties of ETW.
Contact information:
1 Discipline of Chemical Engineering, College of Agriculture, Engineering and Sciences, University of KwaZulu-Natal (Howard Campus), Durban, South Africa
2 Biorefinery Industry Development Facility (BIDF), Council for Scientific and Industrial Research (CSIR), Durban, South Africa
3 Centre for Nano Structured Materials (CeNAM), Council for Scientific and Industrial Research (CSIR), Pretoria, South Africa
4 Department of Chemistry, Nelson Mandela University, Port Elizabeth, South Africa.
Case Studies in Cellulose (2023) 30:5447 –5471 https://doi.org/10.1007/s10570-023-05239-z
Creative Commons Attribution 4.0 International License
The Paper Industry Technical Association (PITA) is an independent organisation which operates for the general benefit of its members – both individual and corporate – dedicated to promoting and improving the technical and scientific knowledge of those working in the UK pulp and paper industry. Formed in 1960, it serves the Industry, both manufacturers and suppliers, by providing a forum for members to meet and network; it organises visits, conferences and training seminars that cover all aspects of papermaking science. It also publishes the prestigious journal Paper Technology International® and the PITA Annual Review , both sent free to members, and a range of other technical publications which include conference proceedings and the acclaimed Essential Guide to Aqueous Coating.
Cellulose (2023) 30:5447–5471
https://doi.org/10.1007/s10570-023-05239-z
Thabisile Brightwell Jele · Jerome Andrew · Maya John · Bruce Sithole
Received: 11 January 2023 / Accepted: 1 May 2023 / Published online: 17 May 2023
© The Author(s) 2023
Abstract Wood is a versatile resource due to its inherent properties such as low density, good weight to strength ratio, unique hierarchical structure, microscale pores, and ease of processing, including its biodegradability and renewability. In the building and construction industry, engineered transparent wood (ETW) may serve as a sustainable replacement for glass which is environmentally unfriendly in its manufacture and application. Natural wood is non transparent due to its low optical transmittance, therefore, lignin and chromophores are modified or eliminated, and a polymer is infiltrated in order to achieve transparency. Engineered transparent wood
T. B. Jele (*) · B. Sithole Discipline of Chemical Engineering, College of Agriculture, Engineering and Sciences, University of KwaZulu-Natal (Howard Campus), Durban, South Africa e-mail: thabisilejele94@gmail.com
T. B. Jele · J. Andrew · B. Sithole Biorefinery Industry Development Facility (BIDF), Council for Scientific and Industrial Research (CSIR), Durban, South Africa
M. John
Centre for Nano-Structured Materials (CeNAM), Council for Scientific and Industrial Research (CSIR), Pretoria, South Africa
M. John
Department of Chemistry, Nelson Mandela University, Port Elizabeth, South Africa
(ETW) exhibits excellent optical properties (transmittance > 80%), high haze (haze > 70%), thermal insulation (thermal conductivity less than 0.23Wm−1 K−1), unique hierarchical structure, good loadbearing performance with tough failure behaviour (no shattering) and ductility. These properties extend wood applications to optical components such as solar cells, screens, windows, magnetic materials, and luminescent and decorative materials. This review details the production of ETW and how the wood density, wood thickness, wood type, wood direction, cellulose volume fraction, extent and type of delignification, polymer type, functionalisation of ETW affect the morphological, functional, optical, thermal, photodegradation and mechanical properties of ETW.
Keywords Engineered transparent wood · Delignification · Polymer
Introduction
Increasing population and industrialisation worldwide cause energy shortages, high cost of energy, and environmental concerns related to the use of fossil fuels for energy generation (Li et al. 2018c). In particular, the construction sector is a major energy consumer accounting for approximately 30% of global energy usage (United Nations Environment Programme 2017; Qiu et al. 2019; Li et al. 2019b; Montanari et al. 2019). In addition, greenhouse gas emissions
emanating from the energy use of buildings are also a major concern. Consequently, there is growing interest in the construction of energy-efficient buildings that incorporate renewable, safe, and cheap building materials. The production of glass is an expensive and environmentally unfriendly process that emits 25,000 metric tons of CO2 annually (EIA 2016; Li et al. 2019b). The high intrinsic thermal conductivity (~ 1 W m−1 K−1) of glass windows in buildings causes significant heat loss (Qiu et al. 2019; Mi et al. 2020b). Glass also poses safety risks as it shatters upon impact (Li et al. 2016b; Mi et al. 2020b).
Some limitations of natural wood are due to its anisotropy, low conductivity, moisture expansion and drying, shrinkage and non-transparency caused by its low optical transmittance. Therefore, there is an urgent need to explore a more sustainable alternative to glass, such as transparent composites produced from wood, referred to as engineered transparent wood (ETW) composites. The ETW composites possess advantages such as high mechanical performance of wood along with optical properties such as transmittance and haze. Although other options such as internal and external blinds, concrete with optical fibre, transparent thermal barriers, angular selective shading systems, coatings, films, and multi-pane windows have been developed, the problem of high cost is still a major drawback (Li et al. 2018c; Mi et al. 2020b). ETW is cheap, sustainable, renewable, lightweight (low density = 1200 kg m−3), and has a high fracture toughness which alleviates safety issues associated with the brittleness of glass (Li et al. 2016b, 2017a; Wang et al. 2018). Li et al. (2017a) showed that ETW had stress at break of approximately 100 MPa, which was comparable to that of glass (116 MPa). The strain at failure of ETW was 2.18% which was much higher than glass (0.19%).
The low optical transmittance of wood is due to three main factors: (1) light scattering at the interfaces between the cell wall tissue with a refractive index (RI) around 1.56 and the empty lumen pore space (RI of 1.0) in wood cells (e.g. cells such as tracheids, wood fibres, and vessels) and the presence of lignin (Li et al. 2019b; Wu et al. 2019a; Chen et al. 2020; Bisht et al. 2021); (2) light scattering due to the mismatch of refractive indices of wood components such as cellulose and hemicelluloses (both with RI of 1.53) and lignin with RI of 1.61 (Li et al. 2018a); and (3) the strong
light-absorption of lignin chromophoric groups that accounts for 80–95% of the light absorption (Li et al. 2018a). In contrast, cellulose and hemicelluloses are optically colourless. In producing ETW, it is necessary to reduce light absorption by removing or modifying lignin and to minimise light scattering at the air/cell wall interface to achieve transparency (Wu et al. 2019a). Conventionally, the production of ETW entails delignification of the wood followed by infiltration of the wood ultrastructure with a refractive index-matched polymer to reduce light scattering and refractive index, suppress light reflection and increase transparency (Montanari et al. 2019). The delignified wood has a unique mesoporous cell wall structure and a high specific area (Montanari et al. 2019). The infiltrated polymer improves the mechanical strength of delignified wood by glueing wood cellulose nanofibers together (Zhu et al. 2016a). Studies have shown that ETW has excellent optical properties: transmittance > 80%, high haze > 70%, high thermal insulation (thermal conductivity less than 0.23Wm−1 K−1) (Mi et al. 2020b), unique hierarchical structure, good loadbearing performance with tough failure behaviour (no shattering) and high ductility.(Yu et al. 2017; Yaddanapudi et al. 2017; Li et al. 2018a). In addition, ETW is lightweight, environmentally safe and mechanically stronger than unmodified wood (Wu et al. 2020). However, ETW is susceptible to weathering and photodegradation due to exposure to natural outdoor conditions such as sunlight, rain, temperature, humidity and pollutants (Bisht et al. 2021). This may cause discolouration, decrease in light transmittance, chemical degradation, microstructure breakdown and loss of mechanical properties, thereby limiting its applications (Bisht et al. 2021). For example, at a wavelength of 550 nm and UV irradiation exposure time of 0 h, 50 h, 100 h and 250 h, the light transmittance was 83%, 75%, 71% and 60%, respectively. Applications of ETW range from optical components to building materials, solar cells, and magnetic materials to luminescent and decorative materials (Fig. 1) (Gan et al. 2017a, 2017b; Yu et al. 2017; Bi et al. 2018; Li et al. 2019c; Wang et al. 2019a; Wu et al. 2020; Zhang et al. 2020; Xia et al. 2021). Montanari et al. (2019) reported successful use of ETW for thermal energy storage due to its
good heat storage, large latent heat of melting and crystallisation (76 J g−1 and 74 J g−1, respectively), tunable optical transparency during phase change, and thermal insulation properties. In cases where the ETW is used as a window or roof, a consistent/ uniform lighting and improved thermal insulation are guaranteed due to a combination of high optical transmittance and haze (Montanari et al. 2019). Li et al. (2019b) assembled perovskite solar cells with good long-term stability on a transparent wood substrate at low temperature (< 150 ). Even though studies have been conducted to produce ETW with excellent strength and optical properties, there is a need to improve its scalability by reducing polymer shrinkage due to polymerisation, eliminate polymer cell wall interface gaps by improving polymer infiltration, improve the short and long-term integrity of ETW, especially in outdoor applications, exploit the natural characteristics of wood to the benefit of the EWT (e.g. aesthetic patterns), and alleviate the optical constraints of ETW related to thickness by surface modification, lamination and multilayering (Jia et al. 2019; Mi et al. 2020a). Several studies detailing ETW preparation methods, optical and mechanical performance, and thermal properties references arranged in ascending order of the publication year are summarised in Table 1. This review article details the ETW production process and how the nature of wood (wood density, composition,
wood directions, wood type and infiltrated polymer) affect the morphological, functional, optical, thermal, photo degradation and mechanical properties of EWT.
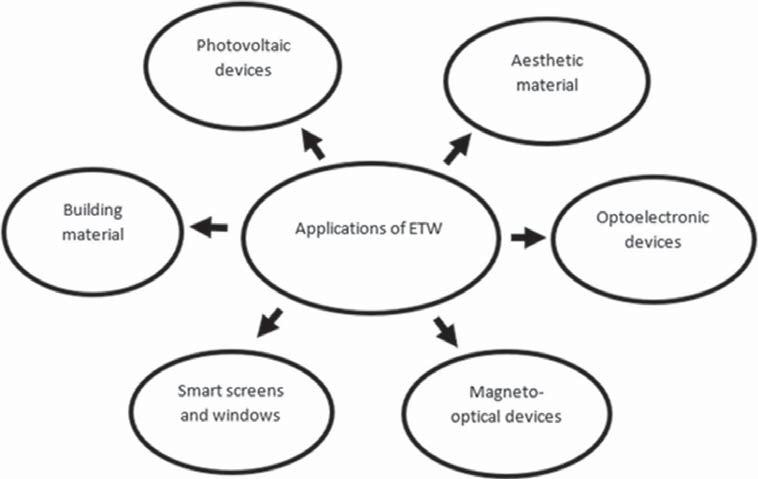
Various techniques have been developed to produce ETW. These techniques mainly consist of two main steps: delignification or lignin modification and polymer infiltration. The schematic diagram of the production process of ETW is shown in Fig. 2. Several studies described the process of immersing a piece of wood (balsa, birch, pine etc.) in sodium chlorite in an acetate buffer solution at high temperature (80–95 ) for 6 to 12 h (Li et al. 2017a; Yaddanapudi et al. 2017; Fu et al. 2018; Qin et al. 2018). The process resulted in white coloured wood after the removal of lignin and part of the hemicelluloses because of the light scattering at the interface between the cell wall and air (Gan et al. 2017a). However, this solution-based method was long, produced a lot of liquid waste, and used large volumes of chemicals to ensure complete immersion and weakened wood. Delignified wood was characterised by delamination, fragility and instability (Li et al. 2017a). Wu et al. (2019a) performed an optimisation study of delignification time and optical properties in the production of ETW. Delignification was done using sodium chlorite in an
Table 1 A review of studies published on the production of ETW
References
Mechanical properties and Thermal conductivity
propertiesOptical properties (wavelength 550 nm)
Lignin removalPolymerDirectionPhysical
Natural wood type and dimensions
Vol:. (1234567890)
1 3
Li et al. ( 2016a )
thermal conductivity = 0.23 Wm −1 K −1
Epoxydimen- sion = 1.4 × 3.0 × 3.5 cm light transmit- tance > 85% haze ~ 95%
BasswoodSodium hydroxide, sodium sulfite
Li et al. ( 2016b )
Zhu et al. ( 2016a )
Zhu et al. ( 2016b )
Gan et al. ( 2017a )
Khalili et al. ( 2017 )
Li et al. ( 2017a )
strain 3.9% stress ~ 90%
Sodium chloritePMMA––transmittance = 85% haze = 71%
Balsa wood 20 × 20 × 0.6 mm 3
strength = 45.4 MPa modulus of elasticity = 2.4 GPa toughness = 1.2 MJm −3
strength = 23.4. MPa modulus of elasticity = 1.22 GPa toughness = 0.59 MJm −3
tensile strength = 40 MPa elastic modulus = 1.4 GPa strain = 5.5% stress = 42%
tensile strength = 152 MPa
stress at breakage = 100 MPa strain to failure = 2.18% % thermal conductivity = 0.23 W m −1 K −1
PVPthickness = 1 mmlight transmit- tance = 90% haze = 80%
Sodium hydroxide magnesium sulphate, hydrogen peroxide
Density of 160 kg m −3
Basswood 30 × 22 × 1 mm 3
80% haze
thickness = 2 mmtransmittance
90%
resinlongitudinal direction
epoxy
Sodium hydroxide, sodium sulfite, hydrogen peroxide
Basswood 50 × 50 × 3 mm 3
80% haze
radialthickness = 2 mmtransmittance
99%
––transmit- tance = 63.8%
polymethyl methacrylate, iron (III) oxide
Sodium chlorite, glacial acetic acid, and hydrogen peroxide
Cathay poplar 20 × 20 × 0.5 mm 3
Sodium chloritePMMA–light transmit- tance = 50%
Basswood 20 mm × 20 mm × 0.42 mm
Sodium chloritePMMA––optical transmittance = 83% and haze = 75%
Balsa wood 5 × 60 mm 2
Cellulose (2023) 30:5447–5471
References
Mechanical properties and Thermal conductivity
Lignin removalPolymerDirectionPhysical propertiesOptical properties (wavelength 550 nm)
Table 1 (continued)
Sodium chloritePMMA––transmittance = 70%Yaddanapudi et al. ( 2017 )
Bi et al. ( 2018 )
stress ~ 27 MPa radial (R) stress ~ 60 MPa longitudinal (L)
acrylic acid––transmittance ~ 85% haze ~ 85%
Diethylstilbes- trol, oxalic acid and choline chloride under microwave- assisted treatment, alkaline hydrogen peroxide
–Fu et al. ( 2018 )
tangentialoptical transmittance = 85% haze = 71%
Sodium chloritepolymethyl methacrylate
Lang et al. ( 2018 )
strain = 2.9%.
stress = 140 MPa work of fracture = 3.2 MJ m −3
light transmittance 80% haze = 70%
PMMA–thermal conductivity = 0.23 WmK −1
–Li et al. ( 2018c )
Qin et al. ( 2018 )
Natural wood type and dimensions
Beech wood thickness = 0.1 mm
Balsa wood chips 20 × 20 × 1 mm 3
Balsa wood 2 × 2 × 0.6 cm 3
Birch woodSodium hypochlorite buffered to pH 4.6
Sodium chloritePMMA––non acetylated transmittance 64% haze 64%
Birch wood thickness = 1.5 mm
Acetylated: transmittance 90% haze 52%
–
Sodium chloritePMMA––non acetylated transmittance 83% haze 70% acetyated: transmittance = 92% haze = 50%
Balsa wood thickness = 1.5 mm
Epoxy–thickness = 2 mmtransmittance = 64%tensile strength = 75 MPa
Sodium chlorite, hydrogen peroxide
Balsa wood thickness = 2 mm
Table 1 (continued)
References
Mechanical properties and Thermal conductivity
Lignin removalPolymerDirectionPhysical propertiesOptical properties (wavelength 550 nm)
Natural wood type and dimensions
1 3 Vol:. (1234567890)
Wang et al. ( 2018
Chen et al. ( 2019 )
Foster et al. ( 2019 )
acetylated: elastic modulus = 7 GPa, Tensile strength = 40 MPa non-Acetylated: elastic modulus = 6.5 GPa tensile strength = 75 MPa
Jia et al. ( 2019 )
tensile strength = 43.4 MPa elongation at break = 19.14% tough- ness = 6.10 MJ m −3
Li et al. ( 2019a )
Li et al. ( 2019b )
PMMA––transmittance = 92% haze = 56%
Sodium hydroxide magnesium sulphate, hydrogen peroxide
Poplar 80 × 25 × 1 mm 3
PMMA––non-acetylated transmit- tance ~ 40% acetylated transmittance ~ 52%
Sodium chlorite acetate buffer solution, acetic anhydride
Balsa wood 20 × 20 × 5.9 mm 3 density = 120 kg m −3
acetylated: transmittance = 46%, haze 89% elastic modulus = 7 GPa tensile strength = 40 MPa Non acetylated: transmit- tance = 38%, haze 90%, elastic modulus = 6.5 GPa, Tensile strength = 75 MPa
longitudinallythickness = 3.41 mm— 2ply acetylated
Sodium chloritephotocurable methacrylate resin
Basswood 100 × 100 × 1.6 mm 3
density = 401 kg m −3
transmit- tance = 91.5% haze = 10.1%
density = 109 000 kg m −3
epoxy resinlongitudinal direction
Sodium hypochlorite
Basswood blocks with a density of 455 kg m −3 thickness = 0.71 mm
strength 20 MPa stress 20 MPa strain 3.2
epoxy resin–Thickness = 0.5 cmlight transmittance
87% haze 90%
thermal conductivity = 0.23 W m −1 K −1
Hydrogen peroxide
Basswood 50 × 50 × 5 mm
–Sodium chloritePMMA–thickness = 1 mmlight transmit- tance = 86% Haze
70%
Cellulose (2023) 30:5447–5471
References
Mechanical properties and Thermal conductivity
Lignin removalPolymerDirectionPhysical propertiesOptical properties (wavelength 550 nm)
Table 1 (continued)
fracture strength = 31.9 MPa modulus = 5.26 GPa Li et al. ( 2019c )
PMMA––transmittance = 75% haze = 85%
Sodium hydroxide, sodium sulfite
Montanari et al. ( 2019 )
strength = 71 MPa elastic modulus = 14.9 GPa thermal conductivity = 0.30 Wm −1 K −1
Sodium chloritePMMA–thickness = 0.5 mmtransmittance = 80% haze = 80%
Qiu et al. ( 2019 )
Sodium chloritePMMA––transmittance = 40%high fracture strength = 96.4 MPa modulus = 4.27 GPa thermal conductivity = 0.2 Wm −1 K −1
Rao et al. ( 2019 )
fracture strength = 13.3 MPa elastic modulus = 0.26 GPa
PVAtransmittance = 80% haze = 90%
Sodium hydroxide
magnesium sulphate, hydrogen peroxide
Wang et al. ( 2019b )
longitudinalthickness = 0.35 mmtransmittance = 80%young modulus = 2.08 MPa
polymerizable deep eutectic solvents, acrylic-acid, choline chloride
Sodium hydroxide and sodium sulfite solution
Wu et al. ( 2019b )
Wu et al. ( 2019c )
Natural wood type and dimensions
Balsa wood 250 × 250 × 15 mm 3
Silver birch wood 20 × 20 × 0.5 mm 3 density 620 kg m −3
Poplar wood 25 × 25 × 1 mm 3
Poplar wood (Populus deltoides) 20 × 20 × 1 mm 3
Balsa wood slice 40 × 20 mm 2
BasswoodSodium chlorite––thickness = 0.42 mmoptical transmittance = 61%
PMMA––transmittance = 30%tensile strength = 165 MPa
BasswoodHydrogen peroxide, trisodium citrate dihydrate, sodium hydroxide
Table 1 (continued)
References
Mechanical properties and Thermal conductivity
Lignin removalPolymerDirectionPhysical propertiesOptical properties (wavelength 550 nm)
Natural wood type and dimensions
1 3 Vol:. (1234567890)
Höglund et al. ( 2020 )
tensile strength = 59.0 MPa modulus = 3.4 GPa stress 60 MPa strain 2.5%
––transmittance = 90% haze = 36%
trifunctional ene monomer, tetrafunctional thiol monomer, UV-initiator 1-hydroxy- cyclohexyl phenyl ketone
Sodium silicate, sodium hydroxide, magnesium sulfate, dieth- ylenetriamine- pentaacetic acid and hydrogen peroxide
Balsa wood density of 90—110,000 kg m −3 15 × 15 × 0.9—1.2 mm 3
Cellulose volume fraction = 4.3
tensile strength = 53.7 MPa modulus = 3.2 GPa stress 55 MPa strain 2.5%
––transmittance = 85% haze = 63 ± 0.7%
Sodium chloritetrifunctional ene monomer, tetrafunctional thiol monomer, UV-initiator 1-hydroxy- cyclohexyl phenyl ketone
Balsa wood with a density of 90 000 − 110 000 kg m −3 15 × 15 × 0.9 − 1.2 mm
Jungstedt et al. ( 2020 )
modulus = 9 GPa and ultimate strength of 263 MPa
–thickness = 1.3 mmoptical transmittance = 70%
Sodium chloritepoly(methyl methacrylate) (PMMA)
Mi et al. ( 2020a )
strength of 92 MPa, high toughness of 2.73 MJm −3 thermal conductivity = 0.24 Wm −1 K −1
Sodium chloriteEpoxy––transparency ~ 80% haze ~ 93%,
Mi et al. ( 2020b )
tough- ness = 3.03 MJ m −3 Thermal conductivity = 0.19 W m −1 K −1
PVA––transmittance = 91% haze = 15%
Bisht et al. ( 2021 )
cellulose volume fraction = 5.0 ± 0.1
Birch density = 1500 kg m −3
douglas fir 60 × 60 × 2 mm 3
tance = 83.53% haze ~ 95%
Balsa woodSodium hypochlorite
epoxy resin doped with a UV absorber
Poplar wood veneers 100 × 30 × 2 mm 3
Cellulose (2023) 30:5447–5471
References
Mechanical properties and Thermal conductivity
Lignin removalPolymerDirectionPhysical propertiesOptical properties (wavelength 550 nm)
Table 1 (continued)
–Cho et al. ( 2021 )
transmittance = 80% transmittance = 65% with indium tin oxide
epoxy–dimensions = 50 × 50 × 1.2 mm 3
Sodium hydroxide and sodium sulfite solution
Montanari et al. ( 2021 )
strength = 174 MPa, Young’s modulus 17 GPa
at 1.2 mm thicknesstransmittance = 90% Haze = 30%,
Wu et al. ( 2021 )
–transmittance ~ 9%tensile strength = 50 MPa
–transmittance ~ 6%tensile strength 50 MPa
Xia et al. ( 2021 )
tensile strength (46 MPa for L and 31 MPa for T), toughness of L 0.93 and T 1.64 MJ m −3
Natural wood type and dimensions
Balsa wood 50 × 50 × 1.01 mm 3
limonene acrylate monomer
Aqueous PAA solution
PMMA3 ply -same direction
Sodium hypochlorite solution
PMMA3 ply -same direction
Sodium hypochlorite solution
epoxythickness = 1 mm–light transmit- tance ~ 90% high haze ~ 60%
Hydrogen peroxide brushing solar illumination
5455
Balsa wood 304 kg m −3
New Zealand pine = 330 kg m −3 , thickness = 0.5 mm
basswood 0.42 kg m −3 , thickness = 0.5 mm
Balsa wood 200 × 10 × 0.6 mm 3
acetate buffer solution, and the delignification time was varied from 30 to 150 min at 30 min intervals. The maximum optical transmittance achieved was 61% at 800 nm for ETW with 9% lignin content at 150 min delignification time and with methyl methacrylate (MMA) impregnation and polymerisation. The drawbacks of using sodium chlorite were the production of toxic gases and yellowing when lignin reached equilibrium point (Qin et al. 2018). Qin et al. (2018) obtained transparent ETW with 82% light transmittance from 2 mm thick balsa wood delignified by a two-step partial delignification process using 1 wt% sodium chlorite followed by treatment with 5 mol L−1 hydrogen peroxide to prevent yellowing. Li et al. (2017a) modified lignin by only removing the chromophores using hydrogen peroxide from balsa wood. The process was less toxic because hydrogen peroxide is an oxidant that produces only water as a by-product, notably reducing waste liquid production. Eliminating chromophores resulted in highly stable, rigid, well-preserved bleached wood with 80% lignin retention (Li et al. 2017a; Bisht et al. 2021). However, on the downside, high amounts of chemical, water, and energy consumption were noted. Partial delignification was reported to endow the ETW with color and texture for decoration, where absolute transparency was not a priority (Wu et al. 2020). In order to minimise chemical consumption during delignification, Xia et al. (2021) performed a brushing technique on 0.6 mm balsa wood with hydrogen peroxide which preserved the aromatic backbone of lignin but diminished its chromophore content. This was followed by a clear epoxy infiltration into pores using vacuum. ETW with a transmittance > 90%, high haze > 60%, excellent light-guiding over visible wavelength, patternable surface, excellent tensile strength (46.2 MPa for L and 31.4 MPa for T), toughness of
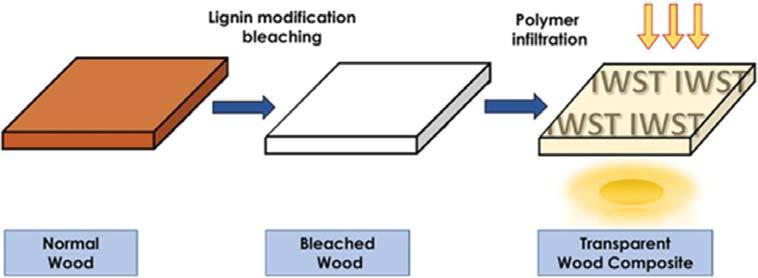
L (0.93 MJ m−3) and T (1.64 MJ m−3) was produced (Xia et al. 2021). Bi et al. (2018) used a low-cost green eutectic solvent to break the bonds between lignin and carbohydrate in 1 mm thick balsa wood under a microwave assistant treatment. The ETW produced by acrylic acid infiltration had light transmittance and haze of 85% and 85%, respectively. Li et al. (2019a) delignified basswood with 30 wt% hydrogen peroxide steam, which penetrated the wood cells and removed lignin together with other dissolved degradation products. The epoxy resin infiltrated ETW of 0.5 mm thickness and had a light transmittance and haze of 87% and 90% respectively.
Various types of polymers used in the production of ETW include epoxy resin polyethylene oxide (PEO), polyvinylpyrrolidone (PVP), polydimethylsiloxane (PDMS), styrene, vinyl carbazole, isobornyl methacrylate and poly(methyl methacrylate) (PMMA) (Bi et al. 2018). Although PMMA has high optical transparency, its main drawback is the lack of compatibility between the polymer and the cell wall of the delignified wood and a refractive index (RI) mismatch with wood (RI is 1.49 for PMMA and 1.53 for holocellulose) leading to decreased transparency and mechanical properties (Li et al. 2018c). Qiu et al. (2019) used a combination of PMMA and antimony tin trioxide (ATO), resulting in improved mechanical properties, although the transparency of polar wood was reduced (Qiu et al. 2019). ATO was composed of hydrophilic groups in the silane coupling, which improved interfacial bonding between PMMA and the delignified wood. Li et al. (2018c) achieved 1.5 mm thick ETW with an optical transmittance of 92% (in the visible wavelength range) by surface application of acetylation on delignified wood substrates followed by PMMA infiltrations. Acetylation reduced the hydrophilicity of wood, thus improving
compatibility between the wood template and PMMA and promoting interface bonding. For 3 mm thick acetylated and non-acetylated ETW, the optical transmittance obtained was 89% and 60%, respectively. In addition to improved optical properties, acetylated ETW exhibited a higher work of fracture (1.0 MJ m−3) compared to glass and a higher modulus of 4 GPa and stress at break of 78.9 MPa compared to the original wood and PMMA. It was concluded that the improved mechanical properties were attributed to the strong interaction between wood and PMMA facilitated by acetyl groups (Li et al. 2018c).
The density of wood can vary significantly depending on the type of species. For instance, Balsa is the lowest density tree species (120 kg m−3 to 160 kg m−3), largely due to its fast growth (Qin et al. 2018; Li et al. 2019b). Populus deltoids is a porous and thin cell walled wood with large cell cavities and short fibres hence its relatively low density of 460 kg m−3 (Chen et al. 2019). After delignification, the density further decreased to 400 kg m−3 due to the enhancement of the wood cell wall porosity after the removal of lignin, hemicellulose and amorphous cellulose. After polymer infiltration into the pores, the ETW increased to 1198 kg m−3. Wang et al. (2021) confirmed the density of ETW (1221 kg m −3) to be higher than that of delignified wood (67 kg m−3) and natural balsa wood (121 kg m−3). Balsa wood of density 126 kg m−3 was delignified by sodium chlorite at pH 4.6 and reduced to a density of 65 kg m−3. After polymer impregnation the density increased to 1232 kg m−3 (Wang et al. 2022). Low-density wood such as pine, ash, and poplar are suspectable to breakage after lignin removal (Li et al. 2017a). Lignin acts as a binder between wood cells, hence the loss in the mechanical integrity of wood after delignification (Mi et al. 2020a). Qin et al. (2018) compared the properties of low-density balsa wood (210 kg m−3) (Ochroma pyramidale) and higher density of basswood (490 kg m−3 Tilia tuan). The tensile strength of transparent high density basswood (8.1 MPa) was higher compared to low density balsa wood (6.1 MPa) with a thickness of 2 mm. Wu et al. (2020) conducted a comparative study of the optical properties of ETW produced from two different wood species (Betula alnoides (Betula) and New Zealand pine (Pinus radiata D. Don) of different
densities and equal thickness. The light transmittance of Betula alnoides with a density of 680 kg m−3 and New Zealand pine with a density of 310 kg m−3 was increased by 11.34% and 14.4%, respectively. Qin et al. (2018) confirmed that the transmittance of the ETW decreased as the original wood density increased. For instance, the light transmittance of balsa with a density of 210 kg m−3 and balsa with a density of 490 kg m−3 was 77% and 64%, respectively. Mi et al. (2020a) demonstrated successful production of tunable aesthetic wood with UV blocking properties from Douglas fir softwood exhibiting annual growth ring patterns of macroscopic and microscopic scales. The two variations in patterns of Douglas fir were termed low density (284 kg m−3) early wood (EW) and high density (846 kg m−3) latewood (LW). However, the preservation of the natural wood aesthetic in hardwood (e.g., basswood, balsa) was not possible owing to its uniform bimodal pores, large lumen diameter and uniform and thinner cell walls (approx. 1.3–2.9 μm) compared to softwood (approx. 5–10 μm for LW). Also, ETW of softwoods, with a cell wall thickness of 1.4–2.6 μm, was not as successful in preserving the natural aesthetic of natural wood upon delignification as LW owing to the faster solution diffusion in EW. Furthermore, a comparative study of wood cut by different methods (cross section and quarter slicing cutting strategies) to achieve two directions [microchannels perpendicular (R-wood) or parallel to the wood plane (L-wood)] was conducted. Delignification was done for 2 h using sodium chlorite in acidic conditions in order to preserve lignin which endowed ETW with UV blocking properties through its phenylpropane structures and phenolic hydroxyl groups. Epoxy was used as a polymer to produce ETW. The mechanical properties of ETW from L wood (tensile strength of 92.0 MPa, toughness of 2.73 MJ m−3) were much higher than for both R wood (tensile strength of 21.60 MPa, toughness of 0.523 MJ m−3) and natural wood (tensile strength of 6.24 MPa). It was concluded that the high mechanical properties of L-ETW were due to the improved synergy between the wood template and the polymer (Mi et al. 2020a). Li et al. (2018c) reported that acetylated ETW produced from wood of high density, had improved transmittance compared to lower density wood. Rao et al. (2019) reported that the density of native poplar veneer only increased from 380 kg m−3 to 910 kg m−3 after polymer impregnation due to
shrinkage of polyvinyl alcohol (PVA) and deformation of the lignin modified wood template during PVA drying. Mi et al. (2020a) reported that delignification of high-density hardwood takes a longer time than low density softwood.
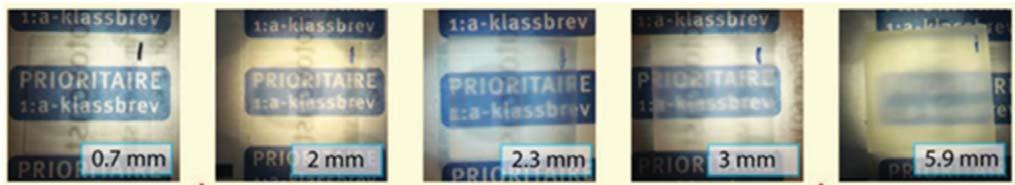
The cellulose volume fraction of wood was calculated according to Eqs. 1 and 2 (Li et al. 2016b).
from birch wood with 30% cellulose by volume, had a transmittance of 64%, while acetylated ETW had a transmittance of 90%. A lower volume fraction of wood of 5% had a transmittance of 83% and 92% for non-acetylated and acetylated ETW, respectively. It was concluded that a high-volume fraction of cellulose resulted in light-scattering originating from the cellulosic cell wall (Li et al. 2016b). An increase in cellulose volume fraction from 5 to 65% resulted in a decrease in transmittance from 85 to 34.6% (Li et al. 2019b). The cellulose volume fraction and cell wall porosity were increased by compression of delignified wood. For instance, Li et al. (2016b) increased the cellulose volume from 5 to 19% by compression of delignified balsa wood. Compression is also important in tailoring wood to the desired thickness.
where Vf is the volume fraction of cellulose, ρc is the density of ETW, ρf is the density of holocellulose (1500 kg m−3), ρm is the density of the polymer, Wm is the weight fraction of the polymer, and Wf is the weight fraction of cellulose.
The cellulose volume fraction in wood is a tunable property that has an effect on the properties of ETW. Fu et al. (2018) reported a linear relationship between the strength of ETW with cellulose volume fraction. For instance, the ultimate strength of ETW with a cellulose volume fraction of 5%, 12.5% and 20% was approximately 40 MPa, 62 MPa and 90 MPa, respectively. Jia et al. (2019) studied the effect of thickness and cellulose volume fraction on the optical properties of ETW. They found that the transmittance of ETW with cellulose volume fractions of 2.89%, 5.86% and 8.71% was approx. 90%, whereas the haze gradually increased to 5%, 10% and 41.6%, respectively. Li et al. (2018c) reported that non-acetylated ETW of a thickness of 1.5 mm, made
Wood thickness and its direction has a direct effect on optical transmittance and haze (Li et al. 2018c). The thinner the wood sample, the higher its light transmittance and the lower its haze (Li et al. 2018a; Qin et al. 2018; Kanócz et al. 2020). Zou et al. (2022) confirmed that an increase in thickness resulted in an increase in haze due to longer light pathways and increased scattering centres. Figure 3 illustrates the decrease in transparency of ETW with an increase in thickness.
Kanócz et al. (2020) reported a dependence of light transmittance on both the thickness and volume fraction of cellulose. Chen et al. (2019) studied the dependence of the optical transmittance of acetylated and non-acetylated ETW on thickness using the anisotropic photon diffusion equation and an equation that quantifies the total transmittance (see Eq. 3). An exponential relationship between
the total transmittance and sample thickness was observed (Chen et al. 2019).
40% for ETW of thickness 0.7 mm and 3.7 mm respectively.
where Ttotal is total transmittance, μ is the isotropic absorption, c is the speed of light in ETW samples, Dxy is the diffusion coefficients perpendicular to the wood fibres, and d is the sample thickness.
Lower thickness resulted in higher optical transmittance because a shorter light pathway lowers light attenuation and vice versa (Montanari et al. 2019). For instance, 1 mm thick ETW had a transmittance of 85% in the radial direction, 2 mm thick ETW had a transmittance of 80% with thickness perpendicular to the longitudinal direction, and 3 mm thick ETW had a transmittance of 90% with thickness in the longitudinal direction (Zhu et al. 2016b; Li et al. 2018c). The transmittance of 0.7 mm and 1.5 mm thick ETW was approx. 90%, whereas haze was 10% and 30%, respectively (Li et al. 2016b). The transmittance of acetylated ETW of thickness 1.5 mm, 3 mm, 7 mm and 10 mm was 92%, 89%, 70% and 60% at a wavelength of 550 nm, respectively (Li et al. 2018c). The optical haze of acetylated ETW of thickness 1.5 mm, 3 mm, 7 mm and 10 mm was approximately 80%, 75%, 50% and 45%, respectively. Chen et al. (2019) compared the differences in transmittance for acetylated and nonacetylated ETW. They found that the transmittance of acetylated ETW of thickness 0.24 cm, 0.32 cm, 0.42 cm, 0.51 cm, and 0.65 cm was 86%, 82%, 77%, 72% and 66% at a wavelength of 550 nm, respectively. Non-acetylated ETW had transmittance values of 84%, 72%, 65%, 62%, 51% and 44% for samples of thickness 0.11 cm, 0.21 cm, 0.25 cm, 0.31 cm, 0.43 cm and 0.46 cm respectively. The light transmittance of 1.5 mm and 2 mm ETW was 80% and 77%, respectively (Qin et al. 2018). ETW is highly anisotropic due to its oriented fibrous structure. Correspondingly, an ETW sample will scatter light differently along two directions (transverse and longitudinal) depending on the light propagation direction (Vasileva et al. 2018). Li et al. (2016b) reported a light transmittance of 90% and
In contrast, optical haze increases with an increase in thickness. Acetylated ETW of thickness 1.5 mm and 3 mm had an optical haze of 50% and 53%, respectively. Non -acetylated ETW of thickness 1.5 mm and 3 mm had an optical haze of 70% and 78%, respectively. The lower optical haze for acetylated ETW was attributed to the improved compatibility between wood and PMMA, resulting in lower light scattering. Rao et al. (2019) reported a decrease in breath and thickness of ETW due to the simultaneous convergence of contracted wood cells. The length, breadth and thickness of the original wood and ETW were 20 × 20 × 1 mm3 and 20 × 16 × 0.7 mm3, respectively. However, the addition of propylene glycol (PG) maintained the lumen and shape of ETW by reducing internal wood stresses, resulting in a sample with dimensions similar to those of original wood, i.e. 20 × 17 × 0.9 mm3 for 50 wt% PG-ETW and 20 × 18 × 0.9 mm3 for 100 wt% PG-RTW (Rao et al. (2019). Wood thickness also affected the duration of delignification. Basswood cut in a direction perpendicular to the wood plane of thickness 20 nm and 40 nm was delignified with hydrogen peroxide and hydrogen acetate steam to a white colour after 4 and 20 h, respectively (Li et al. 2019a).
Wood species have varying densities, cellulose contents, cell structural morphologies, and annual ring structures, all of which affect the structural, mechanical, functional and optical properties of ETW (Rao et al. 2019). Examples of wood species that have been used to produce ETW are balsa, basswood, cathay poplar, pine, birch, and ash (Li et al. 2016b, 2017b, 2017a; Zhu et al. 2016a; Gan et al. 2017b). Figure 4 shows ETW produced from balsa, pine, birch, and ash by the lignin modification process and PMMA infiltration (Li et al. 2017a). Li et al. (2019a) conducted a comparative study on the effect of delignification on two wood species (i.e., basswood and pine) cut in the direction aligned either perpendicular to (Ra) or along (Ro) the wood plane. Basswood had a unique multichannel structure with ultra-thin channel walls and low density. As a result, a longer time (8 h lignin modification and 18 h NaClO2 process) was needed to achieve delignification, compared
to pine which required 4 h. Wu et al. (2021) fabricated multi-layered ETW from two different wood types, i.e., New Zealand pine and Basswood, of densities 330 kg m−3 and 420 kg m−3, respectively and thickness of 0.5 mm. The three-layered ETW were arranged either in the same direction or alternating directions (the first layer and the third layer were in the same direction) according to fibre directions for each type of wood studied. Each type of wood studied was partially delignified using NaClO2 followed by PMMA infiltration into the three layered delignified wood samples. The light transmittance (wavelength = 550 nm) for the three-layered New Zealand pine and basswood ETW arranged in the same direction according to wood fibres was 8% and 6%, respectively. On the other hand, the light transmittance of the three-layered New Zealand pine and basswood ETW arranged in alternating directions was 4% and 3%, respectively. The tensile strength of the three layered ETWs in the same direction and in different directions was approximately 50 MPa and 40 MPa, respectively, for each of the wood species studied. Original New Zealand pine and Basswood had tensile strengths of approx. 37 MPa and 39 MPa for the same direction and approx. 30 MPa and 32 MPa for different directions, respectively. In another study, Foster et al. (2019) compared the optical and mechanical properties of acetylated and non-acetylated single ply and double-ply ETW in an effort to improve mechanical properties and alleviate thickness constraints on ETW. Basswood of thickness 1.6 mm and density
410 kg m3 was delignified, acetylated and infiltrated with PMMA. Two-ply ETW was arranged with one ply in the same direction as the fibre alignment and the other ply positioned 90° transverse to the fibre alignment. The optical properties of acetylated ETW (transmittance = 46%, haze 89%) were superior to those of non-acetylated ETW (transmittance = 38%, haze = 90%). On the other hand, the elastic modulus of acetylated ETW (7 GPa) was slightly greater than non-acetylated, whereas the tensile strength of nonacetylated ETW (75 MPa) was much greater than acetylated ETW (40 MPa). However, for single-ply ETW, the mechanical properties of acetylated ETW (elastic modulus = 4 GPa, tensile strength = 15 MPa) were much higher than for non-acetylated ETW elastic modulus = 3.5 GPa, tensile strength = 10 MPa) positioned 90°/transverse to fibre alignment.
The optical properties of wood are direction dependant due to its anisotropic nature. The way in which wood is sawn affects its cellulose volume fraction, which in turn affects the optical transmittance of ETW. Radially sawn wood and longitudinally sawn wood have a low and high-volume fraction of cellulose, respectively (Kanócz et al. 2020). Low and high volume fraction wood with a thickness of 2 mm exhibits an optical transmittance of 90% and 80%, respectively (Li et al. 2016b). Zhu et al. (2016b) compared the mechanical properties of transparent radially and longitudinally sawn wood to that of their natural counterparts. The fracture strength of transparent longitudinally cut wood strength (45 MPa) was almost twice that of transparent radially cut wood (23 MPa). The fracture strength of natural radially and natural longitudinally cut wood was 4.5 MPa and 42 MPa, respectively (Zhu et al. 2016b). These results were similar to those obtained by Wang et al. (2021), where the mechanical properties of longitudinal ETW (fracture strength = 23 MPa, elastic modulus = 666 MPa, and toughness = 728 kJ m−3) were greater than transverse ETW (fracture strength = 2.6 MPa, elastic modulus = 46 MPa, and toughness = 320 kJ m−3).
The scanning electron microscope (SEM) analysis revealed that in longitudinal ETW, a 3D network was formed due to the interaction of cellulose nanofibers in delignified wood (DW) and the polymer, hence the high mechanical strength compared
to transverse ETW which exhibited weak bonding interfaces between the wood tissue and the polymer. However, R-ETW had an higher optical transmittance of 73.3% than L-ETW with 68.2% (Zhu et al. 2016b; Zhang et al. 2020). It was concluded that the polymer had better compatibility with R-wood due to the small depth of the lumina (Zhu et al. 2016b). Wang et al. (2022) reported thermal conductivities of 0.3 mW m−1 K−1 and 0.29 mW m−1 for transverse and longitudinal editable shape-memory ETW, respectively. Zhang et al. (2020) confirmed the difference in thermal conductivities by producing radial ETW and longitudinal ETW with thermal conductivities of 0.32 W m−1 K−1 and 0.20 W m−1 K−1, respectively. The difference in thermal conductivity values is due to well preserved wood cells even after the delignification process resulting in anisotropic thermal properties. (Li et al. 2016a). Mi et al. (2020a) reported anisotropic thermal properties for axial-ETW and radial-ETW. Radial-ETW and axial ETW had thermal conductivities of 0.24 W m−1 K−1 and 0.41 W m−1 K−1. It was concluded that restrained heat transfer in the radial direction results in greater light scattering than in the axial direction. Further comparison was made between epoxy polymer, ETW and glass. The thermal conductivity of epoxy (0.29 W m−1 K−1) was slightly less than that of ETW (0.3 W m−1 K−1) and glass (0.86 W m−1 K−1). The low thermal conductivity of ETW was due to the low transmission of photon in the wood fibre (Li et al. 2016a). The study of the effect of temperature on the thermal conductivities of transverse ETW showed an increase in thermal conductivity from 0.29 W m−1 K−1, 0.3 W m−1 K−1 to 0.32 W m−1 K−1 at 0 °C, 25 °C and 50 °C, respectively. However, the conductivities remained far less than that of glass. It was concluded that ETW is a more efficient thermal insulator than glass, therefore, making it a suitable alternative in energy efficient buildings (Wang et al. 2022). The same trend was reported by Zou et al. (2022), where the pectinPMMA ETW had a thermal conductivity of approximately 0.1 Wm−1 K−1 far less than that of glass (~ 0.9 Wm−1 K−1). However, the thermal conductivity of PMMA (approx. 0.2 Wm−1 K−1) was slightly higher than that of pectin-PMMA-ETW (Zou et al. 2022).
Longitudinal ETW is characterised by the propagation of light perpendicular to the wood longitudinal direction, high interface density (number of interfaces per length), high transmittance, low haze, isoptropic
light scattering effect and low density of polymer/ cellulose interfaces due to the hollow cylinder shape of wood cells. In contrast, transverse wood is characterised by propagation of light in the transverse plane and with low interface density. Longitudinal wood exhibits isotropic light scattering whereas transverse wood exhibits anisotropic light scattering at the wood cell wall and polymer interface. Moreover, light scattering of longitudinal wood has a balanced angular distribution in both the x and y direction, whereas a larger scattering angle in the y direction compared to the x direction was observed for transverse wood (Li et al. 2018a).
A fast, environmentally friendly, lignin preserving and mechanical strength preserving delignification/ modification method is the most favourable in the production of ETW (Li et al. 2017a). In addition, the delignified wood should be strong enough to allow easy handling during polymer infiltration (Li et al. 2018a). The delignification of wood creates nano and microscale voids in the cell wall, which leads to increased specific surface area from 1.2 m2 g−1 to 20 m2 g−1 in natural wood (Li et al. 2018a). Li et al. (2019a) reported the complete removal of lignin using hot hydrogen peroxide and hydrogen acetate solution to a concentration as low as 0.84%, resulting in increased pores in the cell wall corners, which allowed for more efficient epoxy resin infiltration, high cellulose retention, suppressed interface debonding gaps, high transmittance (87%), high haze (90%), and mechanical strength of ETW. Delignification mainly affects the colour of the natural wood. The methods of delignification include bleaching by total immersion with 1 wt% of sodium chlorite in acetate buffer solution (pH 4.6) at 80 °C (Li et al. 2018c), two step delignification with 1 wt% of sodium chlorite in acetate buffer solution (pH 4.6) at 80 °C sodium chlorite followed by 5 mol L−1 hydrogen peroxide at 90 °C (Qin et al. 2018), 30 wt% H2O2 brushing followed by solar illumination (Xia et al. 2021), lignin chromophore removal using alkaline H2O2 hydrothermal solution (Li et al. 2017a), 2 step delignification with NaOH and sodium sulphate followed by hydrogen peroxide and hydrogen peroxide and hydrogen acetate steaming (Wang et al. 2019a). The measures of delignification are lignin content, lightness, redness and yellowness
(Wu et al. 2019a). Chemical delignification methods are time consuming and operated at high temperatures. For instance, Yaddanapudi et al. (2017) delignified beech wood with thickness 0.1 mm using 5 wt % sodium chlorite in an acetate buffer solution at 95 °C for 12 h. Qin et al. (2018) opted for a 2 step partial delignification and an optimum time of 3 h NaClO2 and 1 h H2O2 treatment for 1 mm thick balsa wood. However, the delignification time required increased with increase in wood thickness. NaClO2 treatment times of 4 h, 5 h and 12 h were recorded for balsa woods of thickness 1.5 mm, 2 mm, and 5 mm, respectively. Xia et al. (2021) avoided using large amounts of chemicals and producing liquid waste streams by using H2O2 brushing instead of delignification by immersion. The ETW produced had a transmittance > 90%, high haze > 60%, and an excellent light guiding over the visible wavelength. Furthermore, the strength of the ETW was 50 times more superior than ETW obtained by delignification by immersion. Wu et al. (2019a) studied the effect of the extent of delignification of basswood on the morphological, optical and mechanical properties of transparent wood production. The lightness of transparent wood increased with delignification, while the redness and yellowness decreased (Wu et al. 2019a). The surface colour was the most obvious observation of ETW samples of different lignin contents (viz., 16%, 15%, 13%, 12% and 9%). Unmodified wood (with 24% lignin content) had a yellowness value of 52.5, while the yellowness values of the ETW samples decreased to approximately 25, 21, 19, 18, and 15, respectively. In contrast, the lightness increased from 69.5 for unmodified wood to 80, 85, 87, 88, and 90 for the ETW samples, respectively. The optical transmittance of the ETW samples increased with an increase in the degree of delignification (Qin et al. 2018; Wu et al. 2019a). For instance, unmodified wood and the most delignified wood (lignin content of 9%) had optical transmittance values of 0% and 61% at a wavelength of 800 nm, respectively. Mechanical properties of the ETW were negatively affected by increased levels of delignification. The tensile strength decreased with a decrease in lignin content in ETW samples. The highest tensile strength was reported for the ETW sample with a low degree of delignification (15% lignin content). Additionally, delignified wood was reported to have lower tensile strength value compared to their respective ETW samples, indicating
that polymer impregnation of MMA contributed to the final improvement of mechanical strength of ETW samples. It was concluded that the pores created by the removal of lignin were responsible for the improvement of light transmittance in samples (Wu et al. 2020). Li et al. (2017a) compared the wet strength measured perpendicular to the fibre direction of various wood species (balsa, birch, pine and ash) with thickness 1.5 mm as a measure of the stability that were delignified by either lignin removal or lignin modification. The wet strength of balsa with a lignin content of 21.3% (lignin modified) and 2.5% (lignin removed) was 7.9 MPa and 6.9 MPa, respectively. Lignin modified (lignin = 20.1%) and delignified Birch wood (lignin = 3.3%) had a wet strength of 14.4 MPa and 1.4 MPa respectively. Lignin modified (lignin = 22.4%) and delignified ash wood (lignin = 5.3%) had a wet strength of 13.9 MPa and 0.8 MPa respectively. Lignin modified pine had a wet strength of 14.4 MPa. Although ash, birch, and pine showed a significant difference between the wet strength of delignified and lignin modified wood samples, the wet strength difference for balsa wood was marginal. Delignified pine wood was too weak for strength testing. Höglund et al. (2020) compared bleaching to delignification in the production of ETW. While the transmittance showed little difference (90% and 85%), the haze of bleached ETW wood and delignified ETW wood varied greatly (36% and 63%). Zhu et al. (2016a) illustrated that the optical transmittance of delignified wood samples increased with increase in degree of delignification. For example, 33%, 50% and 100% delignified wood had transmittances of approx. 2%, 5% and 15%, respectively. These results were in agreement with Khalili et al. (2017), where the light transmittance values of 33%, 35%, 47%, 51%, and 64% delignified ETW was approx. 25%, 35%, 43%,47% and 50%, respectively. The tensile strength of 33%, 35%, 47%, 51% and 64% delignified ETW was 166 MPa, 171 MPa, 161 MPa, 159 MPa and 152 MPa, respectively. Foster et al. (2021) compared the water transport property in chemically modified ETW produced by peroxide-based lignin modification and chlorite-based lignin oxidation. The lignin modified and oxidised wood was further treated via acetylation, 2-hydroxyethyl methacrylate treated treatment and methacrylation. Lignin-modified ETW had lower diffusion coefficients (10.6 for untreated, 2.47 for acetylated, 1.88 methacrylated, 18.91 for
2-hydroxyethyl methacrylate treated) than lignin-oxidized ETWs (12.97 for untreated, 3.93 for acetylated, 5.47 for methacrylated, 46.9 for 2-hydroxyethyl methacrylate treated) at 4 °C due to its high lignin content that was water resistant (Foster et al. 2021). The diffusivity increased with increase in temperature for all ETWs produced because increased thermal energy facilitated faster transport of water into the ETW composite (Foster et al. 2021).
Type of infiltration polymer and compatibility with wood components
The infiltration polymer plays a major role in determining the structural, optical and functional properties of the ETW (Wang et al. 2021). A good polymer is one that has a refractive index that matches that of the wood components, which are cellulose (RI = 1.525), hemicellulose (RI = 1.532), and lignin ( RI = 1.610) (Vasileva et al. 2018). Besides, the refractive index, the viscosity, compatibility and shrinkage of the polymer are important selection criteria (Li et al. 2018a). The polymer’s ability to reduce the optical scattering of the wood may also lead to a desirable combination of high transmittance and low haze. In most studies, PMMA, epoxy resin, polyvinylpyrrolidone, n-butyl methacrylate, polystyrene, dibutylphthalate, iso-bornyl methacrylate, diallyl phthalate and poly vinylcarbazole and poly(acrylic acid) with refractive indices of approximately 1.49, 1.5, 1.53, 1.50, 1.59, 1.52, 1.48, 1.50, 1.68 and 1.45, respectively, are used (Fink 1992; Vasileva et al. 2018; Chen et al. 2020). Li et al. (2018c) reported that polymers had a higher transmittance of 95% compared to transparent wood despite the full infiltration of polymer into wood cell lumens. The decreased transmittance was due to interface bonding which resulted in interface gaps and created optical heterogeneity. The low refractive index of air (1.000) in the interface gaps resulted in light scattering hence decreased transmittance. The air gaps were caused by low compatibility between hydrophilic wood cells and hydrophobic polymers and the shrinkage of the polymer during polymerisation (Li et al. 2018c; Vasileva et al. 2018; Chen et al. 2019). The mechanical properties (in ascending order) of ETW composed of different polymers were: PMMA-ETW; fracture strength = 59.8 MPa and modulus 2720 MPa, epoxy-ETW; fracture strength = 23.4 MPa, modulus = 1220 MPa PVA-ETW-PG; fracture
strength = 13.3 MPa, modulus = 260 MPa (Zhu et al. 2016b; Yu et al. 2017; Rao et al. 2019; Wang et al. 2019b). Correspondingly, pure PMMA (tensile strength = 55.4 MPa, modulus = 2900 MPa) followed by epoxy (tensile strength = 50.2 MPa, Young modulus = 2400 MPa) have the highest strength properties, whereas PVA (tensile strength = 48.4 MPa, Young modulus = 707.9 MPa) has the lowest values (Ibrahim and Hassan 2011; Gong et al. 2016; Yusof et al. 2016; Jain et al. 2017; Seghir and Pierron 2018). It can be concluded that the strength of the polymer positively contributes to the strength of ETW produced. Yue et al. (2021) reported transmittance values (wavelength = 600 nm) of 76.6%, 73.4%, and 64.6% for ETW composed of polyvinyl alcohol (PVOH), PVP and PMMA, respectively. A study to determine the extent to which transmittance can be improved when delignified wood is acetylated before polymer infiltration was conducted (Li et al. 2018c). Acetylated ETW had a high transmittance of 92% at a thickness of 1.5 mm, while non-acetylated ETW had a lower transmittance of 83%. In this case, the wood texture of acetylated EWT was less pronounced. This indicated improved compatibility between the wood and the PMMA polymer. It was observed that with an increase in the thickness of ETW, the transmittance decreased. However, the transmittance of acetylated ETW remained higher than non-acetylated ETW of the same thickness (Li et al. 2018c). In addition, an increase in the difference in transmittance between the acetylated and non-acetylated ETW of the same thickness was noted. Zhu et al. (2016a) opted for a biodegradable polymer, PVP, over epoxy resins which are made of toxic monomers such as bisphenol-A and epichlorohydrin. However, the resulting ETW lacked flexibility. In order to improve the flexibility of the PVP infiltrated ETW, a plasticing agent such as propylene glycol (PG) was used (Rao et al. 2019). Besides biodegradability, PVP is desirable due to its low cost, water solubility, low viscosity in water, excellent film forming property, toughness and transparency, with a refractive index of 1.48 (Wu et al. 2012; Mi et al. 2020b). The hydrophilic nature of PVP alleviated the need to use dehydrating chemicals such as ethanol and acetone in order to increase its compatibility with delignified wood. The thermal conductivities of ETW composed of different polymers had different conductivities, which were far less than the thermal conductivities of glass. For instance,
the thermal conductivities of PVA-ETW, PMMAETW, and Epoxy-ETW were reported to be 0.19 W m−1 K−1, 0.23 W m−1 K−1 and 0.24 W m−1 K−1, respectively (Li et al. 2017a, 2019b; Mi et al. 2020a, 2020b). Wachter et al. (2021) compared the extent of photo degradation of ETWs fabricated using two different polymers (methyl methacrylate, 2-hydroxyethyl methacrylate) over a period of 35 days exposed to monochromatic UV-C (λ—250 nm) radiation. The optical transmittance of methyl methacrylateETW reduced from 58 to 43%, whereas 2-hydroxyethyl methacrylate-ETW reduced from 69 to 57% within 7 days of exposure to UV radiation. Further increase in time resulted in a negligible decrease in optical transmittance (Wachter et al. 2021). It was concluded that decrease in optical properties of both types of ETW was caused by the degradation of both the acrylic polymers and the wood templates. The disadvantages of PVA-ETW were that it had a high solubility in water resulting in weight gain of ETW samples exposed to high humidity conditions. On the other hand, the solubility of PVA favours easy recycling of ETW and recovery of PVA (Rao et al. 2019). Höglund et al. (2020) infiltrated the bleached wood pores with a thiol-ene thermoset to prepare ETW with an optical transmittance of 90% and a haze of 36%. The thiol-ene thermoset network was prepared from thiol PETMP and trifunctional ene TATATO monomers by polymerisation. It was concluded that the adhesion of the thiol-ene polymer significantly contributed to the low haze and high transmittance instead of the wood-polymer matching refractive indices (Höglund et al. 2020).
The disadvantages of ETW, such as low transmittance caused by light scattering at the cellulosepolymer interface, and the loss of optical and mechanical integrity due to exposure to adverse weather conditions (e.g., rain, temperature etc.), can be overcome through functionalisation. The potential for modification and multi functionalities of wood and ETW is due to micro-scale channels and nanopores in the cell wall. Furthermore, functionalisation extends the applications of ETW. Various additives provide the wood composites functionalities, such as luminescence, conductivity, UV stability, aesthetics, fluorescence, stimuli responsiveness,
electromagnetic shielding and magnetocaloric (Li et al. 2017b; Zhang et al. 2020). Bisht et al. (2021) fabricated UV resistant ETW by combing a UV absorber (2-(2H-Benzotriazol-2-yl)-4, 6- di-tertpentylphenol) with an epoxy resin before infiltration into bleached wood. This led to photostable ETW that did not photodegrade nor change colour when exposed to UV light. Also, the UV absorber had no effect on the optical properties of the ETW. A comparative study showed that ETW without a UV absorber had a change in yellowness value of approximately 10, 20, and 25 after 25 h, 100 h and 250 h of UV exposure, respectively. In comparison, ETW containing 1.75% UV absorber content had a change in yellowness value of approximately 2, 5 and 10 after 25 h, 100 h and 250 h of UV exposure, respectively. Increasing UV exposure time resulted in increased photodegradation which was indicated by a decrease in light transmittance. For example, at a wavelength of 550 nm and 250 h UV exposure time, the percentage transmittance loss was 27.5%, 1.43%, and 0.96% for ETW with UV absorber concentrations of 0%, 1% and 1.75%, respectively (Bisht et al. 2021). Wang et al. (2019a) reported the fabrication of photochromic ETW with photo-switching of transmittance in the visible light region and colour tuning properties. The delignified wood was filled with a mixture of photochromic material 30,30-dimethyl-6-nitro-spiro[2H1-benzopyran-2,20-indoline]-10-ethanol (DNSE) and pre-polymerized methyl methacrylate (MMA). The components of DNSE, spiropyran and merocyanine responded to UV light or green light. A similar study involved the fabrication of photochromic and fluorescent ETW with color switching properties from lignin modified basswood, methyl methacrylate (MMA) and a photoluminescent lanthanide-doped aluminum strontium oxide (AlQahtani et al. 2021). Chen et al. (2020) produced a flame-retardant transparent wood composite from pristine natural wood by delignification followed by polyimide infiltration and chemical imidisation. The transparent wood composite showed high mechanical strength (stress and modulus of 169 MPa and 2.11 GPa, respectively) in addition to outstanding flame retardancy characterised by the physical integrity of the composite during combustion. Compared to natural wood and polyimide film, where a shrinkage, twisting and formation of soft and loose
residue occurred, the ETW composite formed a visible layer of char on the residue, therefore, heat transfer between the flame and composite was prevented within 2 s. Cho et al. (2021) fabricated heatshielding transparent wood by application of indium tin oxide on its surface. Balsa wood (50 × 50 × 1.4 mm3) was delignified and infiltrated with epoxy to produce ETW with 80% light transmittance, dielectric constant of 3.344 and the loss tangent was observed at 0.0552. The addition of indium tin oxide resulted in heat shielding ETW with approximately 62% light transmittance. On the other hand, fabrication of heat shielding ETW by the addition of TiO2 nanoparticles resulted in a higher transmittance and haze of 90% and 90%, respectively. The thermal conductivity was 0.3228 W m K−1 (Wu et al. 2022). Fu et al. (2018) fabricated luminescent ETW by delignification of wood veneers followed by compression, impregnation of PMMA combined with quantum dots lamination and polymerisation. In another study, Wang et al. (2021) fabricated 1 mm, 2 mm, and 3 mm thick programmable shape-memory transparent wood (PSMTW) from balsa wood (density 126 kg m−3), using NaCIO2 under acidic conditions, followed by infiltration of epoxy vitrimers. Light transmittances of 75.7%, 61.8%, and 52.8% were reported for 1 mm, 2 mm, and 3 mm thick PSMTW, respectively, whereas the haze for all the ETW samples was approx. 95%. Gan et al. (2017a) endowed transparent wood with magnetic properties by adding RI-matching MMA and magnetic Fe3O4 nanoparticles into the delignified wood template for application in light-transmitting magnetic buildings and magneto-optical devices. The magnetisation of ETW increased with an increase in the concentration of Fe3O4 nanoparticles. However, the mechanical properties decreased with an increase in the concentration of the agglomeration and concentration of the nanoparticles in the cracks in the aggregates. Rao et al. (2019) produced flexible ETW with potential application as a light shaping diffuser by infiltration of aqueous propylene glycol (PG) and plasticised PVP into bleached wood veneers. A light transmittance as high as 80% and a haze of 90% were achieved at a ratio of 1:1 of PG and PVA. Images (Fig. 5) were used to demonstrate the flexibility of ETW (a) bent across the fibre direction; (b) bent across the perpendicular direction of fibre orientation; (c) twisted, and (d)
rolled. Wang et al. (2022) also fabricated flexible ETW by polymerisation of EDCP in a delignified wood template via an epoxy-thiole reaction. The resulting ETW possessed plasticity, shape manipulation capability, good thermal insulation and optical properties. Bending tests were performed on the ETW of 2 mm thickness to measure the bending deformation angles. Stress was applied by an external force on the ETW to form curved shapes at 60 °C and fixation temperature of 0 °C to obtain a temporary shape and recovery observed within 30 min when the temperature was increased back to 60 °C. T-ETW was initially deformed to a temporary curved shape with an angle of 0°. Measurements showed gradual recovery to original rectangular shapes of the deformed T- ETW marked by an increase in bending deformation angles from 0° to 3°, 8°, 18°, 40°, 100°, 144° and 156° from after 0 s, 10 s, 30 s, 1 min, 2 min, 5 min, 10 min and 30 min recovery time, respectively (Wang et al. 2022). In the case of L-ETW, an increase in bending deformation angles from 0° to 3°, 14°, 39°, 91°, 161°, 166° and 170° from after 0 s, 10 s, 30 s, 1 min, 2 min, 5 min, 10 min and 30 min recovery time, respectively (Wang et al. 2022). Li et al. (2017b) produced luminescent transparent wood by the infiltration of quantum dots dispersed in a PMMA/oligomer liquid mixture. Yu et al. (2017) produced 5 mm thick heat shielding ETW from beech wood via NaOH,
Na2SO3 and H2O2 delignification process followed by infiltration of CsxWO3/MMA mixture. Although the optical transmittance of ETW decreased with increased concentration of CsxWO3, whereas the heat shielding ability increased, an optimum dosage of 0.03 wt% in the CsxWO3/MMA mixed solution resulted in 72% transmittance and strength of 59.8 MPa and modulus of 2.72 GPa. Comparison of mechanical properties showed that transparent wood was much stronger (strength = 60.2 MPa, modulus = 2.67 GPa) than CsxWO3/ETW (strength = 59.8 MPa and modulus 2.72 GPa), PMMA (strength = 39.6 MPa, modulus = 1.83 GPa) and natural wood (strength = 55.1 MPa, modulus = 5.67 GPa). The simulation test showed that CsxWO3/ETW can be used as energy efficient smart windows (Yu et al. 2017). Hu et al. (2022) produced ETW with a very low thermal conductivity of 0.157 W m−1 K−1 after coating with a ZnO film via sonochemical deposition process. The low thermal conductive made the ZnO coated ETW ideal for glazing applications.
ETW can be tailor made to fit the specifications of applications. For instance, the thickness of ETW depends on the thickness of initial wood chosen. The mechanical and optical properties of ETW can be controlled by the optical (i.e. refractive index) and mechanical properties of the polymer infiltrated during fabrication. However, for large scale applications, the loss of optical transmittance of ETW of high thickness is a problem. Also, there is need to reduce
polymer shrinkage during polymerization in the production of thick ETW (Li et al. 2018a). The applications of ETW are discussed in the following sections and a summary provided in Table 2
Incorporation of ETW instead of glass as a building material resulted in improved optical transmittance ( 85%), no glare effect, optical haze (> 95%), peculiar light guiding effect with large forward to back scattering ratio (scattering ratio of 9 for 0.5 cm thick ETW), good thermal insulation (i.e. thermal conductivity ~ 0.32 W m−1 K−1 and ~ 0.15 W m−1 K−1 in the cross plane), alleviated safety issues associated with glass, simple and fast fabrication and scalability (Li et al. 2016a). ETW preserves the original cellulose nanofibers of wood which contribute to anisotropic properties. Li et al. (2016a) demonstrated that when ETW is used as a roof top it maintains uniform lighting and a constant temperature inside the building. It was concluded that the application of ETW in a building created comfortable living conditions and reduces energy costs. Li et al. (2019c) used a real house simulation test to confirm the infrared-heat shielding ability and energy storage performance of ETW composed of VO2(M)@SiO2 and thermochromic microcapsules particles. The ETW was proposed to be suitable for building, furniture, thermal insulation, energy conversion, energy storage, and conservation.
Functionalisation of ETW extends its applications to decorative materials. For instance, addition of
ApplicationReferences
Magnetic ETWGan et al. (2017a), Gan et al. (2017b)
Building components (rooftop and windows)Yaddanapudi et al. (2017), Li et al. (2019c)
Smart windowsSamanta et al. (2021)
Flame retardant ETWChen et al. (2020)
Aesthetic materialWang et al. (2019a), Mi et al. (2020a), Mi et al. (2020b), Hoglund et al. (2021)
Smartphone screenMagrini et al. (2021)
PhotovolaicZhu et al. (2016a)
Photovoltaic cellsLi et al. (2019b)
quantum dots to ETW resulted in multi colour luminescence that can be used for planar light sources, building construction elements and furniture (Li et al. 2017b). Yu et al. (2017) produced CsxWO3-ETW with an optical transmittance of 86% and haze of 90%, temperature and humidity resistance (i.e. excellent shielding ability of near-infrared ranging from 780 to 2500 nm). Additionally, the mechanically properties (tensile strength = 60.1 MPa, and modulus = 2.72 GPa fracture strength = 59.8 MPa) of the CsxWO3-ETW were favourable for heat shielding window applications. The transmittance of the CsxWO3/ETW was observed to increase slowly in high temperature (85 °C) and humidity conditions (90% RH). Model houses were developed to compare the thermoregulation effects of CsxWO3/ETW to glass. After continuous application of solar radiation, the ordinary glass house model temperature increased from 21.5 °C to 41.5 °C whereas the CsxWO3-ETW model increased from 21.6 °C to 26.8 °C (Yu et al. 2017). Mi et al. (2020a) produced aesthetic ETW with preserved wood patterns by spatial selectively removing lignin from Douglas fir (softwood). The aesthetic wood possessed good mechanical properties (strength = 91.95 MPa, toughness = 2.73 MJm−3), low thermal conductivity (0.24Wm−1 K−1), and excellent optical properties (transparency ~ 80%, optical haze ~ 93%). These properties are desirable for patterned ceilings, rooftops, transparent decorations, and indoor panels (Mi et al. 2020a). Wang et al. (2019a) fabricated photochromic ETW containing 3’,3’-dimethyl-6-nitro-spiro[2H-1-benzopyran-2,2’-indoline]1’-ethanol. The ETW exhibited a multi colour change under the illumination of light making it suitable for photo-switchable, and colourful smart windows (Wang et al. 2019a; Al-Qahtani et al. 2021).
ETW are not only energy efficient but result in green disposable optoelectronic and photovoltaic devices (Zhu et al. 2016a). Fang et al. (2014) reported that a combination of high optical transparency and high optical haze is beneficial for solar cell substrates to adsorb active materials and increase the light scattering thereby ensuring solar cell efficiency. Zhu et al. (2016a) compared the efficiency of GaAs (Gallium arsenide) solar with or without attachment of ETW (optical transmittance of 90% and haze of 80%). The
overall conversion efficiency of GaAs with and without ETW was 18.02% and 12.21% respectively. It was concluded that ETW was efficient in broadband light management which led to efficient light scattering and adsorption within the solar cell, hence the improved conversion efficiency. Li et al. (2019b) fabricated photovoltaic cells on transparent wood substrates which led to a power conversion efficiency of 16.8%.
Addition of γ-Fe2O3@YVO4:Eu3 + and Fe3O4 nanoparticles has been reported to reported to endow ETW with magnetic properties that were desirable in applications such as electromagnetic interference shielding, LED lighting equipment, luminescent magnetic switches, and anti-counterfeiting facilities (Gan et al. 2017a, 2017b). ETW can be used in speciality applications such as smart phone screens (Magrini et al. 2021). Wang et al. (2022) produced ETW which possessed flexibility, solid shape plasticity, shape manipulation capabilities and unique guiding effects. The ETW was produced through polymerisation of epoxy-based dynamic covalent polymers into a delignified wood template. Applications such as curved or irregularly shaped glass, windows, ceilings, rooftops were suggested for the ETW (Wang et al. 2022). Bi et al. (2018) fabricated multi colour emission ETW containing carbon dots. The properties of the multi colour emission ETW exhibited excellent optical and mechanical properties desirable for use as encapsulating material for white light-emitting diodes.
Generally, ETW was manufactured in two steps, i.e., delignification of wood and infiltration of RI matching polymers. The main focus in ETW production was reducing lignin or lignin chromophores while maintaining the structural integrity of wood, eliminating polymer cell wall interface gaps by improving polymer infiltration, improving the short and long term integrity of ETW, especially in outdoor applications, by surface modification, and exploiting the natural characteristics of wood to the benefit of the ETW (e.g. aesthetic patterns) (Jia et al. 2019; Mi et al. 2020a).
The studies in this review revealed that wood of high density is desirable in the production of ETW because of its strength, even after delignification. Also, the ETW produced had high tensile strength. However, the disadvantages of high-density wood were long delignification time and low optical transmittance of ETW produced.
A higher volume fraction of cellulose in wood resulted in high mechanical strength and low optical transmittance. The cellulose volume fraction was a tunable property which could be increased by the compression of delignified wood template.
Longitudinal ETW had higher mechanical strength than radial ETW. On the contrary, radial delignified wood had greater mechanical properties than delignified longitudinal wood. Radial ETW had higher optical transmittance than longitudinal ETW. The conclusion.
Radial ETW and axial ETW had thermal conductivities of 0.24 W m−1 K−1 and 0.41 W m−1 K−1. It was concluded that restrained heat transfer in the radial direction results in greater light scattering than in the axial direction.
In the case of delignification, the optical transmittance of delignified wood samples increased with increase in the degree of delignification however mechanical properties of the ETW were negatively affected by increased levels of delignification. The tensile strength decreased with a decrease in lignin content in ETW samples.
ETW produced by infiltration of PMMA had the highest mechanical properties. It can be concluded that the strength of the polymer positively contributes to the strength of ETW produced. However, the low optical properties had to be improved by acetylation. The applications of ETW include solar cells, windows, decorative materials, and screens. The main disadvantages of ETW are the limited scalability. Only ETW with a thickness less than 1 cm thick was successfully produced with acceptable optical properties (transmittance = 60%) (Li et al. 2018c). Although the short-term durability of ETW was proven, long term durability, especially in outdoor applications, requires further research.
Acknowledgments The authors acknowledge the Council for Scientific and Industrial Research, Biorefinery Industry Development Facility, South Africa for supporting this work.
Author contributions All authors contributed to the review article. The literature study and the first draft of the article were written by Thabisile Jele, and all authors reviewed, revised, and made relevant contributions and suggestions for the submitted manuscript. All authors read and approved the final manuscript.
Funding Open access funding provided by University of KwaZulu-Natal. Authors wish to acknowledge funding received from the South African Technology Innovation Agency (TIA) under the South African Forestry Bio-economy Innovation Cluster (FBIC), Programme 2 and the CSIR Parliamentary Grant funding 2022/2023.
Declarations
Competing interests The authors declare no competing interests.
Consent for publication All authors consent to the publication of this review.
Open Access This article is licensed under a Creative Commons Attribution 4.0 International License, which permits use, sharing, adaptation, distribution and reproduction in any medium or format, as long as you give appropriate credit to the original author(s) and the source, provide a link to the Creative Commons licence, and indicate if changes were made. The images or other third party material in this article are included in the article’s Creative Commons licence, unless indicated otherwise in a credit line to the material. If material is not included in the article’s Creative Commons licence and your intended use is not permitted by statutory regulation or exceeds the permitted use, you will need to obtain permission directly from the copyright holder. To view a copy of this licence, visit http://creativecommons.org/licenses/by/4.0/
References
Al-Qahtani S, Aljuhani E, Felaly R, Alkhamis K, Alkabli J, Munshi A, El-Metwaly N (2021) Development of photoluminescent translucent wood toward photochromic smart window applications. Indl Eng Chemy Res 60:8340–8350. https://doi.org/10.1021/acs.iecr.1c01603
Bi Z, Li T, Su H, Ni Y, Yan L (2018) Transparent wood film incorporating carbon dots as encapsulating material for white light-emitting diodes. ACS Sustain Chem Eng 6:9314–9323. https://doi.org/10.1021/acssuschemeng. 8b01618.s001
Bisht P, Pandey KK, Barshilia HC (2021) Photostable transparent wood composite functionalized with an UV-absorber. Polym Degrad Stab 189:109600. https://doi.org/10.1016/j. polymdegradstab.2021.109600
Chen H, Baitenov A, Li Y, Vasileva E, Popov S, Sychugov I, Yan M, Berglund L (2019) Thickness dependence of optical transmittance of transparent wood: chemical modification effects. ACS Appl Mater Interfaces 11:35451–35457. https://doi.org/10.1021/acsami.9b11816
Chen L, Xu Z, Wang F, Duan G, Xu W, Zhang G, Yang H, Liu J, Jiang S (2020) A flame-retardant and transparent wood/ polyimide composite with excellent mechanical strength. Compos Commun 20:100355. https://doi.org/10.1016/j. coco.2020.05.001
Cho SS, Song SH, Hong IP (2021) Analysis of the electromagnetic properties of eco-friendly transparent wood. Microw Opt Technol Lett 63:2237–2241. https://doi.org/10.1002/ mop.32385
Chutturi M, Gillela S, Yadav SM, Wibowo ES, Sihag K, Rangppa SM, Bhuyar P, Siengchin S, Antov P, Kristak LJ (2022) A comprehensive review of the synthesis strategies, properties, and applications of transparent wood as a renewable and sustainable resource. Sci Total Environ 864:161067
Cl M, Li Y, Chen H, Yan M, Berglund LA (2019) Transparent wood for thermal energy storage and reversible optical transmittance. ACS Appl Mater Interfaces 11:20465–20472. https://doi.org/10.1021/acsami.9b05525.s001
EIA (2016) U.S. Energy Information Administration International Energy Outlook
Fang Z, Zhu H, Yuan Y, Ha D, Zhu S, Preston C, Chen Q, Li Y, Han X, Lee S, Chen G (2014) Novel nanostructured paper with ultrahigh transparency and ultrahigh haze for solar cells. Nano Lett 14(2):765–773
Fink S (1992) Transparent wood—a new approach in the functional study of wood structure. Holzforschung. https://doi. org/10.1515/hfsg.1992.46.5.403
Foster KE, Hess KM, Miyake GM, Srubar WV III (2019) Optical properties and mechanical modeling of acetylated transparent wood composite laminates. J Mater 12:2256. https://doi.org/10.3390/ma12142256
Foster KE, Jones R, Miyake GM, Srubar WV III (2021) Mechanics, optics, and thermodynamics of water transport in chemically modified transparent wood composites. Compos Sci Technol 208:108737. https://doi.org/10. 1016/j.compscitech.2021.108737
Fu Q, Yan M, Jungstedt E, Yang X, Li Y, Berglund LA (2018) Transparent plywood as a load-bearing and luminescent biocomposite. Compos Sci Technol 164:296–303. https:// doi.org/10.1016/j.compscitech.2018.06.001
Gan W, Gao L, Xiao S, Zhang W, Zhan X, Li J (2017a) Transparent magnetic wood composites based on immobilizing Fe3O4 nanoparticles into a delignified wood template. J Mater Sci 52:3321–3329. https://doi.org/10.1007/ s10853-016-0619-8
Gan W, Xiao S, Gao L, Gao R, Li J, Zhan X (2017b) Luminescent and transparent wood composites fabricated by poly (methyl methacrylate) and γ-Fe2O3@ YVO4: Eu3+ nanoparticle impregnation. ACS Sustain Chem Eng 5:3855–3862. https://doi.org/10.1021/acssuschemeng.6b02985. s001
Gong L-X, Pei Y-B, Han Q-Y, Zhao L, Wu L-B, Jiang J-X, Tang L-C (2016) Polymer grafted reduced graphene oxide sheets for improving stress transfer in polymer composites. Compos Sci Technol 134:144–152. https://doi.org/10. 1016/j.compscitech.2016.08.014
Höglund M, Johansson M, Sychugov I, Berglund LA (2020) Transparent wood biocomposites by fast UV-curing for reduced light-scattering through wood/thiol–ene interface
design. ACS Appl Mater Interfaces 12:46914–46922. https://doi.org/10.1021/acsami.0c12505.s001
Hoglund M, Garemark J, Nero M, Willhammar T, Popov S, Berglund LA (2021) Facile processing of transparent wood nanocomposites with structural color from plasmonic nanoparticles. Chem Mater 33(10):3736–3745
Hu X, Zhang Y, Zhang J, Yang H, Wang F, Bin F, Noor N (2022) Sonochemically-coated transparent wood with ZnO: Passive radiative cooling materials for energy saving applications. Renew Energy 193:398–406. https://doi.org/ 10.1016/j.renene.2022.05.008
Ibrahim AA, Hassan MF (2011) Study the mechanical properties of epoxy resin reinforced with silica (quartz) and alumina particles. Iraqi J Mech Mater Eng 11
Jain N, Singh VK, Chauhan S (2017) A review on mechanical and water absorption properties of polyvinyl alcohol based composites/films. J Mech Behav Biomed Mater 26:213–222. https://doi.org/10.1515/jmbm-2017-0027
Jia C, Chen C, Mi R, Li T, Dai J, Yang Z, Pei Y, He S, Bian H, Jang S-H (2019) Clear wood toward high-performance building materials. ACS Nano 13:9993–10001. https://doi.org/10.1021/acsnano.9b00089.s001
Jungstedt E, Montanari C, Östlund S, Berglund L (2020) Mechanical properties of transparent high strength biocomposites from delignified wood veneer. Compos Part A Appl Sci 133:105853. https://doi.org/10.1016/j. compositesa.2020.105853
Kanócz J, Bajzecerová V, Karl’a V (2020) Analysis of mechanical properties of I-beam with web from transparent wood. IOP Conference Series: Materials Science and Engineering. IOP Publishing, 012017
Khalili P, Tshai K, Hui D, Kong I (2017) Synergistic of ammonium polyphosphate and alumina trihydrate as fire retardants for natural fiber reinforced epoxy composite. Compos B Eng 114:101–110. https://doi.org/10.1016/j. compositesb.2017.01.049
Lang AW, Li Y, De Keersmaecker M, Shen DE, Österholm AM, Berglund L, Reynolds JR (2018) Transparent wood smart windows: polymer electrochromic devices based on poly (3,4-ethylenedioxythiophene): poly (styrene sulfonate) electrodes. Chemsuschem 11:854–863. https:// doi.org/10.1002/cssc.201702026
Li T, Zhu M, Yang Z, Song J, Dai J, Yao Y, Luo W, Pastel G, Yang B, Hu L (2016a) Wood composite as an energy efficient building material: Guided sunlight transmittance and effective thermal insulation. Adv Energy Mater 6:1601122. https://doi.org/10.1002/aenm.20160 1122
Li Y, Fu Q, Yu S, Yan M, Berglund L (2016b) Optically transparent wood from a nanoporous cellulosic template: combining functional and structural performance. Biomacromol 17:1358–1364. https://doi.org/10.1021/acs.biomac. 6b00145.s001
Li Y, Fu Q, Rojas R, Yan M, Lawoko M, Berglund L (2017a) Lignin-retaining transparent wood. Chemsuschem 10:3445–3451. https://doi.org/10.1002/cssc.201701089
Li Y, Yu S, Veinot JG, Linnros J, Berglund L, Sychugov I (2017b) Luminescent transparent wood. Adv Opt Mater 5:1600834. https://doi.org/10.1002/adom.201600834
Li Y, Fu Q, Yang X, Berglund L (2018a) Transparent wood for functional and structural applications. Philos Trans R Soc 376:20170182. https://doi.org/10.1098/rsta.2017.0182
Li Y, Vasileva E, Sychugov I, Popov S, Berglund L (2018b) Optically transparent wood: recent progress, opportunities, and challenges. Adv Opt Mater 6:1800059. https:// doi.org/10.1002/adom.201800059
Li Y, Yang X, Fu Q, Rojas R, Yan M, Berglund L (2018c) Towards centimeter thick transparent wood through interface manipulation. J Mater Chem 6:1094–1101. https:// doi.org/10.1039/c7ta09973h
Li H, Guo X, He Y, Zheng R (2019a) A green steam-modified delignification method to prepare low-lignin delignified wood for thick, large highly transparent wood composites. Mater Res 34:932–940. https://doi.org/10.1557/jmr.2018.
466
Li Y, Cheng M, Jungstedt E, Xu B, Sun L, Berglund L (2019b) Optically transparent wood substrate for perovskite solar cells. ACS Sustain Chem Eng 7:6061–6067. https://doi. org/10.1021/acssuschemeng.8b06248.s001
Li Y, Gao R, Li J (2019c) Energy saving wood composite with temperature regulatory ability and thermoresponsive performance. Eur Polym J 118:163–169. https://doi. org/10.1016/j.eurpolymj.2019.05.050
Magrini T, Bouville F, Studart AR (2021) Transparent materials with stiff and tough hierarchical structures. Open Ceram 6:100109. https://doi.org/10.1016/j.oceram.2021.
100109
Mi R, Chen C, Keplinger T, Pei Y, He S, Liu D, Li J, Dai J, Hitz E, Yang B (2020a) Scalable aesthetic transparent wood for energy efficient buildings. Nat Commun 11:1–9. https://doi.org/10.1038/s41467-020-17513-w
Mi R, Li T, Dalgo D, Chen C, Kuang Y, He S, Zhao X, Xie W, Gan W, Zhu J (2020b) A clear, strong, and thermally insulated transparent wood for energy efficient windows. Adv Funct Mater 30:1907511. https://doi.org/10.1002/ adfm.202001291
Montanari C, Ogawa Y, Olsén P, Berglund LA (2021) High performance, fully bio-based, and optically transparent wood biocomposites. Adv Sci 8:2100559. https://doi. org/10.1002/advs.202100559
Qin J, Li X, Shao Y, Shi K, Zhao X, Feng T, Hu Y (2018) Optimization of delignification process for efficient preparation of transparent wood with high strength and high transmittance. Vacuum 158:158–165. https://doi. org/10.1016/j.vacuum.2018.09.058
Qiu Z, Xiao Z, Gao L, Li J, Wang H, Wang Y, Xie Y (2019) Transparent wood bearing a shielding effect to infrared heat and ultraviolet via incorporation of modified antimony-doped tin oxide nanoparticles. Compos Sci Technol 172:43–48. https://doi.org/10.1016/j.compscitech.
2019.01.005
Rao ANS, Nagarajappa GB, Nair S, Chathoth AM, Pandey KK (2019) Flexible transparent wood prepared from poplar veneer and polyvinyl alcohol. Compos Sci Technol 182:107719. https://doi.org/10.1016/j.compscitech.
2019.107719
Samanta A, Chen H, Samanta P, Popov S, Sychugov I, Berglund L (2021) Reversible dual-stimuli-responsive chromic transparent wood biocomposites for smart window applications. ACS Appl Mater Interfaces 13:3270–3277
Vol:. (1234567890)
Seghir R, Pierron F (2018) A novel image-based ultrasonic test to map material mechanical properties at high strain-rates. Exp Mech 58:183–206. https://doi.org/10. 1007/s11340-017-0329-4
United Nations Environment Programme (2017) Global Status Report 2017 - Towards a Zero-Emission, Efficient, and Resilient Buildings and Construction Sector
Vasileva E, Chen H, Li Y, Sychugov I, Yan M, Berglund L, Popov S (2018) Light scattering by structurally anisotropic media: a benchmark with transparent wood. Adv Opt Mater 6:1800999. https://doi.org/10.1002/adom. 201800999
Wachter I, Štefko T, Rantuch P, Martinka J, Pastierová A (2021) Effect of UV radiation on optical properties and hardness of transparent wood. Polymers 13:2067. https://doi.org/10.3390/polym13132067
Wan C, Liu X, Huang Q, Cheng W, Su J, Wu Y (2021) A brief review of transparent wood: synthetic strategy, functionalization and applications. Curr Org Synth 18:615–623. https://doi.org/10.2174/157017941866621 0614141032
Wang X, Zhan T, Liu Y, Shi J, Pan B, Zhang Y, Cai L, Shi SQ (2018) Large-size transparent wood for energy-saving building applications. Chemsuschem 11:4086–4093. https://doi.org/10.1002/cssc.201801826
Wang L, Liu Y, Zhan X, Luo D, Sun X (2019a) Photochromic transparent wood for photo-switchable smart window applications. J Mater Chem 7:8649–8654. https://doi.org/ 10.1039/c9tc02076d
Wang M, Li R, Chen G, Zhou S, Feng X, Chen Y, He M, Liu D, Song T, Qi H (2019b) Highly stretchable, transparent, and conductive wood fabricated by in situ photopolymerization with polymerizable deep eutectic solvents. ACS Appl Mater Interfaces 11:14313–14321. https://doi.org/ 10.1021/acsami.9b00728.s001
Wang K, Dong Y, Ling Z, Liu X, Shi SQ, Li J (2021) Transparent wood developed by introducing epoxy vitrimers into a delignified wood template. Compos Sci Technol 207:108690. https://doi.org/10.1016/j.compscitech.2021. 108690
Wang K, Liu X, Dong Y, Ling Z, Cai Y, Tian D, Fang Z, Li J (2022) Editable shape-memory transparent wood based on epoxy-based dynamic covalent polymer with excellent optical and thermal management for smart building materials. Cellulose 29:7955–7972. https://doi.org/10.1007/ s10570-022-04754-9
Wu W, Tian H, Xiang A (2012) Influence of polyol plasticizers on the properties of polyvinyl alcohol films fabricated by melt processing. J Polym Environ 20:63–69. https://doi. org/10.1007/s10924-011-0364-7
Wu J, Wu Y, Yang F, Tang C, Huang Q, Zhang J (2019a) Impact of delignification on morphological, optical and mechanical properties of transparent wood. Compos Part A Appl Sci 117:324–331. https://doi.org/10.1016/j.compo sitesa.2018.12.004
Wu J, Wu Y, Yang F, Tang C, Huang Q, Zhang J (2019b) Impact of delignification on morphological, optical and mechanical properties of transparent wood. Compos Part A Appl Sci Manuf 117:324–331
Wu Y, Wu J, Yang F, Tang C, Huang Q (2019c) Effect of H2O2 bleaching treatment on the properties of finished
Cellulose (2023) 30:5447–5471
transparent wood. Polymers 11:776. https://doi.org/10. 3390/polym11050776
Wu Y, Zhou J, Huang Q, Yang F, Wang Y, Wang J (2020) Study on the properties of partially transparent wood under different delignification processes. Polymers 12:661. https://doi.org/10.3390/polym12030661
Wu Y, Zhou J, Yang F, Wang Y, Wang J, Zhang J (2021) A strong multilayered transparent wood with natural wood color and texture. J Mater Sci 56:8000–8013. https://doi. org/10.1007/s10853-021-05833-1
Wu T, Xu Y, Cui Z, Li H, Wang K, Kang L, Cai Y, Li J, Tian D (2022) Efficient heat shielding and ultraviolet isolating transparent wood via in situ generation of TiO2 nanoparticles. ACS Sustain Chem Eng. https://doi.org/10.1021/ acssuschemeng.2c04000.s001
Xia Q, Chen C, Li T, He S, Gao J, Wang X, Hu L (2021) Solarassisted fabrication of large-scale, patternable transparent wood. Sci Adv 7:eabd7342. https://doi.org/10.1126/sciadv.abd7342
Yaddanapudi HS, Hickerson N, Saini S, Tiwari A (2017) Fabrication and characterization of transparent wood for next generation smart building applications. Vacuum 146:649–654. https://doi.org/10.1016/j.vacuum.2017.01.016
Yu Z, Yao Y, Yao J, Zhang L, Chen Z, Gao Y, Luo H (2017) Transparent wood containing Cs x WO3 nanoparticles for heat-shielding window applications. J Mater Chem 5:6019–6024. https://doi.org/10.1039/c7ta00261k
Yue D, Fu G, Jin Z (2021) Transparent wood prepared by polymer impregnation of rubber wood (Hevea brasiliensis Muell.Arg). BioResources. https://doi.org/10.5376/biores.
16.2.2491-2502
Yusof NSM, Dewi DEO, Salih NM, Supriyanto E, Syahrom A, Faudzi AAM (2016) Epoxy resin characterization for
imaging phantom: X-ray, textural, and mechanical properties. In: IEEE EMBS conference on biomedical engineering sciences, pp 617–622. https://doi.org/10.1109/iecbes. 2016.7843523
Zhang L, Wang A, Zhu T, Chen Z, Wu Y, Gao Y (2020) Transparent wood composites fabricated by impregnation of epoxy resin and W-doped VO2 nanoparticles for application in energy-saving windows. ACS Appl Mater Interfaces 12:34777–34783. https://doi.org/10.1021/acsami. 0c06494.s001
Zhu M, Li T, Davis CS, Yao Y, Dai J, Wang Y, AlQatari F, Gilman JW, Hu L (2016a) Transparent and haze wood composites for highly efficient broadband light management in solar cells. Nano Energy 26:332–339. https://doi.org/10. 1016/j.nanoen.2016.05.020
Zhu M, Song J, Li T, Gong A, Wang Y, Dai J, Yao Y, Luo W, Henderson D, Hu L (2016b) Highly anisotropic, highly transparent wood composites. J Adv Mater 28:5181–5187. https://doi.org/10.1002/adma.201600427
Zou F, Li H, Dong Y, Tewari GC, Vapaavuori J (2022) Optically transparent pectin/poly (methyl methacrylate) composite with thermal insulation and UV blocking properties based on anisotropic pectin cryogel. J Chem Eng 439:135738. https://doi.org/10.1016/j.cej.2022.135738
Publisher’s Note Springer Nature remains neutral with regard to jurisdictional claims in published maps and institutional affiliations.
The holiday season can mean high temperatures, increased stress levels and extra demands on your car –so here are our seasonal tips to help with the challenges of summer driving.
https://www.theaa.com/driving-advice/seasonal/summer
The Paper Industry Technical Association (PITA) is an independent organisation which operates for the general benefit of its members – both individual and corporate – dedicated to promoting and improving the technical and scientific knowledge of those working in the UK pulp and paper industry. Formed in 1960, it serves the Industry, both manufacturers and suppliers, by providing a forum for members to meet and network; it organises visits, conferences and training seminars that cover all aspects of papermak ing science. It also publishes the prestigious journal Paper Technology International® and the PITA Annual Review , both sent free to members, and a range of other technical publications which include conference proceedings and the acclaimed Essential Guide to Aqueous Coating.
It's easy to lose your car keys in the sand or ruin your remote control with water by accidentally taking your keys for a swim – keep your keys safe and dry.
If your remote stops working, check your handbook – on most cars, there's an alternative way to open the doors.
If your tyres are already damaged or they're at the wrong pressure, the higher temperatures of summer will increase the risk of a blowout.
Make sure you check tyres regularly – for condition and pressures – and increase pressures to suit extra loads, as advised in your handbook.
Check caravan tyres too, and replace those that show any signs of cracking in the sidewall or tread grooves.
During the summer you may encounter heavier traffic on the roads, as more people travel during this time to go on holiday. Here are our 6 tips on how to stay safe in the traffic this summer:
1. Drive defensively
Driving defensively means being able to ‘expect the unexpected’. In heavy traffic , someone might cut you off or a motorbike may come filtering past you between lanes. Be aware of what’s happening around you to avoid dangerous situations.
2. Remove distractions
Driving in heavy traffic requires you to be more alert and focussed, so keep your eyes on the road and both hands on the steering wheel at all times. Checking your phone is illegal while driving and adjusting your car’s infotainment system is distracting, so avoid doing this while stuck in traffic.
3. Plan ahead
Planning your journey ahead of time may help you avoid heavy traffic. Leaving early to avoid peak traffic hours and being prepared for unexpected delays can also help keep you calm during your trip. The AA route planner can help you find the best route to your destination when traffic is heavy.
4. Keep a safe distance

It’s important to keep a safe distance from other cars so you'll have enough time to respond and slow down in an emergency. A safe following distance is 3 seconds behind the car ahead of you.
5. Drive at a safe speed
When traffic is heavy, you may need to keep your speed below the displayed speed limit. By slowing down you’ll have enough time to brake and avoid a collision if traffic ahead of you stops suddenly.
6. Remain calm (and avoid road rage)

Heavy traffic can cause agitation which could lead to an accident. Try not to drive while tired and remember that other drivers are going through the same stress. Angry driving and road rage can also increase your fuel consumption and cost you more money. Check out our monthly fuel price report. Plan regular breaks as this can help to relieve your tension and give you the chance to stretch your legs, and perhaps even enjoy a cup of tea or coffee.
Cooling systems are under more strain in high temperatures, so issues are more likely to be exposed when it’s hot. It’s important to check the coolant regularly to avoid overheating.
It’s not just the car that can overheat, so it’s important to keep kids, pets and yourself cool in the car in summer. You can do this in the following ways:
Put a sun shield over the back windows – this will help keep the sun off the passengers in the back of the car and will keep some of the heat out
Have iced water in the car – this will help keep all passengers refreshed and hydrated throughout the drive
Use the air conditioning – driving with the A/C on will help keep the internal temperature of the car nice and cool
Try to park in the shade – if you stop along your drive, try to find a shady parking spot to avoid the sun heating up the car
Use a windscreen shade when parked because most of the heat enters the car through the glass
Glare
Dazzle from the sun can reduce visibility, but you can lessen the effect by keeping your windscreen nice and clean. Replace worn or damaged windscreen wipers to keep your screen clear and read our top tips on how to wash a car.
It also pays to keep a clean pair of sunglasses in your car year-round.
It’s not safe to drive tired. If you do feel tired, stop in a safe place and take a break.
It’s best to avoid getting tired in the first place if you can. Try these tips:
Include a 20-minute break in journeys of more than 3 hours
On longer trips, take a break every couple of hours
Take several short stops (of at least 20 minutes) rather than one long one
Don’t drink alcohol or eat a heavy meal before driving
Never stop for a nap on the hard shoulder and make sure you check parking restrictions before putting your head down at a motorway service area, as you could get a ticket for overstaying your welcome.
In warmer weather, you're more likely to encounter cyclists and pedestrians out and about on the roads. It’s important to be aware of your surroundings while driving and The Highway Code has clear rules and guidelines to ensure all road users are protected.
Driving at a safe speed and removing any distractions while driving will help you be aware of your surroundings. This also means you’ll be able to react in time should you encounter vulnerable road users.
If your hay fever is particularly bad, it’s best to get someone else to drive if you can.
If you can’t avoid driving:
Make sure any medication you’re taking doesn't cause drowsiness
Close windows and air vents to reduce pollen grains in the car
Clean mats and carpets regularly to get rid of dust
Keep tissues close to hand
Wear sunglasses to block out bright sunlight
Slow down and drop back if you feel you're about to sneeze – at 70mph you’ll lose vision for up to 100m
Roads repaired with tar and loose chippings are a common sight in the summer. They can cause cracked headlamps and windscreens, and damage paintwork if you’re not careful. Stick to any temporary speed limit that’s been put in place, avoid o vertaking and keep your distance from the car in front.
It’s illegal to smoke in a vehicle carrying passengers under 18. If you are a smoker, don’t just throw your cigarette out of the window when you’ve finished it. Verges and embankments can become bone-dry and a smouldering cigarette may be enough to ignite roadside grass.
The driver of that slow-moving tractor in front of you may have a soundproofed cab, or could be wearing ear protectors, so may not be able to hear approaching cars.
Be aware that tractors only have to have brake or indicator lights if driving at night, so they may stop or turn suddenly and without warning in daylight hours.
When you’re driving in the countryside:
Keep plenty of distance behind a tractor
Remember that a tractor may be longer than it appears – there could be a loader on the front
Before overtaking, make sure you have plenty of room to get past
Slow down gently if you come across a spillage – if you hit a bale of straw at speed you'll damage your car
Don't park in a gateway or passing place
Drive extra carefully after rain, which can turn dry mud into a skid pan
Be prepared for an emergency
Make sure to have your breakdown service company App downloaded on your mobile phone
Download the free what3words app
Ensure you have water for all passengers, including your pets (make sure you have a bowl for pets to drink out of). Also have some snacks on hand in case of a breakdown
Have a first aid kit in your car, as well as mobile phone char gers
Take hats and sun cream in case you breakdown in an area with little or no shade
Volume 9, Number 2, 2023
Whether you’re writing an assignment for class or typing a work email, proofreading and editing are important. By polishing your writing, you ensure your ideas are clear and that you come across as knowledgeable.
https://ualr.edu/writingcenter/tips-for-effective-proofreading/
The Paper Industry Technical Association (PITA) is an independent organisation which operates for the general benefit of its members – both individual and corporate – dedicated to promoting and improving the technical and scientific knowledge of those working in the UK pulp and paper industry. Formed in 1960, it serves the Industry, both manufacturers and suppliers, by providing a forum for members to meet and network; it organises visits, conferences and training seminars that cover all aspects of papermaking science. It also publishes the prestigious journal Paper Technology International® and the PITA Annual Review , both sent free to members, and a range of other technical publications which include conference proceedings and the acclaimed Essential Guide to Aqueous Coating.
Proofread backwards. Begin at the end and work back through the paper paragraph by paragraph or even line by line. This will force you to look at the surface elements rather than the meaning of the paper.
Place a ruler under each line as you read it. This will give your eyes a manageable amount of text to read.
Know your own typical mistakes. Before you proofread, look over papers you have written in the past. Make a list of the errors you make repeatedly.
Proofread for one type of error at a time. If commas are your most frequent problem, go through the paper checking just that one problem. Then proofread again for the next most frequent problem.
Try to make a break between writing and proofreading. Set the paper aside for the night or even for twenty minutes.
Proofread at the time of day when you are most alert to spotting errors.
Proofread once aloud. This will slow you down and you will hear the difference between what you meant to write and what you actually wrote.
Try to give yourself a break between the time you complete your final version of the paper and the time you sit down to edit. Approaching your writing with a clear head and having at least an hour to work on editing will ensure that you can do a thorough, thoughtful job. The results will definitely be worthwhile.
Ask someone else to read over your paper and help you find sentences that aren’t clear, places where you’re being wordy, and any errors.
Try reading backwards, a sentence at a time. This will help you focus on the sentences, rather than getting caught up in the content of your paper.
Know your own patterns. Your instructor can probably help you identify the errors you’ve made most often in your previous papers, and then you can focus your attention on finding and fixing them.
Read through your paper several times, once looking just at spelling, another time looking just at punctuation, and so on. Again, this can help you focus so you’ll do a better job.
Use the spell-checker on your computer, but use it carefully, and also do your own spell-checking. Computer spell-checkers often make errors – they might suggest a word that isn’t what you want at all, and they don’t know the difference between there, their, and they’re, for example.
Get help. If you’re not sure if you need that comma or whether to use “affect” or “effect,” look it up in a writing handbook, or ask your instructor for help.
Remember that editing isn’t just about errors. You want to polish your sentences at this point, making them smooth, interesting, and clear. Watch for very long sentences, since they may be less clear than shorter, more direct sentences. Pay attention to the rhythm of your writing; try to use sentences of varying lengths and patterns. Look for unnecessary phrases, repetition, and awkward spots.
FROM THE PUBLISHERS OF PAPER TECHNOLOGY INTERNATIONAL®
Volume 9, Number 2 2023
In this article, we'll look at the skill of speed reading, and explore techniques that you can use to read better and faster.
We'll also consider the pros and cons of speed reading – when it is appropriate to use, and the effects that it can have on understanding.
By the Mind Tools Content Team (9 min read)https://www.mindtools.com/aokg6bn/speed-reading

The Paper Industry Technical Association (PITA) is an independent organisation which operates for the general benefit of its members – both individual and corporate – dedicated to promoting and improving the technical and scientific knowledge of those working in the UK pulp and paper industry. Formed in 1960, it serves the Industry, both manufacturers and suppliers, by providing a forum for members to meet and network; it organises visits, conferences and training seminars that cover all aspects of papermaking science. It also publishes the prestigious journal Paper Technology International® and the PITA Annual Review, both sent free to members, and a range of other technical publications which include conference proceedings and the acclaimed Essential Guide to Aqueous Coating
Speed reading is the process of rapidly recognizing and absorbing phrases or sentences on a page all at once, rather than identifying individual words.
The amount of information that we process seems to be growing by the day, whether it's emails, reports and websites at work, or social media, books and magazines at home. We likely feel pressure to get through this information more quickly, so that we can "stay in the loop"
Most people read at an average rate of 250 words per minute (wpm), though some are naturally quicker than others. But, the ability to speed read could mean that you double this rate.
We'll now explore some of the skills that you can use to accelerate your reading.
All speed reading techniques have one thing in common: you avoid pronouncing and "hearing" each word in your head as you read it, a process known as "sub-vocalization." Instead, you "skim" lines or groups of words, as you can understand words more quickly than you can say them.
One way to stop yourself from sub-vocalizing is to focus on blocks of words rather than on individual ones. Do this by relaxing your face and "softening" or expanding your gaze on the page, so that you stop seeing words as single, distinct units. As you practice this, your eyes will skip faster across the page.
Then, when you approach the end of a line, allow your peripheral vision to take your eye to the final set of words. This will help to stop pauses in your reading (often at full po ints), meaning that you scan across and down to the next line more quickly.
Now let's look at three methods to boost your reading speed:
1. The Pointer Method
Utah school teacher Evelyn Nielsen Wood was one of the pioneers of speed reading. In the 1950s, she claimed that she could read at up to 2,700 wpm if she swept a finger along the line as she read.
This became known as the Pointer method, and is also sometimes called "hand pacing" or "meta guiding." Holding a card under each line and drawing it down the page as you read works just as well.
2. The Tracker-and-Pacer Method
This is a variant of the Pointer method where you hold a pen, with its cap still on, and underline or track each line as you read it, keeping your eye above the tip of the pen. This will help to increase the pace at which you take in each line, and improve your focus on the words. Whether you actually underline the words is your choice.
Try to spend no more than one second on each line and then increase your speed with each subsequent page. You will probably find that you retain very little information at first, but, as you train your brain and you become more comfortable with the technique, your comprehension should improve.
Note: An advantage of the Pointer and Tracker-and-Pacer methods is that they should reduce your need to skip back and re-read sentences – a hindrance to speed reading that is known as "regression."
3. The Scanning (or Previewing) Method
"Scanning" involves moving your eyes quickly down the page – often down the center – and identifying specific words and phrases as you go. These can be key sentences (often the first sentence of each paragraph), names, numbers, or trigger words and ideas. Learning to expand your peripheral vision can help with this.
You won't read every word, but your eye will land on what is important to allow you to grasp the basic idea. It may be helpful to use a mind map® to organize the information you take in.
These techniques can all help you to read more quickly, but are they appropriate for what you're trying to achieve?
Effective speed reading is a balance between pace and comprehension. Studies have found that the faster you read, the less information you take in, particularly when it comes to remembering detail. [1]
So, speed reading is clearly not the answer if you're reading a complex legal or technical document, even if you are pushed for time. Similarly, it would be sensible to slow down if the material you're reading is new or unfamiliar, or if you have to teach it to someone else.
When you need to understand only the basic arguments or conclusions being presented, though, using a speed reading technique can work.
This may especially be the case if you intend to go back and re -read something more slowly when you're less busy. In fact, one study has suggested that skimming a text can improve your comprehension the second time around. [2]
Generally speaking, if you want to memorize something, you'll need to read slowly, at less than 100 wpm. A normal rate for learning is 100-200 wpm, and for comprehension it is 200-400 wpm.
Speed reading is normally done at a rate of around 400-700 wpm. Anything above 500-600 wpm means sacrificing comprehension, although this varies from person to person.
Knowing the "how" and "when" of speed reading is only the first step to success. Here are some more tips to help you:
Avoid distractions. Create an environment where there are as few interruptions and distractions as possible, to allow you to focus fully on the words in front of you.
Go easy. Read an uncomplicated novel or a simple online article to get a feel for which technique is going to work best for you. Gauge how much you've remembered or understood, and set a timer to see how much faster you are now reading.
Cover words that you've already read. This helps you to stop your eyes from flitting back to earlier words and slowing down your reading.
Know what you want from the text. This can be useful if you are using the skimming method, as it primes you to pay attention when you see relevant words, sentences or phrases. You can then slow down at these points, or circle them for emphasis, but otherwise move across the page quickly.
Benchmark your progress. This way you can tell whether your practice is paying off. There are many free speed reading assessments online, such as at ReadingSoft.com
Practice, practice, practice. You have to practice speed reading to get good at it. The more you train yourself, the more natural it will feel.
Key Points
There are different techniques that you can use to improve your reading speed. All of them involve skimming a page rather than "sub-vocalizing" each word as you were likely taught at school.
Excellent speed reading involves practice and retraining yourself, as well as learning to focus more on what is in front of you and avoiding distractions.
But it is important to strike the right balance between speed and comprehension: sometimes speed reading is not appropriate or helpful.
References
[1] Just, M.A. and Carpenter, P. (1987). The Psychology of Reading and Language Comprehension . Boston: Allyn and Bacon, Inc.
[2] McClusky, H. (1934). 'An Experiment on the Influence of Preliminary Skimming on Reading,' Journal of Educational Psychology, 25(7), 521–529 [online].
Delegation... it's a double-edged sword, isn’t it? On one hand, you can get so much more done if you focus on the things you do best and delegate the rest to other people (who may even do them better than you can). But on the other hand, it can be difficult to relinquish control, or to ask people to take on more work.
This article explores some of the ways you can make delegation feel a little easier, and features advice from the ever-helpful Pip Decks community.
By Gemma King, 7 July 2022 https://pipdecks.com/blogs/leadership/how-to-delegate-tasks-to-your-team
The Paper Industry Technical Association (PITA) is an independent organisation which operates for the general benefit of its members – both individual and corporate – dedicated to promoting and improving the technical and scientific knowledge of those working in the UK pulp and paper industry. Formed in 1960, it serves the Industry, both manufacturers and suppliers, by providing a forum for members to meet and network; it organises visits, conferences and training seminars that cover all aspects of papermak ing science. It also publishes the prestigious journal Paper Technology International® and the PITA Annual Review , both sent free to members, and a range of other technical publications which include conference proceedings and the acclaimed Essential Guide to Aqueous Coating.
How do you delegate tasks successfully?
As you might expect, there isn’t one straightforward answer to this question. Let’s assume a starting pointyou’ve got a lot on your plate, and a willing team of people around you who are able to take on some of the work.
How to decide which tasks to delegate (and which to keep)
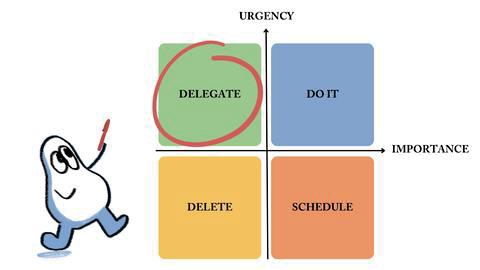
Some of the tasks on your list will be ones that you have sole responsibility for. Identify these and remove them from consideration. But what if that’s not as easy as it sounds? Don’t worry, there are tactics for that!
Approach one: a quick-and-dirty matrix
If you’ve read any books or listened to any podcasts about productivity recently, you’ll be familiar with the Eisenhower Matrix. It’s a super low -tech tool to help you rapidly decide what to do with each of the tasks on your list. Let’s take a look.
First, you draw two bisecting lines and label them as shown (the y axis shows increasing urgency, and the x shows increasing importance).
Then, on your matrix, place an X for each task that’s currently on your to -do list. For example, drafting a welcome message to a new starter on your team could be urgent and important, while renaming the files on a shared drive to use the internal naming convention would be important (probably), but not urgent.
Then you can quickly transfer the tasks into different piles as follows:
Top-right quadrant: urgent and important. Do these tasks (yourself).
Top-left quadrant: urgent, but not as important. Delegate these tasks!
Bottom-right quadrant: important, but not so urgent. Schedule these for a later time/date.
Bottom-left: not particularly urgent or important. Delete them
Top tip: this is a great way to start or end your working week. It helps you keep everything on your radar and decide what to do with things before they stagnate in your inbox for too long.
Approach two: apply a little curiosity
Grab your to-do list and remove all the ones you have to do yourself. But not so fast! Take a little time to reflect on why you believe you can't delegate those tasks. Ask yourself some of the following questions to help you finetune your delegation process.
If no one else has the skills to do this task, should we train/hire someone who does?
If no one else has the authority/oversight required to do this task, can it be broken down into smaller tasks that others can help with?
If this will be particularly challenging for someone else to do, is there anyone who could benefit from using this as an opportunity for development?
Then, you can either move that task (or some of it) into your ‘to delegate’ pile, or keep it on your own to -do list. Remember, this is just for tasks that you think you can't delegate. Ones you're sure you can delegate do not necessarily need to fit any of the those criteria.
So now you’ve got a list of tasks to delegate, you need to actually start doing it. Let’s assume you know who in your team is best suited to take on each task - or you’re happy for them to decide among themselves. How do you go about shuffling it out of your inbox, and into theirs?
Delegating leadership style
Your leadership style will inform how you delegate tasks. In the situational leadership model, however, one of the four types of leadership is the ‘delegating leadership style’. The same model suggests that the best managers adapt their approach through all four types of leadership. So, whatever your leadership style, here’s what you can learn (and apply) from that approach.
The benefits of delegation
Managers who show delegating leadership style behaviours are comfortable with sharing responsibility and authority with their team members. They delegate tasks, then allow their teammates to carry out those tasks with support and advice rather than strict instructions.
This is a particularly powerful way to build up employees’ self confidence, and to help them feel mastery over their work - which in turn results in higher motivation. It’s a win -win situation, if you can get it right! And getting it right means relaxing your control over the how things get done, and just focussing on the outcomes.
Here are some pretty nailed-on tactics to ensure you give yourself and your employee the best chance of success, so that letting going of control doesn't feel so scary.
If the task has landed in your lap and you’re delegating it to someone more junior than you, it could be a great opportunity for them. They could learn some valuable new skills, work on a new project or otherwise just relish the chance to show you what they can do.
So choose the task and the employee carefully, and set them up for success. It’s okay to stretch someone and give them a challenge; it’s not a good idea to overwhelm them or ask them to do something that’s outside of their skills, experience or comfort level.
Additionally, factor in the time it will take to do the task well. Remember, someone else may take slightly longer to complete the task than you would, especially if it’s new to them. But they will get faster with experience, and the whole point of delegating is to get it off of your to-do list. Work in a little extra time, and make sure the person you are delegating to has the capacity to do a great job.
Pip Decks community's delegation tips
Kevin D says "Don't over delegate to your best team member. Over time, they may begin to resent doing the lion's share for the same pay." If you do find someone is consistently picking up extra work, you either need to examine if they have got additional time you could put to use, or if you should be giving them a pay rise!
Will C mentioned that just asking who wants to take on the task is probably the first sensible step, with the option to rotate additional tasks between team members if no one volunteers.
Abdul mentions alignment and skills (read on for more on that) and says "How will you measure the outcome (not output)?" - a reminder to define what outcomes you want to see, rather than rigidly specifying deliverables/output.
And Barry F shared a great article about delegation models, including leadership and task delegation approaches.
If you want to refine how you delegate tasks, there are some great workshop tactics that could help. You could try running a Skills market to find out what skills (hidden or otherwise) people in your team have, and what they want to practise or learn. Roles and responsibilities is also great for helping your team share what they work on so that you all understand what each other do - and why. Finally, Who, what, when is another way to clearly set out who is responsible for the actions that come our of a workshop or meeting.
Make sure your employee knows exactly what deliverables are expected of them. Give as much free rein as you can in terms of how it gets done - who knows, they may find a new, better way to do it - but set boundaries in terms of what absolutely must be achieved. That helps them to plan, and to know how to achieve success.
It will also help if you let them know how and when they need to share updates with you, and what to do if they need some help. Work out how you’ll check in with them along the way, so that they don’t see your questions as a lack of trust or desire to control what they’re doing, but you also g et the information you need.
You’ll have built up an arsenal of tools and tricks to help you get things done. Offer some pointers to your teammates to ensure they have the benefit of everything you know. You might not realise how valuable this is to them - and if they succeed, so do you!
Top tip: depending on the task you're delegating, there might be a suitable Workshop Tactic to help them on their way.
While you're at it, make sure that they have the authority to do whatever needs to be done. Then make sure that they know it! And of course, inform anyone else in the business who might need to know.
Once the task is done there are lots of ways you can help your teammate feel a sense of pride in their achievement. Try the following:
Ask them how they think it went
Provide constructive feedback
Let them know the impact their contribution has made
Give credit when talking to others about the task
And if they did a good job, ask them if they’d like to do similar tasks in future. Keep a note of this work for your performance review process, use it in pay-rise negotiations and remember it when you are considering opportunities for their development.
So now you know how to choose the right tasks to delegate, how to brief them to the right person and what to do once the task has been completed. The only thing left to do is get some of those tasks off of your to-do list... and onto someone else's!
Statistics show that the majority (67%) of falls happen on the same level resulting from slips and trips. The remaining 30% are falls from a height. This document will summarize information on "falls on the same level" (slips and trips). Falls from an elevation, such as falls from ladders, roofs, down stairs or from jumping to a lower level, etc., is discussed in other documents since each type of fall must be assessed as part of a fall prevention program.
https://www.ccohs.ca/oshanswers/safety_haz/falls.html
The Paper Industry Technical Association (PITA) is an independent organisation which operates for the general benefit of its members – both individual and corporate – dedicated to promoting and improving the technical and scientific knowledge of those working in the UK pulp and paper industry. Formed in 1960, it serves the Industry, both manufacturers and suppliers, by providing a forum for members to meet and network; it organises visits, conferences and training seminars that cover all aspects of papermak ing science. It also publishes the prestigious journal Paper Technology International® and the PITA Annual Review , both sent free to members, and a range of other technical publications which include conference proceedings and the acclaimed Essential Guide to Aqueous Coating.
Slips
Slips happen where there is too little friction or traction between the footwear and the walking surface. Common causes of slips are:
wet or oily surfaces
occasional spills
weather hazards
loose, unanchored rugs or mats
flooring or other walking surfaces that do not have the same degree of traction in all areas
Trips
Trips happen when your foot collides (strikes, hits) an object causing you to lose balance and, eventually fall. Common causes of tripping are:
obstructed view
poor lighting
clutter in your way
wrinkled carpeting
uncovered cables
bottom drawers not being closed
uneven (steps, thresholds) walking surfaces
How to prevent falls due to slips and trips?
Both slips and trips result from unintended or unexpected change in the contact between the feet and the ground or walking surface. This fact shows that good housekeeping, quality of walking surfaces (flooring), selection of proper footwear, and appropriate pace of walking are critical for preventing fall incidents.
Housekeeping
Good housekeeping is the first and the most important (fundamental) level of preventing falls due to slips and trips. It includes:
cleaning all spills immediately marking spills and wet areas mopping or sweeping debris from floors removing obstacles from walkways and always keeping walkways free of clutter securing (tacking, taping, etc.) mats, rugs and carpets that do not lay flat always closing file cabinet or storage drawers covering cables that cross walkways keeping working areas and walkways well lit replacing used light bulbs and faulty switches
Without good housekeeping practices, any other preventive measures such as installation of sophisticated flooring, specialty footwear or training on techniques of walking and safe falling will never be fully effective.
For more information about effective housekeeping, visit the OSH Answers document on Workplace Housekeeping - Basic Guide.
Flooring
Changing or modifying walking surfaces is the next level of preventing slip and trips. Recoating or replacing floors, installing mats, pressure-sensitive abrasive strips or abrasive-filled paint-on coating and metal or synthetic decking can further improve safety and reduce the risk of falling. However, it is critical to remember that high-tech flooring requires good housekeeping as much as any other flooring. In addition, resilient, nonslippery flooring prevents or reduces foot fatigue and contributes to slip-prevention measures.
Footwear
In workplaces where floors may be oily or wet or where workers spend considerable time outdoors, prevention of fall incidents should focus on selecting proper footwear. Since there is no footwear with antislip properties for every condition, consultation with manufacturers is highly recommended.
Properly fitting footwear increases comfort and prevents fatigue which, in turn, improves safety for the employee. For more information on footwear visit the OSH Answers document on Safety Footwear
What can you do to avoid falling at work?
You can reduce the risk of slipping on wet flooring by:
taking your time and paying attention to where you are going adjusting your stride to a pace that is suitable for the walking surface and the tasks you are doing walking with the feet pointed slightly outward making wide turns at corners
You can reduce the risk of tripping by:
keeping walking areas clear from clutter or obstructions keeping flooring in good condition always using installed light sources that provide sufficient light for your tasks using a flashlight if you enter a dark room where there is no light making sure that things you are carrying or pushing do not prevent you from seeing any obstructions, spills, etc.
FROM THE PUBLISHERS OF PAPER TECHNOLOGY INTERNATIONAL®
Volume 9, Number 2, 2023
PITA CORPORATE SUPPLIER MEMBERS
Page 2 ABB
Automation Software Maintenance Program
Page 3 ABB advert
Page 4 Valmet Optical Consistency Measurement model (Valmet OC2W)
Page 5 Valmet Brown Stock Analyzer
Page 6 Valmet Residual Measurement (for bleaching optimisation)
Page 7 Valmet advert
PITA NON-CORPORATE SUPPLIER MEMBERS
Page 8 Voith AdaptClean Technology
NON-PITA SUPPLIER MEMBERS
Page 9 mycon GmbH Automated cleaning solution for air heat exchangers
The Paper Industry Technical Association (PITA) is an independent organisation which operates for the general benefit of its members – both individual and corporate – dedicated to promoting and improving the technical and scientific knowledge of those working in the UK pulp and paper industry. Formed in 1960, it serves the Industry, both manufacturers and suppliers, by providing a forum for members to meet and network; it organises visits, conferences and training seminars that cover all aspects of papermaking science. It also publishes the prestigious journal Paper Technology International® and the PITA Annual Review , both sent free to members, and a range of other technical publications which include conference proceedings and the acclaimed Essential Guide to Aqueous Coating
ABB has launched its latest Automation Software Maintenance (ASM) lifecycle management program to cover the software related to Paper Machine Drives (PMC800) and Pulp and Paper Process Control Library (PPLib800xA). The new service offering is an extension of ABB’s ASM program, and complements the Quality Control System (QCS) ASM program that was introduced in January 2023.
The basis of all ASM programs is to offer a tiered subscription service that enables system evolution from older versions to the latest and/or provide on-demand access to regular software updates that include incremental improvements, patches and new features. This proactive system management helps pulp, paper, packaging and tissue mills to maximize their system investment and reduce maintenance and support costs.
ASM tiered subscription options open up the features available as mills go through the upgrade process. Maintain Plus provides customers with access to incremental updates for PPLib800xA and PM Drives containing fixes and enhancements, meaning mill operators can benefit from new or improved features, as well as keep pace with important cyber security updates. Maintain & Evolve includes all the benefits of the Maintain Plus level, with the added ability to upgrade from an older legacy system version to the latest and between system generations.
The program also gives both PPLib800xA and PM Drives users access to the myABB business portal for program management and premium system documentation, helping keep process control software up to date.
With PM Drives ASM, mill operators can benefit from free licenses to ABB’s newest d rives software applications such as Datalogger and PM Drives Performance – allowing them to historize and leverage data for more predictive maintenance and troubleshooting – as well as machine control safety.
With PPLib800xA ASM, subscription enables an improved human-machine interface (HMI) experience and access to the PPSupport tool, a .Net standalone application that detects unintended changes and aids system engineers in migrating the existing process application libraries to the latest version.
“ABB’s ASM lifecycle management program has been expanded to offer proactive mill operators even better support for their pulp and paper-specific software, allowing them to better manage and predict total cost of ownership,” said Shankar Singh, Global Product Line Manager, Drives and Automation, Pulp and Paper, ABB. “Customers can unlock new features for improved troubleshooting and advanced performance, while at the same time keeping their system software up to date.”
The enhanced ASM lifecycle management program for automation and drives is available to customers from June 30, 2023.

Volume 9, Number 2, 2023

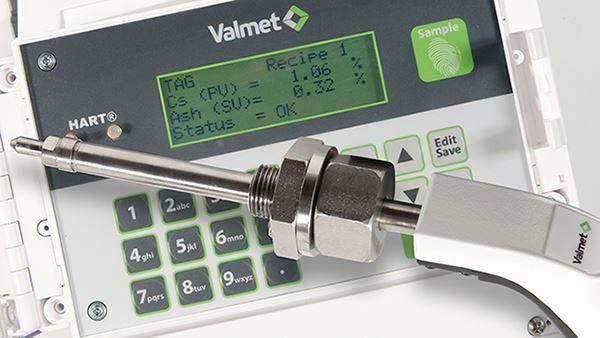
Valmet launches a new Valmet Optical Consistency Measurement model (Valmet OC2W), which has been developed for stock preparation’s short circulation applications in paper, tissue, and board machines. The cost-effective inline consistency measurement is especially suitable for wet end process monitoring.
Valmet OC2W utilizes the total consistency measurement method of the original Valmet Optical Consistency Measurement (Valmet OC) and comes with an added capability of ash content available as a second measured value. Particularly in low-consistency measurements, Valmet’s optical measurem ents are often the only possible technique to provide reliable results. Valmet OC2W can be easily installed with a measuring probe that enables insertion and removal without special tools or a process stop.
“The application specific models make Valmet Opt ical Consistency Measurement perform well in most pulp and paper applications. The new Valmet OC2W makes inline optical measurement available for wet end and adds a new option for wet end monitoring technology,” says Heikki Föhr, Product Manager, Valmet Optical Consistency Measurement, Automation Systems business line, Valmet.
Technical information about Valmet Optical Consistency Measurement (Valmet OC2W)
Valmet OC2W is part of the Valmet Optical Consistency Measurement family, each optimized for use with different kinds of wood pulps and recycled textile fibers. Installed in an area of turbulent flow, the temperature and vibration resistant probes are self-cleaning even in the demanding process environments. Valmet OC2W has been developed to measure ash and total consistency (0-12%) in the challenging wet end environment. Sharing the same basic components and modules, Valmet OC has gained a deserved reputation for accuracy, reliability, and ease of installation.
Valmet OC2W has been developed for sto ck preparation’s short circulation applications in paper, tissue, and board machines.
Valmet has developed Valmet Brown Stock Analyzer to complement its online pulp quality analyzer family. The analyzer provides high analysis frequency for digester and brown stock washing control in kraft pulping. It is the most robust Kappa measurement for high yield and brown pulp, designed to measure the coarsest pulp starting from cooking blow line.
“This is the only analyzer in the market with dual sampling points for blow line Kappa, before and after refining. Accurate and frequent Kappa profile ensures superior process control and enables the mill to optimize cooking parameters, resulting in better yield and pulp quality,” says Timo Laurila, Business Manager, Pulp and Energy Analyzers, Automation Systems, Valmet.
Technical information about Valmet Brown Stock Analyzer
Valmet Brown Stock Analyzer utilizes a well-proven sampling technology to extract a pulp sample and transport it to the analysis unit, where the dissolved lignin is thoroughly washed, and pulp Kappa number analyzed by an advanced optical measurement technology. The Kappa measurement range is 9 –120.
The pulp sample handling principle minimizes water consumption, ensuring effective operation even with high shive content pulps. A low number of moving and wearing parts minimizes the need for maintenance.
The user-friendly analyzer design keeps operators away from the harsh process environment, ensuring that laboratory sampling is carried out in a convenient and safe loca-tion with the automated built-in laboratory collector. Only the process sampling device is connected to the pressurized pulp process.
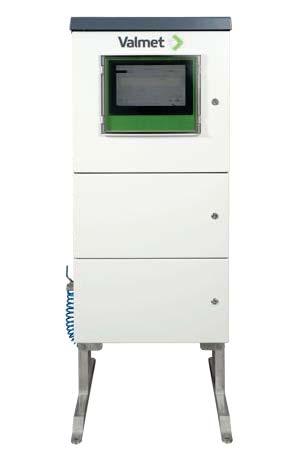
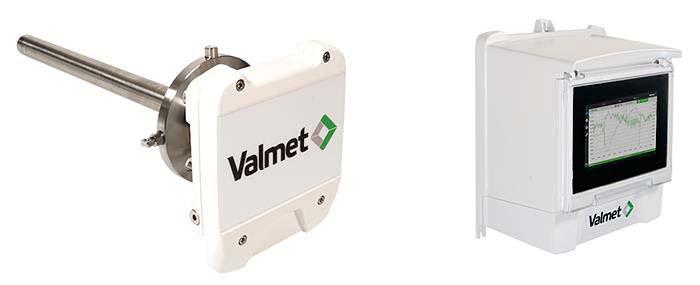
Valmet has launched the sixth generation of its proven design Valmet Residual Measurement (Valmet Polarox6). The new features will further optimize the bleaching process by optimizing bleaching chemical addition, protecting process equipment, and improving measurement and control accuracy.
The updated Residual Measurement is equipped with the Valmet Bridge user interface, a touch screen control platform that is today a standard with Valmet sensors. With comprehensive diagnostics and Valmet Industrial Internet ready capabilities, Valmet Bridge user interface provides an intuitive access to transmitter operation and Valmet ’s remote services.
“This update ensures the longevity and advanced connectivity of our industry standard Valmet Residual Measurement for all pulp bleaching applications,” says Timo Laurila, Business Manager, Pulp and Energy Analyzers, Automation Systems, Valmet.
Technical information about Valmet Residual Measurement
Valmet Residual Measurement provides immediate information about bleachability when installed before the bleaching tower. It is based on pre-chemical consumption (feed-forward), allowing for a fast response to adjust chemical addition controls.
When installed after the bleaching tower, it measures the residual bleaching chemical, providing accurate feedback for chemical dosage control and process equipment protection.
The sensor improves measurement and control accuracy by eliminating under- or overdosing of bleaching chemicals. It ensures the exact chemical dosage for lignin removal and brightness control, resulting in chemical savings and better quality of fibers. Additionally, the operation is safer due to no excess residual.
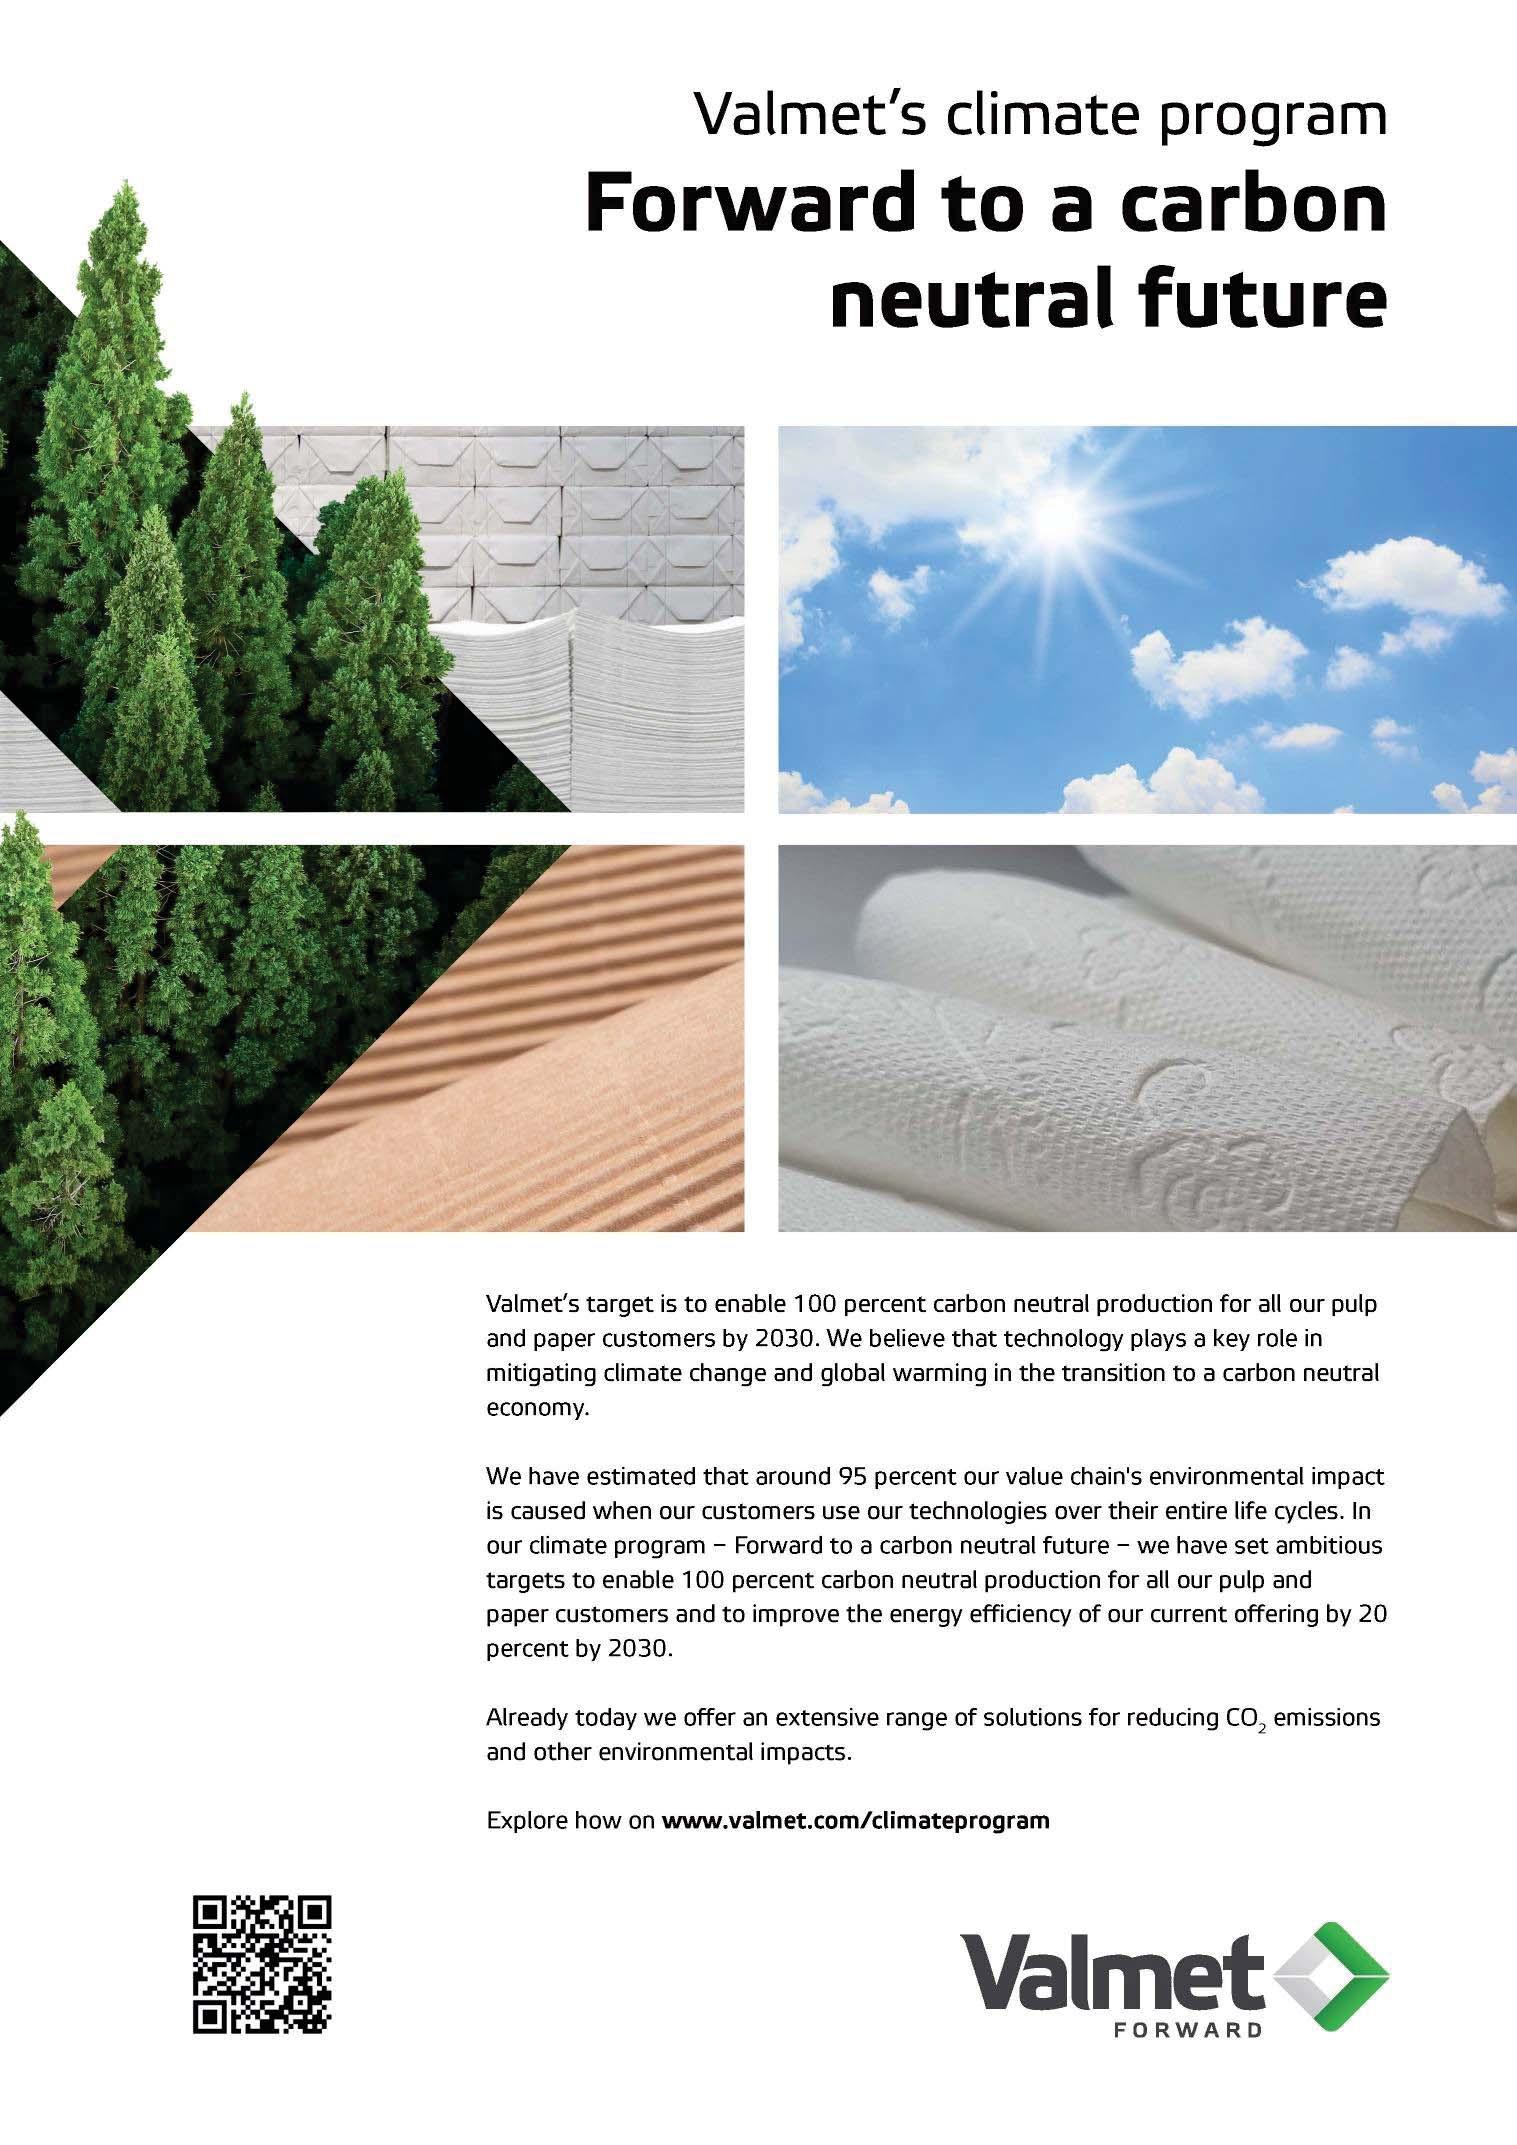
The new AdaptClean system leads to efficiency increases as well as significant fiber and energy savings for existing low consistency cleaner with a diameter of 105 mm or more
The rebuild kit consists of an adapter, the tried and tested cones in various material designs, and the Easy EcoMizer
The modernization is possible for most plants worldwide, regar dless of manufacturer
Based on many years of experience in cleaner technology, Voith introduces the AdaptClean rebuild kit, the latest optimization option within its BlueLine product range. The AdaptClean technology enables a quick and easy conversion of existing low consistency cleaners from a diameter of 105 mm. The upgrade involves removing all parts below the headstock. A Voith cleaner cone and the Easy EcoMizer are then attached to the existing headpiece using an adapter. A dilution water line with pump makes the system ready for use again within a few hours.
“With the new AdaptClean system, we now offer an efficient and fast rebuild worldwide and independent of manufacturer for existing cleaner systems. Due to the optimized service lives and higher plant efficiency, customers thus achieve cost savings every day through the modernization, even for originally non-Voith Cleaners. The ROI of the AdaptClean system is therefore less than one year.” Elmar Ott, Product & Service Manager at Voith Paper
To realize the best cost-benefit combination, the new AdaptClean system is available in a wide range of cone materials. The proven Easy EcoMizer enables clog-free operation with optimal fiber backflushing, significantly reducing fiber losses compared to conventional systems. By reducing the amount of fiber, a significant increase in ash content in the rejects can be realized. In addition, increased inlet stock consistency achieves further energy savings.
Voith also supports its customers with suitable spare parts after the rebuild. In addition to the AdaptClean concept, Voith offers many additional services and individual measures to optimize processes and plant efficiency. Thanks to worldwide service locations and the OnPerformance.Lab remote service center, customers can receive competent support at any time and from any location.
In a transformative effort to combat climate change, mycon GmbH, a specialist in advanced cleaning solutions, announces the launch of a new automated cleaning system for air heat exchangers
A cleaner heat exchanger consumes less energy, with the added benefit that biomass power plants, biogas plants, waste incineration plants, and fossil power plants can produce more electricity. The revolutionary JetMaster and its automated version, JetMaster AS, developed by mycon, utilize compressed air from 3 bar pressure and small volumes of water in a patented process that achieves both an environmentally friendly and surface-friendly result. This meticulous, yet highly efficient cleaning procedure increases the overall performance of the heat exchanger and is protected by patents in both national and international territories.
mycon GmbH has recently successfully implemented this new autom ated cleaning system for a customer operating a 20 MW power plant in Eastern Germany. Prior to the implementation, the power plant experienced significant reductions in electricity production during peak summer temperatures. With the new cleaning system, however, the plant can now continue its operations economically, even during high ambient temperatures.
In addition, mycon GmbH is developing a similarly fully automated cleaning system for smaller heat exchangers, the JetBoy AS. This new system, due to launch later this year, features a simplified design that offers cost-effectiveness and ease of installation. It will provide an alternative to manual cleaning, optimizing the energy efficiency of the heat exchanger and resulting in significant potential savings. With mycon's unique ControlMaster algorithm, the potential savings from increased cleaning frequency can be calculated in advance, provided the customer makes the necessary data available.
By providing an innovative solution to combat energy inefficiency and thus aiding in the global fight against climate change, mycon GmbH continues to demonstrate its commitment to environmentally friendly, effective, and efficient cleaning solutions.
FROM THE PUBLISHERS OF PAPER TECHNOLOGY INTERNATIONAL® R T P O P T
Volume 9, Number 2 2023
Volume 9, Number 2, 2023
The following pages contain a summary of the various installations and orders from around the world of papermaking, wood panel and saw mills, and bio-power generation, received between early April 2023 and the end of June 2023.
The Paper Industry Technical Association (PITA) is an independent organisation which operates for the general benefit of its members – both individual and corporate – dedicated to promoting and improving the technical and scientific knowledge of those working in the UK pulp and paper industry. Formed in 1960, it serves the Industry, both manufacturers and suppliers, by providing a forum for members to meet and network; it organises visits, conferences and training seminars that cover all aspects of papermak ing science. It also publishes the prestigious journal Paper Technology International® and the PITA Annual Review , both sent free to members, and a range of other technical publications which include conference proceedings and the acclaimed Essential Guide to Aqueous Coating
ABC Tissue
Wetherill Park
Sydney Australia
Ahlstrom Aspa Mill
Sweden
A.Celli to supply Distributed Control System (DCS) and Quality Control System (QCS) for PM1 as part of mill’s Industry 4.0 transformation.
Valmet to supply a Valmet IQ Web Inspection System for pulp dirt count; the target is to improve the line efficiency of pulp drying and to achieve high quality of the pulp.
Ajin P&P Hyunpoong Mill
Korea
Alholmens Kraft AB
Pietarsaari Biopower Plant
Finland
Anon
4 different sites USA
APK AG
Merseburg
Germany
Valmet to supply forming section rebuild with an innovative Sleeve roll technology and machine control system for linerboard machine (BM2).
Valmet to replace an existing third-party automation system with a Valmet DNA Automation System.
Toscotec to supply a total of 30 TT SteelDryer cylinders.
AFRY to provide engineering services assignment for the project development phases of this industrial-scale plastics recycling plant to treat 40,000tpy of plastic waste.
Arauco
MDF Mill
Zitácuaro
Mexico
Siempelkamp a complete plant for the production of MDF as well as a short-cycle press lineSiempelkamp subsidiaries CMC and Pallmann will contribute the screening and size reduction technology, and Büttner will supply the dryer as well as the energy plant.
Arauco
MDF Mill
Zitácuaro
Mexico
Arctic Paper S.A., (all sales offices, 2 mills in Sweden and 1 in Poland)
Valmet to deliver chip washing and defibrator system
Tietoevry
to harmonize their processes and speed up digitalization by supplying TIPS Industry Solutions and Services combines standard ERP with industry-specific Manufacturing Execution System (MES) and automation, enabling the needed flexibility in business operations.
Volume 9, Number 2, 2023
COMPANY, SITE SUPPLIER ORDER DESCRIPTION URL
AS Estonian Cell
Kunda Pulp Mill
Estonia
Valmet
renewal of service agreement which covers continuous collaboration on spare parts, process evaluations and condition assessment of the mechanical equipment, as well as yearly shutdowns of the fiber line and baling line.
Link
Asia Pulp & Paper (APP)
Sinar Mas
Indonesian pulp, paper and tissue mills
Asia Symbol Jiangsu Co., Ltd
Changjiang Town
Rugao City
Jiangsu Province
China
Batı Kipaş Kağıt
Söke
Turkey
Billerud AB
Gruvön Mill
Sweden
Tietoevry TIPS Industry Solutions and Services integrated with SAP. Link
Tietoevry Manufacturing Execution System (MES). Link
Valmet
machine clothing for start-up of PM3. Link
Andritz to supply a flue gas treatment system for its soda recovery boiler including an electrostatic precipitator (ESP) including its proven switched integrated rectifier technology (SIR) for maximum operational efficiency.
Link
Burgo
Sarego Paper Mill
Italy
Cartiera Fornaci
Italy
SAEL to rebuild a Jagenberg winder drive Link
SAEL to rebuild PM1 machine drive, the MCC for Steam pumps / hoods / actuators and the DCS modification/implementation for PM1.
Link
Cartiera Pirinoli
Roccavione
Italy
ProJet to provide 4 new high pressure showers (PM1) for multilayer and single-coated cartonboard for foldable boxes and grey carton for packaging, cores, interlayers and tubes.
Link
Chandpur Enterprises Ltd. near New Delhi
Uttar Pradesh
India
Chandpur Enterprises Ltd. near New Delhi
Uttar Pradesh
India
Cellwood to supply hot dispersing unit to help process mixed waste into MG paper
Toscotec
to supply two MG Steel Yankee Dryers for Machine Glazed paper to replace the two local steel cylinders installed on their PM1 and PM2.
Link
Link
DS Smith
Porcari Mill
Italy
DS Smith
Viana Pulp & Paper Mill
Portugal
DS Smith
Viana Pulp & Paper Mill
Portugal
Enfinium Sandwell & Dudley site
UK
Andritz to supply a stock preparation line including Europe’s largest drum pulper (design capacity of 1,650 bdmt per day).
Valmet to supply a recovery boiler and an upgrade of the existing evaporation system.
Voith to rebuild PM4 to increase production and improve overall efficiency.
Valmet to supply automation to this energy-from-waste project (395,000 tonnes of nonrecyclable household and business waste using residual waste to generate 44MW (gross) of baseload energy per annum).
Link
Link
Fibre Excellence
Provence Mill
Tarascon
Southern France
Valmet to supply recovery boiler upgrade, including the design, manufacturing, installation, and start-up support for a modern secondary air system with related equipment and pressure parts, a primary air preheater, black liquor preheaters and related piping, as well as black liquor pumps and related piping.
Link
Green Bay Packaging
Wisconsin
USA
GAW to provide working station for the Speed Sizer from Voith Paper and also the wet end chemical preparation, the starch pneumatic conveying and several starch preparation systems (PM4).
Link
Greenalia Biomass Power
Curtis-Teixeiro S.L.U.
Spain
Greenpanel Industries Ltd.
Routhusuramala
Andhra Pradesh
India
Greenpanel Industries Ltd.
Routhusuramala
Andhra Pradesh
India
Valmet
service agreement to further improve the performance of biomass plant
Andritz a pressurized refining system to process 100% eucalyptus at its MDF mill.
Link
Link
Dieffenbacher a MAIER chipping line for an MDF plant. Link
Holmen Paper AB
Braviken Mill
Sweden
Valmet to provide a TwinRoll wash press to improve the separation between the thermomechanical pulp (TMP) mill and the paper machine; scope includes electric motors, mechanical erection, basic engineering, commissioning, start-up, process support and advisory services.
Henan Longyuan Paper
Zhoukou
Henan province
China
Henan Longyuan Paper
Zhoukou
Henan province
China
A.Celli to deliver a paper rewinder to be used for testliner production
Valmet
to supply key technologies (including a bottom dilution headbox and a Tri-nip press section) and automation systems (including Valmet DNA machine controls (MCS), IQ Quality control system (QCS), dilution profiler for headbox, steam profiler) for new testliner line (PM7).
Hitachi Zosen Inova
EfW facility, Essex & Westfield facility, Scotland
United Kingdom
Hungrana
Hungary
Hyogo Pulp Industries, Ltd.
Japan
ITC
Bhadrachalam Board Mill
Telangana
India
JD Irving Limited
St. Leonard saw mill
New Brunswick
Canada
Jiangxi Pingfeng Paper
China
Valmet to supply a Valmet DNA Automation System to both sites.
ANDRITZ TEP d.o.o Biomass boiler (for sugar beet producer). Link
Andritz a new black liquor evaporation plant to replace the mill’s two existing evaporation lines.
Valmet to rebuild PM1A board machine to produce higher basis weight packaging grade for increasing the production to meet the future market demands.
MiCROTEC log computed tomography scanner
Kadant
OCC line with a capacity of approximately 720 BDMT per day.
Link
Liansheng Pulp & Paper Co. Ltd.
Pulp Mill
Zhangzhou
Fujian province
China
Andritz
to supply two debarking and chipping lines for the new mill. (Scope of supply for the woodyard includes two debarking lines with rubber tire supported debarking drums for excellent debarking results with very low wood losses as well as horizontally fed HHQ-Chippers ensuring high capacity without compromising on chip quality. The line has a capacity of 300 m3 hardwood solid-over-bark per hour. The scope also includes a bark handling system with three BioCrusher BSX machines and bark storage with two ParaScrew travelling screw reclaimers.)
Metsä Board
Kaskinen Mill
Finland
Middle East Paper Company (MEPCO)
Saudi Arabia
Moelven
Valåsen
Sweden
Mondi Štětí Mill
Czech Republic
Mpact Operations (Pty) Ltd.
Mkhondo Paper Mill
Mpumalanga
South Africa
AFRY
pre-engineering assignment for new folding boxboard mill. Link
Greycon to deploy manufacturing process efficiency software Link
Valutec to supply lumber kiln including a control system (sawn boards and planks).
Bellmer to supply a sack kraft line and comprehensive automation solutions including DCS.
Andritz to upgrade the entire neutral sulphite semi-chemical pulping (NSSC) line, including equipment for the wood processing, cooking, washing and refining sections to increase the line’s capacity from 225 bdmt/d to 365 bdmt/d.
Link
Link
Norske Skog
Golbey Mill
France
Valmet to supply consistency measurements to be implemented in the new stock preparation unit and replace the aged ones. (Delivery includes five Valmet Microwave Consistency Measurements, two Valmet Blade Consistency Measurements and 16 Valmet Optical Consistency
Measurements from the latest generation to measure total consistency as well as ash content.)
Pori Energia Oy
Pori
Finland
Andritz to conduct a feasibility study on a carbon capture and storage plant planned to be built at the biomass combined heat and power station supplied by the company in 2017.
Predo Health Products Inc
Türkiye
Quimicolor
Medellín
Colombian
Ranheim Paper & Board
Ranheim
near Trondheim
Norway
Andritz two high-speed hygiene converting lines to produce adult open diapers and femin ine sanitary napkins.
Link
Andritz spunlace line for wipes (nonwovens) Link
Toscotec
dryer section rebuild involving supply of new felt runs including stretcher and guide systems suitable for higher felt tensions, as well as some internal felt loops to deliver improved cleanliness (PM5).
Retek Paper
Türkiye
Roseburg Forest Products
MDF Mill
Southern Oregon USA
SAEL update of drive system of MC2 (purchased from Pirinoli). Link
Siempelkamp
MDF plant. The scope of supply includes a dryer line from Büttner including the sifter, the forming and press line, cooling and stacking line as well as the intermediate storage and the associated automation of the machine technology. The planning of the plan t by the Belgian specialists from Sicoplan is also included. Also integrated is the latest glue saving system for MDF, which is now being further developed with an internationally active industrial partner. The EcoScan NEO measuring system is also used. A special feature in the production process is the use of up to 100% sawdust as input material for the production of MDF instead of the usual wood chips, especially for thin MDF.
Saica
El Burgo de Ebro Mill, Spain & Nogent-sur-Seine Mill, France
Sappi
Saiccor Pulp Mill
South Africa
Voith to supply digital solution OnEfficiency.Strength to save starch on PM10 (Spain) and PM70 (France).
Valmet a three-year service agreement for the MG01 boiler .
Link
Link
SCA
Obbola Mill
Sweden
Valmet to deliver two fibre line improvement projects; deliveries include a Valmet ImpBin chip impregnation system rebuild and the installation of Valmet Wash Filter Hoods. The ImpBin rebuild will stabilize and increase the mill's pulp production and improve its energy efficiency. The new wash filter hoods will primarily improve the mill's safety during regular maintenance and annual shutdowns.
Link
Seshasayee Paper & Boards
Limited India
Shandong Huatai Paper
Pulp Mill
Shandong province
China
Shandong Renfeng
Huantai City plant
Shandong province
China
Sinaatec Algerian
Steves & Sons, Inc.
Athens
Georgia
United States
Stora Enso
Oulu Mill
Finland
BTG to provide digital solutions to improve the mill’s bleaching process (BTG Bleaching Advanced Process Control solution).
Valmet to supply key pulp mill technology to this new mill, including cooking and fiberline, a recovery boiler, a lime kiln and a lime mud filter.
A.Celli to provide paper rewinder to process Jumbo rolls of 60-120 gsm fluting paper
A.Celli to supply two winders to two new Reifenhauser Reicofil meltblown and composite bico RF5 nonwoven lines.
Andritz to supply two high-consistency pressurized refining systems (to process a mixture of hardwood and softwood chips for production of high-quality fibers for molded door skins).
ABB to supply sectional drive systems to convert an idled paper machine to the production of folding box board (FBB) and coated unbleached kraft (CUK).
Link
Link
Link
Link
Link
Link
Stora Enso
Oulu Mill
Finland
FMW Industries to supply four fully automatic pulper feeding lines with a total capacity of 2,700 tons of “virgin fiber bales” per day. Three production lines are designed for processing so-called "jumbo bales" with a total capacity of 123 bales per hour. The fourth line is directed for the preparation and processing of so-called "export bales" (market pulp). This can be adapted for a capacity of 220 bales per hour in the future.
Link
Sudama Wood Panel
Uttarakhand
India
Tamil Nadu Newsprint & Papers Ltd
India
Teknomelt Teknik Mensucat San. ve Tic. A.S.
Kahramanmaras
Türkiye
UNIPAKHELLAS S.A
Thessaloniki
Greece
Winstone Pulp International Ltd. (Karioi Pulp Mill, New Zealand)
Andritz to supply a pressurized refining system to process 100% hardwood for its new fiberboard production line.
BTG
to act as a consulting partner to assist with the Industry 4.0 roadmap development for their Units 1 & 2.
Link
Link
Andritz
to provide a complete neXline wetlace line to produce nonwoven roll goods for biodegradable, plastic-free wet wipes.
Kadant to supply a new stock preparation system to treat OCC.
Andritz
to perform a comprehensive twin wire press retrofit including: a new cantilever system for easier and safer wire replacement; a modernized headbox with modified outlet geometry for improved pulp sheet formation; an upgraded drive section; and a new wire tensioning.
Link
Link
Link
Most journals and magazines devoted to the paper industry contain a mixture of news, features and some technical articles. Very few contain research items, and even fewer of these are peer-reviewed.
This listing contains the most recent articles from three of the remaining specialist English language journals alongside one Korean journal and one Japanese journal, all of which publish original peer-reviewed research:
IPPITA JOURNAL (Peer-reviewed and other)
JAPAN TAPPI JOURNAL (English abstract only)
JOURNAL OF KOREA TAPPI (English abstract only)
NORDIC PULP & PAPER RESEARCH JOURNAL
TAPPI JOURNAL
Notes:
1. JAPAN TAPPI JOURNAL is a members-only journal that contains excellent research articles – abstracts are in English but articles are in Japanese.
2. JOURNAL OF KOREA TAPPI is an excellent open-access research journal –abstracts are in English but articles are in Korean.
The Paper Industry Technical Association (PITA) is an independent organisation which operates for the general benefit of its members – both individual and corporate – dedicated to promoting and improving the technical and scientific knowledge of those working in the UK pulp and paper industry. Formed in 1960, it serves the Industry, both manufacturers and suppliers, by providing a forum for members to meet and network; it organises visits, conferences and training seminars that cover all aspects of papermak ing science. It also publishes the prestigious journal Paper Technology International® and the PITA Annual Review, both sent free to members, and a range of other technical publications which include conference proceedings and the acclaimed Essential Guide to Aqueous Coating
IPPTA JOURNAL, Vol.35(1), 2023
1. A Green approach for Reduction in Bleach Chemicals Consumption by Removing Hexenuronic Acid using Xylanase Enzymes in Pulp Bleaching Process.
2. Artificial Intelligence-enabled green manufacturing of Molded Fibre Products.
3. Controlling Odour Problem in Kraft Paper Industry (Innovative Wastewater Treatment and Monitoring Solutions).
4. Decarbonization in the Indian Pulp & Paper Industry.
5. Energy demand and Carbon Footprint of Bleaching Chemicals.
6. Green manufacturing in Bagasse Pulping in Paper Plant.
7. Green, biobased solutions for Paper Industry.
8. Heat Recovery from Pulp Mill Effluent and Air Compressor System.
9. Hydrogen peroxide - a quick solution to rectify foul conditions in activated sludge process.
10. Improve Sustainability of Paper Mills through Process Optimization.
11. Lignin Valorization and Generation of Precipitated Lignin: a Sustainable Route for Circular Economy in the Context of the Indian Pulp and Paper Industry.
12. Preservation of quality and resource recovery through Lactic Acid Fermentation during Bagasse storage.
13. Production of Packaging Material using Recycled Fibers and Unbleached Subabul Sapwood Pulp through Nanotechnology.
14. Reducing GHG Emissions from Paper Industry using Energy Efficient Techniques.
15. Statistical Validation of Makeup Water Requirement in a Recycled Fibre Based Kraft Paper Mill Operating on Zero Liquid Discharge.
16. Tackling Water Contaminations by Cl02 Technology.
JAPAN TAPPI JOURNAL, VOL.77(4), April 2023
1. Contribute to Saving Energy and Maintenance and Low Noise for Aeration Blower and Flotator Blower New Technology Linked by IoT Support Stable Operation of Wastewater Treatment with Cloud Monitoring and Mac hine Learning.
2. Abrasion Mechanism and Characteristics of Cast Material for Refiner Plates.
3. Latest Mechanical Seal Face Technology OperAtional Reliability Improvement by Technical Specialty of Seal Face.
4. Shaft Voltage Measurement to Protect Roller Bearings.
5. Innovative Roll Handling Module Driven by Compressed Air.
6. The Approaches to Achieve Efficient and Simplified Pest Management.
7. Effect of Two Colors of New UV-Absorbing Films on the Adult Chironomids.
8. Speedy! Safety! High Repeatability! ABB L&W Reliable Paper Testing. Technology L&W New Testing Method Provides New Quality Management Way.
9. Development of the New Formation Tester “FMT -4.”
10. Report on the Results of the Fiscal 2022 Follow-up Survey on “JPA’s Carbon Neutrality Action Plan” and Related Information on Measures against G lobal Warming in the Japanese Paper Industry.
11. Introduction of Research Laboratories (150) ― Laboratory of Applied Microbiology and Microbial Metabology, Department of Biochemistry and Molecular Biology, Faculty of Agriculture and Life Science, Hirosaki University.
12. Research Report (Original Paper) ― Novel Analysis of Recycled PulpContaining Paper, Including Fluorescent Whitening Agent: Part 1 Confocal Laser Scanning Microscopy Method.
13. Pulp and Paper Mills in Japan (102) ― Kani Mill, Daio Paper Cor poration.
JAPAN TAPPI JOURNAL, VOL.77(5), May 2023
1. SEIKOAT® T-EF201, a Novel Non-fluorinated Oil-resistant Coating Agent Capable of Maintaining High Air Permeability of Paper.
2. Development of Water-based Coating Agent for Paper Packaging Materials.
3. Introduction for VOITH Group Pilot Coater and Development Activity of Barrier Coating Paper using Curtain Coater.
4. Technologies for Reuse of Beverage Paper Packages.
5. Development of Biomass Plastics Derived from Wood Pulp.
6. Development of Applications for Non- beverage Paper Container “SPOPS” and Future Plans.
7. Development of Paper Packaging for Plastic Reduction.
8. Development of Biomass Based Non-Woven Fabric for Thermoforming, “Kinarito”.
9. Market Deployment of Micro Cellulose Beads.
10. Adsorption Thermal Storage System “Mega stock” by Using Waste Heat.
11. Research Projects of Universities and Government Research Institutes - Wood Science Committee.
12. Pulp and Paper Mills in Japan (103) - Ebetsu Mill, Oji F-Tex Paper Co., Ltd.
JAPAN TAPPI JOURNAL, VOL.77(6), June 2023
1. Report of the 27th Saving Energy Seminar - Energy Committee.
2. Activities of Kawasaki Heavy Industries for Realization of International Hydrogen Supply Chain.
3. Introduction of Carbon Neutral Technology to Improve of Power Generation Facility for Pulp and Paper Mills.
4. State-of-the-art Integration of Energy Balance by Andritz―A Futuristic Pulp Mill with Integration of Fiberline and Recovery Processes.
5. Start up Experience of a Biomass boiler.
6. The Activities for Energy Saving in Ohe Mill.
7. Activities for Energy Saving in Takaoka Mill.
8. Challenges of Energy Saving in Kasugai Mill.
9. Andritz Proposal for CO2 Reduction at Pulp Mill―Sootblower ACE for Recovery Boiler.
10. Valmet Technology for Energy Saving and Reducing CO2 Emissions in Pulp Mills.
11. Paper and board -Determination of color by diffuse reflectance- Indoor daylight conditions C/2°).
12. Introduction of Research Laboratories (151) Laboratory of Forest Products, Faculty of Agriculture, Yamagata University.
JOURNAL OF KOREA TAPPI, Vol.55(1), February 2023
1. Effect of Lignin-Rich Microfiber on Handsheet Strength.
2. Preparation of Higher Purity Cellulose from Kenaf Core by Acid Hydrolysis.
3. Effect of Application of VAE Emulsion and Water-Soluble Resin Binder on the Properties of Coated Paper.
4. Effect of Pulp Modification and Pulp Mixing Ratio on Fold Crushing Resistance of High Bulk Paper.
5. Effect of the Silica Nanoparticles on Pore Size Control of the Air Filter Made from Cellulose Nanofibers (CNFs).
6. Study on the Stock Preparation Conditions for Improving Fold Crushing Resistance of High Bulk Paper Products.
7. Study of Defibration of Rice Husk Depending on the Mechanical Treatment Methods.
8. Evaluation of Physical Properties of Coated Paper Blended with Zeolite in PreCoating Layer.
9. A Study on Extraction of Softwood and Hardwood Chips Using GlycerolImidazole Eutectic Solvent.
10. Influence of Hydrogels Prepared Using Carboxymethyl Cellulose on Water Retention in Soil.
11. A Study on the Characteristics of Traditional Hanji, Xuan Paper, and Washi for UNESCO Registration.
12. Application of Spectroscopy to Analyze the Degree of Substitution of Carboxymethyl Cellulose.
13. Effect of Cellulose Nano Fiber on the Physical and Printing Properties of Coated Paper.
JOURNAL OF KOREA TAPPI, Vol.55(2), April 2023
1. C Effect of Hydrophobization of Paper by Gas Grafting on Physical Properties of Recycled Paper.
2. Sulfonation of HwBKP by Sulfur Trioxide Pyridine Complex and Preparation of Anionic Cellulose Beads Using the Same.
3. Characterization of Cellulose Fibers According to Cellulase-Active Microbial Pretreatment.
4. Dynamic Causal Relationships among Imported Pulp and Waste Paper Prices.
5. Development of Drying Energy Saving Technology of Paperboard by Applying Precipitated Calcium Carbonate Made from Oyster-Shell Byproducts.
6. Analysis of Surface Characteristics of Printing Paper Using Contact Profilometry.
7. Study on Dispersion Characteristics of HwBKP Hydrophobized by Repeated Gas Grafting in Polypropylene.
NORDIC PULP & PAPER RESEARCH JOURNAL, Vol.38(1), March 2023
1. Biorefining: Microwave heating rate and dielectric properties of some agricultural wastes.
2. Chemical pulping: Adapting the kraft cooking process in glyc erol media. Studies of impregnation kinetics.
3. Paper technology: Numerical simulation of heat pump drying system for paper exhaust hood.
4. Paper technology: Using machine learning to predict paperboard properties – a case study.
5. Paper physics: Wet creping of paperboard.
6. Paper physics: Experimental investigation into paper dust formation during knife edge cutting on a laboratory scale.
7. Paper physics: Bending stiffness and moment capacity of cardboard obtained from three-point and elastica bending tests.
8. Paper chemistry: Application of TMP-DCMC-BBR/KH-791-SiO2/HPDSP multifunctional protective fluid in paper protection.
9. Paper chemistry: Study on aging resistance of AAAS grafted in situ on paper documents.
10. Coating: Flexible graphene oxide/polyacrylonitrile composite films with efficient ultraviolet shielding and high transparency for the protection of paper-based artifacts.
11. Coating: Activated carbon paper as ethylene adsorber.
12. Printing: Effect of progressive deinking and reprinting on inkjet-printed paper.
13. Printing: Digital printing systems and office papers interactions and the effects on print quality.
14. Packaging: Comparison of methods to characterize the penetration of hot melt adhesive into paper.
15. Packaging: A study on forming limit diagram and laminated stamping of paperboard.
16. Environmental Impact: Ultrafiltration and reuse opportunities of sectorial effluents from a kraft pulp mill in Brazil.
17. Open Access: CaCO3 solubility in the process water of recycled containerboard mills.
18. Miscellaneous: Feasibility for the preparation of aerogels with celluloses extracted mildly from waste palm leaves.
1. Biorefining: Possible alternatives for using kraft lignin as activated carbon in pulp mills – a review.
2. Biorefining: Technical kraft lignin from coffee parchment.
3. Biorefinery: Nitric acid-potassium hydroxide fractionation of rice straw: an integrated biorefinery initiative.
4. Paper technology: The influence of fibrous suspension flow regimes on the formation of tissue paper manufactured from different furnish compositions.
5. Paper physics: Assessment of paperboard large deformation at fold using digital image correlation technique.
6. Paper chemistry: Response surface methodology optimization and antimicrobial activity of berberine modified trimethoprim carboxymethyl cellulose.
7. Packaging: Addition of bentonite to cationic starch matrix for coating on kraftliner paper to improve grease resistance.
8. Recycling: Changes in water-vapor-adsorption isotherms of pu lp fibers and sheets during paper recycling, including drying of wet webs, and disintegration and sonication of dried sheets in water.
9. Recycling: Determination of fines in recycled paper.
10. Recycling: Disintegration of toilet papers used in shopping malls.
11. Nanotechnology: Cryoslash as an effective pre-treatment to obtain nanofibrillated cellulose using ultra-fine friction grinder with kraft pulp.
12. Nanotechnology: Pre-treatment with calcium hydroxide and accelerated carbonation for cellulosic pulp fibrillation.
13. Chemical technology/modifications: Study on manufacturing hot water-resistant PVOH coated paper by gas grafting palmitoyl chloride (II) –Control of palmitoyl chloride penetration by inorganic pigments coating.
14. Lignin: Efficient and eco-friendly isolation and purification of lignin from black liquor with choline chloride-based deep eutectic solvents.
15. Miscellaneous: Flocculation of alkyl ketene dimer and calcium carbonate on paper sizing and filling performance.
TAPPI JOURNAL, March 2023
1. Editorial: Progress continues in recovery cycle optimization.
2. Eucalyptus black liquor properties in a lignin extraction process: density, dry solids, viscosity, inorganic, and organic content.
3. On the diagnosis of a fouling condition in a kraft recovery boiler: combining process knowledge and data-based insights.
4. Recovery boiler back-end heat recovery.
5. Non-process elements in the recovery cycle of six Finnish kraft pulp mills.
6. Value creation by converting pulp mill flue gas streams to green fuels.
7. Techno-economic analysis of hydrothermal carbonization of pulp mill biosludge.
TAPPI JOURNAL, April 2023
1. Editorial: PEERS 2023 Poster Session: a competition for students and young professionals.
2. Pilot scale black liquor concentration using pressure driven membrane separation.
3. Evaluation of soap recovery efficiency from black liquor — analytical tools.
4. Black liquor evaporators upgrade How many effects?
5. How do mud balls form in lime kilns?
6. Advantages of lean duplex stainless steels in the pulp and paper industry.
TAPPI JOURNAL, May 2023
1. Editorial: Shaping industry and career success with TAPPI Standards involvement.
2. Comparative analysis and benchmarking of commercial and emerging fast pyrolysis technologies.
3. Quantification of the degree of preference for different tissue products based on a hand-felt tissue test panel.
4. Research on flame-retardant paper prepared by the method of in-pulp addition of ammonium polyphosphate.
5. Dissolution of wood components during hot water extraction of spruce.
6. Paper bending stiffness and web tension measurement from a running web using a vacuum and computer imaging.
TAPPI JOURNAL, June 2023
1. Editorial: Critical literature reviews in open source journals.
2. External fibrillation of wood pulp.
3. Understanding alkenyl succinic anhydride (ASA) size reversio n due to autooxidation.
4. Pareto-based design of experiments for identifying and comparing optimum sealing parameters of heat sealing applications in packaging machines.
5. Evaluating the effect of recovery boiler operation of green liquor dregs concentration using multivariate analysis.
6. Co-pulping of Trewia nudiflora and Trema orientalis.
7. Water chemistry challenges in pulping and papermaking – fundamentals and practical insights: Part 2: Conductivity, charge, and hardness.
Volume 9, Number 2 2023
The general peer-reviewed scientific and engineering press consists of several thousand journals, conference proceedings and books published annually. In among the multitude of articles, presentations and chapters is a small but select number of items that relate to papermaking, environmental and waste processing, packaging, moulded pulp and wood panel manufacture. The abstracts contained in this report show the most recently published items likely to prove of interest to our readership, arranged as follows:
Page 2
Page 3
Page 4
Page 5
Page 6
Page 7
Coating
Environment
Fillers
Moulded Pulp Nano-Science
Packaging Technology Papermaking
Testing
Page 8 Tissue
Page 9
Waste Treatment
Wood Panel
The Paper Industry Technical Association (PITA) is an independent organisation which operates for the general benefit of its members – both individual and corporate – dedicated to promoting and improving the technical and scientific knowledge of those working in the UK pulp and paper industry. Formed in 1960, it serves the Industry, both manufacturers and suppliers, by providing a forum for members to meet and network; it organises visits, conferences and training seminars that cover all aspects of papermak ing science. It also publishes the prestigious journal Paper Technology International® and the PITA Annual Review , both sent free to members, and a range of other technical publications which include conference proceedings and the acclaimed Essential Guide to Aqueous Coating.

“Improving the Optical Properties and Filler Content of White Top Testliners by Using a Size Press”, Mustafa Çiçekler, Tamer Sözbir & Ahmet Tutuş, acs Omega, 2023, 8, 23, 21000–21007. This study aims to investigate the impact of coating with ground calcium carbonate (GCC) on the optical properties and filler content of white top testliner (WTT) papers. The paper properties investigated include brightness, whiteness, opacity, color coordinates, and yellowness. The results showed that the amount of filler mineral used in the coating process significantly affected the optical properties of the paper. The use of 15% total solids of GCC in the coating suspension resulted in the highest level of whiteness and improved the brightness value by 6.8%. The use of 7% total solids of starch and 15% total solids of GCC reduced the yellowness index by 85%. However, the use of only 7 and 10% total solids of starch had an adverse effect on the yellowness values. The surface treatment led to a significant increase in the filler content of the papers, with a maximum of 23.8% achieved using a coating suspension with 10% total solids of starch solution, 15% total solids of GCC suspension, and 1% dispersant. The starch and GCC in the coating suspension were found to have a direct impact on the filler content of the WTT papers. The addition of a dispersant improved the uniform distribution of the filler minerals and increased the filler content of the WTT. The water resistance of WTT papers increases due to the use of GCC, while their surface strength remains at an acceptable level. The study demonstrates the potential benefits of the surface treatment in terms of cost savings and provides valuable information on the impact of the treatment on the properties of WTT papers.
“Water and oil-resistant paper materials based on sodium alginate/hydroxypropyl methylcellulose/polyvinyl butyral/nano-silica with biodegradable and high barrier properties”, Ruifeng Zhu, Xiaoto ng Fu, Shengnan Jin, Rui Ma, Zhibin He, Dan Zhang & Zghu Long, International Journal of Biological Macromolecules , Vol.225, 15 Jan. 2023, pp.162-171. Despite many technical challenges in the development of safe and environmentally friendly food packaging paper materials with excellent water and oil resistance using simple methods, producing paper-based functional materials using biobased polymers is currently an important topic in the food pack aging industry. In this study, novel water and oil-resistant coatings for the paper were developed through the combination of sodium alginate (SA), hydroxypropyl methylcellulose (HPMC), polyvinyl butyral (PVB), and hydrophobic silica nanoparticles (HSNPs). To impart oil-repellency to paper, SA and HPMC were first mixed uniformly and coated on the base paper, which was pre-treated with calcium chloride solution. A compact and tough coating layer was formed on paper due to the hydrogen bonding between SA and HPMC molecules, and the crosslinking between SA and Ca2+ ions in the base paper. High water resistance of the paper was achieved through the coating of PVB and HSNPs on top of the coating of SA/HPMC. The final coated paper demonstrated outstanding oil resistance (kit rating: 12/12), water resistance (Cobb value: 4.23 g/m2), low water vapor transmission rate (100 g/m2·24 h), and improved mechanical properties. This fluorine-free, and biodegradable barrier paper will find excellent applications in the food packaging industry.
“Chitosan coated papers as sustainable platforms for the development of surfaceenhanced Raman scattering hydrophobic substrates”, Natercia C.T. Martins, Sara Fateixa & Tito Trindade, Journal of Molecular Liquids, Vol.375, 1 April 2023, 121388. Paper-based sensors for surface-enhanced Raman scattering (SERS) detection of water pollutants have gained much attention in the last decades. However, most of the fabricated paper-based SERS substrates still face some limitations regarding reproducibility and uniformity. In this work, we report the fabrication of hydrophobic paper-
based SERS substrates with high reproducibility and uniformity by inkjet printing Ag colloidal nanoparticles (NPs) on office paper pre-treated with chitosan (CH) or N,N,Ntrimethyl chitosan (TMC). We demonstrate that the previous coating of paper with such biopolymers substantially improves the SERS performance of the paper substrates. In screening experiments, crystal violet (CV) 100 μM was used as molecular probe, leading to an increase of about 9- and 7-fold in the observed SERS intensity when the papers were coated with CH and TMC, respectively. Also, the reproducib ility of the substrates coated with the biopolymers increased more than 2 times compared to non-coated office paper. We suggest that the improved performance of the coated substrates is related to a more uniform deposition of the AgNPs on the paper surface due to the hydrophobic nature, low porosity and roughness of the coated paper.
“Insights into the per- and polyfluoroalkyl substances-contaminated paper mill processing discharge: Detection, phytotoxicity, bioaccumulative profiling, and health risk verification”, Y.N. Chow & K.Y. Foo, Journal of Cleaner Production , Vol.384, 15 January 2023, 135478. Per- and polyfluoroalkyl substances (PFASs), a new class of contaminants of emerging concern in different water sources and industrial discharges, have been highlighted, mainly ascribed to the high mobility, persistent, and bioaccumulative behaviors. In this work, the analytical detection of PFASs in the paper mill processing discharge (PMPD), physicochemical parameters, tannin and lignin, and phenolic content were carried out. The phytotoxicity evaluation and bioaccumulative profiles of PMPD-assisted irrigation have been conducted using a soilless cultivation system. The cytotoxicity, genotoxicity and human exposure risk were ascertained via in vitro assay on the human hepatocellular carcinoma (HepG2) cell and the estimation of daily intake, respectively. PFASs were quantitatively detected at the mean concentration of 2712.72 ng/L, consisted of mainly perfluoroalkyl carboxylic acids (PFCAs), perfluoroalkane sulfonic acids (PFSAs), perfluoroalkane sulfonamidoacetic acids (FASAAs), perfluoroalkane sulfonamides (FASAs), and fluorotelomer sulfonic acids (FTSAs). Significant reductions of the physical elongation, dry weight, and chlorophylls up to 33.49%, 31.71%, and 52.17% were recorded. Profound increase in the proline (101.81%), hydrogen peroxide (55.56%), superoxide anion (67.86%), lipid peroxidation (43.91%), and protein oxidation (32.31%), and up-regulation of antioxidant enzymes activities have been quantified. Bioaccumulation and translocation of PFASs revealed a concentration-, chain length- and functional group-dependent trend within different plant compartments. PFASscontaminated PMPD treatments induced dose-dependent cell viability reduction and DNA damage in the HepG2 cell. The findings have highlighted that PMPD could be an underestimated source of PFASs, which represents a sharp threat to plants and public health via the water-food crop-human continuum. Future studies gearing towards the genomic profiling of PFASs in different plant species are suggested.
Nupur Swain, Pragti Saini, Sampat Singh Bhati & Vibhore Kumar Rastogi, Journal of Inorganic and Organometallic Polymers and Materials , 2023, online. Stone paper is a relatively sustainable alternative to traditional fibre-based paper. Stone paper is made using resin such as high-density polyethylene (HDPE) and a mineral such calcium carbonate (CaCO3). Plasticizers, bulking agents, coupling reagents, dispersing agents, and inorganic fillers are added in the stone paper formulation for imparting different properties. However, the HDPE, used in stone paper formulation, is not biodegradable and can be replaced with biodegradable polymers to make stone paper more environment friendly. The biodegradable stone paper can be easily made using relatively cheaper
blown film process. The stone paper can also be made from CaCO 3 waste of traditional paper industry and recycled polymer waste. This review paper provides overview about the stone paper, the biodegradable polymeric materials which can be used instead of HDPE, information about the converting processes for stone paper; it’s applications and comparison to the traditional paper.
“Assessing life-cycle GHG emissions of recycled paper products under imported solid waste ban in China: A case study”, Huijing Deng, Dingfan Zhang, Huajun Yu, Yi Man and Yutao Wang, Science of The Total Environment , Vol.891, 15 Sept. 2023, 164407. Changes of raw materials in China's recycled paper industry after the imported solid waste ban affect products' life-cycle greenhouse gas (GHG) emissions as well. This paper presented a case study of newsprint production with prior - and post-ban scenarios with life cycle assessment, including using imported waste paper (P0) and its three substitutions, i.e., virgin pulp (P1), domestic waste paper (P2), and imported recycled pulp (P3). The function unit is 1 ton of newsprint produced in China, and the study is conducted from cradle to grave which consists pulping and papermaking process, from raw material acquisition to manufacturing, with associated energy production and wastewater treatment, transport, and chemicals production. Our results showed that P1 holds the highest life-cycle GHG emission of 2724.91, followed by 2400.88 from P3. P2 has the lowest emission of 1619.27, only slightly lower than 1742.39 before the ban using route P0 (unit: kgCO2e/ton paper). Scenario analysis showed that current average life-cycle GHG emission for one ton of newsprint is 2049.33 kgCO2e, increased by 17.62 % due to the ban, while this number could be reduced to 12.22 % or even −0.79 % if switching from P1 to P3 and P2. Our study highlighted the importance of domestic waste paper as a promising way to reduce GHG emissions, which still has great potential to increase if with an enhanced waste paper recycling system in China.
“Producing Flexible Calcium Carbonate from Waste Paper and Their Use as Fillers for High Bulk Paper”, Lae Hyuk Kang, Yung Bum Seo & Jung Soo Han, BioResources, 2023, Vol.18(2), pp.3400-3412. Microfibrillated cellulose (MFC) was prepared from post-consumer old corrugated container (OCC) material, which was first disintegrated in water, cleaned to remove impurities, and then fibrillated by grinding. Those processed MFCs were treated with in-situ formation of calcium c arbonate by adding calcium oxide and injecting carbon dioxide into the mixture up to the ratio of 1:40 (MFC: calcium carbonate) by weight. The MFCs had a dark brown color initially but turned into high brightness materials similar to commercial ground calcium carbonate (GCC) after the in-situ formation process. The MFCs that had calcium carbonate attached on their surfaces, which were lengthy and flexible, were called flexible calcium carbonate from OCC (FCCO). Paper containing FCCO gave higher bulk, higher stiffness, and higher tensile index without lowering smoothness when compared to the paper containing commercial GCC. However, brightness was slightly lowered because of initial low brightness of the OCC. This study also demonstrated the feasibility to substitute wood fibers up to 5% with FCCO without lowering essential properties for printing paper. Benefits of the waste paper are savings of both wood resources and production cost.
“Comparison of Particle Shape, Surface Area, and Color Properties of the Calcite Particles Ground by Stirred and Ball Mill”, Ugur Ulusoy, Serkan Çayirli, Guler Bayar & Hasan Serkan Gokce, Minerals 2023, 13(1), 99. Since the particle size, shape, specific surface area, and purity of the ground calcium carbonate (GCC) decide its usability in the paper, paint, and plastic industries, the effect of grinding is important. However, the effect
of stirred and ball mill grinding on the particle shape of GCC by dynamic image analysis (DIA) is still lacking in the literature. Therefore, the aim of this study is to compare the aspect ratio at the same fineness (d97 = 50 μm) and evaluate other properties such as color, and surface area of GCC particles by stirred and ball mill grindings. DIA results showed that particles produced by the ball mill had higher aspect ratio values than those by the stirred mill. This was attributed to the impact, and attrition breakage modes produced by the ball and stirred mill, respectively. This conclusion is supported by XRD and SEM. Finally, the results related to physical properties such as aspect ratio, surface area, and whiteness are discussed depending on the usage area of GCC.
“Sustainable nanocomposite coating for moulded pulp with enhanced barrier properties for food packaging applications”, Supattra Klayya, Nattaya Tawichai, Uraiwan Intatha, Han Zhang, Emiliano Bilotti & Nattakan Soykeabkaew, Polymer International, Vol.72(3), pp.323-332. Due to poor barrier properties and high sensitivity to moisture, the applications of paper-based food packaging remain limited. While gaining high barrier performance and surface durability, laminating papers with binders and other materials often leads to reduced recyclability and sustainability. Herein, we present a promising approach to improve the barrier properties and surface oil resistance of bagasse moulded pulp while preserving its green profile. A bio-nanocomp osite layer, combining nanocellulose and shellac (natural polyester), was coated on the surface of moulded pulp. This nanocomposite coating layer provides excellent gas barrier and water barrier performance simultaneously, thanks to the ester modification of nanocellulose to improve its hydrophobicity. With a good compatibility and dispersion in the shellac matrix phase, the modified nanofibrillated cellulose demonstrated an improved barrier performance compared with the unmodified nanofibrillated cellulose. Oxygen transmission rate and water vapour transmission rate of the coated pulps were in the range 60 –300 cm3 m−2 day−1 and 10–30 g m−2 day−1, respectively, comparable to those of conventional food packaging materials. The surface resistance of the coated pulps was also greatly improved, indicated by the water contact angle, oil contact angle, Kit test and oil resistance test in a bowl model. The nanocomposite was able to enhance the tensile strength of the moulded pulp by 23%. In summary, the current sustainable nanocomposite coating layer demonstrated great potential in converting paper-based materials to high barrier and sustainable food packaging.
“Impact of bacterial cellulose on the physical properties and printing quality of fine papers, Ana F. Lourenco, Daniela Martins, Fernando Dourado, Pedro Sarmento, Paulo J.T. Ferreira & Jose A.F. Gamelas, Carbohydrate Polymers, Vol.314, 15 Aug. 2023, 120915. Bacterial nanocellulose (BNC), due to its inherent nanometric scale and strength properties, can be considered as a good candidate to be used in papermaking. This work explored the possibility of using it in the production of fine paper as a wet-end component and for the paper coating. Filler-containing handsheet production was performed with and without the presence of common additives typically used in the furnish of office papers. It was found that, under optimized conditions, BNC mechanically treated by high-pressure homogenization could improve all the evaluated paper properties (mechanical, optical and structural) without impairing the filler retention. However, paper strength was improved only to a small extent (increase in the tensile index of 8 % for a filler content of ca. 27.5 %). On the other hand, when used at the paper surface, remarkable improvements in the gamut area of >25 % in comparison to the base paper and of >40 % in comparison to starch-only coated papers were achieved for a formulation
having 50 % BNC and 50 % of carboxymethylcellulose. Overall, the present results highlight the possibility of using BNC as a paper component, particularly when applied at the paper substrate as a coating agent aiming at improving printing quality.
“Rice Straw as a Source of Nanocellulose for Sustainable Food Packaging Materials: A Review”, Makdud Islam, Praveen Saini, Rahul Das, Shubhra Shekhar, Akhouri Sanjay Kumar Sinha & Kamlesh Prasad, BioResources, Vol.18(1), Feb. 2023, pp.2351-2385. Asian countries, despite being the largest producers and yielding a significant proportion of the world’s rice, have poor disposal facilities for the harvested rice straw (stubble). Due to higher costs in their handling relative to their value, local farmers prefer the burning of stubble fields, thus creating environmental problems. Even though the government has taken initiatives, no effective solution has been discovered to handle this large agro-waste problem efficiently. In this regard, the utilization of rice straw to develop nanocellulose (NC) products is of interest. Renewability and biodegradability, along with suitable mechanical and thermal properties required for the packaging functions, are key advantages of NC. The bio-nanocomposites prepared using NC and other bio-based polymers are also being widely considered for sustainable food packaging applications due to the reinforcement provided by NC and alternative petroleum-based packaging materials. This review provides an overview of process utilization for preparing NC products using rice straw, pulping methods, and isolation to produce bionanocomposites for sustainable food packaging applications. The challenges and future aspects covering the utilization of rice straw for producing NC and eventually producing active packaging materials are also discussed
“Structural design and performance study of corrugated fibreboard with a laminated structure”, Zhou Li-na, Zhong Chen, Liu Li, Guo Yan-ping, Chen Xin & Xia Zheng, Packaging Technology and Science , 2023, online. Corrugated box is an important transport packaging container in the global logistics. The research on its raw material, that is, corrugated fibreboard, has always been an important topic in the packaging field. However, the research objects nearly focus on the corrugated fibreboard of traditional corrugated medium. The innovative research on the structure of corrugated fibreboard is also still rare. Since the pandemic COVID-19 in 2020, the inter national corrugated packaging industry has faced new dilemma. The development of new corrugated boxes and fibreboard is the way to break the situation in innovation and transformation. This study aims to design a new fibreboard with laminated structure medium for obtaining a new type of corrugated fibreboard for packaging with better cushioning and anti-vibration performance than traditional corrugated fibreboard. The verification experiments show that the new fibreboard has better recovery and structural stability due to its unique three-layer structure. The static and dynamic cushioning performance and anti-vibration performance of the proposed fibreboard have been greatly improved compared with those of the traditional one.
“Changes in fold cracking properties and mechanical properties of high -grammage paper as affected by additive and fillers”, Kim, D. -S. & Sung, Y.J., BioResources, Vol.18(2), May 2023, pp.3217-3227. Fold cracking, which reduces the economic feasibility of paper-making, is a localized surface deformation caused by extreme bending stress. Most paper products, such as base paper and coated paper, gener ate fold cracking during folding processing. To control fold cracking, the mechanical properties of the base paper can be strengthened, and the flexibility of the structure can be increased by controlling the
modification in pulp fibers and stock preparation conditions. This study analyzed the changes in the mechanical properties of high-grammage paper in response to the addition of precipitated calcium carbonate (PCC) and cationic starch (C-starch). The application of inorganic filler (PCC) drastically reduced the internal bond strength and tensile strength, causing fold cracking, whereas C-starch increased the bond strength between fibers, which improved the tensile strength, internal bond strength, and elongation. However, when applied independently, fold cracking occurred because of extreme increase or decrease in strength. Therefore, the combined application of C-starch and PCC made it possible to form a paper-based structure with high fold cracking resistance. Moreover, when the fold cracking resistance was excellent, the mechanical properties were balanced without being biased in one direction even under conditions of relatively low mechanical properties
“A comprehensive review of chitosan applications in paper science and technologies”, Mostafa Rohi Gal, Mehdi Rahmaninia & Martin A. Hubbe, Carbohydrate Polymers, Vol.309, 1 June 2023, 120665. Using environmentally friendly biomaterials in different aspects of human life has been considered extensively. In this respect, different biomaterials have been identified and different applications have been found for them. Currently, chitosan, the well-known derivative of the second most abundant polysaccharide in the nature (i.e., chitin), has been receiving a lot of attention. This unique biomaterial can be defined as a renewable, high cationic charge density, antibacterial, biodegradable, biocompatible, non-toxic biomater ial with high compatibility with cellulose structure, where it can be used in different applications. This review takes a deep and comprehensive look at chitosan and its derivative applications in different aspects of papermaking.
“Eliminating congestion in China’s papermaking and paper products i ndustry: From both the perspective of increasing and decreasing inputs ”, Xian-tong Ren & Guoliang Yang, Journal of Productivity Analysis, 2023, online. Congestion is a well-known economic phenomenon in which excessive inputs lead to a decrease in the maximum possible outputs. This study analyzes the relationship between congestion and overinvestment using a data envelopment analysis framework to reveal that some congestion can be eliminated by increasing inputs. The proposed approach classifies congestion into two categories, relative and absolute congestion, depending on the possibility of eliminating congestion by increasing inputs. Corresponding methods for identifying and measuring congestion are proposed and employed for empirical analyses examining China’s papermaking and paper products industry. We find that most congestion in 2013 –2016 is in the relative congestion and could be eliminated by increasing inputs. The primary causes of congestion are identified based on our analysis and corresponding policy suggestions are proposed for eliminating congestion.
“On the tensile response of formed fiber networks with low areal density”, Shubham Agarwal, Sheldon I. Green & A. Srikantha Phani, Mechanics Research Communications, Vol.130, July 2023, 104128. Fiber networks are ubiquitous. The networks of interest to this study are distinguished from the widely studied planar random fiber networks (RFN) by their low areal density (grammage), preferential orientation, and fiber curl. Oriented networks are created through a high speed manufacturing process called forming in paper making. A dilute suspension of elastic fibers in water impinges on a moving wire to create a formed network. A discrete element method (DEM) based forming model is developed that incorporates the qualitative effects of fluid shear (preferred fiber
orientation) and viscous drag during drainage (fiber conformation to the wire topography). Virtual tensile tests performed on thus formed networks reveal that the tensile response is initially softer due to non-affine deformation, and anisotropic due to preferential orientation. Consequently, an orientation dependent power law with a non-unique exponent emerges for the scaling of modulus and strength with the network density. Tensile test simulations reveal the re-alignment of fibers along the loading direction, and strong strain localization resulting in a few fibers (1%) carrying the imposed strain energy. Fiber curl and orientation are observed to govern the degree of non-affine response, stiffness, and strain localization, suggesting that controlling the degree of anisotropy and fiber curl offers the possibility to design networks for specific stiffness and specific strength.
“The influence of microstructure on the tensile properties of a creped tissue paper: Modeling and experiments”, Shubham Agarwal, Prabhat Srivastava, Sheldon I. Green & A. Srikantha Phani, Mechanics of Materials, Vol.176, January 2023, 104505. Low density tissue papers are soft fiber networks with a folded internal microstructure deliberately imparted during a widely used manufacturing process, called dry creping. The folded crepe structure enhances a tissue paper’s specific volume, stretchability, and softness. The influence of the micron-scale crepe structure on nonlinear tensile response is studied using experiments and a discrete elasto-plastic model (DEM). First, ‘Crepe Index (CI)’ is defined to quantify the crepe structure. An optical method to obtain high resolution edge images is developed to measure the CI. The relationship between the CI and tensile failure strain and initial elastic stiffness is assessed: the failure strain is observed to be proportional to CI, while the dependence of initial stiffness on CI is unclear–presumably due to the damage induced through the de-densification of fiber layers during the manufacturing. The effect of CI on initial stiffness and failure strain is assessed using DEM by idealizing the creped paper as a segmented triangular wave each segment governed by a bilinear elastoplastic constitutive law and a strength-based failure criterion. The model reveals that the initial stiffness of a creped sheet depends not only on the CI but also on sheet-thickness to crepe-wavelength ratio, and the stiffness of the uncreped sheet. The failure strain is found to be stretching dominated at low CI, and bending dominated at higher CI. Qualitative agreement is found between the DEM and experiments. The significance of both the material and the geometric non-linearity on the macroscale tensile response of a creped tissue paper emerges from this study.
“Creping technology and its factors for tissue paper production: a review”, Tong Qin, Liqin Liu, Haibing Cao, Shuangxi Nie, Bin Lu, Zhengbai Cheng, Hongbin Liu & Xingye An, European Journal of Wood and Wood Products , 2023, online. Tissue products such as facial tissue and paper towels have been playing a crucial role in promoting hygiene and maintaining good health, since they are commonly available and widely used nowadays. The production of low-density tissue paper typically involves a key creping process that contains pressing and adhering the wet web onto a high-speed Yankee cylinder, followed by releasing the creped sheet with a stationary creping blade to form periodic micro-folds within the tissue structure. This paper discusses and reviews the mechanisms of tissue creping technology, as well as the factors that impact the creping process and tissue properties. These factors primarily include the dryness of the tissue web, creping rate, properties of the pulp raw material, Yankee coating, crepe doctor blade, and tissue drying machines. It is indicated that the creping process, as a multifaceted and integrated treatment for tissue production, can be significantly enhanced through the concerted efforts of the aforementioned factors to achieve greater creping efficiency. However, further endeavors are necessary to address the constraints stemming from the
pilot experimental equipment and data, as well as modeling simulation, to enable a more comprehensive examination of the creping process and its mechanism. This review offers a practical overview and comprehensive understanding of the creping technology and its underlying factors for tissue production.
“Easily-manufactured paper-based materials with high porosity for adsorption/separation applications in complex wastewater”, Shan Jiang, Jianfeng Xi, Hongpi Dai, Huining Xiao & Weibing Wu, Frontiers of Chemical Science and Engineering, 2023, online. A multi-functional porous paper-based material was prepared from grass pulp by simple pore-forming and green cross-linking method. As a pore-forming agent, calcium citrate increased the porosity of the paper-based material from 30% to 69% while retaining the mechanical strength. The covalent cross-linking of citric acid between cellulose fibers improved both the wet strength and adsorption capacity. In addition, owing to the introduction of high-content carboxyl groups as well as the construction of hierarchical micro-nano structure, the underwater oil contact angle was up to 165°. The separation efficiency of the emulsified oil was 99.3%, and the water flux was up to 2020 L·m−2·h−1. The theoretical maximum adsorption capacities of cadmium ion, lead ion and methylene blue reached 136, 229 and 128.9 mg·g−1, respectively. The continuous purification of complex wastewater can be achieved by using paper-based materials combined with filtration technology. This work provides a simple, low cost and environmental approach for the treatment of complex wastewater containing insoluble oil, organic dyes, and heavy metal ions.
“A hybrid mathematical model for international target market decision: the case of fibreboard industry”, Murat Yeşilkaya & Yıldız Çabuk, Wood Material Science & Engineering, 2023, online. Determining the target market constitutes one of the most important strategic decisions. During the target market selection, many factors need to be considered and evaluated systematically and the most accurate choice is required to be made. In this study, the target country market selection is made for the fibreboard industry, which is one of the main sectors of the forest products industry in Turkey. For this purpose, multi-criteria decision-making (MCDM) methods, which are considered the most appropriate decision-making techniques among alternatives with many criteria, are utilised. AHP, VIKOR and TOPSIS methods are used to identify the most appropriate target market. Furthermore, a hybrid mathematical model including goal programming is proposed. And to handle ambiguity and fuzziness in international market decisions, a fuzzy goal programming model is developed. Economic, risk, supply chain and sectoral strategies are determined as the main criteria. 29 target countries are identified by including the countries ranking first in the exports of Turkey in the sector and the target countries determined by Ministry of Development. Target countries are ranked with MCDM. The rankings of the solution are compared via correlation tests. The first 10 countries are selected for the target market by employing the proposed models.
“Increasing fire retardancy of natural wood fibre board with colloidal silica -based geopolymer”, Jingson Luo, Nanyang Technological University, Singapore, 2023, https://hdl.handle.net/10356/166806. Natural fibre contains cellulose, lignin, and hemicellulose, which makes it a highly flammable material. It is easily burned to decomposition and transformed into black charcoal with an average ignition temperature of around 300 [1]. However, natural fibre is widely used in architecture by adding it into brittle concrete or polymer matrix due to the durability, sustainability, and increasing
strength of fibre material [2]. Therefore, how to increase the fire retardancy of natural fibrebased material has been a challenge for engineers. Contributions such as attaching common fire retardant materials like Mg(OH) 2 and fly ash had been researched. Geopolymer acts like inorganic polymer with non-carbon element, mainly silica-based network structure, which provides excellent mechanical properties, and high compressive strength up to 100 MPa [3]. Meanwhile, the geopolymer shows high fire retardancy compared with polymers. Thus, geopolymer like concretes have dominated the construction material with its expected characteristics. All above, an optimized system consisting of natural fibre and silica geopolymer was developed by adding 40% colloidal silica solution with Potassium hydroxide into natural fibre board as matrix. This system aims on increasing the fire retardancy of the board by attaching the matrix onto the fibre providing a protection layer. By adjusting the silica versus potassium ratio, the effect of fire retardancy changed. Comparing different systems with several fire property tests; the most appropriate concentration was found.
“MDF Recycling: Recovering fibres from fibreboards for further material utilisation with a focus on the chemical and morphological alteration of the recovered fibres”, Fahriye Yağmur Bütün Buschalsky, Georg -August-Universitat, Goettingen, PhD thesis, 2023. The present research was performed within the scopes of the DFG Research Training Group 1703 “Resource Efficiency in Interorganizational Networks” and AiF Project GmbH (project No. 16KN065229), which aims at developing a new fibreboard recycling technique based on thermo-hydrolytic disintegration by focusing on the further material usage of the waste fibreboards while preserving the fibrous morphology of the wood element and increasing the added-value compared to combustion (energy recovery). The results have been gathered in total as six manuscripts for being published or are submitted for publishing elsewhere. Medium density fibreboard (MDF) is uniform, dense, smooth, and free of knots and grain patterns, and is an excellent substitute for solid wood in many applications. As the name suggests, the MDF has density range between 500 to 800 kg m-3 and is manufactured by hot-press consolidation with a thermo-setting adhesive resulting in an entire inter-fibre bonding of the fine lignocellulosic fibres. MDF is the second most important wood-based panel (WBP) after particleboard, henc e, the global MDF production has reached above 90 million m3 in 2017 and 2018. MDF tends to be used in indoor applications such as furniture, laminate flooring and panelling. It is estimated that nearly 50 million m3 of waste MDF was generated across the world in 2016 alone. Alternative approaches for the disposal of this waste are missing and need to be considered, such as recycling the waste into further value-added uses. However, a commercially viable method for MDF recycling has not been found yet. Additionally, energy recovery (combustion for energy production) is not an option in many EU countries, due to the lack of sufficient incinerator capacity for burning waste MDF. Therefore, large volumes of MDF must have accumulated across Europe. Furthermore, introducing the recovered fibres back into the MDF manufacturing as a raw material requires careful control to avoid upsetting the process or affecting the board quality. In order to preserve the fibrous morphology of the recovered lignocellulosic fibre material, while releasing the fibres from the thermosetting resin matrix, the thermo-hydrolytic disintegration process would be the best option. Thus, in this thesis, the thermo-hydrolytic disintegration process has been chosen as the main technique for recovering the wood fibres from waste fibreboards. As a result of this disintegration process, recovered fibres (RF) and disintegration water (DW) were obtained. Obtained recovered fibres, when compared to virgin fibres (VF), were found to be shortened which could be attributed to the disintegration conditions and have altered chemical properties resulting in higher pH and formaldehyde emissions due to the remaining resin. Moreover, RF were further utilized for
manufacturing either new MDF panels or wood polymer composites (WPC). When utilized for manufacturing new MDF, even the utilisation of 100 % RF did not cause significantly lower strength properties than that of panels made of 100 % VF. However, introducing the screw press process for drying the RF after the disintegration caused decreased strength properties compared to the original MDF panels containing VF. Although, mixing screwpressed and air-dried RF with VF improved these properties, the strength of the panels containing solely VF were not achieved. Furthermore, WPC formulations containing RF exhibited improved mechanical and water-related properties, even though they provided similar physico-mechanical results to those containing VF. The study has also shown that obtained DW exhibited higher pH values, N as well as formaldehy de contents while containing significant levels of reducing sugar and equivalents when compared to demineralized water. The findings of this dissertation not only make several scientific contributions to the current literature, but also suggest utilizing RF obtained after the thermo-hydrolytic disintegration of waste MDF for manufacturing new MDF and WPC to ensure a more efficient utilization of these wood resources. Further research might be carried out to explore how different mixing proportions of RF and VF effect the strength properties of these possible utilisation areas, especially new MDF.