

PAPERmaking!
The e-magazine for the Fibrous Forest Products Sector


Produced by: The Paper Industry Technical Association
Publishers of: Paper Technology International®
PAPERmaking!


FROM THE PUBLISHERS OF PAPER TECHNOLOGY INTERNATIONAL® Volume10, Number2, 2024
CONTENTS:

FEATURE ARTICLES:
1. Paperboard: Relating papermaking process parameters to paperboard properties.
2. Tissue: Simulation of sheet moulding during TAD processing
3. Chemistry: ASA for better sizing – a review
4. Environment: CO2 emissions accounting of Chinese paper industry.
5. Water Treatment: Quality evaluation of water disclosure of Chinese paper mills
6. Sustainabililty: Recycling various papermaking wastes as eco-friendly slurry.
7. Wood Panel: Antibacterial Medium-Density Fibreboard (MDF) production.
8. Packaging: Barrier coating and tray forming of paperboard
9. Social Media: Using X (Twitter) for business.
10.Eye Health: Easy steps to keep your eyes healthy
11.Sitting Posture: Tips for improving posture at your computer desk.
12.AI in the Office: Possible uses of AI to improve the office environment.
SUPPLIERS NEWS SECTION:
News / Products / Services:
• Section 1 – PITA CORPORATE MEMBERS AFT / ARCHROMA / VALMET
• Section 2 – PITA NON-CORPORATE MEMBERS ANDRITZ / VOITH
• Section 3 – NON-PITA SUPPLIER MEMBERS KADANT / KONECRANES / SICK
Advertisers: ABB
DATA COMPILATION:
Events: PITA Courses & International Conferences / Exhibitions
Installations: Overview of equipment orders and installations between Feb and June
Research Articles: Recent peer-reviewed articles from the technical paper press
Technical Abstracts: Recent peer-reviewed articles from the general scientific press
The Paper Industry Technical Association (PITA) is an independent organisation which operates for the general benefit of its members – both individual and corporate – dedicated to promoting and improving the technical and scientific knowledge of those working in the UK pulp and paper industry. Formed in 1960, it serves the Industry, both manufacturers and suppliers, by providing a forum for members to meet and network; it organises visits, conferences and training seminars that cover all aspects of papermaking science. It also publishes the prestigious journal Paper Technology International® and the PITA Annual Review, both sent free to members, and a range of other technical publications which include conference proceedings and the acclaimed Essential Guide to Aqueous Coating.
1 of 1
PAPERmaking!
FROM THE PUBLISHERS OF PAPER TECHNOLOGY INTERNATIONAL®
Volume10, Number2, 2024
Relating papermaking process parameters to properties of paperboard with special attention to through‑ thickness design
MIKAEL NYGÅRDS1,2
A biaxial stress state has been proposed to formulate a failure criterion for paperboard during bending. About 100 paperboards have been splitted, such that top, middle, and bottom plies have been free-laid and tested in the machine direction, cross-machine direction as well as in out-of-plane direction (ZD). The purpose was to determine the failure stresses and its dependency of papermaking parameters: density, degree of orientation, and fiber length for each layer. A linear model to predict the geometrical strength of a plies was suggested. Analytically simulations of different paperboard structures behavior during bending were performed. The density of the middle ply affected the location of the failure position in ZD, as well as the maximum bending moment. The impact of orientation and degree of anisotropy was simulated, which can be used to optimize the ZD property gradient by tweaking the properties, and hence optimize paperboard performance.
Contact information:
1 BillerudKorsnäs, 801 81 Gävle, Sweden
2 Solid Mechanics, Department of Engineering Mechanics, KTH, 100 44 Stockholm, Sweden
MRS Advances (2022) 7:789–798 https://doi.org/10.1557/s43580-022-00282-7
Creative Commons Attribution 4.0 International License
The Paper Industry Technical Association (PITA) is an independent organisation which operates for the general benefit of its members – both individual and corporate – dedicated to promoting and improving the technical and scientific knowledge of those working in the UK pulp and paper industry. Formed in 1960, it serves the Industry, both manufacturers and suppliers, by providing a forum for members to meet and network; it organises visits, conferences and training seminars that cover all aspects of papermaking science. It also publishes the prestigious journal Paper Technology International® and the PITA Annual Review, both sent free to members, and a range of other technical publications which include conference proceedings and the acclaimed Essential Guide to Aqueous Coating.
MRS Advances (2022) 7:789–798
https://doi.org/10.1557/s43580-022-00282-7

Relating papermaking process parameters to properties of paperboard with special attention to through‑thickness design
Mikael Nygårds1,2
Received: 23 March 2022 / Accepted: 26 April 2022 / Published online: 6 May 2022
© The Author(s) 2022
Abstract
A biaxial stress state has been proposed to formulate a failure criterion for paperboard during bending. About 100 paperboards have been splitted, such that top, middle, and bottom plies have been free-laid and tested in the machine direction, cross-machine direction as well as in out-of-plane direction (ZD). The purpose was to determine the failure stresses and its dependency of papermaking parameters: density, degree of orientation, and fber length for each layer. A linear model to predict the geometrical strength of a plies was suggested. Analytically simulations of diferent paperboard structures behavior during bending were performed. The density of the middle ply afected the location of the failure position in ZD, as well as the maximum bending moment. The impact of orientation and degree of anisotropy was simulated, which can be used to optimize the ZD property gradient by tweaking the properties, and hence optimize paperboard performance.
Introduction
In the papermaking process, fbers with diferent fber length are mixed into a pulp. In the process, it is possible to steer a paperboard machine to control the density by refning and by chemical additives in diferent plies in a paperboard. It is also possible to steer the orientation of the fber by controlling the headbox outlet speed in relation to the moving web. Hence, by utilizing papermaking parameters paperboards can be engineered to have diferent properties in the plies of a multiply paperboard.
The product paperboard is characterized with respect to its bending stifness, thickness, or grammage. To optimize these properties and the paperboard functionality the through-thickness (ZD) profle can be engineered. The straightforward path to optimize the bending stifness would be to make a paperboard with and I-beam structure. However, when a paperboard is folded an I-beam structure might not be optimal to comply with the stress state that arise. One complicating factor is that the in-plane tensile and compression behavior is diferent for paperboard [1]. Depending on
* Mikael Nygårds Mikael.nygards@billerudkorsnas.com
1 BillerudKorsnäs, 801 81 Gävle, Sweden
2 Solid Mechanics, Department of Engineering Mechanics, KTH, 100 44 Stockholm, Sweden
how the ZD profle is engineered diferent failure mechanisms can be activated when a paperboard is folded.
Before a paperboard becomes a package, it needs to be converted; creasing is used to score the paperboard such that it will fold along pre-defned lines [2]. For optimal converting behavior it is important to control where the intentional damage created during creasing develops. This put additional requirements on the paperboard design that can be considered for optimal folding performance.
The key element to design paperboard properties in the ZD is to utilize multiply board structures, such that at least three plies can have diferent properties. To evaluate how the efect of the papermaking process in each ply, it is necessary to freelay the plies and perform testing, where the intention is to isolate the constituent plies, and test each of them separately. While multiply paperboard has been available for a long time, efective and rigorous methods to free-lay (or isolate) the plies have not been available until recently. Initially surface grinding was used [3], and the technique has also successfully been used to determine properties of top, middle, and bottom plies [4–7]. The technique works to determine properties, but is dependent on good calibration of the machinery, and is very time consuming. A more time efcient machine has been developed by Fortuna Gmbh [8], where a rotating knife is placed after a nip. With this technique top, middle, and bottom plies can be free-laid in a very time efcient procedure. The machine has also been used to characterize properties of plies [9–11].
The aim of this work would be to implement analytical models that can be used to predict the performance of paperboards. It will be based on how it is constructed in the thickness direction using the properties of three plies in the paperboard structures. This will be done by utilizing laminate theory Fellers and Carlsson [12] and Fellers [13], and Timoshenko beam bending [14] to construct a model that can predict the maximal bending moment for paperboards based on papermaking variables such as density, fber orientation, and fber length.
Theoretical background
In the analysis, we will assume that in-plane tensile and outof-plane shear stresses will contribute to failure during folding. With laminate theory, it is possible to calculate how a multilayer structure respond to external forces, which helps us to develop a ZD structure with accurate bending stifness.
Elastic bending
Bending stifness of paperboard is normally measured by twopoint bending, when the bending arm is L = 50 mm [15]. With this confguration the shear stress component is negligible. Bending of a homogenous cantilever beam with a rectangular cross section will be performed with a bending moment Mb per unit width. A tensile stress will arise on the convex side of the beam, and compressive stresses on the concave side.
The theoretical framework for evaluation of the bending stifness for multiply paperboards have been derived by Fellers and Carlsson [12] and Fellers [13]. By using the defnition of bending moment, integrating the elastic stress in the beam and by utilizing strain compatibility the bending moment for a homogenous beam with thickness, t, and rectangular cross section the bending moment becomes
If the angle, θ, is measured in degrees the bending stifness is given by
In the two-point bending setup, one end of the paperboard is clamped, and the other end is loaded by a concentrated load. The bending moment then decreases linearly as the distance x from the clamped end increase. If small deformations are assumed during the bending stifness measurements, then the maximum defection δ becomes
The two-point bending is commonly used as a quality control in industry. Then w = 38 mm wide samples are bent, and L = 50 mm is used. For this test, the force, PSb, that is read on the testing device is often interpreted as the bending moment of the paperboard
Multi-ply paperboards consist of several plies, which can represent layers in a laminate. With a multi-ply model, it would be possible to calculate the bending stifness. The model can be used to make predictions, and hence extend the design space for multi-ply paperboards. The ability to make calculations is benefcial for optimization, since it can give an indication of the choice of raw material, grammage, and ply layout. For multi-ply paperboard the same strategy as for homogenous plies are applied. However, it needs to be accounted for that the plies are not located along the neutral line. Then bending stifness for a multi-ply structure can then be expressed as where
Then bending stifness which is evaluated as the steepest slope of a F − δ plot, becomes
where Ek is the elastic modulus of ply k, which might be in either MD or CD. The ply coordinates zk (Fig. 9) (k = 0, 1, 2, …., N) where N is the number of plies, are calculated as
where t is the total thickness of the paperboard. The bending stifness is dependent of the thickness and grammage of the diferent plies.
Relating papermaking process parameters to properties of paperboard with special attention…
Maximum bending moment during folding
Two-point bending, or a cantilever confguration is often used to measure the bending stifness of paper and paperboard. Folding of a paperboard will give an initial linear response associated with the bending stifness. Thereafter, a peak bending moment will be reached, which is followed by a non-linear response as the paperboard is folded 90°.
To evaluate bending stiffness the standard span is L = 50 mm. This ensures that the shear component during folding is small. On the other hand, a span of only L = 10 mm is used when folding both uncreased and creased paperboards. To analyze the stress state in the paperboard during folding a Timoshenko beam analysis [14] can be applied to uncreased paperboard samples, see further Nygårds [16]. The stress state then consists of two components, an in-plane tensile/compressive stress, σx, and an out-of-plane shear stress, τxz, which is expressed as
stress state. Here the diference is however smaller than a factor 2 in density, hence the efect should be neglectable compared to other assumptions. It also has a large dependency of thickness. In thick paperboard, and paperboards with low τ f or high σ f the shear stress component will become larger than the normal stress component. This means that it will contribute to failure, basically the paperboard will shear and cause failure. L = 10 m is an idealized lab setting, bending of paperboards can occur, with shorter bending arm, L, the shear component will be even more important. The conclusion from this is that the out-of-plane shear properties afect the folding behavior for paperboard grades, yet it can be disregarded for nonpaper materials.
Because of the biaxial stress state, a failure criterion needs to be formulated. The idea here is to keep it simple to enable predictions of failure. It should also cover the simple mechanisms that have been observed, which are:
• Normalized stress components should be used.
• If the normal stress is positive, shearing will be more difcult since the fbers are stretched.
and where t is the sample thickness, w the width, and z the distance from the neutral line of the specimen. For most materials, the shear component will be small, and can be neglected. However, due to the orthotropy in paper materials, where the in-plane stifness and strength are much greater than the out-of-plane stifness and strength, the shear component will impact the behavior. For this purpose, it will be of interest to evaluate the stress components in relation to its measured failure stresses, σ f and τf, accordingly
• If the normal stress is negative, shearing will be easier since the paperboard ply can buckle.
• For simplicity no mixed terms are accounted for.
Using the assumptions above it was assumed that
where σf(z) and τf(z) are the failure stresses that are diferent in the diferent plies. Out-of-plane shear strength is needed to evaluate the folding behavior. Normally out-of-plane shear strength can be associated with breaking of bonds within the sheets. In the literature out-of-plane shear properties are often lacking. Instead, ZD strength is most often measured strength value. A fair approximation base on the work by Stenberg et al. [17] is
and In the analysis, it was assumed that the failure stress is homogenous in the thickness direction, hence the paperboard does not have a property gradient. This is an obvious simplifcation in the case of multiply paperboard, which will not have a homogeneous stress distribution in the thickness direction. It shows that within the normal limit of failure properties there is shift of dominating stress component. However, it should also be emphasized that if there is large diference in properties of the outer plies and the middle ply, this will also afect the parabolic shear
Hence, the failure criterion can be express as
The failure criterion has been plotted in Fig. 1 for some diferent combinations of uniform failure stresses σ f and 𝜎 f ZD . This show that as 𝜎 f ZD decreases the failure mechanism is changing from in-plane tension/compression, i.e., failure close to the outer surfaces, that is dominated by the network structure to out-of-plane shear, i.e., failure within the paperboard, that is dominated by bond strength.
Fig. 1 The failure criterion plotted for a 400 μm paperboard with diferent normal and shear failure stresses. In bending the paperboards will fail in the z-position, where the normalized stress is maximal

Results
Properties of free‑laid plies
Paperboards from a series of trial productions have been splitted (Fortuna [8] to free-lay the top, middle, and bottom plies. About 100 paperboards with various properties was used in the study. The paperboards were selected to have variation in the diferent plies to represent the limits with respect to density, fber orientation etc. within each layer. The plies have been characterized with respect to physical properties and tensile tests to measure density, degree of anisotropy, strength, and stifness within each layer. The in-plane tensile properties were measured using ISO 1924-2, while the ZD tensile test was measured using ISO 15754. Normally the variation of strength is about 10% when whole paperboard is tested, which is due to the inhomogeneous fber structure that can have density variations. When free-laid plies are tested, the strength variation is about the same. However, the splitting procedure is also a source of variation, since thickness of the free-laid plies can vary between splits. The aim here has been to try to position the splitting position to the middle of the interface. However, the interface has a thickness of 10–20 mm, hence some fbers from the neighboring ply will still be found on the free-laid ply. The variation of strength properties would then be about 10% and is the main reason to the variations seen in Figs. 2, 3, 4, 5. The data will be used to formulate simplifed models that can be used to make qualitative analytical predictions, in these we will not consider variation at this time. Of interest will be to identify the importance of papermaking parameters
such as density, fber orientation, and fber length to predict strength and stifness.
Since paperboard is orthotropic the geometrical mean strength is often calculated from the strength in the machine direction (MD) and cross-machine direction (CD) [18],
In this work several paperboards have been tested, a diferent feature between the paperboards was the fber orientation. From tensile testing of paperboards with diferent fber orientation it was established that as the MD/CD strength ratio varied; in fact, the tensile strengths in MD and CD were invariant, see Fig. 2, where the top, middle, bottom plies have the same behavior as the whole paperboard.
The strength of a paperboard in arbitrary direction was expressed as
where A is the degree of anisotropy, which by rearranging Eq. (19) the strengths in MD and CD can be expressed as
MD forCD,where
CD < 1 ,
where σ0 is the strength of an isotropic sheet, at
b CD = 1. At this stage it can be concluded that the Eqs. (20–21) can be (19)
Relating papermaking process parameters to properties of paperboard with special attention…
2 Tensile strength as function degree of anisotropy for the whole paperboard and the free-laid plies
of anisotropy, A
3 Strength of free-laid plies as function of density
4 The geometrical mean in MD and CD elastic modulus normalized with fber length show a liner relation with density
used to make fair approximations about the fber orientation efect on the plies.
The density of the paperboard plies as well as the fber length will afect the strength properties. If the strength σ0
was plotted versus density one can see that the strengths of the three plies became grouped into diferent clusters. The diference could be explained by the diference in fber length of the fbers used in the diferent plies. Here, we
Fig.
Degree
Fig.
Fig.
assume that the following average fber lengths apply to the diferent plies:
• Bottom ply Lfiber = 2.0 mm,
• Middle ply Lfiber = 1.3 mm,
• Top ply Lfiber = 1.5 mm.
This is essentially a curve-ftting of the data, but it has a physical relevance. The bottom plies were made of softwood fbers, the top plies had diferent mixtures of hardwood and softwood fbers, while the middle plies had mixtures of softwood, hardwood, broke, and CTMP. All these measurements were also in agreement with measurement of average fber length for headbox pulp samples. However, due to the large number of paperboards tested, there are samples the deviate from these fber lengths. Then one gets the plot in Fig. 3, where the ration σ0/Lfber has been plotted for three plies. In Fig. 3 it was obvious that the density and σ0/Lfber were different for the diferent plies. By doing a linear regression it became evident that the failure stress, 𝜎0 , of the ply data in Fig. 3 can be simplifed into a simple equation
The aim of plotting the tensile properties of the free-laid plies was to fnd relations to diferent parameters that easily can be controlled during machine trials. This was identifed to be density, fber length, and fber orientation (here expressed as a function of the MD/CD strength ratio). Based on this, simple expression was found that can be implemented in the derived stress state during folding. Here we found that the tensile strength can be expressed as:
Normally the tensile strength and tensile stifness is correlated in paper materials. In Fig. 4, it should be noted
that the ratio tensile stifness/fber length also has almost a linear correlation with density for the free-lied plies. There is a deviation for the top ply at high densities. This should be due to the long fber length that cause greater entanglement between the fbers, and lead to fber failure rather than bond failure where the fbers are torn out of the fber network. To make a simple model of stifness in relation to strength it can be assumed that
Typically, ZD tensile tests are performed on the whole paperboard. This is since testing on free-laid middle plies can show smaller ZD strength values, because damage can be initiated during the splitting operation. Therefore, we will present ZD strength tested on whole paperboard, but it will be presented against the middle ply density, since this is most physically relevant since the ZD tensile failures occurs in the middle ply. In Fig. 5, the ZD strength density can be seen, and a linear trend can be observed, yet there is variation. A linear trend would be expected since ZD tensile strength correlates with the number of bonds in the fber network. Formations efects that give local variation of density, as well of ply strength in relation to interface strength will, however, contribute to the observed variation. For the modeling purpose it will however be relevant to assume that denser middle plies give higher ZD strength, that based on the data in Fig. 5 can be assumed to follow
Based on properties of the free-laid sheets it has been possible to develop models that express the failure stresses as function of the papermaking parameters: density, fber orientation, and fber length, which are parameters that can be altered during the papermaking process. The derived
Fig.
Relating papermaking process parameters to properties of paperboard with special attention…
models are now inserted in the failure envelope (Eq. 18), hence Or expressed in MD and CD
of anisotropy, A = 1 in all plies. In the simulations the efect of diferent grammage in the plies was investigated, and the impact of density of the middle ply as well as fber length in the middle ply. When the density of the middle ply is low the paperboard thickness is high (Fig. 6).
Modeling of bending of paperboard structures
Paperboard structures do not have uniform through-thickness (ZD) profles, instead the idea is to have a ZD- profle to optimize performance. In papermaking one can easily change the density, fber length, and orientation of each ply, which was also observed in Figs. 2, 3, 4. Based on this information some artifcial paperboard structures will be constructed to visualize potential problems that can arise during bending. For this purpose, the laminate theory and bending analysis equations were implemented in an Excel sheet. To show how the concept works, the laminate theory was frst used to optimize the bending stifness of an artifcial symmetric paperboard with grammage 250 g/m2, degree
When Lfber = 1.0 mm was used, a rather weak middle ply was simulated; a local maximum was found, where the bending stifness can be optimized with respect to grammage in the outer plies. The simulations showed that the maximum bending stifness have about 25–30% of the grammage in the outer plies. However, simulations with Lfber = 2.0 mm, which represent a middle ply with high elastic modulus. For this case, it was observed that the middle ply contributes considerably to the bending stifness of the paperboard, and therefore the bending stifness increase with increasing grammage in the middle plies. Hence, the efect of the increased thickness due to more grammage in the middle ply was larger than the efect of separating the denser outer plies. This was an interesting observation since many paperboard products are within the property range used. It is hence not necessarily true that maximum bending stifness is achieved with 30% outer plies.
The bending stifness analysis showed that the bending stifness can be optimized by altering the grammages of outer plies, and the maximum ratio between bending stifness and grammage of the paperboard can be found. However, there are also other parameters that depend on the grammage of the outer plies, such as printing and surface properties. Therefore, other parameters than bending stifness also contribute to optimal paperboard performance. For the upcoming simulation of paperboard folding, we have

Fig. 6 Optimization of bending stifness simulating paperboards with diferent densities in the middle ply, as well as diferent fber lengths Lfber = 1 mm (solid lines) corresponding to EMP = 900 MPa and Lfber = 2 mm (dotted lines) corresponding to EMP = 1800 MPa
constructed a paperboard, where data was taken from Fig. 3 This is a asymmetric paperboard with diferent densities 600, 500, and 750 kg/m3 for the bottom, middle, and top plies, respectively, and fber lengths 2, 1.3, and 1.5 mm in the plies. The grammages (83, 250, and 50 g/m2) were chosen such that the paperboard thickness became h = 400 μm and based on the properties of the plies the failure stress during bending was estimated and put into the stress state Eqs. (14–15). With the chosen material parameters, the normal stress is still dominating, but it should be seen that the largest normalized stress can be found in the middle ply, close to the interfaces. This indicates that tensile failure can occur in the middle ply before it can be seen in the outer plies. The normalized shear stress was smaller than the normal stress, but it was not neglectable. This can be seen when the proposed failure criterion was plotted (Fig. 7) it was noted that the fmax is located along the bottom interface, where we hence expect failure to occur when the maximum bending moment has been reached. If a higher bending moment is desired for the paperboard, then the highest prioritization should be to increase the strength of the bottom interface, thereafter the top interface should be strengthened.
The fact that the failure criterion f is largest in the middle ply suggest that the failure will occur there during bending, and that modifcations of the middle ply will alter the value and position of the failure criterion. In paperboard making, it is common to work with the middle ply to alter the properties of the paperboard. If the density of
the middle ply is changed the in-plane and ZD strength of the middle ply will change, which will alter the failure criterion. In Fig. 8, the middle ply density has been varied from 250 to 750 kg/m3. It should be noted when the density is around 500 kg/m3 the failure criterion is roughly the same in the middle ply and the outer plies with this parameter set. This must be optimal; the middle ply has then been made bulkier without compromising the maximum bending moment. As the density is decreased the risk of failure in the middle ply increases, which will also lower the maximum bending moment. And when the middle ply is denser the largest risk of failure is within the outer plies and dominated by the normal component.
In the previous plots (Figs. 7, 8) the failure criterion has been shown for A = 1, i.e., when the paperboard is in-plane isotropic. At a paperboard machine more fbers are often oriented in MD. This will alter the shape of the failure criterion. In fact, the orientation of diferent plies can be altered to minimize the risk of failure, and hence increase the maximum bending moment. If the orientation of the outer plies varies from A = 1 to A = 2 one can see that it is the CD direction that will have the largest risk of failure, see Fig. 9. This is since the failure stress in MD will increase more when the fbers are oriented in MD. In Fig. 9, it can also be seen that a similar efect occurs when the orientation of the middle ply is changed, the risk of failure during folding increase with increased MD orientation.

Fig. 7 Failure criterion based on the unsymmetrical paperboard that was constructed

Discussion and conclusion
The development of analytical models can help us to better understand how paperboards behave under diferent loading conditions. One alternative approach would be to develop fnite element models to do the same kind of analysis. Both methods have their respective advantages and drawbacks. The main advantage with the model presented
here is that it quickly can correlate papermaking parameters to potential risks and do simple parameter studies; this by utilizing Excel.
Splitting and free laying of the top, middle, and bottom plies of paperboards that had been produced during diferent trial gave us a good database to develop phenomenological models of strength that was dependent on density, degree of anisotropy, and fber length. Typical values from this data set were used to perform simulation of folding of paperboard.

Fig. 8 Efect on the failure envelope of having diferent density in the middle ply
Fig. 9 Efect on the failure envelope of orientation: (left) bottom and top plies, (right) middle ply
It was evident the greatest risk for failure often was within the middle ply. Moreover, if the density is lowered, the risk of failure due to insufcient middle ply density increases. Hence by having good control of the densities in the diferent plies it would be possible to balance where the weakest point in the through-thickness direction should be located, and how much stronger the outer plies need to be for optimal performance. Hence, it is not the strength of the individual ply that is important, it is the relation to the other plies that gives optimal performance.
While it could be concluded that an efficient way to increase the bending stiffness of a paperboard was to decrease the density of the middle ply. When the density is decreased from 500 to 400 kg/m3 the bending stifness increase about 50%. However, the analysis also show that this will result in a 20% drop in ZD strength. The drop in ZD strength will also afect the maximum bending moment that the paperboard can carry, which in turn will afect the box compression. Hence, lightweight will reduce quality of the paperboard, which is not acceptable.
An alternative approach is then to work with the strength profle in the through-thickness direction. Instead, it would be possible to work with the density gradient in the paperboard, which can be controlled by drainage of the paperboard during production. The analysis done here showed that it would be advantageous to increase the strength of the lower part of the middle ply to increase the maximum bending moment of the paperboard. In addition, the orientation of the diferent plies can be utilized to optimize the paperboard performance; the plies can be oriented more or less in the MD to minimize the largest stresses that arise in the through-thickness direction.
Acknowledgements The work has been fnanced by internal resources from BillerudKorsnäs, for which the author is grateful. BillerudKorsnäs acknowledge the possibility ofered to publish results within the scientifc community.
Funding Open access funding provided by Royal Institute of Technology.
Data availability This manuscript has no additional data available.
Declarations
Conflict of interest There are not potential conficts of interest behind the work presented here.
Open Access This article is licensed under a Creative Commons Attribution 4.0 International License, which permits use, sharing, adaptation, distribution and reproduction in any medium or format, as long as you give appropriate credit to the original author(s) and the source, provide a link to the Creative Commons licence, and indicate if changes
were made. The images or other third party material in this article are included in the article’s Creative Commons licence, unless indicated otherwise in a credit line to the material. If material is not included in the article’s Creative Commons licence and your intended use is not permitted by statutory regulation or exceeds the permitted use, you will need to obtain permission directly from the copyright holder. To view a copy of this licence, visit http://creativecommons.org/licenses/by/4.0/
References
1. M. Nygårds, J. Sundström, Comparison and analysis of in-plane compression and bending failure in paperboard. Nord. Pulp Pap. Res. J. 31(3), 432–440 (2016)
2. D.W. Coffin, M. Nygårds, Creasing and folding, Advances in Paper Science and Technology: Trans. 16th Fundamental Research Symposium (2018)
3. M. Östlund, S. Östlund, C. Fellers, Experimental determination of residual stresses in paperboard. Exp. Mech. 45, 493–497 (2005)
4. M. Nygårds, Experimental techniques for characterization of elasticplastic material properties in paperboard. Nord. Pulp Pap. Res. J. 23(4) (2008)
5. A. Hagman, M. Nygårds, Short compression testing of multi-ply paperboard, infuence from shear strength. Nord. Pulp Pap. Res. J. 31(1), 123–134 (2016)
6. H. Huang, M. Nygårds, A simplifed material model for fnite element analysis of paperboard creasing. Nord. Pulp Pap. Res. J. 25(4), 502–509 (2010)
7. H. Huang, M. Nygårds, Numerical and experimental investigation of paperboard folding. Nord. Pulp Pap. Res. J. 26(4), 452–467 (2011)
8. Fortuna GmbH, Splitting Machine AB 320 P, Fortuna GmbH, Eisenbahnstraße 15, D-71263 Weil der Stadt (2004)
9. G. Marin, In-plane fracture of paperboard, Master thesis, KTH Royal Institute of Technology, Solid Mechanics, Stockholm (2014)
10. J. Tryding, G. Marin, M. Nygårds, P. Mäkelä, G. Ferrari, Experimental and theoretical analysis of in-plane cohesive testing of paperboard. Int. J. Damage Mech. 26(6), 895–918 (2016)
11. A.N. Giashi, T. Gereke, T. Mbarek, C. Cherif, Novel dynamic test methods for paperboard composite structures. Exp. Tech. (2021). https://doi.org/10.1007/s40799-021-00496-8
12. Fellers, Carlsson, Bending stifness, with special reference to paperboard. In: Handbook of Physical Testing of Paper, Vol 1, Chapter 5: 233–256 (1983)
13. C. Fellers, Laminate theory for papermakers, in Paper Products Physics and Technology (Walter de Gruyter, 2009), pp. 287–314
14. S. Timoshenko, Theory of Elasticity. Engineering Societies Monographs, ed. by H. W. Craver (McGraw-Hill, New York, 1934)
15. ISO 2493-2, Paper and board—determination of bending resistance—part 2: Taber-type tester, Technical Committee: ISO/TC 6/ SC 2 (2011)
16. M. Nygårds, Behavior of corners in carton board boxes, in Mechanics of Paper Products, 2nd edn. ed. by S. Östlund (Walter de Gruyer GmbH, Berlin, 2021)
17. N. Stenberg, C. Fellers, S. Östlund, Plasticity in the thickness direction of paperboard under combined shear and normal loading. Trans. ASME 123, 184–190 (2001)
18. Htun, Fellers, The invariant mechanical properties of oriented handsheets. Tappi 65(4), 113–117 (1982)
PAPERmaking!
FROM THE PUBLISHERS OF PAPER TECHNOLOGY
Volume10, Number2,2024
Simulation of Sheet Molding during Through Air Drying of Tissue Paper within a Papermaking Framework
K. REZK & B. SJÖSTRAND
A way to improve product performance of tissue grade paper products is to replace the press section with a Through Air Drying (TAD) section which is a technique where paper sheets are moulded into a structured fabric by vacuum boxes and transferred over one or more TAD cylinders with steam heated displacement drying. The process of sheet molding is modelled with Comsol Multiphysics where the computational model is setup with a 2-dimensional representation of the paper sheet. The tissue sample with randomly distributed fibre positions is generated using a MATLAB script written in the Livelink interface with Comsol. The process is simulated with the Moisture Flow multiphysics interface. The comprising physical modules are the Laminar Flow and the Moisture Transport in Air modules. Respectively, these modules calculate the velocity and pressure field of the moist air as well as the relative humidity, which is a rewrite of the concentration of water in air. The fibres in the sheet are modelled as porous media where the fibres contain both moist air and liquid water in equilibrium. In this paper, a basis weight at roughly 20 g/m2 is simulated and compared to laboratory data. The aim of the model is to estimate solid content in the paper sheet over vacuum time as well as energy demand and required airflow through the structure.
Contact information:
Pro2BE, the research environment for Processes and products for a circular forest-based bioeconomy, Department of engineering and chemical sciences, Karlstad University, Karlstad, Sweden.
COMSOL Conference 2023, Munich Open Source
The Paper Industry Technical Association (PITA) is an independent organisation which operates for the general benefit of its members – both individual and corporate – dedicated to promoting and improving the technical and scientific knowledge of those working in the UK pulp and paper industry. Formed in 1960, it serves the Industry, both manufacturers and suppliers, by providing a forum for members to meet and network; it organises visits, conferences and training seminars that cover all aspects of papermaking science. It also publishes the prestigious journal Paper Technology International® and the PITA Annual Review, both sent free to members, and a range of other technical publications which include conference proceedings and the acclaimed Essential Guide to Aqueous Coating.

SimulationofSheetMoldingduringThroughAirDryingofTissue PaperwithinaPapermakingFramework
K. Rezk1, B. Sjöstrand1
1. Pro2BE, the research environment for Processes and products for a circular forest-based bioeconomy, Department of engineering and chemical sciences, Karlstad University, Karlstad, Sweden
Abstract
A way to improve product performance of tissue grade paper products is to replace the press section with a Through Air Drying (TAD) section which is a technique where paper sheets are moulded into a structured fabric by vacuum boxes and transferred over one or more TAD cylinderswithsteamheated displacementdrying.Theprocessofsheetmolding ismodelledwith Comsol Multiphysics where the computational model is setup with a 2-dimensional representation of the paper sheet. The tissue sample with randomly distributed fibre positions is generated using a MATLAB script written in the Livelink interface with Comsol The process is simulated with the Moisture Flow multiphysics interface. The comprising physical modules are the Laminar Flow and the Moisture Transport in Air modules. Respectively, these modules calculate the velocity and pressure field of the moist air as well as the relative humidity, which is a rewrite of the concentration of water in air. The fibres in the sheet are modelled as porous media where the fibres contain both moist air and liquid water in equilibrium. In this paper, a basis weight at roughly 20 g/m2 is simulated and compared to laboratory data. The aim of the model isto estimate solid content in the paper sheet over vacuum time as well as energydemand and required airflow through the structure
Keywords: CFD, Dewatering, Moisture transport, tissue paper, through air dying.
Introduction
Water removal during paper and board manufacturing is an energy intensive process. The dewatering process in paper and board manufacturing generally consists of four stages with progressively high energy demand [1, 2]. The first stage comprises water removal with gravity or centrifugal forces where water escapes without additional energy input and then with help of static elements in the geometry of the paper machine, followed by low and high vacuum pressure. In the second stage of vacuum exposure, where higher levels of vacuum pressure are applied through suction boxes [2-8]. Most of the suspended water is removed during gravitational and vacuum dewatering [9]. The third stage is performed in the press section by compressing the paper in one or more press nips [10] The last stage, which far exceeds the other stages in energy demand, is comprised by thermaldryingwhere remaining water in fibres are evaporated on steam-heated cylinders [9, 11]. Hence, improving the mechanical dewateringprocessespriortothethermalstagecould reduce major production cost.
A number of researchers have studied vacuum dewatering experimentally using laboratory equipment as well using pilot scale machines [2-8, 12-21] Process parameters that influence sheet dryness such as applied vacuum, dwell time and basis weight have been analysed.[4, 6, 13, 22-25]
These studies show that a prolonged dwell time would increase dryness to a certain level. To reach a higher dryness level, increased vacuum pressure is necessary.
Numerous researchers have conducted theoretical and numerical analysis on various aspects on vacuum dewatering such as single-flow mechanics in fibrous porous media where permeation through compressible fiber beds, permeability in various representative fiber structures were studied as well as penetrated air volume calculated and compared to experimental data [26-30] Some attempts on simulating the two-phase flow behavior during the early stage of dewatering of the unbound water where progression on estimating the dwell time and dry content with varying pressure pulses has been conducted in [16, 31, 32]. While there are improvements that need to me made on the estimation of the dewatering rate, the penetrated air volume showed excellent agreement with experimental data.
Fluidinertiaaswellasspatialheterogeneityhasbeen studied for moderate Reynolds number in various fiber arrangements by [33-37]. Moreover, the influence on the permeability based on sample size, boundary conditions, homogeneity and isotropy were studied. The relations are used to predict permeability for various fiber arrangements and porosity levels.
A way to improve product performance of tissue grade paper products is to replace the press section with a Through Air Drying (TAD) section which is a technique where paper sheets are moulded into a structured fabric by vacuum boxes and transferred over one or more TAD cylinders with steam heated displacement drying (Tysén 2018, Tysén et al. 2015; 2018) Much like conventional papermaking machines, where the Yankee cylinder is the most energyrequiringstep,theTADcylindershavebyfar the highest energy demand. Hence, improving the drying rate in the molding process is necessary from an energy demand standpoint. The process of sheet molding is modelled with Comsol Multiphysics where the computational model is setup with a 2dimensional representation of the paper sheet. The tissue sample with randomly distributed fibre positions is generated using a MATLAB script written in the Livelink interface with Comsol. The process is simulated with the Moisture Flow multiphysics interface. The comprising physical modules are the Laminar Flow and the Moisture Transport in Air modules. The purpose of this paper isto gain a better understanding ofdriving as well as limiting mechanisms of moisture transport in porous media concept of TAD molding system. The aim is to develop a first draft ofa computational model that can simulate the change in solid content
Theory / Numerical Set Up
Wood fibres for papermaking and paper sheets are both hygroscopic materials and, as such, contain bound water within the sheet network structure and within fibre walls. The network of fibres in a sheet as well as the fibres themselves can be viewed as porous media and understanding the physics and characteristics of fluid transport is key in numerically assessing water removal rate. Physical effects such as fluid flow and transport of fluids in different phases is considered. Heat transfer is excluded from these simulations at this stage as evaporative cooling is assumed to have neglectable effects on the drying process.
Computational domain
The computational model is setup with a 2dimensional representation of the paper sheet. The tissue sample with randomly distributed fibre positions is generated using a MATLAB script written in the Livelink interface with Comsol. The script creates fibres and randomly position them throughout the domain, which represents the paper, see Fig. 1. The code can be set to create fibres comprising of various basis weights and paper sheet porosities Inthispaper,asheetcomprisingofabasis weight at 18 g/m2 and a porosity at approximately 0.7 were simulated and analysed Ten different structureswerecreatedin theLivelink Matlabscript

Figure 1 2-dimensional representation of paper sheet model in Comsol. The upper SEM image is from the study [20]
The basis weight (g/m2) is a standard measurement inpapermanufacturinganditrepresenttheweightof the paper in relation to a standard size. More specifically, it is the ratio between the mass of dry substance and the surface area of the sample.
Where ���� coarseness or length density (kg/m) of a fibre,�� isthenumberoffibres,whereas �� (m)isthe height of the sample
Modelling continua in porous media
Porous materials such as networks of wood fibres has a complex solid structure and is highly discontinues from a continuum theory perspective, see Fig. (2). This is resolved by viewing the modelled structure as a porous media in several layers, that is, the wood fibres are interpreted as a mixtureofdifferentmaterials(solidsandfluids)with measurable quantities in a macroscopic field.

Figure 2 A 2-dimensional schematic representation of the structure of a single wood fibre and, on smaller scales, bundles of microfibrils.
Governing Equations / Numerical Model
At the start of the simulation process, the fibres are saturated with water, although surrounded by moist air. As air flows through the paper sheet, the fibres are dried due to moisture mitigation from the core of the fibre to the surface through convection and capillary forces. At the surface, water is evaporated though forced convection and vapour diffusion. The process is simulated with the Moisture Flow Multiphysics interface. The comprising physical modules are the Laminar Flow and the Moisture Transport in Air modules.
Pore space in the paper model
The penetrating airflow is modelled with the continuity and Navier stokes equations in COMSOL Multiphysics 6.1, see Eqs. (2) and (3),
=0 (2)
(3)
where ������ is the deviatoric stress tensor which includes the bulk viscosity due to compressibility in the air, see Eq. (4).
(4)
Turbulence modelling was excluded from the simulationsdue to small length scalesin the order of 10e-6 m and, hence, leading to low Reynolds numbers.
The moisture transport in the air is described with a modified advection diffusion model shown in Eq. (5),
(5)
where ���� (kg/mol) is the molar mass of water vapour, ���� (m2/s) is the vapor diffusion in air coefficient and �� (kg/m3s) is the moisture source or sink term. The concertation term in in Eq. (5) is related to the relative humidity with the vapor saturation concentration. ��
(6)
Porous media modelling in wood fibre
The wood fibres are typically hygroscopic materials and, as such, should be modelled as a porous media. The fibres contain two phases in equilibrium, which is the liquid water and the moist air. The driving force for transportation of each phase is vapor diffusion and convection in air, as well as capillary flow and convection for water. Assuming that the inertial forces in the fibres are neglectable, Darcy’s correction model is used to relate pressure gradients to the volume averaged superficial velocity
contain the maximum amount of water. The relative permeability varies between zero and one for each phase depending on the water content within the fibre walls. The total permeability is, hence, the product of the intrinsic and relative permeability.
where ������ (m2) is permeability coefficient and �� (Pa·s) is the dynamic viscosity. The permeability is typicallydecomposedintointrinsicpermeabilityand relative permeability for multiphase flow in porous media according to [38]. The intrinsic parameter represents the permeability of liquid or gas in an entirely saturated state, i.e. the pores in the fibre
The equations that describe the relative permeability for eachphase aredescribedinEq. (9) and (10).[38]
The intrinsic permeability for wood fibres are used from [38]
Fluid transport in and between wood fibres is described with the following equation
where ���� (kg/(m·s)), see Eq. (12), is the vapor transport in the gaseous phase in the wood fibre. As the Millington and Quirk equation is used calculate theeffectivediffusivityinseeEq.(12).Thecapillary flux term ������ (kg/(m·s)),seeEq.(13),isdescribed as the relative humidity gradient of the moisture contentandanadded diffusivityterm ���� (m2/s),see Eq. (14). [38] The moisture content, ��(����), is a function of the relative humidity, see Eq. (15)
The liquid saturation, ����, is a dimensionless parameter and it describes the amount of water left withinthepores, ���� istheporosityofthewoodfibres and ���� is vapour mass fraction.
Model simplifications
Some of the major assumptions this model relies on is:
• Aligned fibre positions due to 2dimensional representation of the paper sheet
• The forming and deformation of the fibre web during the TAD molding process is excluded
• Zero unbound water remaining in the paper sheet model.
Initial and boundary conditions
Initially, the fibres are saturated with water and the pore structure of the paper sheet contains air. The boundary conditions of the 2-dimensional representation is presented in Fig. (3)

Figure 3 The properties of the computational domain and boundary conditions.
Pressure was applied at the inlet and outlet boundary in which the vacuum level was set at 30 kPa at the outlet and reference pressure at 0 Pa was set at the inlet. Symmetry was set at thevertical boundaries as the fibre structure of the domain which was considered characteristic. Key input parameters for the simulation model are presented in Table (1)
Table 1: Key input data to the simulation model
Parameter data
Permeability
Porosity
Vapor-air diffusion
Vacuum pressure
Density fibre
Mesh setup and solver settings
Size
4.8e-8 [m2]
0.55 [-]
2.6e-5 [m2/s]
-30 [kPa]
1340 [kg/m3]
An unstructured mesh grid containing triangle elements was created for the paper models, see Fig. (4).Thegridissolvedinafiniteelementspacewhere a set of basis functions are used to create piecewise linear relations between the mesh elements and convert them to weak formulations for them to be solved. Moreover, geometrical features such as the
diameter of a single fibre as well as typical gap distance between adjacent fibres
A direct linear system solver was used coupled with an implicit second order backward differentiation formula (BDF) solver. The direct solver is called PARDISO which handles sparse linear systems using LU factorization to compute a solution. More information on the solver is found in COMSOL documentation. The BDF solver performs time stepping using a backward differentiation with a maximumorderofaccuracyof2,whichisthedegree of the interpolating polynomial.

Figure 4 Grid resolution and geometrical properties of the paper sheet model.
Results and Discussion
The results are comprised by presenting the solid content of the fibre web over time Fig. (5) presents four snapshots of the solid content at times 0, 5, 10 and 20 ms. Local variations of the solid content are observedat20mswhichisaresultofadjacentfibres blocking the airflow and hence, reducing the influence of convective mass transport. Considering that the fibre web is viewed in two dimensions, the air blockage should be overrepresented and thus, causing larger variations of the airflow. This notion is supported in [33] which concluded that flow resistance in the isotropic fibrearrangement in space is lower than the in-plane isotropic orientation and disordered unidirectional fibre arrangements at creeping flow conditions for low to moderate

Figure 5 Colour plot representing solid content in in the fibre structure
The averaged solid content for the entire fibre web is presented in Fig. (5)

Figure 6 Solid content comparison to laboratory trials performed by [20]
The solid content from the simulation model is compared to lab-scale data from [20], for early TAD molding the simulation model show great coherence with the laboratory results. After some time, the laboratory results deviate from the linear behaviour and display diminishing returns. A few additions need to be added to the models to capture the diminishing returns. In a first approach to establish a numerical model of the TAD molding process, the influence of web deformation was excluded which eliminates both compressibility of the sheet which leads to decreasing permeability and also the rewettingphenomena,whichareimportantfactorsto consider for a comprehensive model [39, 40]. The TAD fabric is likewise excluded from the simulations According to [12] machine clothing such as forming fabrics affects the dewatering rate andmagnitudethroughthreemainparameters,fabric caliper, void volume and air permeability. Similar dependence on the process is assumed to be influenced by TAD fabrics. Adding some of these to the numerical models, it is hypothesized to better simulate both laboratory and pilot scale results.
Conclusions
The first draft of the simulation model shows promising results in terms estimating average solid content over dwell time. At least that is the case up until roughly 15 ms. Based in laboratory results, the solidcontentrateseemstoconvergetoanupperlimit value,whichisnotthecaseforthesimulationmodel. Hence, experiments indicate that there is a physical limit on the dewatering rate The surface moisture vaporization needs to by analysed further as theory suggest that there should be an increased resistance to surface vaporization as the moisture level decreases in the porous media. However, since the dryness levels during the TAD molding process rangesabout5-6%fromstarttofinish,itshouldhave a neglectable affect as there is still a lot of bound water in the fibre. Other limiting factors that are not considered at the moment are:
• Including the TAD wire which add blockage to the airflow as well as absorbs water from the fibres
• AnalysingtheTAD molding processina3dimensional space which should have an overall reduction in blockage due to an addeddimension where theflow can travel.
• Including the deformation of the fibre web during the molding process. Perhaps the poroelastic physics interface could be utilized to analyse both the deformation of the fibre web as the fluid transport of the porous media simultaneously.
Acknowledgements
The authors are grateful for the financial support of the Knowledge foundation,Grant No.2022-0024, as well as generous in-kind contributions from Albany International Inc., Karlstad University and Valmet AB.
References
[1] Hubbe MA, Sjostrand B, Nilsson L, Koponen A, McDonald JD. Rate-limiting Mechanisms of Water Removal during the Formation, Vacuum Dewatering, and Wet-pressing of Paper Webs: A Review. Bioresources. 15(4) (2020) 9672-755, [2] Ramaswamy S. Vacuum dewatering during paper manufacturing. Dry Technol. 21(4) (2003) 685-717, https://doi.org/10.1081/Drt-120019058 [3] Attwood BW. A study of vacuum box operation.PaperTechnology.3(5)(1962)T144-T53, [4] Neun JA. Performance of High-Vacuum Dewatering Elements in the Forming Section. Tappi J. 77(9) (1994) 133-8, [5] Neun JA. High-vacuum dewatering of newsprint. Tappi J. 79(9) (1996) 153-7,
[6] Räisänen K, Karrila, S., Maijala, A. Vacuum dewatering optimization with different furnishes. Pap Puu-Pap Tim. 78(8) (1996) 455-,
[7] BaldwinL.Highvacuumdewatering.Paper Technology. 38(4) (1997) 23-8,
[8] Räisänen KO. Vacuum systems. In: Gullichsen HPJ, editor. Papermaking part 1: Stock preparation and wet end 2000. p. 417-30.
[9] Sjöstrand B. Vacuum Dewatering of Cellulosic Materials: Karlstad University; 2020.
[10] Wahlstrom B. Wet pressing in the 20th century: Evolution, understanding and future. Pulp Pap-Canada. 102(12) (2001) 81-8,
[11] Kuhasalo A, Niskanen, J., Paltakari, J., Karlsson, M. Introduction to paper drying and principles and structure of a dryer section. In: Gullichsen PJ, editor. Papermaking part 2, Drying 2000. p. 16-53.
[12] Granevald R, Nilsson LS, Stenstrom S. Impact of different forming fabric parameters on sheet solids content during vacuum dewatering. Nord Pulp Pap Res J. 19(4) (2004) 428-33, https://doi.org/DOI 10.3183/npprj-2004-19-04p428-433
[13] Pujara J, Siddiqui MA, Liu Z, Bjegovic P, TakagakiSS,LiPY,etal.Methodtocharacterizethe air flow and water removal characteristics during vacuum dewatering. Part I - Experimental method. Dry Technol. 26(3) (2008) 334-40, https://doi.org/10.1080/07373930801898091
[14] AslundP,VomhoffH.Methodforstudying the deformation of a fibre web during a suction pulse. Nord Pulp Pap Res J. 23(4) (2008) 398-402, https://doi.org/DOI 10.3183/npprj-2008-23-04p398-402
[15] Sjöstrand B, Barbier, C., & Nilsson, L. . Influence on sheet dewatering by structural differences in forming fabrics. Paper Conference andTradeShowCincinnati,Ohio,USA2016.p.76776.
[16] Sjostrand B, Barbier C, Nilsson L. Modeling the influence of forming fabric structure on vacuum box dewatering. Tappi J. 16(8) (2017) 477-83, https://doi.org/Doi 10.32964/Tj16.8.477
[17] Sjostrand B, Barbier C, Ullsten H, Nilsson L. Dewatering of Softwood Kraft Pulp with Additives of Microfibrillated Cellulose and Dialcohol Cellulose. Bioresources. 14(3) (2019) 6370-83, https://doi.org/10.15376/biores.14.3.63706383
[18] Rahman H, Engstrand P, Sandstrom P, Sjostrand B. Dewatering properties of low grammage handsheets of softwood kraft pulps modified to minimize the need for refining. Nord Pulp Pap Res J. 33(3) (2018) 397-403, https://doi.org/10.1515/npprj-2018-3037
[19] Sjostrand B, Brolinson A. Addition of Polyvinylamine in Chemi-thermomechanical Pulp and Kraft Pulp and the Effects on Dewatering, Strength, and Air Permeance. Bioresources. 17(3) (2022) 4098-115, https://doi.org/10.15376/biores.17.3.4098-4115
[20] Sjostrand B, Danielsson M, Lestelius M. Method for Studying Water Removal and Air Penetration during Through Air Drying of Tissue in Laboratory Scale. Bioresources. 18(2) (2023) 307388, https://doi.org/10.15376/biores.18.2.3073-3088
[21] Sjostrand B. Progression of Vacuum Level in Successive Vacuum Suction Boxes in a Paper Machine-Impact on Dewatering Efficiency and Energy Demand-A Laboratory Study. Bioresources. 18(2) (2023) 3642-53, https://doi.org/10.15376/biores.18.2.3642-3653
[22] Britt KW, Unbehend JE. Water Removal during Paper Formation. Tappi J. 68(4) (1985) 1047,
[23] Granevald R. Vacuum dewatering of lowgrammage paper webs and fabrics.: Karlstad University; 2005.
[24] Aslund P, Vomhoff H, Waljanson A. The deformation of chemical and mechanical pulp webs duringsuctionboxdewatering.NordPulpPapResJ. 23(4) (2008) 403-8, https://doi.org/DOI 10.3183/npprj-2008-23-04-p403-408
[25] Pujara J, Siddiqui MA, Liu Z, Bjegovic P, TakagakiSS,LiPY,etal.Methodtocharacterizethe air flow and water removal characteristics during vacuum dewatering. Part II - Analysis and characterization. Dry Technol. 26(3) (2008) 341-8, https://doi.org/10.1080/07373930801898125
[26] Jackson GW, James DF. The Permeability of Fibrous Porous-Media. Can J Chem Eng. 64(3) (1986) 364-74, https://doi.org/DOI 10.1002/cjce.5450640302
[27] Zhu S, Pelton RH, Collver K. Mechanistic Modeling of Fluid Permeation through Compressible Fiber Beds. Chem Eng Sci. 50(22) (1995) 3557-72, https://doi.org/Doi 10.1016/00092509(95)00205-J
[28] Nilsson L, Stenstrom S. A study of the permeability of pulp and paper. Int J Multiphas Flow. 23(1) (1997) 131-53, https://doi.org/Doi 10.1016/S0301-9322(96)00064-X
[29] Matthews GP. Computer modelling offluid permeation in porous coatings and paper - an overview. Nord Pulp Pap Res J. 15(5) (2000) 47685, https://doi.org/DOI 10.3183/npprj-2000-15-05p476-485
[30] Nilsson L. Stepwise Development of a Mathematical Model for Air Flow in Vacuum Dewatering of Paper. Dry Technol. 32(13) (2014) 1587-97, https://doi.org/10.1080/07373937.2014.909844
[31] Rezk K, Nilsson L, Forsberg J, Berghel J. Modelling of water removal during a paper vacuum dewateringprocessusinga Level-Set method. Chem Eng Sci. 101 (2013) 543-53, https://doi.org/10.1016/j.ces.2013.07.005
[32] Rezk K, Nilsson L, Forsberg J, Berghel J. Simulation of Water Removal in Paper Based on a 2D Level-Set Model Coupled with Volume Forces Representing Fluid Resistance in 3D Fiber Distribution. Dry Technol. 33(5) (2015) 605-15, https://doi.org/10.1080/07373937.2014.967401
[33] Rezk K, Forsberg J, Nilsson L, Berghel J. Characterizing flow resistance in 3-dimensional disordered fibrous structures based on Forchheimer coefficients for a wide range of Reynolds numbers. Appl Math Model. 40(21-22) (2016) 8898-911, https://doi.org/10.1016/j.apm.2016.05.036
[34] YazdchiK,LudingS.Towardsunifieddrag laws for inertial flow through fibrous materials. Chem Eng J. 207 (2012) 35-48, https://doi.org/10.1016/j.cej.2012.06.140
[35] Koch DL, Ladd AJC. Moderate Reynolds numberflowsthroughperiodicandrandomarraysof aligned cylinders. J Fluid Mech. 349 (1997) 31-66, https://doi.org/Doi 10.1017/S002211209700671x
[36] Yazdchi K, Srivastava S, Luding S. Microstructural effects on the permeability of periodicfibrousporousmedia.IntJMultiphasFlow. 37(8) (2011) 956-66, https://doi.org/10.1016/j.ijmultiphaseflow.2011.05. 003
[37] Yazdchi K, Srivastava S, Luding S. Micromacro relations for flow through random arrays of cylinders. Compos Part a-Appl S. 43(11) (2012) 2007-20, https://doi.org/10.1016/j.compositesa.2012.07.020
[38] Datta AK. Porous media approaches to studyingsimultaneousheatandmasstransferinfood processes. II: Property data and representative results. J Food Eng. 80(1) (2007) 96-110, https://doi.org/10.1016/j.jfoodeng.2006.05.012
[39] Mcdonald JD, Kerekes RJ. Estimating limits of wet pressing on paper machines. Tappi J. 16(2) (2017) 81-7, https://doi.org/Doi 10.32964/Tj16.2.81
[40] Sjostrand B, Barbier C, Nilsson L. Rewettingafterhighvacuumsuctionboxesinapilot paper machine. Nord Pulp Pap Res J. 30(4) (2015) 667-72, https://doi.org/DOI 10.3183/npprj-2015-3004-p667-672
PAPERmaking!
FROM THE PUBLISHERS OF PAPER TECHNOLOGY INTERNATIONAL®
Volume10,Number2,2024
Alkenyl Succinic Anhydride: The Question of Covalent Bonding and Chemistry Considerations for Better Sizing—Review
YAO NTIFAFA1, LEBO XU1, SARA BOLLINGER1, YUN JI2 , & PETER W. HART1
Alkenyl Succinic Anhydride (ASA) is a sizing agent used in papermaking to increase the water repellency of paper. Almost 60 years after the introduction of the chemical in papermaking, scientists still have differing views on how ASA interacts with cellulose. Several experiments were conducted to bring more clarity to the ASA sizing mechanism, especially on the contentious question of ASA-cellulose covalent bonding or the esterification reaction between ASA and cellulose during papermaking. Herein, research papers and patents, including experiments and results, from the 1960s to 2020 were reviewed. Our investigation revealed that the ester bond formation between ASA and cellulose is insignificant and is not a prerequisite for sizing effectiveness; the main ASA-related material found in sized paper is hydrolyzed ASA or both hydrolyzed ASA and ASA salt. In addition, ASA emulsion stability and ASA emulsion retention are important for sizing efficiency improvement
Contact information:
1 WestRock, 2742 Charles City Road, Richmond, VA 23231, USA
2 Department of Chemical Engineering, University of North Dakota, Grand Forks, ND 58202, USA.
Polymers 2023, 15, 2876 https://www.mdpi.com/2073-4360/15/13/2876
Creative Commons Attribution 4.0 International License
The Paper Industry Technical Association (PITA) is an independent organisation which operates for the general benefit of its members – both individual and corporate – dedicated to promoting and improving the technical and scientific knowledge of those working in the UK pulp and paper industry. Formed in 1960, it serves the Industry, both manufacturers and suppliers, by providing a forum for members to meet and network; it organises visits, conferences and training seminars that cover all aspects of papermaking science. It also publishes the prestigious journal Paper Technology International® and the PITA Annual Review, both sent free to members, and a range of other technical publications which include conference proceedings and the acclaimed Essential Guide to Aqueous Coating.
polymers
Review
AlkenylSuccinicAnhydride:TheQuestionofCovalent BondingandChemistryConsiderationsforBetter Sizing—Review
YaoNtifafa 1,*,† ,LeboXu 1,†,SaraBollinger 1,†,YunJi 2,† andPeterW.Hart 1,†

1 WestRock,2742CharlesCityRoad,Richmond,VA23231,USA;peter.hart@westrock.com(P.W.H.)
2 DepartmentofChemicalEngineering,UniversityofNorthDakota,GrandForks,ND58202,USA
* Correspondence:yao.ntifafa@westrock.com
†Theseauthorscontributedequallytothiswork.
Abstract: AlkenylSuccinicAnhydride(ASA)isasizingagentusedinpapermakingtoincreasethe waterrepellencyofpaper.Almost60yearsaftertheintroductionofthechemicalinpapermaking, scientistsstillhavedifferingviewsonhowASAinteractswithcellulose.Severalexperimentswere conductedtobringmoreclaritytotheASAsizingmechanism,especiallyonthecontentiousquestion ofASA-cellulosecovalentbondingortheesterificationreactionbetweenASAandcelluloseduring papermaking.Herein,researchpapersandpatents,includingexperimentsandresults,fromthe 1960sto2020werereviewed.OurinvestigationrevealedthattheesterbondformationbetweenASA andcelluloseisinsignificantandisnotaprerequisiteforsizingeffectiveness;themainASA-related materialfoundinsizedpaperishydrolyzedASAorbothhydrolyzedASAandASAsalt.Inaddition, ASAemulsionstabilityandASAemulsionretentionareimportantforsizingefficiencyimprovement.
Keywords: AlkenylSuccinicAnhydride(ASA);cellulose;papersizing;covalentbonding;sizing agentstability;sizingagentretention
Citation: Ntifafa,Y.;Xu,L.; Bollinger,S.;Ji,Y.;Hart,P.W.Alkenyl SuccinicAnhydride:TheQuestionof CovalentBondingandChemistry ConsiderationsforBetter Sizing—Review. Polymers 2023, 15, 2876. https://doi.org/10.3390/ polym15132876
AcademicEditor:LiliWang
Received:13June2023
Revised:23June2023
Accepted:25June2023
Published:29June2023

Copyright: ©2023bytheauthors. LicenseeMDPI,Basel,Switzerland. Thisarticleisanopenaccessarticle distributedunderthetermsand conditionsoftheCreativeCommons Attribution(CCBY)license(https:// creativecommons.org/licenses/by/ 4.0/).
1.Introduction
Theobjectiveofpapersizingistodelaywettingbyreducingthefiberabsorbency. AlkenylSuccinicAnhydride(ASA)wasintroducedasasizingagentinpapermakingin1963 byWurzburgandMazzarella[1].ASAisanorganiccompoundwithcyclicdicarboxylic anhydrideandatetrafurandione(Figure 1).Thechemicalislightyellowcolor,oil-like, non-solubleinwater,andliquidatroomtemperature[2,3].
emulsion particles are retained in the forming paper sheet at the wet end and forming section. Sizing development mostly happens in the dryer section, where the particles break down to release ASA in contact with the fibers [9,10].

Figure1. SchemeofesterbondformationbetweenASAandcellulose.
Today,commoninternalsizingchemicals(e.g.,alum/rosin,AKD[Alkylketenedimer] andASA)areintroducedintoapulpslurryatthewetendduringthepapermakingprocess.
Polymers 2023, 15,2876. https://doi.org/10.3390/polym15132876
The proposed and widely cited ASA sizing mechanism is the formation of an ester or covalent bond between ASA molecules and fibers. Figure 1 illustrates the ester bond formation between ASA and fiber (cellulose). However, during the last 60 years of papermaking research, this popular mechanism has been questioned. Several scientists are still uncertain about the binding mechanism between ASA and cellulose. In addition, most scientists agree that ASA hydrolyzes in water during the papermaking process (Figure 2) [7,11–13].
, 15, x
Figure 1. Scheme of ester bond formation between ASA and cellulose.
Alum/rosinsizingiscommonlyusedforacidicpapermakingwithatypicalpHrangefrom 4.0to5.5.InthispHrange,alumformstherightaluminumspeciestoeitherreactwith soaprosinortoretaindispersedrosin(DRS)forsizingdevelopment.AKDandASAare usedinalkalinepapermakingprocesses,whereASAhasahigherreactivitytocellulosic fibercomparedtoAKD.Moreover,ASAhasalsobeenreportedtobeappliedinacidic
DuetotheinsolubilityofASAinwater,ASAoilneedstobeemulsifiedbeforeadding tothewetendforhomogenousdistributioninpulpslurries.Theemulsifiercanbestarchbased(cationicstarch)orpolymer-based(polyacrylamide).TypicalASAemulsionparticle sizeisaround1 µm.TheASAemulsionhasashortshelflife,andthusthechemicalis typicallyemulsifiedon-siteinthemillanddosedtothewetendassoonaspossible.The emulsionparticlesareretainedintheformingpapersheetatthewetendandforming section.Sizingdevelopmentmostlyhappensinthedryersection,wheretheparticlesbreak downtoreleaseASAincontactwiththefibers[9,10].
Scheme of ester bond formation between ASA and cellulose.
The proposed and widely cited ASA sizing mechanism is the formation of an ester covalent bond between ASA molecules and fibers. Figure 1 illustrates the ester bond mation between ASA and fiber (cellulose). However, during the last 60 years of papermaking research, this popular mechanism has been questioned. Several scientists are still certain about the binding mechanism between ASA and cellulose. In addition, most entists agree that ASA hydrolyzes in water during the papermaking process (Figure [7,11–13].
TheproposedandwidelycitedASAsizingmechanismistheformationofanesteror covalentbondbetweenASAmoleculesandfibers.Figure 1 illustratestheesterbondformationbetweenASAandfiber(cellulose).However,duringthelast60yearsofpapermaking research,thispopularmechanismhasbeenquestioned.Severalscientistsarestilluncertain aboutthebindingmechanismbetweenASAandcellulose.Inaddition,mostscientists agreethatASAhydrolyzesinwaterduringthepapermakingprocess(Figure 2)[7,11–13].
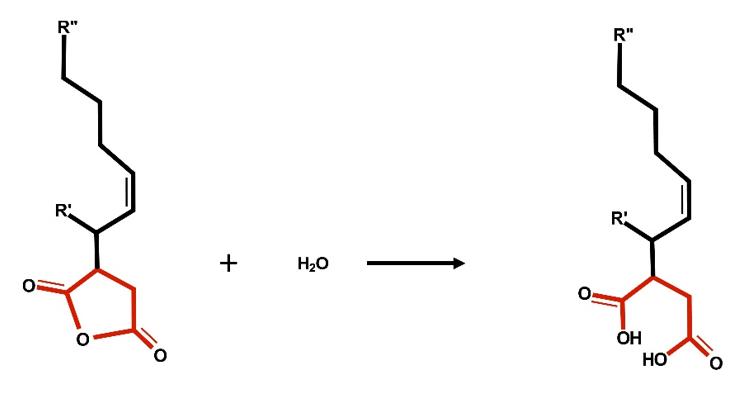
Figure2. SchemeoftheformationofhydrolyzedASA.
Figure 2. Scheme of the formation of hydrolyzed ASA.
Thecovalentbondingquestionbecomesaheateddebatebetweenscientistswhosupporttheesterbondformationastheprimarysizingmechanismandscientistswhobelieve esterbondingisalmostnonexistentanddoesnotplayamajorroleinpapersizing.Dueto theconfusionaroundthecovalentbondingquestions,manyauthorsprefertousetheexpressions“widelyaccepted”,“generallyaccepted”,“generallyunderstood”,“traditionally”, or“assume”inreferencetotheASA-cellulosecovalentbondformation[7,12,14–19].
The covalent bonding question becomes a heated debate between scientists who port the ester bond formation as the primary sizing mechanism and scientists who believe ester bonding is almost nonexistent and does not play a major role in paper sizing. the confusion around the covalent bonding questions, many authors prefer to use pressions “widely accepted”, “generally accepted”, “generally understood”, “traditionally”, or “assume” in reference to the ASA-cellulose covalent bond formation [7,12,14–19].
Inthisreview,patentsandresearchpaperswithexperimentaldatawerereviewedto understandtheASAsizingmechanismsince1963.Inaddition,chemistryconsiderations forbetterapplicationofASAarebrieflydiscussed.
In this review, patents and research papers with experimental data were reviewed understand the ASA sizing mechanism since 1963. In addition, chemistry considerations for better application of ASA are briefly discussed.
2.DebateonASASizingMechanisminPapermaking
PriortotheintroductionofASAtothepapermakingprocessinthe1960s,theadditive wasusedinthetextileindustrytoimpartwaterrepellencytocellulosicfabrics.Patent 2,903,382byRobertBerls[20]in1959provideddetailsonhowtomakehydrophobic cellulosicfabricusingASA.DifferenttypesofASAwithchainsfrom19to35carbon atomsweredissolvedinsolventsuchasisopropanol,benzene,toluene,chloroform,carbon tetrachloride,ammonia,morpholine,andwateremulsions.Thefabricwasdippedintothe resultingsolutionthenheatcured.TherecommendedASAconcentrationwasfrom0.7%
Figure 1.
to2.5%(14to50lb/t)oftheweightofthefabric.ThespraytestmethodoftheAmerican AssociationofTextileChemistsandColoristsA.S.T.M.Designation:D583-54wasusedto evaluatewaterrepellency.Therewasnomentionofesterificationreactionnorcovalent bondingintheclaim.Inaddition,theASAapplicationislikewaxapplicationtotextile fiberforhydrophobicity,asclaimedinpatent2,759,851in1956byFluck,Pluckemin,and Logan[21].
In1963,WurzburgandMazzarella[1]mixedASAwithdifferentderivativesofstarch toformanemulsion.ItwasclaimedthattheapplicationoftheASAemulsiononfiber madethesheethydrophobic.Thepatentdemonstratedthesizingprocesswiththeuseof theASAemulsionandtheadditionofalum,aluminumchloride,longchainfattyamines, sodiumaluminate,polyacrylamide,animalglue,polyamidepolymers,primaryamine starchderivatives,secondaryaminestarchderivatives,tertiaryaminestarchderivatives, andquaternaryaminestarchderivatives.
Theauthorrecommendedtouse0.5to2partsbyweightofcationicstarchper1part ofthesizingagenttoobtainadequateresults.Differentdosagesfrom0.25%to2%(5to 40lb/t)ofthesizingagentwereusedin14differentexamplestosupporttheclaim.Uranine dyeandinkdiptestswereusedtoprovethehydrophobicityofthesheets.Therewasno disclosureofcovalentoresterbondingbetweenASAandcelluloseinthepatentdocument. Cuculo[22]atNCStateUniversitytriedtoesterifysuccinicanhydridewithcellulose in1971.First,successfulresultswereobtainedfromthereactionbetweenviscoserayon celluloseandsuccinamicacid.Thesampleswerebakedinsuccinamicacidat136 ◦C, 183 ◦C,and207 ◦C,water-washed,andthentreatedwith3%sodiumsulfatetoformsodium cellulose-hemisuccinate.Thedegreeofsubstitutionsforthereactionswere,respectively, 0.03,0.24,and0.25.Theauthorconcludedthatthedegreeofthesubstitutionofreaction dependsstronglyonthereactiontemperature.Second,whensuccinicanhydrideinwater wasusedundercomparableconditionstothoseofthesuccinamicacid,theauthorstated thattherewasnoevidenceofesterformation.Thereportedreactionyieldwithsuccinamic acidwas36%,andtheauthormentionedthatammoniacopiouslyevolvedduringthe reaction.Therecommendedtemperatureusingthesuccinamicacidisabove150 ◦C.
McCarthyandStratton[23]studiedthereactionbetweencottonlinterspulpandASA in1986.Inonestudy,thecottonlintersandASAwerereactedinN,N-dimethylformamide withtriethylamineasacatalyst.Inanotherstudy,thecottonlinterpulp(washedin chloroform-ethanolsolutionfor48handairdryforseveralhours)andahighconcentration ofASA(1.5%or30lb/ton)werereacted.Poly(1,2-dimethyl-5-vinylpyridiniumbromide),or DMVPB,wasusedasASAretentionaid.Inbothstudies,FTIRdatashowedtheformation ofesterbonds,howevertheefficiencyofthesereactionswasnotreported.InMcCarthy’s thesisin1987[24],theauthorshowedbyFTIRthatASAreactedwithethanoltoformester bonds.ItisnotknownifpartoftheASAformedesterbondswithethanolratherthan cellulosesincethepulpwaswashed48hwithchloroform-ethanolsolution.
Wan[25]studiedthemechanismofASAsizingin1988usingC14-labelledtetradecenylsuccinicanhydride(TDSA)andtetradecenylsuccinicacid(TDSAcid).TDSAand TDSAcidemulsionsweremadeusingstarchasanemulsifierata1:3ratio.Theemulsions containing1.3%totalsolidwaschargedtothepulptomake60g/m2 hand-sheets.TheC14labelledtechniquewasusedtoquantifytheASAcomponentinthesheetsafterchloroform extraction.TheresultsshowedthatunreactedASAispredominantlyfoundinthesheet andabout25%ofASAcanproducesizingandisnotextractablewithchloroform.
Accordingtotheauthor,theretainedASAcouldbeexplainedbycovalentbondingdue tothreereasons.First,thecontinuousincreasinginsizingatroomtemperaturesuggests thereductioninmoistureallowstheASAtoreactwiththehydroxylsofcellulose.Second, theASAmolecule,whichisunderconstantreorientationduringthesizingprocess,would undergohydrolysisifatanytimethehydrophilicpartofthemoleculeisexposedto moisture.Theretainedmoleculecanbeassumedtobeheldbystrongerirreversiblebond forces.Third,theinabilityoftheASAcid(hydrolyzedformofASAinthedicarboxylicacid form)tosizehand-sheetsdemonstratesthathydrogenbondingisnotthemechanismof
ASAsizing,thuscovalentbondingmustbethemechanism.Theauthorconcludedthatthis evidencesuggeststhatunextractableASAisboundtocelluloseviacovalentbonding.In addition,accordingtotheauthor,solventsizedsheetsgavebettersizingthanconventional emulsionsizedsheetsduetotheabsenceofwaterthatinduceshydrolysis.
Nishiyamaetal.[26]usedaseriesofextraction,impregnation,andcellulasetreatment experimentstostudytheASAbondingmechanismundercommonpapermakingconditions in1996.PulpandASA-starchemulsioncontaining0.2%(4lb/ton)ASAwereusedtomake 60g/m2 hand-sheets.Chloroform,water-acetone,anddimethylsulfoxide(DMSO)were usedtoextractthehand-sheetsandcellulasewasusedtoisolatetheASAresidues.
ThemeasurementoftheextractsbygaschromatographyshowedthatnotallASAwas extractable,andtheNMRdatashowednopresenceofformedesterlinkagebetweenthe ASAandthehydroxylgroupofcellulose.WhenanoldASAemulsion,whichhasnochance toformesterlinkageswithcellulose,wasused,theextractionresultsalsoshowednotall ASAwasextractable.TheauthorsconcludedthatasmallamountofASAisphysically entangledinthecellulosenetworkwithoutformingcovalentbonds.
ImpregnationoffilterpaperswithacetonesolutionsofASA,non-reactiveASAcid, andnon-reactiveASAcidmethylesterswerealsostudied.Sizingoccurredinallcases,but noesterlinkagesbetweenASAandcellulose-OHwerefoundtoexist.
Toensurethatesterbondswerenotformedthendestroyedbythecellulaseisolation andanalyticaltechniquesemployed,thetestswererepeatedusingcellulasetreatment stableconditions.Theseconditionsensuredanyesterlinkagesbetweencellulose-OHand ASAwouldnotbecleavedduringisolationandanalysis.Thesetestswererepeatedusing sampleAwhichisASA-alum-sizedhand-sheets,sampleBwhichisASA-PAE-sizedhandsheets,andsampleCwhichisPAE-treatedhand-sheets.Theresiduesaftertheenzymatic treatmentwere1.4,0.7,and1.1%forthesamplesA,B,andC,respectively.Theanalysisof theresiduesshowedthesamplesAandBcontain10%and15%ASA,respectively.Further analysisoftheresiduesofsamplesAandBwasconducted;theFTIRdatashowedthatmost ASAcomponentsdonotformesterbondswithcellulose,andthepredominantcomponents ofASAinthesheetsAandBareintheformofASAcid.Theauthorconcludedafterthe extraction,impregnation,andcellulasetreatmentstudiesthattheASAsizingmechanism shouldnotbeexplainedbytheformationofesterlinkages.
In2000,Akira[27]studiedtheextractsofASA-sizedhand-sheetswithASAcontent of2.2mg/g.PulpandASA-starchemulsioncontaining0.2%ASAwasusedtomakethe 60g/m2 hands-sheets.Aseriesofextractionsusingwater,chloroform,1%Tween80at 20 ◦C,and1%Tween80at70 ◦Cwereperformed.Theextractedsheetswereanalyzed withpyrolysisgaschromatography–massspectrometry(GCMS).TheamountofASA retainedinthesheetwasrespectively1.7mg/g,0.6mg/g,0.3mg/g,andalmostzero forthelistedextractionconditions,respectively.Accordingtotheauthor,theextraction resultsshowedthatvirtuallynocovalentbondsbetweenASAandhydroxylgroupsof cellulosewerepresentinthehand-sheet.Theseresultsalsoindicatedthatchloroformis notasuitablesolventtocompletelyextractASAeventhoughtheASAispresentonlyby physicalinteractionswithoutformingcovalentbondwithcellulose.
Moreover,tounderstandtheefficientstateoftheASA,threetypesofhand-sheets containing0.4%(8lb/t)ASAweremadewithdifferentASAemulsions:freshemulsion, freshemulsionandpulpstirredfor3days,and3-days-oldemulsion.Onlythefresh emulsionpaperexhibitedasizingeffect.SEMdatashowedlargeflocsofASAcidinthetwo setsofsheetsmadewitheitherstirredoroldemulsion.Thesetmadewithfreshemulsion hadwelldispersedASAcontainedwithinthesheet.TheauthorconcludedthatfreshASA emulsionspreadoverthefibersurfaceandpromoteshydrophobicity.
In2002,YuandGarnier[28]concludedfromtheirworkthatASAandcelluloseare covalentlybonded.Intheexperiment,cellulosefilmwasregeneratedfromcelluloseacetate onglass.ASAvaporwasdepositedonthesubstrateinanairtightadsorptioncell,which washeatedinanovenatapresettemperatureandthenquenched.Thecontactanglewas measuredimmediately,andthemeasurementrevealedthesubstratewashydrophobic.
Accordingtotheauthors,thepresenceoftheOHgroups,thetemperaturedependence ofthereaction,thenon-decreaseinhydrophobicity(evenafterchloroformextraction), andthetimeframe(hour)ofthereactionaretypicalfortheformationofcovalentbond byesterification.
Achaetal.[29]studiedthereactionbetweenASAandwoodflourin2003.Theesterificationreactionwascarriedoutbyimmersingthewoodflourwithanaveragediameterof 57 µmin96g/L(9.6%or192lb/ton)ASAinacetonesolution;4-dimethylaminopyridine wasusedasacatalyst.Themixturewasrefluxedat56.5 ◦Cfor4h.Theproductwasdried at70 ◦Cinanovenandlaterwashedintensivelywithdistilledwatertoremoveunreacted reagentsbeforeitwasdriedagainat70 ◦Cundervacuumtoconstantweight.Theesterified productwaslatermixedwithunsaturatedpolyester(UPE)basedonbisphenolA-fumarate cross-linkedwithstyreneformolding;benzoylperoxidewasusedasaninitiator,and polymethylmethacrylatewasusedasathermoplasticmodifier.
DiffusereflectanceinfraredFouriertransformspectroscopy(DRIFTS),asaponification test,andanacidvaluetestwereusedtoanalyzequalitativelyandquantitativelythe esterifiedproducts.Theresultsshowedthatesterificationdidoccur.Theyieldwas166g ASAfor1kgtreatedwoodflour(16.6%).
In2006,Wang[30]studiedASAsizingmechanismbycomparingFT-IRspectrabetweenASA-sizedhand-sheets,synthesizedASA-cellulosecompound,hydrolyzedASA,hydrolyzedASA-sodiumsalt,hydrolyzedASA-calciumsalt,andhydrolyzedASA-aluminum salt.TheamountofASAchargedtothestudiedhand-sheetswas0.5%or10lb/toven-dried pulp.TheresultsshowednocovalentbondingbetweentheASAandthecellulose.In addition,theresultssuggestedthatthesizingmaterialfoundinASA-sizedhand-sheetwas mainlyhydrolyzedASAanditssalt.Thepaperalsodemonstratedthattosizehand-sheets directlywithhydrolyzed-ASAemulsionresultedinlowsizingdegree.Nevertheless,after dippinghydrolyzed-ASA-sizedhand-sheetsinanalumsolution,thesizingdegreecould bebroughtuptothelevelclosetoASAemulsionsizedpaper.
Hundhausenetal.[31]studiedthereactionofASAandparticleboardchipsin2010. TheobjectivewastoinvestigateifASAbondstothesurfaceofthechipstorepelwater.The chipsweredriedto1%moisturecontentandthenwerewettedwith3%or60lb/tASA (basedontheovendrywood).Thesampleswereprocessedinarotatingreactorat130 ◦C and1013mbarfor1hat12rpm.
FTIRanalysisbeforeandafterthetreatmentrevealedthatesterificationdidnotoccur andbothhydrolyzedandnon-hydrolyzedASAwerelocatedonthechipsurfaceafter curinginthereactor.Inaddition,FTIRmeasurementofthechipsafterSoxhletextraction didnotshowanyASAsignal,whichindicatedthattheASAdidnotesterifyandwas completelyremovedbythesolventduringtheextraction.
Furthermore,ASA-ethylacetateandASAdimethylsulfoxide(DMSO)solutionswere appliedtoveneers.ItturnedoutthattheASAwascompletelyremovedafterextraction whenitwasappliedinethylacetatebutnotcompletelyinDMSO;thecovalentlybound ASAcouldnotbeextracted.Theunextractableamount,ortheyieldofthereaction,isnot known.Accordingtotheauthors,theASAesterificationwithcellulosedependsonthe solventthatprovidescertainmobilityandorientationtothesizingagent.DMSOleadsto esterificationbutitshighboilingpoint(189 ◦C)anditspoormiscibilitywithASAmake itdisadvantageous.WateremulsionswouldhampertheASApenetrationintothewood; xyleneisabettercandidatebutharmfulforhumanhealth.
Masumietal.[32]usedTime-of-FlightSecondaryIonMassSpectrometry(ToF-SIMS) tostudytheASAsizingmechanismin2012.ToF-SIMSisasurface-sensitiveanalytical methodthatusesapulsedionbeamtoremovemoleculesfromtheveryoutermostsurface ofthesample.ToF-SIMScollectedonanASA-sizedpapersamplewascomparedtothe spectracollectedfromASA,ASA/watermixture,ASA/NaOHsolution,cellulose,and synthesizedASA-cellulosecompound.TheresultsindicatedthattheformofASAinASAsizedpaperwasdifferentfromthatinASA-cellulosecompound,whichdidnotsupportan esterbondinghypothesis.TheToF-SIMSfromASA/NaOHsolutionwasclosetothatfrom
ASA-sizedpaper.ThissuggestedtheASAinASA-sizedpaperwaslikelyhydrolyzedASA oritssalt.
In2015,Lietal.[33]studiedtheanchorageofASAoncellulosebydippingcellulose filmandfilterpaperinbothacetone-ASAsolutionandASAemulsion.Thecellulosefilm wasgeneratedbyimmersingcelluloseacetatefilmin0.5%sodiummethoxideinmethanol for12h.Thefilmwasrepeatedlyrinsedwithrunningdeionizedwaterandmethanol, air-dried,andstoredinadesiccator.Thefilterpaperusedwasacommercialash-free filterpaper.TheASA-acetonedippingsolutioncontained1%(20lb/ton)ofASAandthe ASAemulsion,whichalsocontained1%ASA,waspreparedbyusinglaponiteasparticle stabilizersafterbeingmodifiedbyurea,alanine,tetramethylammoniumchlorideand melamineorincombinationwithpoly-aluminumsulfate(PAS).
TheFTIRandtheXPSresultsshowedthepresenceofcovalentbondsbetweenASA andcellulose.Theauthorsconcludedthatsizingisduetotheformationoftheesterbond. TheASA-acetonesizingsolutionperformedbetterthantheASAemulsionco-stabilizedby laponiteandPASduetotheabsenceofwater,whichtendstoproducehydrolyzedASA moreeasily.Althoughtheyieldoftheesterificationisnotknown,theauthorssuggestthat theamountofextractableASAspeciesinthepaperishigherthantheamountanchored. Inaddition,laponiteandPASco-stabilizedemulsionsleadtohighsizingperformance butgreatlydependontheuseofaluminumsulfate.Accordingtotheauthor,theadded aluminumsulfatemayimprovetheretentionofASAoranchorthehydrolyzeASAto thecellulose.
Lackingeretal.[34]attemptedtoprovideproofinfavororagainstcovalentbinding ofASAtocellulosein2015.Toavoidtheinteractionofstarch,filterpaperwassoakedin acetonesolutionswithvariouslevelsofASA(blank,1,5,10,and25%)anddriedunder differentconditions(roomtemperature,drumdryerat115 ◦C,drumdryerat115 ◦C,and ovenat125 ◦C).TheCOOH-selectivefluorescentlabelingforcellulosicmaterialandthe gelpermeationchromatography(GPC)withamulti-detectorsetupforcovalentlybound sizingagentdetectionapproachwasusedtoprovideprofilesofcarboxylgroupsalong themolecularweightdistribution.Theresultshowedthatonlyabout0.5%ofthetotal ASAcovalentlybondedtocellulose.Furthermore,hand-sheetsweremadewith0.2%ASA emulsioninstarch,andthecorrelationbetweenthesmallamountofcovalentlybonded ASAandthesizingefficiencyofthesheetswerestudied.Theresultsindicatedthatthere wasnocorrelationbetweentheamountofcovalentlybondedASAandsizingefficiency. TheauthorsconcludedfromthetwosetsofexperimentsthatesterbondsbetweenASA andcellulosewereasmallfractionandwerenotaprerequisiteforsizing.
In2016,Porkert[35]workedonthelocalizationofASAinthesheetusingconfocal whitelightmicroscopyandthedyeSudanRed7B.Preliminaryexperimentsusingthin layerchromatographyandFTIRwereconductedtoensurethatthedyedoesnotaffectthe processabilityandtheperformanceofASAandASAemulsions.DyedASAdosagesof0%, 0.05%,0.1%,0.2%,0.3%,and0.4%wereappliedto100g/m2 hand-sheetsandtheshades werecorrelatedtoeachvalue.Differentsheetsweremappedtostudytherelationbetween sizeperformanceandthehomogeneityoftheASAdistributionsunderdifferentdosages andconditions.SomeoftheconditionsarereactiveASAemulsion,cationicandanionic hydrolyzedASAemulsions,ASA-Starchratio,andemulsionage.
ThestudyrevealedthattheASAsizingmechanismdependsonthedistributionofthe ASAinthesheet.ThereisadirectcorrelationbetweentheagglomerationofASAandsizing performance:themoreagglomerates,theweakerthesizing.Theapplicationofreactive ASAledtouniformdistribution,whichresultsinbettersizingperformance.Cationicand anionichydrolyzedASAshavehigheragglomeratesthuslowsizingperformance.Better sizedistributionandperformancewereobtainedatASA/starchratioof1:1forlowdosage of0.05%(1lb/ton)ASA.Concerningtheaging,thefirst20mingavethebestperformance forlowandhighdosages.
Accordingtotheauthor,thedistributionofASAsupportsthesizingmechanism basedonhomogenousmoleculardistributionandorientation.Hydrophobizationissolely
basedonthephysicaldistributionandorientationoftheASAmoleculeswithinthesheet. Inaddition,theapplicationofreactiveASAisthekeyelementtoobtainhomogenous distributionastheapplicationofthehydrolyzedASAledtoagglomerations.Furthermore, theesterificationreactionbetweenASAandcelluloseisveryunlikelytohappenduring thepapermakingprocess,andthephenomenaofsizereversion,sizereactivation,andsize migrationexcludeanysignificantextentofesterificationbutareonlyexplainablebyintraandinter-molecularmobilities.
TheobjectiveofWulz[36]in2020wastohydrophobizethesurfaceofpaperbyvapor depositionofASA,palmitoylchloride,TFAA/Ac2O(trifluoroaceticanhydride/acetic anhydride),andTFAA/Aceticacidmixturesandhexamethyldisilazane(HMDS).Unsized anduntreatedpaperswereusedfortheexperiment.Thepaperswerestoredat23 ◦Cand 50%humidityforatleast24h.ThegasphaseASAdepositionwasperformedat50 ◦C and100 ◦Cat20mbarfor2h.TheexperimentwithASAdidnotleadtohydrophobicity, howevertheexperimentwithotheradditivesledtohydrophobicityviaformationofester bonds.DuetothepoorhydrophobizationoftheASAgasphasedeposition,nofurther researchwascarriedoutwithASA,andnoFTIRdatawerecollected.
ThereisnodoubtthatASAsizespaper.However,thesizingmechanism,especially thecovalentbondformationbetweentheASAandcelluloseisadivergencepointamong scientists,researchers,andpapermakers.Thecovalentbondtheoryisoftenusedbyvendors toexplainsizingdevelopment.However,theassessmentoftheavailabledataoverthelast 60yearsshowsthattheformationofcovalentbondisinsignificantinASA-sizedpaper. HydrolyzedASAandorASAsaltsarethefundamentalelementsfoundinsizedpaper. Catalystsandororganicsolventscanbeusedtoinitiateesterification,butsuchconditions areunrealisticinpapermaking.
3.OverviewoftheASAMechanism
AsummaryoftheproposedreactionmechanismsforASAsizingsuggestthatmultiple potentialpathwaysexist.ThefirstproposedsizingmechanismisbondedASAmoleculesto celluloseviaesterification.Thoughsomeresearchusingorganicsolvent,hightemperature, orcatalystshowedtheevidenceofesterbondformation,moststudiesconductedcloseto commercialpapermakingconditionsyieldedscientificevidencesupportinghydrolyzed ASAasthemajorsizingmaterialinasizedpaper.However,thedirectapplicationof hydrolyzedASAtothepulportheapplication(coating)ofhydrolyzedASAtothepaper doesnotachievesizing.Thus,thetypeofsizingmaterialandtheuniformdistributionor structureofthesizingmaterialsignificantlycontributestosizingdevelopment[26,27,35,37].
Figure 3 showsthemainstepsoftheASAsizingprocess;theoil(ASA)isfirstemulsifiedandthenappliedtothepulp.Thepulpisdrainedandpressedtoformasheet.Sizing isdevelopedafterthesheetisdried.
Incommercialpapermills,commonASAapplicationconsistsofpreparingtheASA emulsion,whichislateraddedtothepulpatapointclosetothefanpump.Themixture ismovedtotheheadboxwheretheaverageconsistencyofthepulpisabout1%,andthe predominantcomponentiswater,notorganicsolvent.Althoughothermaterialssuch asalum,PAE(PolyamideEpichlorohydrin),GCC(GroundCalciumCarbonate),CPAM (cationicpolyacrylamide),etc.,areaddedtothefurnishdependingonthepapergrade andthepapermaker,thepredominantcomponentremainswater,andthechanceofthe formationofhydrolyzedASAishigh.Theslurryisdewateredthendriedinthedryer sectionofthemachinetodevelopsizing,i.e.,theresistancetoliquidpenetrationofthe sheet(Figure 3).

3. Scheme of ASA sizing process.
Thecommercialpapermakingprocessismorecomplexthanlaboratoryhand-sheet making,andthechanceofcovalentbondformationisevenlowerthanthealreadylow laboratoryresultsduetothefollowingreasons:
In commercial paper mills, common ASA application consists of preparing the ASA emulsion, which is later added to the pulp at a point close to the fan pump. The mixture is moved to the headbox where the average consistency of the pulp is about 1%, and the predominant component is water, not organic solvent. Although other materials such as alum, PAE (Polyamide Epichlorohydrin), GCC (Ground Calcium Carbonate), CPAM (cationic polyacrylamide), etc., are added to the furnish depending on the paper grade and the papermaker, the predominant component remains water, and the chance of the formation of hydrolyzed ASA is high. The slurry is dewatered then dried in the dryer section of the machine to develop sizing, i.e., the resistance to liquid penetration of the sheet (Figure 3).
• Laboratorywaterqualityissuperiortothatinthemill(deionizedwatervs.white water)[35,38,39].
• LaboratoryASAdosageisusuallyhigherthanthatusedinthemill,[23,30,31,33–35].
• Insomestudies,ASAisappliedinorganicsolvents(DMVPB,DMSO,acetone,toluene, chloroform,ethanol,xylene,ethylacetate )thatarenotfoundonpapermachinesto createidealizedsystems[23,30,31,33–35].
• Oneadditive(ASA)isusuallystudiedinthelaboratorytopreventtheinfluence ofothervariableswhileinrealpapermakingprocessesmanyorganics,inorganics, additivesandevenbacteriacompetewithASAtodwellwiththefiber.Inshort,there aremoreuncontrolledvariablesinfieldexperimentsthaninlabones[39,40].
The commercial papermaking process is more complex than laboratory hand-sheet making, and the chance of covalent bond formation is even lower than the already low laboratory results due to the following reasons:
• Laboratory water quality is superior to that in the mill (deionized water vs. white water) [35,38,39].
• Laboratory ASA dosage is usually higher than that used in the mill, [23,30,31,33–35].
• In some studies, ASA is applied in organic solvents (DMVPB, DMSO, acetone, toluene, chloroform, ethanol, xylene, ethyl acetate…) that are not found on paper machines to create idealized systems [23,30,31,33–35].
• One additive (ASA) is usually studied in the laboratory to prevent the influence of other variables while in real papermaking processes many organics, inorganics, additives and even bacteria compete with ASA to dwell with the fiber. In short, there are more uncontrolled variables in field experiments than in lab ones [39,40].
• Lastly, in laboratory studies, sometimes the pulp or the substrate has a special treatment not found in the mill. Such treatment can be ethanol or methanol wash of the pulp or the substrate, although it is well known that these solvents esterify with ASA, and their leftovers in the pulp can mislead the interpretation of FTIR results [23,26,33,41,42].
• Lastly,inlaboratorystudies,sometimesthepulporthesubstratehasaspecialtreatmentnotfoundinthemill.Suchtreatmentcanbeethanolormethanolwashofthepulp orthesubstrate,althoughitiswellknownthatthesesolventsesterifywithASA,and theirleftoversinthepulpcanmisleadtheinterpretationofFTIRresults[23,26,33,41,42]. Thecovalentbondtheorywasnotbelievedordevelopedoraffirmedbytheinventors WurzburgandMazzarellaintheavailablepatentdocument[1].Itisassumedthatifa strongcatalyst,aspecialcondition,oranaidthatpromotescovalentbondingbetweenthe ASAandthecelluloseisaddedtotheprocessinthepapermill,itmightbepossibleto formcovalentbondsbetweenASAandcellulose.Someofthesecatalystsaretriethylamine, methanesulfonic,sulfuricacid,and4-dimethylaminopyridine[23,26,29,43].Asofnow,such aidsaremissinginpapermillsandtheamountofcovalentbondbetweenASAandcellulose isverylow.Covalentbondingisnotaprerequisiteanddoesnotplayamajorroleinthe sizing.Inaddition,thecontactbetweenASAandstarchinarealpapermakingprocessis farmoreintimateandextensivethanthecontactwithcellulose[26,34,44].The“nebule”of starchthatvehiculatesASAonthepapermachinewilleventuallybreakandreleasethe additive.Assumingstarchdoesnotevaporateaftertheburst,whichisrealistic,another selectivitymechanismwillbeneededtoexplainthereasonwhyASAchoosestobond withcelluloseinsteadofstarch,whichisinclosercontactfortheassumedesterification reaction.Furthermore,evenifpapermillsstartusingstrongcatalystsorsolventsora specialconditionforASAcelluloseesterification,carefulchoiceofthesematerialsneeds tobemadewithrespecttothereactionselectivity,soASA“droplets”envelopedinstarch (emulsion)donotreactwiththestarchitselforlignin(coniferylalcoholandsinapylalcohol)
The covalent bond theory was not believed or developed or affirmed by the inventors Wurzburg and Mazzarella in the available patent document [1]. It is assumed that if a strong catalyst, a special condition, or an aid that promotes covalent bonding between the ASA and the cellulose is added to the process in the paper mill, it might be possible to
Figure
Figure3. SchemeofASAsizingprocess.
orotheradditivesorresidualwoodextractives(fattyalcohols)inthepulp[45–48]but mainlywithcelluloseandhemicellulose.
Aftercarefulreviewofthepastresearcheffortsbothsupportingandrefutingester bondingofASAtocellulose,itisbelievedthat,underroutinepapermakingconditions,the esterificationlevelisalmostnullinthepapermakingprocess.Futureresearcheffortsneed tofindaidssuchasharmlesscatalystsorsolventsthatpromotebetteryieldofesterification, especiallyinwaterandoncommercialpapermachines.Higheresterificationyieldshould bebeneficialforthepapersizingprocess.Webelievehighyieldcovalentbondingequates tostrongchemicalbonds,whichwillreducecertainamountsofsizereversiondueto migration,re-orientation,orfugitiveASAmolecules.
4.ChemistryConsiderationsforBetterASASizingApplication
Sizingperformanceisafunctionofsizedistribution,retention,anddevelopment.For anASAsizingprogram,thoughtherewasdebateonthesizingdevelopmentmechanism,a fewresearchersagreedthatbetterASAemulsionstabilityandhigherretentionimproves sizingresults[27,30,37,49–51].SomechemistryconsiderationsforbetterASAstabilityand retentionareprovidedherein.
• EmulsionStability(betterdistribution)
ASAemulsionismadefromASA(oil)andanemulsifiersuchascationicstarchor polymerinwater.Typically,concentratedemulsifierisfirstdilutedwithprocesswaterto atargetedlowconcentration.Then,ASAoilisintroducedtomaketheemulsioninhigh shearequipment.Whencationicstarchisusedasanemulsifier,themostefficientsize responseisobtainedwhenthemassofthestarchisupto6timesthemassoftheASA;this rangeobviouslydependsonthepapergradethatisbeingmadeandotheradditivesthat arebeingused.Ingeneral,itisrecommendedtokeepthemassratioofthecationicstarch toASAat4:1andtheparticlesizeabout1 µm[12,35,44,52,53].
pHandtemperatureoftheprocesswatercanaffectthestabilityofASAemulsion. ItisknownthatASAishydrolyzedrapidlyatalkalinewaterpH.ThehydrolyzedASA hasbeendemonstratedtoagglomerate,leadingtoinefficientdistributionofthesizing agent[26,30].Therefore,maintainingtheprocesswaterpHatneutraloraslightlyacidic rangecanensurestableemulsionparticlesizeandbetterdistribution.Alum,citricacid,and adipicacidaregenerallyusedtoadjustpH[12,14,53–55].Highertemperaturegenerally accelerateschemicalreactions,includingASAhydrolysis.Ifthemachinetemperatureis high,itisbettertoaddASAemulsionclosetotheheadboxtominimizecontacttime.In addition,amillusingon-sitecookedstarchasanemulsifiershouldpayattentiontothe starchtemperaturegoingtotheASAemulsionprocess.Theoptimaltemperatureforthe emulsificationprocessshouldbedeterminedforbettersizingresponse[2,50,56].
Conductivityisanotherimportantwaterparametertoconsiderforemulsion(colloidal) stability.Highconductivity,duetohighelectrolyteconcentration,collapsesthestarchor thepolymerchaininaqueoussolutionandleadstounstableemulsion,whichinturnleads topoorsizedistribution[57,58].Theimpactoftheionicstrengthoftheprocesswateron theemulsifiercanhappenatdifferentlocationssuchastheemulsifierdilutionpointor theASAemulsiondilutionpoint(pushwater).Forexample,ifgroundwaterisusedfor emulsifierdilution,dependingonmilllocation,highhardness(Ca2+ orMg2+)orsalinity mayimpairtheemulsifier.Pulpingsodacarryoverisatypicalionsourceforavirgin machine.Recyclemachinesmayexperienceunexpectedconductivityshockduetosalt comingwithrecycledmaterial.
• EmulsionShelfLife
TheshelflifeofASAemulsionisanotherimportantfactortocontrolaftertheASAemulsifierratio,pH,temperature,conductivity,shear,andotherwaterqualityparameters areintheirappropriateranges.Ingeneral,theemulsionisusedassoonaspossible,or lessthananhourafteritisformed,topreventthehydrolysisofASA.Severalstudies haveshownthat20to30ministhebestshelflifeofanASA-starchemulsion[6,9,35,59,60].
Theemulsionstartsforminglargeaggregatesafter30minandbecomeshydrophilic;the hydrolysisofASAacceleratesandtheuseofsuchemulsionformsagglomeratesonthe papersurface,whichleadtoinefficientsizing.Knowingtheshelflifealsogivestheability toestimatehowfarfromtheheadboxtheemulsionmustbeinjectedintothepulpforbetter sizingperformance.
ASAsizingcertainlyreducesthepapertendencytoabsorbliquid;however,theshort shelflifeoftheASAemulsionisoneofitsapplicationdrawbacks.Therearesomenovel chemistriestostabilizeandextendtheemulsionshelflife.Anionicpolyacrylamide(APAM), maleatedsunfloweroilhigholeic(MSOHO),urea,combinationoflaponiteandpolyaluminumsulfate(PAS),combinationofchitosanandmontmorillonite,ethyloleatesuccinic anhydride(EOSA),methyloleate-succinicanhydride(MOSA)andlauricarginate/cellulose nanocrystalnanorods(LAE/CNC)canextendtheemulsionshelflifefromseveralhours uptoaday.Moreinformationisneededonlargescaleavailabilityforindustrialuse oftheseproducts,theirenvironmentalimpacts,andsideeffectsonthepapermaking process[9,60–66].
ThedecreaseinsizingperformanceversustheageofASAemulsionisknown[67] buthowthechangeintheASA-emulsifierratio,pH,temperature,conductivity,andshear oftheemulsionindividuallyorcollectivelyaffectstheagingprocessisnotknown.More workneedstobedonetounderstandkeyfactorsandatwhatproportiontheyinfluencethe rapidageingortheshortlifeofanASAemulsion.
• EmulsionRetention
TheretentionofASAemulsionwasreportedmainlybasedonchargeattractionmechanismbetweenanioniccellulose,amphotericASAemulsionparticles,cationicpolymers, andcationicaluminumcompounds.TheASAmoleculeandthefibersurfacearenegatively chargedwhile,attheproperpH,thealuminumspeciessuppliedbythealumandPACare positivelycharged.Inaddition,theuseofalumorPACputsmorecationicchargeonthe ASAemulsion,whichiseasilyretainedontheanionicfibersurface.Thesetwoadditives improvethesizingduetohigherretention,betteranchoring,andalignmentofASAtothe fiber[52,68,69].
Whenproperlyusedinpapermaking,alumimprovesretention,drainage,neutralizes anionics,controlspH,andimprovesrunnability.PACandsodiumaluminatearealso usedassourcesofaluminumions.PACisknowntosizeathigherpH,improvesizing efficiency,controlpitch,reduceoreliminatebariumsulfate(BaSO4)deposits,whilesodium aluminateisknowntosizeathigherpHwithlesscorrosion,andincreasesretentionand paperstrength.AlumandPACarecommonlyusedforASAapplications;inaddition,alum issuitableforacidicpapermaking,whilePACcanbeusedinneutraloralkalinepaper making[70–73].
Alumwasfirstusedinpapersizingincombinationwithrosinin1807byMoritz FriedrichIllig.ThechemicalwaslaterusedinAKDandASAsizingapplications.Alum isknowntoformabridgebetweencelluloseandthesizingagentdependingonthepH andthespeciesofthealuminumionsavailable.AsshowninFigure 4,alumgenerallywill existinoneofthreedominantspecies:Al3+ (pHlessthan4.3),Al8(OH)20 4+ (pH4.3–5.0), orAl(OH)3 (pH5.0–8.0).TheadsorptionofthealuminumionsAl3+ tothefiberoccursat lowpHandunderstandingthepHregionsofalumisparamountforASAadditionand retention[8,57,74,75].
Polymers 2023, 15,2876
the species of the aluminum ions available. As shown in Figure 4, alum generally will exist in one of three dominant species: Al3+ (pH less than 4.3), Al8(OH)204+ (pH 4.3–5.0), Al(OH)3 (pH 5.0–8.0). The adsorption of the aluminum ions Al3+ to the fiber occurs at low pH and understanding the pH regions of alum is paramount for ASA addition and retention [8,57,74,75].

Figure 4. Distribution of Hydrolyzed Aluminum (III) as a Function of pH. Al (III) = 1.0 × 10 3 M, h (Adopted from Rubin and Hayden [76]).
Figure4. DistributionofHydrolyzedAluminum(III)asaFunctionofpH.Al(III)=1.0 × 10 3 M,24 h(AdoptedfromRubinandHayden[76]).
ASAsalt,mainlyaluminum-ASAsalt,isoneofthepredominantformsofASAfound inthesheetbesidethehydrolyzedASA.Theuseofalumenablestheformationofthenontackyaluminumsaltwhichispreferredoverthestickycalcium-ormagnesium-ASAsalt. Inaddition,theuseofalumcontrolsthedepositofhydrolyzedASA,andthealuminum saltofthehydrolyzedASAmayinteractwiththeanionicchargesoncellulosetoimprove sizing.Furthermore,theapplicationofalumcananchorfreehydrolyzedASAtothefiberas ametalsalttoreduce,todelay,ortoreversesizereversionduetomigration,reorientation orfugitivity[26,52,67,75].
ASA salt, mainly aluminum-ASA salt, is one of the predominant forms of ASA found in the sheet beside the hydrolyzed ASA. The use of alum enables the formation of the nontacky aluminum salt which is preferred over the sticky calcium- or magnesium-ASA salt. In addition, the use of alum controls the deposit of hydrolyzed ASA, and the aluminum salt of the hydrolyzed ASA may interact with the anionic charges on cellulose to improve sizing. Furthermore, the application of alum can anchor free hydrolyzed ASA to the fiber as a metal salt to reduce, to delay, or to reverse size reversion due to migration, reorientation or fugitivity [26,52,67,75].
ThedosageofalumorPACiscriticalasitcanimproveorimpairthepapermaking processandpaperproperties.Itisreportedthat0.5%alumbasedondrypulpisgenerally sufficient[75].However,apreliminaryalumorPACapplicationoptimizationstudywillbe idealforeachpapermilltodeterminethedosage,injectionlocation,andthesizingefficiency. Anexcessiveuseofalumcanleadtodepositsonthepapermachine,lossofsizing,and lossofsheetstrength.Alum,PAC,orsodiumaluminatedepositsrequiredowntimefor cleanup;analysishasshownthatthesedepositsaremainlyaluminumhydroxide[Al(OH)3] andcomplexaluminumhydroxides[Alx(OH)y(SO4)nH2O,Alx(OH)yCl2nH2O],whichcan befoundontheprimaryscreens,machinechest,headbox,blades,andvacuumbox[73]. Inaddition,excessiveuseofalumhaslittleeffectonsizingatlowconcentrationsbut decreasedsizingathigherconcentrations.Theoveruseofalumhasadegradativeeffecton paperasitbecomesmoreacidicandundergoesacidhydrolysisthatcausescellulosechain scissionresultinginthelossofpaperstrength[8,52,68,70].
Finally,excessiveuseofdefoamerandcertainbiocideshasanadverseeffectonsizing performance.Itisknowntheexcessiveapplicationofdefoamer,especiallyatthewet end,destroyssizing[58,77,78],butitisnotwellunderstoodifthedefoamerorthebiocide preventsASAfromanchoringtocelluloseorifthesechemicalsjustattackandruinthesizing agent.Quaternaryammoniumsaltbiocideisknowntocauseadverseeffectsonsizing
The dosage of alum or PAC is critical as it can improve or impair the papermaking process and paper properties. It is reported that 0.5% alum based on dry pulp is generally sufficient [75]. However, a preliminary alum or PAC application optimization study will be ideal for each paper mill to determine the dosage, injection location, and the sizing efficiency. An excessive use of alum can lead to deposits on the paper machine, loss sizing, and loss of sheet strength. Alum, PAC, or sodium aluminate deposits require downtime for cleanup; analysis has shown that these deposits are mainly aluminum hydroxide [Al(OH)3] and complex aluminum hydroxides [Alx(OH)y(SO4)nH2 Alx(OH)yCl2nH2O], which can be found on the primary screens, machine chest, headbox, blades, and vacuum box [73]. In addition, excessive use of alum has little effect on sizing at low concentrations but decreased sizing at higher concentrations. The overuse of alum has a degradative effect on paper as it becomes more acidic and undergoes acid hydrolysis that causes cellulose chain scission resulting in the loss of paper strength [8,52,68,70]. Finally, excessive use of defoamer and certain biocides has an adverse effect on sizing performance. It is known the excessive application of defoamer, especially at the wet end,
whileorganosulfurandisothiazolinehasalmostnoeffectonsizingperformance.More investigationsareneededtodeterminethemechanismbywhichdefoamersorbiocides negativelyaffectASA.
5.Conclusions
Severalexperiment-resultpapersandpatentsabouttheASAapplicationwerereviewedfrom1963to2020.
• ItwasbelievedthatASAformedcovalentbondingwithcelluloseduringthepapermakingprocess.Nevertheless,mostrecentscientificevidencesupportsthatthemajor sizingmaterialinasizedpaperishydrolyzedASAanditssalts.
• TheamountofcovalentbondsbetweenASAandthefiberisverylowandisnota requirementtosizingdevelopment.
• HydrolyzedASAcontributestothesizingperformance;however,thedirectapplicationofhydrolyzedASAtothepulportheapplicationofhydrolyzedASAtothesheet leadstoflocculationanddoesnotachievesizing.
• ThepH,temperature,conductivity,andtheASA-emulsifierratioarecriticalforASA emulsionstability.
• AlumorPAC,whenproperlyusedimprovesizingperformance.
• TheshelflifeoftheASAemulsionisabout20to30min.Moreworkisneededto understandhowthechangeinASAconcentration,ASA-starchratio,temperature,and pHindividuallyorcollectivelyaffectstheageingprocess.
• TheuseofnovelchemistriestostabilizeorextendASAemulsionshelflifeshould beinvestigatedforlargescaleavailability,healthandenvironmentalimpacts,and repercussionsonthepapermakingprocess.
AuthorContributions: Writing—originaldraftpreparation,Y.N.andL.X.;writing—reviewand editing,Y.N.,L.X.,S.B.,Y.J.,andP.W.H.;supervision,P.W.H.andY.J.;projectadministration,P.W.H.; fundingacquisition,Y.J.Allauthorshavereadandagreedtothepublishedversionofthemanuscript.
Funding: ThisresearchwassupportedbyWestRock.Thepublicationcostwasprovidedbythe ChemicalEngineeringDepartmentoftheUniversityofNorthDakota.
DataAvailabilityStatement: Nonewdatawerecreatedoranalyzedinthisstudy.Datasharingis notapplicabletothisarticle.
Acknowledgments: TheauthorswanttothankNicholeKilgore,DataScientistatWestRock,forher constanthelpinprovidingneededarticlesforthisreviewpaper.
ConflictsofInterest: Theauthorsdeclarenoconflictofinterest.
References
1. Wurzburg,O.B.;Mazzarella,E.D.NovelPaperSizingProcess.U.S.PatentNo.3,102,064,27August1963.
2. Lindfors,J. AdhesionofReactiveSizesandPaperMachineFouling;HelsinkiUniversityofTechnology:Helsinki,Finland,2007; ISBN9789512290161.
3. Sridach,W.;Paladsongkhram,R.ImprovementofHardwoodKraftPaperwithNarrow-LeavedCattailFiber,CationicStarchand ASA. Cellul.Chem.Technol. 2014, 48,375–383.
4. Xu,L.;Myers,J.;Hart,P.HowtoUseAlumwithCationicDispersedRosinSize. TappiJ. 2016, 15,331–335.[CrossRef]
5. Lapp,G.SizeItUp—InternalSizingChemicals.Availableonline: https://thefiberwire.com/2015/07/07/size-it-up-internalsizing-chemicals/ (accessedon21February2023).
6. Kumar,A.;Bhardwaj,N.K.;Singh,S.P.SizingPerformanceofAlkenylSuccinicAnhydride(ASA)EmulsionStabilizedby PolyvinylamineMacromolecules. ColloidsSurf.APhys.Eng.Asp. 2018, 539,132–139.[CrossRef]
7. Martorana,E.;Hoffmann,J.;Kleemann,S.Post-CuringandSizeReversion-AnExtendedMechanismofASASizing. Int.Munich Pap.Symp. 2011, 30,19.
8. Bruckle,I.TheRoleofAluminHistoricalPapermaking. AbbeyNewsl. 1993, 17,4.
9. Kumar,A.;Bhardwaj,N.K.;Singh,S.P.PolyacrylamideStabilizedAlkenylSuccinicAnhydrideEmulsionasSizingAgentfor VariousCellulosicPulpsandFillers. Carbohydr.Polym. 2020, 236,116069.[CrossRef]
10. Wang,H.;Sun,J.;Zhao,Y.;Zhang,Z.;Cheng,S.JanusParticlesStabilizedAlkenylSuccinicAnhydrideEmulsionasInternal SizingAgent. Cellulose 2022, 29,6361–6372.[CrossRef]
2023, 15,2876
11. Gess,J.M.DominicSRendeAlkenylSuccinicAnhydride(ASA). TappiJ. 2005, 4,25–30.
12. Merisalo,J.-P. OptimizationofASAEmulsificationinInternalSizingofPaperandBoard;HelsinkiUniversityofTechnology:Helsinki, Finland,2009.
13. Hubbe,M.A.Paper’sResistancetoWetting—AReviewofInternalSizingChemicalsandTheirEffects. Bioresources 2007, 2, 106–145.[CrossRef]
14. Seppanen,R.OntheInternalSizingMechanismsofPaperwithAKDandASARelatedtoSurfaceChemistry,Wettabilityand Friction.Ph.D.Dissertation,RoyalInstituteofTechnology,Stockholm,Sweden,2007.
15. Novak,R.DominicRendeSizeReversioninAlkalinePapermaking. TappiJ. 1993, 76,117–120.
16. Hubbe,M.A.Pulping:ChemicalAdditives.In EncyclopediaofForestSciences;AcademicPress:Cambridge,MA,USA,2004; pp.933–939.
17. Farley,C.E.;Wasser,R.B. SizingwithAlkenylSuccinicAnhydride,2nded.;Reynolds,W.F.,Ed.;TAPPIPress:Atlanta,GA, USA,1989.
18. Nurminen,M.MariNiinikoskiStockSizeforPaperorBoardManufacture,MethodPreparationofSize,UseofSize.U.S.Patent No.6,939,441,6September2005.
19. Lackinger,E.NovelASA-SubstitutesinPaperSizingBasedonRenewableRawMaterials.Ph.D.Thesis,UniversitätFür BodenkulturWien,Vienna,Austria,2011.
20. Berls,R.TreatmentofFabricwithAlkenylsuccinicAcidsandAnhydridestoImpartWaterRepellency.U.S.PatentNo.2,903,382, 8September1959.
21. Fluck,L.A.;Pluckemin;Logan,A.L.Water-RepellentTreatmentforHydrophobicTextileMaterials.U.S.PatentNo.2,759,851, 21August1956.
22. Cuculo,J.A.Pad-BakeReactionsPartI:ANewPad-BakeReactionofCelluloseandAqueousSolutionofAmicAcids. Text.Res.J. 1971, 41,321–326.[CrossRef]
23. McCarthy,W.R.;Stratton,R.A.EffectofDryingonASAEsterificationandSizing. TappiJ. 1986, 70,117–121.
24. McCarthy,W.R.AnInvestigationoftheMechanismofAlkalineSizingwithAlkenylSuccinicAnhydride.Ph.D.Thesis,The InstituteofPaperScienceandTechnology,Atlanta,GA,USA,1987.
25. WanDaud,W.R.TheMechanismofAlkenylSuccinicAnhydrideSizing.Ph.D.Dissertation,UniversityofManchesterInstituteof ScienceandTechnology,Manchester,UK,1988.
26. Nishiyama,M.;Isogai,A.;Onabe,F.StructuresofAlkenylSuccinicAnhydride(ASA)ComponentsinASA-SizedPapersheet. Sen’iGakkaishi 1996, 52,180–188.[CrossRef]
27. Isogai,A.TheReasonWhytheReactiveChemicalStructureofAlkenylSuccinicAnhydrideIsNecessaryforEfficientPaper Sizing. Sen’iGakkaishi 2000, 56,334–339.[CrossRef]
28. Yu,L.;Garnier,G.TheRoleofVapourDepositionDuringInternalSizing:AComparativeStudyBetweenASAandAKD. J.Pulp Pap.Sci. 2002, 28,327–331.
29. Acha,B.A.;Aranguren,M.I.;Marcovich,N.E.;Reboredo,M.M.CompositesfromPMMAModifiedThermosetsandChemically TreatedWoodflour. Polym.Eng.Sci. 2003, 43,999–1010.[CrossRef]
30. Wang,D.Q.;Hu,K.T.;Song,S.Y.ChemicalChangeofASAinSizingProcess. ChinaPulpPap. 2006, 25,12–16.
31. Hundhausen,U.;Militz,H.;Mai,C.TreatmentofParticleboardChipswithAlkenylSuccinicAnhydride. WoodRes. 2010, 55, 25–38.
32. Masumi,T.;Matsusita,Y.;Imai,T.;Fukushima,K.AnalysisofAdsorptionBehaviorofChemicalsforPapermakingwithToFSIMS-StudyofAdsorptionBehaviorofAlkenylSuccinicAnhydride(ASA).InProceedingsoftheProceedingsofPulpandPaper ResearchConference-JapanTAPPI,Tokyo,Japan,19–20June2012.
33. Li,H.;Liu,W.;Yu,D.;Song,Z.AnchorageofASAonCelluloseFibersinSizingDevelopment. Nord.PulpPap.Res.J. 2015, 30, 626–633.[CrossRef]
34. Lackinger,E.;Hettegger,H.;Schwaiger,L.;Zweckmair,T.;Sartori,J.;Potthast,A.;Rosenau,T.NovelPaperSizingAgentsBased onRenewables.Part8:OntheBindingBehaviorofReactiveSizingAgents—TheQuestionofCovalentversusAdsorptiveBinding. Cellulose 2016, 23,823–836.[CrossRef]
35. Porkert,S.Physico-ChemicalProcessesduringReactivePaperSizingwithAlkenylSuccinicAnhydride(ASA).Ph.D.Thesis, TechnischeUniversitätDresden,Dresden,Austria,2016.
36. Wulz,P.GasPhaseHydrophobizationofPaper‘ChangingtheContactAngleWithoutChangingOtherPaperProperties.Master’s Thesis,UniversityofTechnologyGraz,Graz,Austria,2020.
37. Matsushima,K.;Takaoka,M.;Zako,H.;Sakamoto,Y.MechanismofSizingBehaviorofASA. J.-Stage 2003, 57,36–43.[CrossRef]
38. Chiellini,C.;Iannelli,R.;Lena,R.;Gullo,M.;Petroni,G.BacterialCommunityCharacterizationinPaperMillWhiteWater. Bioresources 2014, 9,2541–2559.[CrossRef]
39. Hubbe,M.WaterandPapermaking2.WhiteWaterComponents. Pap.Technol. 2007, 48,31–40.
40. Eckel,C.;Londono,N.C.HowtoTameLab-in-the-FieldExperiments.In AdvancesinExperimentalPoliticalScience;Cambridge UniversityPress:Cambridge,UK,2021.
41. Mobley,B.W.;AYER,S.K.;Adkins,T.E.;Boone,S.R.;Fotie,J.HighlyHydrophobicN-AlkylmaleimideandSuccinicAnhydride DerivativesofAnthraceneasPotentialSizingAgentsforthePaperIndustry. Cellul.Chem.Technol. 2018, 52,299–310.
2023, 15,2876
42. Berner,E.;Kjennerud,U.;Strid,L.;Mellander,O.;Trætteberg,M.MethanolysisofSuccinicAnhydrideandSomeSubstituted SuccinicAnhydrides. ActaChem.Scand. 1963, 17,2669–2673.[CrossRef]
43. Marcovich,N.E.;Reboredo,M.M.;Aranguren,M.I.LignocellulosicMaterialsandUnsaturatedPolyesterMatrixComposites: InterfacialModifications. Compos.Interfaces 2005, 12,3–24.[CrossRef]
44. deClerck,P.AlkalineSizing—HaveWeGotItWrong? Bioresources 2020, 15,4636.[CrossRef]
45. Lehr,M.;Miltner,M.;Friedl,A.RemovalofWoodExtractivesasPulp(Pre-)Treatment:ATechnologicalReview. SNAppl.Sci. 2021, 3,886.[CrossRef]
46. Kilulya,K.F.;Msagati,T.;Mamba,B.B.;Ngila,J.C.;Bush,T.DeterminationofLipophilicExtractivesinIonicLiquidExtractsof EucalyptusPulpbyGasChromatography—MassSpectrometry. Tanz.J.Sci. 2012, 38,14–26.
47. Gutiérrez,A.;Rencoret,J.;Ibarra,D.;Molina,S.;Camarero,S.;Romero,J.;delRío,J.C.;Martínez,A.T.RemovalofLipophilic ExtractivesfromPaperPulpbyLaccaseandLignin-DerivedPhenolsasNaturalMediators. Env.Sci.Technol. 2007, 41,4124–4129. [CrossRef]
48. Garoff,N.;Jernberg,S.;Nilvebrant,N.-O.;Fellers,C.;Bäckström,M.TheInfluenceofWoodExtractivesonPaper-to-PaperFriction. Nord.PulpPap.Res.J. 1999, 14,320–329.[CrossRef]
49. Martorana,E.;Fischer,S.;Kleemann,S.NewFindingsforInteractionsandMechanismsinPaperSizingwithASAandAKD.In ProceedingsoftheInternationalesMünchnerPapierSymposium,Munich,Germany,10–12March2010.
50. Martorana,E.;Belle,J.;Kleemann,S.ASAOptimisation—ControlofParticleSize,StabilityandHydrolysis. Prof.Papermak. 2008, 5,34–42.
51. Awate,B.P.;Girish,K.;Samiran,C.;Ganesh,B.;Raut,K.B.;Arora,S.S.AlkalineSizingforFinePaper:AnExperience. IPPTAJ. 2007, 19,137–142.
52. Chen,Q.;Ni,Y.;He,Z.SubstitutionofHigh-Yield-PulpforHardwoodBleachedKraftPulpinPaperProductionanditsEffecton AlkenylSuccinicAnhydrideSizing. Bioresources 2012, 7,1462–1473.[CrossRef]
53. Bajpai,P.K.;Sharma,A.K.;Das,S.;Varadhan,R.OptimizationofASAEmulsionandImpactofFilleronASASizing. IPPTAJ. 2008, 20,93.
54. Sevico,S.AKindofASASizingAgentEmulsionandPreparationMethodThereof.PatentCN109989293A,4January2022.
55. Oyj,K.MethodstoEnhanceAlkenylSuccinicAnhydrideSizingonPaper.PatentWO2019002686A1,3January2019.
56. Choudhury,K.C.;Ajay,G.AShiftfromNeutralSizingtoASASizing:CaseStudyatBallarpurIndustriesLtd;Unit-Sewa. IPPTAJ. 2008, 20,105–112.
57. Xu,L.;Pruszynski,P.E.;Hart,P.W.EffectofConductivityonPaperandBoardMachinePerformance—AReviewandNew Experiences. TappiJ. 2017, 16,567–579.[CrossRef]
58. Hunter,C.R.;Proverb,R.J.;Komarowska,K.;OToole,M.P.;Dilts,K.C.;Garro,G.M.;Pawlowska,L.M.TotalSizingattheSize Press.InProceedingsoftheTAPPI2004,Atlanta,GA,USA,3–5May2004;pp.19–42.
59. Dogan,D.Ö.OptimizationofASAEmulsificationinInternalSizingofPaperandPaperboard.Master’sThesis,BursaTechnical University,Bursa,Turkey,2019.
60. Lackinger,E.;Isogai,A.;Schmid,L.;Sartori,J.;Potthast,A.;Rosenau,T.NovelPaperSizingAgentsfromRenewables.Part3: EmulsionStabilityandHydrolysisBehaviorComparedtoConventionalSizes. Holzforschung 2011, 65,21–27.[CrossRef]
61. Qian,K.;Liu,W.;Zhang,J.;Li,H.;Wang,H.;Wang,Z.UsingUreatoImproveStability,SizingPerformanceandHydrolysis ResistanceofASAEmulsionStabilizedbyLaponite. ColloidsSurf.APhys.Eng.Asp. 2013, 421,125–134.[CrossRef]
62. Li,H.;Liu,W.;Zhang,W.;Qian,K.;Wang,H.LaponiteandPASCostabilizedASAEmulsionwithHighHydrolysisResistance andSizingEfficiency. J.Appl.Polym.Sci. 2013, 129,3209–3218.[CrossRef]
63. Lu,P.;Liu,W.;Wang,H.;Wang,Z.UsingChitosanasSizingPromoterofASAEmulsionStabilizedbyMontmorillonite. Bioresources 2013, 8,4923–4936.[CrossRef]
64. Isogai,A.;Morimoto,S.SizingPerformanceandHydrolysisResistanceofAlkylOleateSuccinicAnhydrides. TappiJ. 2004, 3,8–12.
65. Aboul-Fetouh,M.;Nassar,F.;Tantawy,A.AlkylOleateSuccinicAnhydrideasaNewModificationofInternalPaperSizingAgent. Al-AzharBull.Sci. 2010, 21,287–294.[CrossRef]
66. Li,Y.;Yu,D.;Wang,X.;Wang,Q.;Zhang,Z.;Liu,W.LauricArginate/CelluloseNanocrystalNanorods-StabilizedAlkenylSuccinic AnhydridePickeringEmulsion:EnhancementofStabilizationandPaperSizingPerformance. Cellulose 2022, 29,3253–3269. [CrossRef]
67. Johnston,J.W.;Hagiopol,C. ChemistryofModernPapermaking;CRCPress:BocaRaton,FL,USA,2012.
68. Rao,S.T.;Shibhare,P.;Das,A.AlkalineSizingASAWithPCC:OurExperience. IPPTAJ. 2008, 20,85–88.
69. Isogai,A.;Nishiyama,M.;Onabe,F.MechanismofRetentionofAlkenylSuccinicAnhydride(ASA)onPulpFibersatWet-Endof Papermaking. Gakkaishi 1996, 52,195–201.[CrossRef]
70. Potter,F.S.TheAnalysisandChemistryofAluminumBasedPaperMachineDeposits.InProceedingsoftheTAPPIProceedingsPapermakersConference,Philadelphia,PA,USA,24–27March1996;pp.315–324.
71. Bajpai,P.RefiningandPulpCharacterization.In Biermann’sHandbookofPulpandPaper;Elsevier:Amsterdam,TheNetherlands, 2018;pp.1–34.[CrossRef]
72. Thorn,I.;Au,C.O. ApplicationsofWet-EndPaperChemistry,2nded.;Springer:Berlin/Heidelberg,Germany,2009.
73. John,S.AlkalineandNeutralSizing:LatestTrendsandSelectionofSpecialtyChemicalstoMakeFineQualityPaperCost Effectively. IPPTAJ. 2007, 19,129–131.
2023, 15,2876
74. Meaker,D.W.MachineFactorsInfluencingSizing(andViceVersa). TappiJ. 1984, 67,102–106.
75. Bergvall,N.OptimizingtheCostEfficiencyforInternalSizingKraftlinerPaperGrades.UMEAUniversity:Umea,Sweden,2013.
76. Rubin,A.J.;Hayden,P.L. StudiesontheHydrolysisandPrecipitationofAluminum(III);WaterResourcesCenter-TheOhioState University:Columbus,OH,USA,1973.
77. Patra,M.K.;Chandra,M.K.;Bhuyan,B.K.AlkalineSizing&OurMills’Experience. IPPTAJ. 2007, 19,97–104.
78. Huber,P.;Carre,B.;Zeno,E.TheEffectofSeveralNon-OxidizingBiocidesonFinePaperWet-EndChemistry. Bioresources 2010, 5, 1675–1688.
Disclaimer/Publisher’sNote: Thestatements,opinionsanddatacontainedinallpublicationsaresolelythoseoftheindividual author(s)andcontributor(s)andnotofMDPIand/ortheeditor(s).MDPIand/ortheeditor(s)disclaimresponsibilityforanyinjuryto peopleorpropertyresultingfromanyideas,methods,instructionsorproductsreferredtointhecontent.
PAPERmaking!
FROM THE PUBLISHERS OF PAPER
Volume10, Number2,2024
CO2 Emissions Accounting and Carbon Peak Prediction of China’s Papermaking Industry
JIAMENG YANG1, YUCHEN HUA1, JIARONG YE1, SHIYING XU1 & ZHIYONG (JOHN) LIU2
China has been the world’s largest producer and consumer of paper products. In the context of the “carbon peaking and carbon neutrality goals”, China’s papermaking industry which is traditionally a high energyconsuming and high-emissions industry, desperately needs a nationally appropriate low-carbon development path. From the consumption-side perspective, this paper calculates the CO2 emissions of China’s papermaking industry from 2000 to 2019 by using carbon emission nuclear algorithm, grain-straw ratio, firstorder attenuation method, and STIRFDT decomposition model, etc., to further explore the core stages and basic patterns affecting the industry’s carbon peaking. The results show that the total CO2 emissions of China’s papermaking industry showed an upward trend from 2000–2013, stable from 2013–2017, and a steady but slight decline from 2017–2019. Meanwhile, the total CO2 emissions of the full life cycle of paper products in China have decreased to a certain extent in the raw material acquisition, pulp, and paper making and shipping stages, with only the waste paper disposal stage showing a particular upward trend. We find that from 2000 to 2019, China’s CO2 emissions in the pulping and papermaking stage of paper products accounted for 68% of the total emissions in the whole life cycle, of which 59% was caused by coal consumption. Moreover, the scenario prediction shows that improving the energy structure and increasing the waste paper recovery rate can reduce the CO2 emissions of the industry, and it is more significant when both work. Based on this and the four core stages of CO2 emissions of the papermaking industry we proposed ways to promote CO2 emissions peaking of China’s paper products.
Contact information:
1 College of Economics and Management, Nanjing Forestry University, Nanjing 210037, China.
2 Networks Financial Institute, Donald W. Scott College of Business, Indiana State University, 30 N 7th St., Terre Haute, IN 47809, USA
Forests 2022, 13, 1856. https://doi.org/10.3390/f13111856
This is an open access article under the CC BY-licence 4.0
The Paper Industry Technical Association (PITA) is an independent organisation which operates for the general benefit of its members – both individual and corporate – dedicated to promoting and improving the technical and scientific knowledge of those working in the UK pulp and paper industry. Formed in 1960, it serves the Industry, both manufacturers and suppliers, by providing a forum for members to meet and network; it organises visits, conferences and training seminars that cover all aspects of papermaking science. It also publishes the prestigious journal Paper Technology International® and the PITA Annual Review, both sent free to members, and a range of other technical publications which include conference proceedings and the acclaimed Essential Guide to Aqueous Coating.
Article
CO2 EmissionsAccountingandCarbonPeakPredictionof China’sPapermakingIndustry
JiamengYang 1,* ,YuchenHua 1,JiarongYe 1,ShiyingXu 1 andZhiyong(John)Liu 2
1 CollegeofEconomicsandManagement,NanjingForestryUniversity,Nanjing210037,China
2 NetworksFinancialInstitute,DonaldW.ScottCollegeofBusiness,IndianaStateUniversity,30N7thSt., TerreHaute,IN47809,USA
* Correspondence:yjm@njfu.edu.cn
Citation: Yang,J.;Hua,Y.;Ye,J.;Xu, S.;Liu,Z.CO2 EmissionsAccounting andCarbonPeakPredictionof China’sPapermakingIndustry. Forests 2022, 13,1856. https:// doi.org/10.3390/f13111856
AcademicEditors:Chul-HeeLim andMoonilKim
Received:7October2022
Accepted:3November2022
Published:7November2022
Publisher’sNote: MDPIstaysneutral withregardtojurisdictionalclaimsin publishedmapsandinstitutionalaffiliations.
Copyright: ©2022bytheauthors. LicenseeMDPI,Basel,Switzerland. Thisarticleisanopenaccessarticle distributedunderthetermsand conditionsoftheCreativeCommons Attribution(CCBY)license(https:// creativecommons.org/licenses/by/ 4.0/).
Abstract: Chinahasbeentheworld’slargestproducerandconsumerofpaperproducts.Inthe contextofthe“carbonpeakingandcarbonneutralitygoals”,China’spapermakingindustrywhichis traditionallyahighenergy-consumingandhigh-emissionsindustry,desperatelyneedsanationally appropriatelow-carbondevelopmentpath.Fromtheconsumption-sideperspective,thispapercalculatestheCO2 emissionsofChina’spapermakingindustryfrom2000to2019byusingcarbonemission nuclearalgorithm,grain-strawratio,first-orderattenuationmethod,andSTIRFDTdecomposition model,etc.,tofurtherexplorethecorestagesandbasicpatternsaffectingtheindustry’scarbon peaking.TheresultsshowthatthetotalCO2 emissionsofChina’spapermakingindustryshowedan upwardtrendfrom2000–2013,stablefrom2013–2017,andasteadybutslightdeclinefrom2017–2019. Meanwhile,thetotalCO2 emissionsofthefulllifecycleofpaperproductsinChinahavedecreased toacertainextentintherawmaterialacquisition,pulp,andpapermakingandshippingstages,with onlythewastepaperdisposalstageshowingaparticularupwardtrend.Wefindthatfrom2000to 2019,China’sCO2 emissionsinthepulpingandpapermakingstageofpaperproductsaccountedfor 68%ofthetotalemissionsinthewholelifecycle,ofwhich59%wascausedbycoalconsumption. Moreover,thescenariopredictionshowsthatimprovingtheenergystructureandincreasingthewaste paperrecoveryratecanreducetheCO2 emissionsoftheindustry,anditismoresignificantwhen bothwork.BasedonthisandthefourcorestagesofCO2 emissionsofthepapermakingindustrywe proposedwaystopromoteCO2 emissionspeakingofChina’spaperproducts.
Keywords: paperandpaperproducts;LCA;CO2 emissions;carbonpeaking
1.Introduction
Sincethe21stcentury,globalproblemssuchaslackofresources,environmentaldamage,andclimatechangehavebecomeincreasinglyprominent.Chinahasovertakenthe UnitedStatesastheworld’slargestCO2 emittersince2009[1],andin2019,China’sCO2 emissionswerehigherthanthecombinedCO2 emissionsoftheUnitedStatesandEuropean Union(EU)countries,withaglobalshareof29.37%[2].AccordingtoChina’sIntended NationallyDeterminedContributions(INDC)commitment,they“Strivetoachievecarbon peakingby2030andcarbonneutralityby2060”.Energysavingandcarbonreductionhave becomeessentialtaskstohelpachievethe“carbonpeakingandcarbonneutralitygoals”in thecomingperiod.Thepapermakingindustrypresentsanenergy-intensivesector,which accountedforapproximately1.4%oftotalnationalmanufacturingenergyconsumptionin 2021[3].Chinaistheworld’slargestproducerandconsumerofpaperandpaperboard[4,5], andthetypesandquantitiesofpaperproductsareincreasingwiththegrowthofthepopulationandtheimprovementofpeople’slivingstandards.Nationalpaperandpaperboard productionreaches112.60 × 106 tonsin2020,up4.60%from2019[6].Currently,China’s papermakingindustryisstillintherisingstageofindustrialdevelopmentandenergy consumption,andthecorrespondingCO2 emissionscontinuetoincreasewiththeincrease
inpaperproductsproduction[7].Hence,scientificaccountingofCO2 emissionsfrom thewholelifecycleofpaperproductscanprovideaninformationreferenceforthedevelopmentofChina’spaperproductCO2 emissionlifecycledatabaseandrelatedstandard guidelines,whichisofpositivesignificancetothegreentransformationdevelopmentof thepapermakingindustry.
Currently,themethodsusedbyscholarstoaccountforCO2 emissionsfromtheproductionprocessofpaperproductsmainlyincludethecarbonemissionfactormethod,inputoutputmethod,andlifecycleassessment.Fleiteretal.,Zhangetal.,andWangetal. [8–10] allusedthecarbonemissionfactormethodprovidedintheIntergovernmentalPanelon ClimateChange(IPCC)GuidelinesforNationalGreenhouseGasInventoriestoaccountfor theCO2 emissionsgeneratedbythepulpandpaperproductionprocessofpapercompanies aswellastheindustry.Pulpingandpapermakingarethemainprocessesinpaperproduct production,yetthewastetreatmentprocessesarealsocrucial.Wangetal.[11]measured theCO2 emissionsofpulpmaking,alkalirecovery,andwastewatertreatmentprocessesin papermakingenterprisesinShandongandJiangsuprovincesusingthecarbonemission factormethod,andtheresultsshowedthatCO2 emissionsperunitofstrawpulpwerethe highest,followedbywoodpulp,andwastepulpwasthelowest.Chenetal.[12]estimated energyconsumptionandCO2 emissionsoftheChinesepapermakingindustryfroma supplychainperspectivesupplementedbytheenergyinput/outputmethod,involving themainprocessesofforestcultivation,logging,pulp,andpaperproduction.Accounting foundthatthetotalCO2 emissionsofChina’spapermakingindustryin2011was149.74 × 106 t,withunitCO2 emissionsofabout1543kg/tpaper,muchhigherthanthe200kg/t paperintheNetherlandsand204kg/tpaperinSwedeninthesameperiod(Weneedto notethattheenergymixinChinaisverydifferentfromthatinEurope.Chinaisacountry richincoalresources,butlessinoilandnaturalgasresources,andthedevelopmentand useofnewenergyintheoverallenergysystemisnotyetinadominantposition,contrary tothewidespreaduseofrenewableenergyinEuropeanplants.Therefore,Chinaisone ofafewcountriesintheworldwhoseenergyproductionandconsumptionisdominated bycoal.Thesedifferencesarealsodirectlyreflectedinthedifferenceincarbonemissions fromthepaperindustry).Zhaoetal.[13]accountedandanalyzedtheimplicitcarbonflows andCO2 emissionsintheproductionandoperationofStoraEnso(Guangxi),anintegrated forest-paperenterprise,basedonthemulti-levelinput/outputmethodoftheforest-pulppapersupplychain,andproposedrelevantwaystoreduceCO2 emissionsintheenterprise. Inaddition,FurszyferDelRioetal.[14]presentedthemaindeterminantsofenergyand CO2 emissionsemergingfromthepapermakingindustryandbarrierstodecarbonization ofthepapermakingindustrybasedonasocio-technicalutilizationperspective. Lifecycleassessment(LCA)isamethodtoquantitativelyevaluatetheresourceconsumptionandenvironmentalimpactofaproductthroughoutitslifecycle,fromtheacquisitionofrawmaterials,theproductionoftheproducttothedisposaloftheproductafter use,etc.Itisaproduct-orientedenvironmentalloadquantificationtoolandisincreasingly usedinthepapermakingindustry.Intermsoftheoreticalexploration,Lietal.[15]usedlife cycletheorytoconstructananalyticalframeworkforCO2 emissionaccountingofpaper productsinthepapermakingindustry;Liuetal.[16]analyzedthecarbonsourceandcarbonsinkflowofpaperenterprisesinthecontextofforest-paperintegration;Maetal.[17] constructedacarbonfootprintevaluationsystemforproductsinthepapermakingindustry andevaluatedtheapplicationofcarbonfootprintinthepapermakingindustryandenterprises.TangandZheng[18,19]dividedthelifecycleofpaperproductsintofourstages fromtheperspectiveofmarketconsumption:inputperiod,growthperiod,maturityperiod, anddeclineperiod,andbasedonthecharacteristicsofeachstage,thedevelopmentstages ofpaperproductsandtheircharacteristicswerejudgedthroughtheanalysisofindexed datasuchastypesofpaperproducts,productionvolume,consumption,anddegreeof industrycompetition,etc.Asforempiricalstudies,Lopesetal.andDiasetal.[20,21]used theLCAmethodtoevaluatetheenvironmentalimpactofthepapermakingindustryin Portugal.Gemechuetal.[22]usedtheLCAmethodtocalculateandanalyzethegreen-
housegasemissionsfromvirginwoodpulpandwastepulppapermakingprocesses,and foundthatwastepulppapermakingproducedfewergreenhousegases.Chenetal.[23] analyzedthe2010and2015lifecycleCO2 emissionsofpaperproductsinChina.Thescope coveredintheirstudywasrelativelycomplete,includingforestplantation,pulpandpaper making,transportation,wastepaperrecyclingandpulpmaking,incineration,andlandfill. However,theiranalysisdidnotincludenon-woodpulprawmaterialsintheproduction process,andtheCO2 emissionsfromthepulpandpapermakingprocessaccountedforas muchas86.33%oftheirresults.Itisworthwhiletonotethattheprocessofpapermaking isgenerallydividedintotwotypes:wetpaperanddryingprocess.Currently,Chinais stilldominatedbytheformer,butthelatterisalsodeveloping.Differentprocessesare usedtoproducedifferenttypesofpaper.ThetypesofpaperproducedinChinamainly includecorrugatedpaper,containerboard,printingpaper,andnewsprint.Thearrayof paperproductcategoriesvariesfromcountrytocountry.
Insummary,scholars’researchresultsonCO2 emissionaccountinginthepapermaking industryarerelativelyabundantandtheyprovideanessentialreferenceforthestudyof thispaper.However,studiesonCO2 emissionsofpaperproductsarebasicallybased ontheproduction-sideperspective,mainlyaccountingforCO2 emissionsofthepulp andpaperproductionprocess.Withthedevelopmentoftradeglobalization,theimport andexporttradeofpaperproductshasbecomemoreandmorefrequent,anditiseasy toignorethespatialtransferofCO2 emissionsinthetradebyaccountingonlyfromthe productionside.Atthesametime,theexistingresearchalsoneedstodeepenfurtherthe determinationofthesystemboundaryofthewholelifecycleofthepapermakingindustry. Accordingly,thispapercombinestheperspectiveofconsumerresponsibilitytoprovidea morecompleteestimationofCO2 emissionsofChinesepaperproductsfrom2000to2019, fromvariousstagesinthewholelifecycle,includingrawmaterialacquisition,pulpand paperproduction,tradeandtransportation,wastepaperdisposal,andexport.Onthis basis,theimpactofrelevantpoliciesonCO2 emissionsinthepapermakingindustryis discussedatbothmacroandmicrolevels,andthenspecificpathsareproposedtopromote theindustry’s“carbonpeaking”.
2.MaterialsandMethods
2.1.SystemBoundaryandCO2 EmissionSourceDetermination
2.1.1.SystemBoundary
CO2 emissionsfromtheperspectiveofconsumerresponsibilityarebasedonthecarbon footprintidea,accountingforthetotalamountofgreenhousegasemissionsfromproductsorservicesconsumedbyenterprisesandindividualsintheprocessoftransportation, production,andconsumption,whichisequivalenttotheproduction-sideCO2 emissions minustheCO2 emissionsofexportedproductsplustheCO2 emissionsofimportedproducts,wherethedifferencebetweentheCO2 emissionsofimportedandexportedproducts istheimpliedCO2 emissionsofproducttrade[24–26].Inordertocomprehensivelyand systematicallyquantifytheCO2 emissionsofpaperproductsatallstagesofproduction andconsumption,thispaperadoptsthewholelifecycleaccountingmethodandproposes asystemboundaryforCO2 emissionsaccountingofpaperproducts,asshowninFigure 1. Thesystemboundaryisthesub-interfacebetweenthesystemandtheenvironment. TheenvironmentofthewholelifecycleCO2 emissionsystemofpaperproductsincludes resourcesandenergyinput,andCO2 output.Thewholelifecycleofpaperproductsis mainlydividedintofourstageswithinthesystem:rawmaterialacquisitionstage,pulpand paperstage,wastepaperdisposalstage,andtransportationstage.Consideringthedata acquisitionproblem,CO2 generatedbypaperandpaperboardindomesticconsumptionis notincludedintheaccountingsystem.Undertheperspectiveofconsumerresponsibility, andbasedontheprincipleofwhoconsumeswhobears,partoftheCO2 emissionsfrom paperandpaperboardexportedfromChina(includingproductionandtransportation)are bornebytheimportingcountry,andthispartshouldbesubtractedfromtheaccounting process.Inaddition,Chinaimportsmainlywoodpulpandwastepaperwhicharesemi-
finishedproducts,andstillneedtobeprocessedinChina.Thus,theCO2 emissionsfrom thispartaredividedintothepulpandpaperstageandthetransportationstage,whichare includedintheaccountingsystem.

Figure1. CO2 emissionaccountingboundaryofpaperproductsinthewholelifecycle.
2.1.2.CO2 EmissionSourceDetermination
The system boundary is the sub-interface between the system and the environment. The environment of the whole life cycle CO2 emission system of paper products includes resources and energy input, and CO2 output. The whole life cycle of paper products is mainly divided into four stages within the system: raw material acquisition stage, pulp and paper stage, waste paper disposal stage, and transportation stage. Considering the data acquisition problem, CO2 generated by paper and paperboard in domestic consumption is not included in the accounting system. Under the perspective of consumer responsibility, and based on the principle of who consumes who bears, part of the CO2 emissions from paper and paperboard exported from China (including production and transportation) are borne by the importing country, and this part should be subtracted from the accounting process. In addition, China imports mainly wood pulp and waste paper which are semi-finished products, and still need to be processed in China. Thus, the CO2 emissions from this part are divided into the pulp and paper stage and the transportation stage, which are included in the accounting system.
(1) Therawmaterialacquisitionstage.China’spaperrawmaterialsarecurrentlydominatedbywastepulpfollowedbywoodpulp,withnon-woodpulpconsumingthe lowestpercentage.Non-woodpulporiginatesfromdomesticproduction,whilewaste pulpandwoodpulporiginatefromdomesticproductionandimports.TheCO2 emissionsfromtheproductionorimportofthethreerawmaterialsaredefinedin Table 1 below.
(2) Thepulpandpaperstage.Thisstageistheprocessofpulpprocessingtoproduce paperandpaperboard,whichinvolvesCO2 emissionsincludingfuelcombustion emissions,chemicaldecompositionemissions,andelectricityandheatconsumption emissions.Theresearchboundaryofthepulpandpaperstageisbasedontheaccountingstandardsforgreenhousegasemissionsfromthepapermakingindustrydefined inthe“GreenhouseGasEmissionsAccountingMethodologyandReportingGuidelinesforPaperandPaperProductsProducersinChina(forTrialImplementation)”. Additionally,theamountofCO2 emissionsduetofuelcombustionwasaccountedfor accordingtoZhangetal.[9],andPengetal.[27].
2.1.2. CO2 Emission Source Determination
(3) Thewastepaperdisposalstage.DrawingontheresearchresultsofGonzalezGarciaetal.,Ghoseetal.,andGemechu[22,28,29],thecoreaspectsofrawmaterialinput,production,andproductoutputinthetransportationphaseofpaperproductsare includedintheaccountingboundary.Amongthem,rawmaterialinputtransportation includespulprawmaterialsfromdomesticoriginorforeignimportstransportedto thepulpandpaperenterprisesandaftertheuseofwastepaperrecyclingtransported tothepulpandpaperenterprisesrecycling;productoutputtransportationincludes finishedpaperandpaperboardfromtheproductionenterprisestransportedtothe paperproductssuppliers,distributors,individualconsumersorexporttransportedto
(1) The raw material acquisition stage. China’s paper raw materials are currently dominated by waste pulp followed by wood pulp, with non-wood pulp consuming the lowest percentage. Non-wood pulp originates from domestic production, while waste pulp and wood pulp originate from domestic production and imports. The CO2 emissions from the production or import of the three raw materials are defined in Table 1 below.
(2) The pulp and paper stage. This stage is the process of pulp processing to produce paper and paperboard, which involves CO2 emissions including fuel combustion emissions, chemical decomposition emissions, and electricity and heat consumption emissions. The research boundary of the pulp and paper stage is based on the accounting standards for greenhouse gas emissions from the papermaking industry defined in the “Greenhouse Gas Emissions Accounting Methodology and Reporting Guidelines for Paper and Paper Products Producers in China (for Trial
Figure 1. CO2 emission accounting boundary of paper products in the whole life cycle
othercountries.Undertheconsumerresponsibilityprinciple,CO2 emissionsfrom theexporttransportationofpaperandpaperboardshouldbebornebytheimporting countryofpaperandpaperboard,andthispartofCO2 emissionsisnotincluded inthetransportationphaseofpaperproducts.Duetotheavailabilityofdata,CO2 emissionsfromtheexporttransportationoftheproducttotheconsumeraredifficult tocalculate,andthepartoftheproductionprocessthatinvolvestransportationfrom theworkshopisneglected.
(4) Thetransportationstage.China’swastepaperdisposalmainlyhasthreeways:landfill, incineration,andrecycling[23].Wastepaperrecyclingandutilizationisanimportant partoftheclosed-loopmaterialflowof“resourceconsumption-products-renewable resources”inthepapermakingindustry,andtheCO2 generatedfromrecyclingis includedinthetransportationstage.Fortheconvenienceofestimation,itisassumed thatthewastepaperislandfilledorincineratedintheopenairwithoutfixedconcentrationpoints,andmethanerecoveryisnotconsideredinthelandfillingprocess,so theCO2 releasedinthelandfillingorincinerationprocessismainlyaccountedforin thewastepaperdisposalstage.
Theproportionofforeignimportedwoodusedforfurniture manufacturingishigh,andonlyasmallportionofitisusedfor pulpandpapermaking,sotheCO2 generatedfromthe transportationofthispartofimportedwoodisnegligible.The CO2 generatedintheprocessofforestplantationcanbe absorbedbyitsownphotosynthesis,sowedonotcalculateCO2 emissionsfromforestplantation,butonlycalculateCO2 emissionsfromdomesticharvestingofwoodforpulpand paperproduction.
Woodpulpimportedfromabroadismainlyinvolvedin transportationdistanceandtransportationvolume,soCO2 generatedfromimportedwoodpulpisincludedinthe transportationphaseforcalculation.
Amongnon-woodpulp,rice-wheatstrawpulphasalways accountedforthehighestpercentage[6],sowemainlycalculate theCO2 emissionsfromtherice-wheatstrawpulpfeedstock acquisitionprocess,andthenestimatetheCO2 emissionsfrom thenon-woodpulpfeedstockacquisitionprocessbasedonthe percentageofrice-wheatstrawpulp.
Bothdomesticwastepaperrecyclingandforeignwastepaper importmainlyinvolvetransportation,sothisportionofCO2 emissionsareincludedinthetransportationphase.
2.2.CalculationMethod
2.2.1.AccountingforCO2 EmissionsintheRawMaterialAcquisitionStage TimberHarvestingProcess
Theacquisitionofwoodpulprawmaterials(woodharvestingprocess)involves threeprocesses:loggingfortimber,skidding,andtransportation.TheaccountingofCO2 emissionsfromthisprocessisbasedonthecarbonemissionfactormethodoftheNational GreenhouseGasEmissionsInventoryGuidelines.Theformulaisasfollows.
1 Loggingandtimberingoperations:
Table1. ThreesourcesofrawmaterialsanddefinitionofCO2 emissions.
InEquation(1), Ch istheCO2 emissionfromloggingandtimberingoperationactivities (106 t), ed istheCO2 emissionfactorofdieselfuel(tCO2/t), Eh istheenergyconsumption ofloggingandtimbering(106 t), Wh isthevolumeofpaperlogging(m3),and Wah isthe averagefuelconsumptionofchainsawinloggingoperation(t/m3).
2 Mechanicalropewayskiddingoperations:
InEquation(2), Cm istheCO2 emissionofropewayskiddingoperationactivity(106 t), Em istheenergyconsumptionofropewayskidding(106 t), Wm isthevolumeofskidding (m3), Wam istheaveragefuelconsumptionofmechanicalropewayskidding(t/m3.km), and Lm isthelengthofropeway(km).
3 Materialtransportoperations:
InEquation(3), Cl istheCO2 emissionfromthevehicletimbertransportactivity (106 t), El istheenergyconsumptionoftimbertransport(106 t), Wl isthevolumeoftimber transported(m3), Wat istheaveragefuelconsumptionoftimbertransport(t/m3.km),and Ll isthedistanceoftimbertransport(km).Assumingnodamagetowoodduringskidding andtransportation,i.e., Wh = Wm = Wl .ThefinalCO2 emissionsduringthewoodpulp rawmaterialacquisitionstageare Cw = Ch + Cm + Cl
TheProcessofObtainingRawMaterialsforRiceandWheatStrawPulp Rice-wheatstrawpulpisoneoftheimportantwaystoutilizestrawasrawmaterial. CO2 emissionsfromthisprocessinclude: 1 CO2 fromtheuseofagriculturalchemicals (fertilizers,pesticides); 2 CO2 fromtheconsumptionofdieselfuelforirrigation[30],tilling andharvestingwithagriculturalmachinery,etc.Refertothegrain/strawratiomethod. Theformulaisasfollows.
InEquation(4),Aistheareaofriceplantedforpapermaking, Cn istheCO2 emission inthenon-woodpulprawmaterialacquisitionstage(106 t), n istheratioofrice-wheat strawpulpproductiontototalnon-woodpulpproduction, ARi isthe i-thagricultural inputperhectareofriceplantedarea(t/hm2,kW-h/hm2).Accordingtothestatisticsofthe ChinaRuralStatisticalYearbook,agriculturalinputsincludenitrogenfertilizer,phosphorus fertilizer,potassiumfertilizer,compoundfertilizer,herbicide,insecticide,fungicide,diesel, agriculturalfilm,riceseedandelectricity. ci istheCO2 emissionfactorofthe i-thagricultural input(tCO2/t,tCO2/kW-h).CO2 emissionsintherawmaterialacquisitionstageofthe finalpaperproduct CA = Cw + Cn.
2.2.2.AccountingforCO2 EmissionsinthePulpandPaperStage
ThepulpandpaperstagemainlygeneratesCO2 emissionsfromenergyconsumption. Inthispaper,thecarbonemissionnuclearalgorithmisusedtocalculateCO2 emissions basedontheenergyconsumptionofthepulpandpaperstageandtheCO2 emissionfactor ofenergy,theformulaisasfollows.
InEquation(5), CB istheCO2 emissionofthepulpandpaperstage(106 t), cj isthe CO2 emissionofvariousenergysourcesconsumedinthisstage(106 t),and ej isthephysical quantityofvariousenergysourcesconsumed(106 t,m3,kW-h).Accordingtothestatistical
caliberofChinaStatisticalYearbook,theenergyconsumedinthepulpandpaperstage includescoal,coke,crudeoil,gasoline,kerosene,diesel,fueloil,naturalgas,andelectricity. fj istheCO2 emissioncoefficientofeachenergysource(tCO2/t,tCO2/m3,tCO2/kW-h).
2.2.3.AccountingforCO2 EmissionsintheWastePaperDisposalStage
TheaccountingmethodontransportationCO2 emissionsmainlyreferstotheidea oftheSTIRPATfactordecompositionmodel[31,32],Whichisbasedonconstructingan accountingmodelofenergyconsumptioninthetransportationprocessofpaperproducts, andthencombiningitwiththecarbonemissionfactormethod.ToaccountforCO2 consumptionduringthetransportationofpaperproducts,theformulaisasfollows.
InEquation(6), CT isthetotalCO2 emissionduringthetransportationofpaper products(106 t), F isthefreightvolumeofpaperproducts(106 t); K istheturnoverof paperproducts(106 t.km),and K F isthetransportationdistanceofpaperproducts(km), expressedasD; Ei istheconsumptionofthei-thenergysourceduringthetransportation ofpaperproducts(106 t),and Ei K istheconsumptionofvariousenergysourcesper106 tof paperproductsin1km-transportation(t/106 t.km), µi istheCO2 emissioncoefficientof eachenergysource, C K istheCO2 emissionper106 tofpaperproductin1km-transportation (tCO2/106 t.km),i.e.,theCO2 emissioncoefficientoftransportationmode,expressedas ϕj, j isthejthtransportationmode.Fortheconvenienceofcalculation, ϕj issetconstantfor eachtransportationmode.
(1) CO2 emissionaccountingmethodforthetransportationprocessofimportedpaper rawmaterials
Ininternationaltrade,thedistanceofcargotransportationismostlymeasuredbythe shortestsphericaldistancebetweenthecapitalsofthetwotradingcountries[33,34],but thisisgenerallyapplicabletoairtransportationmethods,andifusedasadistancemeasure forwaterwaytransportation,itwillgreatlyunderestimatetheactualdistanceofcargo transportation[35].Duetothelowcostandhighvolumeofwaterwaytransportation,Chinesepaperrawmaterialimportsaremainlytransportedbywaterway.Tomakeupforthe shortcomingsofthisinternationaltransportdistancemeasure,thetraditionalinternational tradetransportdistanceissplitintotheinternationalanddomesticdistancemeasures[35], andinthispaper,thetransportdistanceofpaperrawmaterialimportisdividedintotwo partswiththemainChineseportasthetransitpoint,thefirstpartistheinternational distancetransportedfromthepaperrawmaterialexportingcountrytothemainChinese port,andthesecondpartisthedomesticdistancetransportedfromthemainChineseport tothepaperandpaperboardmainproductionprovincesinChina.Thetwopaperraw materials(pulpandwastepaper)sourcecountriesarenotexactlythesameandtheyare fromnumeroussourcecountries,hence,foreaseofaccounting,weonlysetChina’slargest portofinternationaltrade—Shanghai—fortheinternationaldistanceinthedestination,the largestportofpaperrawmaterialsexportingcountriesasthestartingplace.Theactual watertransportdistancebetweenthesetwoplacesistheinternationaldistanceofpaper rawmaterialsimports.Asforthedomesticdistance,accordingtoreality,wesetQingdao port,Tianjinport,Shanghaiport,Xiamenport,andShenzhenportasthemainportsof paperrawmaterialimports[36].Themainprovincesofpaperandpaperboardproduction followthenearestandonlyprinciple,i.e.,itwillbefromthenearestportandonlyfrom thisporttoimportpulpandwastepaper.Therefore,theactualdistancebetweenthemain portsandtheprovincialcapitalsofthemainpaperandpaperboard-producingprovincesis thedomesticdistance.Insummary,theformulaforaccountingforCO2 emissionsduring thetransportationofimportedpaperrawmaterialsisasfollows.
InEquation(7), CI isthetotalCO2 emissionofpaperrawmaterialimporttransportation(106 t), Fp and Fw aretheimportvolumeofpulpandwastepaperrespectively(106 t), andthesumofbothisthetotalimportvolumeofpaperrawmaterial(106 t), Dα and Dβ are thewatertransportationdistancebetweenthelargestportofthe αthpulpexportingcountry andthe βthwastepaperexportingcountryandShanghaiportrespectively(km),and ϕ1 is theCO2 emissioncoefficientofwaterwaytransportationmode(tCO2/106 t.km).Sinceitis difficulttoobtainspecificdataonthevolumeofpulpandwastepapertransportedbythe mainpaperandpaperboardproducingprovincesfromeachmajorport, DN istheaverage distance(km)oftheactualdistancebetweenallmajorportstotheprovincialcapitalsofthe mainpaperandpaperboard-producingprovinces,andbasedontheaveragedistance,we setthatthedomestictransportprocessisdominatedbyrailtransport,and ϕ2 istheCO2 emissionfactoroftherailtransportmode.
(2) CO2 emissionaccountingmethodfordomesticwastepaperrecyclingandtransportationprocess
Paperandpaperproductsareinvolvedinalmosteveryaspectofeveryone’slife, andwithintheChineseregion,theconsumermarketisnationwide,withwastepaper generallyoriginatingfromChina’s31provinces,autonomousregions,andmunicipalities (HongKong,Macau,andTaiwanofChinaarenotcounted).Therecoveredwastepaper istransportedto16paperandpaperboard-producingprovinceswithcomplicatedand irregulartransportationroutes.Therefore,thispapersets31provinces,autonomous regions,andmunicipalitiesdirectlyundertheCentralGovernmenttofollowtheprinciple ofproximityanduniqueness,i.e.,onlytransporttothenearestmajorpaperandpaperboardproducingprovince.Takingtheactualdistancebetweenthesetwoprovincialcapitalsas thetransportationdistanceofwastepaperrecycling,andthetransportationmodeisalso mainlyrailroadtransportation,theCO2 emissionaccountingformulaofthedomesticwaste paperrecyclingtransportationprocessisasfollows.
InEquation(8), Cz isCO2 emissionsfromdomesticwastepaperrecyclingtransportation(106 t).Sincespecificdataontheamountofwastepapershippedtothemainpaper andpaperboardproductionsitesineachprovinceandcityarenotavailable, Fw isthetotal amountofwastepaperrecovered(106 t)and, Dw istheaveragedistance(km)between thesourceofallrecoveredwastepaperandtheprovincialcapitalsofthemainpaperand paperboardproductionsites.
2.2.4.AccountingforCO2 EmissionsintheTransportationStage
Inordertoensuretheconsistencyofmethodsanddatasetsinthetimeseriesand minimizeaccountingerrors,thefirst-orderattenuationmethodisusedtoestimatetheCO2 emissionsfromwastepaperopenlandfillandincineration.
(1) Openlandfill
Open-airlandfillsmainlyreleaseCH4,andtheaccountingconvertsCH4 emissions intoCO2 emissions,withthefollowingaccountingformula.
InEquations(9)and(10), MSWm isthevolumeofwastepaperlandfill(106 t), DOC istheproportionofdecomposableorganiccarbon(%)(howmanykgofcarbonperkgof landfillwastepaper), DOC f istheproportionofdecomposable DOC (%), MCF istheCH4 correctionfactorforaerobicdecomposition(%), F istheproportionofCH4 inlandfillgas (%), 16 12 isCH4/Cmolecularweightratio,and 44 12 istheCO2/Cmolecularweightratio.
CJ = MSWm × DOC × DOC f × MCF × F × 16 12 (9)
Cd = MSWm × DOC × DOC f × (1 MCF × F) × 44 12 (10)
(2) Openburning
Assumingthatthewastepaperisburnedcompletelyintheopenair,releasingmainly CO2 gasandproducingverylittleCO,theCO2 emissionsfromthispartareaccountedfor bythefollowingformula.
InEquation(11), MSWs isthewastepaperincinerationvolume(106 t), CF isthecarbon contentofwastepaper(%), FCF isthefossilcarbonpercentageofwastepaper(%),and OF istheoxidationfactor.
2.2.5.AccountingMethodsforExportPaperandPaperboardCO2 Emissions
Fromaconsumerresponsibilityperspective,CO2 emissionsfromtheproductionand otherprocessesofpaperandpaperboardexportedfromChinashouldbebornebythe importingcountryandnotcountedaspartofthewholelifecycleCO2 emissionsofChinese paperproducts.TheformulaforaccountingforCO2 emissionsfromthisportionofpaper andpaperboardisasfollows.
InEquation(12), CO istheCO2 emissionsofpaperandpaperboardexported(106 t), Uc istheCO2 emissionsperunitofpaperandpaperboardproduction(tCO2/t),and PB is thevolumeofpaperandpaperboardexportedfromChina(106 t).
2.3.ListofDataandSources
(1) Therawmaterialacquisitionstage.Theamountofwoodusedintheprocessof acquiringwoodpulpisequivalenttotheamountoftimberusedforpapermaking,dataofwhichistakenfromthe“ChinaForestryStatisticalYearbook2000–2020” (nationalproductionofmajortimberandbamboo).Theaveragefuelconsumption forloggingfortimber,skidding,andtransportingtimberwasreferredtothedata intheresearchresultsofYuanZhouetal.[37],andthecablewaylengthanddistancefortransportingtimberwereadoptedfromthefieldresearchconductedby Zhangetal.[38]onsouthernplantationforests.Asforthenon-woodpulpacquisition process,non-woodpulpandrice-wheatstrawpulpproductiondataweredrawnfrom the“ChinaPapermakingIndustryAnnualReport(2001–2020).Theparametersof theamountofstrawresourcesconsumedperunitofrice-wheatstrawpulpoutput werereferredtothedataofZhang[39]whoinvestigatedthenon-woodpulpproductionlinesofYongfengyuenterprises.Paperstrawavailabilitycoefficientandstraw collectabilitycoefficientwereadoptedfromtheresearchresultsofSunetal.and LiZhongzheng[40,41].Thestraw-to-grainratio(strawcoefficient)wasselectedas theaverageofthestrawcoefficientofriceinChinabyWang[42];dataontotalrice productionandtotalplantedareainChinaduringthestudyperiodwereobtained fromtheChinaRuralStatisticalYearbook(2000–2020)[43](plantedandfarmedarea andproductionofmajoragriculturalproducts).Statisticsonvariousagricultural inputsduringricecultivationandcultivationuptoharvestingweretakenfromthe NationalCompilationofInformationonCostsandReturnsofAgriculturalProducts (2001–2020)[44].TheCO2 emissionfactorsofagriculturalinputssuchasfertilizers, pesticides,agriculturalfilms,andseedswereobtainedfromthedataofHuangetal., Wangetal.,andXueetal.[30,45,46],respectively.
(2) Thepulpandpaperstage.Energyconsumptiondataforthestudyperiodwasobtained fromtheChinaStatisticalYearbook(2000–2020)[3].Energytypeswereclassifiedinto ninecategoriesaccordingtotheChinaEnergyYearbook:coal,coke,crudeoil,gasoline, kerosene,diesel,fueloil,naturalgas,andelectricity,andtheCO2 emissioncoefficients ofvariousenergysourceswereadoptedfromtheGuidetoProvincialGreenhouseGas InventoryPreparation(forTrialImplementation)[47].TheelectricityCO2 emission
Cv = MSWs × CF × FCF × OF × 44 12
factoristheaveragevalueofCO2 emissionsperunitofelectricitysupplyinthesix regionsofChinaandHainanProvinceinthereferencelist.
(3) Thetransportationstage.Dataonpulpandwastepaperimportsandcountryof importforthestudyperiodwereobtainedfromtheUNTradeDatabase https:// comtrade.un.org/data (accessedon25December2021).Chinaneedstoimportlarge amountsofpaperrawmaterialsfromabroad.Thepulporpaperscrapexporting countrieswiththehighestexportvolumesandthesumoftheirexportvolumes accountingformorethan90%ofChina’stotalpulporpaperscrapimportswere selectedasthemainimportersofpaperrawmaterialsintoChina.Thedistance betweenthelargestportoftheimportingcountryandtheChineseportofShanghai wasreferredtoasthewatertransportdistanceasindicatedonthewebsiteofthe InternationalCargoExchange https://www.searates.com (accessedon25December 2021).Forthemainpaperandpaperboard-producingprovinces,wereferredtothe “ChinaPapermakingIndustry2000–2020AnnualReport”[6]andselected16provinces andcitiessuchasShandong,Zhejiang,Guangdong,andJiangsu,whosecombined productionofpaperandpaperboardaccountedformorethan95%ofthetotalpaper andpaperboardproductioninChinaduringthestudyperiod.Theactualdistance databetweenthemainimportingportstotheprovincialcapitalsofthemainpaper andpaperboardproductionareasandtotheprovincialcapitalsofmainwastepaper recyclingsiteswerebasedontheBaidumap,andArcGISwasusedtocalculatethe sphericaldistancebetweenpoints.Thedataonwastepaperrecyclingvolumewere obtainedfromtheChinaPaperYearbook(2000–2020)[48],andtheCO2 emission factorsofeachtransportationmodewerereferredtothe“EuropeanCommunities TradeMarkAssociation’sGuidelinesforMeasuringandManagingCO2 Emission fromFreightTransportOperations”[31].
(4) Thewastepaperdisposalstage.Thereisrelativelylessliteratureavailableabout thepercentageofwastepaperrecycling,landfill,andincineration.Inourpaper,the proportionoflandfillandincinerationofdomesticwastetothetotaldomesticwaste disposalinChinafrom2000to2020,respectively,wasusedasthelandfillrateand incinerationrateofwastepaper,fromwhichtheamountoflandfillandincinerationof wastepaperwasderived[23].DataondomesticwastedisposalinChinaduringthe studyperiodwereobtainedfromtheChinaStatisticalYearbookofUrbanConstruction (2000–2020)[49](informationonthenationalurbansanitationsubgroup).Thedata parameterssuchas DOC f utilizedintheaccountingprocesswerereferredtoas theNationalGreenhouseGasEmissionInventoryGuidelinesandtheProvincial GreenhouseGasInventoryPreparationGuidelines(forTrialImplementation)[47]. Someadditionalnotesareinplacehere.TheChinaForestryStatisticalYearbook (2017–2020)nolongerseparatelycountswoodusedforpapermaking.Thewoodusedfor papermakingduring2017–2019isforecastedbytheaverageyear-on-yeargrowthfrom 2012–2016.Forthereasonoflimitationsindataacquisition,theshippingdistancefrom ShanghaiporttootherregionsinAsiaiscalculatedbytheaverageshippingdistancefrom ShanghaiporttothelargestportsinJapan,SouthKorea,Thailand,andSingapore.China UrbanConstructionStatisticalYearbook2000doesnotcountthedomesticwastelandfill rateandincinerationrate,andthedomesticwastelandfillrateandincinerationratein2000 areextrapolatedbythedatain2001.
Alistofdataparametersandasummaryofvaluesusedinthewholelifecyclecarbon accountingofpaperproductswereincludedinTable 2 below.
Table2. SummaryofdataparametersrelatedtoCO2 emissionsofpaperproducts.
Paperstrawavailabilitycoefficient(t/t)0.4500CoalCO
Strawcollectabilitycoefficient(t/t)0.8300CokeCO
PotashCO2 emissionfactors(tCO2/t)0.6500 NaturalgasCO2 emissionfactor(tCO2/m3) 0.0022
CompostCO2 emissionfactor(tCO2/t)1.7700ElectricityCO2
3.Results
3.1.OverallCO2 EmissionStatus
TheresultsofaccountingforeachstageofthewholelifecycleofCO2 emissionsof paperproductsarecombinedtoestimatetheCO2 emissionsofthewholelifecycleof paperproductsinChina,asshowninFigure 2.TheCO2 emissionsofeachstageare,in descendingorder,pulpandpaperstage(averageshareofabout67.95%)>wastepaper disposalstage(19.26%)>rawmaterialdisposalstage(5.70%)>transportationstage(3.84%) >exportpaperandboard(3.23%).Thepulpandpapermakingandwastepaperdisposal stagesarethemainsourcesofCO2 emissionsforthewholelifecycleofpaperproducts, accountingformorethan90%.ThegrowthofCO2 emissionsfromexportedpaperand paperboardmeansagradualincreaseinCO2 emissionstransferredfromabroadtoChina, whichnotonlyincreasesthepressureofenergyconservationandemissionreductionin Chinabutalsoexacerbatesthecontradictionbetweenthelackofpaperrawmaterialsand theexcessproductionofpaperandpaperboardinChina’spapermakingindustry.

3.2. CO2 Emission Status of the Raw Material Acquisition Stage
In the raw material acquisition stage, the CO2 emissions from acquiring non-wood pulp are much higher than those from acquiring wood pulp, see Figure 3. China is also gradually reducing the use of non-wood pulp raw materials, which is in the direction of improving the raw material structure of papermaking in China, and we expect that the
Figure 2. CO2 emissions from the life cycle of paper products from the perspective of consumer responsibility.
Figure2. CO2 emissionsfromthelifecycleofpaperproductsfromtheperspectiveofconsumer responsibility.
Figure 2. CO2 emissions from the life cycle of paper products from the perspective of consumer responsibility.
3.2. CO2 Emission Status of the Raw Material Acquisition Stage
3.2.CO2 EmissionStatusoftheRawMaterialAcquisitionStage
In the raw material acquisition stage, the CO2 emissions from acquiring non-wood pulp are much higher than those from acquiring wood pulp, see Figure 3. China is also gradually reducing the use of non-wood pulp raw materials, which is in the direction of improving the raw material structure of papermaking in China, and we expect that the CO2 emissions from acquiring non-wood pulp will continue to show a significant decline.
Intherawmaterialacquisitionstage,theCO2 emissionsfromacquiringnon-wood pulparemuchhigherthanthosefromacquiringwoodpulp,seeFigure 3.Chinaisalso graduallyreducingtheuseofnon-woodpulprawmaterials,whichisinthedirectionof improvingtherawmaterialstructureofpapermakinginChina,andweexpectthatthe CO2 emissionsfromacquiringnon-woodpulpwillcontinuetoshowasignificantdecline.

Figure 3. CO2 emissions from the raw material acquisition stage.
CO2 emissionsfromtherawmaterialacquisitionstage.
From the accounting results, the CO2 emissions from wood pulp acquisition rose slightly from 2000–2019, and the opposite for non-wood pulp. Since the CO2 emissions from non-wood pulp always accounted for the largest proportion, accounting for more than 95% from 2000–2019, the total CO2 emissions from the raw material acquisition stage continued to decline with the decline in CO2 emissions from non-wood pulp acquisition. Among them, around 2010, the CO2 emissions of the raw material acquisition stage rose significantly, mainly due to the continued high prices of imported wood pulp and
Fromtheaccountingresults,theCO2 emissionsfromwoodpulpacquisitionrose slightlyfrom2000–2019,andtheoppositefornon-woodpulp.SincetheCO2 emissions fromnon-woodpulpalwaysaccountedforthelargestproportion,accountingformore than95%from2000–2019,thetotalCO2 emissionsfromtherawmaterialacquisitionstage continuedtodeclinewiththedeclineinCO2 emissionsfromnon-woodpulpacquisition. Amongthem,around2010,theCO2 emissionsoftherawmaterialacquisitionstagerose significantly,mainlyduetothecontinuedhighpricesofimportedwoodpulpandimported wastepaper,resultinginayear-on-yeardeclineinimportsandariseindomesticdemand fornon-woodpulp.2013onwards,theadjustmentoftherawmaterialstructureofpaper productionhastosomeextentreducedthepressureonCO2 emissions.Duringthetwo “2011–2019Five-YearPlan”period,theproportionofnon-woodpulphasbeenreduced from13.71%to6.03%sothattheCO2 emissionsofthisphaseexhibitacertaindownward trend.Intermsofwoodharvestingandtransportation,thehighestCO2 emissionsare fromtransportingwood,followedbyskidding,andthelowestisfromharvestingwood;in termsofCO2 emissionsfromvariousagriculturalinputsusedinricecultivationforpaper production,fertilizeraccountsfor41%,electricityconsumptionforirrigationaccountsfor 26%,andCO2 emissionsfromdieselandpesticideinputsaccountfor8–9%,andtheCO2 emissionsfromtheaboveagriculturalinputsintotalaccountformorethan85%ofthetotal emissionsfromcultivation.
3.3.CO2 EmissionsStatusofPulpandPaperStage
Fromanoverallperspective,CO2 emissionsfromthepulpandpaperstagerosefrom 64.21 × 10⁶ tin2000to151.61 × 106 tin2019,withanaverageannualcompoundgrowth rateof4.38%(Figure 4),whichishigherthantheaverageannualcompoundgrowthrate of3.79%ofChina’stotalCO2 emissions[2].WhiletheUK’sCO2 emissionsatthatstage in2014havebeenreducedby42%comparedto2008[50].ComparedtosomeEuropean countries,CO2 emissionsfromthepulpandpaperproductionprocessinChinaarestillon anincreasingtrend.
Figure3.
× 106 t in 2000 to 151.61 × 10⁶ t in 2019, with an average annual compound growth rate of 4.38% (Figure 4), which is higher than the average annual compound growth rate of 3.79% of China’s total CO2 emissions [2]. While the UK’s CO2 emissions at that stage in 2014 have been reduced by 42% compared to 2008 [50]. Compared to some European countries, CO2 emissions from the pulp and paper production process in China are still on an increasing trend.

Figure 4. CO2 emissions from energy consumption in the pulp and paper stage.
Figure4. CO2 emissionsfromenergyconsumptioninthepulpandpaperstage.
Specifically, from 2000–2016, coal, which accounts for more than 75% of total energy consumption, accounted for the highest proportion of CO2 emissions in the pulp and paper stage, basically remaining at around 60% and still on an upward trend. With the implementation of China’s “13th five-year plan” in 2016–2019, the energy structure adjustment has increased, and the proportion of CO2 emissions from coal in the pulp and paper stage has been reduced to 49.4% by 2019. In 2013, there was a phase peak of CO2 emissions in the pulp and paper stage, which was attributed to the large increase in coal consumption during this stage, and a slow decline in the Chinese coal price index during the same period, followed by a steep downward trend after the summer, until late in the “12th FiveYear Plan” [51]. The CO2 emissions share of electricity is above 35%, growing from 22.65 × 10⁶ t in 2000 to 71.04 × 10⁶ t in 2019, with an average annual compound growth rate of 5.88%, higher than that of coal at 3.24%. The sum of CO2 emissions from coal and electricity accounts for more than 95% of the total CO2 emissions from the entire pulp and paper
Specifically,from2000–2016,coal,whichaccountsformorethan75%oftotalenergy consumption,accountedforthehighestproportionofCO2 emissionsinthepulpand paperstage,basicallyremainingataround60%andstillonanupwardtrend.With theimplementationofChina’s“13thfive-yearplan”in2016–2019,theenergystructure adjustmenthasincreased,andtheproportionofCO2 emissionsfromcoalinthepulpand paperstagehasbeenreducedto49.4%by2019.In2013,therewasaphasepeakofCO2 emissionsinthepulpandpaperstage,whichwasattributedtothelargeincreaseincoal consumptionduringthisstage,andaslowdeclineintheChinesecoalpriceindexduring thesameperiod,followedbyasteepdownwardtrendafterthesummer,untillateinthe “12thFive-YearPlan”[51].TheCO2 emissionsshareofelectricityisabove35%,growing from22.65 × 106 tin2000to71.04 × 106 tin2019,withanaverageannualcompound growthrateof5.88%,higherthanthatofcoalat3.24%.ThesumofCO2 emissionsfrom coalandelectricityaccountsformorethan95%ofthetotalCO2 emissionsfromtheentire pulpandpaperstage,whilethesumofCO2 emissionsfromnaturalgasandotherenergy sourcesaccountsforjustunder4%.Moreover,accordingtotheEuropeanPapermaking IndustryFederationCEPI(ConfederationofEuropeanPaperIndustries)[52],datashow thatin2016theEuropeanpapermakingindustrybiomassenergyconsumptionreached 58.82%,naturalgasconsumptionaccountedforabout33.43%,whilecoalaccountedfor only3.96%.Inparticular,intheDutchpapermakingindustryby2009naturalgasenergy consumptionaccountedforabout97%[53].Thisshowsthattheenergyconsumption structureofthepulpandpaperstageofChina’spapermakingindustryisstilldominated bycoalandelectricity,andtheenergystructureadjustmentisyettobestrengthened.
3.4.CO2 EmissionsStatusoftheTransportationStage CO2 emissionsfromtheinputofpaperrawmaterialsduringthetransportationphase ofpaperproductsmainlyincludewoodpulp,wastepaperimports,anddomesticwaste paperrecycling.TheresultsareshowninFigure 5
Overall,from2000to2020,thetotalCO2 emissionsfromthewholelifecycletransportationprocessofpaperproductsincreasedfrom1.59 × 106 ttoamaximumvalueof 11.16 × 10⁶ twithin2017andthengraduallydeclinedto8.07 × 106 tin2020.Thehigh dependenceonpaperrawmaterialimportsisoneofthemainreasonsfortheincreasein CO2 emissionsduringthewholelifecycletransportationofpaperproducts.In2010,CO2 emissionsfromtransportationdeclinedsignificantlyduetohighinternationalpulpand wastepaperpricesandtheaccordinglyreducedimportsofpaperrawmaterials.Comparing theCO2 emissionsofpulpandwastepaperimportandtransportationfrom2000–2017,the gapbetweenthetwohasgraduallynarrowed.Ontheonehand,duetothegradualincrease inChina’swastepaperrecyclingrate,therehasbeenafluctuatingdeclineinwastepaper
stage, while the sum of CO2 emissions from natural gas and other energy sources accounts for just under 4%. Moreover, according to the European Papermaking Industry Federation CEPI (Confederation of European Paper Industries) [52], data show that in 2016 the European papermaking industry biomass energy consumption reached 58.82%, natural gas consumption accounted for about 33.43%, while coal accounted for only 3.96%. In particular, in the Dutch papermaking industry by 2009 natural gas energy consumption accounted for about 97% [53]. This shows that the energy consumption structure of the pulp and paper stage of China’s papermaking industry is still dominated by coal and electricity, and the energy structure adjustment is yet to be strengthened.
3.4. CO2 Emissions Status of the Transportation Stage
CO2 emissions from the input of paper raw materials during the transportation phase of paper products mainly include wood pulp, waste paper imports, and domestic waste paper recycling. The results are shown in Figure 5.
imports.Ontheotherhand,duetothetightforestryresources,theexternaldependence onwoodpulpremainshighandistemporarilydifficulttoimprove,sotheCO2 emissions ofwoodpulpimportandtransportationmaycontinuetoriseinthefuture.Influenced bythe“ImplementationPlanforProhibitingtheEntryofForeignWasteandPromoting theReformofSolidWasteImportManagementSystem”releasedin2017,thestructureof importedrawmaterialsforthepapermakingindustryisadjustedin2018–2020,withthe gapbetweenpulpandwastepapergraduallyexpandingandshowinganoppositepattern tothatof2000–2017.2000–2020,China’swastepaperrecyclingrateincreasesfrom29.5% to46.5%,andCO2 emissionsfromdomesticwastepaperrecyclingtransportareslowly increasing,from0.08 × 106 tin2000to0.41 × 106 tin2020.Comparedwithpaperraw materialimporttransport,domesticwastepaperrecyclingtransportisshorterindistance andtherecyclingvolumeislowerthanthesumofpulpandwastepaperimportvolumein thesameperiod,resultinginitsCO2 emissionsbeingmuchlowerthantheCO2 emissions frompaperrawmaterialimporttransportinthesameperiod.

Figure5. CO2 emissionsfromthetransportationofChinesepaperproducts.
3.5.CO2 EmissionsStatusofWastePaperDisposalStage
TheamountofCO2 releasedfromthewastepaperlandfillandwastepaperincinerationsegmentsofthelifecycleofpaperproductsinChinaisshowninFigure 6.At present,thetotalamountofharmlessdomesticwastedisposalinthecountryhasbeen risingsignificantlyyearbyyear,andthedevelopmenttrendofincinerationvolumeis similartoit,whilethesanitarylandfillvolumeisgrowingveryslowly.InFigure 6,CO2 emissionsfromwastepaperincinerationriseandthosefromlandfillfall,withtheformer increasingatacompoundannualgrowthrate(CAGR)of22.17%andsurpassingthelatter since2013.ThetotalCO2 emissionsfromthewastepaperdisposalphasealsoincreased, withaCAGRof7.76%.Incomparison,theCO2 emissionsperunitofwastepaperlandfill areabout0.55t,whiletheCO2 emissionsperunitofwastepaperincinerationareabout 1.65t,sothelandfillofwastepaperismoreconducivetothelowcarbondevelopmentof paperproductscomparedtoincineration.
Overall, from 2000 to 2020, the total CO2 emissions from the whole life cycle transportation process of paper products increased from 1.59 × 10⁶ t to a maximum value of 11.16 × 10⁶ t within 2017 and then gradually declined to 8.07 × 10⁶ t in 2020. The high dependence on paper raw material imports is one of the main reasons for the increase in CO2 emissions during the whole life cycle transportation of paper products. In 2010, CO2 emissions from transportation declined significantly due to high international pulp and waste paper prices and the accordingly reduced imports of paper raw materials. Comparing the CO2 emissions of pulp and waste paper import and transportation from 2000–2017, the gap between the two has gradually narrowed. On the one hand, due to the gradual increase in China’s waste paper recycling rate, there has been a fluctuating decline in waste paper imports. On the other hand, due to the tight forestry resources, the external dependence on wood pulp remains high and is temporarily difficult to improve, so the CO2 emissions of wood pulp import and transportation may continue to rise in the future. Influenced by the “Implementation Plan for Prohibiting the Entry of Foreign Waste and Promoting the Reform of Solid Waste Import Management System” released in 2017, the structure of imported raw materials for the papermaking industry is adjusted in 2018–2020, with the gap between pulp and waste paper gradually expanding and showing an
Figure 5. CO2 emissions from the transportation of Chinese paper products.
compound annual growth rate (CAGR) of 22.17% and surpassing the latter since 2013. The total CO2 emissions from the waste paper disposal phase also increased, with a CAGR of 7.76%. In comparison, the CO2 emissions per unit of waste paper landfill are about 0.55 t, while the CO2 emissions per unit of waste paper incineration are about 1.65 t, so the landfill of waste paper is more conducive to the low carbon development of paper products compared to incineration.

Figure 6. CO2 emissions from the waste paper disposal of Chinese paper products.
Figure6. CO2 emissionsfromthewastepaperdisposalofChinesepaperproducts.
3.6.ExportPaperandPaperboardCO2 EmissionsStatus
3.6. Export Paper and Paperboard CO2 Emissions Status
Fromaconsumerresponsibilityperspective,CO2 emissionsfromexportedpaper andpaperboardshouldbesubtractedfromthefulllife-cycleCO2 emissionsofthepaper product,whichareshowninTable 3
From a consumer responsibility perspective, CO2 emissions from exported paper and paperboard should be subtracted from the full life-cycle CO2 emissions of the paper product, which are shown in Table 3.
Table 3. CO2 emissions from exported paper and board.
Paper and Paperboard
Table3. CO2 emissionsfromexportedpaperandboard. Year PaperandPaperboard ExportVolume(106 t) CO2 EmissionsperUnitofPaper andBoardProduced(tCO2/t) EmissionsfromtheProductionof PaperandPaperboardforExport(106 t)
3.7.DiscussionoftheLimitationsofOurAnalyticalResults
Thewhole-lifecycleCO2 emissionsofpaperproductsaccountedforinthispaper areconservativeestimates,andtheresultsofthestudyaresubjecttosomelimitations, mainlyincluding:(1)Withregardtothesystemaccountingboundary,CO2 emissions generatedfromtheconsumptionofpaperandpaperboard,CO2 emissionsgenerated fromroadconstructionandrepairandproductionandmaintenanceoftransportation
equipmentduringthewholelifecycletransportationofpaperproductsarenotincludedin theaccountingsystembecauseofthedifficultyinobtainingdata.(2)Intermsofaccounting methods,whenaccountingforCO2 emissionsfromdomesticwastepaperrecyclingin thetransportationstage,itisassumedthatthewastepapergeneratedineachofthe 16majorpaperandpaperboard-producingprovincesisrecycledforpulpingwithinthe province,andthedistanceofthispartofwastepaperrecyclingis0,resultinginnegligible CO2 emissions;thewastepaperfromtheremaining15(non-majorpaperandpaperboard producing)provincesisrecycledandtransportedtothenearestmajorpaperandpaperboard producingprovince(regionorcity),andthedistancebetweentheprovincialcapitalsof thetwoprovincesistakenasthedistanceofwastepaperrecycling,whichmaybeslightly lowerthantheactualtransportationdistance,resultinginlowerCO2 emissionsfromwaste paperrecyclingandtransportation.(3)Somedataparameters(suchasCO2 emissions coefficientsofdifferenttransportationmodes)areadoptedfromrelevantEuropeanresearch data,whiletherearecertaindifferencesbetweenthedevelopmentofChinaandEurope, whichwillaffecttheaccuracyoftherelevantparametersused.Inaddition,thispapersets theCO2 emissionscoefficientsrelatedtoeachstageofthestudyperiodunchanged,but thecorrespondingCO2 emissionscoefficientsmaydecreasewiththeimprovementofthe technologylevelinvariousaspects,whichwillleadtosomeerrorsintheaccountingresults. (4)RegardingtheaccountingmethodofCO2 emissionsused,therearerelevantreferences forCO2 emissionsaccountingmethodslistedinourpaper.Amongsimilarstudies,CO2 emissionsaccountingstudiesfromtheperspectiveofdifferentpulptypesarerelatively consistentwiththeresultsofthispaper[7,27].Inaddition,theCO2 emissionstrendofthe papermakingindustryinthisarticleisconsistentwiththeoverallsituationofCO2 emissions ofthemanufacturingindustryinChina[54],whilereflectingtheindustrialcharacteristics oflowcarbondevelopment,transformation,andupgradingofthepapermakingindustry.
4.ForecastofLCACO2 EmissionsScenariosforPaperProductsinChina
Sincethepulpandpaperandwastepaperdisposalstageisthemainstageofthewhole lifecycleofCO2 emissionsofpaperproducts,reductioninCO2 emissionsintheprocess ofpulpandpaperandwastepaperdisposalisthekeylinktolowcarbondevelopment ofpaperproductsinChina.Accordingly,thispaperfurtherpredictsthewholelifecycle ofCO2 emissionsofpaperproductsinChinafrom2020to2035usingscenarioanalysis. Amongthem,thebaselinescenariousescurvefittingtopredictCO2 emissionsateach stageofthewholelifecycleofpaperproducts,i.e.,CO2 emissionsarepredictedforeach stageofthewholelifecycle,andthenaggregatedintothetotalCO2 emissionsofthe wholelifecycleofpaperproducts.Low-carbonscenarioIonlyimprovesthewastepaper recoveryrate,otherwisethesameasthebaselinescenario;low-carbonscenarioIIonly improvestheenergyconsumptionstructureinthepulpandpaperstage,otherwisethe sameasthebaselinescenario;low-carbonscenarioIIIimprovesboththeenergystructure andwastepaperrecoveryrate,otherwisethesameasthebaselinescenario.Intermsof scenarioparameters,thepaperrecyclingproblemiscomplexandcomprehensive,which isreflectedinthefactthatpaperrecyclingcannotachieveahighrecyclingrateunderthe existingcircumstancesduetotheeconomicstructure,papercharacteristics,andrecycling algorithmsinChina.Inthispaper,wesettheoptimizationcriteriainthescenarioprediction bycombiningthepolicyproposalandtheimpactofthe“wasteseparation”policyonCO2 emissionsinthewastepaperdisposalstage.LowcarbonscenarioIsetsChina’swaste paperrecyclingrateto74%in2035withreferencetoEurope’swastepaperrecyclingrate of74%in2020,andassumesalinearincreaseinthewastepaperrecyclingratefrom2020 to2035.ForthelowcarbonscenarioII,withreferencetotherequirementsintheoutline ofthe“14thfive-yearplan”andthe2035visionarygoalsfornationaleconomicandsocial developmentofthePeople’sRepublicofChinaissuedbytheNationalDevelopmentand ReformCommission,theproportionofnon-fossilenergyconsumptionin2035issettobe about20%[55],theproportionofcoalconsumptioniswithin49%,naturalgasismorethan 13%,andoilisabout16%[56].Thetotalenergyconsumptionofthepapermakingindustry
recycling rate of 74% in 2020, and assumes a linear increase in the waste paper recycling rate from 2020 to 2035. For the low carbon scenario II, with reference to the requirements in the outline of the “14th five-year plan” and the 2035 visionary goals for national economic and social development of the People’s Republic of China issued by the National Development and Reform Commission, the proportion of non-fossil energy consumption in 2035 is set to be about 20% [55], the proportion of coal consumption is within 49%, natural gas is more than 13%, and oil is about 16% [56] The total energy consumption of the papermaking industry in this scenario is obtained from the industrial output value and energy intensity, while the energy structure is set to change linearly, where the industrial output value is fitted to the model curve using SPSS software. To avoid the effect of energy intensity effect on CO2 emissions reduction, the energy intensity is assumed to be the same as in 2016. The scenario projection results are shown in Figure 7.
inthisscenarioisobtainedfromtheindustrialoutputvalueandenergyintensity,while theenergystructureissettochangelinearly,wheretheindustrialoutputvalueisfitted tothemodelcurveusingSPSSsoftware.Toavoidtheeffectofenergyintensityeffecton CO2 emissionsreduction,theenergyintensityisassumedtobethesameasin2016.The scenarioprojectionresultsareshowninFigure 7.

Figure7. PredictionofCO2 emissionsfromlifecycleofpaperproductsunderthelowcarbonscenario.
Figure 7. Prediction of CO2 emissions from life cycle of paper products under the low carbon scenario.
From the predicted results, under the existing policy, CO2 emissions from paper products in China’s papermaking industry will peak around 2025 at about 223 × 106 t, and the peak trend will be very smooth, with CO2 emissions fluctuating only within 1 × 10⁶ t from 2023 to 2026. In general, improving the energy mix and increasing the recycling rate of waste paper can curb CO2 emissions throughout the life cycle of paper products. The projections of the baseline scenario show that, under the existing policy background, the
Fromthepredictedresults,undertheexistingpolicy,CO2 emissionsfrompaper productsinChina’spapermakingindustrywillpeakaround2025atabout223 × 106 t,and thepeaktrendwillbeverysmooth,withCO2 emissionsfluctuatingonlywithin 1 × 10⁶ t from2023to2026.Ingeneral,improvingtheenergymixandincreasingtherecycling rateofwastepapercancurbCO2 emissionsthroughoutthelifecycleofpaperproducts. Theprojectionsofthebaselinescenarioshowthat,undertheexistingpolicybackground, thesystematicandcontinuousadjustmentoftheindustrialstructureofthepapermaking industryinChinasincethe“12thFive-YearPlan”hasachievedsignificantresults.The emissionsreductioneffectoflow-carbonscenarioIIbasedonenergyconsumptionstructure isbetterthanthatoflow-carbonscenarioIbasedonwastepaperrecyclingrate,andthe differenceinCO2 emissionsreductionbetweenthetwoisrelativelyminor.Theprojection resultsoflowcarbonscenarioIIIshowthatsimultaneouslyimprovingtheenergymixand increasingthewastepaperrecyclingratearemoreeffectiveinreducingtotalCO2 emissions. Comparedwiththebaselinescenario,theCO2 emissionsreductionofthewholelifecycleof paperproductsfrom2021–2035increasesfrom49.04 × 106 tto86.82 × 106 t,whichisclose totheCO2 emissionsofthepulpandpaperstagein2003–2004,andtheemissionsreduction contributionrateisalsoashighas41.63%in2035,whichismoreeffectivethantheeffect oflowcarbonscenariosIandII.Inalow-carboncontext,thepapermakingindustry,asa traditionalhigh-energy-consumingandhigh-emissionsindustry,canachieveafasterand moreeffectivelow-carbondevelopmentpath.
5.Conclusions
FromtwodimensionsandfourstagesofreducingCO2 emissionsandincreasing carbonsequestration,weproposethefollowingemissionsreductionstrategyforthewhole lifecycleofpaperproducts(Figure 8).
(1) Therawmaterialacquisitionstage.CombinedwiththeCO2 emissionsaccountingand scenariopredictionresultsinthispaper,thepulpandpaperstageisthestagewiththe largestshareofemissionsinthepapermakingindustry(over70%).Itsenergystructure adjustmentisthetoppriorityforthelow-carbondevelopmentofthepapermaking industry.Specifically,weproposethefollowing:Firstly,increasetheapplication ofcogenerationtechnologyinthepapermakingindustry.Throughcogeneration technology,papercompaniescanusethesteamgeneratedforpowergeneration
inpulpandpaperproductionthroughtemperatureandpressurereduction,which cansignificantlyimprovetheutilizationrateofenergyandreducetheproduction costsofpapercompanies.Inthisregard,intheEuropeanpapermakingindustry cogenerationpoweraccountedfor96%ofthetotalelectricityconsumption,China’s correspondingproportiononthisislessthan50%,hence,thedevelopmentpotential isenormous.Secondly,increasetheapplicationofbiomassenergy.Therawmaterial ofthepapermakingindustrymainlycomesfromplants.Afterextractingfiberfrom plants,inthepulpingprocessbyconvertingtheremainingorganicmatterintobiomass energyefficiently,itcansignificantlyreducetheconsumptionoffossilenergyand reducetheemissionsofCO2.InEurope,papermillshavebeenabletoachieve anon-fossilenergyconsumptionratioofmorethan57%byefficientlyconverting organicmatterfrompaperresiduesintobiomassenergy.Forexample,biodiesel producedbyUPMinFinlandfromtheby-productsofpulpproductioncanreduce CO2 emissionsby80%[57].SomeJapanesepapercompaniesmakefulluseoftheir ownbiomassresources,whilepurchasingwasterubberandwoodfromsocietyand treatingmunicipalwaste,sothat100%oftheirenergyconsumptionisbiomassenergy, therebyreducingtheCO2 generatedbyenergyconsumption.
(2) Thepulpandpaperstage.Thisstagerequiresgreatereffortstosortwasteinrecycling. Forexample,thethreetypesofwastepaper—oldnewspapers,books,andcardboard boxes—containdifferentvarietiesofpulp,andthemechanicalandchemicalpulp obtainedfromtheirrecyclinghasdifferentproperties.Ifalargeamountofchemical pulpismixedintothemechanicalpulp,thecorrugatedboxesproducedwillbecome softandlosetheiroriginalload-bearingandpressure-resistantcapacity.So,the strongerandmoredetailedtheclassificationofalltypesofwastepaper,thehigher thevalueitwillproduce.WithChina’swastepapernearingthelimitofrecyclable volume,greaterrecyclingandsortingeffortscanprovidenewideasforreducing CO2 emissions.
(3) Thewastepaperdisposalstage.Although“thepolicyofbanningwasteimports” hasledtoasignificantreductioninCO2 emissionsfromimports,theimbalance betweensupplyanddemandhasledtohighpricesofwastepaperrawmaterials andseriousadulteration,somanypapercompanieshavehadtorevisetheirwaste paperacquisitionqualitystandards,whichhashadaseriesofadverseeffectsonthe papermakingindustry.Inresponsetotheproblem,itisrecommended“thepolicyof banningwasteimports”torefinetheimportofsolidwastetoavoid“one-size-fits-all”. Fromtheperspectiveofcirculareconomyandenvironmentalprotection,China’s ownexportstakeawaythepackagingandinstructionsandotherpaperproducts throughtheimportofthewaytorecycleisamorescientificandmoreenvironmentally friendlychoice.
(4) Thetransportationstage.First,increasingsustainablemanagementofforests.With thecertificationofforestcertificationorganizations,wecaneffectivelyreduceCO2 emissionsbysupervisingandmanagingtheentirevaluechainfromforestmanagementtopaperproductproductionthentoconsumerrecycling.Second,promote the“forest-pulp-paperintegration”model,effectivelyreducingCO2 emissionsfrom therawmaterialacquisitionstageoftheaggregationandtransportationoperations. Third,promotetheoptimalrotationperiodsystemforforests,choosesuitabletree speciesaccordingtolocalconditionsandmaintainareasonableforestagestructureso thattheforestcanabsorbthemaximumamountofCO2.Fourth,toreducetheuse ofnon-woodpulpintheproportionofrice-wheatstrawpulp.Theuseofrice-wheat strawpulpisanimportantreasonfortherelativelylargeproportionofCO2 emissions inthepulpandpaperstage.Promotingthecleanproductionofreedrawmaterials andotherpulpandpapercaneffectivelyreduceCO2 emissions.Inaddition,theuse ofbamboopulpandpaperisalsoaneffectivepathtoreduceCO2 emissions.
5. Suggested Paths to Promote Low-Carbon Development in the Papermaking Industry
From two dimensions and four stages of reducing CO2 emissions and increasing carbon sequestration, we propose the following emissions reduction strategy for the whole life cycle of paper products (Figure 8).

8. Low carbon development route map for the whole life cycle of papermaking industry.
Figure8. Lowcarbondevelopmentroutemapforthewholelifecycleofpapermakingindustry.
References
ToachievetheSustainableDevelopmentGoalsandtheemissionreductiontargets intheINDCframeworkforChina’spapermakingindustrywewillneedtostudymore aspectsbeyondourcurrentarticle’sfocusonCO2 emissions.Theoutlookfrom“atree” to“apieceofpaper”suggeststhatthewholeindustrychaininvolvesmorethanjustCO2 emissions.Inthefuture,welookforwardtoconductingmoreresearchonforests,natural gas,andbiomasstopromotesustainabledevelopmentandachievecleanproduction.
Nowadays,China’spapermakingindustryisgraduallydevelopingintoanindustry withrecyclableresources,lowenergyconsumption,andlowemissions,butthereisstilla largegapinindustrialstructureandenergyutilizationefficiencycomparedtodeveloped countries’papermakingindustry.Foralongtimetocome,China’slow-carbondevelopment pathmustalwaysadheretotheconceptofgreendevelopment,synergizetechnology, management,finance,andothermultiplemeans.
(1) The raw material acquisition stage Combined with the CO2 emissions accounting and scenario prediction results in this paper, the pulp and paper stage is the stage with the largest share of emissions in the papermaking industry (over 70%). Its energy structure adjustment is the top priority for the low-carbon development of the papermaking industry. Specifically, we propose the following: Firstly, increase the application of cogeneration technology in the papermaking industry. Through cogeneration technology, paper companies can use the steam generated for power generation in pulp and paper production through temperature and pressure reduction, which can significantly improve the utilization rate of energy and reduce the production costs of paper companies. In this regard, in the European papermaking industry cogeneration power accounted for 96% of the total electricity consumption, China’s corresponding proportion on this is less than 50%, hence, the development potential is enormous. Secondly, increase the application of biomass energy. The raw material of the papermaking industry mainly comes from plants. After extracting fiber from plants, in the pulping process by converting the remaining organic matter into biomass energy efficiently, it can significantly reduce the consumption of fossil energy
AuthorContributions: J.Y.(JiamengYang)conceptualization,formalanalysis,validation,supervision;Y.H.methodology,datacuration,writing—originaldraft;J.Y.(JiarongYe)investigation, visualization;S.X.writing—originaldraft;Z.L.formalanalysis,writing—reviewandediting.All authorshavereadandagreedtothepublishedversionofthemanuscript.
Funding: ThisresearchwasfinanciallysupportedbytheMajorprojectofNationalSocialScience FoundationofChina(GrantNo.20&ZD092).
DataAvailabilityStatement: Notapplicable. ConflictsofInterest: Theauthorsdeclarenoconflictofinterest.
1. IEA. WorldEnergyOutlook2009;OECDPublishing:Paris,France,2009.
2. IEA.CO2 EmissionsfromFuelCombustion[EB/OL](2021-05-09).Availableonline: https://www.iea.org/data-and-statistics (accessedon9December2021).
3. NationalBureauofStatistics. ChinaStatisticalYearbook(2000–2021);ChinaStatisticsPress:Beijing,China,2021.(InChinese)
4. Wang,Q.C.2019globalpaperdevelopmentreport2019GlobalPaperDevelopmentReport. ChinaPulpPap.Ind. 2020, 41,22–25. (InChinese)
5. Liu,Y.;Shen,W.;Man,Y.;Liu,Z.;Seferlis,P.OptimalschedulingratioofrecyclingwastepaperwithNSGAIIbasedon deinked-pulppropertiesprediction. Comput.Ind.Eng. 2019, 132,74–83.[CrossRef]
6. ChinaPaperAssociation. China’sPaperIndustry2000–2020AnnualReport;ChinaPaperAssociation:Beijing,China,2021. (InChinese)
7. Man,Y.;Li,J.;Hong,M.;Han,Y.Energytransitionforthelow-carbonpulpandpaperindustryinChina. Renew.Sustain.Energy Rev. 2020, 131,109998.[CrossRef]
8. Fleiter,T.;Fehrenbach,D.;Worrell,E.;Eichhammer,W.EnergyefficiencyintheGermanpulpandpaperindustry–Amodel-based assessmentofsavingpotentials. Energy 2012, 40,84–99.[CrossRef]
Figure
9. Zhang,X.;Zhang,F.;Cai,H.;Zhang,H.ARepresentativeStudyofCO2EmissionsandCarbonIntensityBasedonaCaseofa PulpandPaperMillinChina:CalculationandAnalysis. BioResources 2017, 12,6157–6172.[CrossRef]
10. Wang,S.;Li,Q.;Fang,C.;Zhou,C.Therelationshipbetweeneconomicgrowth,energyconsumption,andCO2emissions: EmpiricalevidencefromChina. Sci.TotalEnviron. 2016, 542,360–371.[CrossRef]
11. Wang,X.F.;Cui,Z.J.;Yu,F.Analysisofgreenhouseeffectcarbonemissionequivalentofdifferentrawmaterialpulpingsystems. Pap.Pap.Mak. 2013, 32,1–5.(InChinese)
12. Chen,C.;Qiu,R.Z.EstimationofenergyconsumptionandcarbonemissionofpulpandpaperindustryinChina. ChinaPulpPap. 2014, 33,50–55.(InChinese)
13. Zhao,Q.J.;Wen,Z.M.;Zhang,M.X.;Anne,T.ResearchonimplicitcarbonflowandcarbonemissionmeasurementbasedonForest Pulpandpapersupplychain. ChinaPopul.Resour.Environ. 2018, 28,39–46.(InChinese)
14. FurszyferDelRio,D.D.;Sovacool,B.K.;Griffiths,S.;Bazilian,M.;Kim,J.;Foley,A.M.;Rooney,D.Decarbonizingthepulpand paperindustry:Acriticalandsystematicreviewofsociotechnicaldevelopmentsandpolicyoptions. Renew.Sustain.EnergyRev. 2022, 167,112706.[CrossRef]
15. Li,D.F.;Cao,Z.L.;Lu,B.R.;Chen,X.Lifecycleassessmentanditsapplicationinpaperindustry. ChinaPulpPap. 2009, 28,62–65. (InChinese)
16. Liu,H.B.;Li,J.G.;Tao,J.S.Somethoughtsondevelopinglowcarbonpaperindustry. ChinaPulpPap. 2011, 30,51–56.(InChinese)
17. Ma,Q.Q.;Lu,B.R.;Zhang,Q.W.Carbonfootprintevaluationmethodofpaperproductsbasedonlifecycleassessment(LCA). ChinaPulpPap. 2012, 31,57–62.(InChinese)
18. Tang,Y.H.OnthelifecycleofChina’spaperindustryandthestrategicmeasuresthatenterprisesshouldtakeatthisstage. China PulpPap.Ind. 2002, 03,38–40.(InChinese)
19. Zheng,B.C.ResearchonproductlifecycleandstrategyofChina’spaperindustry. ChinaPulpPap.Ind. 2014, 35,42–47.(InChinese)
20. Lopes,E.;Dias,A.;Arroja,L.;Capela,I.;Pereira,F.ApplicationoflifecycleassessmenttothePortuguesepulpandpaperindustry. J.Clean.Prod. 2003, 11,51–59.[CrossRef]
21. Dias,A.C.;Louro,M.;Arroja,L.;Capela,I.EvalutionoftheEnvironmentalPerformanceofPrintingandWritingPaperUsingLife CycleAssessment. WorldPulpPap. 2011, 15,1–12.
22. Gemechu,E.D.;Butnar,I.;Gomà-Camps,J.;Pons,A.;Castells,F.AcomparisonoftheGHGemissionscausedbymanufacturing tissuepaperfromvirginpulporrecycledwastepaper. Int.J.LifeCycleAssess. 2013, 18,1618–1628.[CrossRef]
23. Chen,S.;Yang,X.G.;Li,Y.P.;Cao,L.;Yue,W.Z.AnalysisofGHGemissioninthewholelifecycleofChinesepaperproducts. J. BeijingUniv.Technol. 2014, 40,944–949.(InChinese)
24. Peters,G.P.;Hertwich,E.G.Post-Kyotogreenhousegasinventories:Productionversusconsumption. Clim.Change 2008, 86,51–66. [CrossRef]
25. Ma,C.M.;Xu,H.Q.;Su,M.S.Researchprogressofgreenhousegasinventorypreparationmethod. Prog.Geogr. 2013, 32,400–407. (InChinese)
26. Han,Z.;Chen,Y.H.;Shi,Y.Calculationanddecompositionofconsumptioncarbonemissionsfromtheperspectiveofinternational finaldemand. J.Quant.Tech.Econ. 2018, 35,114–129.(InChinese)
27. Peng,L.;Zeng,X.;Wang,Y.;Hong,G.-B.AnalysisofenergyefficiencyandcarbondioxidereductionintheChinesepulpand paperindustry. EnergyPolicy 2015, 80,65–75.[CrossRef]
28. González-García,S.;Hospido,A.;Feijoo,G.;Moreira,M.T.Lifecycleassessmentofrawmaterialsfornon-woodpulpmills:Hemp andflax. Resour.Conserv.Recycl. 2010, 54,923–930.[CrossRef]
29. Ghose,A.;Chinga-Carrasco,G.EnvironmentalaspectsofNorwegianproductionofpulpfibresandprintingpaper. J.Clean.Prod. 2013, 57,293–301.[CrossRef]
30. Wang,X.;Zhao,X.;Wang,Y.Q.;Xue,J.F.;Zhang,H.L.CarbonfootprintanalysisofriceproductioninChina. Resour.Sci. 2017, 39, 713–722.(InChinese)
31. EuropeanChemicalIndustryCouncil;EuropeanCommunitiesTradeMarkAssociation. GuidelinesforMeasuringandManaging CO2 EmissionfromFreightTransportOperations;Cefic:Brussels,Belgium,2011.
32. Ji,J.Y.;Kong,J.J.AstudyoncarbonemissionpredictionofmarinetransportationindustrybasedonSTIRFDTmodel. Sci.Technol. Manag.Res. 2012, 32,79–81.(InChinese)
33. Li,Q.;Tian,X.Y.ExportandimporteffectsofASEAN“10+3”:Astudybasedonathree-dimensionalgravitymodel. Int.Trade Issues 2010, 06,47–53.(InChinese)
34. Lei,L.;Liu,J.L.;Yang,K.J.StudyonthefactorsinfluencingChina’simportandexporttradeanditsdevelopmentpotentialinthe contextof“OneBelt,OneRoad”-Analysisbasedonthegravitationalmodelincludingcarbonproductivity. Financ.Econ. 2018, 02, 55–60.(InChinese)
35. Lu,J.;Shi,B.Z.HowfarinlandChinaisfromthesea:Astudybasedonthedifferenceofforeigntradescaleamongprovinces. WorldEcon. 2014, 37,32–55.(InChinese)
36. Guo,C.Y.Overviewofdomesticandinternationalwastepapermarketin2016. Pap.Inf. 2017, 10,71–80.(InChinese)
37. Zhou,Y.;Li,D.;Wu,Z.L.;Zhou,C.J.;Zhen,L.F.Analysisofcarbonemissionduringforestminingandtransportation. For.Eng. 2014, 30,1–5.(InChinese)
38. Zhang,Z.X.;Zhou,X.N.;Zhao,C.;Chen,Y.F.Optimizationofecologicalminingandtransportationoperationmodeofplantation insouthernforestarea. ScientiaSilvaeSinicae 2008, 05,128–134.(InChinese)
39. Zhang,K.Y.ScientificResearchEvaluationonComprehensiveUtilizationTechnologyofCropStrawinJiangsuProvince.Master’s Thesis,NanjingAgriculturalUniversity,Nanjing,China,2016.(InChinese).
40. Sun,S.R.;Guo,Y.;Yue,J.Q.OverviewofricestrawresourcesforpulpingandpapermakinginChina. TianjinPap.Mak. 2015, 37, 2–7.(InChinese)
41. Li,Z.Z.CurrentsituationofagriculturalstrawresourcesforpapermakinginChina. ChinaPulpPap. 2014, 33,56–60.(InChinese)
42. Wang,X.Y.StudyontheamountandTemporalandSpatialDistributionofFieldCropStrawResourcesFocusingonEastChina, CentralSouthandSouthwestChina.Ph.D.Thesis,ChinaAgriculturalUniversity,Beijing,China,2014.(InChinese).
43. NationalBureauofStatistics. ChinaRuralStatisticalYearbook(2000–2020);ChinaStatisticsPress:Beijing,China,2020.(InChinese)
44. PricedepartmentofnationaldevelopmentandReformCommission. CompilationofCost-BenefitDataofNationalAgricultural Products(20012020);ChinaStatisticsPress:Beijing,China,2001.(InChinese)
45. Huang,X.M.;Chen,C.Q.;Chen,M.Z.;Song,Z.W.;Demg,A.X.;Zhang,J.;Zhen,C.Y.;Zhang,W.J.Carbonfootprintofmajorgrain cropproductioninthethreenortheasternprovincesfrom2004to2013. Chin.J.Appl.Ecol. 2016, 27,3307–3315.(InChinese)
46. Xue,J.;Liu,S.;Chen,Z.;Chen,F.;Lal,R.;Tang,H.-M.;Zhang,H.-L.Assessmentofcarbonsustainabilityunderdifferenttillage systemsinadoublericecroppingsysteminSouthernChina. Int.J.LifeCycleAssess. 2014, 19,1581–1592.[CrossRef]
47. NationalDevelopmentandReformCommission. GuidelinesforthePreparationofProvincialGreenhouseGasInventories(Trial); NationalDevelopmentandReformCommission:Beijing,China,2011.(InChinese)
48. ChinaPaperSocietyChinaPaperYearbook(2000–2020);ChinaLightIndustryPress:Beijing,China,2021.
49. NationalBureauofStatistics. ChinaUrbanConstructionStatisticalYearbook(2000–2020);ChinaStatisticsPress:Beijing,China,2020. (InChinese)
50. Lv,G.F.UKpaperindustrycontinuestoreducecarbondioxideemissions. ChinaPap.Newsl. 2015, 09,76.(InChinese)
51. ChinaCoalIndustryAssociationChinacoalpriceindex[EB/OL](2021).Availableonline: http://www.coalchina.org.cn/page/ newsmore.jsp?typeid=3240 (accessedon5December2021).(InChinese).
52. ConfederationofEuropeanPaperIndustries. KeyStatistics2017—EuropeanPulp&PaperIndustry;CEPI:Brussels,Belgium,2017. (InChinese)
53. Laurijssen,J.;Faaij,A.;Worrell,E.EnergyconversionstrategiesintheEuropeanpaperindustry—Acasestudyinthreecountries. Appl.Energy 2012, 98,102–113.[CrossRef]
54. Shao,S.;Zhang,X.;Zhao,X.R.EmpiricaldecompositionandpeakpathsofcarbonemissionsinChina’smanufacturing industry–generalizedDixieindexdecompositionanddynamicscenarioanalysis. ChinaInd.Econ. 2017, 3,44–63.(InChinese)
55. NationalDevelopmentandReformCommission. The14thFiveYearPlanforNationalEconomicandSocialDevelopmentofthePeople’s RepublicofChinaandtheOutlineofLong-TermObjectivesfor2035;People’sPublishingHouse:Beijing,China,2021.(InChinese)
56. Hao,Y.;Zhang,Z.Y.;Liao,H.China’senergy“newnormal”:The13thfive-yearplanandtheenergyeconomyoutlookin2030. J. BeijingInst.Technol.Soc.Sci.Ed. 2016, 18,1–7.(InChinese)
57. UPMChina.ClimatePositiveForestryandBiodiversityImprovement[EB/OL](2021).Availableonline: https://www.upm. com/responsibility/forests/ (accessedon6May2022).
PAPERmaking!
FROM THE PUBLISHERS OF PAPER TECHNOLOGY INTERNATIONAL®
Volume10, Number2, 2024
Quality evaluation of water disclosure of Chinese papermaking enterprises based on accelerated genetic algorithm
CHAORAN HE1, JUQIN SHEN2, JIAWEI XU1, FUHUA SUN2 & BING WANG3
As the carrier of enterprise water resources management disclosure, water information disclosure is a means of expression of enterprises’ environmental responsibility. First, a corporate water information disclosure quality evaluation index system and evaluation method are established, and with the help of the projection tracing method of accelerated genetic algorithm, 27 paper companies in China are selected as a sample and the disclosure quality level is analyzed empirically. Then, the analysis is carried out in terms of three changes in vertical trends, horizontal trends and changes in laws, regulations and policies, and the results show that Chinese paper and paper product enterprises have low quality of water information disclosure, weak disclosure content and low voluntary disclosure. Finally, feasible suggestions are made based on the evaluation of disclosure issues.
Contact information:
1 Business School, Hohai University, Nanjing 210098, China.
2 College of Agricultural Science and Engineering, Hohai University, Nanjing 210098, China.
3 Xuchang Bureau of Hydrology and Water Resources Investigation, Xuchang 461000, China.
www.nature.com/scientificreports, (2023) 13:12225 https://doi.org/10.1038/s41598-023-39307-y
Creative Commons Attribution 4.0 International License
The Paper Industry Technical Association (PITA) is an independent organisation which operates for the general benefit of its members – both individual and corporate – dedicated to promoting and improving the technical and scientific knowledge of those working in the UK pulp and paper industry. Formed in 1960, it serves the Industry, both manufacturers and suppliers, by providing a forum for members to meet and network; it organises visits, conferences and training seminars that cover all aspects of papermaking science. It also publishes the prestigious journal Paper Technology International® and the PITA Annual Review, both sent free to members, and a range of other technical publications which include conference proceedings and the acclaimed Essential Guide to Aqueous Coating.
Quality evaluation of water disclosure of Chinese papermaking enterprises based on accelerated genetic algorithm
Chaoran He 1, Juqin Shen 2, Jiawei Xu 1, Fuhua Sun 2* & Bing Wang 3
As the carrier of enterprise water resources management disclosure, water information disclosure is a means of expression of enterprises’ environmental responsibility. First, a corporate water information disclosure quality evaluation index system and evaluation method are established, and with the help of the projection tracing method of accelerated genetic algorithm, 27 paper companies in China are selected as a sample and the disclosure quality level is analyzed empirically. Then, the analysis is carried out in terms of three changes in vertical trends, horizontal trends and changes in laws, regulations and policies, and the results show that Chinese paper and paper product enterprises have low quality of water information disclosure, weak disclosure content and low voluntary disclosure. Finally, feasible suggestions are made based on the evaluation of disclosure issues.
As an important traditional manufacturing industry, the paper industry is closely related to social development and ecological environment, and is also an important part of water consumption. As a disclosure carrier of corporate water resources management, water information disclosure describes the relevant information of corporate water use and drainage through monetary performance or volume, and discloses non-fnancial reports on corporate water management, strategy and other business risks and opportunities to stakeholders (Te CEO Water Mandate, 2014), which occupies an important part of environmental information disclosure. With the intensifcation of global climate change and the increasing strain on industrial water use, the importance of corporate water information disclosure has made Chinese enterprises have begun to pay attention to their own water resource management, and gradually integrate water resource management into high-level supervision (Carbon Disclosure Project China, 2020). Te research feld of water resources management mainly focuses on the infuence of macro factors on enterprise water resources management from the perspective of economics1, the strategy of corporate water resources from the perspective of management2, the improvement of enterprise water resources accounting capacity from the perspective of water management accounting3, and the development of comprehensive framework of enterprise water management accounting4. Whether in practice or theoretical research, water environment issues have gradually been paid attention to by enterprises. Green development with the goal of "water-saving priority" has become one of the important directions for the development of the paper and paper products industry.
According to the statistics compiled by the China Environmental Statistical Yearbook, the wastewater discharge of the paper industry accounted for 12.3% in 2020, second only to chemical raw materials and chemical products manufacturing, and is the second largest industry in China’s industrial wastewater discharge. Although the Administrative Measures for the Legal Disclosure of Enterprise Environmental Information reviewed by the Ministry of Ecology and Environment clarifes the accurate and complete disclosure of environmental information by enterprises. However, in the actual enterprise report disclosure, the information disclosure on water consumption, total groundwater withdrawal control and wastewater emission reduction is far lower than expected, and there are problems such as incomplete and inconsistent water information disclosure and weak water performance disclosure. Water information disclosure by enterprises not only promotes the transformation of enterprises from extensive management to refned management mode, but also optimizes the water resource management mechanism of enterprises, which is more important for sustainable water resources management5 With the increasing attention of society to the environment, the information disclosure of listed companies has
1Business School, Hohai University, Nanjing 210098, China. 2College of Agricultural Science and Engineering, Hohai University, Nanjing 210098, China. 3Xuchang Bureau of Hydrology and Water Resources Investigation, Xuchang 461000, China. *email: ccranhh@163.com
transitioned from voluntary disclosure to mandatory disclosure, and carbon emission information must be disclosed in the content requirements of environmental information disclosure according to law, but there are few related contents related to water information disclosure, and there are no clear requirements. As a result, enterprises cannot deal with the "internal and external response" problem of water information disclosure, that is, the imbalanced ecological contradiction between enterprises and nature, and human society. In the process of papermaking production and sales activities, enterprises gradually expose the low water efciency and slow update and iteration of water-saving technology, resulting in high production water costs, and increasing the risk of enterprises taking the social responsibility of ecological water as a marketing strategy and public relations means of "greenwashing"; It cannot meet the individualization of stakeholders and their needs, and it is not conducive to the role of the market in allocating resources6
In view of the water information disclosure reports of existing enterprises, how to scientifcally and objectively evaluate the quality of enterprise water information disclosure, and the disclosure of enterprise water information has become a hot spot for scholars. At present, the establishment of an applicable model of enterprise water information disclosure quality has become the most urgent need at present, this paper constructs an evaluation index system of enterprise water information disclosure by sorting out relevant literature and results at home and abroad, and at the same time, based on the quality characteristics of enterprise accounting information disclosure as a research framework. Finally, the improved projection tracing model is used to analyze the water information disclosure quality of paper and paper products enterprises and obtain the fnal evaluation value. Tis paper and paper products industry is trying to analyze whether China’s paper and paper products industry has got rid of water-consuming production methods, aiming to better summarize the current results and problems of intensive water conservation in China’s paper and paper products industry.
Te theoretical contribution of this paper is fourfold, frst, the study is based on the high water consumption and high pollution light industry—Paper and paper products industry as an example, the introduction of sustainable development theory and environmental accounting theory and other research methods, through theoretical analysis from internal factors and external factors two perspectives a comprehensive and systematic analysis of the connotation of enterprise water information disclosure, Te impact of corporate water disclosure on the evaluation of the company’s own water environment and corporate value is explored to provide a theoretical basis for corporate water management and sustainable innovation; then, that is, a corporate water disclosure indicator evaluation system is constructed, which will help stakeholders to assess the understanding of optimal management of water resources within the company, bridging the gap between existing studies in the evaluation of the quality of corporate water disclosure; Next, this paper constructs a model based on projection tracing method, which can overcome the interference of subjective factors and improve the performance of computing more accurately and scientifcally, and improve the algorithm as an accelerated genetic algorithm encoded with real numbers, so as to speed up the convergence speed, improve the accuracy and robustness of the model, and fnally fnd the best projection value of the sample, rank the quality of corporate water disclosure, and solve the subsequent corporate water disclosure laying the foundation for solving the problem; Finally, this paper systematically proposed enterprise water information disclosure index system, based on the quality characteristics of enterprise environmental accounting information, from the four principles of relevance, reliability, efectiveness and comparability, to build a new paper and paper products enterprise water information disclosure Indicator system, enrich the existing literature of water information disclosure system in each level of indicators, improve the practicality of enterprise water information disclosure, and thus has a theoretical contribution to provide planning and decision-making for the sustainable and high-quality development of enterprise water resources cycle.
Te rest of the paper is structured as follows: Sect. “Literature reviews” provides an overview of the factors and quality evaluation methods that afect the disclosure of corporate water information. Te third section constructs the enterprise water information disclosure quality evaluation index system and model, scores based on the four principles of accounting information quality, and adopts the improved projection tracing model method. In the fourth section, the horizontal and vertical process changes of water information quality of China’s A-share papermaking and paper products enterprises are analyzed using weight indicators and fnal evaluation values. Finally, the research conclusions are drawn and recommendations are made for the future water management of the enterprise.
Literature reviews
Only high-quality disclosure of water resources information can enterprises achieve long-term sustainable development. Most of the domestic and international literature focus on the current situation of corporate water information disclosure and the impact mechanism, expressed in the company’s internal and external factors. From the perspective of internal factors, corporate water disclosure is motivated by "internal incentives" and "own risk" considerations7,8. Internal incentives are mainly in the form of corporate governance and business performance. Liu et al.9 used a sample of 781 listed companies to clarify that water information disclosure through fnancing constraints can signifcantly improve fnancial quality, thus establish a good reputation and help enterprises develop capital markets for green credit; Japanese scholars Burritt et al.10 conducted an empirical study on 100 enterprises’ water information disclosure and explored the impact of corporate water risk awareness, media exposure, and ownership dispersion on corporate water disclosure behavior. Malik et al. 11 constructed environmental information disclosure level indicators based on listed companies in China to analyze the signifcance of the environment on corporate performance at macro and micro levels. Liao et al.12, Clarkso et al.13 and Martinez14 found that corporate information disclosure was signifcantly and negatively related to environmental performance. It means that enterprises found to have poor business performance in the early stage should disclose environmental information promptly to avoid future penalties for not fully disclosing it.
Risk is mainly manifested in the enterprise’s own risk. Zkou et al.15 study selected 334 listed companies in China’s high-water risk industry. Te results show that water information disclosure is not signifcantly correlated with enterprise systemic risk, but helps enterprises to attenuate systemic risk. Most of the listed companies’ business development is fnanced by external fnancing. Te "green credit" policy launched by the regulatory authorities combines environmental and fnancial risks, raising higher standards for corporate environmental governance. It can be seen that corporate water information disclosure is more focused on water resources in terms of saving operating costs and improving short-term earnings.
From the perspective of external factors, generally manifested as direct pressure (government) and indirect pressure (media or market), driven by the results of pressure, corporate disclosure of water information is not only a requirement for stakeholders and companies to fulfll their social and environmental obligations, but also a requirement to achieve sustainable and high-quality national and corporate development. Deng Mingjun et al.16 analyzed the motivation mechanism of corporate water information disclosure, explained the mechanism of corporate water information disclosure regulation and realization mechanism, and called on relevant authorities to set quantifable and enforceable evaluation criteria for critical regulations such as "signifcant corporate water-related impact" and "signifcant corporate water-related litigation". We call on relevant authorities to set quantifable and clearly enforceable evaluation criteria for critical provisions such as "company water-related material impact" and "company water-related material litigation, Walid and Mohamed17. Taking a sample of 1166 non-fnancial companies in the CDP report, the empirical test of how national policies and legal systems can help strengthen the level of water information disclosure of enterprises, and Shen Juqin et al.18 constructed a water information phi level indicator system in line with China’s national conditions, and verifed the sensitivity of social monitoring to water information disclosure through model testing, indicating that under external environmental governance, the public and the government attach great importance to the environment and the use of information.information utilization status, and increased the willingness of enterprises to actively disclose. Xu Jianling et al.19 and Zeng et al.20, using a sample of listed companies in highly water-sensitive industries, confrmed that the efect of water information disclosure on corporate risk containment was strengthened by means of media exposure through the news. Media coverage generates reputational pressure to a certain extent, forcing frms to fulfll their environmental responsibilities. Tus, external monitoring plays a leading role in environmental governance, with the public monitoring pollutant emissions and the government compensating for market "failures" and providing subsidies and incentives in tax and credit policies, so that water conservation is elevated to the strategic level of corporate water management actions to achieve high-quality economic development and sustainable and harmonious social and environmental development.
Te choice of diferent evaluation methods will have an impact on the accuracy of the evaluation. Scholars at home and abroad have studied the content of water disclosure through empirical research, and the relevant research results provide more options for improving the level of corporate water disclosure. And there is no unifed standard for evaluating and measuring water information disclosure quality, and many scholars have explored various ways to measure the quality of corporate water information disclosure. Liu CY et al.21 and Yu HC9 took the data of Chinese listed companies as a sample, and afer mathematical and statistical analysis of the disclosed water information, based on the relevant information disclosed in the annual reports of enterprises, to Te "quantitative + qualitative" approach was used to analyze the factors afecting water information disclosure by listed companies based on the coding of water disclosure items by the Global Reporting Initiative (GRI). Liang et al.22 uses the NCA and fsQCA approach to study the joint roles of environmental regulations and other internal and external factors on the quality of environmental information disclosure. Liu Xuewen23 used a combination of fuzzy comprehensive evaluation and hierarchical analysis methods to construct a water environmental information disclosure index system for heavily polluting listed companies, which provided a reference for the evaluation method of enterprise water information disclosure quality, Kleinman24 uses Formal Concept Analysis (FCA) to study water disclosure and water stewardship in the U.S. food and beverage industry.Plumle et al.25 and Clarkson et al.26 evaluated by "content analysis method" and constructed environmental information disclosure indexes for analysis and evaluation, and the study of environmental information disclosure and quality evaluation. As we can see, domestic and foreign scholars are still exploring the methods of information disclosure quality evaluation. Afer the promulgation of the revised Environmental Protection Law in China, what are the main contents of water information disclosed by enterprises to the relevant departments, and what is the impact of the environmental laws and regulations, and policies introduced by the government on enterprises’ disclosure of information about water resources? What is the quality of water information disclosure for high water-consuming manufacturing industries? Do manufacturing enterprises record information on water consumption, withdrawal, and consumption generated in the supply chain? Te existing literature fails to explain well enough to answer the more profound questions behind corporate water information disclosure.
Given the above theoretical and practical limitations, and to implement the ecological civilization construction of intensive and sustainable use of water resources, this paper studies the paper and paper products industry, a typical high water-consuming enterprise in the manufacturing industry, digs deeper and analyzes the disclosure of water information of listed enterprises, and adopts the mainstream method of content analysis to quantify the water information of enterprises. Te content of the disclosure, combined with the projection tracing model of accelerated genetic algorithm, to establish a scientifc and practical quality evaluation system in line with the paper and paper products enterprises, through the evaluation of the value of high and low ranking, analysis of the quality of enterprise water information disclosure, so as to force enterprises to accelerate the development of green transformation and innovation, to provide experience and methodological guidance to achieve sustainable and high-quality development of the paper industry.
Methods
Evaluation index system construction. Currently, China has not yet issued a responsibility report on water information disclosure, and has been in the stage of voluntary disclosure. Te enterprise water information disclosure system is not perfect. Te system is not sound and generally puts the data related to water disclosure into the annual report of listed enterprises, social responsibility report, and sustainable development report, resulting in the lack of uniform standards when enterprises make the disclosure. Tere are diferences. Based on the existing studies (Morikawa et al. and Zeng Huixiang et al.), this paper selects the four basic principles of "relevance", "reliability", "validity", and "comparability" based on the quality characteristics of corporate accounting information disclosure.
Relevance is a corporate environmental report to provide evaluation information useful to users of water resources, and companies through water environmental assets, water environmental liabilities, water environmental costs, and water environmental management impact. Tis water-related information to stakeholders to meet the information needs of interested parties; reliability is used to test the quality of water information disclosure, usually using third-party audit or system certifcation to assess this reliability is used to test the quality of water information disclosure, and third-party audits or systematic certifcation are ofen used to evaluate this information. Currently, the water information disclosure audit has not been established, so the water risk assessment, environmental violations penalties, environmental honors, patented green technology, and corporate environmental emergency plans are selected to refect the truth and objectivity of corporate water information disclosure; validity is the daily production and operation activities of enterprises to provide information about water resources clean production status, water and environmental performance comparison, production process equipment, and staf related education and training, etc. Refect the importance of enterprise water information disclosure, as well as enterprise transformation of water-saving equipment to show the eforts made by enterprises in energy conservation and emission reduction, to eliminate investors’ doubts about whether the enterprise production process is green and environmentally friendly, the indicators to choose the enterprise water resources management performance evaluation, enterprise water conservation measures secondary indicators for efectiveness; comparability refers to diferent enterprises, diferent periods of time can be compared with each other information. Annual reports, social responsibility reports, and environmental reports as disclosure vehicles. Disclosure information will involve the degree of detailed water information disclosure, a horizontal comparison of the report’s content. Content analysis method, "quantitative + qualitative" method, the number and quality of disclosure analysis, each quality dimension assigned a value range of [0 – 3], the higher the score, on behalf of the paper and paper products enterprises more detailed water information disclosure standard. Te results are shown in Table 1
Among the secondary indicators of enterprise water information disclosure quality, we selected water recycling efciency, enterprise COD emissions, environmental information exchange with stakeholders, enterprise daily water management system plans, goals and strategies, and enterprise water management performance evaluation programs as key indicators for evaluation, which refect the key aspects of enterprise water use, water conservation measures, water discharge and wastewater treatment performance. By focusing on these key indicators, companies can better understand their core water management issues and take targeted improvement measures. (1) Water recycling efciency can promote the sustainable use of water resources. By improving water recycling, enterprises can reduce the over-exploitation of natural water bodies and save production costs. By optimizing the recycling technology of water resources, enterprises can demonstrate their innovative ability in resource management and competitive advantages in sustainable development, and enhance their brand image and market competitiveness. (2) COD emissions from enterprises is an important indicator for internationally common detection of the content of organic matter in water bodies and the pollution level of water quality. Monitoring COD emissions helps enterprises identify potential water environmental risks, timely identify the source of water pollution, adjust treatment plans and ensure the safety of discharged water quality. By reducing COD emissions, enterprises can reduce wastewater generation and treatment costs, improve resource utilization efciency, and achieve the dual benefts of energy saving and cost saving. (3) Communicating environmental information with stakeholders is a social responsibility that enterprises should undertake, refecting their concern for environmental protection and sustainable development. On the one hand, it can improve the transparency of information disclosure and convey to stakeholders the performance and responsibility of the enterprise in water resources management, which helps to enhance the reputation of the enterprise. On the other hand, by communicating environmental information disclosure with stakeholders and introducing their opinions and suggestions, it increases the diversity and legitimacy of decision making to help enterprises better respond to the expectations of society. (4) An enterprise’s daily water management system plan, objectives and strategies can clarify the enterprise’s goals and directions in water resources management and provide guidance for the development of specifc action plans and strategies in water resources management. At the same time, it provides a set of systematic strategies and measures to help companies manage and use water resources efectively. In addition, by developing a daily water management system plan, objectives and strategies, companies are better able to identify and manage the risks associated with water management. Tis helps companies comply with relevant laws and regulations and reduce the legal risks they face due to non-compliance with discharge or excessive discharge of pollutants from water bodies. (5) Enterprise water management performance evaluation provides a quantitative assessment of the enterprise’s internal water management practices. Trough information on the status of clean production of water resources, comparative water and environmental performance, production processes and equipment, and employee education and training related to water conservation, companies can identify problems and opportunities for improvement, which can help them understand the efectiveness and efciency of their water management and promote continuous improvement and optimization of water management strategies. Te results are shown in Table 1
Water source (B1)
Water recycling efciency (B2)
Water environment assets (A1)
Water environment liabilities (A2)
Relevance
Water environment costs (A3)
Environmental investment (B3)
Water resources tax or environmental protection tax (B4)
Wastewater abatement treatment expenditure (B5)
Enterprise water consumption (B6)
Enterprise wastewater discharge (B7)
Enterprise COD emissions (B8)
Enterprise daily water management system plans, goals and strategies (B9)
For the area where the water source is sufcient, take the value of 3, generally take the value of 2. For local water shortage 1, water scarcity takes the value of 0
Quantitative and qualitative disclosure of water pollution control and emission reduction information to take the value of 3, quantitative hit 2, qualitative hit 1, otherwise take the value of 0
Quantitative and qualitative disclosure of water pollution control and emission reduction information to take the value of 3, quantitative hit 2, qualitative hit 1, otherwise take the value of 0
Disclosure of the amount of taxes paid quantitative and qualitative disclosure of water pollution control, and emission reduction information is taken as quantitative hit 2, qualitative hit 1, otherwise the value of 0
Quantitative and qualitative disclosure of water pollution control and emission reduction information to take the value of 3, quantitative hit 2, qualitative hit 1, otherwise take the value of 0
Quantitative and qualitative disclosure of water consumption row information to take the value of 3, quantitative hit 2, qualitative hit 1; otherwise, take the value of 0
Quantitative and qualitative disclosure of wastewater discharge information takes the value of 3, quantitative hit 2, qualitative hit 1; otherwise, it takes the value of 0
Quantitative and qualitative disclosure of COD information takes the value of 3, quantitative hit 2, qualitative hit 1, otherwise it takes the value of 0
Disclosure of the company to develop water resources objectives and the completion of the system and other quantitative and qualitative disclosure of water pollution control and emission reduction information to take the value of 3, quantitative hit 2, qualitative hit 1, otherwise take the value of 0
Water environment management (A4)
Reliability Water environment regulation (A5)
Environmental information exchange with stakeholders (B10)
Water risk assessment (B11)
Penalties for environmental violations (B12)
Environmental honors (B13)
Disclosure of environmental information exchange with environmental protection departments at all levels, suppliers, vendors, the public, industry peers, and employees quantitative and qualitative disclosure of water pollution control and emission reduction information take the value of 3, qualitative hit 2, quantitative hit 1, otherwise, take the value of 0
Searching Baidu library and news reports, information such as positive news reports on the existence of physical risk, regulatory risk, and reputational risk of enterprises take the value of 1, negative reports otherwise 0
Disclosure of company environmental penalty information takes the value of 1; otherwise, it is 0
Get environmental protection and water conservation honor to take the value of 2, general environmental protection honor for 1, otherwise take the value of 0 Green patented technology (B14)
Enterprise environmental emergency plan (B15)
Enterprise water management performance evaluation (B16)
Validity Water environment performance (A6)
Te value of the green patent is 1; otherwise, it is 0
Disclosure of information on the company’s emergency mechanism, emergency measures, and programs for major environmental emergencies takes a value of 3 in detail, 2 for quantitative, and 1 for qualitative. Otherwise, it takes the value of 0
Qualitative and quantitative disclosure of information on the status of clean production of water resources, comparative performance of the water environment, production processes and equipment, as well as stafrelated education and training is valued at 3, quantitative hit 2, qualitative hit 1; otherwise, it is valued at 0
Enterprise water conservation measures program (B17)
Corporate annual report (B18)
Qualitative and quantitative disclosure of detailed water conservation measures take the value of 3, quantitative hit 2, qualitative hit 1; otherwise, take the value of 0
Qualitative and quantitative disclosure of relevant water information to take the value of 3, quantitative hit 2, qualitative hit 1; otherwise, take the value of 0
Comparability Disclosure vehicle (A7)
Social responsibility report (B19)
Environmental report (B20)
Qualitative and quantitative disclosure of relevant water information to take the value of 3, quantitative hit 2, qualitative hit 1; otherwise, take the value of 0
Qualitative and quantitative disclosure of relevant water information to take the value of 3, quantitative hit 2, qualitative hit 1; otherwise, take the value of 0
Table 1. Enterprise water information disclosure quality index system.
Corporate water information data from the annual reports, social responsibility reports, and sustainability reports of listed companies in Juchao Consulting and Hexun.com, green patent data from China "CSMAR Solution V4.4", water risk assessment based on the Annual Report and Baidu News Database.
Model specifcation. Te projection tracing model was frst proposed and conducted by U.S. professors Kruskal27,28 in the 1970s as an operational model for cluster analysis to solve the problem of high-dimensional data, many of which do not satisfy the assumption of normality and need to be solved by a robust or nonparametric method. It mainly involves projecting high-dimensional data onto a low-dimensional subspace by some combination, using a projection indicator function to describe the probability size of a certain classifcation ranking structure of the original system, fnding the projection value that makes the projection indicator function optimal, and then analyzing the characteristics of the classifcation structure of high-dimensional data according to that projection value29. Tis method is used in water quality evaluation, land resource carrying capacity, and enterprise accounting information quality evaluation. In this paper, a projection tracing model based on an accelerated genetic algorithm is used to evaluate the quality of corporate water information disclosure. Te specifc process of model construction is as follows30.
Step 1: Normalization of sample indicators. Let the sample set of each indicator value be {x ∗ (i , j )|i = 1,2, , n; j = 1,2, , p}, Among them x ∗ (i , j ) is the value of the Jth indicator for the ith sample, N is the number of samples, and P is the number of indicators in the sample. For the larger and better indicators, the normalization criteria were applied to the indicators using Eq. (1).
which xmin (j ), xmax (j ) are the minimum and maximum values of the Jth index value in the sample set, respectively, x (i , j ) is the sequence of indicator eigenvalues normalized.
Step 2: Construct the projection indicator function. Te projection tracing method is to project the P-dimensional data {x (i , j )|j = 1,2, ··· , p} into the low-dimensional space, Integrated into a one-dimensional projection with a = (a(1), a(2), ... , a(p)) as the projection direction z (i ).
Ten the one-dimensional scatterplot is classifed according to Eq. (2) as a unit length vector for the projection function expressed as
where Sz is the standard deviation of the projection z (i ),Dz is the local density of the projection z (i ); Ez is the mean of the projection, R is the window radius of the local scatter density. rij denotes the distance between samples, rij =|Zi Zj |,u(R rij ) is a frst-order unit step function, When R rij ≥ 0, Its value is 1; R rij < 0, Its value is 0.
Step 3: Optimize the projection direction. Afer determining the sample index value, the Q (a) maximum direction is estimated as the best projection direction,
Step 4: Optimal alignment of samples. According to the optimal projection direction, the projection eigenvalue z (i ) of each evaluation index combined is calculated.
Te genetic algorithm introduces the simulated biological evolution process into the middle algorithm, which is frst converted into genetic space. Afer composing individuals or chromosomes according to the structure of biological evolution, the computational process is optimized by binary coding without restricting the objective function and constraints. Compared with traditional and projection tracking models, its advantages are (1) accelerated genetic algorithms are able to search and improve solutions in the space of feasible solutions, thus improving the multi-dimensional spatial movement tendency of feasible solutions, exploring diverse solutions, and discovering high-quality projections, which can improve the accuracy and robustness of the model, (2) avoiding the drawbacks of traditional projection tracking models that fall into local extremes and early global

Figure 1. Dynamic evolution of the quality of water disclosure by paper and paper product companies, 2017–2021.
convergence. It has inherent parallelism and global superiority seeking capability. (3) Accelerated genetic algorithms are able to speed up convergence in each generation iteration and improve the efciency of fnding optimal projections by using genetic operations such as crossover and mutation to complete the optimization process in a limited amount of time. In this paper, an accelerated genetic algorithm is used to solve complex nonlinear optimization, improve the algorithm’s performance in fnding the best, and solve the high-dimensional global optimum problem. Te basic procedure is as follows31,32
First, the encoding of model real numbers is constructed, and linear optimization is performed:
x (j ) = a(j ) + y (j )(b(j ) a(j )), (j = 1,2..., p); Ten, the initial parent basic group is produced, and N initial string structure data are randomly generated.
{x ∗ (i , j )|i = 1,2, , n; j = 1,2, , p}, A further population of N individuals is generated for evolutionary sorting {f (i )|i = 1,2, , n;}{y (i , j )|i = 1,2, , n; j = 1,2, , p};
Assessment of the degree of adaptation. Te merits and demerits of the individual or solution.
F (i ) = 1/(f 2 (i ) + 0.001); and select the next generation of individuals.
Afer selecting good individuals from each chromosome, the cycle was repeated—forming a new individual PS (i ) = F (i )/ n i =1 F (i )
By cross-operation,
Mutation operation Y3 (i , j ) = u(j ), um < pm (i );Y3 (i , j ) = u(j ), um ≥ pm (i );
Finally iterate. Te cycle is repeated until the best individual in the group of N individuals is found and the operation is fnished.
Results and discussions
Vertical changes in water disclosure for paper and paper product companies. Using 2017–2021 (excluding ST, ST*, and current year listed companies) as sample data, a projection tracing model with an accelerated genetic algorithm was used to analyze the change in the trend of information disclosure about water resources in listed companies of paper and paper products. MATLAB 2022 was used to program the data, and the parents’ initial population size was 200, the crossover probability was 0. 8, the variation probability was 0.1, the number of outstanding individuals was selected as 20, and the number of accelerations was 20. Obtain the best projection direction of the indicator a∗ = (0.1157, 0.2559, 0.1702, 0.1985, 0.2042, 0.3147, 0.2496, 0.3384, 0.1782, 0.2317, 0.1436, 0.1964, 0.1240, 0.2079, 0.1993, 0.2215, 0.2676, 0.2359, 0.2617, 0.2178), and to obtain the value of the investment evaluation of each sample corresponding to the disclosure of water resources information (Fig. 1).
Changes in the vertical projection value of water information disclosure of paper and paper product companies. From the characteristics of the projection value change trend of water information disclosure of paper and paper product enterprises over the years, the projection value of each subsystem shows a staggered state of increase and decrease. Among them, the change trend of the disclosure carrier projection value shows a gradual decrease, as shown in Fig. 1. Water environment regulation, water environment assets, water environment management projection value in 2017 to 2019 overall steadily increasing, especially the water environment assets projection value from 0.4802 to 0.6778, 2019–2021, except for the disclosure carrier and water environment management projection value, showing a slow decline afer a continuous increase, mainly
because of the " COVID-19", in order to reduce the spread of the virus, some localities implemented blockade and quarantine measures, which restricted the daily operations of enterprises, and as the epidemic was controlled, the Chinese government enacted policy measures to stimulate economic growth in order to promote economic recovery and development. As a result, various projection values gradually continued to rise during this period. Te disclosure carrier and water environment management showed a gradual decline in the projection value of enterprise water information disclosure, decreasing from 0.7963 and 0.4724 in 2017 to 0.5833 and 0.3946, respectively. Although in 2020, the government issued the Opinions on Further Improving the Quality of Listed Companies (hereinafer referred to as "Opinions") and the Measures for the Administration of the Legal Disclosure of Enterprise Environmental Information, which put forward the principle of "the disclosure of information on listed companies". Te government issued the "Opinions on Further Improving the Quality of Listed Companies" (hereinafer referred to as "Opinions") and the "Measures for the Administration of Legal Disclosure of Corporate Environmental Information" in 2020, which put forward the requirement of "improving the quality of information disclosure" to further optimize and regulate the activities of legal disclosure of corporate environmental information. However, the disclosure content does not clearly regulate the disclosure of enterprise water information, focusing more on the ecological and environmental information of the production process and carbon emission information of enterprises. Because it is not mandatory for enterprises to disclose information on water consumption, sewage discharge, etc., resulting in paper companies to disclose less content about water resources in the relevant reports, so the disclosure carrier and water environment management projection value continued to decrease from 2017 to 2021, indicating that there are certain risks in the process of using water resources.
From the dynamic evolutionary change characteristics of the projection value, the following fve infuencing factors are mainly summarized (1) From the analysis of tax policy factors, the Chinese government has implemented a series of tax reduction and fee reduction policies for paper enterprises, aiming to help enterprises develop green, promote transformation and upgrading and environmental protection. For the purchase and installation of qualifed wastewater treatment equipment, they can enjoy the VAT reduction policy, and the expenditure related to the purchase and installation of wastewater treatment equipment by enterprises can be included in the cost or ofset against income tax. In addition, the Chinese tax law stipulates that enterprises purchasing fxed assets (such as wastewater treatment equipment) can charge depreciation expenses according to certain depreciable life. Te depreciation expense can reduce the tax burden of enterprises and promote the return of investment. While enjoying tax benefts, in order to restrain the ecological and environmental problems caused by the discharge of enterprise pollutants, the Chinese government started the environmental protection tax on January 1, 2018, to force environmental polluters to reduce pollution and prompt enterprises to transform and upgrade through the imposition of environmental protection tax; (2) from the analysis of technological innovation and application factors, Chinese paper enterprises adopt more efcient and environmentally friendly pulp production technologies, paper-making equipment and processes in the production process. To improve the efciency, quality and paper manufacturing efciency, quality and diversity of pulp production. Tis reduces environmental pollution and resource consumption. (3) From the analysis of industrial structure transformation factors, Chinese paper companies gradually promote the digital and intelligent transformation of paper-making process equipment and apply technologies such as information technology, big data analysis and artifcial intelligence in order to move toward high-quality development of comprehensive strength. Trough the implementation of intelligent manufacturing and water supply chain management, they have improved the efciency of water recycling and daily water management, and explored a new path to develop a circular economy; (4) from the analysis of environmental governance investment factors, as social awareness of environmental protection increases, more and more enterprises are aware of the importance of environmental governance and take on environmental responsibility. Some paper enterprises have a certain awareness of environmental governance and corporate social responsibility, and voluntarily increase the investment in environmental governance funds. For example, Jingxing Paper and Rongsheng Environmental, according to the annual report information statistics 2017–2019, the amount of investment in environmental protection increased from 66.35 million yuan to 127.3296 million yuan, the investment in environmental governance funds can not only promote water-saving technology innovation and improvement, improve the efciency and efectiveness of water environmental management, but also reduce resource waste and pollution emissions, reduce costs and increase efciency, and increase the competitive advantage of enterprises. Among other things, banks and fnancial institutions provide certain support to environment-friendly enterprises, including the provision of green credit and fnancing channels. Tis injects "living water" into the cash fow of paper enterprises and supports them to carry out environmental management. (5) In terms of public participation, Chinese paper companies have established a series of public participation mechanisms for external corporate management, such as public hearings, media coverage and third-party assessments. Tese mechanisms provide channels and platforms for public participation, enabling the public to directly participate in the environmental decision-making and management of the company and enhancing public participation. In terms of internal management, the company organizes and holds employee water conservation education and publicity activities, community involvement activities and public welfare projects to promote public attention and participation in the paper-making enterprise.
Changes in horizontal projection values of water information disclosure of paper and paper product companies. Considering that 2020 is the closing year of China’s 13th Five-Year Plan, the paper and products enterprises in 2020 are taken as the research unit, following the above approach, Exploring the characteristics of corporate water disclosure in 2020, obtaining the best projection direction of the indicator a∗ = (0.2195, 0.2680, 0.1435, 0.1894, 0.2933, 0.2490, 0.1891, 0.2856, 0.2298, 0.1802, 0.2925, 0.2066, 0.2313,

Figure 2. Projection weights of frst-level evaluation indicators.
0.2621, 0.1265, 0.1465, 0.2870, 0.1631, 0.1314, 0.2424). In turn, the distribution ratio of each index dimension of the paper company is obtained.
Te value of each vector in the best projection direction represents each indicator’s corresponding weight, and each indicator’s importance in evaluating the quality of corporate water disclosure can be derived by ranking. As can be seen from Fig. 2, the weight of the frst-level evaluation indicators is ranked from largest to smallest as water environmental supervision (A5), water environmental costs (A3), water environmental assets (A1), disclosure vehicle (A7), water environmental performance (A6), water environmental management (A4), water environmental liabilities (A2), of which the total contribution of the three indicator dimensions of water environmental supervision, water environmental costs, and water environmental assets is more than 50%. It can be seen that listed companies in the paper industry should improve the information disclosure quality of these three indicators, which have a greater impact on the overall quality of corporate water information disclosure. Te greater the indicator’s weight represents a greater impact on the quality of corporate water disclosure, specifcally in the secondary indicators. Table 2 shows the degree of impact of each indicator in detail. Four indicators, such as wastewater abatement treatment, water risk assessment, enterprise COD emissions, and enterprise water conservation measures program, have higher weight values and have the greatest impact on the quality of water information disclosure of paper enterprises. In addition, it can also be more intuitive to see the water information disclosure quality evaluation value projection value of paper-listed enterprises, as shown in Table 3. In order to qualitatively evaluate the quality of water disclosure of enterprises, concerning relevant literature studies33, this study uses a 4-level grading scale to evaluate (Table 4), and the projection values are divided into intervals, (~ , 1.6], [1.6, 2.4], [2.4, 3.2], [3.2, ~) indicating poor, average, better, and excellent.
From the evaluation values (see Table 3), we can see that the top three companies are "Jingxing Paper", "Minfeng Special Paper" and " Rong sheng Environmental Protection Paper", with evaluation values of 3.7901, 3.7072, and 2.9978, respectively. In the original information, these three companies issued not only independent social responsibility reports, but also disclosed independent annual environmental reports, describing in detail the content of environmental accounting, including investment in clean production, governance costs, environmental research and development expenditure and investment in environmental education and training; water resources management performance. Including water consumption, sewage discharge methods, whether the number of emissions and emission concentrations comply with national standards, water conservation program measures, water environment management, including internal environmental management system, system and clean production status, environmental protection supervision letter work, and other content. Among them, Jing xing Paper publicly disclosed in the 2020 environmental report to exchange water environmental information with stakeholders, efectively allowing public participation in the enterprise’s water environmental protection work, timely follow-up and feedback on problems, and the establishment of a set of internal water environmental management system in line with the enterprise, and got 95% of stakeholders in 2020 to evaluate Jingxing Pape’s
Table 2. Optimal projection directions for the secondary evaluation indicators of water information disclosure for paper companies in 2020.
Table 4. Quality rating of water information disclosure of paper companies.
environmental information good. It indicates that the enterprise has a strong voluntary disclosure of water information and values the direct impact of water management on its sustainable and high-quality development. From the grade rating (see Table 4), the maximum value of 27 paper enterprises is 3.7901. Te minimum value is 0.5355. Te average value is 1.6360, the variance is 0.804, and the standard deviation is 0.8966, indicating that the quality of water information disclosure of paper enterprises varies greatly. Te diference is a bifurcated phenomenon. Only two enterprises (7.41%) that reach the excellent grade, better and general enterprises, have 11, respectively, accounting for 14.81% and 25.93%. In contrast, the majority of enterprises are bad grades, a total of 14, accounting for half of the overall proportion of 51.85%. It can be seen that most paper enterprises are missing water information disclosure content, facing low-quality of water information disclosure, and the need to improve the enthusiasm for enterprise water information disclosure.
In terms of the nature of enterprises (see Fig. 3), although the maximum projection value of SOEs is smaller than the maximum projection value of non-SOEs, the overall disclosure of SOEs is slightly higher than that of non-SOEs. Minfeng Special Paper proposes an environmental management grid in the disclosure information, establishes a special environmental management committee, incorporates the results of monthly supervision and inspection into the monthly performance assessment, and the disclosure information also makes special explanations about the situation of letters and visits during the period of Central Ecological and Environmental Protection Inspectors. In addition, Guanhao High-Tech has prepared annual sustainability reports in accordance with the Global Sustainability Reporting Standards (GRI Standards) of the Global Sustainability Standards Board, and implement the concept of efcient use of water resources and strict protection of the environment, relatively speaking, SOEs are subject to more stringent regulation and supervision in their operations. Te government, as the major shareholder of SOEs, usually requires more information disclosure from SOEs to ensure a fair, just and transparent market environment. At the same time, SOEs are more sensitive to the government’s environmental policies and have better execution, especially those that have been listed for a longer period of time, pay more attention to fulflling their social responsibility, achieving high-quality development, and carrying out environmental protection and ecological sustainability, and their image and reputation have a direct impact on the country’s image.
Regionally (see Fig. 4), A-share listed paper and paper products companies are concentrated in 11 provinces (municipalities and autonomous regions), with Zhejiang Province and Shandong Province generally having a higher composite rating value of 2.1947 and 1.9883 than other regions. Shanghai, as China’s economic and fnancial center, has a dominant position in industry. However, Shanghai’s water resources are mainly
Table 3. Evaluation value of water information disclosure quality of paper companies.

Figure 3. Evaluation of the nature of the enterprise of the quality of water information disclosure of paper companies.

Figure 4. Regional evaluation of paper companies’ water information disclosure quality enterprises.
on external water diversions and water management may focus more on meeting industrial and urban water supply needs, with relatively little attention to water information disclosure, which, combined with the fact that some water information may involve commercially sensitive information or privacy issues, may limit the scope and content of water information disclosure, resulting in a low overall rating value. From the perspective of raw materials, Heilongjiang has abundant forest resources, while Fujian and Zhejiang have abundant bamboo resources, and Guangdong and Zhejiang also have abundant waste paper resources. Te abundance of these raw material resources provides convenience and cost advantages for local paper enterprises; from the perspective of water sources, Ningxia and Shaanxi land belongs to the structural water shortage, and Shanghai, although located in the coastal area, belongs to the supply and demand water shortage. In addition to these three places,
the rest of the regions are abundant in water resources, which makes it convenient for enterprises to use water locally and also meet the production water needs of industrial enterprises; from the perspective of geographical advantageous location, Guangdong, Zhejiang, Shandong and Shanghai are located in the coastal areas of China, which makes it easy to trade with domestic and foreign markets. Provides convenient conditions for logistics and sales of paper enterprises; from the perspective of market demand, Shandong and Shanghai areas, the demand for packaging paper, printing paper, etc. is large, which provides local paper enterprises with broad market opportunities and potential. From the perspective of technological innovation, Zhejiang Province has strong technical strength and innovation capability in the feld of specialty paper and printing paper, Guangdong Province has strong technical advantages in the feld of paper processing and packaging, Shandong Province is the frst in pulp and paper production nationwide, and its regional enterprises jointly complete the "high-performance wood chemical pulp green preparation and high-value utilization of key technologies and industrialization "project won the 2020 National Science and Technology Progress Second Prize, the only award-winning project in the paper industry; from the perspective of environmental policy regulation, six provincial governments have long supported and encouraged the paper industry, promoting industrial development through policy, fnancial and tax support. Tese provinces may enjoy certain preferential policies in terms of policy support.
Analysis of legal regulations and policy infuencing factors. During the period 2017–2021, several laws, regulations and policy documents have been introduced in China related to environmental protection in the paper industry. Te following are some of the important laws, regulations and policies that have prompted companies to pay more attention to water environmental issues and take more efective management measures, thus driving up indicators. In 2015, the State Council promulgated the Water Pollution Prevention and Control Action Plan and the Ten Articles of Water, which provide for the principles, responsibilities, legal liabilities and supervision of water environmental protection; in 2017, the Water Pollution Prevention and Control Law was revised to Prevention and control was regulated, for the paper industry wastewater discharge standards, sewage permit system, water environmental monitoring and assessment and other aspects of the corresponding requirements; 2019 the National Development and Reform Commission, the Ministry of Water Resources jointly issued a "National Water Conservation Action Plan" for industrial enterprises to put forward "water conservation and emission reduction" and "Science and technology innovation" and other closely related, paper enterprises from the technical adjustment of the paper industry industrial transformation, increased investment in environmental protection and water-saving equipment, the construction of a new model of diversifcation of enterprise water-saving services, so as to achieve the transformation of the results of green water-saving technology as soon as possible. Te government from the policy and regulations to further strengthen the protection of water sources and limit the discharge of polluted water sources, for enterprise water resources management and water information disclosure to provide planning and guidance. Te two go hand in hand to promote the paper industry intensive water conservation, to the green, low-carbon direction, in the 2020 implementation of the "2020 in accordance with the law to promote backward production capacity exit work program" policy documents to the paper industry and other heavy polluting enterprises were strictly in accordance with the law to eliminate backward products, so that overcapacity contradictions are eased, reducing the discharge of industrial wastewater in the production process, indicating that the paper industry has always Adhere to the policy guidance of green and sustainable development, and actively improve and upgrade water-saving technology to reduce production costs and sewage discharge. In the same year, the Law of the People’s Republic of China on the Prevention of Environmental Pollution by Solid Waste was introduced, which clearly stipulates that China will gradually achieve zero solid waste imports. Te continuous adjustment and retrenchment of the waste paper import policy has led to the concentration of enterprises’ foreign waste quotas in large enterprises, the decline of foreign waste ratios year by year, and the rising cost of raw materials. In addition, China has issued a series of policy documents on environmental protection and environmental impact assessment of construction projects, such as the China Agenda for Sustainable Development 2030 and the Law of the People’s Republic of China on Environmental Impact Assessment, which provide guidance and measures to regulate the procedures and contents of environmental protection and environmental impact assessment. Terefore, under the guidance and promotion of national laws and regulations and policy documents, we should strengthen the regulation and restraint of enterprise water pollutant discharge and encourage enterprises to voluntarily disclose water information in order to realize the optimal allocation and intensive, economical and safe use of enterprise water resources.
Conclusions
In order to better evaluate the level of enterprise water information disclosure quality, this paper constructs a water information disclosure quality index system for paper and paper products enterprises, which improves and supplements the previous evaluation indexes. Te projection tracing model is used to analyze A-share paper and product enterprises. Meanwhile, in order to overcome the shortcomings of the traditional model of projection tracing, an improved model based on accelerated genetic algorithm is proposed, which improves the accuracy and robustness of the model. Finally, the efectiveness and adaptability of the method is demonstrated through a case study of water disclosure quality evaluation of 27 paper companies in China, which provides ideas for the study of corporate water disclosure quality evaluation. Our study shows that (1) corporate water disclosure quality indicators include four basic criteria: "relevance", "reliability", "validity" and "comparability", as well as the selection of water recycling efciency, corporate COD emissions, environmental information exchange with stakeholders, corporate daily water management system plans, goals and strategies, and corporate water management performance evaluation programs as key indicators for evaluation. (2) Introducing accelerated genetic algorithm in the traditional projection tracing model to construct the best projection weights and evaluation values to more accurately and reliably analyze the dynamic evolutionary trend changes of information disclosure related
to water resources in paper and paper product enterprises. (3) Analysis of the vertical trend changes of weights and evaluation values from 2017 to 2021 reveals that the disclosure of information about water resources in paper and paper products enterprises shows fuctuations and increases in 2017, but afer 2019, enterprises disclose information about water resources tends to slow down, and in the disclosure carrier, relevant reports gradually compress the details of information disclosure about water, which is related to relevant environmental policy changes and enterprise disclosure awareness Weakness is related. And from the tax policy, from technological innovation and application factors, industrial structure transformation, environmental investment governance and social public participation in fve categories of infuencing factors, a detailed analysis of the trend of change in paper enterprises, (4) from the 2021 weight and rating value of the horizontal trend change analysis, in the rating level, the number of excellent enterprises is less, indicating that enterprises are not high enthusiasm for voluntary disclosure of water resources information, enterprise water information Te overall quality of disclosure quality results are less satisfactory; the nature of enterprises, state-owned enterprises slightly better than non-state enterprises, mainly because of the stronger policy sensitivity of state-owned enterprises and its image and reputation of the direct impact on the image of the country; from a regional perspective, Zhejiang Province and Shandong Province in the overall enterprise water information quality evaluation system performance is better, its advantages in raw materials, water resources, geographic location, market demand, technology and innovation and environmental policy rules, while Shanghai and Shaanxi Province evaluation value is at a lower level, mainly by the geographical environment to limit access to water resources, as well as enterprises involved in commercially sensitive information or privacy issues, reluctance to actively disclose water-related information factors. It is worth noting that although the projection tracing imitation with the introduction of genetic algorithm overcomes the subjective factors of the evaluation method to a certain extent, the subjectivity brought by the content analysis method still cannot be avoided. Tis paper tries to establish a scientifc, complete and efective evaluation index system, which will help to achieve the comprehensiveness of the evaluation index and make the defnition of the evaluation results clearer and more accurate through the continuous in-depth research conducted by future scholars and thus improve the objectivity of the evaluation results.
We note that these results have some implications for understanding corporate water information disclosure, frst, to raise awareness and improve the construction of the legal and regulatory system. In recent years, a number of laws and regulations have been promulgated in environmental protection, but. However, the legal system for environmental information disclosure, especially water information disclosure, is still under development. Specifc measurement indicators regarding water information disclosure need to be continuously improved, and specifc requirements and content forms for water information disclosure should be introduced as soon as possible. Enterprises in the water information disclosure, daily need to measure, and collect data and timely collation of information. Te process will increase the cost of certain fees, due to the lack of mandatory disclosure of enterprise water information, resulting in the disclosure of enthusiasm is not high. Te government should lead enterprises to carry out water-saving technology upgrades, promote enterprise green technology innovation, and reduce enterprise water and environmental risks. At the same time, the government’s specifc system continues to adapt to changes in the implementation of the enterprise to the reality, to give enterprises a certain amount of fnancial assistance, so that the ecologically sustainable development of enterprises have a material basis for the protection of positive water information disclosure of enterprises, through green fnancial means to promote the construction of enterprise water information disclosure system, to mobilize the initiative of enterprises. In addition, there is a need to improve the system, and the ability to play the main corporate governance. Enterprises are the main body of water information disclosure, in the pursuit of proft maximization at the same time, shoulders social responsibility, high water-sensitive industries should be a more spontaneous initiative to disclose water information, but from the report, only three enterprises independently disclose information related to water information in the annual environmental report, one enterprise independently discloses the annual sustainability report, there are enterprises did not disclose social responsibility report. From the disclosure of information, to the disclosure of formal content, the quality varies, only the disclosure of better indicator data, so that stakeholders have one-sided cognitive enterprise water environment status. Enterprises combine their own reality and the requirements of relevant departments to establish an internal control system for environmental management, responsible for information collection, collation, review and release, to ensure the authenticity and reliability of data disclosure, the main person in charge of the enterprise to enhance the sense of responsibility, the enterprise water resources information disclosure as an important work well arranged and deployed, the enterprise management of water resources information disclosure with business work with the same arrangements, with the implementation, and fnally detailed to each Te management of the enterprise will arrange and implement the disclosure of water resources information together with the business work, and fnally, it will be detailed to each staf position, encourage the staf to actively participate in the activities of information disclosure, and give job promotion and material rewards to the staf who are complete and comprehensive in the information disclosure.
Data availability
Upon publication of the paper, the datasets used and analyzed during the study are available from the corresponding author upon reasonable request.
Received: 23 March 2023; Accepted: 23 July 2023
References
1. Ortas, E., Burritt, R. L. & Christ, K. L. Te infuence of macro factors on corporate water management: A multi-country quantile regression approach. J. Clean Prod. 226, 1013–1021. https://doi.org/10.1016/j.jclepro.2019.04.165 (2019).
2. Barber, M. & Jackson, S. Indigenous engagement in Australian mine water management: Te alignment of corporate strategies with national water reform objectives. Resour. Policy 37, 48–58. https://doi.org/10.1016/j.resourpol.2011.12.006 (2012).
3. Hazelton, J. Corporate water accountability–the role of water labels given non-fungible extractions. Pac. Account. Rev. https://doi. org/10.1108/PAR-07-2013-0074 (2014).
4. Burritt, R. L. & Christ, K. L. Te need for monetary information within corporate water accounting. J. Environ. Manag. 201, 72–81. https://doi.org/10.1016/j.jenvman.2017.06.035 (2017).
5. Lambooy, T. Corporate social responsibility: Sustainable water use. J. Clean Prod. 19, 852–866. https://doi.org/10.1016/j.jclepro. 2010.09.009 (2011).
6. Tsalis, T. A., Malamateniou, K. E., Koulouriotis, D. & Nikolaou, I. E. New challenges for corporate sustainability reporting: United Nations’ 2030 Agenda for sustainable development and the sustainable development goals. Corp. Soc. Responsib. Environ. Manag. 27, 1617–1629. https://doi.org/10.1002/csr.1910 (2020).
7. Li, S. H., He, S. L. & He, Y. X. A review of research on corporate water disclosure. Commun. Finance Account. https://doi.org/10. 16144/j.cnki.issn1002-8072.2018.19.010 (2018).
8. Tello, E. From Risks to Shared Value? Corporate Strategies in Building a Global Water Accounting and Disclosure Regime (Taylor & Francis, 2013). https://doi.org/10.1080/0969160X.2013.820414
9. Liu, C., Su, K. & Zhang, M. Water disclosure and fnancial reporting quality for social changes: Empirical evidence from China. Technol. Forecast. Soc. Change https://doi.org/10.1016/j.techfore.2021.120571 (2021).
10. Burritt, R. L., Christ, K. L. & Omori, A. Drivers of corporate water-related disclosure: Evidence from Japan. J. Clean Prod. 129, 65–74. https://doi.org/10.1016/j.jclepro.2016.04.119 (2016).
11. Malik, F., Wang, F. J., Li, J. Y. & Naseem, M. A. Impact of environmental disclosure on frm performance: Te mediating role of green innovation. Rev. Contab. 26, 14–26. https://doi.org/10.6018/rcsar.407921 (2023).
12. Liao, L., Luo, L. & Tang, Q. Gender diversity, board independence, environmental committee and greenhouse gas disclosure. Br. Account. Rev. 47, 409–424. https://doi.org/10.1016/j.bar.2014.01.002 (2015).
13. Clarkson, P. M., Overell, M. B. & Chapple, L. Environmental reporting and its relation to corporate environmental performance. Abacus J. Account. Finance Bus. Stud. 47, 27–60. https://doi.org/10.1111/j.1467-6281.2011.00330.x (2011).
14. Martinez, F. A three-dimensional conceptual framework of corporate water responsibility. Organ. Environ. 28, 137–159. https:// doi.org/10.1177/1086026614545632 (2015).
15. Zhou, Z., Zhou, H., Zeng, H. & Chen, X. Te impact of water information disclosure on the cost of capital: An empirical study of China’s capital market. Corp. Soc. Responsib. Environ. Manag. 25, 1332–1349. https://doi.org/10.1002/csr.1643 (2018).
16. Deng, M. J., Gong, X. F. & Luo, W. B. Research on the mechanism of corporate water disclosure. J. Shandong Inst. Bus. Technol. 36, 53–66. https://doi.org/10.3969/j.issn.1672-5956.2022.04.006 (2022).
17. Ben-Amar, W. & Chelli, M. What drives voluntary corporate water disclosures? Te efect of country-level institutions. Bus. Strateg. Environ. 27, 1609–1622. https://doi.org/10.1002/bse.2227 (2018).
18. Zhang, Q., Shen, J. Q., Sun, F. H. & Zhang, D. D. An empirical study on the factors infuencing corporate water information disclosure–based on data from listed companies in China’s chemical industry. Resour. Ind. 23, 53–62. https://doi.org/10.13776/j.cnki. resourcesindustries.20210601.003 (2021).
19. Xu, J. L., Gu, F. H., Zhou, Z. Y. & Jiao, J. Water disclosure, media attention and corporate value -an empirical analysis based on manufacturing listed companies. J. Xinjiang Finance Econ. Inst. https://doi.org/10.16713/j.cnki.65-1269/c.2020.03.006 (2020).
20. Zeng, H. X., Zhang, T., Zhou, Z. F., Zhao, Y. & Chen, X. H. Water disclosure and frm risk: Empirical evidence from highly watersensitive industries in China. Bus. Strateg. Environ. 29, 17–38. https://doi.org/10.1002/bse.2347 (2020).
21. Yu, H.-C. Creating environmental sustainability: Determining factors of water resources information disclosure among Chinese enterprises. Sustain. Account. Manag. Policy J. 13, 438–458. https://doi.org/10.1108/sampj-11-2019-0385 (2022).
22. Liang, C., Wang, S. J., Foley, M. & Ma, G. H. Te path selection on improving the quality of environmental information disclosure—Confguration analysis based on fsQCA. Appl. Econ. https://doi.org/10.1080/00036846.2022.2102134 (2022).
23. Liu, X. W. Evaluation of the quality of environmental information disclosure of listed companies based on the AHP-Fuzzy method. J. Shandong Univ. (Philos. Soc. Sci.) https://doi.org/10.3969/j.issn.1001-9839.2012.04.011 (2012).
24. Kleinman, G., Kuei, C.-H. & Lee, P. Using formal concept analysis to examine water disclosure in corporate social responsibility reports. Corp. Soc. Responsib. Environ. Manag. 24, 341–356. https://doi.org/10.1002/csr.1427 (2017).
25. Plumlee, M., Brown, D., Hayes, R. M. & Marshall, R. S. Voluntary environmental disclosure quality and frm value: Further evidence. J. Account. Public Policy 34, 336–361. https://doi.org/10.1016/j.jaccpubpol.2015.04.004 (2015).
26. Artiach, T. C. & Clarkson, P. M. Disclosure, conservatism and the cost of equity capital: A review of the foundation literature. Account. Finance 51, 2–49. https://doi.org/10.1111/j.1467-629X.2010.00387.x (2011).
27. Kruskal, J. B. Toward a Practical Method Which Helps Uncover the Structure of a Set of Multivariate Observations by Finding the Linear Transformation Which Optimizes a New “Index of Condensation”, Statistical Computation 427–440 (Elsevier, 1969). https:// doi.org/10.1016/B978-0-12-498150-8.50024-0
28. Kruskal, J. B. & Shepard, R. N. A nonmetric variety of linear factor analysis. Psychometrika 39, 123–157. https://doi.org/10.1007/ BF02291465 (1974).
29. Huber, P. J. Projection pursuit. Ann. Stat. 13, 435–475 (1985).
30. Su, Q. & Yu, Y. Q. Research on evaluation of enterprise sustainable development capability based on accelerated genetic algorithm projection pursuit model. Oper. Res. Manag. Sci. 27, 130–139. https://doi.org/10.12005/orms.2018.0119 (2018).
31. Jin, J. L., Yang, X. H. & Ding, J. Accelerated genetic algorithm based on real number coding. J. Sichuan Univ. (Eng. Sci. Ed.) https:// doi.org/10.15961/j.jsuese.2000.04.006 (2000).
32. Goldberg, b. D. E. & learning, B. G. A. M. Addison-Wesley Pub. Co., 1–83 (1989).
33. Li, M. W., Chen, W. Q., Yun, Y. H., Ma, Y. H. & Guo, R. Ecological security evaluation of arable land in Henan Province based on projection tracing model. Res. Soil Water Conserv. 25, 257–263. https://doi.org/10.13869/j.cnki.rswc.2018.04.038 (2018).
Acknowledgements
Key technology research on the evaluation and improvement of the management level of Yangtze River thousand fowing water resources assets based on the Yangtze River protection needs, grant number B200204019.
Author contributions
Conceptualization, Formal analysis, Writing – original draf, C.H.; Methodology, Writing – original draf, J.S.; Writing – review & editing, J.X.; Data preprocessing, Sofware, F.S. Diagrams, Data collection and recording, B.W. All authors reviewed and approved the fnal manuscript.
Competing interests
Te authors declare no competing interests.
Additional information
Correspondence and requests for materials should be addressed to F.S. Reprints and permissions information is available at www.nature.com/reprints
Publisher’s note Springer Nature remains neutral with regard to jurisdictional claims in published maps and institutional afliations.
Open Access Tis article is licensed under a Creative Commons Attribution 4.0 International License, which permits use, sharing, adaptation, distribution and reproduction in any medium or format, as long as you give appropriate credit to the original author(s) and the source, provide a link to the Creative Commons licence, and indicate if changes were made. Te images or other third party material in this article are included in the article’s Creative Commons licence, unless indicated otherwise in a credit line to the material. If material is not included in the article’s Creative Commons licence and your intended use is not permitted by statutory regulation or exceeds the permitted use, you will need to obtain permission directly from the copyright holder. To view a copy of this licence, visit http://creativecommons.org/licenses/by/4.0/.
© Te Author(s) 2023
FROM THE PUBLISHERS OF PAPER TECHNOLOGY INTERNATIONAL®
Volume10, Number2,2024
Research on Recycling Various Wastes in Papermaking as Eco-Friendly Slurry
TENG YI, SHUENN-REN LIOU & WEN-YIH KUO
Waste recycling has always been a priority in the paper industry. In this study, the potential of translating various wastes in papermaking into building materials was separately evaluated. For the first time, the improvement of flexibility and sample texture after translating wastes into cementitious materials was analyzed. The results showed that 20% of the waste in alkali-activated slag slurry is the best proportion for papermaking. In addition, paper sludge and wood chips significantly improved the slurry flexibility while lime mud and bottom ash did not have this effect. Considering the effect of adding wood chips on the optimization of the sample texture, the most appropriate proportion of the paper sludge was 5% when the wood chips in the mixture were 15%. The most suitable alkali equivalent was 6%, with a silicate modulus of 0.9. According to the experimental results, wastes in papermaking had great potential for exploitation and application as circular materials.
Contact information:
Department of Architecture, National Cheng Kung University, 701 No. 1, East District, Tainan 701401, Taiwan
Sustainability 2022, 14, 13536 https://www.mdpi.com/2071-1050/14/20/13536
Creative Commons Attribution 4.0 International License
The Paper Industry Technical Association (PITA) is an independent organisation which operates for the general benefit of its members – both individual and corporate – dedicated to promoting and improving the technical and scientific knowledge of those working in the UK pulp and paper industry. Formed in 1960, it serves the Industry, both manufacturers and suppliers, by providing a forum for members to meet and network; it organises visits, conferences and training seminars that cover all aspects of papermaking science. It also publishes the prestigious journal Paper Technology International® and the PITA Annual Review, both sent free to members, and a range of other technical publications which include conference proceedings and the acclaimed Essential Guide to Aqueous Coating.
sustainability
Article
ResearchonRecyclingVariousWastesinPapermakingas Eco-FriendlySlurry
TengYi*,Shuenn-RenLiou andWen-YihKuo
Citation: Yi,T.;Liou,S.-R.;Kuo,W.-Y. ResearchonRecyclingVarious WastesinPapermakingas Eco-FriendlySlurry. Sustainability 2022, 14,13536. https://doi.org/ 10.3390/su142013536
AcademicEditors:RuiZhao, TianxueYangandSebastianoPatti
Received:19September2022
Accepted:17October2022
Published:19October2022
Publisher’sNote: MDPIstaysneutral withregardtojurisdictionalclaimsin publishedmapsandinstitutionalaffiliations.
Copyright: ©2022bytheauthors. LicenseeMDPI,Basel,Switzerland. Thisarticleisanopenaccessarticle distributedunderthetermsand conditionsoftheCreativeCommons Attribution(CCBY)license(https:// creativecommons.org/licenses/by/ 4.0/).
DepartmentofArchitecture,NationalChengKungUniversity,701No.1,EastDistrict,Tainan701401,Taiwan * Correspondence:n78083503@gs.ncku.edu.tw;Tel.:+886-(06)-275-7575(ext.54122)
Abstract: Wasterecyclinghasalwaysbeenapriorityinthepaperindustry.Inthisstudy,thepotential oftranslatingvariouswastesinpapermakingintobuildingmaterialswasseparatelyevaluated. Forthefirsttime,theimprovementofflexibilityandsampletextureaftertranslatingwastesinto cementitiousmaterialswasanalyzed.Theresultsshowedthat20%ofthewasteinalkali-activated slagslurryisthebestproportionforpapermaking.Inaddition,papersludgeandwoodchips significantlyimprovedtheslurryflexibilitywhilelimemudandbottomashdidnothavethiseffect. Consideringtheeffectofaddingwoodchipsontheoptimizationofthesampletexture,themost appropriateproportionofthepapersludgewas5%whenthewoodchipsinthemixturewere 15%.Themostsuitablealkaliequivalentwas6%,withasilicatemodulusof0.9.Accordingtothe experimentalresults,wastesinpapermakinghadgreatpotentialforexploitationandapplicationas circularmaterials.
Keywords: alkali-activatedbinder;wastesinpapermaking;blastfurnaceslag;compressivestrength; flexibility;texture
1.Introduction
In2021,theglobaloutputofpaperproductswas90.2milliontons,whichcontinuesto growduetotheCOVID-19pandemic[1].Inaddition,approximately3billionUSDisspent eachyearonwastedisposalfromthepaperindustryandrelatedexpenses.Foramediumsizedmill,thecostiscloseto7millionUSD[2].Thewasteinpapermakingincludes manysolidwastessuchaschipsfromwoodprocessing,limemudsfromkraftpumping, bottomashintherecoveryboiler,andpapersludgesfromon-sitesewagetreatment[3,4]. Severalprogramshavebeendevelopedtomanagethesewastes.Forexample,biomass materialssuchaswoodchipsandwatertreatmentsludgecouldbepartiallyaddedasfuel tofuelboilersofpapermills[5].However,thisprocesscreatedadditionalairandwater pollutionwhilesupplyingelectricitytothepapermanufacturingprocess[6].Someother solidwastes,suchaslimesludge,weredifficulttoreuseasfuel.Thesematerialswere usuallylandfilledwiththeashesfromincineration[7],causingoccupancyofthewaste plantandposingtheriskofsoilandwatercontamination[8].Therefore,itisnecessary toselectsuitableresource-basedmethodstoreprocessthesewasteswithoutincreasingor shiftingtheenvironmentalburden.
Byinvestigatingthemaincomponentsofwasteinpapermaking[9],theconversionof wasteintobuildingmaterialscouldbeasuitablesolution[10].Amongthesolidwastes, limemudreplacedtherawmaterialsofordinaryPortlandcementbycalcination,with amaximumreplacementratioof20%[11,12].Thepapersludgethermallyactivatedat 600–750 ◦Creplaced10%ofcementasthecementitiousbinder[13].Inaddition,15%of woodchipashfrompapermillscouldbeusedasarawmaterialforthecementitious binder[14].Althoughthesemethodshelpedconvertwasteintobuildingmaterials,they stillcausedsomeenergyconsumptionandenvironmentalimpact[15].Inaddition,some studiesinvestigatedtheuseofbottomashesasaggregates[16].
some energy consumption and environmental impact [15]. In addition, some studies investigated the use of bottom ashes as aggregates [16]
Alkali-activated cementitious materials are formed by mixing aluminosilicate materials with alkali metal silicate solutions and alkali activators [17,18]. Among them, alkaliactivated slag has received wide attention for its low CO2 emission, high comp ressive strength, durability, and fire resistance [19]. Recently, more emphasis has been placed on the potential for solidifying waste from alkali-activated blast furnace slag [20–24]
Alkali-activatedcementitiousmaterialsareformedbymixingaluminosilicatematerials withalkalimetalsilicatesolutionsandalkaliactivators[17,18].Amongthem,alkaliactivatedslaghasreceivedwideattentionforitslowCO2 emission,highcompressive strength,durability,andfireresistance[19].Recently,moreemphasishasbeenplacedon thepotentialforsolidifyingwastefromalkali-activatedblastfurnaceslag[20–24].
This study aimed to analyze the possibility of alkali-activating the mixture of wastes and blast furnace slag (BFS) in papermaking. Moreover, the effects of different wastes on the physical and mechanical properties of the slurry are discussed. In this study, different single-type papermaking wastes (SPW) were mixed with BFS and alkali-activated at ambient conditions. The compressive strengths and stress-time curves were used to analyze the optimized component and proportion of waste replacement BFS. On this basis, different types of wastes were selected as paper waste mixture (PWM) for further analysis to ensure a balance between the proportion of wastes in the mixtures, compressive strengths, and flexibilities. The effect of organic materials, such as wood chips, was also discussed. This study provided an appropriate alkali equivalent (AE) for the alkali activators.
2. Materials and Methods
Thisstudyaimedtoanalyzethepossibilityofalkali-activatingthemixtureofwastes andblastfurnaceslag(BFS)inpapermaking.Moreover,theeffectsofdifferentwastesonthe physicalandmechanicalpropertiesoftheslurryarediscussed.Inthisstudy,differentsingletypepapermakingwastes(SPW)weremixedwithBFSandalkali-activatedatambient conditions.Thecompressivestrengthsandstress-timecurveswereusedtoanalyzethe optimizedcomponentandproportionofwastereplacementBFS.Onthisbasis,different typesofwasteswereselectedaspaperwastemixture(PWM)forfurtheranalysistoensure abalancebetweentheproportionofwastesinthemixtures,compressivestrengths,and flexibilities.Theeffectoforganicmaterials,suchaswoodchips,wasalsodiscussed.This studyprovidedanappropriatealkaliequivalent(AE)forthealkaliactivators.
2.MaterialsandMethods
The BFS used in this study was the experimental raw material provided by China Steel in Taiwan, with the label S6000, packed in 20 kg sealed bags. The papermaking wastes were provided by the Chung Hwa Paper Corporation in eastern Taiwan. Among them, lime mud was collected from the caustic kiln, paper sludge was collected during the sewage treatment process, and the bottom ash was collected from the recovery boilers. All the papermaking wastes were directly collected from the same batch of paper, with 150 kg samples of each material packed in six sealed bags. The sample of raw materials is shown in Figure 1. Those four materials were dried to constant weight at 110 °C and sieved with a mesh size of 0.282 mm. The main chemical components provided by the manufacturer are shown in Table 1.
TheBFSusedinthisstudywastheexperimentalrawmaterialprovidedbyChinaSteel inTaiwan,withthelabelS6000,packedin20kgsealedbags.Thepapermakingwasteswere providedbytheChungHwaPaperCorporationineasternTaiwan.Amongthem,lime mudwascollectedfromthecaustickiln,papersludgewascollectedduringthesewage treatmentprocess,andthebottomashwascollectedfromtherecoveryboilers.Allthe papermakingwastesweredirectlycollectedfromthesamebatchofpaper,with150kg samplesofeachmaterialpackedinsixsealedbags.Thesampleofrawmaterialsisshown inFigure 1.Thosefourmaterialsweredriedtoconstantweightat110 ◦Candsievedwitha meshsizeof0.282mm.Themainchemicalcomponentsprovidedbythemanufacturerare showninTable 1
Considering the simplification of the alkali-activated cementitious material production and the convenience of storage and transportation, sodium silicate powder was used to prepare activators. The composition of sodium silicate powder was 46.07% of SiO2 and 51.35% of Na2O. The AE of the activators was 10%, the silicate modulus (Ms) of the activators was 0.93, and the water-binder ratio (W/B) was 0.5.

BFS28.153.713.2–0.5–4.5 limemud–71.6–16.23.43.21.5 papersludge–18.2–3.70.574.22.1 bottomash33.516.714.15.27.918.24.4
Legend:SiO2—Silicondioxide;CaO—Calciumoxide;Al2O3—Aluminumoxide;SO3—Sulphurtrioxide; Fe2O3—Ferricoxide;L.O.I—Lossonignition;wt.%—weightpercentage.
Figure 1. The material diagram. (a) BFS (b) Lime mud (c) Paper sludge (d) Bottom ash.
Figure1. Thematerialdiagram.(a)BFS.(b)Limemud.(c)Papersludge.(d)Bottomash.
Table1. ChemicalcompositionofpaperindustrialwastesandBFS.
Consideringthesimplificationofthealkali-activatedcementitiousmaterialproduction andtheconvenienceofstorageandtransportation,sodiumsilicatepowderwasused toprepareactivators.Thecompositionofsodiumsilicatepowderwas46.07%ofSiO2 and51.35%ofNa2O.TheAEoftheactivatorswas10%,thesilicatemodulus(Ms)ofthe activatorswas0.93,andthewater-binderratio(W/B)was0.5.
The experimental procedures included the preparation of the activator or material mixture, preparation of slurry, casting of specimens, and testing. Firstly, the alkali activator solution was prepared by mixing sodium silicate powder and water, then sealed and cooled to room temperature. Meanwhile, the raw materials were weighed in the required quantity and thoroughly mixed for 1 min. Subsequently, the mixture of dry materials was added to an alkali activator and mixed for another 10 min to finish the slurry. According to ASTM C109, the specimens for compressive strength tests were cast in 50 mm × 50 mm × 50 mm molds with two layers of mortar, followed by compaction and vibration to eliminate air bubbles. After the initial setting, specimens were sealed with plastic films to prevent moisture loss. In this study, samples were de-molded after 24 h of casting and stored in a control box at 20 °C and 95% relative humidity. Considering the experimental design and the number of samples, three of each experimental series were separately tested on the compressive strengths at 3, 7, and 28 days; the stress-time curves at day 28 were recorded. The specific steps and test parameters are shown in Figure 2 and the experiment’s process records in the laboratory are shown in Figure 3.
Table 1. Chemical composition of paper industrial wastes and BFS
Legend: SiO2 Silicon dioxide; CaO Calcium oxide; Al2O3 Aluminum oxide; SO3 Sulphur trioxide; Fe2O3 Ferric oxide; L.O.I Loss on ignition; wt.% weight percentage.
Theexperimentalproceduresincludedthepreparationoftheactivatorormaterial mixture,preparationofslurry,castingofspecimens,andtesting.Firstly,thealkaliactivator solutionwaspreparedbymixingsodiumsilicatepowderandwater,thensealedandcooled toroomtemperature.Meanwhile,therawmaterialswereweighedintherequiredquantity andthoroughlymixedfor1min.Subsequently,themixtureofdrymaterialswasaddedto analkaliactivatorandmixedforanother10mintofinishtheslurry.AccordingtoASTM C109,thespecimensforcompressivestrengthtestswerecastin 50mm × 50mm × 50mm moldswithtwolayersofmortar,followedbycompactionandvibrationtoeliminateair bubbles.Aftertheinitialsetting,specimensweresealedwithplasticfilmstoprevent moistureloss.Inthisstudy,sampleswerede-moldedafter24hofcastingandstoredin acontrolboxat20 ◦Cand95%relativehumidity.Consideringtheexperimentaldesign andthenumberofsamples,threeofeachexperimentalserieswereseparatelytestedonthe compressivestrengthsat3,7,and28days;thestress-timecurvesatday28wererecorded. ThespecificstepsandtestparametersareshowninFigure 2 andtheexperiment’sprocess recordsinthelaboratoryareshowninFigure 3

Figure 2. Experimental steps and test item. Figure2. Experimentalstepsandtestitem.


3. The experiments process record in the laboratory. (a) The material mixing process (b) The performance test.
Figure3. Theexperimentsprocessrecordinthelaboratory.(a)Thematerialmixingprocess.(b)The performancetest.
3. Results and Discussion
3.ResultsandDiscussion
This study classified the BFS substitution from wastes in papermaking into two pathways: SPW substitution and PWM substitution. In both pathways, the effects of these wastes on mechanical properties and texture were investigated. The suitable AE values were also analyzed.
ThisstudyclassifiedtheBFSsubstitutionfromwastesinpapermakingintotwo pathways:SPWsubstitutionandPWMsubstitution.Inbothpathways,theeffectsofthese wastesonmechanicalpropertiesandtexturewereinvestigated.ThesuitableAEvalues werealsoanalyzed.
3.1.EffectofSingle-TypePaperWaste(SPW)SubstitutionProportion
3.1. Effect of Single-Type Paper Waste (SPW) Substitution Proportion
The experiment parameters of the SPW substitution are shown in Table 2 and the compressive strengths of samples are illustrated in Figure 4. The compressive strengths for different experimental series ranged from 14.5 MPa to 73.7 MPa after 28 days of curing. In terms of the SPW substitution proportion, the highest compressive strength was 73.7 MPa, in which BFS was partially substituted by 10% of the lime mud. The weakest compressive strength was 14.5 MPa, in which wood chips partially replaced 30% of BFS. Under the same substitution ratio, the compressive strength of lime mud, paper sludge, bottom ash, and wood chips sequentially decreased. The early strength illustrated that the compressive strengths of the sample increased rapidly from 0 to 7 days, almost exceeding 85% of the final strength. Except for the decrease in the compressive strength values of samples with the addition of sawdust from 7 to 28 days, the trend of strength development remained relatively constant, with some values fluctuating.
TheexperimentparametersoftheSPWsubstitutionareshowninTable 2 andthe compressivestrengthsofsamplesareillustratedinFigure 4.Thecompressivestrengthsfor differentexperimentalseriesrangedfrom14.5MPato73.7MPaafter28daysofcuring.In termsoftheSPWsubstitutionproportion,thehighestcompressivestrengthwas73.7MPa, inwhichBFSwaspartiallysubstitutedby10%ofthelimemud.Theweakestcompressive strengthwas14.5MPa,inwhichwoodchipspartiallyreplaced30%ofBFS.Underthesame substitutionratio,thecompressivestrengthoflimemud,papersludge,bottomash,and woodchipssequentiallydecreased.Theearlystrengthillustratedthatthecompressive strengthsofthesampleincreasedrapidlyfrom0to7days,almostexceeding85%ofthe finalstrength.Exceptforthedecreaseinthecompressivestrengthvaluesofsampleswith theadditionofsawdustfrom7to28days,thetrendofstrengthdevelopmentremained relativelyconstant,withsomevaluesfluctuating.
Table2. ExperimentalparametersofSPWsubstitutionproportion.
2. Experimental parameters of SPW substitution proportion
Experiment No.
S0100––––
S9L19010–––S8L28020–––S7L37030–––S9B190–10––S8B280–20––S7B370–30––S9P190––10–
S8P280––20–S7P370––30–S9W190–––10
S8W280–––20
S7W370–––30
Legend:AE—Alkaliequivalent;Ms—Silicatemodulus;W/B—Water-binderratio;wt.%—weightpercentage.
Figure
Table
Legend: AE Alkali equivalent; Ms Silicate modulus; W/B Water-binder ratio; wt.% weight percentage

Figure 4. The compressive strength of SPW substitution proportion
Figure4. ThecompressivestrengthofSPWsubstitutionproportion.
When paper sludge and wood chips were used as partial substitutes for BFS, the highest 28-day compressive strengths were 41.1 MPa and 28.8 MPa, respectively. This result could be attributed to the high content of organic impurities, which disrupted the polymerization of the cement [25]. In addition, the highest compressive strength of bottom ash was 39.4 MPa, which substituted BFS after 28 days of curing. Compared to other wastes, bottom ash had some volume expansion except for the reduction in the w/b ratio of the slurry [21]. Although the volume expansion reduced the self-shrinkage of the slurry, cracks were also generated in this process, degrading the mechanical properties of the material [16]
WhenpapersludgeandwoodchipswereusedaspartialsubstitutesforBFS,the highest28-daycompressivestrengthswere41.1MPaand28.8MPa,respectively.This resultcouldbeattributedtothehighcontentoforganicimpurities,whichdisruptedthe polymerizationofthecement[25].Inaddition,thehighestcompressivestrengthofbottom ashwas39.4MPa,whichsubstitutedBFSafter28daysofcuring.Comparedtoother wastes,bottomashhadsomevolumeexpansionexceptforthereductioninthew/bratio oftheslurry[21].Althoughthevolumeexpansionreducedtheself-shrinkageoftheslurry, crackswerealsogeneratedinthisprocess,degradingthemechanicalpropertiesofthe material[16].
In S8L2 and S8P2, the development of compressive strengths from 7 to 28 days approached 20% of the final strength. Since the reactivity of the lime mud and the paper sludge is poorer than BFS, the weakening of compressive strength was reflected by the decreased development rate of compressive strength with an increasing ratio. Furthermore, the strengths on day 28 showed a significant decrease of more than 10 MPa in the comparison between S8M2 and S7M3 or S8P2 and S7P3 (11.5 MPa and 14.0MPa, respectively). This result indicated that if the total proportion of lime mud and the paper sludge exceeded 20%, the polymerization in cementitious materials was incomplete [26], significantly decreasing the compressive strength. This result was similar to previous reports [11,12]. However, the other reports have expressed different opinions [27,28] due to different pretreatment of slurry raw materials. Therefore, a total weight of 20% could be considered a suitable proportion, which allowed the partial substitution of the lime mud or paper sludge for BFS.
Considering the optimization of compressive strength, the stress-time curve of BFS replaced by 20% of the waste was selected as the study object. According to Figure 5, the stress-time curves for partial substitution of BFS with lime mud or bottom ash showed the characteristics of brittle materials. Moreover, the shapes of the curves were similar, with a linear increase in yield strength and a sharp decrease at the peak. This variation
InS8L2andS8P2,thedevelopmentofcompressivestrengthsfrom7to28daysapproached20%ofthefinalstrength.Sincethereactivityofthelimemudandthepaper sludgeispoorerthanBFS,theweakeningofcompressivestrengthwasreflectedbythe decreaseddevelopmentrateofcompressivestrengthwithanincreasingratio.Furthermore, thestrengthsonday28showedasignificantdecreaseofmorethan10MPainthecomparisonbetweenS8M2andS7M3orS8P2andS7P3(11.5MPaand14.0MPa,respectively).This resultindicatedthatifthetotalproportionoflimemudandthepapersludgeexceeded20%, thepolymerizationincementitiousmaterialswasincomplete[26],significantlydecreasing thecompressivestrength.Thisresultwassimilartopreviousreports[11,12].However, theotherreportshaveexpresseddifferentopinions[27,28]duetodifferentpretreatment ofslurryrawmaterials.Therefore,atotalweightof20%couldbeconsideredasuitable proportion,whichallowedthepartialsubstitutionofthelimemudorpapersludgeforBFS. Consideringtheoptimizationofcompressivestrength,thestress-timecurveofBFS replacedby20%ofthewastewasselectedasthestudyobject.AccordingtoFigure 5,the stress-timecurvesforpartialsubstitutionofBFSwithlimemudorbottomashshowedthe characteristicsofbrittlematerials.Moreover,theshapesofthecurvesweresimilar,witha linearincreaseinyieldstrengthandasharpdecreaseatthepeak.Thisvariationsuggested thatthesampleswerecrushedandlostthestressintensityatthepeak.Onlythepeakpoints ofthecurvesdifferedbetweenthem,indicatingthatlimemudorbottomashcouldnot changethecharacteristicsofbrittlematerials,resultinginthealkaliactivationofBFS.Inthe partialsubstitutionofBFSwithpapersludgeorwoodchips,thecurvesdecreasedslowlyat thepeak.Thischangeindicatedthatthesamplesstillexceededtheyieldstrengthinsome respects.Basedontheseresults,papersludgeorwoodchipscouldsignificantlychangethe propertiesofalkali-activatedBFSfrombrittletoductile[29].
peak points of the curves differed between them, indicating that lime mud or bottom ash could not change the characteristics of brittle materials, resulting in the alkali activation of BFS. In the partial substitution of BFS with paper sludge or wood chips, the curves decreased slowly at the peak. This change indicated that the samples still exceeded the yield strength in some respects. Based on these results, paper sludge or wood chips could significantly change the properties of alkali-activated BFS from brittle to ductile [ 29].
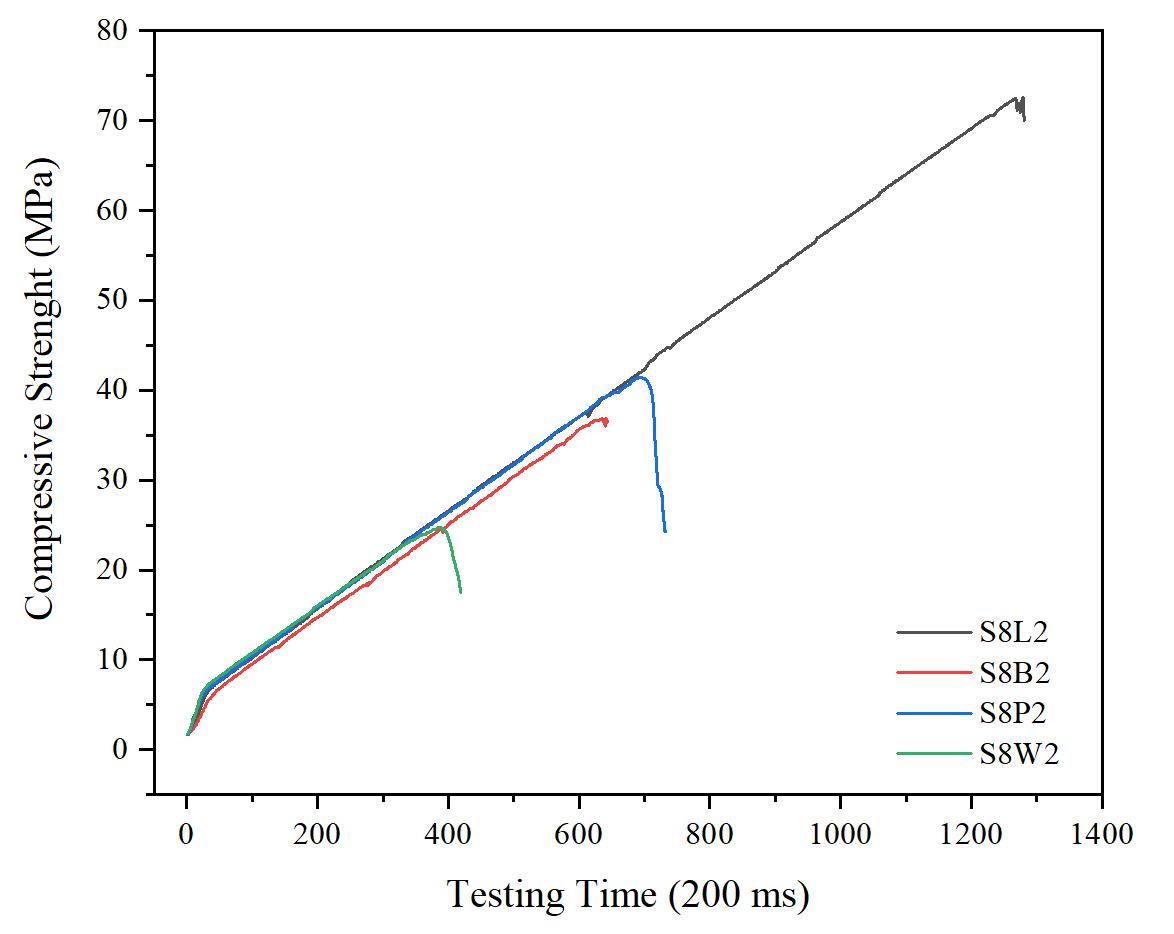
Figure5. Thestresscurveoftheslurrywiththe20%proportionofSPWsubstitutedforBFS.
Figure 5. The stress curve of the slurry with the 20% proportion of SPW substituted for BFS.
3.2.EffectofPaperWasteMixture(PWM)Proportion
3.2. Effect of Paper Waste Mixture (PWM) Proportion
DuetotheexperimentalresultsofthepartialsubstitutionofBFSwithSPW,thelime mudandpapersludgewereconsideredsuitablematerialsforpartialsubstitution.The experimentparametersofthePWMsubstitutionareshowninTable 3.Theeffectofthe proportionofvariouswastemixturesoncompressivestrengthwasdiscussedinthissection. Basedontheresults,theproportionofBFSinthemixedpowdercanbefurtherreduced.
Due to the experimental results of the partial substitution of BFS with SPW, the lime mud and paper sludge were considered suitable materials for partial substitution. The experiment parameters of the PWM substitution are shown in Table 3. The effect of the proportion of various waste mixtures on compressive strength was discussed in this section. Based on the results, the proportion of BFS in the mixed powder can be further reduced.
Table3. ExperimentalparametersofPWMsubstitutionproportion.
As shown in Figure 6, the compressive strengths of BFS substituted with waste mixtures showed a similar trend to that of BFS substituted with SPW. The compressive strength rapidly increased to a maximum around day 7 and fluctuated from 7 to 28 days. When the BFS was substituted by waste mixtures with a weight proportion of 50%, the highest compressive strength was 23.1 MPa. It was evident that the compressive strength decreased with decreasing proportion of lime mud in the waste mixtures. For every 5% reduction in the proportion of lime mud, the average compressive strength decreased by nearly 2.5 MPa.
PWM4-2602020
PWM5-1504010
PWM5-2503515
PWM4-1603010 10%0.930.5
PWM5-3503020
PWM5-4502525
Table 3. Experimental parameters of PWM substitution proportion
PWM5-5502030
Legend:AE—Alkaliequivalent;Ms—Silicatemodulus;W/B—Water-binderratio;wt.%—weightpercentage.
AsshowninFigure 6,thecompressivestrengthsofBFSsubstitutedwithwastemixturesshowedasimilartrendtothatofBFSsubstitutedwithSPW.Thecompressivestrength rapidlyincreasedtoamaximumaroundday7andfluctuatedfrom7to28days.When theBFSwassubstitutedbywastemixtureswithaweightproportionof50%,thehighest compressivestrengthwas23.1MPa.Itwasevidentthatthecompressivestrengthdecreased withdecreasingproportionoflimemudinthewastemixtures.Forevery5%reductionin theproportionoflimemud,theaveragecompressivestrengthdecreasedbynearly2.5MPa.
Legend: AE Alkali equivalent; Ms Silicate modulus; W/B Water-binder ratio; wt.% weight percentage

Figure 6. The compressive strength of PWM substitution proportion
Figure6. ThecompressivestrengthofPWMsubstitutionproportion.
In Figure 7, the stress-time curves did not drop abruptly at the peak in the substitution of BFS with mixed wastes. When the proportion of the lime mud in waste mixtures exceeded 10% of the total weight, curve optimization was performed. As the proportion of paper sludge in waste mixtures increased, the slope of the curve flattened out at the yield stress, suggesting that the flexibility of samples was optimized with the increase of paper sludge. When the proportion of paper sludge increased to 1% of the total weight, the slope of the curve over the yield point changed from 2.5 to 1, indicating a prominent enhancement of flexibility. Therefore, the stress-time curve was optimized when the paper sludge accounted for 20% of the total mixture weight.
InFigure 7,thestress-timecurvesdidnotdropabruptlyatthepeakinthesubstitution ofBFSwithmixedwastes.Whentheproportionofthelimemudinwastemixtures exceeded10%ofthetotalweight,curveoptimizationwasperformed.Astheproportion ofpapersludgeinwastemixturesincreased,theslopeofthecurveflattenedoutatthe yieldstress,suggestingthattheflexibilityofsampleswasoptimizedwiththeincreaseof papersludge.Whentheproportionofpapersludgeincreasedto1%ofthetotalweight,the slopeofthecurveovertheyieldpointchangedfrom 2.5to 1,indicatingaprominent enhancementofflexibility.Therefore,thestress-timecurvewasoptimizedwhenthepaper sludgeaccountedfor20%ofthetotalmixtureweight.

Figure7. Thestresscurveoftheslurrywiththe50%proportionofPWMsubstitutedforBFS.
3.3.
Considering the optimization of slurry texture and compressive strength, the wood chips were added to the slurry as seen in Table 4. Both wood chips and paper sludge improved the property of the stress-time curve. In addition, 5% of wood chips were used to gradually replace the paper sludge in the mixing proportion of up to 20% of the total weight.
Sustainability
Figure 7. The stress curve of the slurry with the 50% proportion of PWM substituted for BFS
Texture Change of PWM Slurry
3.3.TextureChangeofPWMSlurry
Consideringtheoptimizationofslurrytextureandcompressivestrength,thewood chipswereaddedtotheslurryasseeninTable 4.Bothwoodchipsandpapersludge improvedthepropertyofthestress-timecurve.Inaddition,5%ofwoodchipswereused tograduallyreplacethepapersludgeinthemixingproportionofupto20%ofthetotal weight.ItcanbeseenfromFigure 8 thatwhenwoodchipswereaddedfrom10%(PWM3-3) to15%(PWM3-4)ofthetotalweight,thecompressivestrengthwasatasteadystage(nearly 25MPa),withbothstonyandwoodytexturesstartingtoappearclearlyonthesurfaceofthe mud(Figure 9).Consideringthepossibilityofaddingwoodchipsasdecorationmaterials, itisappropriatetoadd15%ofwoodchipsand5%ofpapersludgetothemixture.
Table4. ExperimentalparametersofPWM3seriessubstitutionproportion. Experiment No.
PWM3-17010200
PWM3-27010155
PWM3-370101010
PWM3-47010515
PWM3-57010020
Legend:AE—Alkaliequivalent;Ms—Silicatemodulus;W/B—Water-binderratio;wt.%—weightpercentage.

Figure8. ThecompressivestrengthofPWM3series.

Figure9. ThechangeoftextureintermsofPWM.
Figure 9. The change of texture in terms of PWM
9. The change of texture in terms of PWM
3.4. Effect of Declining Alkali Equivalent
3.4. Effect of Declining Alkali Equivalent
Given the simplified process for producing alkali-activated cementitious materials and the convenience of storing and transporting raw materials, only sodium silicate pow-
Given the simplified process for producing alkali-activated cementitious materials and the convenience of storing and transporting raw materials, only sodium silicate powder was used to prepare alkali activators in this study. Therefore, the silicate modulus (Ms) of alkali
Lime Mud Paper Sludge Wood Chips
Figure 8. The compressive strength of PWM3 series
Figure
Figure 8. The compressive strength of PWM3 series.
Sustainability 2022, 14,
3.4.EffectofDecliningAlkaliEquivalent
Giventhesimplifiedprocessforproducingalkali-activatedcementitiousmaterialsand theconvenienceofstoringandtransportingrawmaterials,onlysodiumsilicatepowder wasusedtopreparealkaliactivatorsinthisstudy.Therefore,thesilicatemodulus(Ms)of alkaliactivatorswasaconstantvalueandtheingredientofalkaliactivatorscouldonlybe adjustedbyAE.Consideringthepulpwasteproportion,thecompressivestrength,and theoptimizationofslurrytexture,threekindsofslurrieswereselectedasthesamplesto investigatethemostsuitablevalueofAE.BasedontheresultsoftheBFSsubstitutionwith wastemixturesinpapermaking,thelimemudsignificantlyimprovedthecompressive strengthoftheslurry.Moreover,twoSPWtestgroupsandonePWMtestgroupwereused forAEadjustment.ThewastesubstitutionswereS7L3,S8L2,andPWM3-4.Thecontentof AEintheactivatordecreasedfrom10%to2%.
strength. Since the AE was 6%, the compressive strength could approach more than 65 MPa after 28 days of curing.
TheeffectsofAEonthecompressivestrengthsareshowninFigure 10.Whenthe contentofAEexceeded6%,thecompressivestrengthincreasedastheAEdecreased. Thereasonwasthepresenceofexcessivehydroxylionsintheslurry,whichcouldform carbonateonthesamplesurfacebyevaporationofwater[19].Inaddition,thisreaction ledtothedestructionofthecolloidalstructure.With6%ofAE,thecompressivestrength reacheditspeak.ThisresultisconsistentwiththebestAEintervalinapreviousstudy[30]. However,S8L2andPWM3-4failedtohardenafter24handcouldnotbede-molded.This resultsuggestedthatthealkalinityoftheactivatorwasnotsufficienttofullystimulatethe activityoftheBFSandlimemud,resultinginadramaticdecreaseincompressivestrength. SincetheAEwas6%,thecompressivestrengthcouldapproachmorethan65MPaafter 28daysofcuring.

Figure10. TheeffectofdifferentAEonthecompressivestrength.
4.Conclusions
4. Conclusions
Thisstudyevaluatedthepotentialofvariouswastesinpapermakingtobealkaliactivatedascementitiousmaterialsintermsofmechanicalproperties,flexibility,and sampletexture.Theresultsexpandedtheknowledgeboundaryofpaperwastereuse
This study evaluated the potential of various wastes in papermaking to be alkaliactivated as cementitious materials in terms of mechanical properties, flexibility, and sample texture. The results expanded the knowledge boundary of paper waste reuse and demonstrated the potential advantages of using papermaking wastes as building materials (e.g., toughness enhancement and wood texture). Some experimental data (e.g., 6% AE, 20% waste addition) can also be used as a reference for the actual transformation of wastes in papermaking. However, the experimental findings have limitations in terms of
Figure 10. The effect of different AE on the compressive strength
anddemonstratedthepotentialadvantagesofusingpapermakingwastesasbuilding materials(e.g.,toughnessenhancementandwoodtexture).Someexperimentaldata(e.g., 6%AE,20%wasteaddition)canalsobeusedasareferencefortheactualtransformation ofwastesinpapermaking.However,theexperimentalfindingshavelimitationsinterms ofgeneralizationbecausethecompositionsofpapermakingwastesfromdifferentsources varyconsiderably.Theconclusionsofthisstudyareasfollows:
(1) Accordingtotheexperimentalresults,thecompressivestrengthshowedahugespan of14.5~73.7MPaaftercuringfor28days.WhentheBFSwaspartiallysubstitutedby thesameproportionofwastes,thecompressivestrengthdecreasedsequentiallyfrom thelimemud,papersludge,bottomash,andwoodchips.Theeffectofthemixtureof thelimemudandpapersludgeonthecompressivestrengthshowedthatforevery5% reductionintheproportionoflimemud,thestrengthdecreasedbynearly2.5MPa.
(2) Fromthestress-timecurves,neitherthelimemudnorthebottomashcontributed totheflexibilityoftheslurry.Onthecontrary,thepapersludgeandwoodchips significantlyoptimizedtheslurries.Inordertostrikeabalancebetweenthecompressivestrengthandtheflexibilityproportion,20%ofthewastesubstitutionshouldbe preliminarilydeterminedasthesuitableproportion.
(3) Consideringthepossibilityofaddingwoodchipsasdecorationmaterials,15%of woodchipsand5%ofpapersludgeareappropriateproportionsinthemixture.
(4) Forthealkali-activatedmixtureofwastesandBFS,6%ofAEwasthebestratioforthe activatorwiththesilicatemodulus(Ms)fixedat0.9.
AuthorContributions: T.Y.:Conceptualization,Methodology,Formalanalysis,Investigation,Data curation,Writing—originaldraft.S.-R.L.:Fundingacquisition,Projectadministration,Supervision, Resources,Writing—reviewandediting.W.-Y.K.:Supervision,Resources,Writing—reviewand editing.Allauthorshavereadandagreedtothepublishedversionofthemanuscript.
Funding: ThisresearchwasfundedbyMinistryofEducationofTaiwan,grantnumberH108-AA09.
DataAvailabilityStatement: https://www.researchgate.net/publication/364358812_data_for_Research_ on_Recycling_Various_Wastes_in_Papermaking_as_Eco-Friendly_Slurry (accessedon18September2022).
Acknowledgments: WethanktheCHPformaterialsprovision,andNCKUC-Hubforspaceand instruments.
ConflictsofInterest: Theauthorsdeclarenoconflictofinterest.
Nomenclature
BFSblastfurnaceslag
SPWthesingle-typepapermakingwastes
PWMthepaperwastemixture
AEalkaliequivalent
Mssilicatemodulus
W/Bwater-binderratio
wt.%weightpercentage
References
1. Lombard,B. CepiPreliminaryStatisticsReport2021;ConfederationofEuropeanPaperIndustries:Brussels,Belgium,2022;p.2. Availableonline: https://www.cepi.org/statistics/ (accessedon23February2022).
2. Kilinc,M.B.EpicellulyseXT(XerophilicTechnology)-PaperMillSludge(Waste)toEnergy&OrganicFertilizer.Availableonline: https://sdgs.un.org/partnerships/epicellulyse-xt-xerophilic-technology-paper-mill-sludge-waste-energyorganic-fertilizer (accessedon18September2022).
3. Suhr,M.;Klein,G.;Kourti,I.;Gonzalo,M.R.;Santonja,G.G.;Roudier,S.;Sancho,L.D. BestAvailableTechniques(Bat)Reference DocumentfortheProductionofPulp,PaperandBoard;PublicationsOfficeoftheEuropeanUnion:Luxembourg,2015;Volume906.
4. Monte,M.C.;Fuente,E.;Blanco,A.;Negro,C.WastemanagementfrompulpandpaperproductionintheEuropeanUnion. Waste Manag. 2009, 29,293–308.[CrossRef][PubMed]
5. Gavrilescu,D.Energyfrombiomassinpulpandpapermills. Environ.Eng.Manag.J. 2008, 7,537–546.[CrossRef]
6. Tarnawski,W.Emissionfactorsforcombustionofbiomassfuelsinthepulpandpapermills. Czas.FibresText.East.Eur. 2004, 12, 91–95.
7. vanEwijk,S.;Park,J.Y.;Chertow,M.Quantifyingthesystem-widerecoverypotentialofwasteintheglobalpaperlifecycle. Resour.Conserv.Recycl. 2018, 134,48–60.[CrossRef]
8. Kaur,R.;Tyagi,R.D.;Zhang,X.Reviewonpulpandpaperactivatedsludgepretreatment,inhibitoryeffectsanddetoxification strategiesforbiovalorization. Environ.Res. 2020, 182,109094.[CrossRef][PubMed]
9. Martins,F.M.;Martins,J.M.;Ferracin,L.C.;daCunha,C.J.Mineralphasesofgreenliquordregs,slakergrits,limemudandwood ashofaKraftpulpandpapermill. J.Hazard.Mater. 2007, 147,610–617.[CrossRef]
10. deAzevedo,A.R.G.;Alexandre,J.;Pessanha,L.S.P.;Manhães,R.d.S.T.;deBrito,J.;Marvila,M.T.Characterizingthepaper industrysludgeforenvironmentally-safedisposal. WasteManag. 2019, 95,43–52.[CrossRef]
11. Buruberri,L.H.;Seabra,M.P.;Labrincha,J.A.Preparationofclinkerfrompaperpulpindustrywastes. J.Hazard.Mater. 2015, 286, 252–260.[CrossRef]
12. Singh,S.K.;Singh,A.;Singh,B.;Vashistha,P.Applicationofthermo-chemicallyactivatedlimesludgeinproductionofsustainable lowclinkercementitiousbinders. J.Clean.Prod. 2020, 264,121570.[CrossRef]
13. Ferreiro,S.;Frías,M.;VigildelaVilla,R.;SánchezdeRojas,M.I.Theinfluenceofthermalactivationofartpapersludgeonthe technicalpropertiesofblendedPortlandcements. Cem.Concr.Compos. 2013, 37,136–142.[CrossRef]
14. Ukrainczyk,N.;Vrbos,N.;Koenders,E.A.B.Reuseofwoodybiomassashwasteincementitiousmaterials. Chem.Biochem.Eng.Q. 2016, 30,137–148.[CrossRef]
15. Yi,T.;Liou,S.-R.;Kuo,W.-Y.TheInteractionEffectsoftheParametersonOptimizationDesigninPaperProductionWasteUsage onAlkali-ActivatedSlagwithTaguchiMethod. J.Renew.Mater. 2022, 10,1753–1772.[CrossRef]
16. Wyrzykowski,M.;Ghourchian,S.;Sinthupinyo,S.;Chitvoranund,N.;Chintana,T.;Lura,P.Internalcuringofhighperformance mortarswithbottomash. Cem.Concr.Compos. 2016, 71,1–9.[CrossRef]
17. Wang,S.-D.;Scrivener,K.L.S.Hydrationproductsofalkaliactivatedslagcement. Cem.Concr.Res. 1995, 25,561–571.[CrossRef]
18. Xu,H.;VanDeventer,J.S.J.Thegeopolymerisationofalumino-silicateminerals. Int.J.Miner.Process. 2000, 59,247–266.[CrossRef]
19. Chen,J.-H.Silicon-ContainedWasteasaRawMaterialofInorganicPolymers.Ph.D.Thesis,NationalChengKungUniversity, TainanCity,Taiwan,2009.
20. Huang,K.;Fan,X.;Gan,M.;Ji,Z.UseofMunicipalSolidWasteIncinerator(MSWI)FlyAshinAlkaliActivatedSlagCement.In CharacterizationofMinerals,Metals,andMaterials2019;Springer:Berlin/Heidelberg,Germany,2019;pp.401–410.
21. Gao,X.;Yuan,B.;Yu,Q.L.;Brouwers,H.J.H.Characterizationandapplicationofmunicipalsolidwasteincineration(MSWI) bottomashandwastegranitepowderinalkaliactivatedslag. J.Clean.Prod. 2017, 164,410–419.[CrossRef]
22. Kang,S.-P.;Kwon,S.-J.J.C.;Materials,B.Effectsofredmudandalkali-activatedslagcementonefflorescenceincementmortar. Constr.Build.Mater. 2017, 133,459–467.[CrossRef]
23. Liu,G.;Florea,M.;Brouwers,H.J.H.Wasteglassasbinderinalkaliactivatedslag–flyashmortars. Mater.Struct. 2019, 52,101. [CrossRef]
24. Long,W.-J.;Tan,X.-W.;Xiao,B.-X.;Han,N.-X.;Xing,F.Effectiveuseofgroundwasteexpandedperliteasgreensupplementary cementitiousmaterialineco-friendlyalkaliactivatedslagcomposites. J.Clean.Prod. 2019, 213,406–414.[CrossRef]
25. Choi,H.;Choi,Y.C.Settingcharacteristicsofnaturalcellulosefiberreinforcedcementcomposite. Constr.Build.Mater. 2021, 271, 121910.[CrossRef]
26. Dai,X.;Aydin,S.;YücelYardimci,M.;Qiang,R.E.N.;Lesage,K.;DeSchutter,G.Rheology,early-agehydrationandmicrostructure ofalkali-activatedGGBFS-Flyash-limestonemixtures. Cem.Concr.Compos. 2021, 124,104244.[CrossRef]
27. deAzevedo,A.R.G.;Alexandre,J.;Xavier,G.d.C.;Pedroti,L.G.Recyclingpaperindustryeffluentsludgeforuseinmortars:A sustainabilityperspective. J.Clean.Prod. 2018, 192,335–346.[CrossRef]
28. Saeli,M.;Senff,L.;Tobaldi,D.M.;Carvalheiras,J.;Seabra,M.P.;Labrincha,J.A.Unexploredalternativeuseofcalcareoussludge fromthepaper-pulpindustryingreengeopolymerconstructionmaterials. Constr.Build.Mater. 2020, 246,118457.[CrossRef]
29. Silva,G.;Kim,S.;Bertolotti,B.;Nakamatsu,J.;Aguilar,R.J.C.;Materials,B.Optimizationofareinforcedgeopolymercomposite usingnaturalfibersandconstructionwastes. Constr.Build.Mater. 2020, 258,119697.[CrossRef]
30. Shi,C.;Roy,D.;Krivenko,P. Alkali-ActivatedCementsandConcretes;CRCPress:BocaRaton,FL,USA,2003.
PAPERmaking!
FROM THE PUBLISHERS OF PAPER TECHNOLOGY INTERNATIONAL®
Volume10, Number2, 2024
Production of environmentally friendly and antibacterial MDF (Medium-density fiberboard) surfaces with green synthesized nano silvers
ARIFE
KÜBRA YONTAR1,3 SINEM ÇEVIK2,3 & SEYMA AKBAY4
The study involves modifying green nano silver particles (AgNP) synthesized from the extracts of Cannabis Sativa seeds onto Medium-Density Fiberboard (MDF) surfaces. Microstructural examinations and chemical analyses of the produced surfaces were performed with Scanning Electron Microscope (SEM) and Energy Dispersive Spectroscopy (EDS). A peak at 415nm was found in the UV–Vis spectrophotometer analysis range of the aqueous media containing green synthesized silver nanoparticles. The average size of AgNPs was found to be 45nm by particle size distribution analysis. Performance tests of the modified surfaces revealed that the abrasion and scratch resistance of the coating containing 1% AgNP increased twice and that all modified surfaces were resistant to staining. With nano silver modification, energy efficiency was achieved by shortening the gelation (drying) time of the surfaces coming out of the bath by one and a half minutes during coating production. Nano silver-modified MDF surfaces have shown antibacterial properties that are at least 1000 times more effective. MDF surface coatings modified with new-generation plant-based nanoparticles can prevent and reduce bacterial diseases that can be contaminated by the environment. The production of MDF surfaces that provide low energy consumption and antibacterial properties with green production will be possible.
Contact information:
1 Department Mechanical and Metal Technologies, Ondokuz Mayis University, 55300, Samsun, Turkey.
2 Department of Metallurgical and Materials Engineering, Ondokuz Mayis University, 55270, Samsun, Turkey
3 Department of Nanoscience and Nanotechnology, Ondokuz Mayis University, Atakum 55139, Samsun, Turkey
4 CAMSAN ORDU ĂGAÇ SANAY˙I˙I VE T˙IC. Inc., 52000, Ordu, Turkey
Inorganic Chemistry Communications 159 (2024) 111865
https://doi.org/10.1016/j.inoche.2023.111865
Creative Commons Attribution 4.0 License
The Paper Industry Technical Association (PITA) is an independent organisation which operates for the general benefit of its members – both individual and corporate – dedicated to promoting and improving the technical and scientific knowledge of those working in the UK pulp and paper industry. Formed in 1960, it serves the Industry, both manufacturers and suppliers, by providing a forum for members to meet and network; it organises visits, conferences and training seminars that cover all aspects of papermaking science. It also publishes the prestigious journal Paper Technology International® and the PITA Annual Review, both sent free to members, and a range of other technical publications which include conference proceedings and the acclaimed Essential Guide to Aqueous Coating.

Short communication
Inorganic Chemistry Communications
journal homepage: www.elsevier.com/locate/inoche
Production of environmentally friendly and antibacterial MDF (Medium-density fiberboard) surfaces with green synthesized nano silvers
Arife Kübra Yontar a, c, * , Sinem Çevik b, c , S ¸ eyma Akbay d
a Department Mechanical and Metal Technologies, Ondokuz Mayis University, 55300, Samsun, Turkey
b Department of Metallurgical and Materials Engineering, Ondokuz Mayis University, 55270, Samsun, Turkey
c Department of Nanoscience and Nanotechnology, Ondokuz Mayis University, Atakum 55139, Samsun, Turkey
d CAMSAN ORDU A ˘ GAÇ SANAYII VE TIC. Inc., 52000, Ordu, Turkey
ARTICLE INFO
Keywords:
Green synthesis
Nano silver
Antibacterial
MDF coating
Mechanical strength
ABSTRACT


The study involves modifying green nano silver particles (AgNP) synthesized from the extracts of Cannabis Sativa seeds onto Medium-Density Fiberboard (MDF) surfaces. Microstructural examinations and chemical analyses of the produced surfaces were performed with Scanning Electron Microscope (SEM) and Energy Dispersive Spectroscopy (EDS). A peak at 415 nm was found in the UV–Vis spectrophotometer analysis range of the aqueous media containing green synthesized silver nanoparticles. The average size of AgNPs was found to be 45 nm by particle size distribution analysis. Performance tests of the modified surfaces revealed that the abrasion and scratch resistance of the coating containing 1 % AgNP increased twice and that all modified surfaces were resistant to staining. With nano silver modification, energy efficiency was achieved by shortening the gelation (drying) time of the surfaces coming out of the bath by one and a half minutes during coating production. Nano silver-modified MDF surfaces have shown antibacterial properties that are at least 1000 times more effective. MDF surface coatings modified with new-generation plant-based nanoparticles can prevent and reduce bacterial diseases that can be contaminated by the environment. The production of MDF surfaces that provide low energy consumption and antibacterial properties with green production will be possible.
1. Introduction
Infections and diseases, especially those of hospital origin, pose a worldwide health risk and cause serious deaths yearly [1] A report in the Lancet noted that approximately 1.27 million deaths in 2019 were caused by AMR bacteria, which include six leading pathogens such as Escherichia coli, Staphylococcus aureus, Streptococcus pneumoniae, Acinetobacter baumannii, Klebsiella pneumonia, and Pseudomonas aeruginosa [2] Current global pandemics have raised public awareness of developing new antimicrobial surfaces and coatings that can stop microbial contamination and prevent the spread of infection-causing bacteria [3] Medium-density fiberboard (MDF) is widely used as a wood substrate in furniture and wood products due to its unique grain and texture, easy processing, lightweight and high strength. MDF products are frequently used in flooring, furniture and building materials, tables, counters, cutlery etc. and have a place in our daily lives in many areas, including hospitals and health institutions. MDF is very sensitive to rot and mold, and since it has a structure that can absorb
* Corresponding author.
E-mail address: kubra.demirbas@omu.edu.tr (A. Kübra Yontar).
https://doi.org/10.1016/j.inoche.2023.111865
moisture in the environment, it provides suitable conditions for bacterial growth [4,5] MDFs are generally used as coated with polymers such as Polyvinyl chloride and melamine and special papers for aesthetic appearance and protection. In this way, moisture retention and disintegration of the fibers are prevented, while their resistance to fire and chemicals is increased [6]. Unfortunately, until today, MDF surfaces did not provide antibacterial effects and were the source of many moldrelated diseases. Generally, people become ill with infectious diseases by coming into direct or indirect contact with pathogenic microorganisms [7]. For this reason, minimizing the bacterial growth on the surfaces of MDF and similar products used in hospitals and food areas is of great importance for public health. In recent years, it has come to the fore to add antibacterial properties to the surfaces of these wood-based products. Various studies have been carried out on antibacterial MDF surfaces, but they are not sufficient [8–11] The diversification of these studies and their preparation with natural ingredients that do not show toxic effects are critical for both the environment and human health. Antibacterial properties for MDF and all other surfaces can be achieved
Received 26 October 2023; Received in revised form 23 November 2023; Accepted 9 December 2023
Availableonline10December2023 1387-7003/©2023ElsevierB.V.Allrightsreserved.

with metallic nanoparticles. Among the metallic nanoparticles, silver nanoparticles (AgNPs) have been widely used in antibacterial surface applications due to their antibacterial, antifungal, antioxidant, anticancer and anti-inflammatory effects [12,13] However, due to the toxic chemicals and harmful reactions used in AgNP production, they become harmful to the environment and human health. Green synthesis, which has replaced the sol–gel method, sono chemical method, thermal decomposition method, pulsed laser deposition and pyrolysis process methods in recent years, provides the production of silver nanoparticles at low cost with a minimal toxic effect by using natural ingredients [14,15] It is also known that green synthesized AgNPs have superior effects compared to those produced by other methods. They have also been proven to be potentially pathogenic antibacterial agents against a variety of Gram-positive and Gram-negative bacteria, including Salmonella epidermidis, Streptococcus pyogens, Escherichia coli, Bacillus subtilis, Vibrio parahaemolyticus, Salmonella Typhimurium, Pseudomonas aeruginosa, Staphylococcus aureus, Streptococcus pneumoniae [16–18]. They owe all these impressive properties to plant extracts. Many natural resources such as plants, fungi and algae can be used as initiators in green synthesis production [19,20] Herbs are the most effective ones ever known. Flowers, leaves, stems, roots and bulbs of plants are used for green synthesis. They take part in the green synthesis reaction as starting agents by obtaining the extracts of the used part of the plants in water [21,22]. Flavonoids, carboxyl groups, beneficial acids, hydroxyl groups and all other secondary metabolites in plants reduce Ag+ ions in aqueous solution and provide AgNP synthesis and prevent agglomeration of these nanoparticles [23–25] Silver nanoparticles synthesized using extracts of Cannabis Sativa seeds are known
to have small sizes and high antibacterial effects [21,23]. Silver nanoparticles synthesized using extracts of Cannabis Sativa seeds are known to have small sizes and high antibacterial effects. This is because Cannabis Sativa contains high levels of Cannabinoids, Terpenes, Organic Acids, Phenolic Compounds and Flavonoids [26–29]
In this current study, the curing time was improved and the antibacterial effect was achieved by modifying green synthesized AgNPs with extracts of Cannabis sativa seeds on MDF surfaces. MDF surfaces, which are produced at high rates in the wood industry and used in many places in daily life, have been made resistant to bacteria. In this way, it is aimed to reduce diseases caused by mold and bacteria and improve the quality of human life. In addition, the fact that the raw materials used for the production of nanoparticles are natural will ensure that the antibacterial MDF surfaces produced are environmentally and climate friendly.
2. Experimental methods and materials
2.1.
Materials
Silver nanoparticles were synthesized using plant extracts and silver nitrate (AgNO3). Silver nitrate (AgNO3) salt (99 %) was purchased from Sigma Aldrich. Cannabis sativa seeds were obtained from the local market. Melamine and UC 205 coded BLACK colored papers used in the surface coating of MDFs were specially supplied by ÇAMSAN A.S ¸ The materials used in all other MDF surface coating processes and the MDF itself are company-specific materials that ÇAMSAN A.S ¸ provides for its own production. This coating solution consists of melamine glue,
Fig. 1. Production of silver nanoparticles by green synthesis method.
A. Kübra Yontar

hardener, wetting agent, release agent, and antiblocanticust chemicals. The proportion of melamine glue varies between 99 and 100 %.
2.2. Green synthesis of silver nanoparticles
Cannabis Sativa seeds contain carboxylic acids, oleic acid, antioxidants, terpenoids, flavonoids, alkaloids and canniprene [30,31] These biomolecules found in plants are called secondary metabolites and generally act as both reductants and stabilizers in the green synthesis and nanoparticle production mechanism. Hydroxyl groups (OH) found in plant biomolecules such as amino acids, alkaloids, proteins, polyphenols, flavonoids, enzymes, tannins, carbohydrates and saponins provide the stabilization and reduction of silver ions (Ag+) to Ag0 Further reduction to Ag + leads to the formation of silver nuclei, resulting in the synthesis of AgNPs. Ag+ ions as OH groups bind to the carbon atoms of aromatic rings of plants, which is the mechanism that enables the reduction of Ag+ into nanoparticles [33–35] The first step required for green synthesis of nanosilver is the preparation of the plant extract. First, Cannabis Sativa seeds were crushed in a mortar until they reached an average size of 500 μm. Then the seed pieces were thrown into 200 mL of distilled water. Water was preferred in obtaining the extract of Cannabis Sativa seeds. Because, by using water and heat together, results as effective as alcohol extraction can be achieved. With temperature, the components and oils found in plants can rapidly diffuse into water. As a greener and more economical method, the use of water in the preparation of plant extracts is highly preferred [36–38]. After heating at 90˚C for 20 min, the water containing the seeds was kept at room temperature for 12 h. Finally, the plant extracts were obtained by
passing the solution through filter paper. As shown in Fig. 1, when the color of the water changed from clear to light brown, it was understood that the seed extracts were released into the water. In order to compare the antibacterial, mechanical and other performance properties with nano silver modification on MDF surfaces, silver solutions were used at the rates of 1,3 and 5 % by weight on the surfaces to be coated. The green synthesis method was used to prepare individual nano silver solutions at these ratios. Basically, silver nitrate solution is prepared first for green synthesis. These nano silver solutions, which will be added to the coating solution, which will be 40 mL in total, were prepared with 7 mL of distilled water. While preparing nano silver solutions, 0.4 g for 1 %, 1.2 g for 3 % and 2 g for 5 % silver nitrate were used. Silver nitrates were added to 7 mL of pure water in separate beakers and mixed for 15 min in a magnetic stirrer to ensure complete dissolution. After adding 3 mL of Cannabis Sativa seeds extracts into silver nitrate solutions, stirring continued for 10 min. When the reaction solution turned from light yellow to dark gray, the synthesis process was complete and mixing was stopped. Thus, as shown in Fig. 1, silver nanoparticles were synthesized with plant extracts.
2.3. Production of antibacterial MDFs
An antibacterial effective product was produced with silver nanoparticle modification on MDF surfaces. In the MDF surface coating process, the production stages of which are shown in Fig. 2, the first step was the modification of AgNPs into melamine. A solution of 10 mL of green synthesized nanosilver particles was added to 30 mL of melamine and mixed for 10 min until it became homogeneous. Then, after pouring
Fig. 2. MDF coating manufacturing process with AgNP modification.
A. Kübra

3. Results of characterization analyzes, (A) UV–Vis spectrophotometer, (B) Particle Size Measurement, and (C) X-Ray Diffraction Analysis.
the melamine mixture into a glass container, A4 size MDF coating papers were slowly placed in the bath. The solution was distributed over the entire surface with the help of a brush so that the paper could absorb the solution homogeneously. After the paper had absorbed all the solution, it was placed in the second bath. In the second bath, a chemical solution consisting of binders and hardeners of ÇAMSAN company’s own recipe was used. After the second bath, the papers were placed on the MDF surfaces and compressed at 190 ◦ C in a hot press. The MDFs were dried to ensure that the paper and all components adhere to the surface completely. After the drying process, the final antibacterial effective MDF product was created. A total of 4 MDF samples were produced together with the control sample named R. Sample A is 1 %, sample B is 3 % and sample C is 5 % nano silver modified surfaces.
2.4.
Characterizations
Particle size measurement analysis was performed to calculate the average sizes of nano silvers produced by green synthesis with Mastersizer 3000 laser technology (ISO-13320). By adjusting the particle size distribution histogram to the log-normal distribution function, the average particle size for silver nanoparticles has been calculated which is represented as in Eq(1) [32];
deviation. The wavelength range for Ag-NPs is 300 to 700 nm, and this was detected by UV–Vis spectrophotometer analysis performed 48 h after biosynthesis (Perkin Elmer, Lambda 25). In the range of 10◦ ≤ 2θ ≥ 80◦ at room temperature, XRD was performed at a rate of 2◦ /min using a Rigaku Smart Lab CuKα radiation monochromatic filter. XRD analyses of silver and plant extract added films and only plant added films were carried out separately and the presence and crystallite sizes of silver nanoparticles were investigated. Debye-Scherer’s equation(1) was used to calculate the crystallite size and microstrain of silver nanoparticles. Debye-Scherer’s equation is;
D = K λ/βcosθ (2)
where D is the Crystallites size (nm), λ the X-ray wavelength (k = 0.1541 nm), K the so-called shape or geometry factor which usually takes a value of about 0.9 (Scherer constant), β the full width at half maximum (FWHM) of diffraction peak and ‘‘θ’’ the diffraction angle. MDF surface microstructure and EDS chemical mapping were examined using an 80 mm2 X-MAX detector and an EDS attachment on a JEOL 7001F Field Emission (FE) Scanning Electron Microscope (SEM).
2.5. Performance tests
where D corresponds to average particle size and σD is the standard
MDF is the process of coating the surface of the boards under high pressure and heat by impregnating and drying decorative papers in glued baths. They are available in various thicknesses and features and are often used in areas such as furniture, interior design, countertops, floor coverings, wall panels. The key features of HPL are: resistance to
Fig.

physical abrasion, scratching and impact, variety of finishes, and resistance to stains and chemicals. All performance tests were carried out in accordance with TSE EN 438–2 standard. This standard is used to evaluate the performance of coating materials and to determine the compliance of products with quality standards. In this way, it is aimed to offer reliable and quality coating materials to consumers. Three performance tests were performed for antibacterial MDF surfaces modified with AgNP. The first of these is the stain resistance test. The stain tests of MDF products used in living areas were carried out by dripping the substances that are used extensively in daily life and cause stains. Substances are cleaned from the surface by washing after being kept on the surface for one day in contact with oxygen and in environments where
contact with oxygen is cut off. It is checked whether there is any trace, swelling, color change on the surface. The substances used in the test and leaving significant stains are as follows; acetone, vinegar, hydrogen peroxide, trioxidant, coffee and bleach. The second test is the wear resistance measurement. For the wear test, a 50 x 50 mm MDF sample is cut. Abrasion test is done by rotating the test specimen with cylindrical wheels covered with sandpaper and applied load. The wheels cause an annular wear on the surface of the sample. The test is continued until there is a certain amount of wear and the results are given over the number of revolutions. The first wear point occurs when the pattern in the sample is clearly visible or a solid color appears so that 3/4 of the substrate is visible. When approximately 95 % wear occurs on
Fig. 4. SEM images of all nanosilver modified and non-modified MDF samples.
A. Kübra Yontar

patterned/unpatterned MDF, the number of revolutions at the last wear point is recorded. The third test was the scratch resistance test. For the scratch test, a 50 x 50 mm MDF sample is cut and placed in the test device. The scratch tip of this tester is diamond and double scratches are created starting from 1 N force up to 2, 4, 6 N. Each double scratch is adjusted to 1–2 mm between itself, and 3–5 mm between double scratches. The test is continued until the maximum load value required to produce a continuous surface scratch is determined. In addition, the gelation times of polymeric adhesives used in the production of surface coatings with nano silver reinforcement in 3 different ratios were also calculated. This is the time required for the solution to cure after being absorbed into the paper and hot pressed. Gelling time covers a large part of the time spent on total production. Therefore, by shortening this period, time and energy savings can be achieved in production.
2.6. Antibacterial activity
AgNPs and modified MDF surfaces with plant extracts were tested for their antibacterial activities using a version of the Japanese Industrial Standard JIS Z 2801. Staphylococcus aureus (NCTC-13552) and Escherichia coli (ATCC 25922) bacteria had been grown at a concentration of 5 x 10⁵ CFU/mL, and 1 x 1 cm test samples were inserted within. As a control, a culture with 5 x 10⁵ CFU/mL that was created without a sample was employed. Samples were shaken in Eppendorf tubes for 4 h at 100 rpm. The sample was vortexed after spending 30 s in an ultrasonic water bath to separate the bacteria that were sticking to the surface. Transferring 100 L of suspension into 900 L of physiological saline (FTS) served as the dilution process. Plate Count Agar (PCA)-filled petri plates were split into eight equal portions, and 25 μL of each dilution was seeded. Three duplicates of each experiment were performed. The antibacterial activity value of colony-forming units (CFU)
Fig. 5. EDS mapping results of nanosilver modified and non-modified MDF surfaces.
was measured after incubation for 24 h at 37 ◦ C. The growth difference between the culture treated with coated filters and the positive control was assessed logarithmically and documented.
3. Results and discussion
3.1. Characterizations of silver nanoparticles
UV–Vis spectroscopy has been utilized to clarify the optical properties and demonstrate the generation of AgNPs after green synthesis. Fig. 3 (A) demonstrates that the most intense wavelength for silver nanoparticles is around 415 nm, 72 h after green synthesize. The peak observed in the UV–Visible spectrum is strongly affected by the size, shape, and morphology of the created AgNP. Earlier studies has shown that the visible zone of spherical-shaped AgNP fluctuates in wavelength with amplitude from 400 to 470 nm under UV–Visible spectroscopy [39–44] The varying sizes and shapes of AgNP cause a wide range of absorption bands to appear. Average sizes and standard derivation values of silver nanoparticles produced by green synthesis are shown in the graph given in Fig. 3 (B). The average nanoparticle size and standard deviation were found to be 45 nm and 1.59 nm, respectively. UV–Vis spectroscopy and particle size measurement analyzes revealed that nano silver particles could be successfully synthesized in small sizes.
3.2. X-ray diffraction analysis of MDF surfaces
Crystal phases, nature and average crystal size values of MDF coating surfaces were measured and calculated by XRD analysis. In particular, XRD revealed the crystal structure of AgNP synthesized with Cannabis Sativa seed extracts and polymeric coating material in Fig. 3 XRD pattern of MDF surfaces revealed the sharp diffraction peaks at 30.68◦ , 36◦ , 43.62◦ , and 63.18◦ , indexed as (2 2 0), (3 1 1), (2 0 0) and, (2 2 0) Bragg’s reflection planes. These peaks correspond to FCC lattice structure and crystalline nature as indexed in JCPDS-04–0783 [45,46]. This crystal structure of our AgNPs parallels the XRD pattern of silver nanoparticles synthesized from plant extract in similar studies [47–52] The unassigned peaks were considered to have formed because of the crystallization of other organic compounds in the Cannabis Sativa seeds extract. The wide-ranging main crystal peaks appearing at 23◦ are predicted to arise mainly from the coating resin and added cross-linkers, and these peaks have also been revealed in similar studies [53–55] Debye-Scherrer formula (1) was used to calculate the crystallite size on MDF surfaces containing synthesized green AgNPs. Calculation of crystallite size of all samples was based on the four strongest peaks observed in the XRD pattern. The crystallite size was found to be 12.26, 9.58 and 6.13 nm for samples A, B and C, respectively. Crystallite size is known to belong to a consistently diffracted area and does not have the same meaning as particle size [56,57] The lowest crystallite sizes in sample C, which contains the highest amount of AgNP, are due to nanoparticles. It was calculated that the crystallite size decreased with increasing AgNP content. The addition of AgNP suppresses the growth of polymer particles in the melamine resin present in the MDF coating. Thus, it creates a retarding effect that reduces the crystallite size. Moreover, reducing the crystallite size leads to an increase in the surface area, which improves the antibacterial effect. The higher polymer ratio in the coating content causes the polymer grains and crystals to grow rapidly upon cooling and the crystallite sizes to increase [58–61]
3.3. Microstructural characterzation of MDF surfaces
SEM analysis was performed to examine the nanosilver distribution on the coating surfaces. Fig. 4 shows the microstructure images of the MDF sample without any coating and the MDF coating surfaces modified with nanosilver. Fig. 4 (R) shows the surface of an uncoated MDF sample. Fig. 4 (A), (B) and (C) show the microstructures of the coating surfaces containing 1 %, 3 % and 5 % nanosilver. Fig. 4 (D) shows the
Table 1
Stain resistance of nanosilver modified MDF coatings.
AgNP Modified MDF Samples
1 %
3 %
5 %
Stain resistance
Outdoor (in contact with oxygen)
Closed to external environment (no contact with oxygen)
Vinegar (Suitable) Vinegar (Suitable)
Acetone (Suitable) Acetone (Suitable)
Coffee (Suitable) Coffee (Suitable)
Bleach (Suitable) Bleach (Suitable)
H2O2 Suitable (Slight discoloration) H2O3 (Suitable)
Vinegar (Suitable) Vinegar (Suitable)
Acetone (Suitable) Acetone (Suitable)
Coffee (Suitable) Coffee (Suitable)
Bleach (Suitable) Bleach (Suitable) (Light Stain)
H2O2Suitable (Slight discoloration) H2O3 (Suitable)
Vinegar (Suitable) (Light Stain)
Vinegar (Suitable)
Acetone (Suitable) Acetone (Suitable)
Bleach (Suitable) Bleach (Suitable)
Coffee (Suitable) Coffee (Suitable) H2O2 (Suitable) H2O3 (Suitable)
Table 2
Wear, scratch resistance and curing times of nanosilver modified MDF surface coatings.
Agnps Modified Samples (%) Abrasion Resistance (Ip + Fp)/2 (>150) Scratch Resistance (>1.75 N) Gel Time (Curing Time)
edge section of the MDF sample. The layer on the top layer is the coating consisting of paper, resin and nanosilver particles applied to the MDF surface. EDS analysis was performed to determine the coating content and nanosilver presence on the coating surfaces. Fig. 5 shows the results of the EDS mapping analyses. Fig. 5 (R) shows the EDS mapping of the uncoated MDF surface, and Fig. 5 (A), (B), and (C) of the AgNP modified coating surfaces. The elements present on the surfaces are shown separately for the regions they are found in the mapping results with different colors. EDS results of the sample without coating revealed that

it contained C, O, Ca and K elements coming from the structure of the wood and binders used in MDF production. It is known that the Pd element comes from the coating applied to the sample to provide conductivity for SEM imaging. In addition, it can be seen from the SEM image that the R sample does not contain nano silver and melamine resin added coating. In Fig. 4 (A), (B) and (C) images, the coating surface applied to the MDF surface under high temperature pressure and the nano silver particles dispersed on the surface are clearly visible. It is shown in Fig. 5 (A), (B) and (C) EDS results that the added nano silver particles are distributed homogeneously on all MDF surfaces. It is estimated that the N, Fe, Si, Al and Ti elements appearing in the EDS mapping results come from the melamine resin coating content and the plants used in nano silver synthesis [62,63]. The image of the MDF coating layer in Fig. 4 (D) shows that the total veneer thickness is 1 mm. This layer is the layer containing paper, melamine and nano silver.
3.4. Performance tests
The results of performance tests of silver nanoparticle treated and non-treated MDF surfaces are shown in Tables 1 and 2 Staining resistance tests were carried out both in an open air environment with oxygen and in a vacuum environment with no contact with oxygen. The resistance of the surfaces to staining with different contaminants has
been tested and Table 1 shows their status against each contaminant. Whether the contaminants are suitable for the stains they leave on the surface or whether they are stained is also recorded. Fig. 6 (A) shows the coating surfaces before the staining test. In Fig. 6 (B), the application of the staining tests is shown, and in Fig. 6 (C), the surfaces are shown separately for each pollutant after the staining test. The slightly light gray areas visible on all post-test surfaces are not due to staining, but due to the reflection of light from rough surfaces with the nano silver additive. After the staining test, it was determined that the nano silver treated surfaces were only slightly sensitive to hydrogen peroxide, bleach and vinegar. These staining amounts are at negligible levels. This result proved that nano silver reinforcement does not reduce the resistance of the coating against different pollutants and chemicals. In order to examine the effects of nanosilver on the mechanical strength of MDF coating surfaces, abrasion and scratch tests were carried out and the results are shown in Table 2 According to TSE EN 438–2 standards, the control values are 150 cycles for wear resistance and 1.75 N for scratch resistance. Performance test results were compared according to these values. It has been determined that silver nanoparticle reinforcement increases the mechanical strength of all MDF coating surfaces above their standard values. However, sample A with 1 % AgNP added showed the highest wear resistance with 275 cycles. It has a wear resistance almost twice the standard value. As the nanoparticle ratio increased,
Fig. 6. MDF surface images after performance tests, (A) MDF surface before tests, (B) application of stain resistance tests, (C) surface after stain resistance tests, (D) surfaces after wear test and, (E) furfaces after scratch test.
A.

7. Growth of bacterial colonies images, (A)
wear resistance decreased. It is thought that this may be due to increased nanoparticle agglomeration and the melamine coating showing higher slip behavior in some regions. It is possible that nanoparticles cannot bond sufficiently with melamine, which may increase the amount of wear on the surface. Scratch resistance was found to be 3 N in all samples. In other words, a strength approximately twice the standard value was achieved. The curing times of the coating solutions prepared with nanosilver reinforcement were determined for each ratio. Table 2 shows the curing times of the control and AgNP modified samples after both baths. In the production of coatings, two different baths containing melamine mixture are prepared to ensure that the papers adhere to the surface and to improve the surfaces both aesthetically and mechanically. The time it takes for the polymeric gel layer of the binder mixture on the surfaces immersed in the baths to dry is called gelation time. These gelation times were calculated for each nanoparticle doping ratio. With
Table 3
Antibacterial effect comparisons in logarithmic growth difference (CFU. mL 1). Bacteria Control
the nano silver particle additive, the curing time after the second bath was shortened by 1 min. Moreover, by increasing the nano silver rate, the time could be shortened by 30 s. In this way, the time spent in production can be shortened and the daily production amount can be increased by applying more MDF surface coatings. Shortening the gelation time was achieved by reducing the amount of water by filling the gaps in the polymeric coating of nano silver particles. As the amount of water that had to evaporate during drying decreased, gelation occurred faster.
3.5. Antibacterial activity of MDF surfaces
Fig. 7 (A), (B) and (C) shows the growth amounts of Staphylococcus aureus and Escherichia coli bacteria colonies on agar on nanosilveradded MDF coating surfaces. The lowest growth rate was obtained in
Fig.
%1 AgNPs modified MDF surface, (B) %3 AgNPs modified MDF surface, and (C) %5 AgNPs modified MDF surface and (D) antibacterial effect comparisons in logarithmic growth difference (CFU. mL 1) graph.
sample C with 5 % AgNP-doped coating surface. As the amount of nanosilver increased, bacterial growth decreased at a higher rate. With the values given in Fig. 7(D) and Table 3, it has been proven that nano silver additive has an antibacterial effect of at least 1000 times on MDF surfaces. Green synthesized nano silver modification even at a rate of 1 % in MDF coatings can provide a high antibacterial effect to all wood products used in daily life. The effective antibacterial activity mechanism of AgNPs is explained by destroying cell membranes, causing intracellular damage, altering genetic material, and causing oxidative stress in the bacterial cell. With their small size, nanoparticles have a large surface area that allows them to adhere to the cell wall, penetrate the cell, and cause bacterial death by causing a deterioration in membrane permeability and leakage of cell contents. Silver ions released from AgNPs into surfaces, tissues, and environments serve as a reservoir for antimicrobial activity [64–66] Another predicted mechanism is that the ability of silver nanoparticles to adhere to the bacterial cell wall is due to the electrostatic interaction between positively charged silver ions and the negatively charged surface of the cell membrane. Due to these electrostatic attractions, silver nanoparticles can cross the cell membrane and change its molecular composition and permeability. This causes the bacterial cell contents to disperse and the membrane to rupture [67] It has also been proven by previous studies that AgNPs are more effective against Gram-negative bacteria (Escherichia coli) than Gram-positive bacteria (Staphylococcus aureus). This effect is thought to be due to changes in the membrane structures of different bacterial pathogens. Positively charged nanosilver is likely to have a higher electrostatic interaction with the negatively charged E.coli bacterial wall and therefore has a higher effect, ensuring bacterial growth and death [68] The fact that the cell wall of E.coli bacteria is thinner than the wall of S.aureus bacteria explains the higher effectiveness of AgNPs [69]. Nano silvers synthesized with the extract of Cannabis Sativa seeds showed 1.5 times higher effectiveness against E.coli bacteria than S. aurues bacteria, and this effect has also been demonstrated in other studies [70–74] Nano silvers synthesized with the extract of Cannabis Sativa seeds have lower toxicity, while on the other hand, they show a higher antibacterial effect with the components coming from the essence. Thus, MDF surfaces with both natural content and antibacterial effect could be produced. Nano silvers synthesized with the extract of Cannabis Sativa seeds have lower toxicity [75], while on the other hand, they show a higher antibacterial effect with the components coming from the extract [76–79]. Thus, MDF surfaces with both natural content and antibacterial effect could be produced.
4. Conclusions
The aim of the study was to produce MDF surface coatings with improved mechanical strength, gelation time and high antibacterial effect. Moreover, the aim was to create MDF surfaces with clean content by providing these effects with nano silver particles naturally synthesized with plant extracts. In the study, by modifying nano silvers synthesized with Cannabis Sativa seed extracts into MDF surface coatings, products with 2 times higher abrasion and scratch resistance than standard surfaces, resistant to staining and high antibacterial effect were created. With green synthesized nano silver, productivity is increased by shortening the waiting time during production and the curing period that causes time loss. All tests revealed that the 1 % AgNP added MDF surface had both high mechanical strength and high antibacterial effects. As a result, it has been proven that MDF surfaces with superior properties can be produced with 1 % green synthesized nano silver additive. With this study, a new way has been developed for the production of low energy consumption, environmentally friendly and multifunctional MDF surfaces. Also, it will provide antibacterial production of wooden surfaces used in daily life in hospitals, homes, offices and all health institutions. In this way, it will be possible to reduce and eliminate various diseases transmitted from the environment.
Funding
The Unit of Scientific Research Projects, Ondokuz Mayıs University funded this study with the following project codes PYO. MUH.1908.21.001. The production of MDF surfaces and the performance tests of the surfaces were carried out in CAMSAN ORDU AGAÇ SANAYII VE TIC. Inc./Turkey.
CRediT authorship contribution statement
Arife Kübra Yontar: Conceptualization, Methodology, Data curation, Investigation, Writing – original draft. Sinem Çevik: Conceptualization, Funding acquisition, Investigation, Project administration, Resources, Supervision, Writing – review & editing. S ¸ eyma Akbay: Data curation, Formal analysis, Investigation, Resources, Visualization.
Declaration of competing interest
The authors declare that they have no known competing financial interests or personal relationships that could have appeared to influence the work reported in this paper.
Data availability
Data will be made available on request.
References
[1] M. Xie, M. Gao, Y. Yun, M. Malmsten, V.M. Rotello, R. Zboril, O. Akhavan, A. Kraskouski, J. Amalraj, X. Cai, J. Lu, H. Zheng, R. Li, Antibacterial nanomaterials: Mechanisms, impacts on antimicrobial resistance and design principles, Angew. Chem. Int. Ed Engl. 62 (17) (2023) e202217345
[2] X. Wang, M. Shan, S. Zhang, X. Chen, W. Liu, J. Chen, X. Liu, Stimuli-responsive antibacterial materials: Molecular structures, design principles, and biomedical applications, Adv. Sci. (Weinh) 9 (13) (2022) e2104843
[3] M. Sheridan, C. Winters, F. Zamboni, M.N. Collins, Biomaterials: Antimicrobial surfaces in biomedical engineering and healthcare, Curr. Opin. Biomed. Eng. 22 (4 Suppl 1) (2022), 100373, https://doi.org/10.1016/j.cobme.2022.100373
[4] Y. Zhu, N. Huang, X. Yan, Effect of three kinds of aloe emodin microcapsules prepared by SDBS, OP-10 and TWEEN-80 emulsifiers on antibacterial, optical and mechanical properties of water-based coating for MDF, Coatings 13 (9) (2023) 1477, https://doi.org/10.3390/coatings13091477
[5] H. Zhang, X. Feng, Y. Wu, Z. Wu, Effect of photoinitiator concentration and film thickness on the properties of UV-curable self-matting coating for wood-based panels, Forests 14 (6) (2023) 1189, https://doi.org/10.3390/f14061189.
[6] A. Zimmer, S. Angie Lunelli Bachmann, Challenges for recycling medium-density fiberboard (MDF), Results Eng. 19 (2023), 101277, https://doi.org/10.1016/j. rineng.2023.101277
[7] Y. Zhan, S. Yu, A. Amirfazli, A. Rahim Siddiqui, W. Li, Recent advances in antibacterial superhydrophobic coatings, Adv. Eng. Mater. 24 (4) (2022) 4856, https://doi.org/10.1002/adem.202101053
[8] A. Dorieh, M. Farajollah Pour, S. Ghafari Movahed, A. Pizzi, P. Pouresmaeel Selakjani, M. Valizadeh Kiamahalleh, H. Hatefnia, M.H. Shahavi, R. Aghaei, A review of recent progress in melamine-formaldehyde resin based nanocomposites as coating materials, Prog. Org. Coat. 165 (2022), 106768, https://doi.org/ 10.1016/j.porgcoat.2022.106768
[9] H. Jian, Y. Liang, C. Deng, J. Xu, Y. Liu, J. Shi, M. Wen, H.-J. Park, Research progress on the improvement of flame retardancy, hydrophobicity, and antibacterial properties of wood surfaces, Polymers (Basel) 15 (4) (2023), https:// doi.org/10.3390/polym15040951
[10] B. Lin, A.C.Y. Yuen, S. Oliver, J. Liu, B. Yu, W. Yang, S. Wu, G.H. Yeoh, C.H. Wang, Dual functionalisation of polyurethane foam for unprecedented flame retardancy and antibacterial properties using layer-by-layer assembly of MXene chitosan with antibacterial metal particles, Compos. B Eng. 244 (1) (2022), 110147, https://doi. org/10.1016/j.compositesb.2022.110147
[11] B. Feng, S. Zhang, Y. Di Wang, P. Li, L. Zheng, D. Gao, L. Huo, S.W. Cheng, Study on antibacterial wood coatings with soybean protein isolate nano-silver hydrosol, Prog. Org. Coat. 165 (2022), 106766, https://doi.org/10.1016/j. porgcoat.2022.106766.
[12] M.A. Huq, M. Ashrafudoulla, M.M. Rahman, S.R. Balusamy, S. Akter, Green synthesis and potential antibacterial applications of bioactive silver nanoparticles: A review, Polymers (Basel) 14 (4) (2022), https://doi.org/10.3390/ polym14040742
[13] G.E. Yılmaz, I. Goktürk, M. Ovezova, F. Yılmaz, S. Kılıç, A. Denizli, Antimicrobial nanomaterials: A review, Hygiene 3 (3) (2023) 269–290, https://doi.org/10.3390/ hygiene3030020
A. Kübra Yontar
[14] N. Kaur, A. Singh, W. Ahmad, Microwave assisted green synthesis of silver nanoparticles and its application: A review, J. Inorg. Organomet. Polym. 33 (3) (2023) 663–672, https://doi.org/10.1007/s10904-022-02470-2
[15] R.V. Bordiwala, Green synthesis and applications of metal nanoparticles - A review article, Results Chem. 5 (6) (2023), 100832, https://doi.org/10.1016/j. rechem.2023.100832
[16] W.M. Alamier, M.D.Y. Oteef, A.M. Bakry, N. Hasan, K.S. Ismail, F.S. Awad, Green synthesis of silver nanoparticles using Acacia ehrenbergiana plant cortex extract for efficient removal of rhodamine B cationic dye from wastewater and the evaluation of antimicrobial activity, ACS Omega 8 (21) (2023) 18901–18914, https://doi.org/10.1021/acsomega.3c01292
[17] M.F. Baran, C. Keskin, A. Baran, A. Hatipo ˘ glu, M. Yildiztekin, S. Küçükaydin, K. Kurt, H. Hosgoren, M.M.R. Sarker, A. Sufianov, O. Beylerli, R. Khalilov, A. Eftekhari, Green synthesis of silver nanoparticles from Allium cepa L. peel extract, their antioxidant, antipathogenic, and anticholinesterase activity, Molecules 28 (5) (2023), https://doi.org/10.3390/molecules28052310
[18] K. Parvathalu, S. Chinmayee, B. Preethi, A. Swetha, G. Maruthi, M. Pritam, B. Sreenivas, S.R. Naidu, G.L. Merlinsheeba, B. Murali, M. Vijay, K. Moses, D. C. Krishna, P.B. Bhaskar, Green synthesis of silver nanoparticles using Argyreia nervosa leaf extract and their antimicrobial activity, Plasmonics 18 (3) (2023) 1075–1081, https://doi.org/10.1007/s11468-023-01835-8
[19] R. Erenler, I. Hosaflioglu, Green synthesis of silver nanoparticles using Onobrychis sativa L: Characterization, catalytic degradation of methylene blue, antioxidant activity, and quantitative analysis of bioactive compounds, Mater. Today Commun. 35 (2023), 105863, https://doi.org/10.1016/j.mtcomm.2023.105863
[20] P. Herrera-Marín, L. Fernandez, F. Pilaquinga F., A. Debut, A. Rodríguez, P. Espinoza-Montero, Green synthesis of silver nanoparticles using aqueous extract of the leaves of fine aroma cocoa Theobroma cacao linneu (Malvaceae): Optimization by electrochemical techniques, Electrochimica Acta 447 (2023) 142122. 10.1016/ j.electacta.2023.142122.
[21] A.K. Yontar, S. Çevik, O. Yontar, Green production of plant/collagen-based antibacterial polyvinyl alcohol (PVA) nanocomposite films, Sustain. Chem. Pharm. 33 (1) (2023), 101119, https://doi.org/10.1016/j.scp.2023.101119
[22] H. Sulistyarti, M.M. Utama, A.M. Fadhila, A. Cahyaningrum, R.J. Murti, A. Febriyanti, Green synthesis of silver nanoparticles using Coffea canephora fruit skin extract and its application for mercury detection in face cream samples, Anal. Sci. 39 (3) (2023) 335–346, https://doi.org/10.1007/s44211-022-00237-w
[23] A.K. Yontar, S. Çevik, Effects of plant extracts and green-synthesized silver nanoparticles on the polyvinyl alcohol (PVA) nanocomposite films, Arab. J. Sci. Eng. 48 (9) (2023) 12043–12060, https://doi.org/10.1007/s13369-023-07643-w
[24] R. Khojasteh-Taheri, A. Ghasemi, Z. Meshkat, Z. Sabouri, M. Mohtashami, M. Darroudi, Green synthesis of silver nanoparticles using Salvadora persica and Caccinia macranthera extracts: Cytotoxicity analysis and antimicrobial activity against antibiotic-resistant bacteria, Appl. Biochem. Biotechnol. 195 (8) (2023) 5120–5135, https://doi.org/10.1007/s12010-023-04407-y
[25] A.K. Yontar, S. Avcioglu, S. Çevik, Nature-based nanocomposites for adsorption and visible light photocatalytic degradation of methylene blue dye, J. Clean. Prod. 380 (2022), 135070, https://doi.org/10.1016/j.jclepro.2022.135070
[26] J.I. Alonso-Esteban, M.J. Gonzalez-Fernandez, D. Fabrikov, M. de Cortes SanchezMata, E. Torija-Isasa, J.L. Guil-Guerrero, Fatty acids and minor functional compounds of hemp (Cannabis sativa L.) seeds and other Cannabaceae species, J. Food Compos. Anal. 115 (2023), 104962, https://doi.org/10.1016/j. jfca.2022.104962
[27] N. Brkljaca, S. Đurovi´ c, S. Milosevi´ c, U. Gasi´ c, D. Pankovi´ c, Z. Zekovi´ c, B. Pavli´ c, Sequential extraction approach for sustainable recovery of various hemp (Cannabis sativa L.) bioactive compounds, Sustain. Chem. Pharm. 35 (3) (2023), 101213, https://doi.org/10.1016/j.scp.2023.101213
[28] D. Motiejauskaite, S. Ullah, A. Kundrotaite, R. Zvirdauskiene, A. Baksinskaite, K. Barcauskaite, Isolation of biologically active compounds from Cannabis sativa L. Inflorescences by using different extraction solvents and evaluation of antimicrobial activity, Antioxidants (Basel) 12 (5) (2023), https://doi.org/ 10.3390/antiox12050998.
[29] R. Silva-Reis, A.M.S. Silva, P.A. Oliveira, S.M. Cardoso, Antitumor effects of cannabis sativa bioactive compounds on colorectal carcinogenesis, Biomolecules 13 (5) (2023), https://doi.org/10.3390/biom13050764
[30] M. Damej, S. Skal, J. Aslam, M. Zouarhi, H. Erramli, A.A. Alrashdi, H.-S. Lee, Y. El aoufir, H. Lgaz, An environmentally friendly formulation based on Cannabis sativa L. seed oil for corrosion inhibition of E24 steel in HCl medium: Experimental and theoretical study, Colloids and Surfaces A: Physicochemical and Engineering Aspects 643 (2022) 128745. 10.1016/j.colsurfa.2022.128745.
[31] E. Isidore, H. Karim, I. Ioannou, Extraction of phenolic compounds and terpenes from Cannabis sativa L. by-products: From conventional to intensified processes, Antioxidants (Basel) 10 (6) (2021) 942, https://doi.org/10.3390/antiox10060942
[32] S.K. Paswan, S. Kumari, M. Kar, A. Singh, H. Pathak, J.P. Borah, L. Kumar, Optimization of structure-property relationships in nickel ferrite nanoparticles annealed at different temperature, J. Phys. Chem. Solid 151 (2021), 109928, https://doi.org/10.1016/j.jpcs.2020.109928
[33] V. Vorobyova, G. Vasyliev, M. Skiba, Eco-friendly “green” synthesis of silver nanoparticles with the black currant pomace extract and its antibacterial, electrochemical, and antioxidant activity, Appl. Nanosci. 10 (12) (2020) 4523–4534, https://doi.org/10.1007/s13204-020-01369-z
[34] G.S. Vasyliev, V.I. Vorobyova, O.V. Linyucheva, L. Lvova, Evaluation of reducing ability and antioxidant activity of fruit pomace extracts by spectrophotometric and electrochemical methods, J. Anal. Methods Chem. 2020 (1) (2020) 1–16, https:// doi.org/10.1155/2020/8869436
[35] N.S. Alharbi, N.S. Alsubhi, A.I. Felimban, Green synthesis of silver nanoparticles using medicinal plants: Characterization and application, J. Radiat. Res. Appl. Sci. 15 (3) (2022) 109–124, https://doi.org/10.1016/j.jrras.2022.06.012
[36] A.K. Jha, N. Sit, Extraction of bioactive compounds from plant materials using combination of various novel methods: A review, Trends Food Sci. Technol. 119 (8) (2022) 579–591, https://doi.org/10.1016/j.tifs.2021.11.019
[37] N.M. Daud, N.R. Putra, R. Jamaludin, N.S. Md Norodin, N.S. Sarkawi, M.H.S. Hamzah, H. Mohd Nasir, D.N. Abang Zaidel, M.A. Che Yunus, L. Md Salleh, Valorisation of plant seed as natural bioactive compounds by various extraction methods: A review, Trends in Food Science & Technology 119 (4) (2022) 201–214. 10.1016/j.tifs.2021.12.010.
[38] S.C. Chuo, H.M. Nasir, S.H. Mohd-Setapar, S.F. Mohamed, A. Ahmad, W.A. Wani, M. Muddassir, A. Alarifi, A glimpse into the extraction methods of active compounds from plants, Crit. Rev. Anal. Chem. 52 (4) (2022) 667–696, https:// doi.org/10.1080/10408347.2020.1820851.
[39] F. Ameen, A.A. Al-Homaidan, A. Al-Sabri, A. Almansob, S. AlNAdhari, Antioxidant, anti-fungal and cytotoxic effects of silver nanoparticles synthesized using marine fungus Cladosporium halotolerans, Appl. Nanosci. 13 (1) (2023) 623–631, https://doi.org/10.1007/s13204-021-01874-9
[40] M.A. Awad, P. Virk, A.A. Hendi, K.M. Ortashi, N. AlMasoud, T.S. Alomar, Role of biosynthesized silver nanoparticles with Trigonella foenum-graecum seeds in wastewater treatment, Processes 11 (8) (2023) 2394, https://doi.org/10.3390/ pr11082394
[41] H.M. Azwatul, M.N.A. Uda, S.C.B. Gopinath, Z.A. Arsat, F. Abdullah, M.F.A. Muttalib, M.K.R. Hashim, U. Hashim, M. Isa, M.A. Uda, A. Radi Wan Yaakub, N.H. Ibrahim, N.A. Parmin, T. Adam, Plant-based green synthesis of silver nanoparticle via chemical bonding analysis, Materials Today: Proceedings 6 (2023) 5942. 10.1016/j.matpr.2023.01.005.
[42] E. Gonzalez-Aguinaga, P.E. Cardoso´ Avila, R. Patakfalvi, F. Pedro-Garcia, The morphology-dependent catalytic activity of anisotropic silver nanoparticles, Mater. Lett. 342 (10) (2023), 134334, https://doi.org/10.1016/j.matlet.2023.134334
[43] A. Said, M. Abu-Elghait, H.M. Atta, S.S. Salem, Antibacterial activity of green synthesized silver nanoparticles using Lawsonia inermis against common pathogens from urinary tract infection, Appl. Biochem. Biotechnol. (2023), https:// doi.org/10.1007/s12010-023-04482-1
[44] K.M. Zepon, C.d. Amaral Fetzner Pucci, A.W. Hansen, F.M. de Moraes, d.N. Jose Heriberto Oliveria, F.D.P. Morisso, R.F. Magnago, A.L. Ziulkoski, Using sugars as both reducing and cryoprotectants of freeze-dried silver nanoparticles for improving long-term stability, Industrial Crops and Products 197 (2023) 116519. 10.1016/j.indcrop.2023.116519.
[45] P. Chirumamilla, S.B. Dharavath, S. Taduri, Eco-friendly green synthesis of silver nanoparticles from leaf extract of Solanum khasianum: Optical properties and biological applications, Appl. Biochem. Biotechnol. 195 (1) (2023) 353–368, https://doi.org/10.1007/s12010-022-04156-4
[46] S. Kanimozhi, R. Durga, M. Sabithasree, A.V. Kumar, A. Sofiavizhimalar, A. A. Kadam, R. Rajagopal, R. Sathya, N.I.W. Azelee, Biogenic synthesis of silver nanoparticle using Cissus quadrangularis extract and its invitro study, J. King Saud Univ. - Sci. 34 (4) (2022), 101930, https://doi.org/10.1016/j.jksus.2022.101930
[47] A. Chakravarty, I. Ahmad, P. Singh, M. Ud Din Sheikh, G. Aalam, S. Sagadevan, S. Ikram, Green synthesis of silver nanoparticles using fruits extracts of Syzygium cumini and their bioactivity, Chemical Physics Letters 795 (2) (2022) 139493. 10.1016/j.cplett.2022.139493.
[48] T.K. Dua, S. Giri, G. Nandi, R. Sahu, T.K. Shaw, P. Paul, Green synthesis of silver nanoparticles using Eupatorium adenophorum leaf extract: Characterizations, antioxidant, antibacterial and photocatalytic activities, Chem. Zvesti 77 (6) (2023) 2947–2956, https://doi.org/10.1007/s11696-023-02676-9
[49] H.B. Herbin, M. Aravind, M. Amalanathan, M.S.M. Mary, M.M. Lenin, C. Parvathiraja, M.R. Siddiqui, S.M. Wabaidur, M.A. Islam, Synthesis of silver nanoparticles using Syzygium malaccense fruit extract and evaluation of their catalytic activity and antibacterial properties, J. Inorg. Organomet. Polym. 32 (3) (2022) 1103–1115, https://doi.org/10.1007/s10904-021-02210-y
[50] A. Sahin Yaglioglu, R. Erenler, E.N. Gecer, N. Genc, Biosynthesis of Silver Nanoparticles Using Astragalus flavesces Leaf: Identification, Antioxidant Activity, and Catalytic Degradation of Methylene Blue, J Inorg Organomet Polym 32 (10) (2022) 3700–3707. 10.1007/s10904-022-02362-5.
[51] A. Sharma, A. Sagar, J. Rana, R. Rani, Green synthesis of silver nanoparticles and its antibacterial activity using fungus Talaromyces purpureogenus isolated from Taxus baccata Linn, Micro Nano Syst. Lett. 10 (1) (2022) 70, https://doi.org/ 10.1186/s40486-022-00144-9
[52] M. Zubair, M. Azeem, R. Mumtaz, M. Younas, M. Adrees, E. Zubair, A. Khalid, F. Hafeez, M. Rizwan, S. Ali, Green synthesis and characterization of silver nanoparticles from Acacia nilotica and their anticancer, antidiabetic and antioxidant efficacy, Environ. Pollut. 304 (2022), 119249, https://doi.org/ 10.1016/j.envpol.2022.119249
[53] D. Li, L. Yu, L. Li, J. Liang, Z. Wu, X. Xu, X. Zhong, F. Gong, Melamine–urea–formaldehyde resin adhesive modified with recycling lignin: Preparation, structures and properties, Forests 14 (8) (2023) 1625, https://doi. org/10.3390/f14081625
[54] H. Wang, H. Wang, J. Liao, X. Zhou, G. Du, Technological properties of a branched polyethyleneimine derivative as a cross-linker for low molar ratio ureaformaldehyde resins, Polym. Test. 118 (2023), 107914, https://doi.org/10.1016/j. polymertesting.2022.107914
[55] Q. Yu, J. Bai, J. Huang, M. Demir, A.A. Farghaly, P. Aghamohammadi, X. Hu, L. Wang, One-pot synthesis of melamine formaldehyde resin-derived N-doped porous carbon for CO2 capture application, Molecules 28 (4) (2023), https://doi. org/10.3390/molecules28041772.
[56] N. Srikhao, A. Ounkaew, N. Srichiangsa, S. Phanthanawiboon, T. Boonmars, A. Artchayasawat, S. Theerakulpisut, M. Okhawilai, P. Kasemsiri, Greensynthesized silver nanoparticle coating on paper for antibacterial and antiviral applications, Polym. Bull. 80 (9) (2023) 9651–9668, https://doi.org/10.1007/ s00289-022-04530-6
[57] S.D. Senol, E. Ozugurlu, L. Arda, Synthesis, structure and optical properties of (Mn/ Cu) co-doped ZnO nanoparticles, J. Alloy. Compd. 822 (2) (2020), 153514, https://doi.org/10.1016/j.jallcom.2019.153514
[58] N. Srikhao, S. Theerakulpisut, P. Chindaprasirt, M. Okhawilai, R. Narain, P. Kasemsiri, Green synthesis of nano silver-embedded carboxymethyl starch waste/poly vinyl alcohol hydrogel with photothermal sterilization and pHresponsive behavior, Int. J. Biol. Macromol. 242 (2023), 125118, https://doi.org/ 10.1016/j.ijbiomac.2023.125118
[59] A. Serrano, O. Caballero-Calero, M.A. García, S. Lazi´ c, N. Carmona, G.R. Castro, M. Martín-Gonz´ alez, J.F. Fern´ andez, Cold sintering process of ZnO ceramics: Effect of the nanoparticle/microparticle ratio, J. Eur. Ceram. Soc. 40 (15) (2020) 5535–5542, https://doi.org/10.1016/j.jeurceramsoc.2020.05.059
[60] C. Jarensungnen, K. Jetsrisuparb, S. Phanthanawiboon, S. Theerakulpisut, S. Hiziroglu, J.T.N. Knijnenburg, M. Okhawilai, P. Kasemsiri, Development of ecofriendly antifungal and antibacterial adhesive derived from modified cassava starch waste/polyvinyl alcohol containing green synthesized nano-silver, Sci. Rep. 13 (1) (2023) 1, https://doi.org/10.1038/s41598-023-40305-3
[61] M.R. Islam, M. Rahman, S.F.U. Farhad, J. Podder, Structural, optical and photocatalysis properties of sol–gel deposited Al-doped ZnO thin films, Surf. Interfaces 16 (2019) 120–126, https://doi.org/10.1016/j.surfin.2019.05.007
[62] J. Zhao, Y. Ma, X. Wu, S. Wang, Z. Li, S. Zhao, Efficient capture of mercury ions by a novel organic melamine polymer, Mater. Today Commun. 35 (2023), 106230, https://doi.org/10.1016/j.mtcomm.2023.106230
[63] W. Si, Q. Xie, Y. Shen, Z. Wang, Melamine-formaldehyde resin derived carbon catalysts with abundant intrinsic defects to afford superior oxygen reduction activity, Catal. Lett. 32 (2023) 1907879, https://doi.org/10.1007/s10562-02304412-0
[64] A. Alahmad, W.A. Al-Zereini, T.J. Hijazin, O.Y. Al-Madanat, I. Alghoraibi, O. AlQaralleh, S. Al-Qaraleh, A. Feldhoff, J.-G. Walter, T. Scheper, Green synthesis of silver nanoparticles using Hypericum perforatum L. aqueous extract with the evaluation of its antibacterial activity against clinical and food pathogens, Pharmaceutics 14 (5) (2022), https://doi.org/10.3390/pharmaceutics14051104
[65] S. Singla, A. Jana, R. Thakur, C. Kumari, S. Goyal, J. Pradhan, Green synthesis of silver nanoparticles using Oxalis griffithii extract and assessing their antimicrobial activity, Open Nano 7 (2022), 100047, https://doi.org/10.1016/j. onano.2022.100047
[66] A. Wasilewska, U. Klekotka, M. Zambrzycka, G. Zambrowski, I. Swięcicka, B. Kalska-Szostko, Physico-chemical properties and antimicrobial activity of silver nanoparticles fabricated by green synthesis, Food Chem. 400 (2023), 133960, https://doi.org/10.1016/j.foodchem.2022.133960
[67] A.K. Alzubaidi, W.J. Al-Kaabi, A.A. Ali, S. Albukhaty, H. Al-Karagoly, G. M. Sulaiman, M. Asiri, Y. Khane, Green synthesis and characterization of silver nanoparticles using flaxseed extract and evaluation of their antibacterial and
antioxidant activities, Appl. Sci. 13 (4) (2023) 2182, https://doi.org/10.3390/ app13042182
[68] K. Wolny-Koładka, D. Malina, A. Suder, K. Pluta, Z. Wzorek, Bio-based synthesis of silver nanoparticles from waste agricultural biomass and its antimicrobial activity, Processes 10 (2) (2022) 389, https://doi.org/10.3390/pr10020389
[69] H. Zhang, Y. Lu, Q. Zhang, F. Yang, A. Hui, A. Wang, Structural evolution of palygorskite-rich clay as the nanocarriers of silver nanoparticles for efficient improving antibacterial activity, Colloids Surf. A Physicochem. Eng. Asp. 652 (2022), 129885, https://doi.org/10.1016/j.colsurfa.2022.129885
[70] D. Borah, N. Das, P. Sarmah, K. Ghosh, M. Chandel, J. Rout, P. Pandey, N.N. Ghosh, C.R. Bhattacharjee, A facile green synthesis route to silver nanoparticles using cyanobacterium Nostoc carneum and its photocatalytic, antibacterial and anticoagulative activity, Mater. Today Commun. 34 (8) (2023), 105110, https:// doi.org/10.1016/j.mtcomm.2022.105110.
[71] Q. Dong, D. Zu, L. Kong, S. Chen, J. Yao, J. Lin, L. Lu, B. Wu, B. Fang, Construction of antibacterial nano-silver embedded bioactive hydrogel to repair infectious skin defects, Biomater. Res. 26 (1) (2022) 36, https://doi.org/10.1186/s40824-02200281-7
[72] M.T. Yassin, A.-A.-F. Mostafa, A.A. Al-Askar, F.O. Al-Otibi, Synergistic antibacterial activity of green synthesized silver nanomaterials with colistin antibiotic against multidrug-resistant bacterial pathogens, Crystals 12 (8) (2022) 1057, https://doi. org/10.3390/cryst12081057
[73] R. Zein, I. Alghoraibi, C. Soukkarieh, M.T. Ismail, A. Alahmad, Influence of polyvinylpyrrolidone concentration on properties and anti-bacterial activity of green synthesized silver nanoparticles, Micromachines (Basel) 13 (5) (2022), https://doi.org/10.3390/mi13050777
[74] A. Zhou, Y. Zhang, X. Zhang, Y. Deng, D. Huang, C. Huang, Q. Qu, Quaternized chitin/tannic acid bilayers layer-by-layer deposited poly(lactic acid)/polyurethane nanofibrous mats decorated with photoresponsive complex and silver nanoparticles for antibacterial activity, Int. J. Biol. Macromol. 201 (2022) 448–457, https://doi.org/10.1016/j.ijbiomac.2022.01.065
[75] A.K. Yontar, S. Çevik, Electrospray deposited plant-based polymer nanocomposite coatings with enhanced antibacterial activity for Ti-6Al-4V implants, Prog. Org. Coat. 186 (Suppl. 1) (2024), 107965, https://doi.org/10.1016/j. porgcoat.2023.107965
[76] M. Barb˘ alat˘ a-Mandru, D. Serbezeanu, M. Butnaru, C.M. Rîmbu, A.A. Enache, M. Aflori, Poly(vinyl alcohol)/Plant Extracts Films: Preparation, Surface Characterization and Antibacterial Studies against Gram Positive and Gram Negative Bacteria, Materials (Basel) 15 (7) (2022). 10.3390/ma15072493.
[77] S. Chouhan, S. Guleria, Green synthesis of AgNPs using Cannabis sativa leaf extract: Characterization, antibacterial, anti-yeast and α-amylase inhibitory activity, Mater. Sci. Energy Technol. 3 (3) (2020) 536–544, https://doi.org/ 10.1016/j.mset.2020.05.004
[78] L. Schofs, M.D. Sparo, S.F. Sanchez Bruni, The antimicrobial effect behind Cannabis sativa, Pharmacol. Res. Perspect. 9 (2) (2021) e00761
[79] M.E. Vozza Berardo, J.R. Mendieta, M.D. Villamonte, S.L. Colman, D. Nercessian, Antifungal and antibacterial activities of Cannabis sativa L. resins, J. Ethnopharmacol. 318 (Pt A) (2024) 116839. 10.1016/j.jep.2023.116839.
PAPERmaking!
FROM THE PUBLISHERS OF PAPER TECHNOLOGY
Volume10, Number2,2024
Barrier, converting, and tray-forming properties of paperboard packaging materials coated with waterborne dispersions
ANDREA MARINELLI1 , JOHANNA LYYTIKÄINEN2 , PANU TANNINEN2 , BARBARA DEL CURTO1 & VILLE LEMINEN2
In this work, different food-contact experimental and commercial aqueous polymeric dispersions were applied to paperboard via rod coating technology to achieve <5% non-cellulosic content. Barrier (water, moisture and grease), mechanical (tensile and bending) and converting (heat-sealing and creasing) properties were analysed before tray formation trials on pilot-scale equipment. Dispersion-coated samples were compared against polyethylene terephthalate (PET) extrusion-coated paperboard, the principal industrial material used for food trays. Results show that, within the investigated properties, waterborne dispersions can achieve similar barrier properties compared with PET, yet at lower dry coat grammage (12 g/m2 vs. 40 g/m2 of PET-coated paperboard). Additionally, the investigated coatings heat-sealed at temperatures as low as 80–90°C, almost 100°C less than PET; however, lower seal forces could be achieved (15–20 N/(25 mm) vs. 23 N/(25 mm) of PET-coated paperboard). Paperboard delamination occurred at the highest seal forces. Dispersion-coated trays were obtained at 4.5–5.0% blank moisture content. Formed trays at industrial processing parameters showed critical coating damage during converting due to tensile stresses. This work shows that milder processing conditions allow a reduction in coat defects.
Contact Details:
1 Department of Chemistry, Materials and Chemical Engineering “Giulio Natta”, Politecnico di Milano, Milan, Italy
2 Lappeenranta-Lahti University of Technology LUT, Lappeenranta, Finland
Packag Technol Sci. 2024;37:149–165. https://onlinelibrary.wiley.com/doi/full/10.1002/pts.2784
This work is licensed under the Creative Commons Attribution License
The Paper Industry Technical Association (PITA) is an independent organisation which operates for the general benefit of its members – both individual and corporate – dedicated to promoting and improving the technical and scientific knowledge of those working in the UK pulp and paper industry. Formed in 1960, it serves the Industry, both manufacturers and suppliers, by providing a forum for members to meet and network; it organises visits, conferences and training seminars that cover all aspects of papermaking science. It also publishes the prestigious journal Paper Technology International® and the PITA Annual Review, both sent free to members, and a range of other technical publications which include conference proceedings and the acclaimed Essential Guide to Aqueous Coating.

Barrier,converting,andtray-formingpropertiesofpaperboard packagingmaterialscoatedwithwaterbornedispersions
AndreaMarinelli 1 |JohannaLyytikäinen 2 |PanuTanninen 2 |
BarbaraDelCurto 1 |VilleLeminen 2
1DepartmentofChemistry,Materialsand ChemicalEngineering “GiulioNatta” , PolitecnicodiMilano,Milan,Italy
2Lappeenranta-LahtiUniversityofTechnology LUT,Lappeenranta,Finland
Correspondence
AndreaMarinelli,PolitecnicodiMilano,Piazza LeonardodaVinci32,Milan20131,Italy. Email: andrea.marinelli@polimi.it
Abstract
Inthiswork,differentfood-contactexperimentalandcommercialaqueouspolymeric dispersionswereappliedtopaperboardviarodcoatingtechnologytoachieve<5% non-cellulosiccontent.Barrier(water,moistureandgrease),mechanical(tensileand bending)andconverting(heat-sealingandcreasing)propertieswereanalysedbefore trayformationtrialsonpilot-scaleequipment.Dispersion-coatedsampleswerecomparedagainstpolyethyleneterephthalate(PET)extrusion-coatedpaperboard,the principalindustrialmaterialusedforfoodtrays.Resultsshowthat,withintheinvestigatedproperties,waterbornedispersionscanachievesimilarbarrierpropertiescomparedwithPET,yetatlowerdrycoatgrammage(12g/m2 vs.40g/m2 ofPET-coated paperboard).Additionally,theinvestigatedcoatingsheat-sealedattemperaturesas lowas80–90 C,almost100 ClessthanPET;however,lowersealforcescouldbe achieved(15–20N/(25mm)vs.23N/(25mm)ofPET-coatedpaperboard).Paperboarddelaminationoccurredatthehighestsealforces.Dispersion-coatedtrayswere obtainedat4.5–5.0%blankmoisturecontent.Formedtraysatindustrialprocessing parametersshowedcriticalcoatingdamageduringconvertingduetotensilestresses. Thisworkshowsthatmilderprocessingconditionsallowareductionincoatdefects.
KEYWORDS
aqueousdispersions,barrierproperties,coating,converting,foodpackaging,mechanical properties,paperboardtrays
1 | INTRODUCTION
Dispersioncoating(DC)isaninterestingtechnologythat,despite beingknownforsomedecades,hasonlyrecentlygainedincreased interestfromtheindustry.Mostofthecommercializedcoated fibre-basedpackagingisextrusion-coatedorlaminated.Onlyafew productsarecurrentlydispersion-coated1.OneadvantageoftheDC technologyisthatitcanachievealowerfinaldrycoatgrammage comparedwithextrusioncoatingandlamination,reducingthenoncellulosiccontentofthepackaging.Thismightleadtohigherfibre
recyclingyields2,3.Indeed,previousstudies4–6 reportedhowDCscan berecycled,showinglowerrejectfractions.However,itwasonly recentlythattestingmethodologieswerestandardizedordeveloped foraEuropeanharmonization7,8;besides,suchrecyclingmethodologiesareconstantlyadaptingtoaddressissueslinkedtothenewpackagingsoldonthemarket.Bypotentiallyavoidingslotscreeningduring recycling,thincoatingandfillerfragmentsmightreachthesecondary rawmaterial(i.e.,recycledmaterial)oraddupinthewatercircuitsat thepapermill9.Relatedtomicroplastics,thispotentialissueis currentlyunderdiscussion,possiblyhinderingtheapplicationof
Thisisanopenaccessarticleunderthetermsofthe CreativeCommonsAttribution-NonCommercial License,whichpermitsuse,distributionandreproductioninany medium,providedtheoriginalworkisproperlycitedandisnotusedforcommercialpurposes. ©2023TheAuthors. PackagingTechnologyandScience publishedbyJohnWiley&SonsLtd.
numerouscoatingsthatarebrittle,fragmentintinyparticlesduring repulping,anddetachfromfibres.
Previousstudiesfocusedonfillers10–12 insidecoatingformulationsanddifferentlatexpolymericnature,generallybasedonstyrenebutadieneandstyreneacrylateslatexes10–14.Recentresearchfocused onbiobasedpolymers15–19;still,inmanycases,theyfeaturelower barrierpropertiesasagainstsyntheticcounterparts,highercost,and arechallengingtoscaleupintheirproductionprocessforanindustrial technologytransfer20,21
Nowadays,therearemanycommerciallyavailableaqueousdispersiongrades,someofwhichwerealreadyappliedandtestedon papersubstrates22.Mostgradesarebasedonsyntheticlatexes becauseofhigherindustrialavailabilityandeasierproductionprocesses,thoughacademicandindustryeffortstoshifttobio-based counterpartsmustbeacknowledged15,16,23
Besidesacompletebarrierpropertiescharacterization,theprocessingoffibre-basedsubstratesmightaffectcoatingintegrity,hence thefinalpackagingperformance24–27.Therefore,theevaluationof processingeffectsonthebarrierproperties,andtheactualprocessabilityofsuchcoatingsisofextremeinterest.
Creasingisamethodthatcreatesagrooveintheprocessedmaterial.Itaimstolocallydecreasebendingstiffnesstogeneratepreferential foldinglines28(p916).Differentmethodswerereportedtoobtaincreases, bothintheflatbeddie-cuttingprocess29,30 – commonlyusedinlargescaleproduction – andwithcreasingwheelsmountedonsample makers30–32 tostudy,forexample,bothcreasingpatternsandcrease orientation.Additionally,previousstudiesdiscussedtheeffectofcrease ruleandgroovewidthontheprocessedmaterial'sthickness29,32
Heat-sealing,incontrast,isaimedatbondingtwosurfacesthanks totheactionoftemperature,pressureandtime.Previousliterature focusedonbothflexible33,34 andrigid35 packaging.Differentsealbar geometriescanbeused,especiallyforflexiblepackaging,whereasrigid packagingcommonlyadoptsaflatbar.Asuccessfulheatsealis requiredtoensurespill-proofpackagingaswellassufficientadhesion toensureunintentionalpackageopening.Aqueousdispersionsprovide inferiorheat-sealstrengthcomparedwithlaminatedcounterparts36
Multipleconvertingpropertiesmightbeinvolvedinasingleforming processlikepaperboard3Dforming(referredtoasdrawing)toachieve afinalpackagingstructure,forexample,trays.Formerstudiesexplored severalparametersaffectingoutputquality,includingpackaginggeometry,substratemoisturecontent,blankholdingforce,creasingdepthand creasingwidth31,35,37–39.Insummary,multipleprocessparametersmust befinelytunedtoguaranteethatboththesubstrateandthecoating layerdonotcrack;thiswouldallowforamaterial-coatingconfiguration thatmightcompeteunderbotheconomicandenvironmentalperspectivesagainstpolymericpackagingcounterparts,aswellasagainstfibrebasedsolutionswithhighernon-cellulosiccontent.
Inthiswork,theauthorsexploredtheproductionandcharacterizationofbothexperimentalmineral-filledandcommercialaqueousdispersionsonpaperboard.Theauthorsaimedforabroadcharacterization, goingfrombarrierpropertiestoconvertingpropertiesandtrayforming tobecomparedwithpolyethyleneterephthalate(PET)-coatedpaperboard,currentlytheleadingindustrialmaterial.Thisstudyinvolveddry
dispersioncoatgrammagesrepresentinglessthan5%ofthetotal packagingweight,thatis,maximumnon-cellulosiccontentthatmight constituteaninsignificantpartofthepackagingunit,hencepossibly consideredasmonomaterialbyEUmembercountries40.Therefore,the aimistoassessifandinwhichcasestheuseoflightweightDCs(<5% w/wnon-cellulosiccontent)mightsubstitutePET-coatedsubstrates.
2 | MATERIALSANDMETHODS
2.1 | Materials
2.1.1|Substrate
StoraEnso(Helsinki,Finland)Trayforma350g/m2 paperboard (UC)(averagemeasuredgrammagewas348.5g/m2)wasusedasthe basissubstrate.UCisathree-layer457±4 μmthickbleachedsulphatepulppaperboard,featuringchemithermomechanicalpulpinthe middlelayer.AllthelayersareAlkylKeteneDimer(AKD)sized.Sizing improvesthehydrophobicbehaviourofthesubstrate.
Moreover,StoraEnso(Helsinki,Finland)TrayformaPET40 extrusion-coatedsubstrate(grammage:350 + 40g/m2,UC + PET, respectively)(PET)wastestedasreferencecommercialmaterial, representingthecommonestmaterialusedatanindustrialscaleto produce,forexample,paperboardtrays.Thepaperboardsubstrateof TrayformaPET40isUC.
2.1.2|Experimentalaqueousdispersions formulation
Twoexperimentalformulationswereproducedatalabscaleinvolving HPH39highlycrosslinkedcarboxylatedstyrene-butadienelatex (Tg ffi 0 C,drysolidcontent54%)asbinder – whichwaskindlyprovidedbyTrinseo(Horgen,Switzerland) – andCamCoat80kaolin (63%oftheparticles<2 μminsize)fromAmbergerKaolinwerke (Hirschau,Germany)asfiller:
• H39K80,containing80:20latex:pigmentratio – dryweightratio;
• H39K60,containing60:40latex:pigmentratio – dryweightratio.
Coatingpreparationfollowedtheproceduredescribedinprevious publications22,24.PCCExolSA(BrzegDolny,Poland)kindlyprovided ExolatC40sodiumpolyacrylate,usedasadispersant(0.16%dry weightondrypigmentweight).NaOH1MwasusedtoadjustthepH levelto8.Atfirst,awater-basedkaolinslurrywasproducedbyadding kaolinpowder,dispersantandNaOHinsidedeionizedwater.The slurrywascontinuouslystirredwithaturbine-typestirrerat1200rpm foratleast1h.Thefinalsolidcontentoftheslurrywas63%.Following,thekaolinslurrywasmixedwithHPH39latex(theamountswere accordingtothedefineddryweightratio)andstirredat500rpmfor 30minwiththeturbinetypestirrer,adjustingthepHto8withNaOH. Experimentalformulationshad50%solidcontent.
TABLE1 Propertiesofthedispersion coatingsinvolvedinthisstudy.
CoatingSolidcontent[%]Tg [ C]pHFordcup#4viscosity[s] H39K80500a 812 H39K60500a 811
SA-B4631.78>60 SAP-H5112.1718 aTg ofHPH39(neatlatexusedinthecoatingformulation).
Beforeanyuse,experimentalformulationswerestirredwitha magneticanchorforatleast1htoensureproperhomogeneity.H39K 80andH39K60wereappliedwet-on-wettopreparedouble-layer coatedsamples.
2.1.3|Commercialaqueousdispersions
Inthiswork,twocommercialaqueousdispersionswereinvestigated. Suchdispersionswerealreadypartofpreviousresearchforsinglelayercoatedpaperpackaging22,24.Adoptingapreviousnomenclature, thespecificgradesstudiedinthiscontextwere:
• SA-B:styreneacrylateDCdevelopedtoprovidebarrierperformance. Solidcontentis46%(onaweightbasis),whereasTg is31.7 C.
• SAP-H:heat-sealablestyreneacrylate-basedDCwith6%pigment byweight.Solidcontentis51%(onaweightbasis),whereasTg is 12.1 C.
Consideringawet-on-wetdouble-layercoatinginvestigation, threedistinctconfigurationswereproducedandtested:SA-B,SAP-H andSAP-HoverSA-Btomakethecoatedsubstratesheat-sealable.
Table 1 reportsthepropertiesofbothexperimentaland commercialDCs.
2.2 | Methods
2.2.1|Samplepreparationandpreliminary characterization
ThetopsideofUCwasdoublecoatedalongthemachinedirection (MD)usinga20 μm(wetfilmthickness)wiredrawdowncoater mountedonanErichsen(Hemer,Germany)Coatmaster510automatedcoater.Themachinewasequippedwithavacuumsuctionplate toimproveUCflatnessonthecoatingplane.Thecoatingspeedwas 50mm/s,andnoadditionalmassweighedonthecoatingrod.The secondcoatlayerwasappliedwet-on-wetoverthefirstone,thatis, withoutoven-dryingthefirstlayer.DryingoccurredinaVWR (Leuven,Belgium)Venti-line180Primeovenat120 Cfor90s.
Unlesselsewherespecified,coatedsampleswereconditionedat 23±1 Cand50±2%relativehumidityforatleast24hbeforeany furthercharacterizationandtests.Theaveragedrycoatgrammage wasdeterminedasthedifferencebetweenthegrammageofthe
coatedsamplesandthemeasuredoneofUC.Thepinholetestwas assessedaccordingtotheproceduredefinedinBSEN13676:200141 witha25cm2 testingapparatus.Fivereplicatesweretestedforeach coatingmaterial.Additionally,BendtsenroughnessaccordingtoDIN 53108,andairpermeabilityweremeasuredusingaLorentzen& Wettre(Kista,Sweden)SE114BendtsenPaperRoughnessandAir PermeabilityTester 10measurementsforeachcoating,aswellas forUC.Thepressurewas1.47kPaforbothroughnessandairpermeabilitytests;thelatterwasmeasuredoveranareaof10cm2
ABiolinScientificABAttensionThetaOpticalTensiometer (Göteborg,Sweden)wasusedtomeasurethesessiledropcontact angleofbothcoatedanduncoatedsubstrates.Atotalofsevenmeasurementswereaveragedforeachsample.Thedeionizedwaterdropletvolumewas3 μl.Thecontactanglewasmeasured1safterthe applicationofthedrop.
2.2.2|Mechanicalproperties
Atotalof20samples(measuring140by15mm) – 10alongsideMD, andthesamenumberalongsideCD – weretensiletestedaccordingto BSISO1924-3:200542 usingaLorentzen&Wettre(Kista,Sweden) SE064Tensiletester.Thetestinglengthwas100mm,whereasthe crossheadsspeedwas100mm/min.
Atotalof20samples(100by38mm) – 10alongsidemachine directionandthesameamountalongsidecrossdirection(CD) – were bendingtestedusingaLorentzen&Wettre(Kista,Sweden)SE 160BendingTester.Thebendingresistance(0–15 )andtwo-point bendingstiffness(0–5 )weremeasuredaccordingtoBSISO 2493-1:201043 andISO5628:201944,respectively.Forbothtests, thebendinglengthwas50mm.
Beforetheirtesting,bothgrammage(seeSection 2.2.1)andthicknessweredeterminedforbothtensileandbendingtests;the thicknesswasobtainedusingaMessmerBüchel(TheNetherlands) 49–56Micrometer,averaging20measurements.
2.2.3|Barrierproperties
Conditionedsamplesweretestedforwaterabsorptiveness(Cobb test),WaterVapourTransmissionRate(WVTR)andOilandGrease Resistance(OGR).
Cobb1800(i.e.,30min)testwasperformedaccordingtothe methodologydefinedinBSENISO535:201445 onfivesamplesover
anareaof25cm2.Waterabsorptivenessisdefinedastheweight increaseofthesampleduetowateruptakeduringthetest,dividedby thetestingarea.Theresultisthenconvertedtog/m2.Lowerwater absorptivenessvaluesindicatehigherwaterbarrierproperties.
WVTR,instead,followedtheevaluationproceduredefinedinBS ISO2528:201746 usingcupsfilledwith35.0±0.1gofsilicagel.Three samplesforeachcoatingmaterialweretested;thetestingareawas 20cm2.WVTRisdefinedastheamountofwatervapourabsorbedby silicagelatasteadystate.Itwascalculatedastheslopeofmassincrease intime,dividedbythetestingarea.Theresultisreporteding/(m2 day). LowerWVTRvaluesshowhigherwatervapourbarrierperformance.
OGRfollowedasimilarmethodologytotheonedefinedinBS ISO16532-1:200847.Evaluationtimesandsetupwerethesame(50g weightswithadiameterof30mm),butthetestingtemperaturewas 60 C.Thisallowedharshertestingconditionsforthesubstrates,simulatingcontactwithhotgreasyfood.Giventhetemperature,dyedpalm kerneloilwasliquid,andtheamountappliedtothesampleswas 0.1ml.Atotaloffivesamplesforeachcoatingweretestedandthe resultswereaveraged.TheoutcomeswerereportedasdefinedinBS ISO16532-1:200847
2.2.4|Creasing
Eachaqueousdispersionconfigurationunderwentcreasingwitha three-ruletooldevelopedatLUTandalreadypresentedinasingleruleversioninpreviouswork48.ThetoolwasmountedonaShimadzu (Kyoto,Japan)AutographAGS-Xmachine.Itfeaturesthreeequally spaced2pt.(0.706mm)rulesthatdifferinlengthandwhosecorners arerounded totallengthisalmost43mm,excludingrounding.On thebottom,theauthorsuseda0.5mmdeepand1.4mmwidecreasingmatrix,leadingtoacreasingfactor μ of1.5(seeTanninenetal.32 fortheequationtocalculate μ).
Thecreasingpre-loadwassetto10N.Thespeedwasconstantat 5mm/minforthepre-testandactualcreasing.Theauthorsassessed theeffectoftwodifferentcreasingstrokes(0.5mmand0.6mm, respectively)forbothMDandCDfibreorientationofeverydoublecoatedlayerconfiguration,leadingtoacreasedepthofaround90–120 μm.
AKeyence(Osaka,Japan)VR-3200wide-area3Dmeasurement systemdeterminedtherealcreasedepth.Foreachsample,11multilineprofileswereequallyspaced(0.5mmdistant)andaveragedfor eachcreaseline.
Next,possiblecoatingdamagewasevaluatedthroughanOGR test,asdescribedinSection 2.2.3.Fivesamplesweretestedforeach creasingconditionandeachcoatingconfiguration.ORGtestingoffive uncreasedsamplesprovidedreferenceresistancetime.
2.2.5|Heatsealing
AnRDMTestEquipment(Hertfordshire,England)HSB-1heatsealer wasusedtoseal25by130mmcoatedstripswithfacingcoatedsides.

Theequipmentmountedflat25mmwidetools;thetopone – moved bytwopneumaticcylinders – washeated,whereasthebottomone,a flexibletool,waskeptatroomtemperature.
A23 full-factorialdesignofexperiments(DoE)includingacentral pointwasdesignedadoptingasvariablestemperature,dwelltimeand pressure.AschematicrepresentationofsuchDoEisreportedin Figure 1.Thenumberofreplicateswasfive.ThereadershouldconsiderthatthepressureinFigure 1 representsthecylinderpressure thatallowsasample-specificpressureof2,2.5and3MPa, respectively.
Heat-sealedsamplesweresubsequentlyT-peel tested – unsupportedpeeltesting,accordingtoASTMF88/F88M2149 – usingaShimadzu(Kyoto,Japan)AutographAGS-Xmachine withpneumaticclamps.Thepre-testspeedwas50mm/minuntil reaching0.2N.Afterwards,thespeedwas300mm/minuntiltheend ofthetest.T-peeltestcurveswereanalysedtodeterminepeakforce, averageforceinthesealarea,andpeelenergyinthesealarea.Linear Paretochartsprovidedheat-sealingrelevancefortheanalysedprocessingparameters.Sincelowdrycoatgrammagesmightnegatively affecttheheat-sealabilityofroughsubstrates,theauthorsalsoconsideredthedrycoatgrammageofthesinglespecimensasafactorto beincludedinParetocharts.Indeed,theaimwastoassessifsmall changesinthecoatgrammagecouldaffecttheheat-sealing performance.
2.2.6|Trayforming
TrayformingbehaviourwasassessedforH39K80,H39K60,andSAB + SAP-Hcoatedpaperboard.Forcomparison,thePET-coated paperboardwasalsoinvestigatedtoensurethattheprocessingconditionscorrespondedtoindustrialproductionones.Trayblankswere producedusingcommercialdie-cuttingequipmentwith1/9foodstuff container – nomenclatureaccordingtoBSEN631–1:199350 – die andmatrix.Matrixgroovewidthanddepthwere1.4mmand0.5mm, respectively;creasingruleswere2pt.wide(0.706mm)and23mm high,likeforthecreasingtestsdefinedinSection 2.2.4.Thecrease patternfeaturedcreasesthatwereradialtowardtherotationaxisof thetraycorner,asdiscussedinpreviousresearch32.Theblankswere
FIGURE1 Heatsealinginvestigationmatrix.
TABLE2 Trayformingparameters.

Temperature[ C]100120
Pressingspeed[mm/s]4590
Subsequently,coatdefectsduetopress-formationwerequalitatively evaluatedusingE131-dyedwaterandethanol.
die-cutwiththelongersidealignedtotheMachineDirection(MD)to providehighertraystiffness(Figure 2).
Berrytrays(142mm 94mm 50mm)werepress-formed fromconditionedtrayblanks,withmaindimensionsof 211.3mm 167.3mm,varyingblankmoisturecontent(MC),blank holdingforce(BHF),temperature,andpressingspeed dwelltime wasconstantto0.6s.PETblankswereformedmaintainingtheMC withinthe8–9%range.Themoisturecontentwasassessedbytesting 5gofmaterialwithanAdamEquipment(MiltonKeynes,UK)PMB 53MoistureAnalyzer.ParametersrangedasreportedinTable 2 and theireffectwasassessedfollowingthepreviouslymentioned sequence.Suchspecificorderwasbecauseofpreliminarytests,which showedastickingbehaviourofbothH39K80andH39K60.Dynamic frictiontestsatdifferentMC(i.e.,2.4%,7.4%and11.0%,duetodifferentconditioningenvironments)wereperformedonthreesamples foreachcoating,tobetestedalongMD.Dynamicfrictionequipment consistedofa0.2kgsledstucktoasample-coatedsidefacinga smoothstainlesssteelslidingplane.

FIGURE3 Averagedrycoatgrammageforeachcoating investigatedinthiswork.
2.2.7|Statisticalanalysis
GraphrepresentationwasperformedwithMSExcel(allerrorbars representstandarddeviation),whereasstatisticalanalysisoftheheat sealingexperiments(seeSection 2.2.5)wascarriedoutusingMinitab 21.3.1.LinearParetochartswereproducedtoevaluatetherelevance
FIGURE2 Trayblankaftercreasing.
TABLE3 Averagenumberofpinholesmeasuredforeachcoating grade,bothcommercialandexperimental.

FIGURE4 Bendtsenroughnessofthecoatedsideofdifferent aqueousdispersion-coatedpaperboard.UncoatedandPET-coated paperboardareincluded,too.
oftemperature,time,pressureanddrycoatgrammageprocessing parametersforheat-sealing.
3 | RESULTS
3.1 | Samplepreparationandpreliminary characterization
Coatedpaperboardwassuccessfullyobtained.AveragedrycoatgrammagesforeachmaterialunderinvestigationarereportedinFigure 3 Differentlyfromwhatwasexpected,drycoatgrammageforadouble 20 μmwetthicknesscoatingachievedanaverageof12g/m2.This mightbeattributedtopaperboardsurfacesizing,repellingtosome extentthewaterbornedispersionspreadwiththerodcoater.
Generally,coatedsubstratesshowedfewornopinholes,as reportedinTable 3.H39K80pinholeswereexplainedby

FIGURE5 Dispersion-coated,uncoated,andPET-coated paperboardmeasuredcontactangle.
microbubblesincorporatedintheaqueousdispersionduringmixing sincebothexperimentalformulationsfeaturenodefoamers.
BendtsenroughnessisreportedinFigure 4.UCandPET-coated samplesachievedthehighestresults,whereasaqueousdispersions reached,onaverage,200ml/minroughness,meaningmorethan55% reduction.Itmustbeobservedhow,ingeneral,H39K60showed higherBendtsenroughnesscomparedwithH39K80,whichwas attributedtoincreasedkaolincontent,whichiscoarsercompared withlatexparticlesthatfilm-form22,51
Regardingairpermeability,UCshowed4.23±0.23 μm/(Pa s)air permeability,whereasalltheDCsandPETachievedresultsthatwere almostnull(≤0.002±0.001 μm/(Pa s)).
Contactangle(Figure 5)clearlyshowshowexperimental kaolin-containingstyrene-butadienecoatingsfeaturehighlyhydrophilicsurface52,withoutstatisticallysignificantdifferenceduetodifferentkaolinamounts.Onthecontrary,uncoatedpaperboard achievedthehighestvalue(127 ),highlightingthehydrophobicnature duetosizingagents.Interestingly,theSA-B + SAP-HcoatedpaperboardfeaturedacontactanglethatwasclosetotheSA-Bone;this suggeststhatthewet-on-wetcoatingallowsthetwocoatinglayer particlestointerdiffusebeforedrying.
3.2 | Mechanicalproperties
TensileandbendingtestresultsarereportedinFigure 6 andFigure 7, respectively.Theresultsdiffereddependingonsubstratefibrealignment,thatis,MDorCD.MDalignmentprovided,aspredictable, highertensilestrength,averagemaximumforce,aswellasbending resistanceandstiffnessduetoparallelfibrealignmentintensiletests andorthogonalalignmenttothebendingaxis uptothreefoldvalues comparedwithCD.

FIGURE6 TensiletestresultsforbothUC,PET,anddispersion-coatedpaperboard:a)tensilestrength;b)strainatbreak;c)averagemaximum force;d)tensileenergyabsorption.
Nosignificantdifferencecouldbeobservedintheinvestigated parametersbecauseofdifferentDCbecauseofeithercloseaverage valueorstandarddeviation–asitisforbendingstiffness(Figure 7.b). Suchresultsarecoherentwithpreviousfindings53,54.Therationaleis inthelowdrycoatgrammagecomparedwiththesubstrateone,with theformeraccountingforlessthan5%ofthetotalgrammage.The previousstatementmightbesupportedbytheresultsforPET-coated substrate,generallyshowingbettermechanicalperformancetoboth MDandCD.Indeed,thePETgrammagefractionisslightlymorethan 10%ofthetotalgrammage.
3.3 | Barrierproperties
Cobb1800testresultsarereportedinFigure 8.Experimentalformulationprovidedminimalbarriercomparedwithothercoatings.Indeed,
evenSAP-H,acommercialheat-sealablegrade,showedawater absorptionthatwas50%lowercomparedwithH39K80.Onthe otherhand,SA-BachievedsimilarresultscomparedwithPET-coated paperboard,aswellasSA-B + SAP-Hcoatingconfiguration.
Coherentlytopreviousstudies22,55–57,thepresenceofkaolinin theformulationprovedtobeoflowbenefitforimprovedwaterbarrierpropertiesbecauseofitshydrophilicnature58.Inparticular,higher kaolincontentgenerallyledtoincreasedwaterabsorption.However, intermsofmagnitude,suchresultsdifferfrompreviousresults22,24 withthesamecoatingsbutdifferentsubstrate,especiallyforexperimentalcoatings,wherehigherdrycoatgrammageledtoevenworse relativeperformance.
WVTR(Figure 9),onceagain,showedhowSA-BprovidedperformancessimilartoPET(bothlessthan20g/(m2 day),whereasexperimentalformulationsachievedresultsaround40g/(m2 day),with H39K60showingslightlylowerWVTR,similarlytowhatdescribed

FIGURE7 BendingtestresultsforUC,PET,anddispersion-coatedpaperboard:a)bendingresistance;b)bendingstiffness.

FIGURE8 Waterabsorptiveness(Cobb1800test)resultsofthe investigatedcoatings.
elsewhere22.Waterbornedispersionsshowedbarrierproperties improvementrangingfrom80–95%.Still,coatweightshouldbeconsideredwhendiscussingresults,sinceaqueousdispersionsinvolvedin thisstudyledtolessthanhalfcoatgrammagethanitwasforPET. BothSA-Bandexperimentalcoatingsachievedperformancesimilarto previousstudieswithsimilardrycoatgrammage12,55,59
Greasebarrierresistance,expressedasminutestospotdyed greaseontheuncoatedsideofthesamples,isreportedinTable 4.UC samplesshowednoOGR.Theoilpenetratesthroughthematerialina coupleofsecondsafteritsapplicationonthesurface.Asageneral statement,thedifferentdispersionsprovidedwidelyvariablyperformance.Indeed,SA-B,whichwasthebest-performingmaterialfor bothwaterabsorptionandmoisturebarrier(Figure 8 andFigure 9,
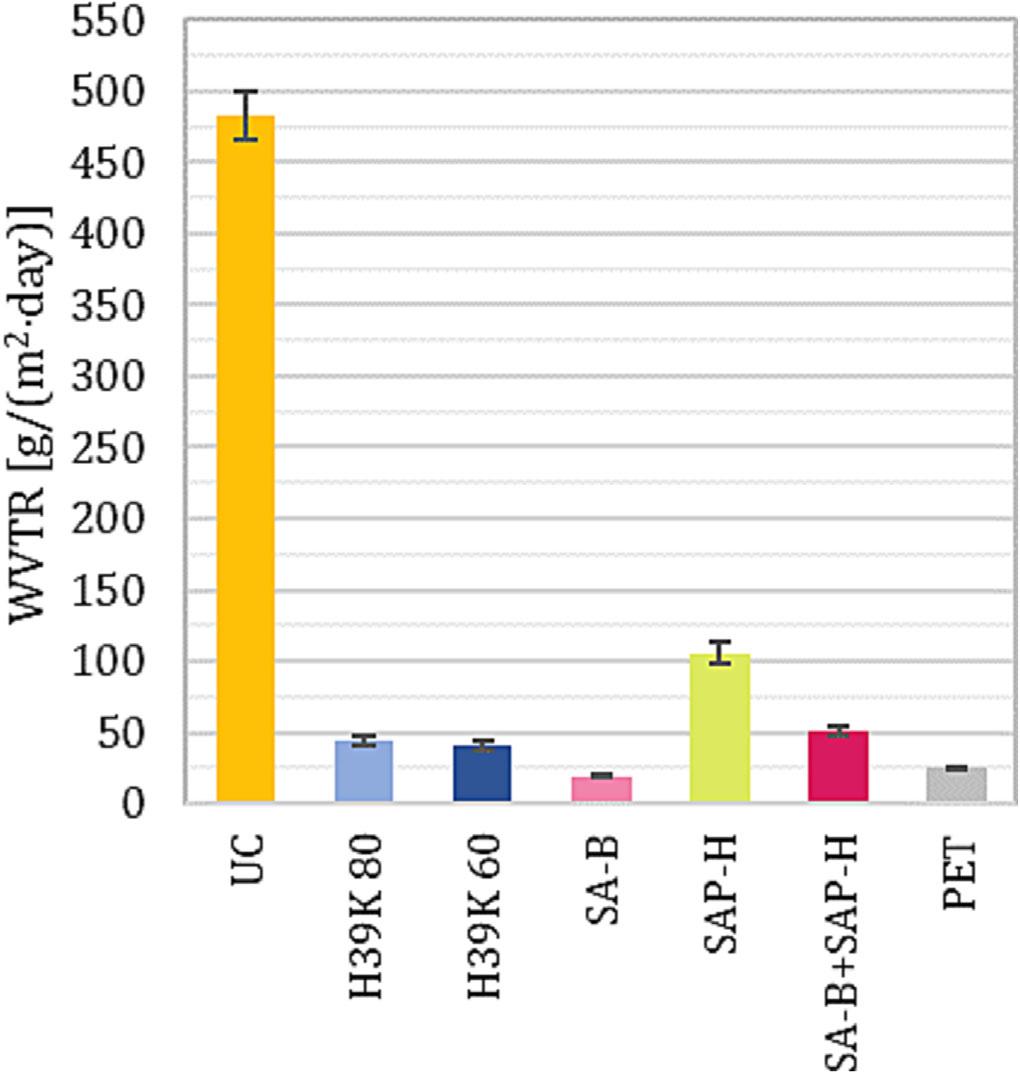
FIGURE9 Moisturepermeability(WVTR)resultsofthe investigatedcoatings.
respectively)showedtheworstresistance,onlyupto4h.Onthe contrary,bothexperimentalformulationsandSA-B + SAP-Hconfigurationwereabletoresistupto24hat60 C.Nonetheless,thebest result,thatis,similartoPET,wasachievedwithSAP-H,whichwas abletoresistformorethan24h.
Despitesimilarresultsachievedonpapersubstrates22,24,thetestingconditionsinvolvedinthisresearchwereharsherbecauseof higherpenetrationratescausedbyhighertesttemperature(i.e.,60 C insteadof23 C).
Overall,DCsachievedpropertiesthatweresometimessimilarto PET,butatareduceddrycoatgrammage.Thismeansthat,froma barrierpointofview,dispersion-coatedsubstratesmightrepresent moresustainablesolutionssincetheydecreasethenon-cellulosic content.
3.4 | Creasing
ResultsforcreasedsamplesarereportedinTable 5,whichalsospecifiesfailuremode.PETprovidedthebestperformance,alongsideSAPH;still,H39K80andH39K60showedinterestingresults,resisting
TABLE4 Greasepermeabilityoftheinvestigatedcoatings.Unless specified,theresultsunitisminutes. Uncreased
UCTestresult0
Min-Max[min]All<1 PETTestresult>24h
Min-Max[min]All>1440
H39K80Testresult6<X<24h
Min-Max[min]All ≤1440
H39K60Testresult6<X<24h
Min-Max[min]All ≤1440
SA-BTestresult240
Min-Max[min]240–270
SAP-HTestresult>24h
Min-Max[min]All>1440
SA-B + SAP-HTestresult6<X<24h
Min-Max[min]All ≤1440
between6and24h.PETsamplewastheonlymaterialthatdidnot showdyecolourleftoversonthecoatside,highlightingthat – atleast tosomeextent – thecoatingabsorbsdyedgrease.Suchresultsare coherentwithsimilarpreviousliterature29
Generally,samplesfailedbecauseofgeneralpermeationthrough thecoatings(Figure 10.c),suggestingonceagainthepossiblepresenceofporesthatwerefilledbydyedgrease.However,pores'dimensionmightbesmall,sincecolourwashomogeneousandcoatporosity wasnotobservedathighmagnificationscanningelectron microscope22
Nevertheless,asageneralstatement,sampleswerenotaffected bystrokeorfibreorientationapartfromSA-B + SAP-H,whichfailed becauseofseveralcreasedefectsasofFigure 10.aandFigure 10.b. Suchbehaviourunderlinesamulti-DCscoatthatismorebrittlecomparedwithaqueousdispersionsusedontheirown.Singleaqueous dispersionsbehavedsimilarlytoextrusion-coatedandlaminated materialsratherthancracking60 atthestudiedcreasedepths. Therefore,creasestrokeshouldbefurtherreducedforSA-B + SAP-H,limitingcreasing-induceddefects.However,strokereductionmeans – likeincreasingcreaserulewidth – shallowercreases, whicharedetrimentalforleakproofseals31,35.Additionally,given themeasureddata,itseemsthatcreasetip-relateddefectsaremore likelytobewitnessesasagainsttheonesalongthecreaseline.The reasonliesincreaseruletips,whichgenerallyundergoafilingprocess thatmightleavesomedentsthatcandamagethincoatlayers moreeasily.
3.5 | Heat-sealing
Peeltestresultsofheat-sealedsamplesareshowninFigure 11.H39K 60andSA-B + SAP-Hcoatedsubstratesbehavedfollowingthesame trend,whereasH39K80didnotvaryasmuchastheothersdid.This
TABLE5 Greasepermeabilityoftheinvestigatedcoatingsaftercreasing.Differentstrokesandfibreorientationwereconsidered. Additionally,failuremodesarereported.Unlessspecified,theresultsunitisminutes.
Stroke0.50.50.60.6
OrientationMDCDMDCDFailuremode
PETTestresult>24h>24h>24h>24hn.a.
Min-Max[min]All>1440All>1440All>1440All>1440
H39K80Testresult6<X<24h6<X<24h6<X<24h6<X<24hPermeationthroughcoating
Min-Max[min]All1440All1440All1440All1440
H39K60Testresult6<X<24h6<X<24h6<X<24h6<X<24hPermeationthroughcoating(rarecreasetip damage)
Min-Max[min]150–1440330–1440All1440150–1440
SA-BTestresult180180150180Permeationthroughcoating
Min-Max[min]All180180–21070–210130–180
SAP-HTestresult>24h>24h>24h>24hn.a. (rarecreasetipdamage)
Min-Max[min]All>1440All>14401440–>1440 1440–>1440
SA-B + SAPH Testresult6<X<24h6<X<24h360360Creasetipdamage(+somealongcrease)
Min-Max[min]180–144024–144030–144026–1440

FIGURE10 Picturesofthebackside ofthesamplesthatshowobservedfailure modes:a)coatdefectalongthecrease line;b)coatdefectbecauseofthecrease tip;andc)nocoatdefectbecauseof creasing,butgreasepermeationthrough thecoating.
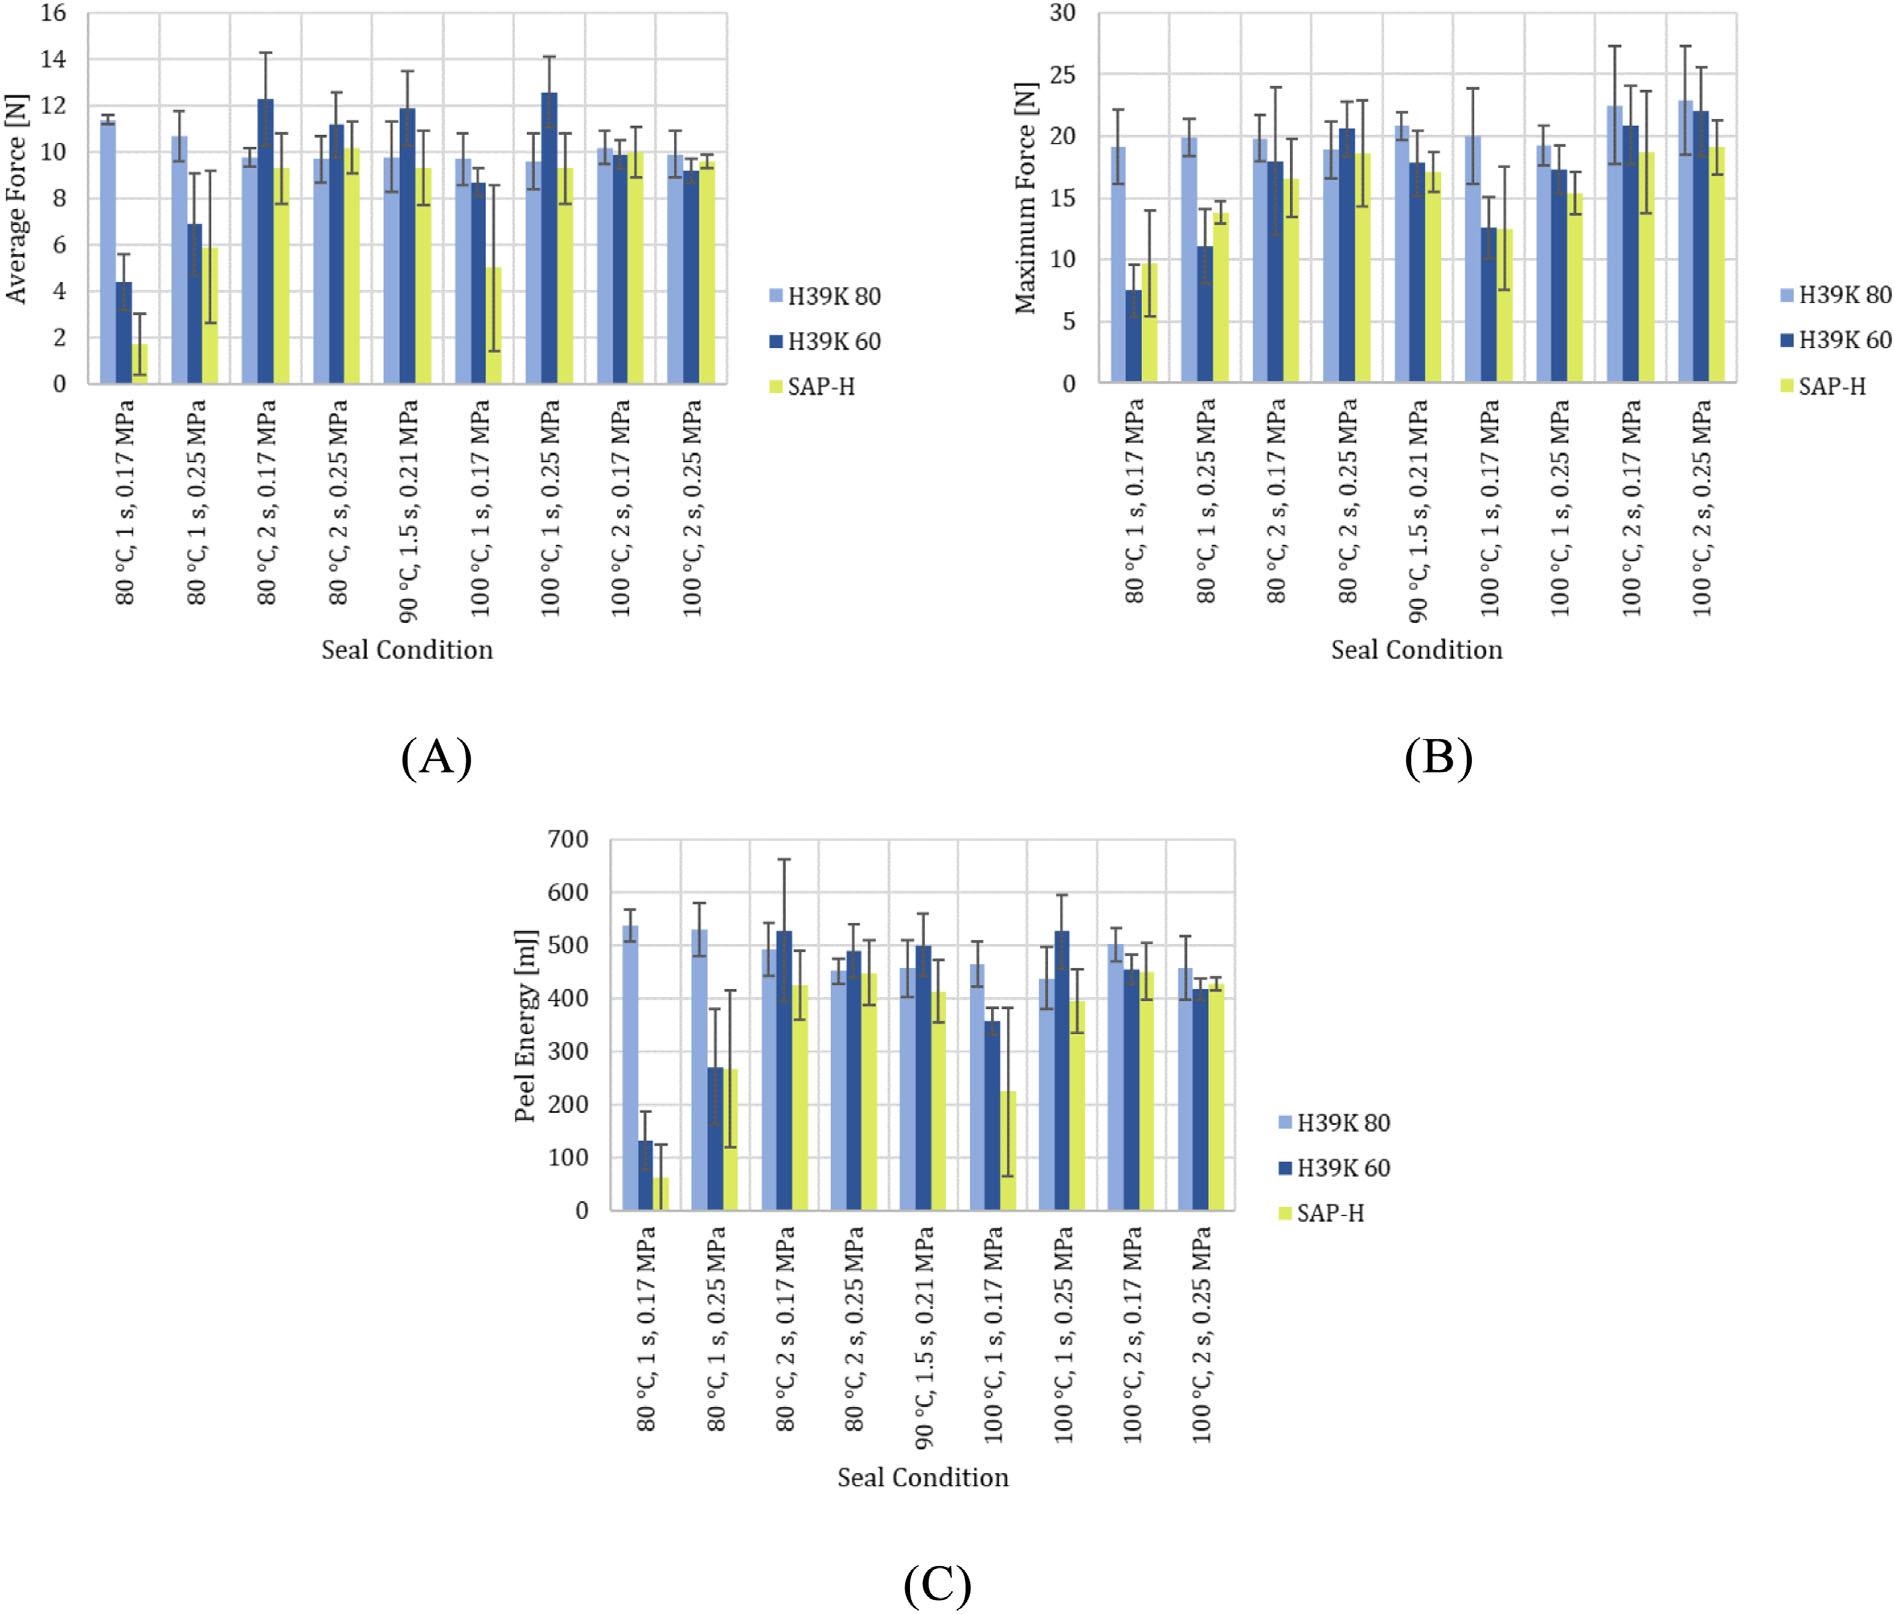
Peeltestresultsforeachheat-sealsetoftemperature,dwelltimeandpressure:a)averageforce;b)maximumforce;c)seal energy.
mightbeexplainedbylowerkaolincontentthatcannotshieldnative latexstickiness,aspreviouslyreported24
Similartopreviousworks24,33,twomainfailuremodeswere retrieved:aseparationalongthecoat-coatinterface,andacrackformationinthesealantfollowedbypaperboarddelamination(i.e.,fibre tear).Indicatively,thelattermodeoccurredataverageforces ≥10N
and,equivalently,topeelenergiesinthesealedarea ≥450mJand maximumforces ≥18N.Consequently,itcouldbestatedhowthe rangesinvestigatedinthisworkwerenotcorrecttospotoutachange inH39K80behaviour,hencetoohighsetoftemperature,timeand pressure.Additionally,peelenergyvaluesshouldnotbeconsidered meaningfulwhenassociatedwithpaperboarddelamination.The
FIGURE11

FIGURE12 LinearParetochartsofthestandardizedeffectsofheat-sealparameters,plusdrycoatgrammage:a)H39K80;b)H39K60;c) SAP-H.Factorswithascorehigherthanthereferencevalue(2.021,reddashedline)arestatisticallyevidentfactors.
FIGURE13 Maximumheat-seal forceregisteredforsamplessealedat differenttemperatures(dwelltime:1.5s; equipmentpressure:0.21MPa).

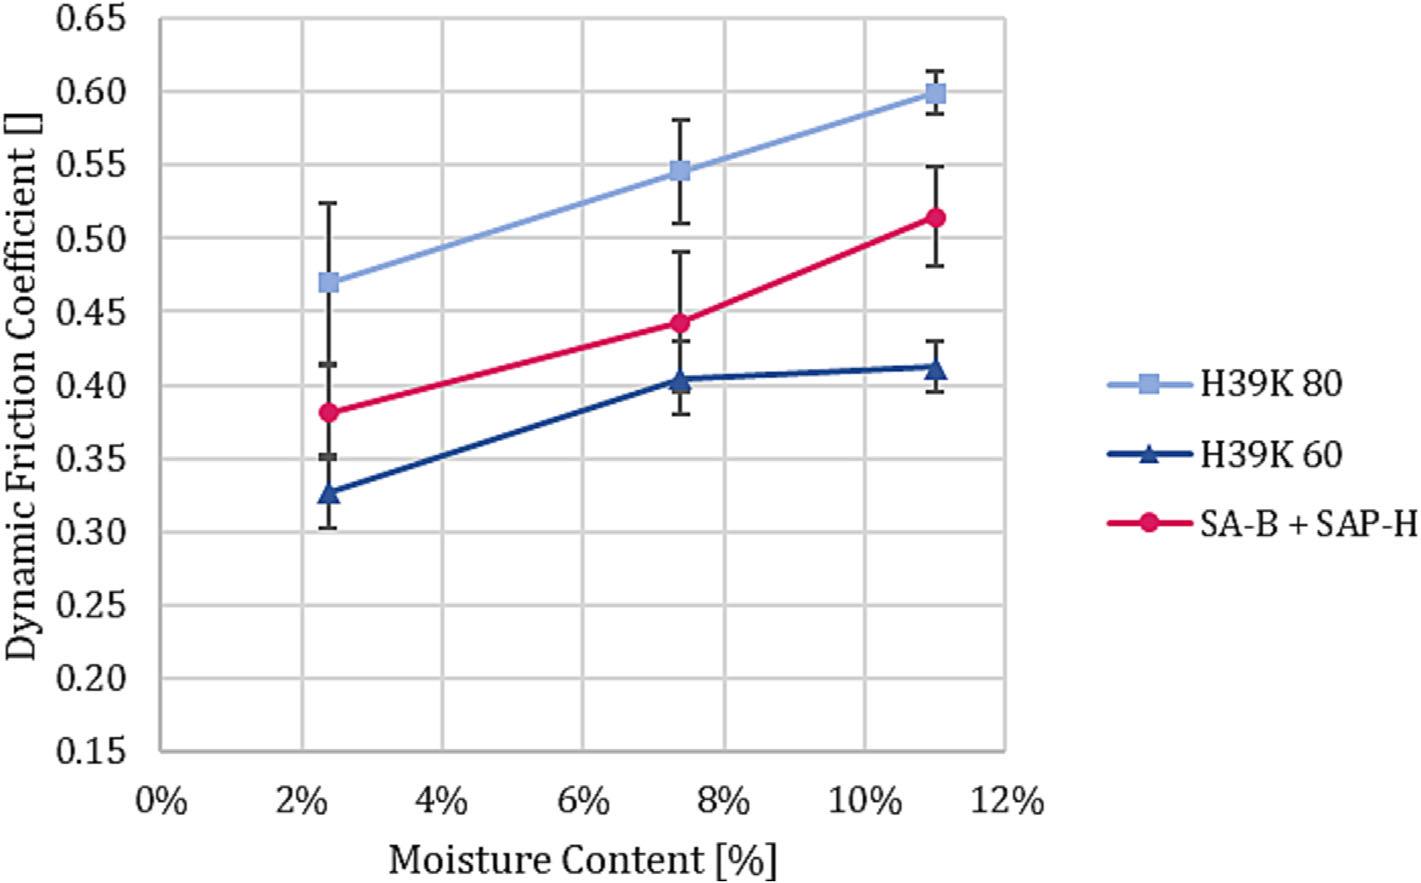
reasonliesintheenergycontribution,whichisnotduetocoatto-coatinterfaceseparation;instead,theexternalenergyprovidedby thesystemismainlyassociatedwithfibreseparation.
LinearParetochartsforbothprocessingparametersanddrycoat grammage(Figure 12)highlightdifferentstatisticallysignificant parametersforeachmaterial,giventhesameDoE.ForH39K80,it seemstobeamatterofdrycoatgrammage.However,takingacloser lookattheresultsforsuchcoating(Figure 11),thechangeinsealing parametersappearednegligibleinthemeasuredoutcomes.Indeed, almosteverysampleshowedpaperboarddelamination(fibretearing) duringthepeeltest,underliningacoat-to-coatinterfacebondingthat isstrongerthantheoneofbulkpaperboard,regardlessoftemperature,timeandpressureappliedduringheat-sealing34.
H39K60andSAP-H,instead,undoubtedlyshowtheimportance oftime,plustemperature,notwithstandingthelowermagnitudeof thelatter.Coherentlywithpreviouswork24 anddespitehighersubstrategrammage(i.e.,thickness),similartimerange,andhigherspecific pressures(0.4to0.6MPaversus2to3MPaofthecurrentwork), timewasthemostcrucialparametertoobtainheat-sealedsamples. Theeffectoftimewasdiscussedinpreviouswork33 tobecrucialat lowertemperaturesbecauseofthermalinsulationpropertiesofcellulosicsubstrates.AsofFigure 11,dataiscoherentwithsuchargument foralltheinvestigatedpropertiesat80 Cand100 Ccomparingsamplessealedat1sand2s,withasharperdifferenceatlowersealing pressures.Withagoodapproximation,alsopressurewasasignificant parameteraccordingtoParetocharts.
Theauthorscomparedtheheat-sealabilityofdispersion-coated paperboardwiththeoneofPET-coatedpaperboard.AsofFigure 13, maximumsealforceclearlyshowshowaqueousdispersionsarecapableofsealingattemperaturesthatarearound100 ClowerthanPET ones.Thisrepresentsacrucialadvantage,leadingtolowerenergy consumption,henceloweringproductioncosts.Additionally,amajor differenceinpeelingbehaviouristhatDCsgenerallyfailbypaperboarddelamination,whereasPETseparatesatthecoat-coat
FIGURE14 Dynamicfrictionresults forH39K80,H39K60,andSA-B + SAP-Hatdifferentmoisturecontents.

FIGURE15 Blankbreakageduringtrayforming.Highermoisture contentincreasesfriction,leadingtoblankadhesiontothemale mould.
interface despitesomePET-paperboardinterfacebondingbeing damagedathighertemperatures.HighermaximumforcesforPETcoatedpaperboardcouldbeexplainedbythehighercoat grammage – aswellasthetoughnatureofthematerial – thatprovidedhigherTensileEnergyAbsorption(Figure 6),thatis,itwasable towithstandpeelingwithoutbreakingnortransferringthestressto paperboardfibreswhich,inturn,resiststoalowerextentcompared withcoat–coatbondatthesealinginterface(asobservedfordispersioncoatedsubstrates).Recentresearch36 showedhowdispersion-
coatedpapercouldwithstandmaximumforcesthatwerealmost50% lessthanPE-coatedsimilarsubstrates.Inthiswork,theauthorsexperiencedsimilarbehaviour,thoughthesealstrengthgapwasconsiderablyless,rangingfrom 10%to 20%.Althoughsealstrengthata givensetofsealingparametersismainlydrivenbythepolymeric nature,aswellaspossiblepigmentamountandfibretearresistance,it shouldbeconsideredthatcoatgrammagemightplayaroleinsuch lowerstrength,assuggestedbyFigure 12.c.
3.6 | Trayforming
Differentmaterialsshoweddifferentdynamicfrictioncoefficients,as reportedinFigure 14.Itisclearhowmoistureplaysacrucialrolein determiningthefrictioncoefficient,withincreasingMCleadingto increasedfriction.FrictionincreasedlinearlywithMC(forH39K 80andSA-B + SAP-H,R2 ≥ 0.98)intheinvestigatedmoisturecontentrange.Suchbehaviourmightfindasimilarexplanationasinpreviousresearch33,sincewaterincreasespaperboardthermalconduction, hencehelpingcoatingsoftening.Additionally,previousworksdiscussedthehydroplasticizingeffectofmoistureonpolymericcoating
carboxylgroups,leadingtoreducedTg61,62.H39K80andH39K 60gapwasexplainedbyhigherkaolincontent,whichreducedthe equivalentlatex(hence,fewercarboxylgroups)facingthesliding plane,thuslimitingfriction.Thelowerfrictioncoefficientachievedby thepresenceofpigmentisalsocoherentwithpreviousfindings63,64 Additionally,thefrictioncoefficientwasalignedwithBendtsenroughnessvalues(Figure 4);indeed,H39K60featuresaroughersurface, hencefewercontactpointstosticktothesmoothsteelsurface.
Despitefriction,coatedpaperboardtraysweresuccessfully achieved.TheprocessingwindowintermsofMCfortheexperimental formulationswaslimitedto 4.5–5.0%,whereasSA-B + SAP-Hcould beformedevenat5.6% femalemould:100 C;BHF:0.780kN; pressingspeed:90mm/s;dwelltime:0.6s.Eachcoatingmaterial couldnotformatalowerMC(i.e.,4.0%).SuchresultsdifferfromtypicalpaperboardformingMC,whichpreviousresearchreportedtobe around8.0–9.0%38,65,66.Indeed,bothtrialsatMCof4.0%andpreliminarytrayformingathighermoisturecontent(>6.0%)showedhighly adhesivebehaviouronthemalemould,whichledtomaterialbreakage,asdocumentedinFigure 15.Therefore,allthefollowingprocessingwascarriedoutatablankMCof 4.5–5.0%forallthecoatings involved.

FIGURE16 DyedwaterandethanoldefectsinthecornersforH39K80,H39K60,andSA-B + SAP-Hcoatedpaperboardtrays:a)H39K 80,water;b)H39K60,water;c)SA-B + SAP-H,water;d)H39K80,ethanol;e)H39K60,ethanol;f)SA-B + SAP-H,ethanol.Alltrayswere producedat100 C,0.780kNBHF,90mm/s,0.6sdwelltime.

BHFisassociatedwithfriction,too.IncreasingBHFleadsto increasednormalforcesappliedontheblank,hencefriction.However,BHFisalsoproportionaltothesmoothnessoftheflange whichis,inturn,crucialfortraysthatneedtobeheat-sealed35.H39K 60andSA-B + SAP-HcouldbeprocessedataBHFof1.014kN, whereasH39K80failed,badlystickingtothemould.Onceagain, higherpigmentcontentseemedtohelplimitfrictioncoefficientand stickiness.
Theeffectofprocessingtemperaturecorrelatestothethermal propertiesofthecoatings.Highermouldtemperatureleadsto increasedchainmobility,which,inturn,helpstheheat-sealingofthe creasesandadhesiontoothersubstratesingeneral.SA-B + SAP-H trayswereformedwithoutanyissueswhenmouldtemperature increasedfrom100 Cto120 CatbothBHFof0.780kNand1.014 kN.Similarly,H39K80andH39K60couldbeformedat120 Cata BHFof0.780kN.Unfortunately,despitekaolincontent,aBHFof 1.014kNledtomouldstickingforH39K60at120 C.Additionally, bothH39K80andH39K60weretray-formedataBHFof0.546kN tohavefurtherdatatoassessformingspeed.
Fromamaterialperspective,formingspeedisprimarilyassociated withdeformationrateandlatexsoftening(becauseofanextended contacttimewiththeheatedmould).Theformer,givenotherfactors tobeconstant,influencesthebrittleorplasticbehaviourofthecoating,withhigherspeedsthatcanbeassociatedwithmorefragile behaviourduetolesstimeforthepolymericchainstoflowwithout breaking.At45mm/sformingspeed(120 C,BHFof0.780kNand 1.014kNforSA-B + SAP-H,and0.546kNand0.780kNforH39K 80andH39K60),allthematerialscouldbetrayformedwithoutstickingoccurrence.Lowerspeedseemedtohaveanegligibleeffecton theadhesionandblockingeffectoftheinvestigatedcoated paperboard.
Despitesuccessfultrayformingatthegivenparameters'range, dyedwaterandethanolgenerallyhighlightedquitedamagedcoatings (Figure 16).Themaindamagedareaswerethecornersandtheflange. Specifically,theflangeshoweddefectsintheareaexposedtotensile stresses(convexcoatedside),leavingfewerdamagestotheconcave coatedside.Moreover,despitelowerstickingbehaviour,H39K 60wasmoredamagedcomparedwithH39K80.Thereasonlies withinlowerlatexcontinuityinhighlypigmentedformulationsthat leadtoearlybreakage,similartofilledpolymermatrixcomposites67.
FIGURE17 Effectofformingspeedoncoatdefects forSA-B + SAP-Hformedtrays(dyedethanol):a) 45mm/s;b)90mm/s.Otherformingparameterswere 120 C,1.014kNBHF,and0.6sdwelltime.
Onthecontrary,thePETsampletraysshowednodefectsorsticking behaviourwithintheinvestigatedparameterrange,highlightinghow theprocessingarrangementcorrespondedtotheonesadoptedfor industrialproduction.Nonetheless,itmustbenotedthatthePET coatingwasmuchthickercomparedwithdispersion-coatedcounterparts,allowingpossiblehighertensileresistance.
NomarkeddifferencewasobservedbecauseofBHFandtemperatureparametereffectsfortheinvestigatedranges.Nevertheless, lowerpressingspeedshowedsignificantlyfewerdefects,highlighting howhigherspeedhelpeddamagethethinDCs(Figure 17).Additionally,takingacloserlookatthedefects,stainedareasclearlyshow transversalcrackstothecreaselines,suggestingdamagescausedby axialdeformation.
4 | CONCLUSIONS
Thisworkprovidedencouragingresultsfrommultiplepointsofview tosustainanarrowyetpossiblematerialsubstitutiontoreducenoncellulosiccontentinpaperboard-basedpackaging.
SA-Baqueousdispersionprovidedwaterandmoisturebarrier propertiesthatweresimilartoPET,whereasSAP-Hforgreasebarrier. Experimentaldispersions,onthecontrary,featuredintermediate values,apartfromwaterbarrierproperties.Nevertheless,theresults weresatisfyingbecauseofthelowerdrycoatgrammageinvolvedfor dispersionsasagainstPET.
Theinvestigatedcreasingdepthrangedidnotaffectthecoating integrityofbothexperimentalformulations(i.e.,H39K80andH39K 60)andSAP-H,generallyleavinggreasepermeationvaluesintact. SomedamageswereobservedwithSA-BandSA-B + SAP-H, highlightingamorefragilebehaviouratroomtemperature.
Aqueousdispersion-coatedpaperboardcouldbeheatsealedat temperaturesthatwereupto100 ClowercomparedwithconventionalPET-coatedpaperboard,representingabetterchoicetoreduce powerconsumption.Suchbehaviourappearedtobeproportionalto theTg ofeachpolymericfraction.Despitelowersealstrength,such materialsmaybeusedinapplicationswhereatemperature-sensitive contentisinvolved.Unfortunately,thepeelmechanismforstrongly sealedsampleswaspaperboarddelamination,suggestingearlycoating breakage,whereasPETseparatesattheheat-sealedinterface.
Paperboarddispersion-coatedtrayscouldbemanufactured;however,moisturecontentwasreducedto4.5–5.0%topreventblanks fromstickingtotheequipment.Althoughthisisanatypicalprocedure topreparethematerialsforprocessing,itstronglyaffectedcoating blockingbehaviour.Still,trayformingspeeddamagedcoatintegrity. Lowerformationspeedandhighertemperatureprovedtoqualitativelyreducecoatcracking,thoughfine-tuningisrequiredtoachieve aflawlessconvertedcoatedpaperboardtray.Overall,dispersioncoatedsubstratesshowedgoodmachinability.
Thepresentstudyprovidedfurtherinsightsintotherelationship betweencoatingpropertiesandtheirinfluenceonprocessparameters,posinganadditionalbasisforfutureresearch.
ACKNOWLEDGEMENTS
Theauthorswouldliketothankthecompaniesforsupplyingmaterials aswellasAnttiPesonenforassistinginthelaboratoryexperiments.
DATAAVAILABILITYSTATEMENT
Thedatathatsupportthefindingsofthisstudyareavailablefromthe correspondingauthoruponreasonablerequest.
ORCID
AndreaMarinelli https://orcid.org/0000-0002-2646-8686
JohannaLyytikäinen https://orcid.org/0000-0002-2241-762X
PanuTanninen https://orcid.org/0000-0001-6570-5253
BarbaraDelCurto https://orcid.org/0000-0002-0125-0226
VilleLeminen https://orcid.org/0000-0001-5854-3321
REFERENCES
1.MarinelliA,SossiniL,SantiR,DelCurtoB. ImballaggioCellulosicoCon ProprietàBarriera:StatoDell'arteeInnovazioneDeiMateriali.1st ed.EdizioniDativoSrl;2022. https://www.comieco.org/downloads/ 16177/9158/STAMPATO-Imballaggio cellulosicoconproprietabarriera.pdf
2.BakkerS,KloosJ,MetselaarGA,CatarinaA,EstevesC, SchenningAPHJ.Aboutgasbarrierperformanceandrecyclabilityof waterbornecoatingsonpaperboard. Coatings.2022;12(12):1841.doi: 10.3390/COATINGS12121841
3.ChiK,HeJ,LinW-S,BokhariSMQ,CatchmarkJM.Electrostatically complexednaturalpolysaccharidesasaqueousbarriercoatingsfor sustainableandrecyclablefiber-basedpackaging. ACSApplMater Interfaces .2023;15(9):12248-12260.doi:10.1021/acsami.2c17886
4.AnderssonC.Newwaystoenhancethefunctionalityofpaperboard bysurfacetreatment-areview. PackagTechnolSci.2008;21(6):339373.doi:10.1002/PTS.823
5.LeeTJ,YoonC,RyuJY.Anewpotentialpaperresource;recyclability ofpapercupscoatedwithwater-solublepolyacrylate-basedpolymer. NordPulpPapResJ.2017;32(1):155-161.doi:10.3183/npprj-201732-01-p155-161
6.OvaskaS-S,Sami-SeppoK,LyytikäinenJ,HirnU,BackfolkK.DeterminationofRepulpabilityofTalc-FilledBiopolymerDispersionCoatingsandOptimizationofRepulpedRejectforImprovedMaterial EfficiencybyTailoringCoatings.In: TappiPaperCon2017proceedings; 2017:36-48.doi:10.2/JQUERY.MIN.JS
7.UNI. UNI11743:2019. http://store.uni.com/catalogo/uni-117432019?josso_back_to=http://store.uni.com/josso-security-check. php&josso_cmd=login_optional&josso_partnerapp_host=store.uni. com.AccessedJuly2,2019.
8.Cepi. HarmonisedEuropeanlaboratorytestmethodtogenerateparametersenablingtheassessmentoftherecyclabilityofpaperandboardproductsinstandardpaperandboardrecyclingmills.;2022. https://www. cepi.org/cepi-recyclability-test-method-version-2/
9.ZhangH,BussiniD,HortalM,ElegirG,MendesJ,JordáBM.PLA coatedpapercontainingactiveinorganicnanoparticles:material characterizationandfateofnanoparticlesinthepaperrecyclingprocess. WasteManag.2016;52:339-345.doi:10.1016/j.wasman.2016. 03.045
10.Martinez-HermosillaGA,MesicBB,BronlundJE.Relativepermeabilityofbarrierdispersioncoatingsappliedonpaper-basedmaterials; mathematicalmodelingandexperimentalvalidation. JCoatingsTechnolRes.2022;19(2):543-558.doi:10.1007/S11998-021-00552-3/ FIGURES/13
11.MesicBB,CairnsM,JärnstromL,JooLeGuenM,ParrR.Filmformationandbarrierperformanceoflatexbasedcoating:impactofdrying temperatureinaflexographicprocess. ProgOrgCoat.2019;129:4351.doi:10.1016/J.PORGCOAT.2018.12.025
12.SchumanT,KarlssonA,LarssonJ,WikströmM,RigdahlM.Characteristicsofpigment-filledpolymercoatingsonpaperboard. ProgOrg Coat.2005;54(4):360-371.doi:10.1016/J.PORGCOAT.2005.06.017
13.KimpimäkiT,SavolainenAV.Barrierdispersioncoatingofpaperand board.In:BranderJ,ThronI,eds. Surfaceapplicationofpaper chemicals.Springer;1997:208-228.doi:10.1007/978-94-009-14575_12
14.MarinelliA,DiamantiMV,LucottiA,PedeferriMP,DelCurtoB.Evaluationofcoatingstoimprovethedurabilityandwater-barrierpropertiesofcorrugatedcardboard. Coatings.2022;12(1):10.doi:10.3390/ COATINGS12010010
15.ColtelliMB,WildF,BugnicourtE,etal.Stateoftheartinthedevelopmentandpropertiesofprotein-basedfilmsandcoatingsandtheir applicabilitytocellulosebasedproducts:anextensivereview. Coatings.2015;6(1):1.doi:10.3390/COATINGS6010001
16.RastogiVK,SamynP.Bio-basedcoatingsforpaperapplications. Coatings.2015;5:887-930.doi:10.3390/coatings5040887
17.KathuriaA,ZhangS.SustainableandRepulpablebarriercoatingsfor fiber-basedmaterialsforfoodpackaging:areview. FrontMater.2022; 9:9.doi:10.3389/fmats.2022.929501
18.TyagiP,SalemKS,HubbeMA,PalL.Advancesinbarriercoatingsand filmtechnologiesforachievingsustainablepackagingoffood products – areview. TrendsFoodSciTechnol.2021;115:461-485.doi: 10.1016/j.tifs.2021.06.036
19.WangJ,EuringM,OstendorfK,ZhangK.Biobasedmaterialsforfood packaging. JBioresourBioprod.2022;7(1):1-13.doi:10.1016/j.jobab. 2021.11.004
20.WuF,MisraM,MohantyAK.Challengesandnewopportunitieson barrierperformanceofbiodegradablepolymersforsustainable packaging. ProgPolymSci.2021;117:101395.doi:10.1016/J. PROGPOLYMSCI.2021.101395
21.Nilsen-NygaardJ,FernándezEN,RadusinT,etal.Currentstatusof biobasedandbiodegradablefoodpackagingmaterials:impactonfood qualityandeffectofinnovativeprocessingtechnologies. ComprRev FoodSciFoodSaf.2021;20(2):1333-1380.doi:10.1111/1541-4337. 12715
22.MarinelliA,DiamantiMV,PedeferriMP,DelCurtoB.Kaolin-filled styrene-butadiene-baseddispersioncoatingsforpaper-basedpackaging:effectonwater,moisture,andgreasebarrierproperties. Coatings 2023;13(1):195.doi:10.3390/COATINGS13010195
23.CazonP,VelazquezG,RamírezJA,VázquezM.Polysaccharide-based filmsandcoatingsforfoodpackaging:areview. FoodHydrocoll.2017; 68:136-148.doi:10.1016/J.FOODHYD.2016.09.009
24.MarinelliA,ProfaizerM,DiamantiMV,PedeferriM,DelCurtoB. Heat-sealabilityandfoldcrackingresistanceofkaolin-filledstyrenebutadiene-basedaqueousdispersionsforpaper-basedpackaging. Coatings.2023;13(6):975.doi:10.3390/coatings13060975
25.OhK,SimK,BinJY,etal.Effectofcoatingbinderonfoldcrackingof coatedpaper. NordPulpPapResJ.2015;30(2):361-368.doi:10.3183/ npprj-2015-30-02-p361-368
26.YangA,XieY,RenjungW.FromTheorytoPractice:Improvingthe FoldcrackResistanceofIndustriallyProducedTripleCoatedPaper.In: Papercon;2011:1845-1858.
27.ZhuY,BousfieldD,GramlichWM.Theinfluenceofpigmenttypeand loadingonwatervaporbarrierpropertiesofpapercoatingsbefore andafterfolding. ProgOrgCoat.2019;132:132-210.doi:10.1016/j. porgcoat.2019.03.031
28.HolikH. Handbookofpaperandboard.Wiley-VCHVerlagGmbH& Co.KGaA;2013.doi:10.1002/9783527652495
29.TanninenP,LeminenV,LindellH,SaukkonenE,BackfolkK.Adjusting thediecuttingprocessandtoolsforbiopolymerdispersioncoated paperboards. NordPulpPapResJ.2015;30(2):336-343.doi:10.3183/ npprj-2015-30-02-p336-343
30.LeminenV,NiiniA,TanninenP,MatthewsS.Comparisonofcreasing andscoringinthemanufacturingoffoldingcartons. ProcediaManuf 2021;55(C):221-225.doi:10.1016/J.PROMFG.2021.10.031
31.LeminenV,MatthewsS,TanninenP,VarisJ.Effectofcreasingtool dimensionsonthequalityofpress-formedpaperboardtrays. Procedia Manuf.2018;25:397-403.doi:10.1016/J.PROMFG.2018.06.109
32.TanninenP,LeminenV,EskelinenH,LindellH,VarisJ.Controlling thefoldingoftheblankinpaperboardtraypressforming. BioResources.2015;10(3):5191-5202.doi:10.15376/biores.10.3.51915202
33.HauptmannM,BärW,SchmidtchenL,etal.Thesealingbehaviorof newmono-polyolefinandpaper-basedfilmlaminatesinthecontext ofbagform-fill-sealmachines. PackagTechnolSci.2021;34(2):117126.doi:10.1002/PTS.2544
34.MerabteneM,TanninenP,VarisJ,LeminenV.HeatsealingevaluationandRunnabilityissuesofflexiblepapermaterialsinavertical formfillsealpackagingmachine. BioResources.2022;17(1):223-242. doi:10.15376/BIORES.17.1.223-242
35.LeminenV,MäkeläP,TanninenP,VarisJ.Leakproofheatsealingof paperboardtrays-effectofsealingpressureandcreasegeometry. BioResources .2015;10(4):6906-6916.doi:10.15376/biores.10.4. 6906-6916
36.MerabteneM,TanninenP,WolfJ,etal.Heat-sealingandmicroscopic evaluationofpaper-basedcoatedmaterialsusingvarioussealbar geometriesinverticalformfillsealmachine. PackagTechnolSci.2023; 36(8):667-679.doi:10.1002/PTS.2735
37.HauptmannM,MajschakJ-P.Newqualitylevelofpackagingcomponentsfrompaperboardthroughtechnologyimprovementin3Dforming. PackagTechnolSci.2011;24(7):419-432.doi:10.1002/pts.941
38.NiiniA,BertholdL,MüllerT,etal.Effectofblankmoisturecontent onformingbehaviourandmechanicalpropertiesofpaperboardtray packages. JApplPackagRes.2022;14(1):1-18. https://scholarworks. rit.edu/japr/vol14/iss1/4/
39.ÖstlundM,BorodulinaS,ÖstlundS.Influenceofpaperboardstructureandprocessingconditionsonformingofcomplexpaperboard structures. PackagTechnolSci.2011;24(6):331-341.doi:10.1002/ pts.942
40.EuropeanCommission. Commissionimplementingdecision (EU)2019/665. https://eur-lex.europa.eu/legal-content/EN/TXT/? uri=CELEX%3A32019D0665.2019.AccessedFebruary3,2022.
41.BSEN12702. Adhesivesforpaperandboard,packaginganddisposable sanitaryproducts.Determinationofblockingbehaviourofpotentially adhesivelayers.BSOLBritishStandardsOnline. https://bsol.bsigroup. com/Bibliographic/BibliographicInfoData/000000000030019633 Published2000;2000.AccessedNovember15,2022
42.BSISO1924-3. Paperandboard.Determinationoftensileproperties. Constantrateofelongationmethod(100mm/min).BSOL BritishStandardsOnline. https://bsol.bsigroup.com/Bibliographic/
BibliographicInfoData/000000000030102136.Published2005; 2005.AccessedApril18,2023
43.BSISO2493-1. Paperandboard.Determinationofbendingresistance. Constantrateofdeflection.BSOLBritishStandardsOnline. https:// bsol.bsigroup.com/Bibliographic/BibliographicInfoData/ 000000000030190546.Published2010;2010.AccessedApril 18,2023
44.BSISO5628. Paperandboard.Determinationofbendingstiffness.Generalprinciplesfortwo-point,three-pointandfour-pointmethods.BSOL BritishStandards;2019. https://bsol.bsigroup.com/Bibliographic/ BibliographicInfoData/000000000030379994.Published2019
45.BSENISO535.In:BSOLBritishStandardsOnline,ed. https://bsol. bsigroup.com/Bibliographic/BibliographicInfoData/ 000000000030259603.Published2014Paperandboard.Determinationofwaterabsorptiveness.Cobbmethod;2014.AccessedJanuary 5,2021
46.BSISO2528. Sheetmaterials.Determinationofwatervapourtransmissionrate(WVTR).Gravimetric(dish)method.BSOLBritishStandards Online. https://bsol.bsigroup.com/Bibliographic/ BibliographicInfoData/000000000030349864.Published2017; 2017.AccessedMarch3,2022
47.BSISO16532-1. Paperandboard.Determinationofgreaseresistance. Permeabilitytest.BSOLBritishStandardsOnline. https://bsol. bsigroup.com/Bibliographic/BibliographicInfoData/ 000000000030164327.Published2008;2008.AccessedFebruary 2,2022
48.TanninenP,MatthewsS,LeminenV,VarisJ.Analysisofpaperboard creasingpropertieswithanoveldevice. ProcediaManuf.2021;55: 232-237.doi:10.1016/j.promfg.2021.10.033
49.ASTM. ASTMF88/F88M-21.Standardtestmethodforsealstrengthof flexiblebarriermaterials https://www.astm.org/f0088_f0088m-21. html.Published2021.AccessedFebruary2,2023.
50.BSEN631–1. Materialsandarticlesincontactwithfoodstuffs.Catering containers.Specificationfordimensionsofcontainers.BSOL BritishStandardsOnline. https://bsol.bsigroup.com/Bibliographic/ BibliographicInfoData/000000000000319214.Published1993; 1993.AccessedMay5,2023
51.Al-TuraifH.Surfacecoatingpropertiesofdifferentshapeandsize pigmentblends. ProgOrgCoat.2009;65(3):322-327.doi:10.1016/J. PORGCOAT.2009.01.001
52.JärnströmJ,VäisänenM,LehtoR,JäsbergA,TimonenJ,PeltonenJ. Effectoflatexonsurfacestructureandwettingofpigmentcoatings. ColloidsSurfacesaPhysicochemEngAsp.2010;353(2–3):104-116.doi: 10.1016/j.colsurfa.2009.11.001
53.TüreH,GällstedtM,JohanssonE,HedenqvistMS.Wheatgluten/montmorilloniteclaymultilayer-coatedpaperboardswithhigh barrierproperties. IndCropProd.2013;51:1-6.doi:10.1016/j.indcrop. 2013.08.054
54.HavimoM,JalomäkiJ,GranströmM,etal.Mechanicalstrength andwaterresistanceofpaperboardcoatedwithlongchain celluloseesters. PackagTechnolSci.2011;24(4):249-258.doi:10. 1002/pts.932
55.ZouY,HsiehJS,MehnertE,KokoszkaJ.Theeffectofpigmentsand laticesonthepropertiesofcoatedpaper. ColloidsSurfacesaPhysicochemEngAsp.2007;294(1–3):40-45.doi:10.1016/J.COLSURFA. 2006.07.046
56.PopilRE.Optimizingwaterresistanceoflinerboardcoatingsusing pigments. TappiJ.2006;5(9):18-26.
57.ThitsartarnW,JinkarnT.Waterresistanceimprovementofpaperboardbycoatingformulationsbasedonnanoscalepigments. JCoatingsTechnolRes.2020;17(6):1609-1617.doi:10.1007/S11998020-00386-5/FIGURES/10
58.LyonsA,ReedG.Pigmentedaqueousbarriercoatings. TAPPIj.2020; 19(11):551-558.doi:10.32964/TJ19.11.551
59.KuggeC,JohnsonB.Improvedbarrierpropertiesofdoubledispersion coatedliner. ProgOrgCoat.2008;62(4):430-435.doi:10.1016/J. PORGCOAT.2008.03.006
60.PouloseS,TorisevaJ,LahtiJ,JönkkäriI,HedenqvistMS,KuusipaloJ. Agreenhighbarriersolutionforpaperboardpackagingbasedon potatofruitjuice,poly(lacticacid),andpoly(butyleneadipateterephthalate). ACSApplPolymMater.2022;4(6):4179-4188.doi:10. 1021/acsapm.2c00153
61.BakkerS,AartsJ,EstevesACC,MetselaarGA,SchenningAPHJ. Waterbarrierpropertiesofresin-stabilizedwaterbornecoatingsfor paperboard. MacromolMaterEng.2022;307(4):2100829.doi:10. 1002/mame.202100829
62.VoogtB,HuininkH,vandeKamp-PeetersL,etal.Hydroplasticization oflatexfilmswithvaryingmethacrylicacidcontent. Polymer(Guildf) 2019;166:206-214.doi:10.1016/J.POLYMER.2019.01.074
63.HubbeMA,GillRA.Fillersforpapermaking:areviewoftheirproperties,usagepractices,andtheirmechanisticrole. BioResources.2016; 11(1):2886-2963.doi:10.15376/biores.11.1.2886-2963
64.RättöP,BarbierC,RigdahlM.Aninvestigationofthefrictionpropertiesofcoatedpaper. NordPulpPapResJ.2000;15(5):351-356.doi: 10.3183/npprj-2000-15-05-p351-356
65.KettleJ.Moistureandfluidtransport.In:NiskanenK,ed. Paper physics(papermakingscienceandtechnology).2nded.FinnishPaper Engineers'Association/PaperijaPuuOy;2008:265-294.
66.TanninenP,LindellH,SaukkonenE,BackfolkK.Thermaland mechanicaldurabilityofstarch-baseddualpolymercoatingsinthe pressformingofpaperboard. PackagTechnolSci.2014;27(5):353363.doi:10.1002/pts.2036
67.FarukO,BledzkiAK,FinkHP,SainM.Biocompositesreinforcedwith naturalfibers:2000-2010. ProgPolymSci.2012;37(11):1552-1596. doi:10.1016/j.progpolymsci.2012.04.003
Howtocitethisarticle: MarinelliA,LyytikäinenJ,TanninenP, DelCurtoB,LeminenV.Barrier,converting,andtray-forming propertiesofpaperboardpackagingmaterialscoatedwith waterbornedispersions. PackagTechnolSci.2024;37(3): 149‐165.doi:10.1002/pts.2784
FROM THE PUBLISHERS
Volume10, Number2,2024
Pros and Cons of “X (Twitter)” for Business: Maximizing Opportunities and Overcoming Challenges
In today’s digital landscape, social media platforms have become indispensable for businesses seeking to establish a strong online presence. Among these platforms, “X (Twitter)” has emerged as a powerful tool for connecting with audiences, increasing brand exposure, and driving engagement. However, like any tool, “X (Twitter)” has both its advantages and disadvantages for businesses. In this article, we will explore the pros and cons of using “X (Twitter)” for business. By understanding these factors, you can make informed decisions and effectively leverage “X (Twitter)” potential to maximize your business’s success.
By Yoel Israel
11 July 2023
https://wadidigital.com/blog/pros-and-cons-of-twitter-for-business/


Advantages of using “X (Twitter)” for Business

When it comes to leveraging “X (Twitter)” for business, there are several compelling advantages that make it a valuable platform for brands. Let’s delve into the pros in more detail:
Wide Reach and Brand Exposure
“X (Twitter)” boasts a massive user base, offering businesses an extensive platform to reach a global audience. With millions of active users, businesses can significantly increase brand visibility and awareness. The viral nature of “X (Twitter)” allows brand messages to spread rapidly, exposing your business to new customers and markets.
Real-Time Marketing Opportunities
“X (Twitter)” real-time nature enables businesses to tap into trending topics and hashtags, leveraging current events and popular conversations to promote their products or services. By engaging in real-time marketing, businesses can stay relevant and capture the attention of their target audience.
Customer Engagement and Feedback
“X (Twitter)” facilitates direct interaction between businesses and customers, providing a platform for valuable engagement and feedback. Customers can easily reach out to brands, share their experiences, ask questions, and provide feedback. This real-time engagement not only builds trust and fosters customer loyalty but also enables businesses to address concerns promptly and improve their offerings based on customer feedback.
Influencer Marketing and Partnerships
“X (Twitter)” offers excellent opportunities for influencer marketing, allowing businesses to collaborate with relevant industry influencers. By partnering with influencers aligned with their brand values, businesses can reach a larger audience, gain credibility, and drive conversions effectively.
Disadvantages of using “X (Twitter)” for Business
Now, let’s explore the cons of using “X (Twitter)” for business, which is important to consider:
Information Overload and Noise
With the vast number of tweets flooding users’ timelines, businesses face the challenge of standing out amidst the noise. It can be difficult to capture users’ attention and make an impact in such a crowded environment. Thoughtful content creation and strategic approaches are necessary to cut through the clutter.
Negative Publicity and Crisis Management
While “X (Twitter)” provides ample opportunities for positive brand exposure, it also poses the risk of negative publicity. Negative sentiments and crises can spread quickly on the platform, potentially damaging a brand’s reputation. Effective crisis management strategies and timely responses are crucial to mitigate damage and maintain a positive brand image.
Limited Message Length and Context
The character limit on “X (Twitter)” poses a challenge for businesses aiming to convey complex messages. Crafting concise yet impactful tweets while providing sufficient context can be difficult. However, this limitation also encourages businesses to communicate their core value proposition succinctly, promoting clarity and engagement.
Time and Resource Commitment
Successful management of an “X (Twitter)” presence requires dedicated time and resources. Consistently posting, engaging with followers, and creating relevant content demand a significant commitment. Without proper planning and resource allocation, businesses may struggle to maintain an active and effective presence on the platform.
Conclusion:
“X (Twitter)” offers businesses a wealth of opportunities to connect with audiences, increase brand exposure, and foster customer engagement. Understanding the advantages and disadvantages of using “X (Twitter)” is crucial for developing a well-rounded strategy that aligns with your goals and resources. By leveraging “X (Twitter)” wide reach, real-time marketing potential, customer engagement, and influencer partnerships, businesses can tap into a vast network of opportunities. However, it’s equally important to address the challenges of information overload, crisis management, limited message length, and time/resource commitment. With careful planning and a deep understanding of the platform, businesses.
PAPERmaking!
FROM THE PUBLISHERS OF PAPER TECHNOLOGY INTERNATIONAL® Volume10, Number2, 2024
How to Keep Your Eyes Healthy
Don't take your eyes for granted. Take these easy steps to keep your peepers healthy.
Medically Reviewed by Whitney Seltman, OD on June 14, 2022
Written by WebMD Editorial Contributors
https://www.webmd.com/eye-health/good-eyesight
The Paper Industry Technical Association (PITA) is an independent organisation which operates for the general benefit of its members – both individual and corporate – dedicated to promoting and improving the technical and scientific knowledge of those working in the UK pulp and paper industry. Formed in 1960, it serves the Industry, both manufacturers and suppliers, by providing a forum for members to meet and network; it organises visits, conferences and training seminars that cover all aspects of papermaking science. It also publishes the prestigious journal Paper Technology International® and the PITA Annual Review, both sent free to members, and a range of other technical publications which include conference proceedings and the acclaimed Essential Guide to Aqueous Coating
1. Eat Well
Good eye health starts with the food on your plate. Nutrients like omega-3 fatty acids, lutein, zinc, and vitamins C and E might help ward off age-related vision problems like macular degeneration and cataracts. To get them, fill your plate with:
Green leafy vegetables like spinach, kale, and collards
Salmon, tuna, and other oily fish
Eggs, nuts, beans, and other nonmeat protein sources
Oranges and other citrus fruits or juices
Oysters and pork
A well-balanced diet also helps you stay at a healthy weight. That lowers your odds of obesity and related diseases like type 2 diabetes, which is the leading cause of blindness in adults.
2. Quit Smoking
It makes you more likely to get cataracts, damage to your optic nerve, and macular degeneration, among many other medical problems. If you've tried to kick the habit before only to start again, keep at it. The more times you try to quit, the more likely you are to succeed. Ask your doctor for help.
3. Wear Sunglasses
The right pair of shades will help protect your eyes from the sun's ultraviolet (UV) rays. Too much UV exposure boosts your chances of cataracts and macular degeneration.
Choose a pair that blocks 99% to 100% of UVA and UVB rays. Wraparound lenses help protect your eyes from the side. Polarized lenses reduce glare while you drive, but don’t necessarily offer added protection.
If you wear contact lenses, some offer UV protection. It's still a good idea to wear sunglasses for an extra layer.
4. Use Safety Eyewear
If you use hazardous or airborne materials on the job or at home, wear safety glasses or protective goggles.
Sports like ice hockey, racquetball, and lacrosse can also lead to eye injury. Wear eye protection. Helmets with protective face masks or sports goggles with polycarbonate lenses will shield your eyes.
5. Look Away From the Computer Screen
Staring at a computer or phone screen for too long can cause:
• Eyestrain
• Blurry vision
• Trouble focusing at a distance
• Dry eyes
• Headaches
• Neck, back, and shoulder pain
To protect your eyes:
• Make sure your glasses or contacts prescription is up to date and good for looking at a computer screen.
• If your eye strain won’t go away, talk to your doctor about computer glasses.
• Move the screen so your eyes are level with the top of the monitor. That lets you look slightly down at the screen.
• Try to avoid glare from windows and lights. Use an anti-glare screen if needed.
• Choose a comfortable, supportive chair. Position it so that your feet are flat on the floor.
• If your eyes are dry, blink more or try using artificial tears.
• Rest your eyes every 20 minutes. Look 20 feet away for 20 seconds. Get up at least every 2 hours and take a 15-minute break.
6. Visit Your Eye Doctor Regularly
Everyone needs a regular eye exam, even young children. It helps protect your sight and lets you see your best.
Eye exams can also find diseases, like glaucoma, that have no symptoms. It's important to spot them early on, when they're easier to treat.
Depending on your eye health needs, you can see one of two types of doctors:
• Ophthalmologists are medical doctors who specialize in eye care. They can provide general eye care, treat eye diseases, and perform eye surgery.
• Optometrists have had 4 years of specialized training after college. They provide general eye care and can diagnose and treat most eye diseases. They don't do eye surgery.
A comprehensive eye exam might include:
• Talking about your personal and family medical history
• Vision tests to see if you’re nearsighted, farsighted, have an astigmatism (a curved cornea that blurs vision), or presbyopia (age-related vision changes)
• Tests to see how well your eyes work together
• Eye pressure and optic nerve tests to check for glaucoma
• External and microscopic examination of your eyes before and after dilation
You might also need other tests.
FROM THE PUBLISHERS
Volume10, Number2,2024
10 Tips For Proper Sitting Posture At A Computer Desk
In the modern workplace, many workers spend more than 50% of their workday in a seated position. This is why learning the proper sitting posture is so important.
Our bodies were built to move and yet we are spending an increasing amount of time in sedentary environments that minimize our physical activity levels, and also require us to sit for prolonged periods of time.
Sitting with poor posture can lead to:
– Neck and back pain
– Forward head posture
– Rounded shoulders
– Hyperkyphosis
– Anterior pelvic tilt
– Bulging discs
– Muscle stiffness
– Decreased mobility
– Poor balance
– Decreased athletic performance
According to the Cleveland Clinic, good posture involves positioning your body to walk, stand, sit, or lie in a position that places the least amount of strain on the supporting muscles and ligaments of your body.
Benefits of proper posture include:
– Keeps bones and joints in proper alignment to encourage efficient use of muscles.
– Helps reduce abnormal wear and tear on joint surfaces.
– Decreases the stress on the spinal ligaments.
– Prevents abnormal spinal positions.
– Prevents muscle fatigue.
– Prevents injury including strains, sprains, and overuse injuries.
– Contributes to a good appearance.
– Improves self-esteem.
Dr. Shaina McQuilkie, DC, July 3, 2023 https://backintelligence.com/proper-sitting-posture-at-a-desk/
1. Keep your pelvis neutral with your buttocks against the back of your chair. Proper sitting posture at a desk begins at your pelvis. You want to sit with your pelvis in a neutral position, with your buttocks against the back of the chair.
You might be wondering… how do I sit with a neutral pelvis? The first step to finding a neutral pelvis is begins with finding your sitz bones. These bones are the most prominent bones that you’ll feel in your buttocks when you place your hands underneath your buttocks.
Once you find these bones, round your lower back into a slouched position and tuck your pelvis under – the sitz bones will start to feel flat under your hands. Now, tilt your pelvis forward by arching your lower back. Your sitz bones will leave your hands and all of your weight will move to the back of your thighs.
A neutral pelvis is midway between the slouched and tilted forward positions. In a neutral pelvis posture, your sitz bones will feel pointy.
Sitting with your pelvis in a neutral position, with your buttocks positioned against the back of your chair, will help to prevent your pelvis from tilting forwards (anterior pelvis tilt), or backwards (posterior pelvic tilt).

2. Keep your ears, shoulders, and hips aligned. The natural curves of your spine are maintained by keeping your ears, shoulders, and hips aligned. Any deviation from this position will cause shifting of the natural curves of your spine, which places excess stress on the spine resulting in pain, and also increases your risk of injury.

3. Maintain the normal low back curve (Use a back support)
Your back should have a small curve in the lower back, which is where your lordortic curve is. Without support, your back tends to curve in the opposite direction, which is known as kyphosis (hunchback), which leaves your lower back vulnerable to injuries including sprains and strains, and disc herniation. A rolled up towel, or a small pillow, is a simple solution that can be used to provide support to the lower back.

4. Keep your hips and knees at 90 degrees. When sitting at your desk, try to keep your knees almost aligned with your hips. This position helps to keep a neutral spine position. Sitting in a chair that’s too low positions your knees above your hips, while sitting perched higher up positions your hips significantly higher than your knees. Both of these positions place excessive stress on your back and can lead to back pain and stiffness.

5. Evenly distribute your weight over both hips (avoid leaning to one side).
It can be tempting to lean to the side when you’re sitting at your desk, but this bad habit causes your spine to curve, which can lead to issues such as sprains and strains, scoliosis, and disc herniation. Ensure that your weight is evenly distributed over both hips when in a seated position.

6. Keep both feet flat on the ground (use foot stool if necessary). When you cross your legs, or if just your toes are touching the floor, you put stress on the large supportive muscles of your back, pelvis and hip and you also interfere with proper blood flow. Another issue with a crossed-leg position is that it puts added pressure on your lower back and forces you to lean slightly to one side, causing and imbalanced pelvis.

7. Keep your forearms parallel with the floor, resting on your desk. Keeping your forearms parallel with the floor, resting on your desk helps to reduce the amount of stress on the joints of your upper extremities. Ensure that you place your keyboard and mouse at appropriate distances from your body so that you don’t have to continually reach forwards to use them. If you have to stretch your arms to reach you keyboard and/or mouse, your shoulders will start to rotate forward which can lead to rounded shoulders posture as well as upper back pain.

8. Place your computer monitor 18-24 inches from your face with the top 1/3 of monitor at eye level. If your computer monitor is positioned incorrectly, you’ll be placing excess strain on your neck because you’ll have to be constantly looking up or down. This puts you at risk for injuries such as neck strains and sprains, cervical disc herniation, and headaches.

9. Regularly check that your head is not protruding forward. You’ll really want to be aware of this bad habit and make a conscious effort to avoid it. Research has found that for every inch your head moves forward, there’s an extra 10 pounds of weight placed on your neck! Protruding your head forward when seated can lead to forward head posture, which can results in an array of health issues including neck and back pain, muscle spasms, arthritis of the neck, restricted breathing, headaches and migraine, insomnia, sleep apnea, chronic fatigue, numbness and tingling in your arms and hands, and temporal mandibular joint (TMJ) pain.

10. Take periodic breaks & Stretch out.
Try to take a short break from sitting at least once every hour to move around your office. This can help to relieve pain and prevent muscle tightness. During your breaks, you can try doing simple stretches to relieve muscle tightness and improve blood flow. Simple exercises that can be done in your office include:
– Neck range of motion (flexion, lateral flexion, and rotation)
– Shoulder shrugs
– Calf raises
– Ankle pumps
– Lunges
– Doorway stretch

In Conclusion
If you’re like many people, you spent countless hours seated at your desk and you may be suffering with aches and pains due to poor posture. Bad sitting habits, such as slouching or crossing your legs, can have a detrimental impact on the health of your spine. Fortunately, these bad habits can be corrected by following the tips outlines above. Simple changes to your workspace and your sitting posture can go a long way to improving the health of your spine.
PAPERmaking!
FROM THE PUBLISHERS OF PAPER TECHNOLOGY INTERNATIONAL®
Volume10, Number2,2024
The best AI productivity tools in 2024
As the dust settles on last year's AI storm, ChatGPT is just one of hundreds of powerful tools in the game. From new intelligent features on apps you already love, to entirely new platforms with jaw-dropping functionality, there's an AI-powered solution to nearly every productivity problem.
I've been playing around with AI tools for a while now, and I've continued to update this list with lots of research and testing from me and the team at Zapier. With that, here are 37 AI productivity tools that will change the way you work.
The best AI productivity tools by category
• Chatbots (ChatGPT, Claude, Bing AI, Zapier Central)
• Content creation (Jasper, Copy.ai, Anyword)
• Grammar checkers and rewording tools (Grammarly, Wordtune, ProWritingAid)
• Video creation and editing (Descript, Wondershare Filmora, Runway)
• Image generation (DALL·E 3, Midjourney, Stable Diffusion)
• Voice and music generation (Murf, Splash Pro, AIVA)
• Knowledge management and AI grounding (Mem, Notion AI Q&A, Personal AI)
• Task and project management (Asana, Any.do, BeeDone)
• Transcription and meeting assistants (Fireflies, Airgram, Krisp)
• Scheduling (Reclaim, Clockwise, Motion)
• Email inbox management (SaneBox, Mailbutler, EmailTree)
• Slide decks and presentations (Decktopus, Beautiful.ai, Slidesgo)
• Automation (Zapier)
• Other AI productivity tools
How I selected the best AI productivity app in each category My AI app database is at 270 entries right now. I'm absolutely sure there are way more out there, with many new apps being launched every week.
Full transparency: I've had a chance to take a look at most of them, but I haven't tested them all (yet). The list you're about to see contains a collection of great AI productivity tools tested by Zapier's app review team, myself included. If there's a particular category you like, check out the best apps lists we've put together for them or if we're still in the process of writing that list, run a quick Google search to find more options.
While all these apps are getting better every day, they're far from perfect: be sure to always check AI's work with your human brain. With that being said, please keep all hands and legs inside the vehicle it's time to explore.
By Miguel Rebelo · January 25, 2024
https://zapier.com/blog/best-ai-productivity-tools/
The Paper Industry Technical Association (PITA) is an independent organisation which operates for the general benefit of its members – both individual and corporate – dedicated to promoting and improving the technical and scientific knowledge of those working in the UK pulp and paper industry. Formed in 1960, it serves the Industry, both manufacturers and suppliers, by providing a forum for members to meet and network; it organises visits, conferences and training seminars that cover all aspects of papermaking science. It also publishes the prestigious journal Paper Technology International® and the PITA Annual Review, both sent free to members, and a range of other technical publications which include conference proceedings and the acclaimed Essential Guide to Aqueous Coating.
1. AI chatbots
The best place to start is the category that brought AI to the mainstream. AI chatbots allow you to chat with an AI large language model, letting you ask questions and get answers in a conversational style. The best chatbots use advanced reasoning and logic, write code, and make mathematical calculations.
ChatGPT
ChatGPT is the current industry leader, and the first chatbot that set the scene on fire. It's powered by OpenAI's GPT-3 and GPT-4 models, and it's surprisingly flexible and very easy to use. Learn how to use ChatGPT, understand how it works, and discover how to use it to write marketing copy, do market research, or write sales emails. When you connect ChatGPT to Zapier, you can automate ChatGPT, so you can access the power of the AI chatbot from within any of your favorite apps.
Claude
Anthropic's safe and creative chatbot, Claude has impressive memory: it can remember up to 150,000 words in each conversation. This makes it useful to have long, step-by-step discussions of a problem or to upload a PDF and ask questions.
Bing AI (Microsoft Copilot)
Microsoft's close relationship with OpenAI was a positive step to Bing Search: it can search the web and generate answers based on the results. It's also connected to DALL·E 3, so if you ask for images, you'll get four visual variations of your prompt. Microsoft is bringing all its AI features into a single name Microsoft Copilot so look out for that rebranding across its product line.
Zapier Central
Zapier Central is an experimental AI workspace where you can teach bots to work across thousands of apps. But the interface is a chatbot, which means that creating your own AI agent is as simple as using ChatGPT. Tell your bot what to do when it's triggered, how to process or summarize data, and which actions it should take. You can trigger behaviors on demand, when new data comes through any app in your tech stack, or when you use a specific keyword in a message to the bot. It's AI chat, automation, and data analysis all in one place.
2. AI apps for content creation
Entire movies have been made about writer's block. These apps are here to break it. By entering your prompts, starting from templates, or using recipes, you can use AI models as a co-writer, helping you put together first drafts faster.
Jasper
Jasper is a powerful AI content creation platform, favoring users who need a high volume of content. It packs dozens of templates to help you get started, connects to the internet to find research and sources, and also lets you generate images with AI. All your content creation needs are covered here. You can also connect Jasper to thousands of other apps using Zapier.
Copy.ai
Copy.ai is a slower-paced option, acting as a writing co-pilot. Each of your prompts generates a list of options, and it's up to you to pull the best ones into your document. This is better for writing tasks that require more ideation and iteration, such as copywriting.
Anyword
Anyword helps marketers create content by breaking the generation process down step by step. First, you add your prompt to generate a few titles. Then, you can pick your favorite and see a generated outline. Once you tweak that outline to what you want to cover, you can move forward to generating the final piece.
3. AI apps for text enhancement
Spell-checking has been around for a long time, but AI is changing the game. Before, it only detected spelling and basic structure errors. Now, it can spot tone and complex language and offer suggestions to make your writing clearer.
Grammarly
Grammarly is the mainstream spell- and structure-checking app. It's a complete solution that keeps your English on point, lets you adjust your tone, and suggests shortcuts to simplify wordy or complex phrases. It
has plenty of extensions and integrations, so you can use it almost anywhere there's a text box. It has generative text features, too.
Wordtune
Wordtune helps you find plenty of wording alternatives to improve your text. When you input the text you want to check, you can easily browse synonyms, ask to rewrite entire sentences, and adapt the suggestions into a final draft.
ProWritingAid
ProWritingAid is a direct competitor of Grammarly, offering plenty of statistics to help you track grammar, style, and spelling scores. One of the main advantages here is its lifetime plan, helping you leverage all these features without adding a new recurring bill.
4. AI apps for video generation and editing
While full-blown video generation is still coming together, there's already a set of video tools that leverage AI to enhance video, remove backgrounds accurately, and even paint a few new images into each frame.
Descript
Descript transcribes your videos into a script. Then, instead of using a timeline to trim the audio and video tracks, you edit the text script. As you do so, the video gets trimmed automatically. The rest of the editing works in a similar way, cutting the time to edit your talking head videos When you connect Descript to Zapier, you can automate the work better suited for computers, so you can focus on the creative side of things.
Wondershare Filmora
Wondershare Filmora has been around for a long time. Now, it also brings to the table a set of AI features that let you remove backgrounds, denoise low-quality clips, and improve sound quality. All this with the classic video editing user experience, so you'll never feel lost.
Runway
Runway is a video magic wand. It has a set of interesting features that helps you generate video with AI, train your own AI models, and paint parts of frames using text prompts. The learning curve is very rewarding, and the app is growing at a great pace. Be sure to check it out.
5. AI apps for image generation
An image is worth a thousand words, but you don't need so many to generate a beautiful one with AI. These image generators take a text prompt and deliver the results and this can be anywhere between mind-blowing to nightmare-inducing. They're both hugely entertaining and highly useful.
DALL·E 3
DALL·E 3 is an image generator by OpenAI, the creators of ChatGPT. It's very simple to use it runs in ChatGPT and it produces interesting results, no matter if you've just started writing image prompts or are already a master. A great choice to begin exploring the realm of AI image generation. You can connect DALL·E to Zapier to do things like automatically create images from transcripts, chat messages, or any other apps you use.
Midjourney
Midjourney is impressive. Anything you throw at it generates incredible results even if sometimes they're slightly off the mark. The fact that you have to use Discord to access it feels unintuitive at first, but once you get the hang of it, you'll be spending hours turning your imagination into colorful pixels.
Stable Diffusion
DreamStudio, powered by the Stable Diffusion AI model, is versatile and offers plenty of controls to help you prompt your way to the results you want. You'll have to invest a bit more time and learn how to control the model, but the reward is well worth it
6. Voice and music generators
YouTubers and other social media creators sometimes struggle to get original assets for their content. Good thing AI is here to (re)mix everything with AI voice generators and AI music generators.
Murf
Short on voiceover talent? Murf offers over 120 voices in 20 languages to turn your text into voice. With simple controls to change pitch, emphasis, and pauses, you'll have a quick way to add narration to your latest social media post or training video.
Splash Pro
Moving on to music generation, Splash Pro is one of the few apps that accepts a text prompt. I recommend you try out the Improve button before sending it you'll get more interesting results. The engine generates up to five music samples per prompt. If you like one of them, you can either ask for variations or move on to creating the full song.
AIVA
AIVA also deals with music, but takes a different approach. Instead of a text prompt, there are three ways you can start generating:
• By picking a style, from epic orchestral to cinematic cyberpunk
• By chord progression
• By uploading an audio reference as inspiration
Once ready, you can edit the result in a timeline editor, adding or removing instrument tracks as you feel your way into the final version.
7. AI apps for knowledge management and grounding
AI is also a powerful search tool. When you connect it to your personal data, workspace, or second brain, it can find anything you need and put it into a natural language answer. Much better than sifting through your notes for hours, right? This is the gist of grounding: keeping an AI model close to your facts not up there flying with the hallucinations.
Mem
Mem uses AI to tag and connect the notes you take, so you don't have to spend time organizing them. You can just gather bits and pieces of information, store them, and trust that Mem's AI features will keep everything connected and organized. When the time comes to search for those notes, you can browse the automatic tags and use the search bar to find all you wrote about each topic that matters to you. Keep feeding your intelligent second brain by connecting Mem to Zapier, improving data transmission and opening up more automation opportunities.
Notion AI Q&A
Notion is a strong workspace for organizing your knowledge, but even if you're disciplined, important pages will still fall through the cracks. Not anymore with Notion AI Q&A: grounded on your data, it generates answers and points you to the sources, revealing that lost insight you recorded in a meeting years ago. You can connect Notion to Zapier to streamline things even more.
Personal AI
While Mem and Notion focus on notes and documents, Personal AI focuses on messaging. The data you upload into the app is turned into memory blocks. Then, whenever someone messages you, your personal AI generates a reply based on your data: you can edit the details or tap to send it right away. When you feel your AI model knows enough about you, you can turn on AI Autopilot, which will make others feel like they're talking to a ChatGPT-like version of you. You can help Personal AI learn about you by connecting it to Zapier and sending it memories from the apps where you spend the most time.
8. AI task and project management
When you have a good plan, collaboration and execution is easier. AI can help getting more clarity on what to do, optimize processes, and help you cross every single task off your list.
Asana
A project management heavyweight, Asana adds a wide range of useful AI-powered features. Smart goals use historical data to come up with better goals for the quarter. It identifies project risks and workflow blockers, so you can tackle trouble before it happens. And it provides answers to anything related to your projects, helping you gain more visibility into what is (or isn't) happening. You can automate Asana even more by connecting it to Zapier, so it can talk to thousands of other apps.
Any.do
It's natural not to know the entire task lineup of a project. If you have trouble figuring out all the steps to get from zero to complete, Any.do generates tasks for you. Whenever you're writing them down, you can take a look at AI suggestions and click to enlarge your list. Connect Any.do to Zapier to automate all your task management processes.
BeeDone
BeeDone is a quirky option directed at those of us who need a little excitement to get things done (I'm 100% guilty here). Based on principles put forward by Cal Newport and James Clear (among other productivity greats), the app turns boring tasks into little games, offering rewards whenever you move forward. It keeps track of your habits, offers an AI assistant to guide you, and you can spin the Task Roulette if you feel like tackling a random one from your list.
9. AI transcription apps and meeting assistants
Taking notes in meetings may reduce your focus, so why not scrap that activity entirely? AI transcription/meeting assistant apps are great to turn voice into text, letting you browse it later. This will help you be more present in your meetings and, at the same time, be able to thoroughly analyze the transcription later.
Fireflies
Fireflies is great to transcribe all your meetings, tracking the conversation topics along the way. It has its own bot called Fred that can handle summarizing the meeting's contents, generating text, and searching through your history to meet your query.
Airgram
Airgram has all the core transcription features too. But it also adds AI data extraction on top of it, helping you extract bits of information, such as currencies, people, or places from unstructured data.
Krisp
Krisp is actually an audio optimization tool that reduces background noise to help you sound better in meetings. While you can use it to improve your podcast or other important recordings, you can also use it to assist you in your meetings by transcribing everything.
10. AI apps for scheduling
No one loves the back and forth of setting up meetings, or any of the extra work tied to scheduling your work for the day. In an ideal world, you'd just look at your calendar, hop on meetings, and start your tasks at the marked date and time. We're getting closer to that, as AI can already take some trouble out of scheduling your work and your life.
Reclaim
Reclaim does a great job protecting your habits, so you never miss your weekly fitness objectives or your reading targets. More than that, it'll defend the time you need to complete important tasks by rearranging your schedule.
Clockwise
Clockwise is better for teams, promising to save you one hour per week and to show you that it works, it'll schedule a one-hour break shortly after you start using it. You can adjust the settings to create your ideal day where work, breaks, and meetings live in harmony.
Motion
Motion focuses on project management, helping you keep track of all the tasks you still have to complete. By tweaking each task priority, you'll be telling the AI engine when it should land on the calendar and how to place the other tasks around it.
11. AI apps for email and inbox management
People spend about one month per year managing their work email inbox no, I didn't make this up. With so many messages to follow up on, it can feel like email is driving you away from what really moves your work forward. You can start cutting the admin time here by using an AI email assistant to categorize, generate reply drafts, and keep everything up to date.
SaneBox
SaneBox starts by scanning your inbox, understanding who you usually communicate with, which newsletters you receive, and what useless emails arrive every day. Based on that, it can help you delete unwanted emails, prioritize important messages, and add tags to keep things organized.
Mailbutler
Mailbutler has the full suite of generative AI tools in the email compose window: Smart Compose, Respond, Summarize, and Improve. An extension for Gmail, Apple Mail, and Outlook, it extracts the contact information of people in your inbox, so you don't have to organize them manually. And, if you usually forget to note down your tasks, it analyzes all the emails you get and extracts any detected tasks into the sidebar.
EmailTree
EmailTree is a solution for customer support teams, helping you organize your inbox, follow up on messages, and automate a few replies. It does this by processing the emails you receive and suggesting the follow-up action that makes the most sense. It's then up to you to trigger it.
12. AI apps for presentations and slide decks
Your magnetic stage presence is what people came for, but they stayed because of your beautiful slide deck. Clean and beautiful slides support your performance, keep your audience engaged, and help you drive in the points that you're making. The problem? Creating a solid slide deck can take a decent chunk of time, especially if you're starting from scratch. Can AI help?
Decktopus
Decktopus is simple and fun to use. You enter what your presentation should be about, the target audience, and the objective. It'll put together a full presentation with text and slides, with plenty of magic buttons scattered around the user interface, helping you change images or generate text. Great for starting with a solid first draft and honing it into a powerful final version.
Beautiful.ai
Beautiful.ai delivers on its name's promise. It simplifies the process of putting together a beautiful slide deck, with all the layouts and styles figured out. Pick the colors, find royalty-free images in the library, and start putting together your presentation. If you have data that changes frequently, you can update it by using sliders and tables. The values will then change dynamically on the presentation.
Slidesgo
Slidesgo will let you pick the topic, writing tone, and a general template. AI generates the whole presentation for you, and from there, you can add your own content, customize each slide, and use AI to write, generate images, or generate a new slide.
13. AI apps for automation
Each of these AI productivity tools is impressive on its own, but when you want to integrate AI into your daily workflows, that means connecting AI to the other tools you already use.
Zapier
Zapier lets you automate faster by using natural language to create workflows that connect thousands of apps. Describe what you want to automate, and Zapier will draft a workflow that you can easily customize. You can even use Zapier to build your own custom chatbot. Zapier connects to OpenAI, ChatGPT, Jasper, Hugging Face, and thousands of other apps, so you can combine the magic of AI with the power of automation to accelerate the work that matters most.
Other AI productivity apps
If you like trying out more niche apps, here are some extra ones to keep an eye out for.
• 3D modeling: Generate the third dimension with Spline AI, 3DFY.ai, and Meshcapade.
• AI agents: Automate tasks with AI using AI Agent, AgentGPT, and HyperWrite Assistant.
• Research: Take a deep dive with aomni, genei, and Consensus.
• AI app builders: Quickstart your interface and databases with Softr, PowerApps, and AppSheet (or try an AI website builder).
AI for productivity: the AI-powered you I'm a full-blown AI enthusiast. Even still, I like to think that these are merely tools. They save you time, spark ideas, and offer new angles. Remember to always use your judgment and keep your attention on the objective of what you're working on.
Another big risk: losing too much time feeding prompts to the AI, or generating so much output that it becomes difficult to edit, manipulate, and put together. Sharpen your cutting and editing skills to curb the excess, and you'll do great.
With all that in mind, it's time to enjoy. Try out these tools, and see why AI is the next big productivity leap.
PAPERmaking!
FROM THE PUBLISHERS OF PAPER TECHNOLOGY INTERNATIONAL®
Volume10,Number2, 2024
Products & Services & News
PITA CORPORATE SUPPLIER MEMBERS
Page 2 ABB
Page 3 AFT
Page 4 AFT
Page 5 Archroma
Page 6 Valmet
Page 7 Valmet
advert “ABB MES for Pulp & Paper”
MaxEdge600 refiner
IoT data processing and reporting
Cartaseal® OGB F10 barrier coating
Low friction doctor blades
Valmet DNAe for process automation
PITA NON-CORPORATE SUPPLIER MEMBERS
Page 9 Andritz
Page 10 Voith
NON-PITA SUPPLIER MEMBERS
Page 11 Kadant
Page 12 Konecranes
Page 14 SICK
HPC carbon capture technology
SolarFlow Green suction roll cover
VeriFlex™ oscillation system roll cleaning system
X-series industrial crane series
OD7000 displacement sensor
The Paper Industry Technical Association (PITA) is an independent organisation which operates for the general benefit of its members – both individual and corporate – dedicated to promoting and improving the technical and scientific knowledge of those working in the UK pulp and paper industry. Formed in 1960, it serves the Industry, both manufacturers and suppliers, by providing a forum for members to meet and network; it organises visits, conferences and training seminars that cover all aspects of papermaking science. It also publishes the prestigious journal Paper Technology International® and the PITA Annual Review, both sent free to members, and a range of other technical publications which include conference proceedings and the acclaimed Essential Guide to Aqueous Coating.

AFT EXPANDS MAXEDGE REFINER PRODUCT LINE
The MaxEdge™ refiner family has a new member: Meet the MaxEdge600, capable of handling process capacities over 600 t/d.
With this latest design, AFT is expanding its product range to higher production rates, offering energy efficient refining technology combined with patented Finebar® segments.
Since launching the MaxEdge refiner, AFT has been continuously developing the refiner series by integrating more control and IoT features. With AFTLinx™ service, we are providing more comprehensive and faster support to ensure efficient and optimized refiner operation.
For more on MaxEdge Technology: https://ow.ly/FL3j50Reju4

AFT DEVELOPS IOT DATA PROCESSING AND REPORTING USING ISLET
Aikawa Fiber Technologies (AFT) and Islet Group have collaborated to improve AFT's IoT data processing and reporting. Islet's team created a modern data and analytics platform using Microsoft Fabric, able to meet AFT’s current needs and expandable for the future.
AFT is a global supplier of equipment, engineered components, and IoT solutions for the pulp and paper industry. IoT refers to systems that are based on the automatic data transfer performed by technical devices and the remote monitoring via the Internet. With the right tools, information can be processed into an easily usable form - and with the help of a data network, automatic, real-time analytics can be used to organize massive amounts of data into usable key figures and snapshot reports.
From manual reporting to scalable architecture
AFTLinx™ Service was developed as a diagnostic service that collects equipment-specific operating data to improve its productivity and performance - with assistance from AFT specialists who analyze the instrument information.
In the solution implemented by Islet, both current needs and future expansion of AFTLinx service were taken into account. AFT’s data platform and reporting will be expanded in stages by bringing in data from other operational systems. The architecture was implemented using specific Microsoft models, which have become industry standards.
"Our collaboration with AFT has been very inspiring. With the new data and analytics platform, AFT can now fully utilize the potential of IoT data and get real-time information that helps them make better decisions. The new platform not only meets AFT's current needs but is also expandable for future needs. This gives AFT the opportunity to scale and develop operations more flexibly. We are pleased to be able to support AFT's journey towards datadriven business." - Janne Anttila, CBO Data & Analytics, Islet Group.
Islet is a full-service provider
Islet Group serves as AFT's Cloud Solution Partner (CSP) for IoT. The collaboration covers the information platform, reporting, analytics, and low-code application development, as well as the maintenance of the overall solution.
"Islet’s team of experts has created a modern and efficient data and analytics platform for us, enabling real-time reporting. Islet's role as a partner and their innovative approach has been crucial in the development and maintenance of the data platform, reporting, analytics, and overall solution. We are very satisfied with our collaboration with Islet and look forward to continuing working with them." – Timo Koivisto, VP, Technology, AFT.
ARCHROMA LAUNCHES CARTASEAL® OGB F10, A SUPERIOR PFAS-FREE BARRIER COATING FOR OIL AND GREASE APPLICATIONS
Archroma, a global leader in specialty chemicals towards sustainable solutions, announces the launch of the latest innovation in their Cartaseal® portfolio, Cartaseal® OGB F10.
Cartaseal® OGB F10 is a superior water-based oil and grease resistant barrier coating that enables papermakers to provide high-quality and sustainable packaging by replacing fluoro based substances and polyethylene with a recyclable and repulpable coating. It is FDA and BfR compliant, making it suitable for the manufacturing of paper and board for food and nonfood contact.
Key features and benefits of Cartaseal® OGB F10 include:
• Superior oil and grease barrier: Offers unparalleled protection against oil and grease, ensuring the integrity and freshness of packaged goods. Its advanced formulation guarantees maximum resistance, providing peace of mind for both manufacturers and consumers.
• Exceptional resistance even when folding: Provides superior oil and grease resistance (OGR) for folding box board and flexible paper packaging application, without compromising on performance.
• Recyclable and repulpable: Facilitates easy recycling and repulping processes, contributing to a more sustainable packaging lifecycle. In addition, as it contains biobased raw materials, Cartaseal® OGB F10 supports brands and papermakers in their journey towards sustainability by minimizing reliance on oil-based substances.
"We are excited to introduce Cartaseal® OGB F10 to the market, our latest barrier solution that addresses key challenges in the packaging industry while upholding our commitment to sustainability," said Sameer Singla, CEO PP&C at Archroma. "With its unmatched oil and grease resistance, exceptional foldability, and sustainability features, Cartaseal® OGB F10 represents a significant advancement in packaging technology, empowering businesses to meet evolving consumer demands while reducing their environmental footprint."
Cartaseal® OGB F10 sets a new standard for packaging excellence, offering a comprehensive solution that prioritizes functionality, sustainability, and performance.
Archroma remains committed to driving innovation and sustainability across the value chain, empowering businesses to embrace greener practices and meet evolving consumer demands.
For information about Cartaseal® OGB F10 and Archroma's comprehensive range of packaging solutions, please visit https://www.archroma.com/innovations/cartaseal-ogbf10

VALMET INTRODUCES SUSTAINABLE LOW-FRICTION DOCTOR BLADES TO REDUCE ENERGY CONSUMPTION AT THE DRYER SECTION OF BOARD AND PAPER MACHINES
Valmet is introducing new low-friction doctor blades to respond to customers’ energy savings and decreased doctor blade usage sustainability requirements. The new low-friction doctor blades are suitable for dryer sections in all paper and board machines regardless of the original equipment manufacturer.
“We are always striving to help our customers diminish their environmental impact with our products. As their name suggests, the new low-friction doctor blades have a low coefficient of friction, leading to significant energy savings at the dryer section. The new blades also contribute to cleaner dryer cylinders and, thanks to increased blade lifetime, to less doctor blade usage,” says Pasi Viitasalo, Global Technology Manager for paper process parts at Valmet.
The new doctor blades are made of epoxy resin with glass and/or carbon glass fiber reinforcements. Special attention in research and development was paid to functional fillers for low friction.
Valmet has conducted a series of successful customer trials with the new blades. “Based on the data given to us by a European customer, the new doctor blades decreased the absolute electric consumption of dryer section electric motors by more than 26%. This results in annual energy savings that are as much as 950 MWh at that mill. When it comes to CO2 emissions, the reduction is 190 ton per year,” says Viitasalo.
Valmet’s doctoring offering includes a complete portfolio of doctor blades, holders and other accessories
Read more about Valmet doctoring solutions: Doctoring solutions for board and paper making
VALMET REACHES A SIGNIFICANT MILESTONE FOR AUTOMATION SYSTEMS BUSINESS BY LAUNCHING VALMET DNAE, THE NEXT GENERATION DISTRIBUTED CONTROL SYSTEM
Valmet is taking process automation further by introducing the next-generation distributed control system (DCS), the Valmet DNAe.
The fully web-based process control system comes with a new cybersecure system architecture, control software and hardware, engineering and analytics tools, helping customers improve efficiency, productivity, sustainability and safety of their operations.
“The new Valmet DNAe represents a major milestone in process automation. It provides a solid platform for moving towards more digitalized, autonomous operations, helping our customers thrive in the changing business environment. In the development of this new system, we have focused on usability and performance, with a modular approach that enables upgrade paths also from our previous system generations,” says Emilia TorttilaMiettinen, President, Automation Systems business line at Valmet.
The launch is a major step in the company’s roadmap for growing its automation business further and in bringing unrivalled future-proof automation solutions to a wide base of process industries globally. With this new system, the company will have an excellent opportunity to continue expanding the footprint of its automation systems business worldwide.
Designed to support the work of all process automation user groups
Valmet DNAe is developed with a design philosophy to empower people to perform and collaborate better across the organization. The system provides a common user interface for controls, analytics, configuration, and maintenance. Intuitive workflows simplify operations and enable users to manage larger process areas with less effort. Advanced analytics tools enable turning real-time and historical data into actionable insights. Additionally, the new web-based configuration environment provides a unified environment for all engineering needs from office to field, enhancing flexibility in configuration and maintenance tasks. These features are designed to increase the operational efficiency of our customers.
A high-performing DCS advancing digitalization and autonomous operations
Valmet DNAe has been engineered for demanding process control, emphasizing performance and availability. The system empowers users to seamlessly run industrial applications on-premise, at the edge server, or in the cloud. It features a scalable redundant data platform, granting easy and controlled access to all data. The system architecture is cybersecure by design, with role-based access control, authentication, audit trail and encryption mechanisms for proactive prevention of cyber threats. With smooth OT/IT (Operational technology / Information technology) connectivity through secure communication interfaces with external systems, Valmet DNAe establishes a robust base for advancing digitalization and autonomous operations.
Step-by-step upgrade paths for cost-efficient system evolution
In alignment with Valmet’s lifetime systems compatibility promise, a leading principle in Valmet DNAe’s development has been to make it easy for Valmet’s existing process automation customers to benefit from the latest technology.
The new Valmet DNAe Distributed Control System shares its web-based user interface, analytics tools, and common hardware with the previous generation of Valmet DNA.
Additionally, Valmet also introduces a new modular controller and a single-channel I/O as new hardware options for Valmet DNAe.
“The lifecycle approach enables flexible step-by-step upgrade paths for a sustainable and cost-efficient system evolution. We have already delivered over 200 new generation user interface upgrade projects to various industries. The first full Valmet DNAe systems have also been successfully delivered to customers. An important part of Valmet's strategy is to cover a wide base of global process industries in the automation business, and with this new system, we will have an excellent opportunity to continue expanding the footprint of our DCS business globally,” says Torttila-Miettinen.
Read more: https://www.valmet.com/automation/control-systems/dnae

ANDRITZ EXPANDS CARBON CAPTURE OFFERING WITH HPC TECHNOLOGY
International technology group ANDRITZ has expanded its technology portfolio for carbon capture through a licensing agreement with US-based Eickmeyer & Associates, Inc.
The cooperation gives ANDRITZ access to Eickmeyer’s hot potassium carbonate (HPC) technology known under the brand name CATACARB®. It complements the technologies used by ANDRITZ to offer complete carbon capture plants to a wide range of industries.
ANDRITZ’s technology portfolio already includes amine-based absorption/desorption and membrane separation. The addition of the state-of-the-art CATACARB process, which has been proven in various applications around the world, will enable ANDRITZ to respond more flexibly to individual customer requirements. Based on its extensive experience in designing flue gas treatment systems, ANDRITZ is well positioned to efficiently integrate carbon capture units into existing and planned flue gas treatment plants.
“We are very pleased to enter into this cooperation with Eickmeyer. Both our companies are committed to advancing carbon capture technologies and helping industries transition to a greener future,” says Harald Reissner, Senior Vice President of Clean Air Technologies at ANDRITZ. “The HPC technology perfectly complements our product portfolio and helps us to serve an even broader customer base with solutions tailored to their needs.”
Gary Buckholz, CEO and President of Eickmeyer & Associates, Inc., adds: “Industries need solutions that enable them to maintain competitive operations in a carbon-constrained world. This partnership will further promote the use of our leading-edge technology that aligns with global sustainability goals.”
VOITH: BIO-BASED SOLARFLOW GREEN SUCTION PRESS ROLL COVER ENSURES MORE SUSTAINABLE PAPER PRODUCTION
With SolarFlow Green, Voith is setting yet another standard for paper manufacturing products made of renewable raw materials. The suction press roll cover is certified according to the internationally recognized DIN CERTCO standard for bio-based products. The cover combines all the advantages of the proven SolarFlow technology while simultaneously reducing the carbon footprint. This innovation is in line with Voith’s long-standing commitment and ambitious goals to promote sustainability in both paper manufacturing and its own production.
SolarFlow Green is a premium polyurethane roll cover and boasts a maximum void volume that remains constant over a long operating period.
“Achieving a high dry content is extremely important to us. Thanks to SolarFlow Green, we were able to implement our customized surface design, resulting in a high void volume and maximum dewatering in the press section. We achieve this using resourcefriendly, sustainable materials. It’s a winning combination for us.” Robin Linney, Palm Paper plant manager at King’s Lynn
The polyurethane material with its biobased component also gives the press roll cover a high degree of stability that can withstand extreme nip conditions. This enables not only fast machine speeds with a high dry content but also low energy consumption at the same time.
“With SolarFlow Green, we are the first manufacturer with the ability to offer our customers a suction press roll cover made of biobased materials that has been certified by DIN CERTCO. We look forward to working together with our customers to make paper production even more sustainable and resource-friendly in the future.” Dr. Christina Bauer, Global Product Manager for Press Roll Covers at Voith
KADANT SOLUTIONS LAUNCHES THE VERIFLEX™ OSCILLATION SYSTEM FOR ROLL CLEANING
Kadant Solutions, a division of Kadant Inc. (NYSE: KAI), announced the launch of the VeriFlex™ oscillation system which provides compact and reliable oscillation for the VeriLite™ roll cleaner assembly. The VeriFlex oscillation system enhances roll cleaning effectiveness and extends blade life in a variety of industrial processing applications.
“Highly effective roll cleaning is critical to performance in industrial applications where installation space is often limited,” stated Marcelo Deboni, applications and product manager for Kadant Solutions. “From our extensive doctoring and roll cleaning experience, we know how much more effective roll cleaning can be when a blade is oscillated. The VeriFlex oscillation system reduces the space requirement of conventional oscillators by use of our proven pneumatic Varimatic™ 500 oscillator along with an innovative flex element design.”
Design simplicity is a key feature of the VeriFlex oscillation system, which uses low-pressure compressed air and eliminates the need for external controls. The addition of the VeriFlex oscillation system provides enhanced roll cleaning through oscillation, particularly in more challenging or critical roll cleaning applications.

KONECRANES LAUNCHES SMART, CONNECTED CRANE: SETTING A NEW STANDARD IN INDUSTRIAL CRANES
Konecranes today launched its flagship Konecranes X-series industrial crane, the successor to its popular CXT model with a new compact design and safe, reliable technology that thanks to its wireless upgrade capabilities can adapt to customer needs now and in the future.
"The new flagship crane builds on a quarter-century of success for the CXT, which was launched in 2000 and to date has sold well over 100,000 units globally," said Jussi Luokomaa, Product Manager, ISE EMEA, Konecranes. "We expect to see good demand for the Konecranes X-series across multiple industries including general manufacturing, making it a core product for the company for years to come."
Connectivity for enhanced performance
The Konecranes X-series stands out not only for its lean, state-of-the-art electrical architecture but also for its connectivity. Designed to be safe, compact and reliable, it can flexibly adjust to future customer requirements, maximizing the investment's value. This adaptability is enabled by smart, connected components, allowing seamless software upgrades "over the air" a first in the standard crane industry.
Customers have the option to initially purchase the crane and easily upgrade to additional Smart Features, enabling seamless incorporation of functionalities as business needs evolve. Additionally, troubleshooting and software updates can be conveniently conducted from floor level, minimizing potential downtime. With a focus on user-friendly design, the crane features a new ergonomic CANMAN radio with an integrated display, providing operators with freedom of movement and essential information at their fingertips, while also offering stepless control for safer and more precise lifting experiences.
Equipped with TRUCONNECT Remote Monitoring, the Konecranes X-series provides vital insights into crane usage and operation. This data, combined with maintenance information, empowers businesses to make informed decisions regarding maintenance schedules, safety and productivity enhancements. This innovation in connectivity underscores Konecranes' commitment to enhancing productivity, reducing downtime, and leading in digital services, reflecting the growing importance of connected equipment in material handling. To date, Konecranes has 53,600 pieces of connected equipment globally.
A great crane needs a great hoist
What further distinguishes the Konecranes X-series crane is the new Konecranes S-series low headroom hoist. This compact hoist features excellent approach dimensions and smooth stepless lifting with a load-dependent lifting motor, enhancing the user experience and reducing cycle times. The use of strong, lightweight, durable synthetic rope improves safety and handling compared to steel wire rope.
Commitment to Sustainability
The X-series shows how Konecranes is shaping next generation material handling for a smarter, safer and better world. Through sustainable design and material choices, such as a more compact and efficient motor and synthetic rope, the X-series drives efficiency improvements. Features like a thrust rocker reduce steel consumption, and an optimized belt drive reduces wear, minimizing the overall environmental impact. The optimized design, with synthetic rope and guide rollers, enhances performance and extends equipment lifespan
while also reducing maintenance needs. Additionally, the implementation of inverter lifting technology ensures precise motor speed control, minimizing energy waste. With the X-series, Konecranes delivers a reliable solution while having an emphasis on sustainability. The Design for Environment (DfE) approach guided product development, aiming to minimize environmental impact throughout the product lifecycle.
A strong focus on customers and commitment to business growth and continuous improvement make Konecranes a material handling industry leader. This is underpinned by investments in digitalization and technology, plus our work to make material flows more efficient with solutions that decarbonize the economy and advance circularity and safety.
Konecranes is now taking orders for the crane and expects the first deliveries to begin in Q4 2024 in Europe, Middle East and Africa, with deliveries in other regions to follow later.
SICK OD7000 PRECISION SENSOR FOR DEMANDING MICRON MEASUREMENTS
Developed for ultra-high precision in the micron range, SICK’s innovative and compact OD7000 displacement sensor reliably measures tiny distances in consumer goods and packaging applications cost-effectively. Comprising a separate controller and sensor head that are both extremely compact, the OD7000 is purpose-built to fit into the tightest machine spaces.
The SICK OD7000 is a 1D laser distance sensor that measures differences in height accurately even on challenging materials. Its tiny light spot precisely targets the object and outputs a precise measurement regardless of the colour or surface material and even measures curved surfaces accurately.
Challenging Applications
The SICK OD7000’s chromatic confocal technology enables highly-precise measurement on a wide range of materials, from black to transparent, diffuse, reflective, and even curved surfaces. The SICK OD7000 can inspect, for example, whether a target object is smooth or is positioned correctly. It can measure holes or check if a material has the desired thickness. Using one sensor head, it can measure up to three very thin layers simultaneously, even if the material is transparent.
It is therefore ideal for precise measurement duties in packaging, food and beverage/consumer goods applications, even for challenging applications such as detecting deviations in thin, embossed films, measuring the thickness of dark-coloured glass, or the thickness of multi-ply toilet and tissue papers.
Meticulous Development
“SICK has worked hard and taken some time to develop the OD7000 meticulously,” explains Nick Hartley, SICK’s UK Product Manager for Distance Measurement. “The result is a highlyprecise instrument that offers manufacturers with some of the most challenging measurement requirements a real opportunity to output precise data, without complicated set-ups or superexpensive equipment.
“Using a 1D laser distance sensor with the performance of the OD7000 enables machine integrations to achieve high levels of material inspection and thickness determination, that might otherwise only be possible with much more expensive equipment.”
Easy to Set up and Install
Two controller types both with EtherNet interface and a choice of 3 sensor heads span measurement ranges of 600μm, 4mm, and 10mm with corresponding resolutions of 25nm, 180nm, and 400nm.
The OD7000’s engineering tool has an easy-to-use graphic interface that allows the user to visualise the installation and configure the controller rapidly, while additional settings are available for more advanced applications. The OD7000 also offers serial RS-232 / RS-422 or Ethernet TCP/IP interfaces as standard.
One of the OD7000’s controllers offers the further cost and space-saving benefit of being able to define an encoder input as a trigger for the output of measurement data, so that a separate encoder is not required as part of the machine set-up. The SICK OD7000 has a 10 kHz maximum sampling frequency, meaning all variants offer the same high performance, enabling stock control to minimise inventories.
PAPERmaking!

CALENDAR OF EVENTS – 2024
PITA TRAINING COURSES
INTERNATIONAL CONFERENCES & EXHIBITIONS
PAPERmaking!
FROM THE PUBLISHERS OF PAPER TECHNOLOGY INTERNATIONAL®
Volume10,Number2,2024
Installations
The following pages contain a summary of the various installations and orders from around the world of papermaking, wood panel and saw mills, and bio-power generation, received between the start of March 2024 and the end of June 2024
The Paper Industry Technical Association (PITA) is an independent organisation which operates for the general benefit of its members – both individual and corporate – dedicated to promoting and improving the technical and scientific knowledge of those working in the UK pulp and paper industry. Formed in 1960, it serves the Industry, both manufacturers and suppliers, by providing a forum for members to meet and network; it organises visits, conferences and training seminars that cover all aspects of papermaking science. It also publishes the prestigious journal Paper Technology International® and the PITA Annual Review, both sent free to members, and a range of other technical publications which include conference proceedings and the acclaimed Essential Guide to Aqueous Coating

COMPANY, SITE
Adara Pakkaus
Valkeakoski
Finland
SUPPLIER
Valmet
Africaine Paper Mills
Rouiba near Algiers
Algeria
Toscotec
To supply a Valmet IQ Warp Control system and an IQ Moisturizer, which is used to correct all kinds of warping, decrease cracking tendency and optimize glue consumption (Corrugator).
To supply new rewinder line to process near 2,800mm width parent reels using two unwind stands; also a complete service package with erection supervision, training, commissioning, and start-up assistance.
Link
Link
Al Dhafra Paper Manufacturing Company
Abu Dhabi
United Arab Emirates
Alkim Kagit Kemalpasa
Izmir
Turkey
Anagren Pack Uzbekistan
Andhra Paper Limited
Kadiyam Mill
Andhra Pradesh
India
Anon
Asia-Pacific region
Valmet
Runtech
Bellmer
To deliver dewatering element ceramics made of wear-resistant material offering long and trouble-free operation and optimized dewatering in the forming section. Link
To deliver a vacuum system rebuild (PM2).
To supply a new white top line, capacity 120tpd, to fit their 4.25m testliner and fluting machine
Link
Link
Valmet
To deliver a new tissue production line. Link
Valmet
To supply both a papermaking line and a paper machine rebuild. One order includes a complete papermaking line from stock preparation to reel and winders, a comprehensive automation solution package as well as spare parts and consumables packages. The other order includes a paper machine rebuild with automation and services. Both will produce uncoated woodfree grades.
Link
COMPANY, SITE
Anon
Kyushu area
Japan
Anon Paper Mill
Germany
Arauco global operations
Arauco
Trupan Chile
Assocarta Italy
Cartiera del Vignaletto Zevio Tissue Mill
Verona
Italy
Cartiera Fornaci Fagnano Olona Italy
Cordenons Italy
Crown Paper Mill
Dammam area
Saudi Arabia
DL E&C Co., Ltd.
Yeosu
South Korea
E.ON
Steven’s Croft biomass power station
Lockerbie
Scotland
SUPPLIER
ABB
PCF Maintenance
Opturion
Sunds Fibertech
ORDER DESCRIPTION
To supply a L&W Autoline with modules to measure Air Permeance, Thickness, Tensile, Burst P Lower and Grammage. The team is also providing two standalone instruments for tensile and tear, and a lab management system (LMS).
To supply two press felt cleaners with moisture and permeability measuring.
To build, commission and support a supply chain optimisation solution, based on its proven optimisation platform.
To supply a complete resin dosing and injection system, including automation and startup.
URL
Link
AFRY
Toscotec
ABB
Sael
Valmet
To define a decarbonisation strategy for the pulp and paper sector that is in line with EU framework, country-specific conditions, and technological advancements.
To supply upgrade of the cogeneration plant and air systems of the mill’s PM4 and PM5.
Placed an order for L&W Autoline paper testing equipment.
To rebuild the coating machine and install a new soft calender, and reconstruct the electrical control system of Coater 2.
To supply an Advantage DCT 200 tissue line, including an extensive automation package, flow control valves and Industrial Internet solutions
Link
Link
Link
Link
Link
Link
Link
Link
BMH Technology Oy
Valmet
To deliver a biomass handling system to a combined heat and power (CHP) plant.
Link
To deliver a boiler rebuild. Link
COMPANY, SITE
Ence
Navia Pulp Biofactory Spain
Five Continents Special Paper Hanchuan
Hubei Province China
GHC
Jinjiang
Quanzhou City China
Göteborg Energi AB Riskulla site
Mölndal Sweden
SUPPLIER
BTG
A.Celli
A.Celli
Valmet
Grigeo Baltwood Lithuania
Sunds Fibertech
Have entered into a comprehensive three-year lifecycle and maintenance agreement to maintain the full functionality of its instruments.
To supply a paper rewinder to process T-paper and highstrength corrugated paper.
Has partnered with Reicofil to integrate a winder, slitter and packaging system into a spunbond nonwoven line supplied by Reicofil.
To provide a 50MW pellet-fired heating plant, which will be integrated into the existing district heating system. The delivery includes a boiler system with wood pellet storage and milling, wood dust dosing, and a flue gas cleaning system featuring Valmet's Bag House Filter and Selective Catalytic Reduction (SCR) system.
To supply a major upgrade of the press in line number two. The installation will include new Columns and sleeves, Cylinder renovation with Pistons, Press table guides, along with the delivery of a new top table and heating platens. The Multi Opening Press Line No.2 has a pressing format of 5’7” x 18’.
Link
Guangxi Xiangsheng
Household Material
Technology Co, Ltd.
Xiangsheng High-End Green
Household Furnishing
Industrial Park China
Siempelkamp
To supply a new super strength particleboard line. The “super strength” feature of the new particleboard line is characterised by the use of elongated flakes in the core layer, which significantly enhances bending strength. This technological advancement will support the production of durable and high-quality particleboards tailored to meet diverse market demands.
Link
Link
Link
Link
Link
COMPANY, SITE
lndah Kiat Pulp & Paper TBK
Karawang
Jawa Barat
Indonesia
SUPPLIER
Andritz
Ittihad Paper Mill
Abu Dhabi
UAE
Valmet
Klabin global WEG
Koskisen
Sawmill
Järvelä
Finland
MiCROTEC
Kuantum Papers Limited
Punjab
India
ORDER DESCRIPTION URL
To supply a complete old corrugated containers line including a reject treatment system with design capacity of 2,000bdmt/d, to process a mixture of OCC, mixed waste and up to 30% American OCC as raw material to produce testliner.
To deliver a comprehensive selection of field services both prior to and during the Ittihad Paper Mill’s annual shutdown. Valmet will perform a machine alignment check as well as inspection and maintenance of several paper machine sections and parts such as Valmet Disc Filter, OptiFlo Gap headbox, Valmet SymBelt Shoe Press Roll, OptiSizer Film, OptiCalender Hard and OptiWin Drum two-drum base winders. Valmet will also be responsible for the planning and management of the shutdown.
To supply an IoT solution for asset management of a paper machine, including intelligent WEGscan sensors, and asset management software WEG Motion Fleet Management (MFM).
To supply a new log sorting line with a multi-sensor scanner that utilizes laser, colour, and X-ray channels to provide a highprecision real 360° shape of the log with a wealth of data for log sorting and cutting optimisation.
Link
Valmet
To deliver a recovery boiler upgrade (for the older of the two boilers). The delivery consists of key pressure parts, such as the lower furnace rebuild and a new economizer replacing the cascade evaporator, new Valmet design airports, liquor guns, and other boiler related auxiliaries and associated systems.
Link
Link
Link
Link
COMPANY, SITE
Lecta
Zaragoza Mill
Spain
Levent Kâğıt ve Tic. A.S. Paper Mill
Kemalpasa
Izmir
Turkey
Lignatherm AG
Küssnacht am Rigi
Switzerland
Middle East Paper Company
Jeddah
Saudi Arabia
Middle East Paper Company
Jeddah
Saudi Arabia
Metsä Group
‘Muoto Production Plant’ Rauma
Finland
Metsä Group
‘Muoto Production Plant’ Rauma
Finland
Metsä Group
‘Muoto Production Plant’ Rauma
Finland
Metsä Group
‘Muoto Production Plant’ Rauma
Finland
Metsä Group
Äänekoski bioproduct mill
Finland
SUPPLIER
Valmet
Runtech
Andritz
AFRY
Voith
A-insinöörit Suunnittelu Ltd
Elomatic
SRV
ORDER
To upgrade the fibreline including a new log feeding system and a Valmet Chip Cutter for wood handling, a cooking modification with Valmet OptiBin solution and Valmet Chip Pumps, a new screening room, an additional washing stage with a new Valmet TwinRoll Press, and an Oxygen Delignification stage modification.
Signed a 5-year care agreement for the vacuum system.
URL
Link
Valmet
Andritz
To supply a pressurised refining system for a new insulation board production plant.
Signed a contract for detailed engineering services and project management consultancy concerning MEPCO’s upcoming paper machine project.
Has signed an engineering and supply contract to manufacture, supply, and supervise the installation of a new containerboard machine (PM5).
Has been selected as the plant construction design partner for the project.
To be the main design partner for the design of the factory structure and facilities and will assist in the cost planning and construction schedule.
To act as project management contractor for the construction project and will also be the engineering design partner for the building services.
To act as process engineer for the fibre product in the project.
To build a demo plant for developing new lignin products.
Link
Link
Link
Link
Link
Link
Link
Link
Link
COMPANY, SITE
Metsä Group
Kemi Finland
Metsä Tissue
Project ”The Future Mill”
Mariestad
Sweden
SUPPLIER ORDER
Fortum Recycling & Waste
Valmet
Moorim Paper
Moorim Ulsan, Moorim Jinju & Moorim Daegu Mills
South Korea
Munksjo Caieiras Ltda
Brazil
Nordic Paper
various sites in Sweden
Norway and Canada
Voith
Runtech
AFRY
Northwood Tissue Ltd.
Chesterfield
Derbyshire
UK
Novopan del Ecuador
Quito
Ecuador
Andritz
Dieffenbacher
Papelera Reyes
Lima Peru
Voith
To dismantle and demolish the old pulp mill which closed in Autumn 2023.
To provide two complete tissue converting lines including packaging solutions; the order follows the earlier announced delivery of a Valmet Advantage DCT 200 tissue making line to the same mill. Both deliveries are part of Metsä Tissue’s expansion and modernisation project “The Future Mill”, aiming at world-class environmental and operational performance.
To supply a range of fabrics and sleeves; the order was placed through the Voith Paper Webshop.
To deliver ropeless tail threading (to offer more fluent and faster tail threading and improved operator safety).
To supply the digital solution AFRY PaperLine to replace the existing production support system with a new MES-system; this includes migration of existing data to the new system and start-up.
To supply a new PrimeDry Hood and an air system for a tissue machine rebuild.
To deliver a new 30MW energy plant equipped with advanced reciprocating grate technology to combust waste wood, including a big crusher and rechipper, both designed to reprocess waste wood for combustion.
To supply clothing for the company’s third tissue paper machine, including the forming fabrics and the press felts.
Link
Link
Link
Link
Link
Link
Link
Link
COMPANY, SITE
Papresa
Errentería Paper Mill
Spain
Papeteries du Cotentin
Orval sur Sienne Mill
Normandy France
Papierfabrik Palm
Aalen & Wörth Mills
Germany
PT. Cikarang Listrindo Tbk
Babelan
Indonesia
PT. Pabrik Kertas Indonesia Surabaya
Indonesia
Roseburg Forest Products
Dillard
Oregon USA
Shandong Jin Tian He Paper Co., Ltd China
Sichuan Fengsheng Paper
Technology
Leshan City
Sichuan province
China
Silvan near Diyarbakir
Southeast Anatolia Region
Türkiye
SUPPLIER
Valmet
Toscotec
Valmet
Valmet
Andritz
IMA Schelling Group
GAW
A.Celli
Andritz
ORDER DESCRIPTION
To deliver a Bale Tester which is a reliable and real-time measuring system for recovered paper, providing an opportunity to reduce operational costs and to improve the recycled fibre line performance. The Valmet Bale Tester measures the moisture and other contaminants, such as plastic and ash of the recovered paper, after which the information is automatically stored in the mill’s database, analysed, and further utilised for optimising the production process
Purchased a steel Yankee dryer and a complete highperformance steam and condensate plant (PM3).
Signed a one-year Performance Agreement to further improve the performance of PM5 and PM6.
To add biomass co-firing to coalfired circulating fluidised bed boiler (power supplier).
To rebuild two existing OCC (old corrugated containers) lines, increasing capacity to increased to 500t/d.
To install automated panel cutting and packaging solution (MDF plant).
To supply coating colour preparation and working stations to the new PM13 for production of food grade folding boxboard.
To supply a Film Size Press and Suction Press Rolls for the new machine (PM1).
To equip this hydropower plant with four 40MW turbines, four generators, associated hydropower plant equipment, and a 154kV switchyard system.
URL
Link
Link
Link
Link
Link
Link
Link
Link
Link
COMPANY, SITE
Sioen Technical Felts
Liège
Belgium
Siteks Sismanlar Tekstil San. ve Tic. A.S
Tekirdag
Turkiye
Södra Cell
Mönsterås Mill
Sweden
Södra Mörrum pulp mill
Sweden
Södra Cell
Värö Pulp Mill
Sweden
Solidus Solutions
Bad Nieuweschans
Netherlands
Stora Enso
Oulu Mill
Finland
Stora Enso Oulu Mill
Finland
Suzano S.A. (site not yet decided)
SUPPLIER
Andritz
Andritz
Valmet
Andritz
ABB
PCF
Caverion
ORDER DESCRIPTION
To add a complete needlepunch line for production of technical fabrics used mainly in industrial applications such as pipe lining (CIPP), acoustics and filtration.
To supply a complete needlepunch line for production of insulation felt products in the automotive and construction sectors.
To deliver a new digester top separator that will lengthen the lifespan of the digester originally installed in 1979.
To upgrade flue gas treatment systems.
To implement optimisation control; delivery includes extended functionality for the ABB Ability™ System 800xA® distributed control system (DCS) through the implementation of advanced process control (APC) for the bleaching process.
To supply one tail cutter with rotating knife.
To deliver work related to process electrics and instrumentation installations; the work is related to the project, where one of the production lines in the Oulu mill is converted into a consumer packaging board line.
URL
Link
Sylvamo
Mogi Guaçu
SP
Brazil
Waraq Paper Manufacturers Dammam
Saudi Arabia
Link
Link
Link
Link
Link
Link
Enersense
Has made an agreement with Andritz Oy for the mechanical installation works of a new debarking line.
Link
Spinnova
Has signed a Letter of Intent (LOI) regarding a potential new production facility for woodbased SPINNOVA® fibre (preliminary capacity 20,000tpy).
Link
Hergen
To supply a rewinder, which will be installed on its PM3.
Link
PCF Maintenance
To deliver three dryer fabric cleaners (PM3), and two dryer cleaners (PM1)
Page 9 of 10 Installations
Link
COMPANY, SITE
SUPPLIER
ORDER DESCRIPTION
URL Wisewoods Co Ltd
Khao Yoi
province of Phetchaburi Thailand
Yueli Machinery Taiwan
Zhejiang Jiding New Material Technology China
Dieffenbacher
To supply a CEBRO MDF plant. Link
PCF
A.Celli
To supply two HP water tail cutters for dryer section.
To supply a paper rewinder to process decoration paper master rolls.
Link
Link
PAPERmaking!
FROM THE PUBLISHERS OF PAPER TECHNOLOGY INTERNATIONAL® Volume10,Number2, 2024
Research Articles
Most journals and magazines devoted to the paper industry contain a mixture of news, features and some technical articles. Very few contain research items, and even fewer of these are peer-reviewed.
This listing contains the most recent articles from three of the remaining specialist English language journals alongside one Korean journal and one Japanese journal, all of which publish original peer-reviewed research:
• IPPITA JOURNAL (Peer-reviewed and other)
• JAPAN TAPPI JOURNAL (English abstract only)
• JOURNAL OF KOREA TAPPI (English abstract only)
• NORDIC PULP & PAPER RESEARCH JOURNAL
• TAPPI JOURNAL
Notes:
1. JAPAN TAPPI JOURNAL is a members-only journal that contains excellent research articles – abstracts are in English but articles are in Japanese.
2. JOURNAL OF KOREA TAPPI is an excellent open-access research journal –abstracts are in English but articles are in Korean.
The Paper Industry Technical Association (PITA) is an independent organisation which operates for the general benefit of its members – both individual and corporate – dedicated to promoting and improving the technical and scientific knowledge of those working in the UK pulp and paper industry. Formed in 1960, it serves the Industry, both manufacturers and suppliers, by providing a forum for members to meet and network; it organises visits, conferences and training seminars that cover all aspects of papermaking science. It also publishes the prestigious journal Paper Technology International® and the PITA Annual Review, both sent free to members, and a range of other technical publications which include conference proceedings and the acclaimed Essential Guide to Aqueous Coating.
IPPTA JOURNAL, Vol.36(1), 2024
1. Achieving New Benchmarks in Field of Energy Efficiency and Sustainability in Pulp & Paper Industry
2. AI-Ml Driven Control Of Effluent Treatment Plants For Sustainable Pulp And Paper Mill Operations
3. Carbon Neutrality And Emissions Reduction
4. Energy Efficiency & Optimization
5. Energy Efficiency in Chilled Water System & Compressed Air System
6. Energy Saving Efforts And Results In TNPL
7. Fostering energy and environment through de-carbonization by agro residue
8. Fostering the future of energy and environment in Seshasayee Paper and Boards Ltd, Unit: Erode
9. Green Energy A Reality For Integrated Pulp And Paper Mill
10. Improvement in Energy Efficiency and Energy Conservation Initiatives at Khanna Paper Mills Limited
11. Innovation in Effluent Colour Reduction and Generation of Vermi Compost from Lignin Sludge
12. Innovative Power Enhancement Scheme In Extraction Condensing Steam Turbines of Cpp In Orient Paper Mills
13. New MCA Generator
14. Ozone Oxidation for brighter Pulp & Blue Water
15. Potassium Hydroxide Pulping of Rice Straw
16. Revolutionizing Green Practices: Role of Bio-Methanation Technology’s Transformative Role in Pulp & Paper Mills for net zero emissions and sustainable future
17. Saving Energy through Synergistic Innovation with Digitalization
18. Significance & Role of Biotechnological Applications in Environmental & Energy Sustainability in Pulp & Paper Industry – An Overview
19. Solutions for a carbon neutral pulp and paper production
20. Sustainable Practices for Environmental Stewardship
21. Trash to Treasure – Bio-Cng from Recycled-Based Paper Mill Waste
22. Valorization of Pulp and Paper Mill Bio-Residues to Biochar for Environmental and Business Sustainability in Totality
JAPAN TAPPI JOURNAL, VOL.78(3), March 2024
Automation Technology and IoT/DX
1. Report of the 47th Automation Technology Seminar
2. Digitization Made Innovative Operation Management ―The Need to Digitize Timeseries in Formation
3. Recent Generator Online Insulation Diagnosis
4. Automated Plant Operation Using AI that Imitates Manual Operation
5. A Small Scale Advanced Control Solution to Utilize Sensors and Analyzers
Topics & Information
6. Case Study:Degitalization of Raw Material Yard Degital Data Utilization and Visualizaiton by BI × IoT Technology
7. DX Brought by Control AI Winner of the Prime Minister’s Award
8. Corporate Profile & Product Information(50)AQUAS CORPORATION Research Report
9. Characteristics of CNF-reinforced PA6 for PBF 3D Printers
JAPAN TAPPI JOURNAL, VOL.78(4), April 2024
1. ‘Mpression Smart Motor Sensor’ Lecture on Predictive Maintenance Solution: Services for Low-voltage Three-phase Cage Induction Motors
2. NDT Assessment of Boiler Pipe’s Wall Thinning Using 3D Scanner: Current Technology and Future Trajectory
3. Paralign Revolutionary Roll Parallelism Measurement Technology, Enables Measurement with Higher Accuracy Than Previously Possible ―Introduction of Roll Parallelism Measurement Technology Using a Laser Ring Gyro
4. Age of Renovation Somay-Q will be Responsible for
5. Traditional and State of the art cost reduction approach in abroad 5th generation automated paper testing machine
6. The latest information of softness measurement by acoustic and stress
7. Performance evaluation of low attracting insects between sunlight type LEDs, high CRI LEDs, and white LEDs.
8. Key Points for Manipulation of Several Data and Effective Measures Concerning with Pest Management
9. Report on the Results of the Fiscal 2023 Follow-up Survey on “JPA’s Carbon Neutrality Action Plan” and Related Information on Measures against Global Warming in the Japanese Paper Industry
10. Creation of polycaprolactone–wood pulp composites and the evaluation of degradability in soil
11. Introduction of Research Laboratories(156)Laboratory of Plant Biomass Chemistry, Faculty of Agriculture, Niigata University
12. Research Report(Original Paper)- Creation of Poly caprolactone-wood Pulp Composites and the Evaluation of Degradability in Soil
13. Pulp and Paper Mills in Japan(105)Ohe Mill, Marusumi Paper Co., Ltd
JAPAN
TAPPI JOURNAL, VOL.78(5), May 2024
Biorefinery and Plastics substitution
1. Pine-based Resin Use in Paper for Sustainability
2. Valmet’s Biorefinery Technologies for Products from Wood-resources towards Decarbonization
3. Effective Treatment of Organic Liquid Waste Such as Shochu Liquid Waste ―Introduction of Miyazaki Model
4. Development of the Bio-Asphalt Mixture Utilizing Kraft Lignin
5. Development of Cellophane Recycling Technology
6. Paper Packaging Materials to Substitute for Film Topics & Information
7. Valmet’s New Recovery Boiler and Effective Utilization of Existing Boilers After New Recovery Boiler Construction
8. Our Efforts to the Energy Plants in the Pulp and Paper Industry
9. Anti-Scaling Technique of Black Liquor Evaporator Using High Power Ultrasonic Technology
10. Confront the Surge in Energy Prices ! An Organizational Approach to Maximize the Value of Factory Energy Management Systems
11. Application of Superheated Steam Drying to Pulp and Paper Industries
12. Research Projects of Universities and Government Research Institutes Research Report
13. Safety Assessment of Bamboo-derived Cellulose Nanofibers in Food for Healthy Adults:A Long-term, Open-label Ingestion Trial
14. Pulp and Paper Mills in Japan(106)Mishima Mill, Tokushu Tokai Paper Co., Ltd.
JOURNAL OF KOREA TAPPI, Vol.56(1), February 2024
1. Determinants of Pulp Producer Prices in Korea: Focused on Exchange Rate and Import Prices
2. Interpretation of Carboxymethylation in Cellulose Pretreatment by 1H-NMR Spectroscopy
3. A Study on Production of Soil Covering Materials Using Waste Paper and Citrus Pomace
4. Manufacturing of Solid Substrates Using Waste Paper Fiber and Biochar
5. Changes in Properties of Various Deep Eutectic Solvents According to Water Mixing Ratio and Temperature Changes
JOURNAL OF KOREA TAPPI, Vol.56(2), April 2024
1. Dynamic Causal Relationship between Imported Pulp and Wood Chip Prices
2. Effect of Mechanical-Chemical Pretreatment at Room Temperature on Properties of Cellulose and Cellulose Solution
3. Preparation of Hydrophobic Cellulose Beads using Cellulose Dissolved in TEAH/Urea Solvent and AKD
4. The Characteristics of Wet-laid Nonwoven Sheet Using Lyocell/Wood Pulp Fibers
5. A Study on the Post-treatments of Citrus Pomace-based Soil Covering Materials for Improving Functional Properties
NORDIC PULP & PAPER RESEARCH JOURNAL, Vol.39(1), 2024
1. Biorefining: Organic acid fractionation of hardwoods planted in social forestry
2. Paper Technology: Effect of fine fibers on secondary fibers and recycled paper
3. Paper Chemistry: Increased recyclability of wet strengthened liquid packaging board, through synergetic effects of combining CMC and PAE – a case study in full scale
4. Packaging: Printable active packaging film with Pelargonium graveolens oil
5. Chemical Technology/Modifications: Water uptake as a fuel for soft actuators from cellulose
6. Miscellaneous: Nanofibers/reduced graphene oxide/polypyrrole for Highperformance electrode material
7. Miscellaneous: Chemical properties, crystallinity, and fiber biometry of Jabon (Anthocephalus cadamba) wood for pulp raw material: the effect of age and position
8. Miscellaneous: Penetration and spreading of graphene oxide ink in rice paper enabling its unique expressiveness in Chinese paintings
NORDIC PULP & PAPER RESEARCH JOURNAL, Vol.39(2), 2024
9. Biorefining: Advances and prospects for adsorption-driven valorization of newspapers using activated carbon: a short review
10. Biorefining: Influence of spent liquor obtained from SO2–ethanol–water (SEW) fractionation of Eucalyptus on drifting sands stabilization
11. Paper Technology: Drying characteristics and thin layer drying model of semimature rice paper
12. Paper Technology: Monitoring solids content development in pilot-scale through air drying of tissue paper
13. Paper Technology: Strength and thermal insulation properties of foam-formed ceramic fiber paper with different reinforcement methods
14. Paper Physics: Heterogeneity characterization of commercial structural papers
15. Paper Chemistry: Production of recycled paper using harmless municipal sludge as a new biomass filler
16. Environmental Impact: Preparation and characterization of nanocellulose acetate and acrylate polymer composite membrane
17. Environmental Impact: Fabrication of modified lignin-based liquid mulching film and its potential application
18. Environmental Impact: Modification of polyvinyl alcohol with 2-hydroxypropionic acid and cross-linking with glutaraldehyde for the preparation of biodegradable mulch paper and its properties
19. Recycling: Research on the brightening effect of miscible wetting additives on fly ash coatings
20. Nanotechnology: Nanofibrillated pulps from Amazonian species as a potential raw material for ecological packaging
21. Chemical Technology/Modifications: Effect of in-situ mineralization of calcium carbonate on the aging resistance of Wikstroemia bast fiber
22. Miscellaneous: Utilization of rice straw for parallel production of sugars rich extract and paper
TAPPI JOURNAL, March 2024
1. Editorial: Special issues in March and May TAPPI Journal focus on the latest pulp manufacture and engineering research
2. Life cycle carbon analysis of packaging products containing nonwood residues: A case study on linerboard and corrugating medium
3. Life cycle carbon analysis of packaging products containing purposely grown nonwood fibers: A case study on the use of switchgrass pulp for linerboard and corrugating medium
4. Effect of high sulfate content on viscosity of recovery boiler molten smelt
5. Effects of varying total titratable alkali and causticizing efficiency targets on kraft pulp mill productivity
6. Factors affecting phosphorus uptake/dissolution during slaking and causticizing
TAPPI JOURNAL, April 2024
1. Editorial: Celebrating an industry giant: Dr. Peter W. Hart
2. A true green cover for industrial waste landfills
3. Characterizing rheological behavior and fluidization of highly refined furnishes
4. Surface modification of TiO2 with MPS and its effects on the wettability and physical properties of Kawayan Kiling (Bambusa vulgaris Schrad ex. Wendl) handsheets
5. Effect of pressure and time on water absorption of coated paperboard based on a modified Cobb test method
TAPPI JOURNAL, May 2024
1. Editorial: Surface energy in printing is the focus of runner-up
2. Remembering Dr. Peter W. Hart: Dedicated leader, mentor, friend
3. Polyvinylamine as a wet-end additive: Effects of pH and anionic contamination
4. Enhancing tissue wet pressing performance and dry end material efficiency for cost savings
5. Z-directional testing of paperboard in combined tensile and compression loading
6. Utilization of Areca leaf residues for sustainable production of greyboard
PAPERmaking!
FROM THE PUBLISHERS OF PAPER TECHNOLOGY INTERNATIONAL®
Volume10,Number2, 2024
Technical Abstracts
The general peer-reviewed scientific and engineering press consists of several thousand journals, conference proceedings and books published annually. In among the multitude of articles, presentations and chapters is a small but select number of items that relate to papermaking, environmental and waste processing, packaging, moulded pulp and wood panel manufacture. The abstracts contained in this report show the most recently published items likely to prove of interest to our readership, arranged as follows:
Page 2
Page 3
Page 4
Page 5
Page 6
Page 7
Page 8
Page 9
Coating Environment
Fillers Moulded Pulp
Nano-Science
Packaging Technology
Paper Chemicals
Papermaking
Pulp Testing
Tissue
Waste Treatment
Wood Panel
The Paper Industry Technical Association (PITA) is an independent organisation which operates for the general benefit of its members – both individual and corporate – dedicated to promoting and improving the technical and scientific knowledge of those working in the UK pulp and paper industry. Formed in 1960, it serves the Industry, both manufacturers and suppliers, by providing a forum for members to meet and network; it organises visits, conferences and training seminars that cover all aspects of papermaking science. It also publishes the prestigious journal Paper Technology International® and the PITA Annual Review, both sent free to members, and a range of other technical publications which include conference proceedings and the acclaimed Essential Guide to Aqueous Coating.
Page 1 of 10
COATING
“Oil- and water-resistant paper coatings: A review”, Sumanta Basak, Milind Shrinivas Dangate & Shanmugha Samy, Progress in Organic Coatings, Vol.186, January 2024, 107938. Paper coatings based on petroleum-based compounds such as fluoro-compounds, polyethylene, and waxes are utilized to alter the properties of paper, such as wettability and oil and water transport. Although such polymers promote surface water resistance, their unfavorable qualities—poor recycling and lack of biodegradability— have led to their decline. However, using such non-renewable and non-biodegradable materials not only poses a threat to the environment and human health but also releases greenhouse gases. In addition, the use of plastic and fossil-fuel-based materials as barrier coatings in paper-based packaging boxes makes recycling difficult, enhancing overall recycling costs and causing environmental concerns about the waste created due to lack of biodegradation. Due to increasing worries about using petroleum-based polymeric packaging compounds and coatings and rising consumer demands for items with nutritive quality and prolonged shelf life, studies on alternative packaging materials are getting more popular. On the other hand, fresh techniques for environmentally friendly coatings may be constructed by employing biological polymers like polyesters, amino acids, and carbohydrates. These biopolymer coatings are powerful oil and water protectors that can substitute chemical-based paper and paperboard coatings. They could also stop inadvertent water transfer in food products. Nevertheless, many biopolymers may encounter challenges during manufacturing due to the material's innate water-holding capacity, crystallinity, and fragility, which precludes their usage in industrial applications. For that reason, it will be preferable to use polymer blends by combining them with other polymers, fillers, and plasticizers to enhance coating efficacy. This review paper will cover a detailed analysis of the water and oil resistance characteristics of several synthetic and naturally occurring polymers and their composites used as paper coatings for food packaging applications. The combination of polymers and their modifications with various agents and fillers can be utilized to build coatings that enhance the water and oil resistance of papers. There are also discussions about different coating techniques and the various solvents used to prepare coating solutions.
ENVIRONMENT
“Sustainable Papermaking in China: Assessing Provincial Economic and Environmental Performance of Pulping Technologies”, Qian-long Han, Hai-long Zhao, Guo-xia Wei, Yu-wen Zhu*, Tong Li, Mao Xu, Xin Guo, Hui-zhen Shi, Yi Lian, & Han-qiao Liu, ACS Sustainable Chem. Eng. 2024, 12(11), 4517–4529. There are 100 million tonnes of carbon emissions from China’s paper industries, which attracts growing interest in their sustainability under the dual-carbon targets. Reasonable technological upgrading, waste paper recycling, and waste resource utilization can positively affect the sustainable development of paper manufacturing. Hence, the environmental and economic performance of paper from four pulping technologies (chemical mechanical, chemical, biomechanical, and waste paper pulping) were analyzed via Life Cycle Assessment (LCA) and Life Cycle Costing (LCC) methods. LCA results show that paper from chemical pulp is optimal, reducing 591.6–1385.7kg CO2 equiv/t compared to others. LCC results indicate paper from biomechanical pulp has the highest economic benefits, with net profits outperforming others by $52.2–84.6/t. Moreover, environmental differences were investigated for papermaking wastes (black liquor (BL) and paper sludge (PS)) management options. The 80% caustic combustion of BL has the best environmental benefits, saving 154.3–331.6 kg of CO2 equiv/t compared to other methods. The production of paperboard from PS is more environmentally friendly, causing 200 kg of CO2 equivalent/t less emissions than landfill. Finally, various waste paper recovery rates (60%,
Page 2 of 10 Technical
70%, and 80%) and technology substitution scenarios were designed from the provincial perspective. The results indicate that the current carbon emissions and energy consumption (CEEC) of paper from wood pulp are 13.51Mt CO2 equiv and 7.05 million GJ, respectively. Based on an 80% recovery rate and the adoption of advanced pulping technologies, the national CEEC can be reduced by 32.4% and 50.06%, respectively. In economic terms, advanced pulping technology application can increase total revenue by 30.2%. With the implementation of the optimal waste management programs, the national CEEC can be reduced by 27.8% and 65.3%, respectively.
FILLERS
“Production of recycled paper using harmless municipal sludge as a new biomass filler”, Hao Sun , Xiyu Chen , Lingjun Wei EMAIL logo , Jieyu Cui , Wanlu Zhang & Longfei Liu, Nordic Pulp & Paper Research Journal, https://doi.org/10.1515/npprj2024-0007. Due to a shortage of resources, exploring new biomass fillers has become critical for paper making. In this study, we reported an eco-friendly strategy for fabricating low-cost and efficient recycled paper with high mechanical properties using corrugated cardboard waste paper and harmless municipal sludge (HMS). First, the characteristics of HMS, including the particle size, pH, specific surface area, organic functional groups and organic component content, were analyzed. Then, the influence of the amount of HMS on the properties of the recycled paper was studied. Finally, the strengthening mechanism of biomass filling recycled paper was discussed. The results showed that HMS, a biomass filler for recycled paper preparation, exhibited excellent physical and chemical properties, with a median particle size of 6.395μm, a surface area of 39.974m2 g−1 and organic functional groups. The tensile index of the recycled paper with 30% HMS was 13.10Nm/g, which was 16.4% greater than that of the unfilled paper and showed better thermal stability. This excellent performance could be attributed to the uniform distribution of HMS on the fiber surface, which improved the accessibility of hydrogen bond formation between fibers. Thus, this study proved that HMS was an excellent biomass filler for producing recycled paper.
MOULDED PULP
“Development of a beverage carton closure cap based on 100% wood pulp fibres”, Gary Chinga-Carrasco, Jost Ruwoldt, Eva Pasquier, Marianne Øksnes Dalheim & Martin K. Wieser, Journal of Cleaner Production, Vol.445, 15 March 2024, 141339. Single-use plastic products have been identified as an environmental challenge. When such products are not recycled, they may end up in nature and thus cause, e.g., marine littering. Thermoformed wood pulp fibre products are gaining more interest to replace fossil plastic products. However, beverage caps made of wood pulp fibres are challenging due to the hygroscopic nature of wood fibres, i.e., they absorb water, deform and loose functionality. Hence, the purpose of this study was to develop a fibre-based beverage cap that could replace plastic tethered cap systems. Both unbleached and bleached Kraft pulp and chemo-thermo-mechanical pulp (CTMP) fibres were tested in thermoforming trials, using tailor-made metal moulds. The results showed that Kraft pulp fibres formed denser structures, with more limited water absorption, compared to CTMP. The mechanical properties of thermoformed specimens were suitable for the application, i.e., the strength, modulus and elongation were between 32 and 36 MPa, 4–4.9 GPa and 1.6–1.9%, respectively, depending on the type of pulp fibre. Additionally, in order to secure that the caps were functional in relevant conditions in contact with liquids (water or milk), the caps were surface modified by silylation and esterification to increase the liquid barrier. The results indicate that surface esterification increased the contact angle to 95°. On the other hand, the surface-modified caps could not entirely limit the liquid absorption over longer
periods of time (>∼1 h) when the caps were directly exposed to liquid. However, the liquid barrier was satisfactory when the products were exposed to increased relative humidity in refrigerated conditions (relative humidity >76% and temperature <7 °C).
“Investigation of a lignocellulose fiber hornification treatment for improving the functionality of apple pomace-based pulp for molded pulp packaging”, Emma Gordy, Jooyeoun Jung & Yanyun Zhao, International Journal of Biological Macromolecules, Vol.263(Pt.1), April 2024, 130265. Transfer molded pulp packaging (TMPP) is a viable alternative to single use plastic packaging. TMPP is typically produced from recycled newspapers, but the availability of this feedstock material is declining. Apple pomace (AP) pulp, primarily composed of cellulose, hemicellulose, lignin, and pectin, can be used as the primary component of TMPP, but its high water retention value (WRV) and separation from other pulps (recycled cardboard (CB) in this study) limits its utilizations in TMPP. A pressing and thermal drying cellulose hornification treatment followed by a repulping step was implemented to reduce pulp WRV and enhance AP and CB fiber entanglements. 11%, 20%, and 25% reductions in WRV were achieved through 1 t-force pressing and drying at 120°C for 2.5, 15, or 27.5min, named mild, medium, and strong hornification treatments, respectively. Increased AP and CB fiber entanglements were observed via microscopy with rising hornification drying times. The medium hornification treatment was identified as the optimal treatment for reducing pulp WRV and reducing pulp separation without decreasing pulp sheet tensile strength. This study introduced and validated a novel processing technique for improved functionality of AP-based pulp for packaging applications.
NANO-SCIENCE
“The effect of pre-treatment and process conditions on the gas barrier properties of fibrillated cellulose films and coatings: A review”, Robyn Hill, Jon Phipps, Richard Greenwood, David Skuse, & Zhenyu Jason Zhang, Carbohydrate Polymers, Vol.337, 1 August 2024, 122085. Microfibrillated cellulose (MFC) is a bio-material produced by disintegrating cellulose fibres into fibrillar components. MFC could offer a sustainable solution to packaging needs since it can form an excellent barrier to oxygen. However, a comprehensive understanding of how MFC characteristics impact barrier properties of MFC films or coatings is required. This article critically reviews how the extent of separation of fibres into fibrils and any resulting changes to the crystallinity and degree of polymerisation of cellulose influences gas barrier properties of MFC films or coatings. Findings from publications investigating the barrier performance of MFC prepared through different processes intending to increase the effectiveness of fibrillation are evaluated and compared. The effects of processing conditions or chemical pre-treatments on barrier properties of MFC films or coatings are then discussed. A comparison of reported results showed that morphology and size polydispersity of the cellulose strongly influence the barrier properties of MFC. However, changing the MFC production process to decrease fibril diameter and polydispersity can result in changes to cellulose crystallinity; reduction in fibril length; introduction of bulky functional groups; or increased fibril surface charge: all of which could have a negative impact on the barrier properties of the final films or coatings.
“A review on the enhancement of circular economy aspects focusing on nanocellulose composites”, Muhammad Adlan Azka, Adib Adam, S.M. Ridzuan, S.M. Sapuan & Abdul Habib, International Journal of Biological Macromolecules, Vol.269(Pt.1), June 2024, 132052. Researchers are now focusing on using the circular economy model to manufacture nanocellulose composites due to growing environmental
issues related to waste management. The circular economy model offers a sustainable solution to the problem by optimizing resource efficiency and waste management by reducing waste, maintaining value over time, minimizing the use of primary resources, and creating closed loops for goods, components, and materials. With the use of the circular economy model, waste, such as industrial, agricultural, and textile waste, is used again to produce new products, which can solve waste management issues and improve resource efficiency. In order to encourage the use of circular economy ideas with a specific focus on nanocellulose composites, this review examines the concept of using circular economy, and explores ways to make nanocellulose composites from different types of waste, such as industrial, agricultural, and textile waste. Furthermore, this review investigates the application of nanocellulose composites across multiple industries. In addition, this review provides researchers useful insights of how circular economics can be applied to the development of nanocellulose composites, which have the goal of creating a flexible and environmentally friendly material that can address waste management issues and optimize resource efficiency.
PACKAGING TECHNOLOGY
“Biodegradable active coating from chitosan/astaxanthin crosslinked with genipin to improve water resistance, moisture and oxygen barrier and mechanical properties of Kraft paper”, Patthrare Inthamat, Thomas Karbowiak, Wirongrong Tongdeesoontorn & Ubonrat Siripatrawan, International Journal of Biological Macromolecules, Vol.254(Pt.2), January 2024, 127816. An active chitosan-based coating with an addition of a natural antioxidant and a natural crosslinker has been applied to improve the performance of Kraft paper. Coatings, including chitosan (CS), CS crosslinked with 1.5% genipin (CS-1.5G), CS containing 1% astaxanthin (CSA) and CSA crosslinked with 1% genipin (CSA-1G) were coated on Kraft paper. Uncoated and coated papers were then evaluated for water content (WC), water vapor permeability (WVP), contact angle, oxygen permeability (OP), tensile strength (TS), bursting strength and elongation at break (EAB). Results indicated that the coating improved the properties of Kraft paper. When compared with CS-coated paper, WC and WVP of CSA-1G-coated paper decreased significantly by 40% and 24%, respectively. The lowest OP was also observed in CSA-1G-coated paper. CSA- and CSA-1G-coated paper had contact angle values >100°, indicating hydrophobic nature of coated paper surface. All coatings largely improved TS of the paper (by 182–224%) whereas CS-1.5G and CSA-1G significantly improved the bursting strength of the paper. The developed genipin-crosslinked chitosanbased coating enriched with astaxanthin can improve the functional properties of Kraft paper and thus will facilitate the usage of the paper for food packaging applications.
PAPER CHEMICALS
“A comprehensive comparison between synthetic and bio-based wet-strength additives for paper manufacturing”, Varsha Singh, Satish Kumar Bachala, Manisha Madan, Arihant Ahuja & Vibhore Kumar Rastogi, Cellulose, Vol.31, 4645–4679, (2024). Wet-strength additives are vital in maintaining the structural integrity of paper and paper-based products in wet conditions. Most wet-strength additives are synthetically produced and pose environmental and human health risks. Therefore, there is a growing interest in developing natural and environment-friendly wet-strength additives for paper. However, the unavoidable replacement of these harmful wet-strength additives with greener materials to achieve similar wet-strength without compromising product performance, with the added option of sustainability, is challenging. This review discusses up-to-date conventional synthetic, natural, and other wet-strength additives used in developing wet-strength in paper-based products. A detailed description of the additive’s
Page 5 of 10
reaction mechanisms and working principles for achieving the required wet-strength is also analyzed. Moreover, a detailed comparative literature review of the physio-chemical properties of these wet-strength additives is also discussed. Finally, the paper also discusses the challenges associated with bio-based additives in improving the wetstrength of paper-based products, comparing the well-established synthetic wet-strength additives.
PAPERMAKING
“Surface Modification of Adsorbents for Removing Microstickies from Papermaking Whitewater”, Kunrui Xu, Wenxuan Mo, Fengshan Zhang, Carl J. Houtman, Jinquan Wan, & Bo Li, Ind. Eng. Chem. Res., 63(17), 7950–7957 (2024). Adhesion and agglomeration of small sticky particles, i.e., microstickies, onto paper and paper machines cause serious problems for recycling mills. Because associations between materials with similar surface energies are strongest, we propose an “adhesives collect stickies” strategy to physically remove microstickies from whitewater systems. We characterized deposits from a commercial paper machine and observed a large amount of acrylate-based materials. Based on this observation, we chose to graft glycidyl methacrylate (GMA) to surfaces of polypropylene (PP) to make it more similar to the deposited stickies, which will encourage association by van der Waals forces and interdiffusion. The modified material efficiently collected acrylic adhesive particles suspended in water (58.3%) and particles found in paper mill whitewater (40.6%). Additionally, a flow cell incorporating layers of modified mats of fibers shows good efficiency (40.6–49.4%) for collecting stickies at steady flow rates. This strategy may provide a method for removing microstickies without disturbing the chemical environment of the papermaking system.
PULP
“Flax biorefining for paper production”, L. Verónica Cabañas-Romero, Oriol Cusola, Carolina Buruaga-Ramiro, Cristina Valls, M. Blanca Roncero & Susana V. Valenzuela, Cellulose, Vol.31, 4497–4508, (2024). In this work, we assessed the potential of Cel6D, a recently reported exocellulase from Paenibacillus barcinonensis, as a biorefining agent for flax pulp. Pulp fibers were treated with this enzyme, Cel9B (an endocellulase previously shown to possess biorefining action) and the two in combination. Samples of biorefined flax pulp were mechanically refined to obtain handsheets. All three biorefining treatments decreased air permeance in the handsheets. Cel9B increased tensile index and folding endurance, and the Cel6D − Cel9B combination increased tensile index and burst index but also resulted in markedly decreased tear index and folding endurance. On the other hand, Cel6D increased tensile index and burst index; also, more importantly, it increased tear resistance, albeit slightly, relative to the other two treatments. The results of this work can be useful to understand the differential effects of exocellulases and endocellulases as biorefining tools and open up new avenues for exploring their use in other biotechnological applications.
TESTING
“Optical measurement of paper moisture content with application in paper pressing”, Hooman Mahdavi, Boris Stoeber & Sheldon Green, Cellulose, Vol.31, 2557–2570, (2024). We present a novel non-contact method for measuring the moisture content of paper. In the method, paper is illuminated obliquely by light from an IR LED, and the light reflected from the paper is imaged by a short-wave infrared (SWIR) camera. Owing to the high absorptivity of liquid water to light in the 1400–1500nm wavelength range, the intensity of light reflected off the paper diminishes sharply with increasing moisture content. We show that for a variety of paper samples (Whatman paper, NBSK,
Page 6 of 10
NBHK, tissue paper) and moisture contents of up to 200%, there is a monotonic relationship between reflectivity and moisture content. This relationship is independent of the wood species used to make the paper, but does differ between wood-based papers and cotton-based papers. As this method involves an optical camera, the spatio-temporal distribution of moisture content in paper can be measured. The method was validated by separately measuring moisture content in paper gravimetrically for both uniform and nonuniform moisture distributions. The measurement technique was applied to a simulated pressing operation where the inferred moisture content distribution changes with the applied pressure.
“Classification Analysis of Copy Papers Using Infrared Spectroscopy and Machine Learning Modeling”, Yong-Ju Lee, Tai-Ju Lee & Hyoung Jin Kim, BioResources, Vol.19(1), p160, (2024). The evaluation and classification of chemical properties in different copypaper products could significantly help address document forgery. This study analyzes the feasibility of utilizing infrared spectroscopy in conjunction with machine learning algorithms for classifying copy-paper products. A dataset comprising 140 infrared spectra of copy-paper samples was collected. The classification models employed in this study include partial least squares-discriminant analysis, support vector machine, and Knearest neighbors. The key findings indicate that a classification model based on the use of attenuated-total-reflection infrared spectroscopy demonstrated good performance, highlighting its potential as a valuable tool in accurately classifying paper products and ensuring assisting in solving criminal cases involving document forgery.
“Alternative methods to evaluate flocculation of particles in papermaking suspensions”, Juan Cecchini, Antti I. Koponen, Olli-Ville Laukkanen & Ari Jäsberg, Proceedings of TAPPICon 2024, April 28-May 1, 2024, Cleveland OH, USA. When dealing with papermaking fibre suspensions, particle aggregation takes place already before the paper web is formed. The particle aggregation depends on several aspects including particle mass concentration (consistency), particle collisions, electrochemical interactions promoted by chemical additives, etc. Due to its importance, fibre suspension aggregation (or flocculation) has been studied for a long time in papermaking, and several methods have been developed for this purpose. The traditional techniques include e.g. Focused Beam Reflectance Microscopy (FBRM) and High-Speed Video Imaging (HSVI). Recently, a new optical method, Optical Coherence Tomography (OCT) has emerged for flocculation and aggregation analysis. The advantages of OCT are the possibility to study opaque suspensions, its micron-level resolution and its high data acquisition speed. OCT measurements can be combined with rheological measurements, allowing simultaneous measurement of both the time evolution of the aggregate size and the suspension viscosity. In this work, we used this approach to study the flocculation of suspensions of various papermaking furnishes. We analyzed the time evolution of the aggregate size and the fibre suspension viscosity when the studied papermaking suspensions were treated with a Highly Refined Furnish (HRF, this furnish contains a significant amount of MFC type fibrils) together with chemical additives. We show how such studies can lead to a better understanding of the impact of flocculation on the produced paper web on such quantities as formation, drainage potential and strength behavior.
TISSUE
“Impact of Air Jet Impingement Technology on the Strength of Tissue Paper”, Reczulski, Mariusz; Pospiech, Piotr; Troszczyńska, Kinga & Bieńkowska, Maria, BioResources, 2024, Vol.19(1), p1190. Impinging air jets can be used to dewater, heat, and dry the web of tissue paper. High velocities of the air jets degrade the paper, and
appropriate adjustments to the jet velocity and the distance of the nozzle from the surface of the wet web are crucial to obtain the highest quality product. This work investigated the correlation between the velocity of the air jet and the strength of paper subjected to the impingement method. Papers with an initial moisture content of 20% and various pulp mixes were tested, and the physical properties of papers were explored. After impinging an air jet, different tensile strength limits were obtained in the machine and cross directions. The paper had lower apparent density and higher roughness compared to classical pressing. The dependence of tensile strength and roughness on the fibers composition also was determined. Increasing the amount of eucalyptus fibers in impingement dewatered paper resulted in a decrease in its tensile strength and roughness. The value of elongation before breaking was the highest for softwood papers after the impingement method. The maximum velocity of an air jet that can be used to dewater or dry paper without the risk of damage to the papers was determined.
WASTE TREATMENT
“Enhancing anaerobic digestion of actual papermaking wastewater with addition of Fenton sludge”, Xianbao Wang, Xiang Li, Yili Xie, Jialu Zhang, Jiarong Ran, Minting Zhang, Lixin Zhang, Anlong Zhang & Chao Zhu, Journal of Water Process Engineering, Vol.63, June 2024, 105520. The effect of Fenton sludge on anaerobic digestion of actual papermaking wastewater was investigated in this study. The results showed the iron in the Fenton sludge primarily exists in the form of needle-like iron oxide (FeOOH) and showed high electron transfer capability. Fenton sludge promoted electron transport in anaerobic digestion and electron transport system activity increased by 59%. Fenton sludge enhanced the metabolic activity of anaerobic microorganisms, especially that of the hydrogenotrophic methanogens, the content of coenzyme F420 increased by 48.9%. Besides, the microbial community structure in anaerobic digestion was affected by Fenton sludge, the quantity of microorganisms increased significantly. The dissimilatory iron-reducing bacteria (Desulfobacterota) and hydrogenotrophic methanogens (Methanobacterium and Methanolinea) were enriched, which promoted the methane production. As a result, the anaerobic digestion performance of papermaking wastewater was promoted significantly by adding Fenton sludge, the organic matter removal efficiency and methane production increased by 11.17% and 15.12%. This study provided an effective solution for the optimisation of anaerobic treatment of actual refractory organic wastewater
“Modeling greenhouse gas emissions from biological wastewater treatment process with experimental verification: A case study of paper mill”, Jiahui Han, Yin Liu, Wenqing Li, Feini Huang, Wenhao Shen, Tianlong Liu, Jean-Pierre Corriou & Panagiotis Seferlis, Science of The Total Environment, Vol.924, 10 May 2024, 171637. Wastewater treatment plants (WWTPs) have been regarded as the main sources of greenhouse gas (GHG) emissions. This study compares the influent characteristics of industrial wastewater represented by the WWTP of paper mill and that of domestic sewage represented by the Benchmark Simulation Model No.1 (BSM1) under stormy weather. The various sources of GHG emissions from the two processes are calculated, and the contribution of each source to the total GHG emissions is assessed. Firstly, based on the mass balance analysis and the recognized emission factors, a GHG emission calculation model was established for the on-site and off-site GHG emission sources from the WWTP of paper mill. Simultaneously, a GHG emission experimental model was established by determining the dissolved concentrations of carbon dioxide (CO2) and nitrous oxide (N2O) in the papermaking wastewater, to verify the accuracy of the developed GHG calculation model. Subsequently, an optimum aeration rate for the paper mill was investigated to
Page 8 of 10 Technical
comply with the discharging norms. Under the optimum aeration rate of 10h−1, the obtained calculation accuracies of CO2 and N2O emissions were 94.6% and 91.1%, respectively. The mean total GHG emission in the WWTP of paper mill was 550kg CO2eq·h−1, of which 44.6% came from the on-site emission sources and 55.4% from the offsite emission sources. It was also uncovered that the electrical consumption for aeration was the largest contributor to the total GHG emissions with a proportion of 25.2%, revealing that the control strategy of the aeration rate is highly significant in reducing GHG emissions in WWTP of paper mills
WOOD PANEL
“Characterization of randomly oriented strand boards manufactured from juvenile wood of underutilized wood species”, Tomáš Pipíška, Marek Nociar, Pavel Král, Jozef Ráheľ, Pavlo Bekhta, Roman Réh, Ľuboš Krišťák, Miroslav Jopek, Barbora Pijáková, Rupert Wimmer & Milan Šernek, European Journal of Wood and Wood Products, (2024). The wood-based panel industry in Europe, which is dominated by the use of Norway spruce, will face new challenges due to environmental changes and the bark-beetle calamity, which started a new era of forestry. To explore the possibility of replacing spruce with other wood species, juvenile wood of nine underutilized wood species (Scots pine, European larch, poplar, willow, alder, birch, European beech, English oak and hornbeam) were used to make randomly oriented strand boards (OSBs). Singlelayer OSBs were produced with 3% pMDI resin and 0.5% wax. Standard physical and mechanical properties were measured. The bending strength (MOR) values showed that there was no statistically significant difference between the values for, on the one hand, spruce (34.6MPa) and, on the other, larch (25.9MPa), poplar (25.2MPa), willow (27.8MPa), alder (34.3MPa) or birch (27.1MPa). A similar trend was found for the boards modulus of elasticity (MOE). The highest MOE values of 5,185MPa and 4,472MPa were found for spruce and alder, respectively. There was no significant difference between spruce and other wood species in internal bond strength. Boards made from high-density wood species showed better physical performance, whereas those made from low-density wood species (except pine) gave better mechanical properties. Strand-generalized characteristics, such as the slenderness ratio and specific surface, were analyzed for all investigated physical and mechanical properties. European larch, poplar, willow, and alder are potential wood species for manufacturing OSBs in future without mixing species, as they can replace spruce in the wood-based panel industry
“Sensitivity study of measured wooden board thermal properties on solid heat transfer model predictions”, Vojtěch Šálek, Lucie Hasalová, Vojtěch Štejfa, Adam Pivák, Petr Hejtmánek, Jiří Ira & Milan Jahoda, FireSafetyJournal, Vol.143, February 2024, 104055. This work presents experimental investigation on specific heat capacity and thermal conductivity as a function of temperature and vertical density profile over the sample cross section of oriented strand board, particle board, medium density fibreboard, and plywood. A possibility of introducing an universal set of parameters describing various EWPs by averaging the parameters of the four studied materials obtained in this work is investigated. A one-dimensional heat transfer simulation sensitivity study is performed using the experimentally measured values. The study aims to investigate the effect of using spatial- and temperature-dependent properties compared to constant values and to study the importance of these parameters and their combination in predicting onedimensional heat transfer below the thermal decomposition temperature of engineered wood products.
“Life cycle assessment of wood-based panels: A review”, Daniele Costa, João Serra, Paula Quinteiro & Ana Cláudia Dias, Journal of Cleaner Production, Vol.444, 10 March 2024, 140955. Wood-based panels are products used in various applications with the potential to replace energy-intensive materials while promoting carbon sequestration. This article aims to systematically review the scientific literature assessing the impacts of wood-based panel manufacturing from a life cycle perspective. It intends to identify different methodological choices and challenges, compare impacts on the climate change impact category and provide recommendations for future assessments. The reviewed articles were identified using search strings in the Web of Science and Scopus databases, focusing on the different wood-based panel sub-types (veneer sheets, plywood, particleboard or chipboard, fibreboard). In total, 53 articles were selected for qualitative and 36 for quantitative synthesis. Most articles were published in the United States of America, Spain, Brazil or China, which are among the largest wood-based panel producers. This study's assessment shows that the published articles' methodological choices varied widely, specifically concerning the functional unit, system boundaries, procedures to deal with multifunctionality, biogenic carbon modelling and impact assessment methods. Further, its quantitative synthesis reveals considerable variability in the results, even within the same panel subtype. Laminated veneer lumber tends to be the least carbon-intensive wood-based panel. However, a lack of uniformity in previous articles' methodological choices precludes comparisons of results. For this reason, elaborating Product Environmental Footprint Category Rules (PEFCR) for wood-based panels to harmonize methodological choices is critical for obtaining comparable results regarding multiple environmental impact categories.
“Enhancing oriented strand board performance using wheat straw for eco-friendly construction”, Hani Abobakr, Marya Raji, Hamid Essabir, Mohammed Ouadi Bensalah, Rachid Bouhfid & Abou el kacem Qaiss, Construction and Building Materials, Vol.417, 23 February 2024, 135135. Wheat straw is an abundant and cheap agricultural by-product. This research aims to produce an outperform-oriented strand board utilizing wheat straw for sustainable construction. The produced rectangular specimens via the compression molding process were tested in terms of mechanical, hygroscopic, morphological, and sound isolation performances. The results compared to the commercial (OSB) EN 300: 2006 standard showed excellent mechanical properties in wheat straw-based panels with a density of 0.60g.cm−3, with a remarkable 44.61% increase in flexural strength and 42.2% improvement in Young's modulus over woodbased OSB. Taking into consideration the hygroscopic properties, wheat straw-based boards showed superior swelling resistance, with WS-OSB-0.45 leading the way with a 23% reduction compared to commercial OSB. Water absorption was inversely related to density, with WS-OSB-0.60 reducing water absorption by 8.9% compared to commercial OSB. The contact angle measurements showed that wheat straw-based panels (WS-OSB0.60 at 106° and WS-OSB-0.45 at 100.4°) had more hydrophobic surfaces than commercial OSB (88.1°). The wheat straw-based OSB panels, especially WS-OSB-0.45, achieved remarkable sound reduction, with an overall sound reduction value of 35.2dB, outperforming WS-OSB-0.6 (34.9dB) and commercial OSB (34dB). These results demonstrate the viability of using wheat straw residues as an environmentally friendly alternative to wood in the production of panels for building, furniture manufacturing, and equipment packaging applications.