Using the latest available data, this quarterly update offers insight into Philadelphia’s labor market, industry mix, and economic development.
In 2018, Philadelphia’s institutional and community leaders collaborated to develop a comprehensive workforcedevelopment strategy. This document, Fueling Philadelphia’s Talent Engine, calls on Philadelphia Works, Inc. to serve as the city’s hub of labor market and economic reporting and analysis. Under this mandate, this quarterly report provides insight into key measures of economic activity, providing leaders across public and private institutions an easy-to-access update on how Philadelphia’s economy and labor forcecontinue to evolve.

For more insight into Philadelphia’s labor force, economic characteristics, and the ongoing recovery from the COVID-19 employment crisis, visit the Philadelphia Works website.
“Continued economic growth is critical to the future of our city and region, and is dependent upon a strong, skilled workforce.” Fueling Philadelphia’s Talent Engine
By the end of 2023, Philadelphia’s economy has emerged from the COVID19 pandemic tasked with navigating the “new normal”. While overall employment has recovered at or beyond pre-COVID levels in most industries, Philadelphia business leaders & residents have been navigating economic uncertainty surrounding inflation, rising interest rates, and labor shortages and economic activity continues. While inflation has largely cooled since last summer with minimal upticks in unemployment,
• The unemployment rate hit a record low of 3.7% in December 2023 in Philadelphia, with a coinciding record low in total unemployed. Over the fourth quarter of 2023 the total number of unemployed Philadelphians fell by roughly 4,500, while the total number of employed decreased by about 1,700.
• As a result of the changes in total employed and unemployed, the overall labor force fell by roughly 6,200 over the duration of the fourth quarter. However, as of December 2023, the labor force was still at a year-over-year positive.
• Inflation as measured by the year-over-year change in CPI stood at 3.9% in Philadelphia as of December 2023, higher than that of the United States (3.3%).
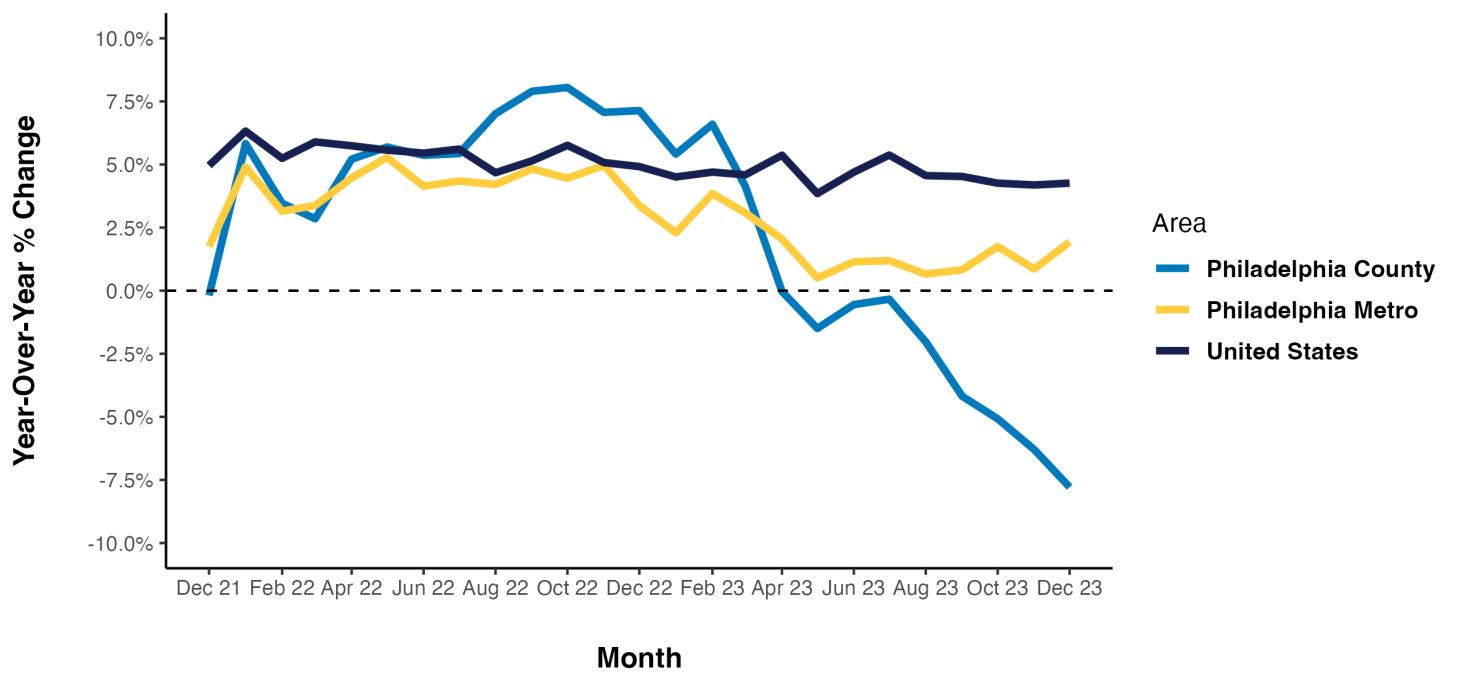
• Average hourly wages of private employed in Philadelphia County fell at a rate of -6.2% in Philadelphia County as of December 2023. Utilizing average hourly wages as a measurement of wage growth, Philadelphia County has seen a decline in year-over-year growth rates compared to the overall metro area and united States.


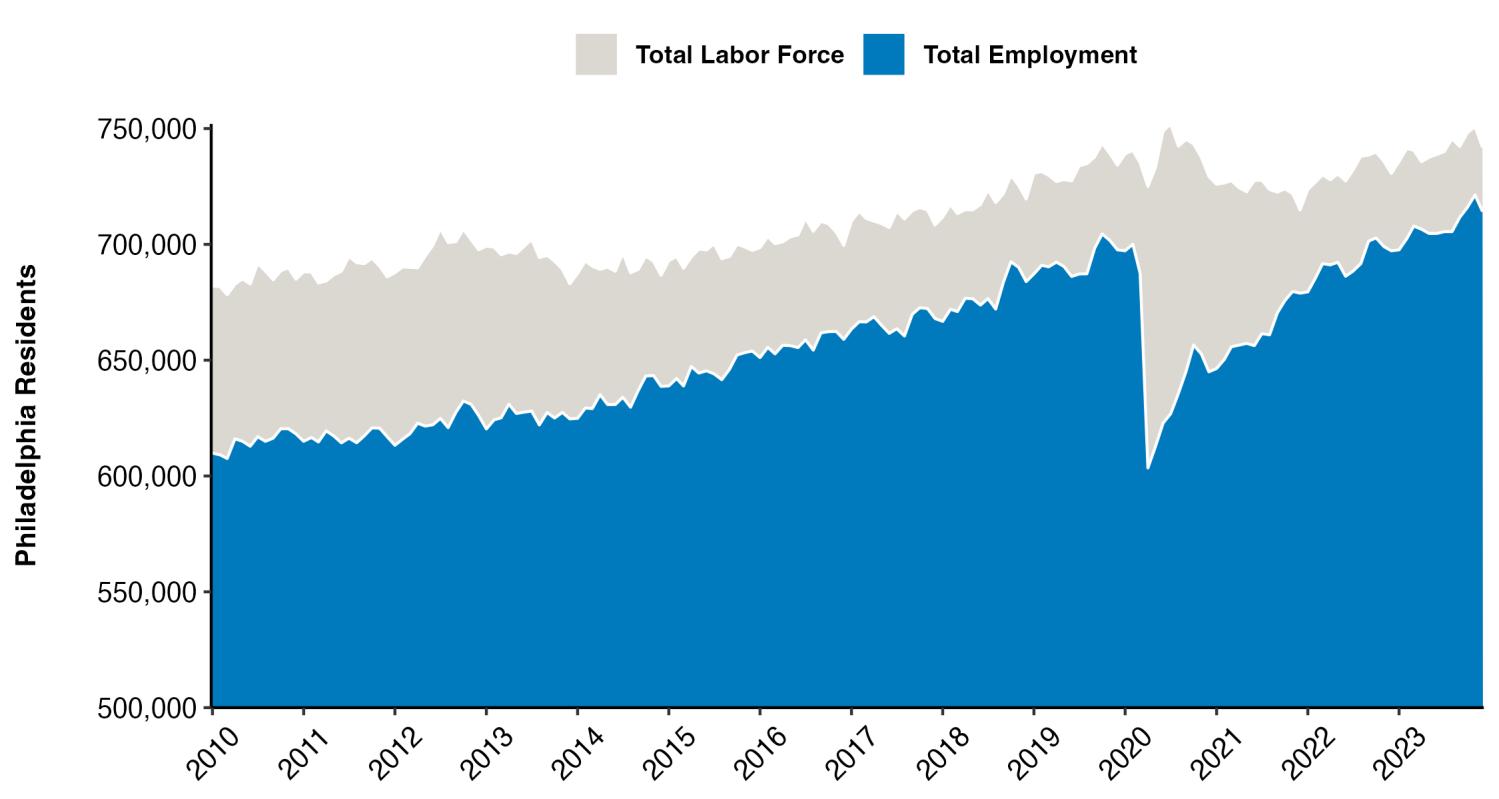
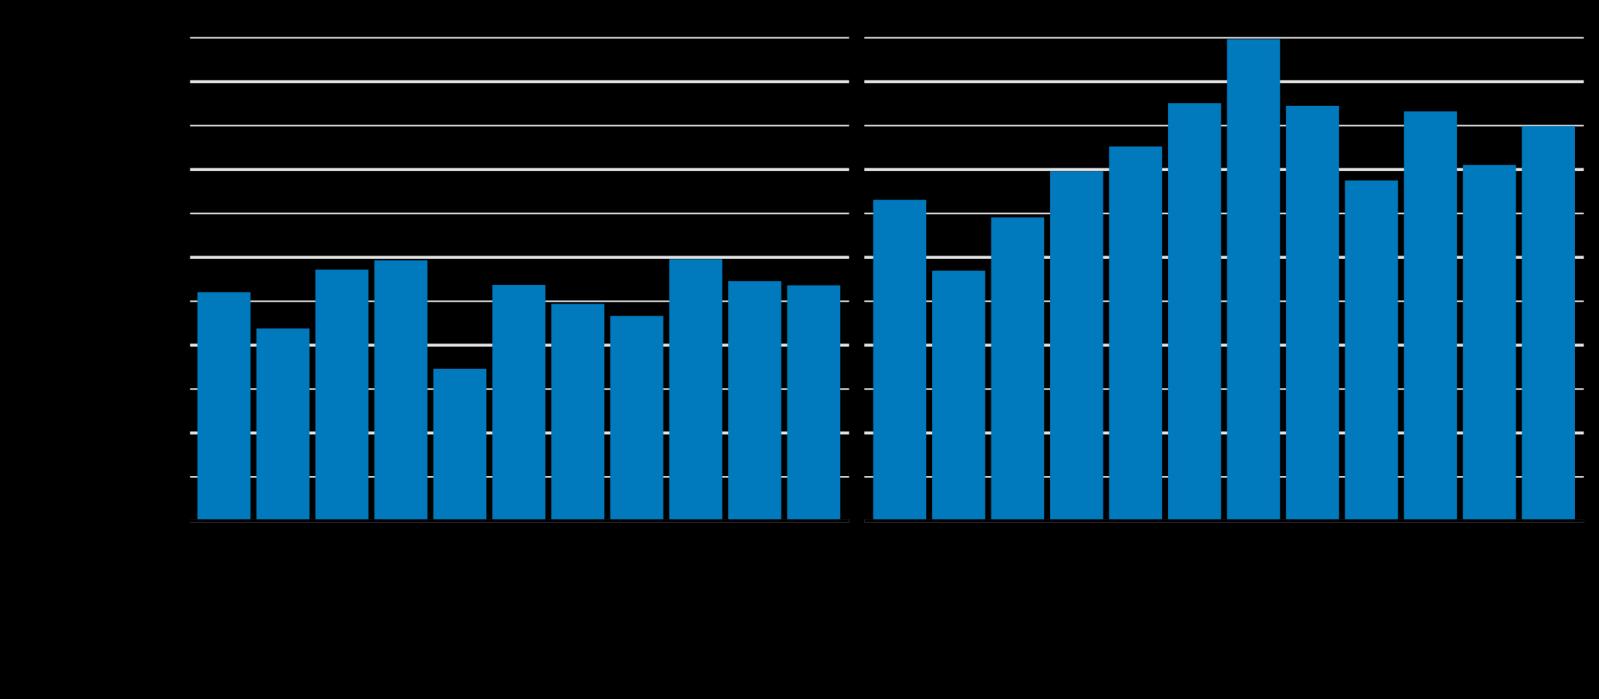
Over the past decade, employment in Philadelphia has witnessed strong growth. By February 2020, the total number of employed Philadelphians had grown by more than 120,000 individuals – a more than 15% increase –since 2010.
In recent months, Philadelphia County has seen a strong growth in the overall labor force size as well as the total number of employed individuals. In December 2023, the preliminary unemployment rate hit a record low of 3.7%, continuing its trend down throughout 2023.
In the final quarter of 2023, Philadelphia saw its total number of employed residents grow by about 1,700, as the total number of unemployed fell to a record-low of roughly 27,670.

3.7%
December 2023
Unemployment Rate City of Philadelphia

741,830
December 2023
Estimated Total Labor Force City of Philadelphia +11,230 year-over-year

Since the start of 2022, the overall unemployment rate in Philadelphia has experience a downward trend. By December 2023, the unemployment rate was almost a percentage point below that of December 2022.
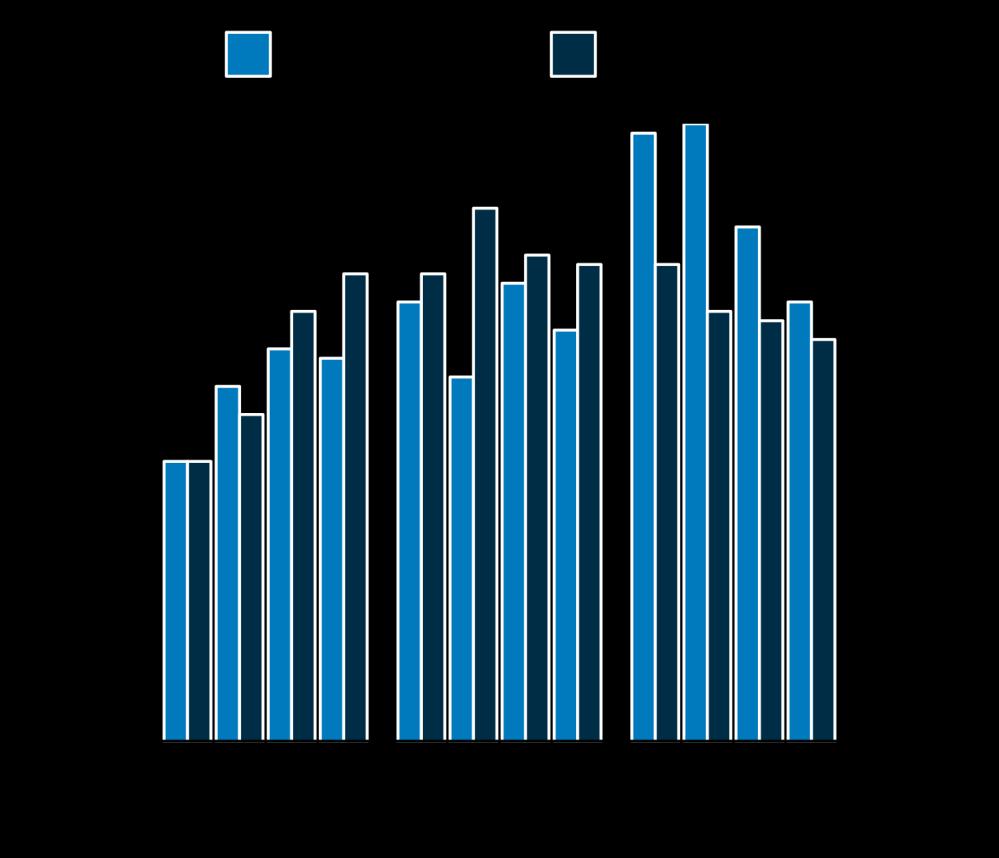
Even with inflation concerns that emerged in the post-COVID economy, relative employment in the last five years has been strong in Philadelphia County. As of December 2023, the total number of employed Philadelphia sat at 7.1% higher than that of January 2018, compared to 5.2% in the United States and just 3.3% in Pennsylvania.
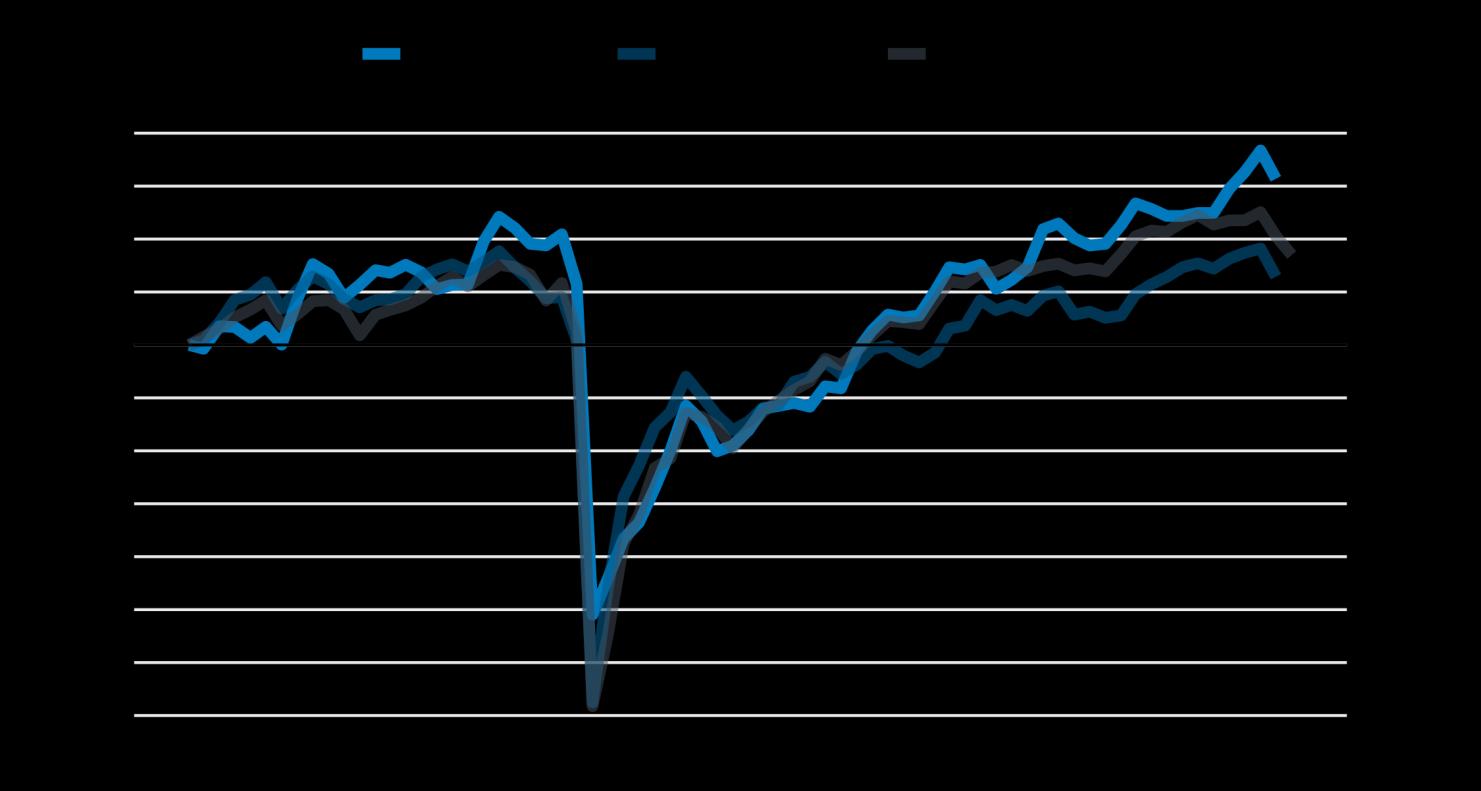
Relative to other large cities, Philadelphia’s regional economy has proven to be resilient. Philadelphia is one of four top metros to have maintained positive job growth in both the last year and since pre-pandemic levels.
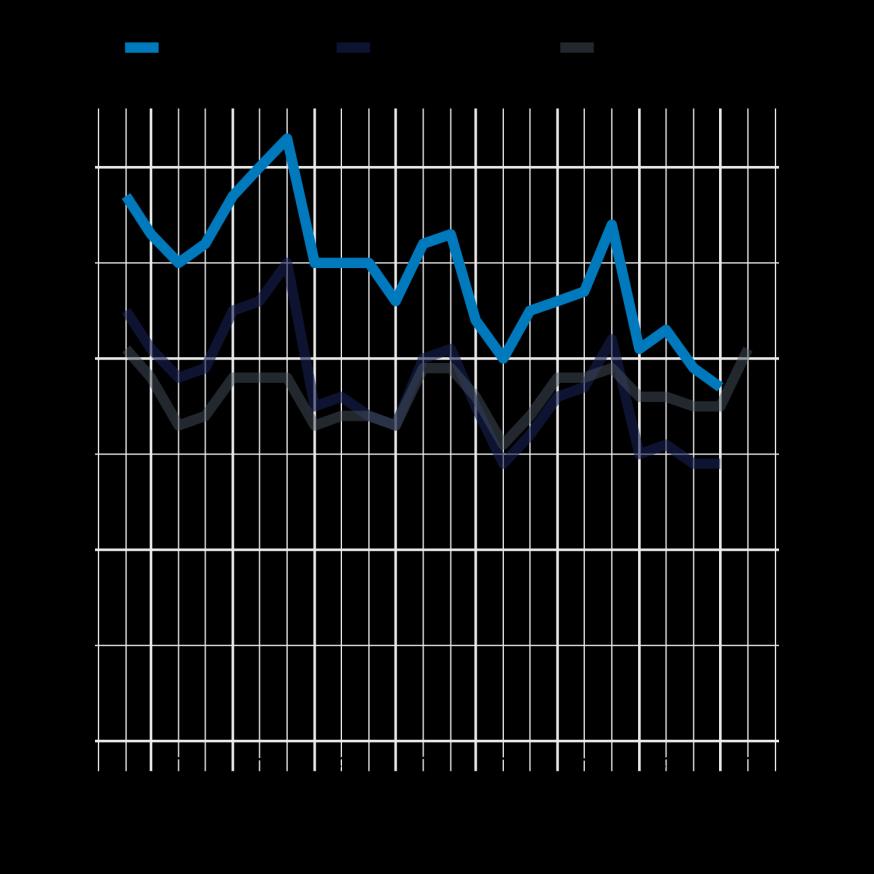
Following trends in Philadelphia’s official unemployment rate, Pennsylvania CWDS data suggests a recent uptick in initial unemployment claims. In the third quarter of 2023, there were roughly 14,500 initial unemployment claims, up from roughly 13,200 in the second quarter of 2022. In addition, third quarter unemployment claims totals stood at only about 7,500 in 2022.

Home Health Aides
Security Guards
Warehouse Workers
Customer Service Representatives
Cashiers
Stock

5%
52%
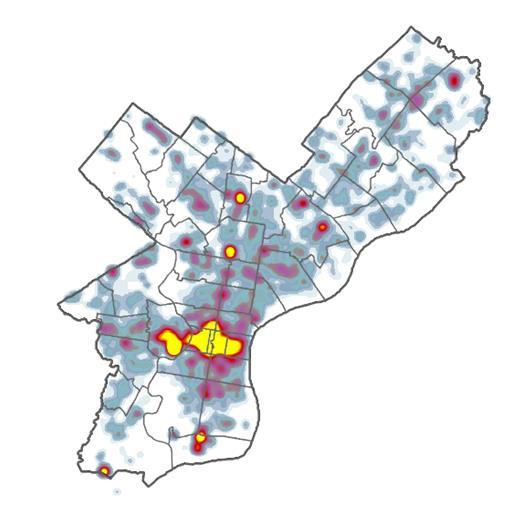
Over 50% of all Philadelphia businesses employ fewer than 5 workers. However, these firms make up just 5% of the city’s total employment. In the last year, businesses staffing between 500-999 employees saw by far the strongest growth.
74%
Of employment declines were concentrated among occupations with median wages lower than $25 per hour.
60%
Of employment declines were among occupations typically requiring no formal educational credential.
During the recovery from the Great Recession, occupational growth in Philadelphia was highly bifurcated by wage and education. Gains were concentrated among low- and highpaying opportunities, following a national pattern of growing income inequality. Declines in lower education and lower wage occupations were sharp, but have evened out.

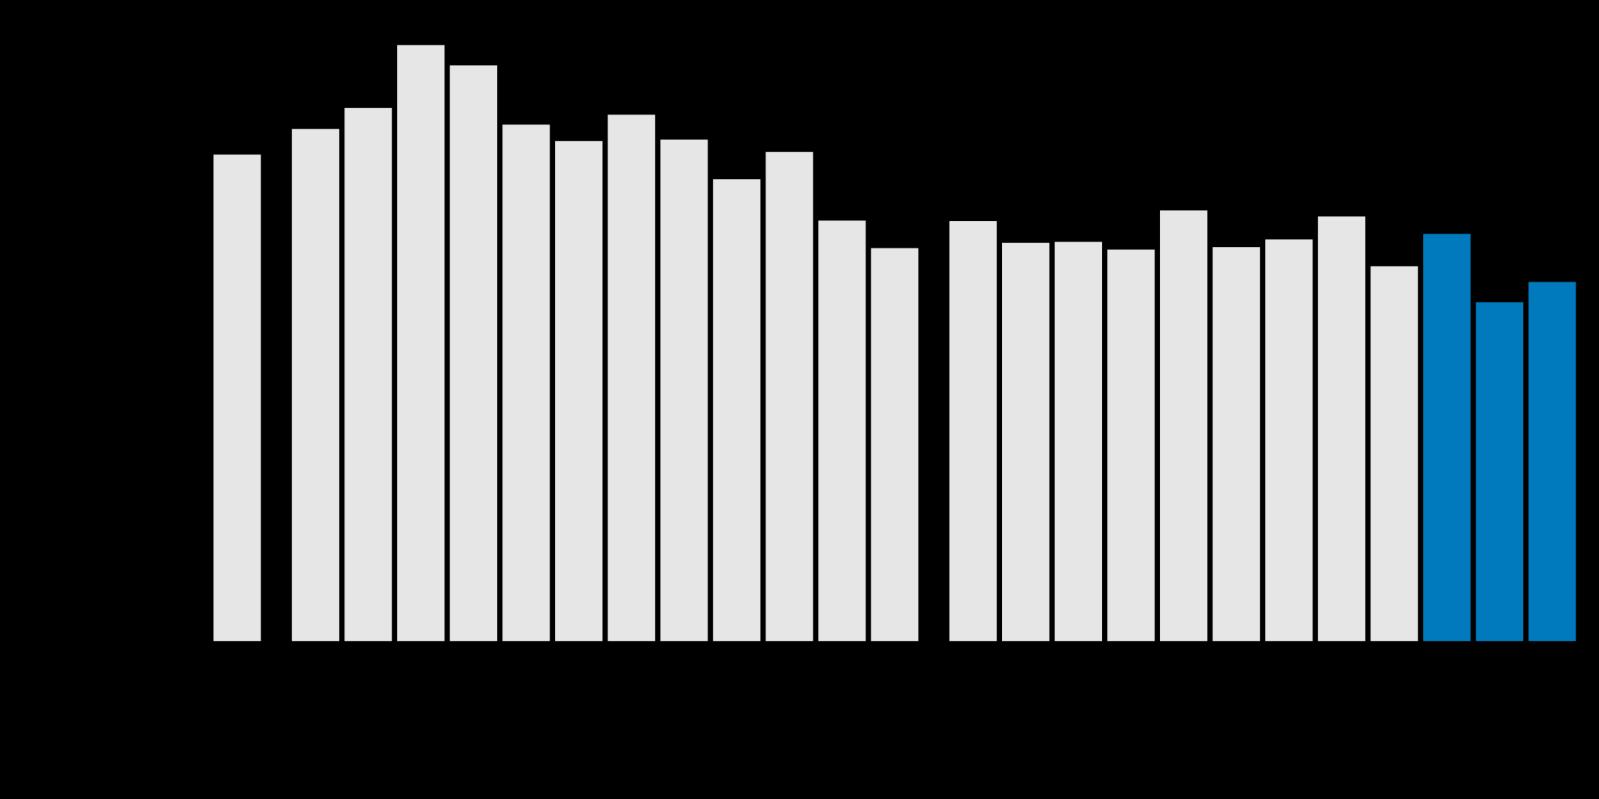
Philadelphia employers have shown recovering demand for labor over the last two years. However, this quarter saw a decline in job postings, following national trends of dampened demand.
Lightcast scrapes local job postings to provide data on employer demand based on occupation, industry, and a variety of other details. According to the latest estimates, the total number of job postings in Philadelphia cooled in the third quarter of 2023. Postings had remained strong over much of 2022 despite persistent inflation, with the expected seasonal fluctuations.
45,910
Unique Job Postings this Quarter
-3,970
Change in Total Postings Over Previous Quarter
University of Pennsylvania
Penn Medicine
Temple University Health System
City of Philadelphia
UnitedHealth Group
Children’s Hospital of Philadelphia
Comcast
The Judge Group
Allied Universal
Registered Nurse (RN)
Driver’s License
Basic Life Support (BLS)
Board Certified/Board Eligible
Licensed Practical Nurse (LPN)
Basic Cardiac Life Support

Project Management
Nursing
Marketing
Auditing
Accounting
Finance
Data Analysis
Underwriting


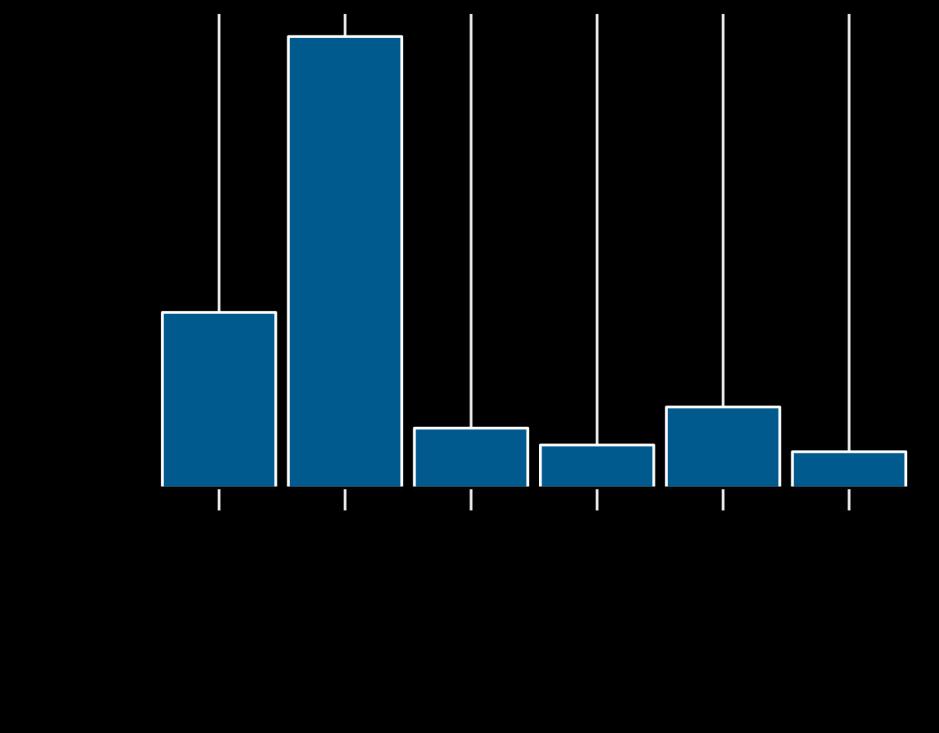
Statewide*, Leisure and Hospitality stands apart as having the strongest year-over-year wage growth as of August 2023, whereas Educational and Health Services and Trade and Transportation continue to rank bottom in terms of year-over-year growth.
However, overall private wage growth in Philadelphia County has slowed this summer, suggesting the Fed’s efforts to calm inflation with interest rates has worked.
The Employment Const Index (ECI), a measure the cost of labor that utilizes both salaries and benefits, has cooled to levels comparable to 2021 in the United States. However, the ECI in Philadelphia has rose sharply, to record high levels.
When analyzing inflation, a rising ECI may be considered a source of inflationary pressure. Rising labor costs may be passed along to the consumer in the form of price increases, but this is not always the case.
Like the United States, Philadelphia battled record high inflation in the summer of 2022. Since the start of 2023, however, overall inflation as measured by the Consumer Price Index (CPI) has cooled in both Philadelphia and the United States.
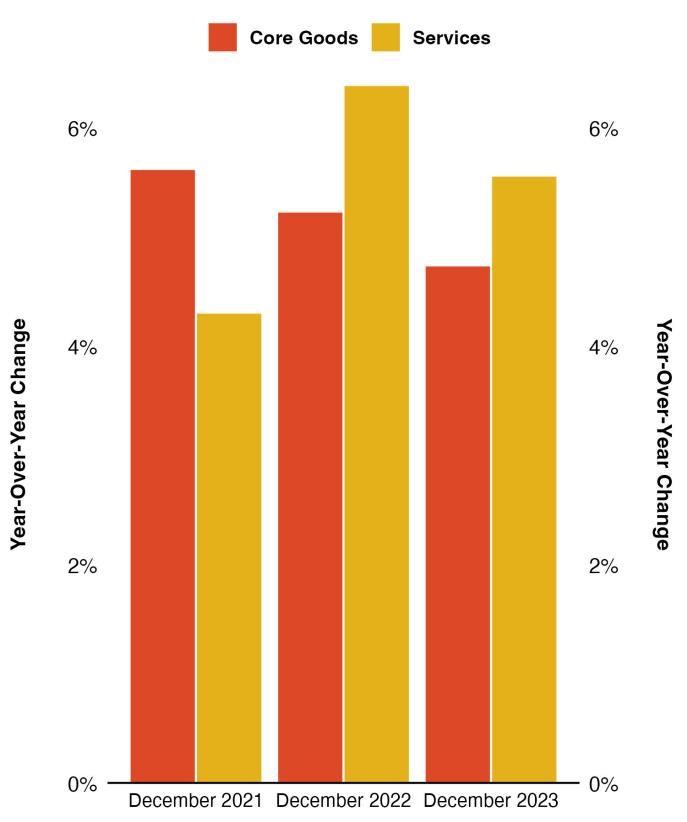
Beyond the CPI, economists can separate inflation between core goods and services to better understand inflation’s impact. In the Philadelphia metro area, there was a rotation between core and goods inflation between 2021 and 2022, where services inflation rose sharply to overcome core goods. While services inflation remained above core goods in 2023, they both cooled from last summer’s readings.

While Philadelphia’s labor force has grown in recent years, employment outcomesvary by race, ethnicity, and educational attainment.
Using data available from the American Community Survey, this section presents the demographic characteristics of Philadelphia’s workforce. These figures represent individuals living in Philadelphia, regardless of where they work.
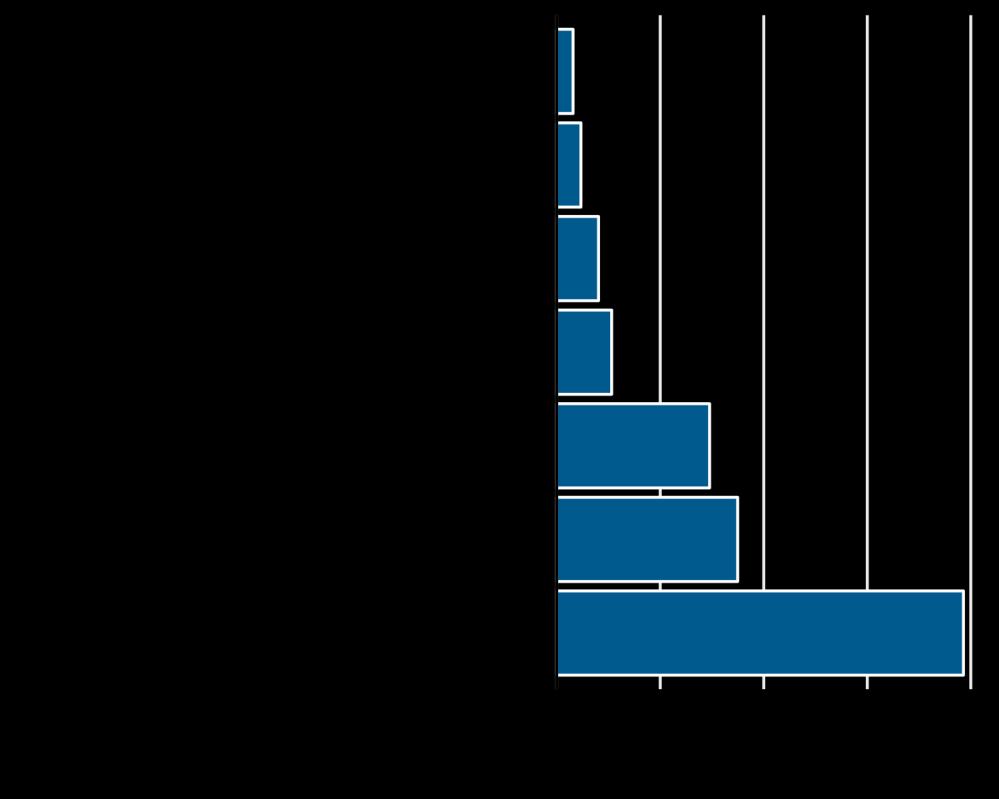
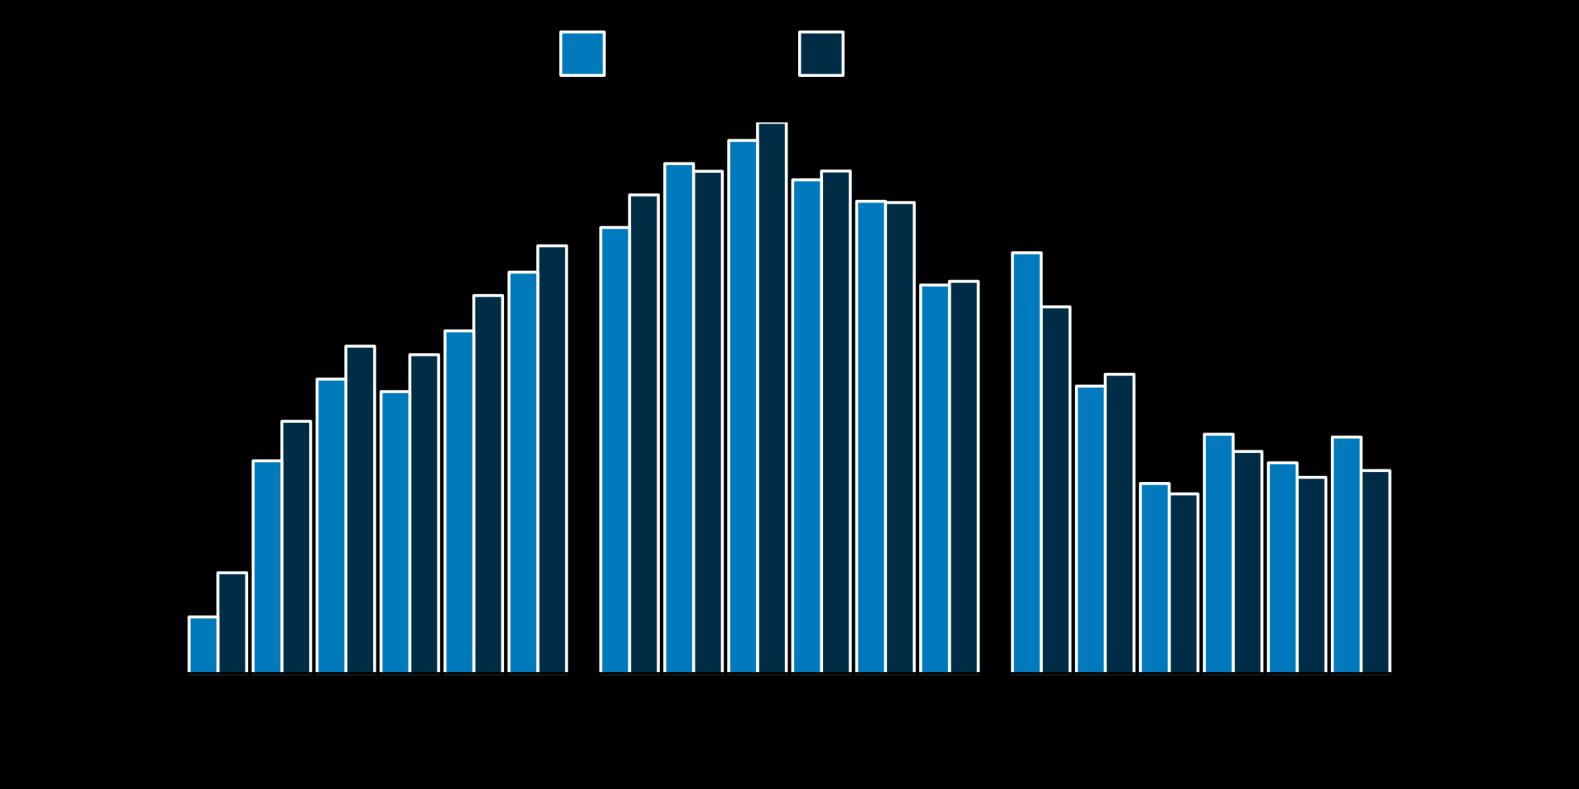
By age and binary sex, individuals between the ages of 25 and 34 make up the largest portions of Philadelphia’s population and labor force. For both men and women, labor force participation among these age cohorts is between 80% and 87%, higher than the overall rate.
Long-term growth in the city’s labor force has been driven by an increase in participation among women and an increase in population among individuals 25 to 34.Again, these figures represent Philadelphia residents and therefore do not capture workers commuting into the city, a demographic that is much more likely to be older.
65+ years
60 to 64 years
55 to 59 years
45 to 54 years
35 to 44 years
30 to 34 years
25 to 29 years
20 to 24 years
19 to 19 years
Among American Indian, Asian, Black and African American, and Hispanic or Latino residents, labor force participation was much lower, and unemployment was much higher, than for their white peers.
60% Labor Force Participation Rate Among Black and African American Philadelphians in 2022
By educational attainment, individuals with less than a bachelor’s degree are more likely to be unemployed and less likely to participate in the labor force. For those with less than a high school diploma, employment outcomes are significantly worse.
53%
Labor Force Participation Rate Among Philadelphians with less than a High School Diploma in 2022
While Philadelphia has seen great improvements in educational attainment over the past decade, more work is needed to both upskill residents for available opportunities and ensure that lower-skilled employment opportunities are high-quality. Source: Philadelphia Works Analysis of the ACS, US Census Bureau
Philadelphia is intrinsically connected to its suburban neighbors. Nearly half of all primary jobs in the city are held by workers that commute from outside the city limits.
Commuting patterns have greatly changed in the years since COVID-19, however Census LODES data for 2021 is yet to be released.
Notably, according to 2021 ACS 5-year estimates, Philadelphians are utilizing public transit at a rate still much lower than pre-COVID.

340,000 Commute In
400,000 Live and Work in Philadelphia
15% Of Resident Workers Relied on Public Transportation in 2021
17% Of Resident Workers Had No Access to a Vehicle in 2021

266,000 Commute Out

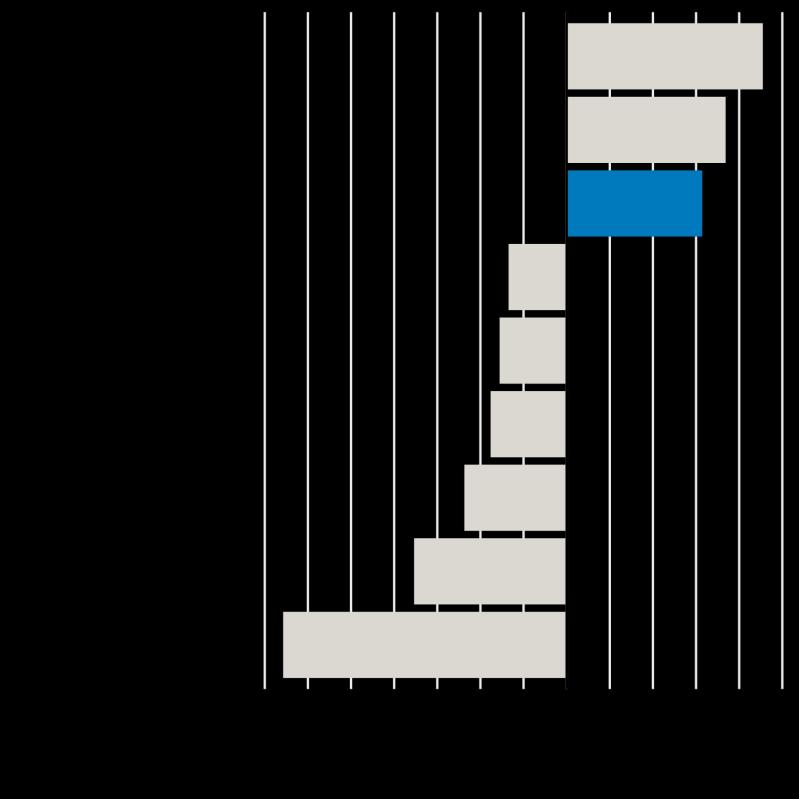
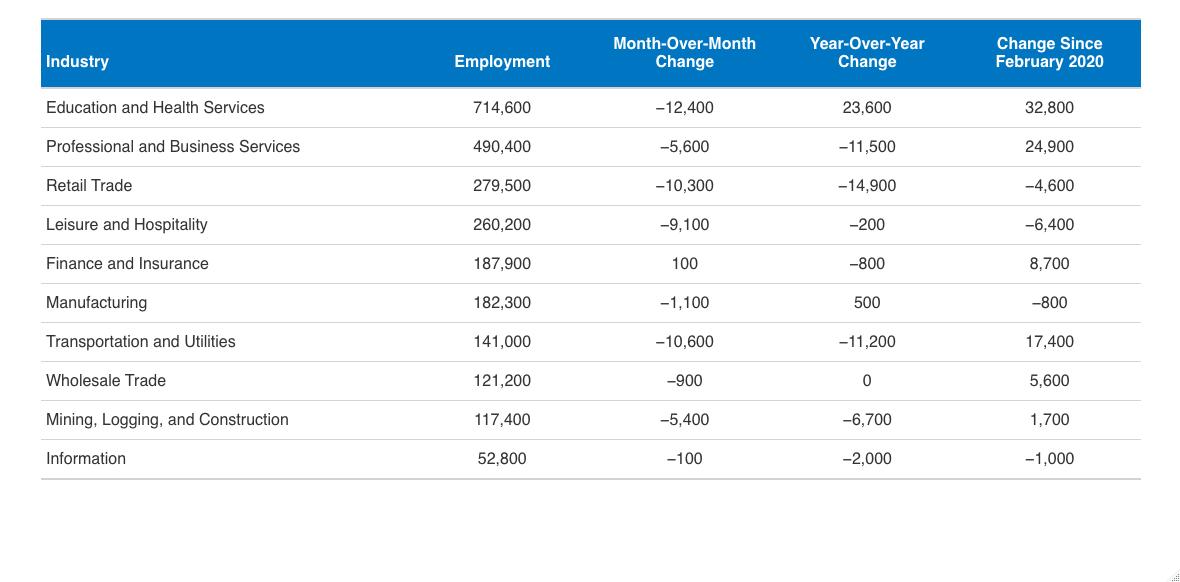
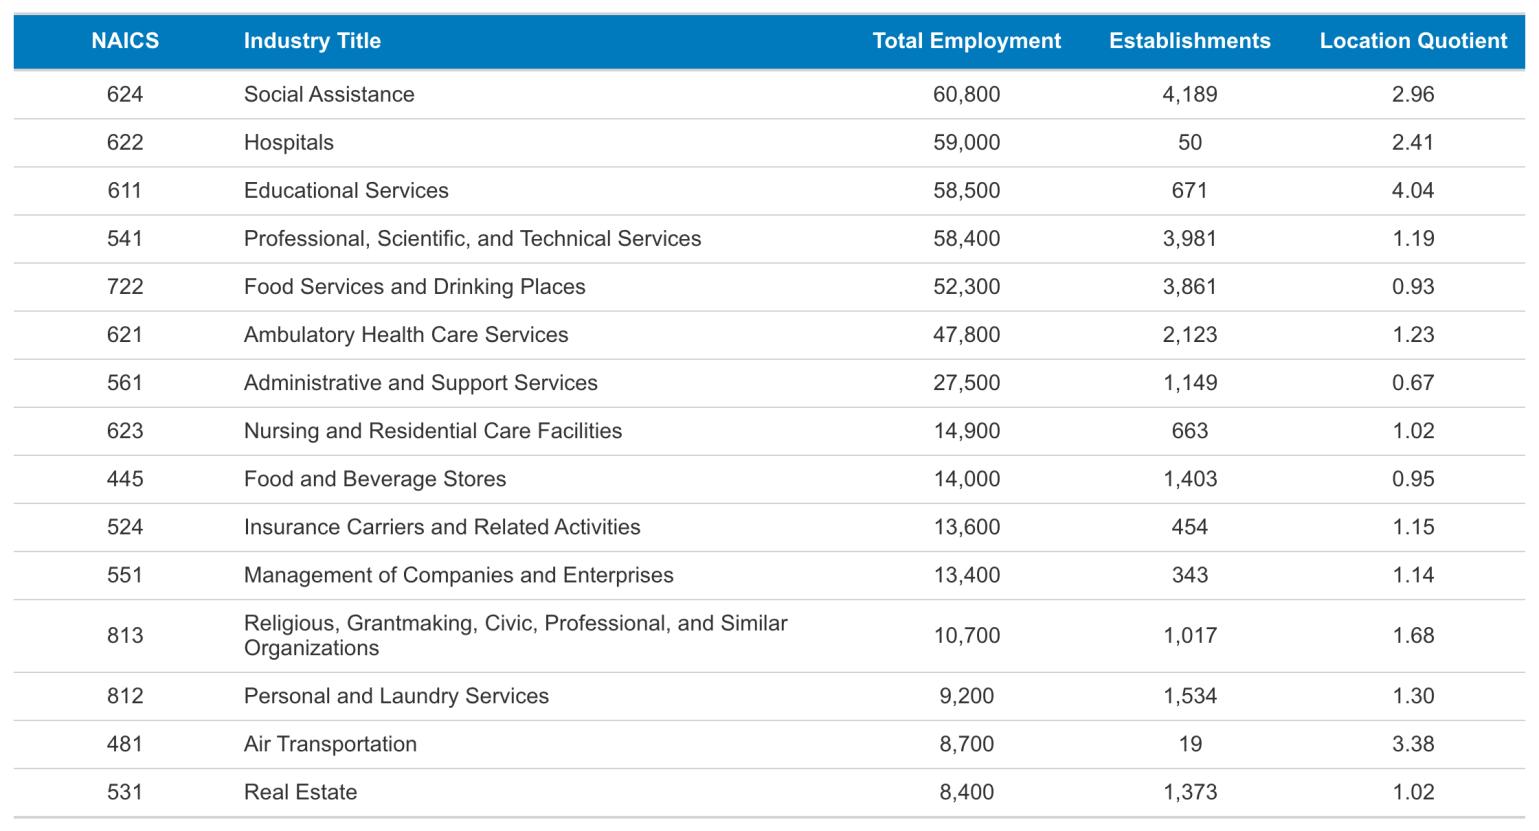
From the Quarterly Census of Employment and Wages, this table shows the 15 largest industry sectors by total employment. These data are released on a roughly six-month delay.
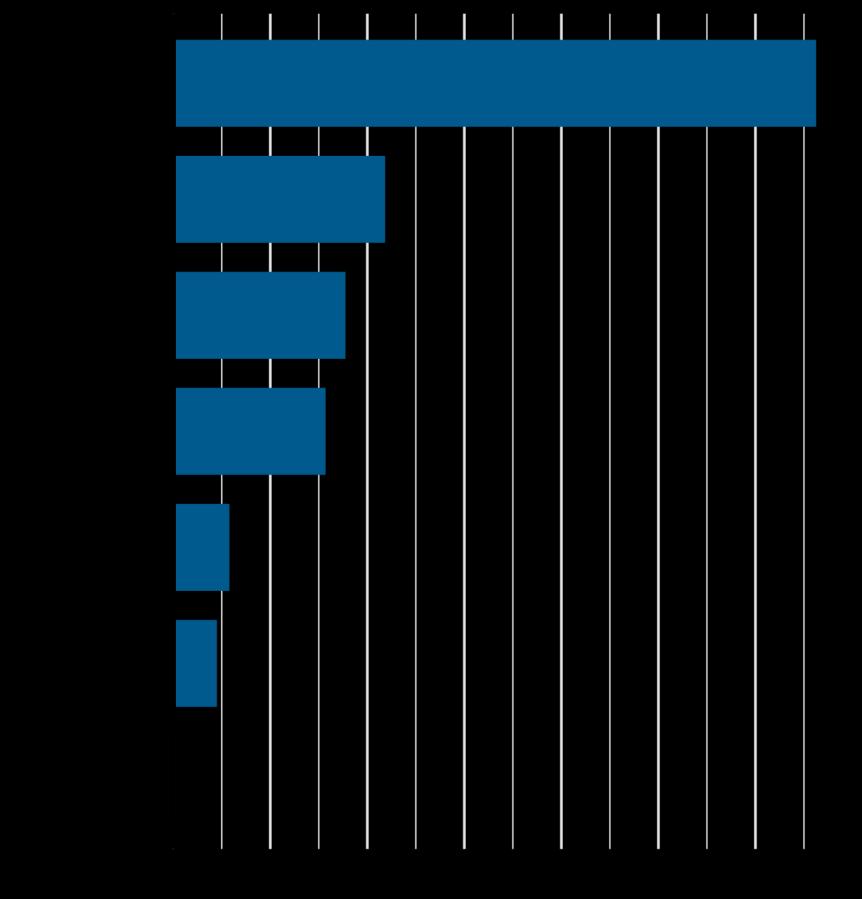
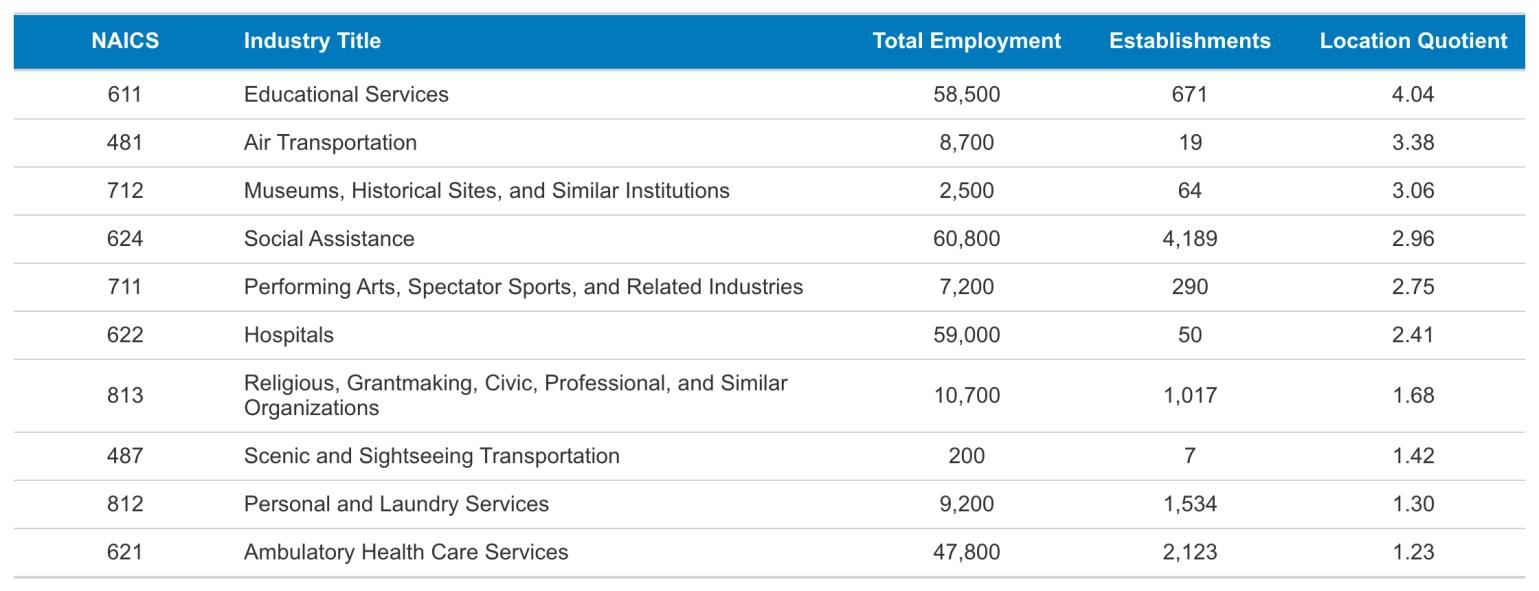
From the Quarterly Census of Employment and Wages, this table shows the 10 most specialized industry sectors by total employment. These industries are disproportionately important to Philadelphia’s economy. These data are released on a roughly six-month delay.
2023
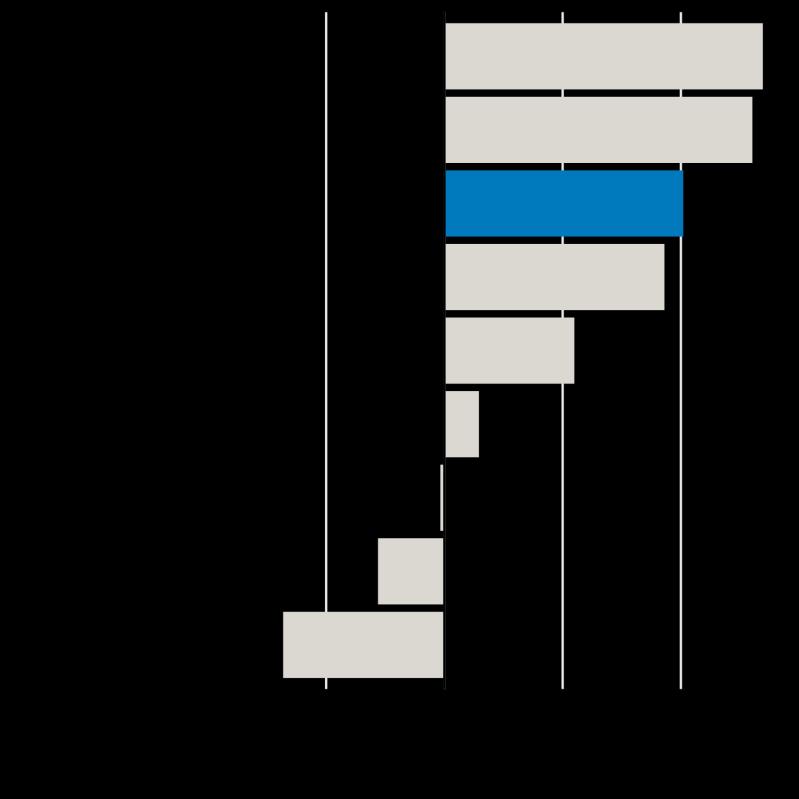
From the Quarterly Census of Employment and Wages, this table shows the 10 industry sectors with the largest annual employment growth. These data are released on a roughly six-month delay.

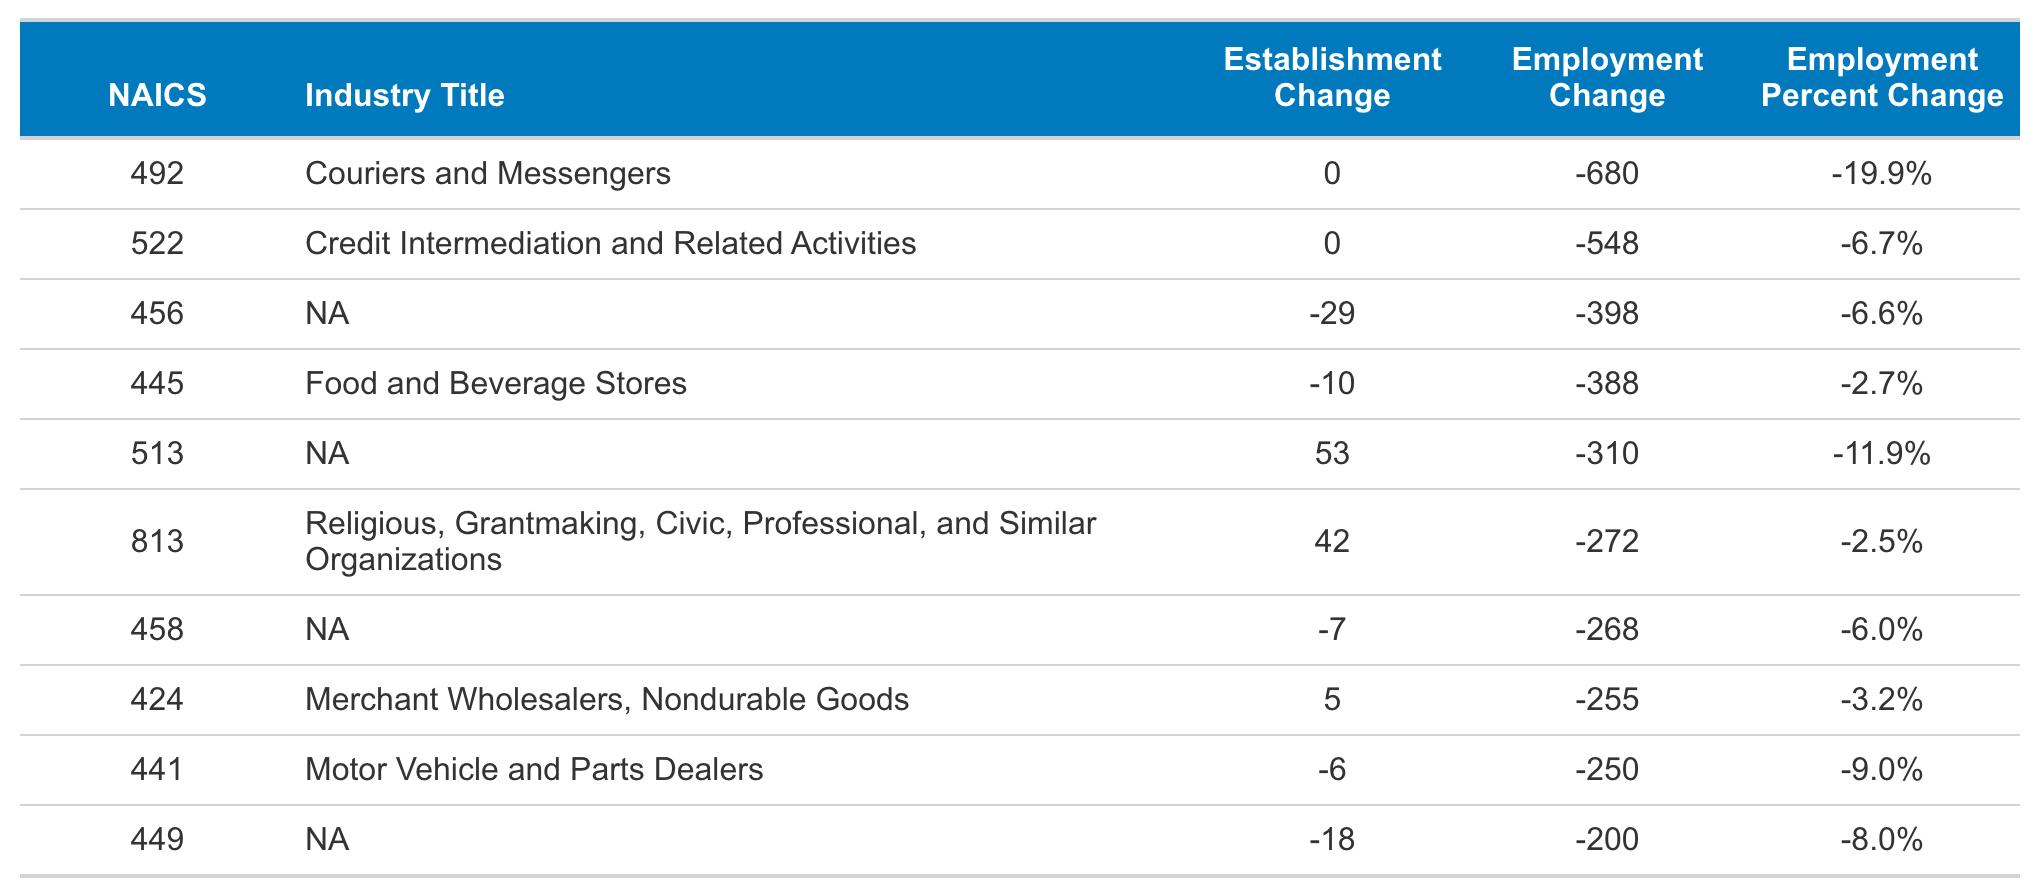
From the Quarterly Census of Employment and Wages, this table shows the 10 industry sectors with the largest annual employment declines. These data are released on a roughly six-month delay.
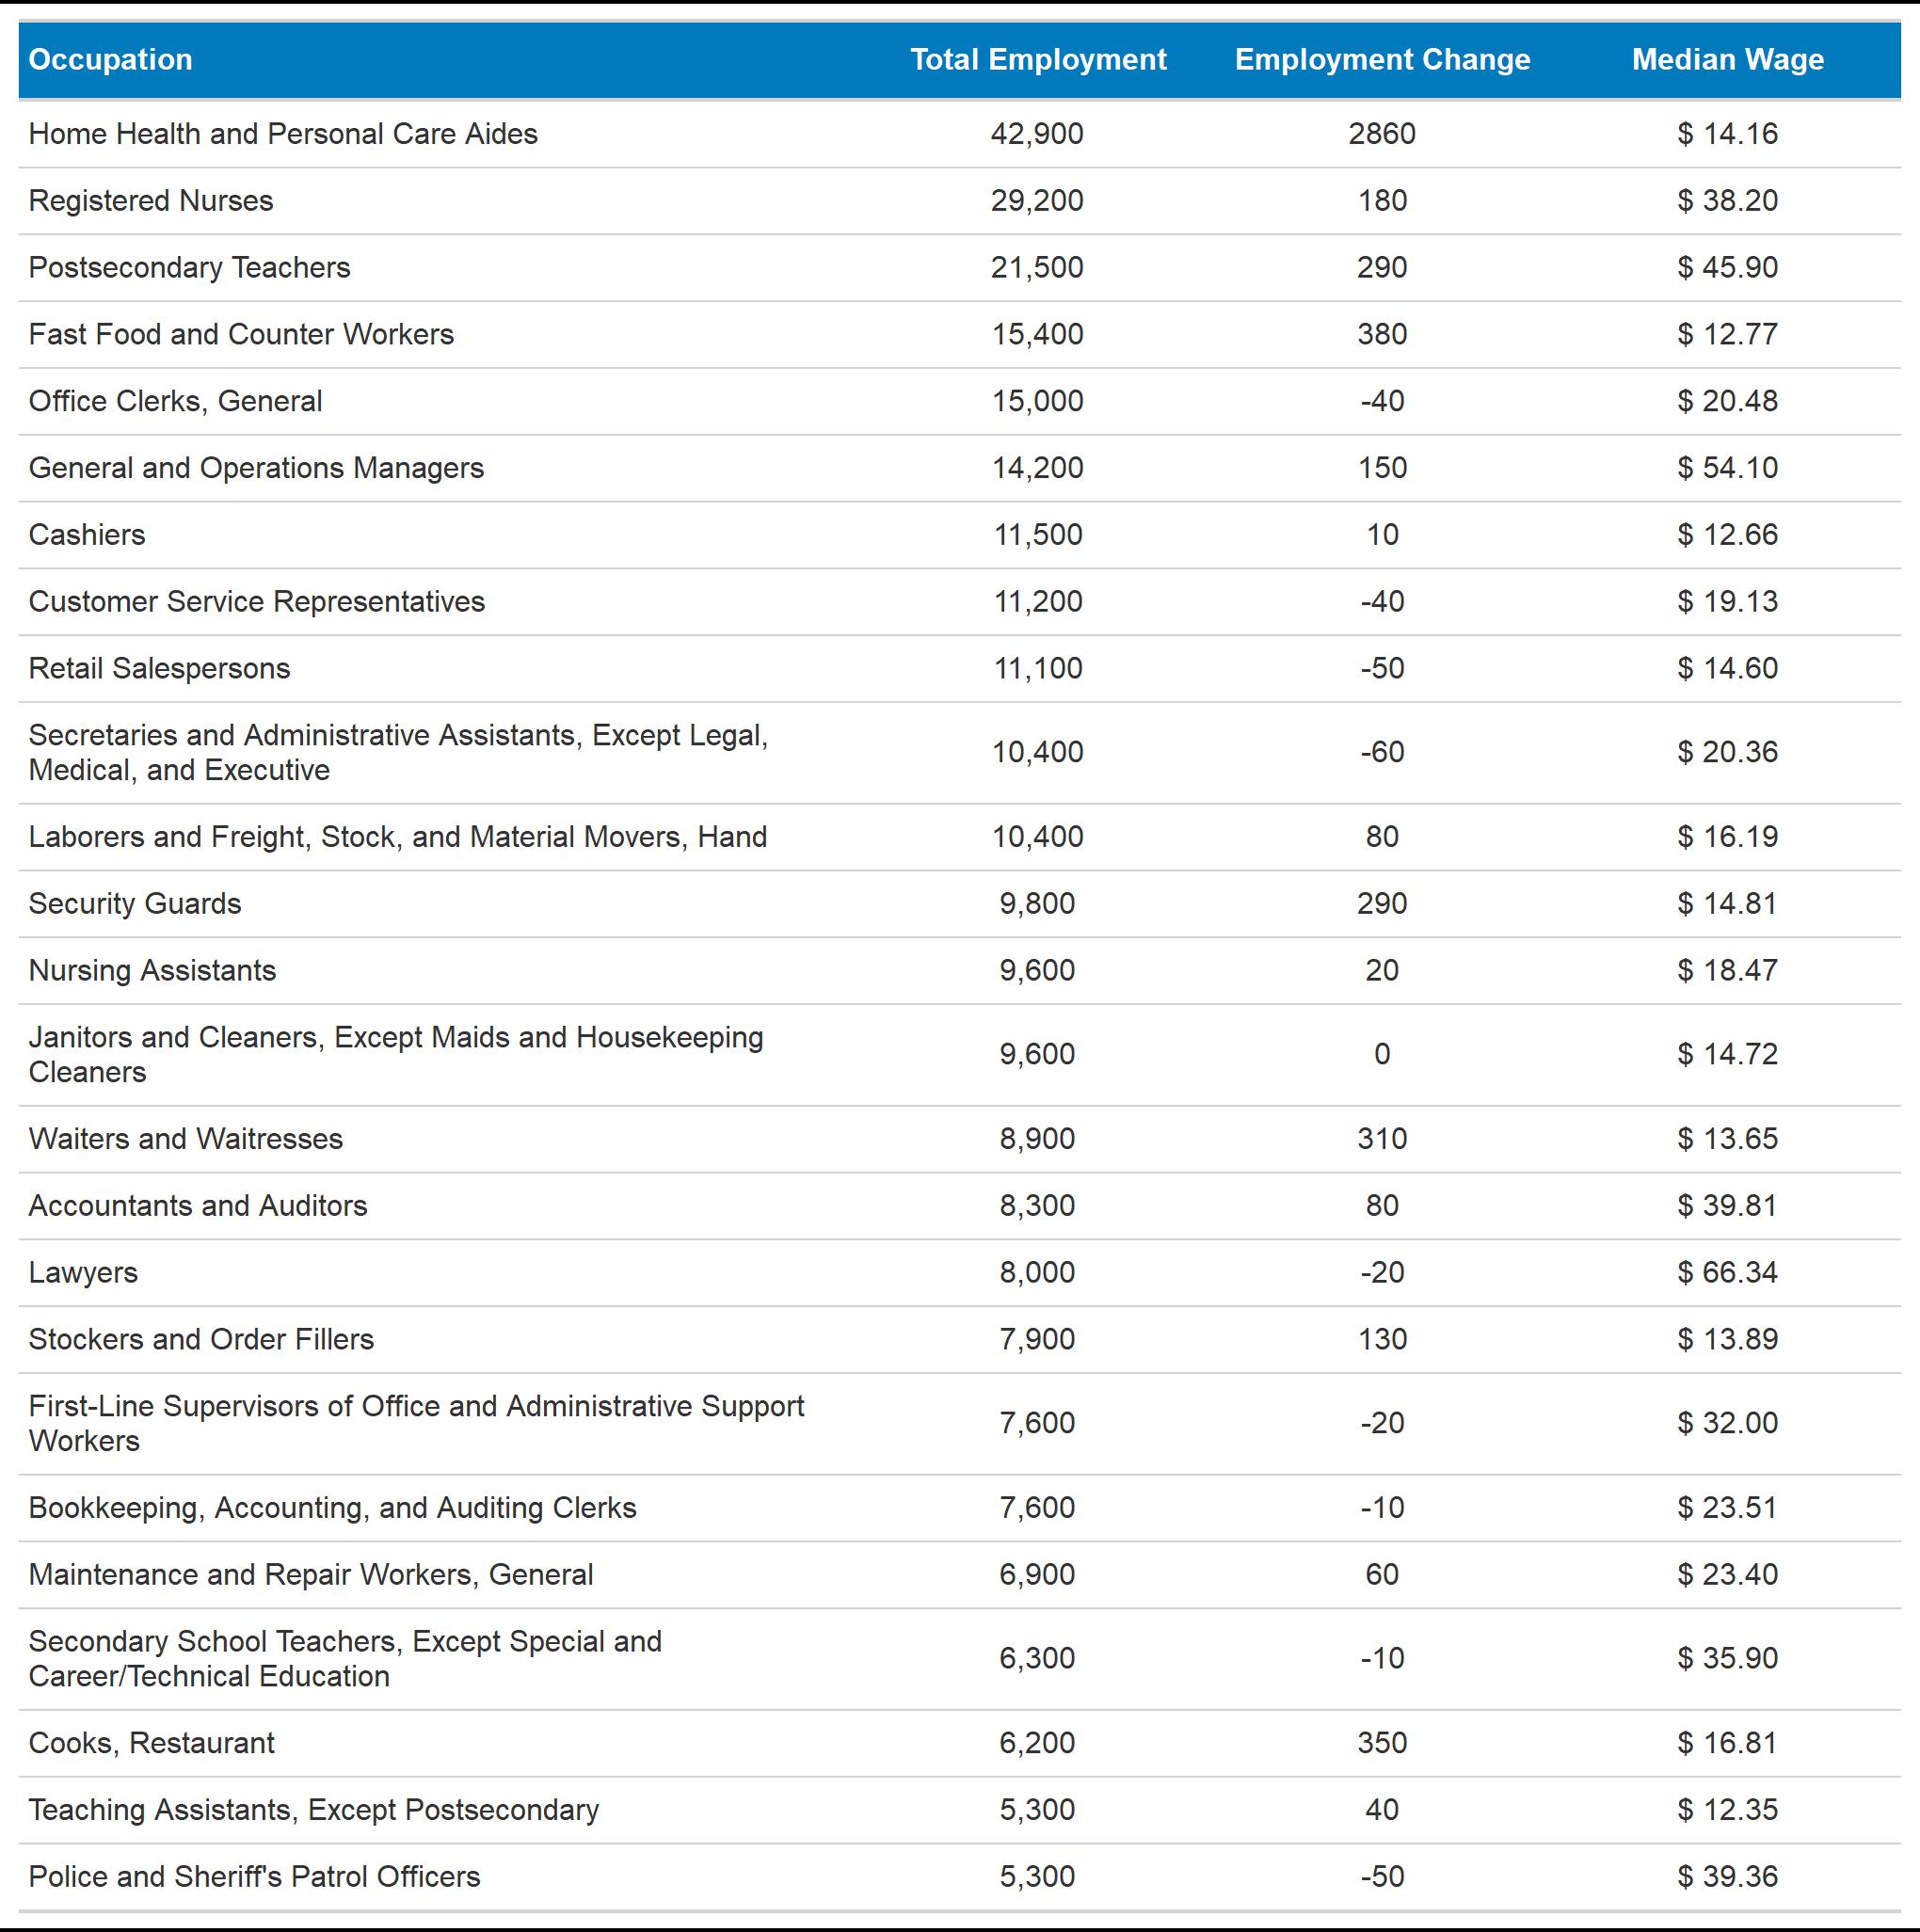
Appendix Table 5: Largest Occupations in Philadelphia with Employment Change from 2019 to 2023
Based on estimates derived from the Quarterly Census of Employment and Wages, this table shows the 25 largest occupation by total employment. These data are released on a roughly nine-month delay.