Philadelphia Works, Inc. - Quarterly Report - 2025
Continued economic growth is critical to the future of our city and region, and is dependent upon a strong, skilled workforce.
Fueling Philadelphia’s Talent Engine ”
Page 03
Current Research
The latest ongoing research about Philadelphia’s workforce.
Page 05
Employment Trend
The most recent data available on Philadelphia’s economy.
Page 12
Employer Demand
Exploring recent trends in employer demand through job postings and other sources.
Page 17
Philadelphia’s Labor Force
Demographic, social, and economic characteristics of Philadelphia’s labor force.
Page 22
Appendix: Detailed Tables
Detailed employment information for important industries and occupations in Philadelphia.
Using the latest available data, this quarterly update offers insight into Philadelphia’s labor market, industry mix, and economic development.
For more insight into Philadelphia’s labor force, economic characteristics, and the employment dynamics, visit the Philadelphia Works website.
Future Impact Occupations
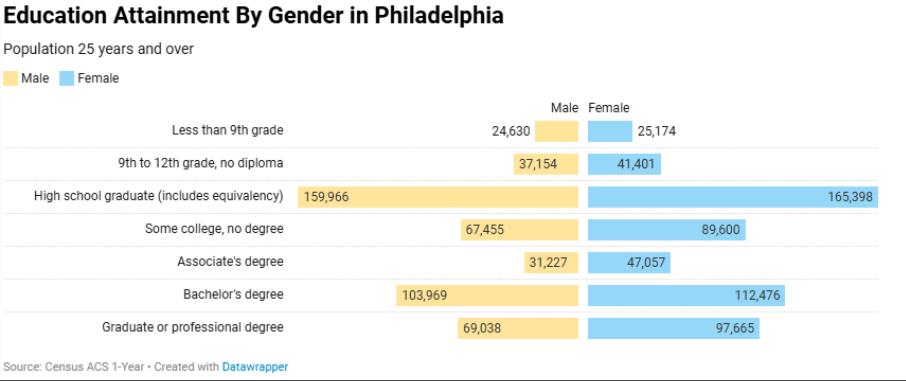
Education Attainment In Philadelphia
According to the latest U.S. Census data, nearly two-thirds (64.3%) of Philadelphia's adult population hold an associate's degree or less. This includes:
• 12% of residents (over 128,000 individuals) with less than a high school diploma, for whom access to quality employment is significantly limited
• 30% of residents (over 325,000 individuals) with a high school diploma or equivalent, representing a substantial workforce pool positioned to benefit from career pathways that provide familysustaining wages without requiring a four-year degree
• 22% of residents (over 235,000 individuals) have completed some college or earned an associate's degree. This demographic is a critical opportunity area for targeted workforce development, as they are primed for roles that require modest additional investment in skills training.
This data reinforces the national focus on "middle-skill" jobs, which require more than a high school diploma but less than a four-year degree. These roles are critical for economic mobility. The Research & Analysis Team at Philadelphia Works has been working on the Future Impact Occupations List based on systematic and rigorous criterion (family-sustaining wage, low barrier to entry, accessibility for education and job training, and verified regional job demand), which is also designed to illuminate these high-opportunity pathways The primary data source for the analysis is the "2022-2032 LongTerm Projections" for the Philadelphia County Workforce Development Area (WDA), published by the Pennsylvania Department of Labor & Industry's Center for Workforce Information & Analysis (CWIA). Stay tuned for our Future Impact Occupations List!
Figure 1: Education Attainment By Gender In Philadelphia
Past and Present
Quarterly Comparison
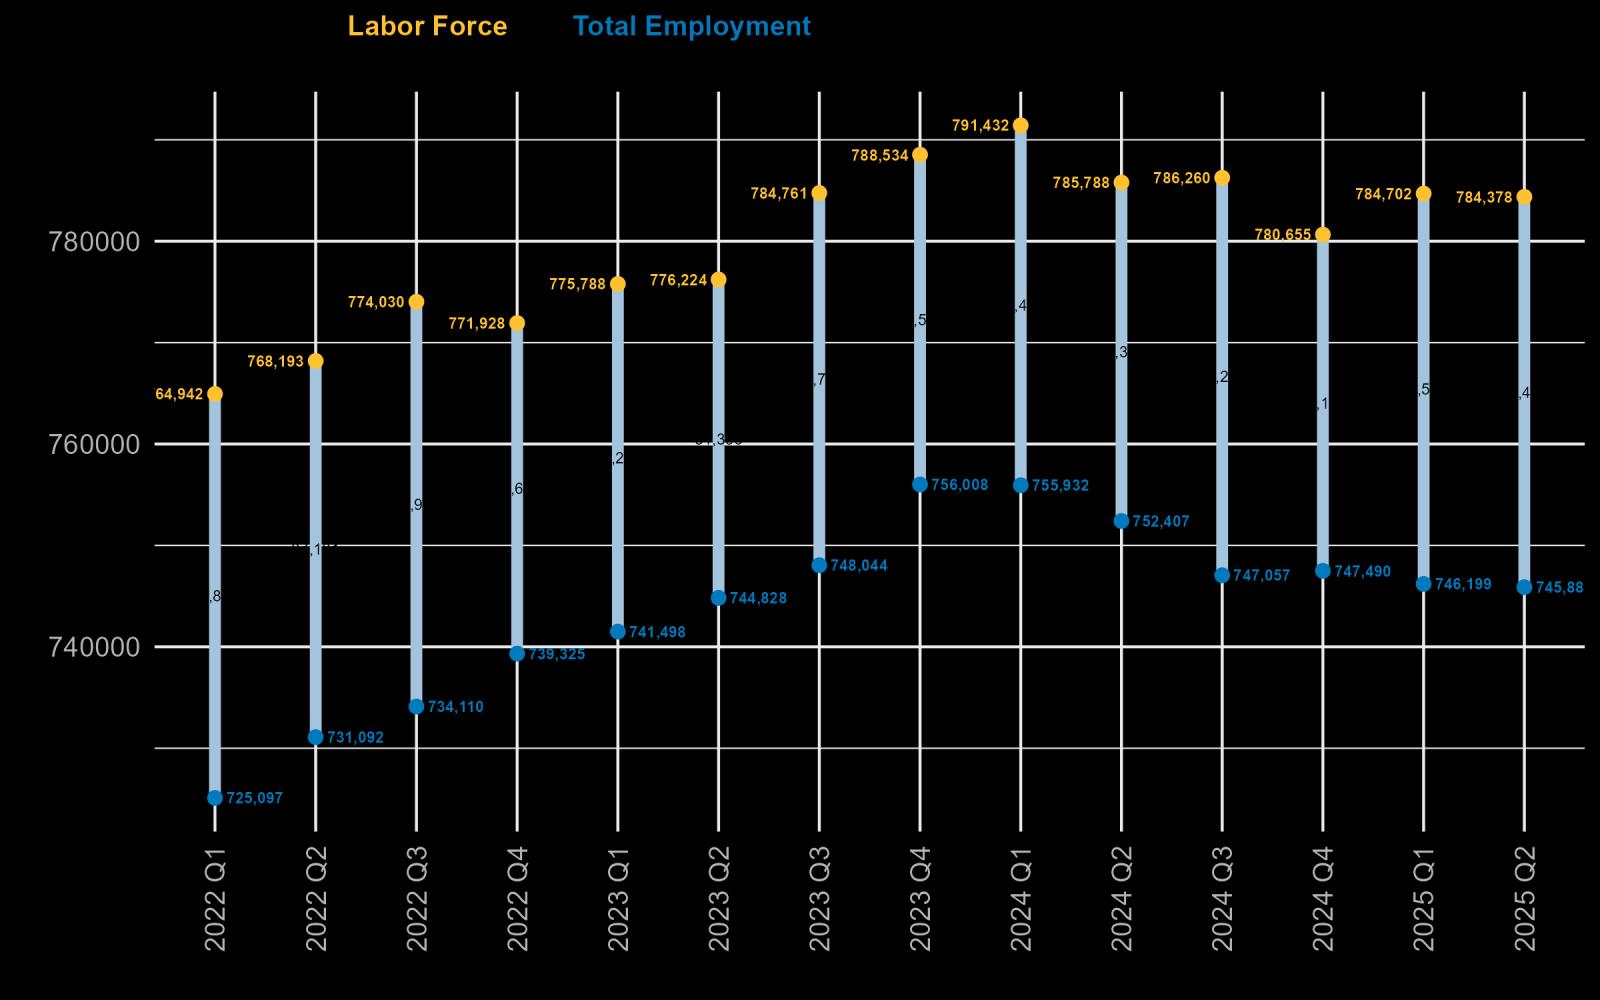
A detailed quarterly analysis reveals that while Philadelphia's labor market remained relatively stable between the first and second quarters of 2025, it did experience a slight contraction. In Q2 2025, the labor force stood at 784,378, with 745,884 people employed, resulting in 38,496 unemployed residents. This unemployment figure is nearly identical to the 38,503 recorded in Q1 2025, though both the total labor force and the number of employed people decreased slightly over the quarter, indicating a modest cooling down of the market.
The cooling trend becomes more apparent in the annual comparison. The 38,496 unemployed residents in Q2 2025 represent a notable increase from the 33,380 unemployed individuals in Q2 2024. A year prior, the labor market was more robust, with both a larger labor force (786,260) and higher total employment (752,407). The most recent figures for mid-2025, while stable in the short term, are a step down from that recent high point, confirming a broader market slowdown from its post-pandemic peak.
Figure 2: Quarterly Mean Value Comparison in Philadelphia, Previous 24 Months
Employment & Unemployment
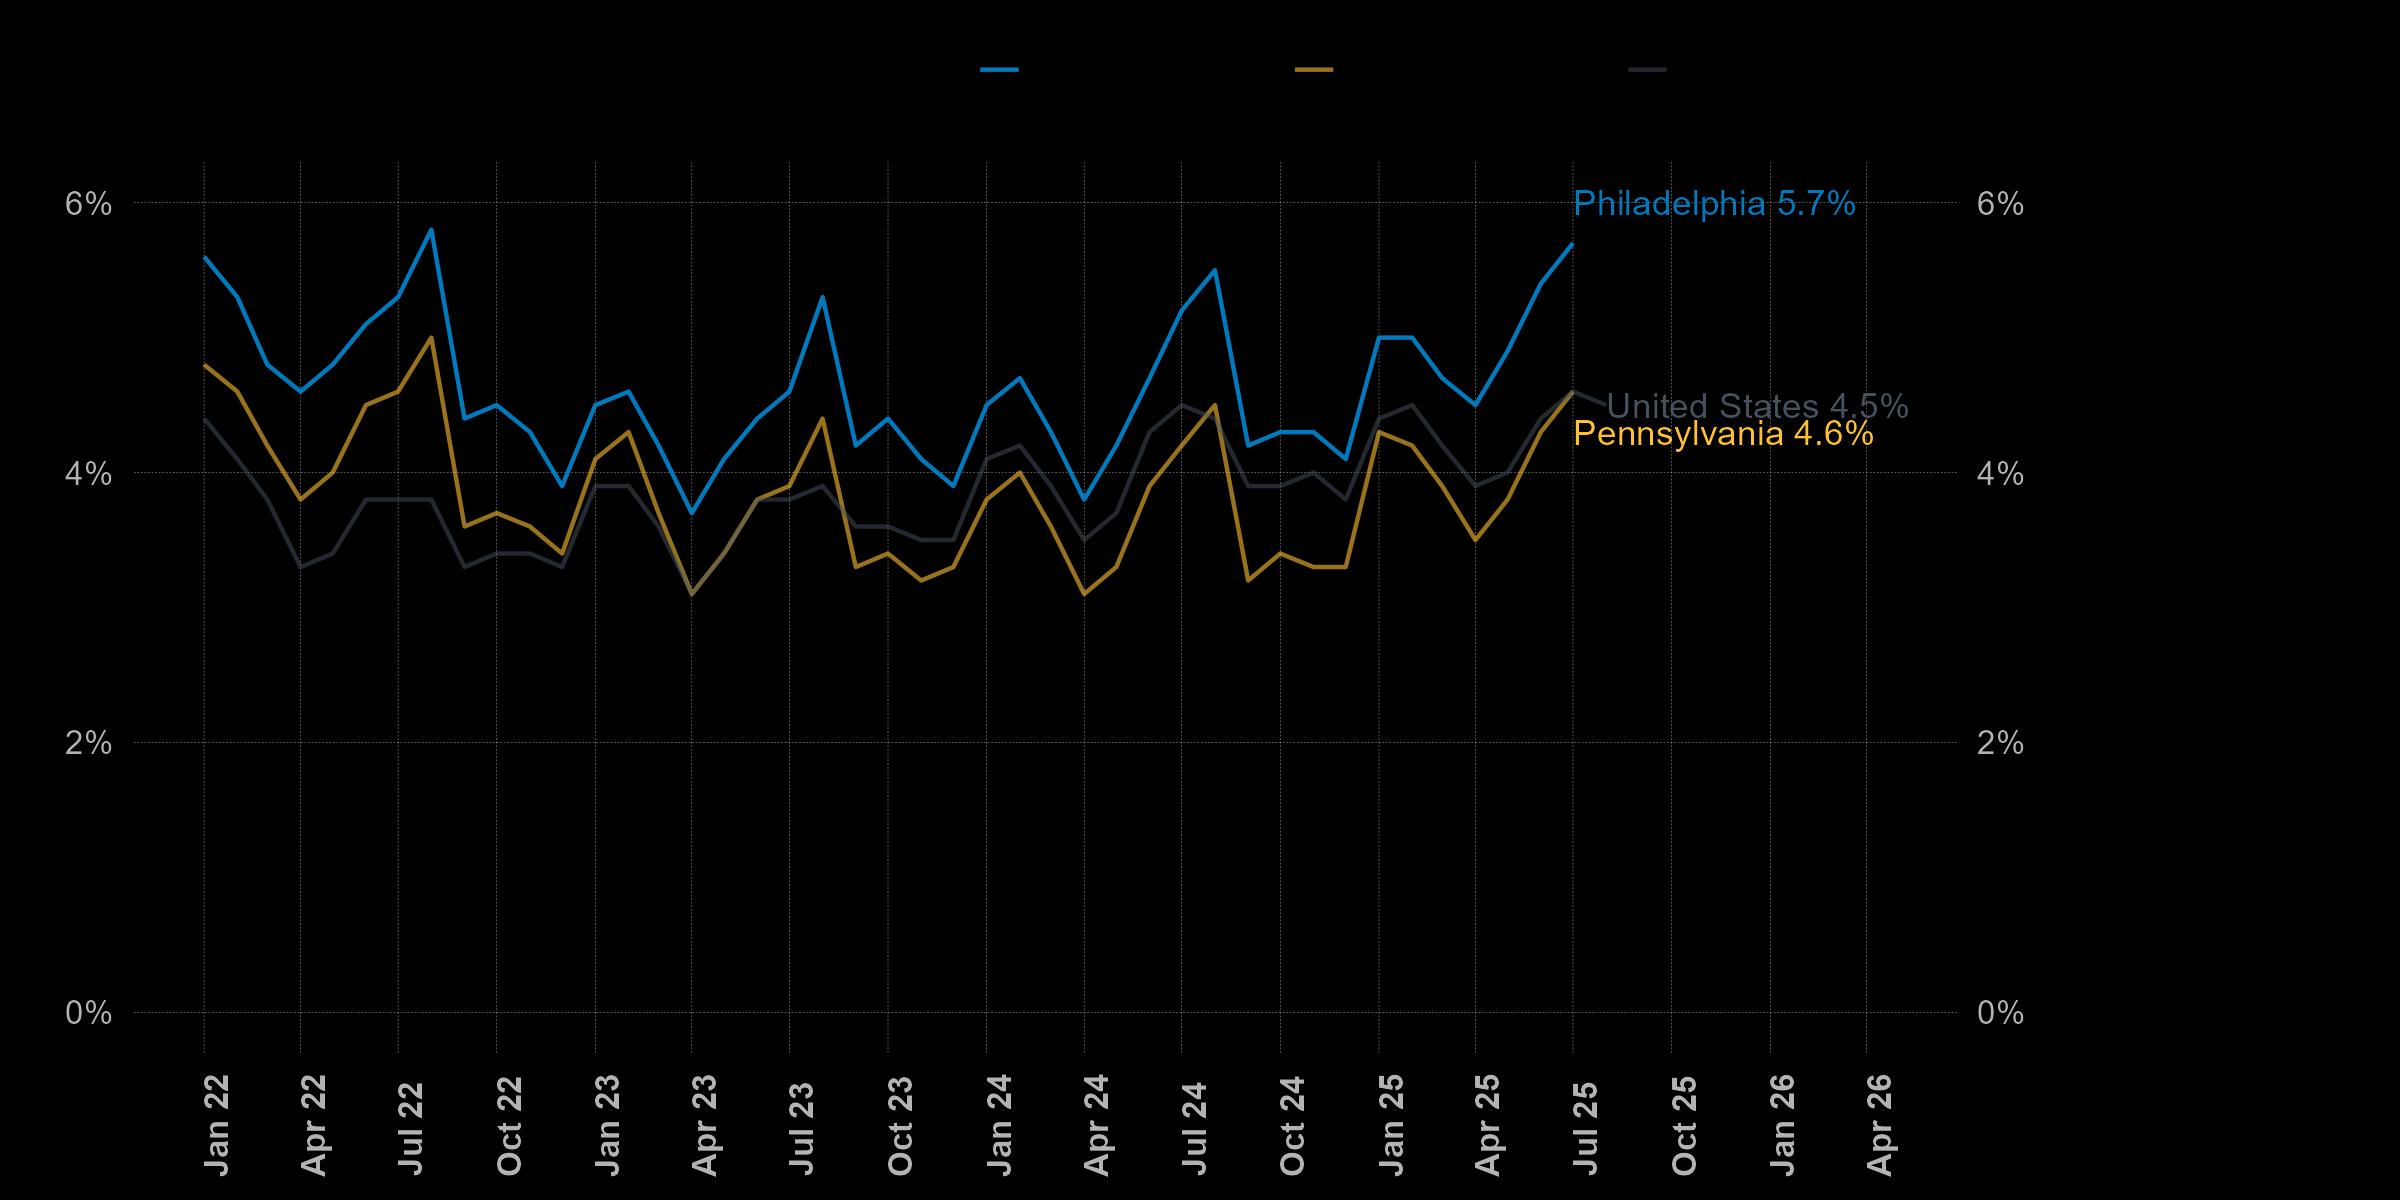
In June 2025, Philadelphia's unemployment rate stood at 5.4%. The total labor force was 783,779, with 741,537 residents employed.
While the June rate provides a snapshot of the month, the historical trend shows that Philadelphia's unemployment rate remains persistently higher than state and national averages.
The March 2025 Beige Book report, compiled by the Federal Reserve for the district including Philadelphia, provided a crucial leading indicator. It noted that overall "business activity... declined slightly" and, more pointedly, that firms were becoming "more reluctant to hire amid economic uncertainty“.
Figure 3: UnemploymentRate Since January 2022 Within 3 Regions
Philadelphia MSA Industry
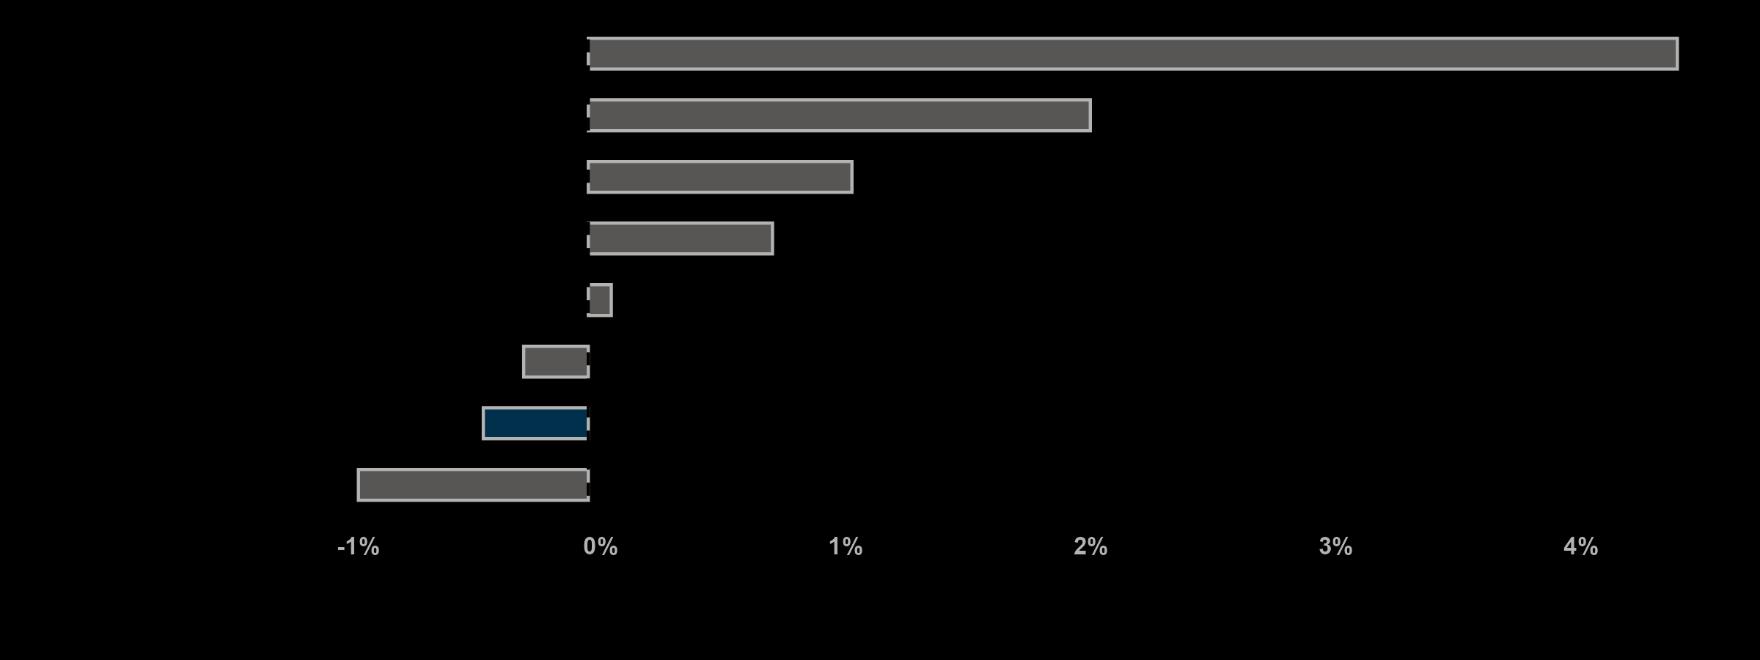
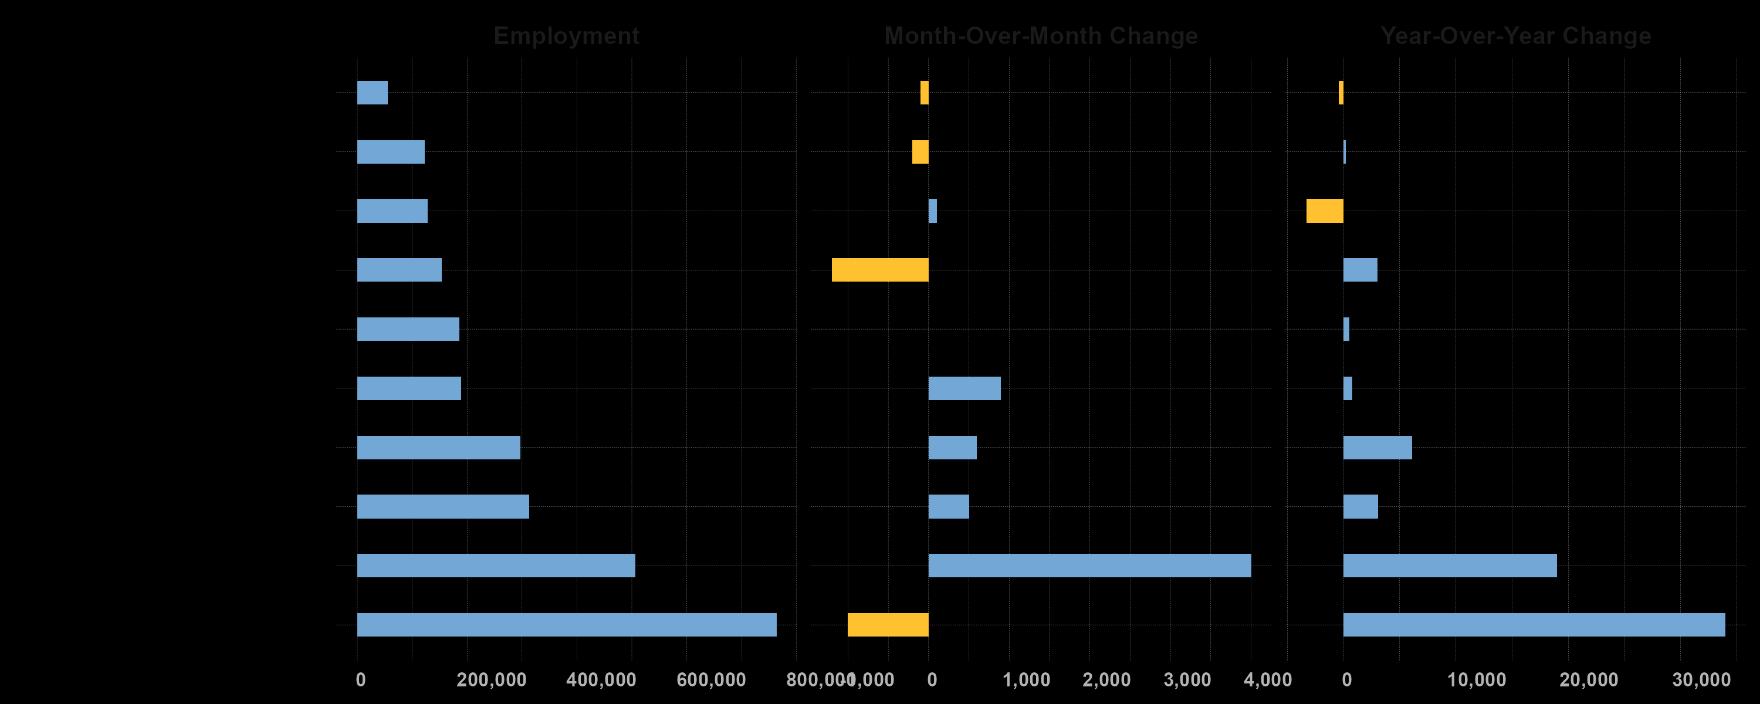
In June 2025, the Philadelphia MSA's overall employment performance experienced a slight contraction of approximately -0.2% compared to other major metros, while metros like Houston and Chicago saw significant job growth. This modest regional decline reflects a complex and divergent picture across the area's key industries. While the two largest sectors, Education and Health Services and Professional and Business Services, have anchored the region with substantial year-over-year job gains, recent monthly data reveals short-term weakness.
Source: Philadelphia Works Analysis of Data
Figure 5: Regional Employment by Industry Sector in Philadelphia MSA, June 2025
Figure 4: Regional Employment by Industry Sector in Philadelphia MSA, June 2025
The Philadelphia MSA, officially the Philadelphia-Camden-Wilmington, PA-NJ-DE-MD Metropolitan Statistical Area, is a large metropolitan region in the Northeastern US centered on Philadelphia. It encompasses counties in Pennsylvania (Bucks, Chester, Delaware, Montgomery, and Philadelphia), New Jersey (Burlington, Camden, Gloucester, and Salem), Delaware (New Castle), and Maryland (Cecil).
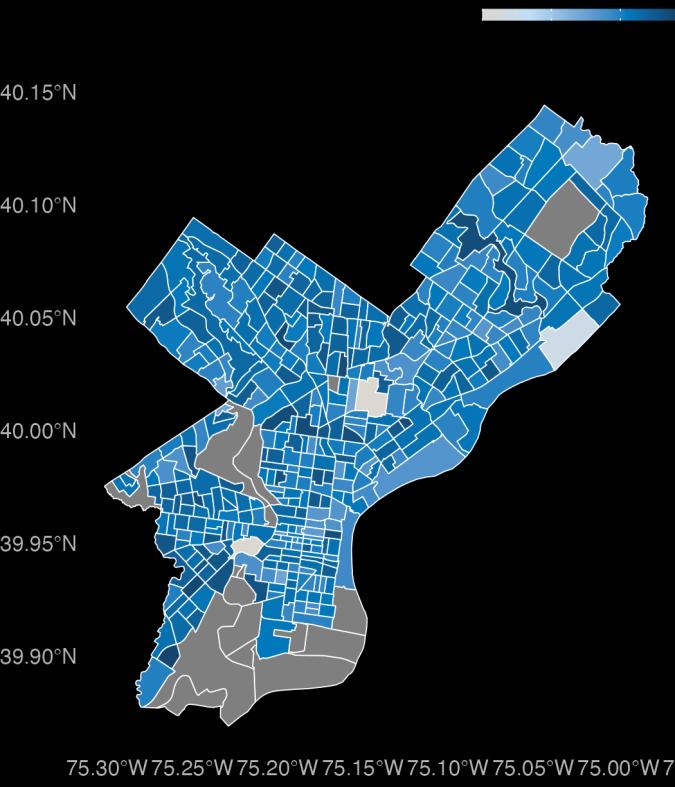
Industry Geospatial Concentration In Philadelphia
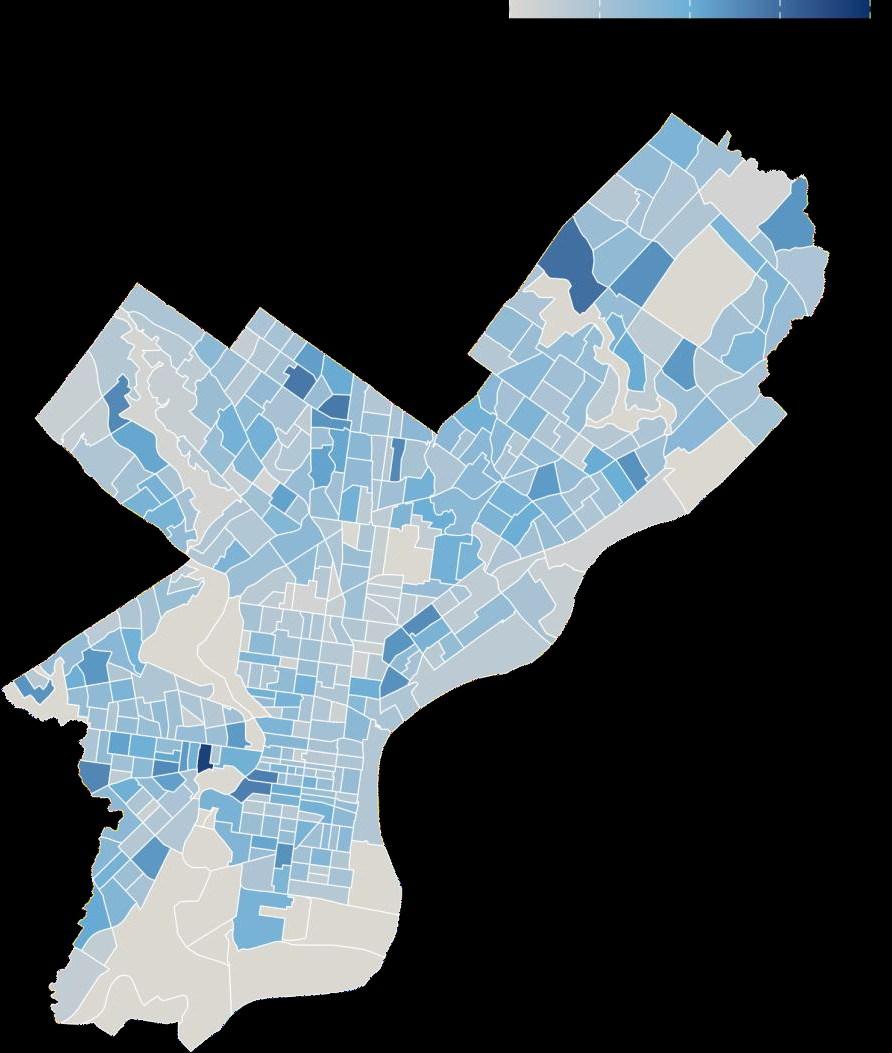
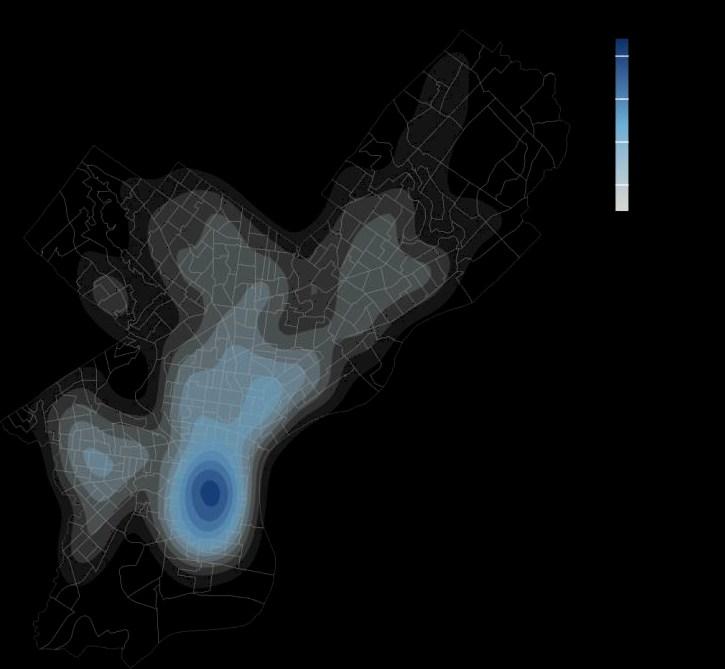
Map 1: Education and Health Services Employed Individuals Distribution, ACS 2023
The regional economy in Philadelphia County is primarily driven by the Education and Health Services sector, which has shown predominant demand and growth in general.
The map (Map 1) illustrates the geospatial distribution of sector development and growth at the census tract level in Philadelphia County.
Lighter blue areas have relatively fewer facilities for Education and Health Services, while the grey areas indicate no related clustered Education and Health Services.
Dark blue areas represent the highest concentration of employment in Education and Health Services, mainly in the west, center, and north of Philadelphia, near major health care centers and institutions. It also indicates a high density of employed individuals in those areas.
Education and Wage
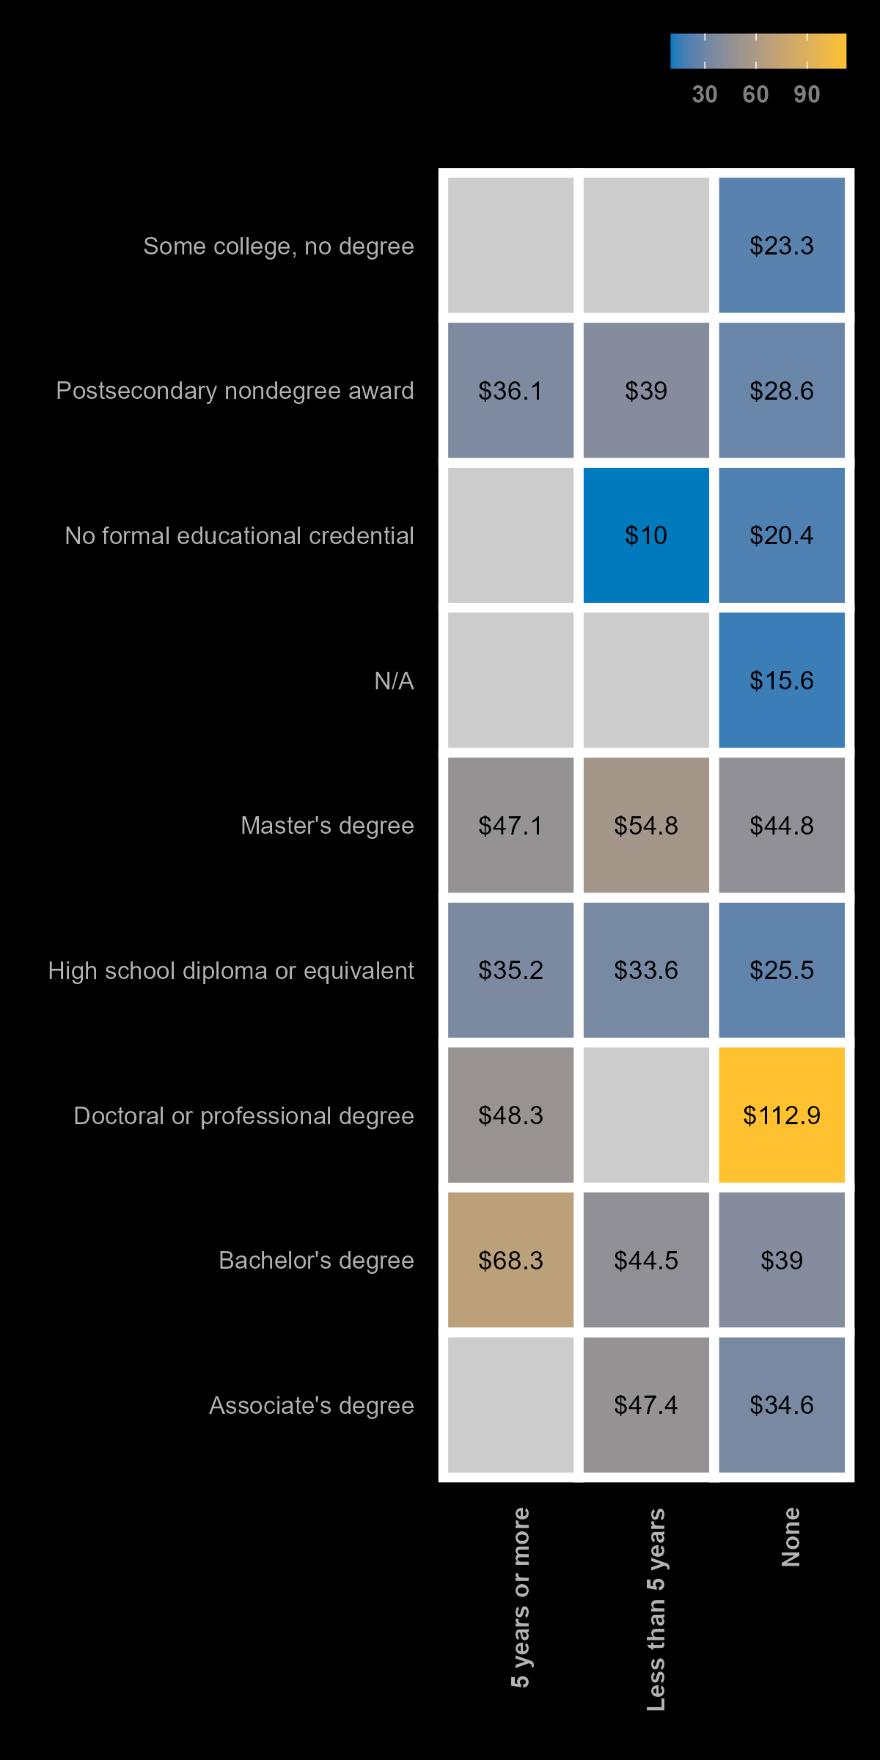
Philadelphia’s wage data confirms a well-known pattern: higher education and experience translate into higher earnings. The impact of an advanced degree is obvious, with doctoral or professional degree holders commanding a median hourly wage of $112.9 even with no prior work experience.
Experience powerfully amplifies earning potential across all educational levels. A bachelor's degree holder with five or more years of experience earns a median of $68.3 per hour, significantly more than the $39 per hour for a recent graduate with no experience.
This trend also holds for workers without a formal degree; an individual without any credentials can see their median wage rise from $10 to $20.4 with experience, while those with some college can increase their earnings from $23.3 to a higher wage not specified in the chart. This data underscores the crucial, dual role of advanced learning and on-the-job experience in securing higher wages and long-term earning potential.
Figure 6: Relation BetweenEducation Level, Median Hourly Earnings and Work Experience, 2024to2025
Recent Unemployment Claims
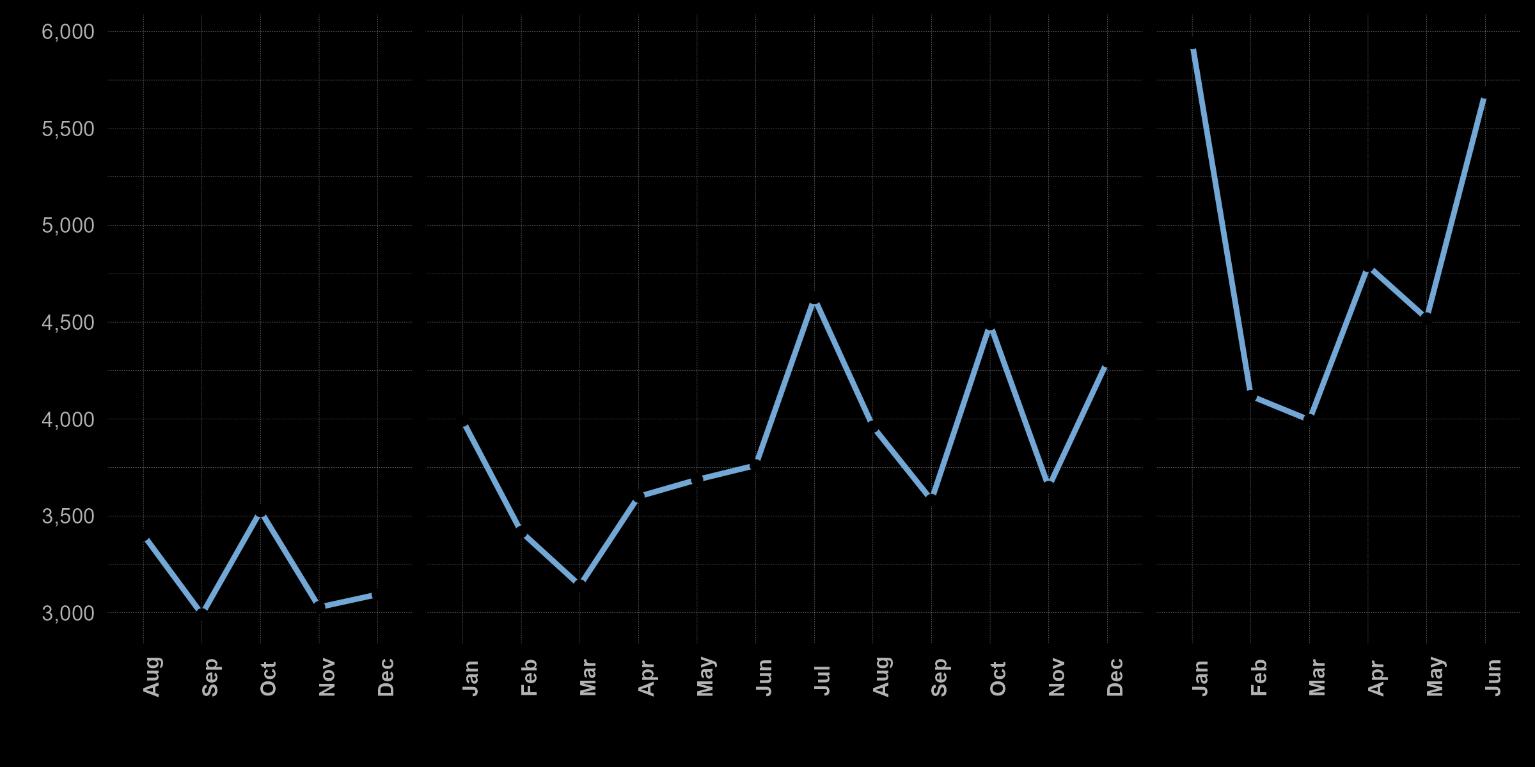
In early 2025, initial unemployment claims in Philadelphia surged sharply, hitting a peak of nearly 6,000 in January the highest level seen in recent years.
Following this spike, claims moderated in February and March before rising again through the second quarter. By June 2025, new initial claims had climbed back to approximately 5,700, indicating renewed instability in the labor market.
Figure 7: Monthly Initial Unemployment Claims by Philadelphia Residents, Previous 24 Months
Trends in Job Postings
Overall Trends
Philadelphia employers have shown recovering demand for labor over the last two years. However, this quarter saw a decline in job postings, following national trends of dampened demand.
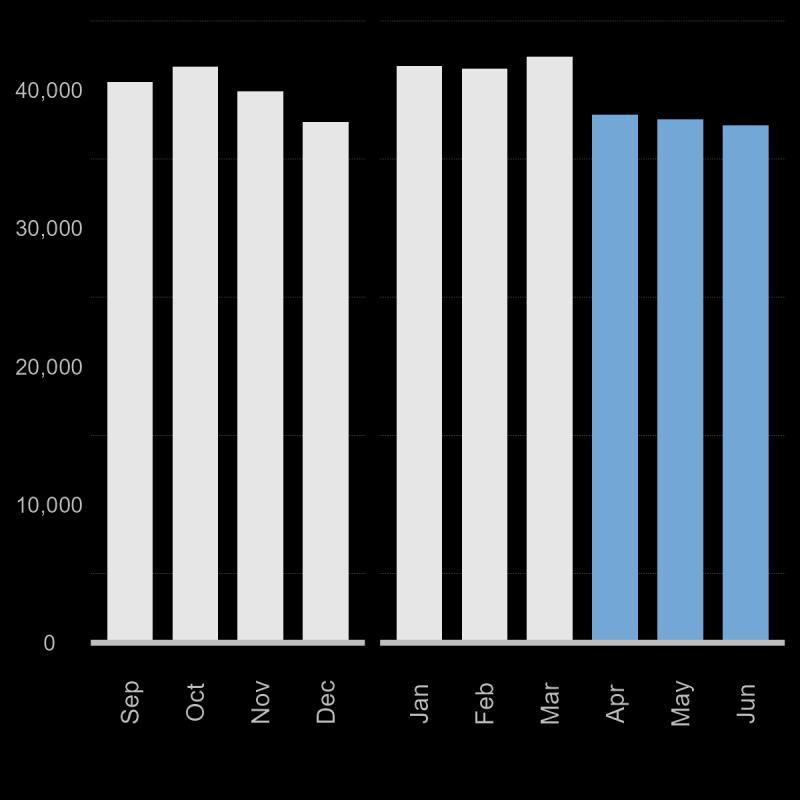
Employer demand in Philadelphia cooled down during the second quarter of 2025, reversing the trend from a strong first quarter. After peaking at 42,200 job postings in March, listings saw a marked decline to 38,200 in April, 37,800 in May, and 37,400 in June.
This Q2 downturn contrasts with the robust hiring activity seen in Q1, when monthly postings consistently exceeded 41,000.
Figure 8: Monthly Job Postings in PhiladelphiaCounty
Despite a general slowdown in job postings, hiring in June was heavily concentrated in Philadelphia's dominant higher education and healthcare sectors. UPenn's unique job postings almost reached 3k. Thomas Jefferson University (956), Penn Medicine (525), Temple University Health System (523) brought the total to over 5k postings across clinical care, research, and campus operations.
Children's
Across the board, employers emphasized the need for strong foundational and soft skills. Communication was the most requested skill, appearing in 37% of job postings, followed by Management (24%), Customer Service (20%), and Leadership (18%). This highlights that even for technical or specialized roles, businesses are prioritizing candidates who can collaborate, lead, and interact effectively with clients and colleagues. The top functional skills in demand were Operations (17%) and Research (14%).
Figure 9: Top 10 Unique Job Postings By Employer
Figure 10: Top 10 Unique Job Postings By Skills
Wage Growth in Pennsylvania
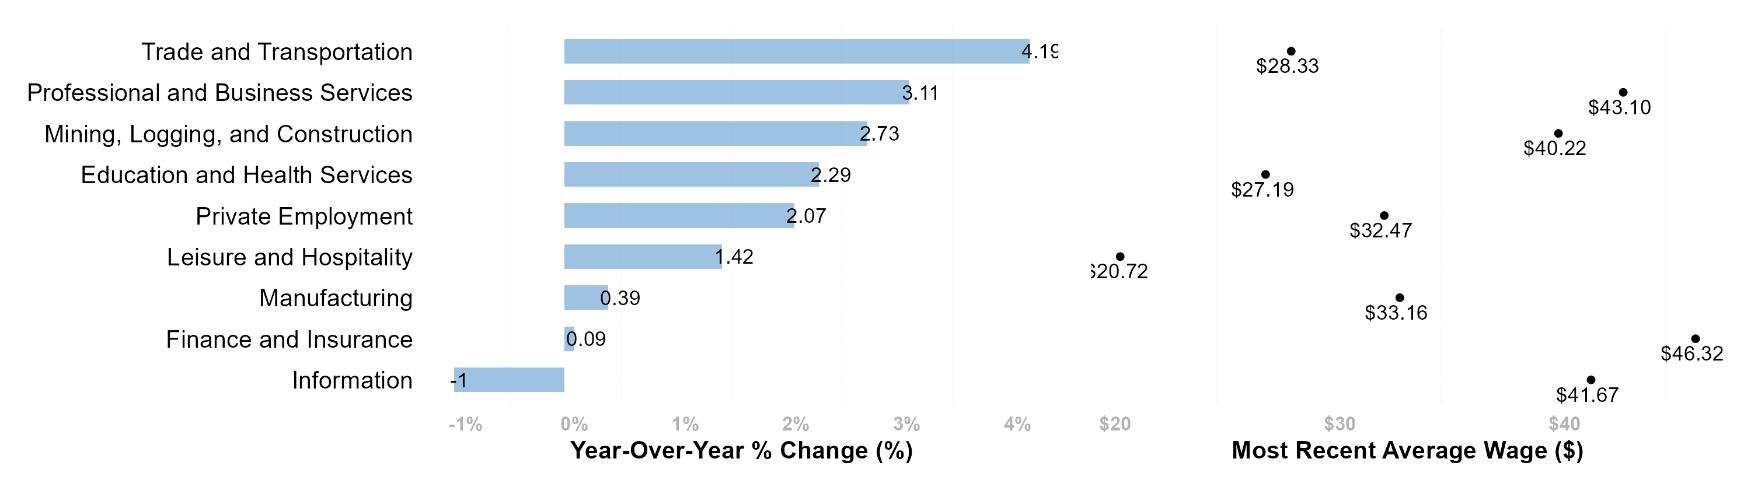
Wage growth across Pennsylvania showed significant disparities among industries. Trade and Transportation led all sectors with a 4.19% year-over-year wage increase to an average of $28.33. Professional and Business Services ($43.10) and Mining, Logging, and Construction ($40.22) also posted strong wage gains of 3.11% and 2.73%, respectively. However, the Information sector saw wages decline by 1 0% to $41 67, while Manufacturing ($33 16) and Finance and Insurance ($46 32) experienced nearly stagnant growth at 0 39% and 0 09% respectively
Figure 11: PennsylvaniaYear-over-YearWage Growth, March 2025
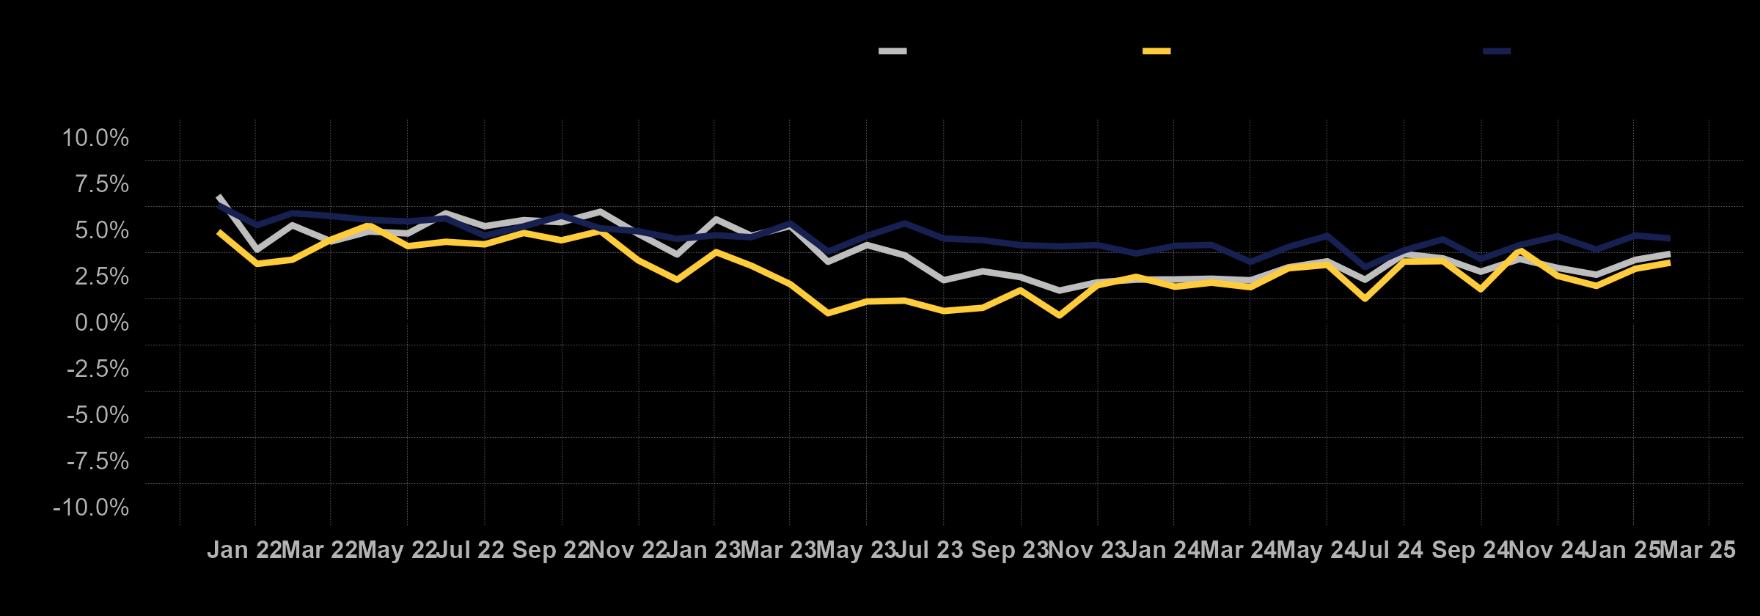
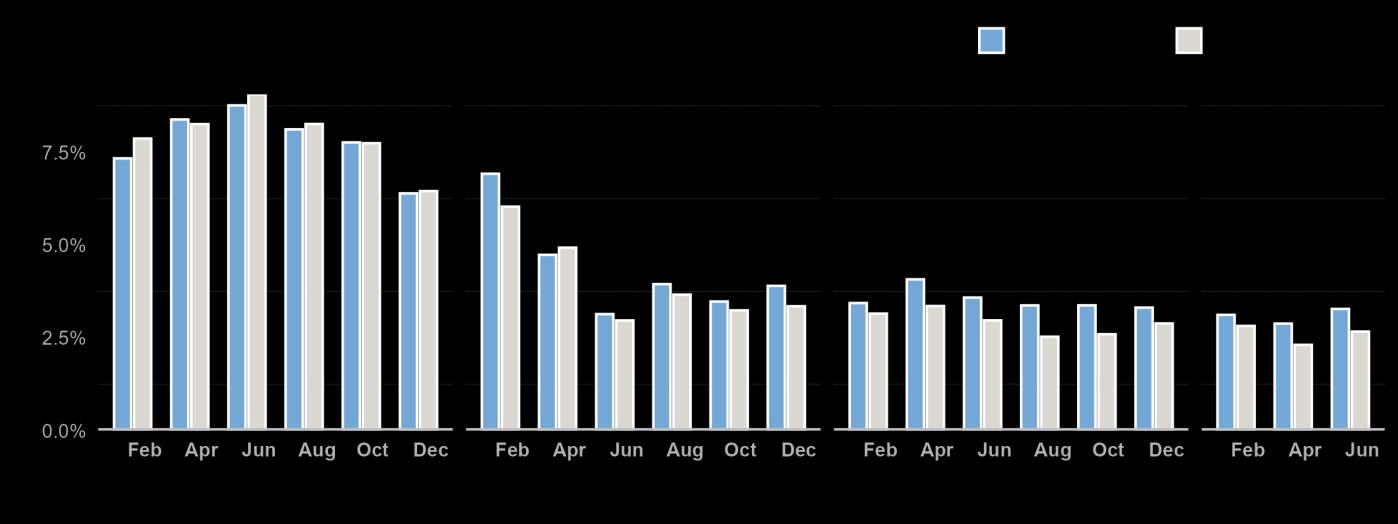
By March 2025, year-over-year wage growth for all private employment showed signs of stabilization. The trend lines, which represent the Philadelphia metro area, Pennsylvania, and the U.S., appear to be converging after a period of volatility in 2023. As of the latest data, growth rates are fluctuating in a relatively narrow band between approximately 3% and 4.5%.
Figure 12: Year over YearChange in Average Hourly Wages, All Private Employment
Inflation
Figure 13: Bimonthly Year-Over-YearInflation Accordingto the ConsumerPrice Index, 2021 to Present
After starting the year at 3.12% in February, Philadelphia MSA’s inflation rate dipped to 2.88% in April before climbing again through the summer. The second quarter of 2025 was marked by rising price pressures. The quarter began with a 2.88% inflation rate in April, which then increased to 3.28% by June. During this same period, the U.S. inflation rate also rose from 2.31% to 2.67%, but the gap between local and national inflation widened, indicating stronger price pressures within the Philadelphia MSA. This elevated top-line inflation is the result of extreme volatility across different consumer spending categories.
A detailed breakdown of year-over-year inflation for June 2025 reveals a market experiencing extreme and divergent pressures. The primary drivers pushing costs up for consumers were concentrated in the services and energy sectors. The cost of Services saw a massive 85.18% year-over-year increase, signaling intense underlying price pressures. This was compounded by a 52.01% surge in Gasoline prices at the pump. Together, these powerful increases pushed the core inflation rate, which excludes food and energy, to a very high 17.85%.
In contrast, consumers saw significant price relief in the goods sector. The price of New Vehicles plummeted by 45.53% year-over-year, while overall Commodities fell by 31.31% and Fuels and Utilities declined by 4.78%. Other key budget items showed more modest changes, with Housing costs rising 2.57% and Used Cars and Trucks increasing slightly by 2.11%. This data highlights a complex inflationary environment where historic price hikes in the service sector are occurring alongside significant price drops for goods.
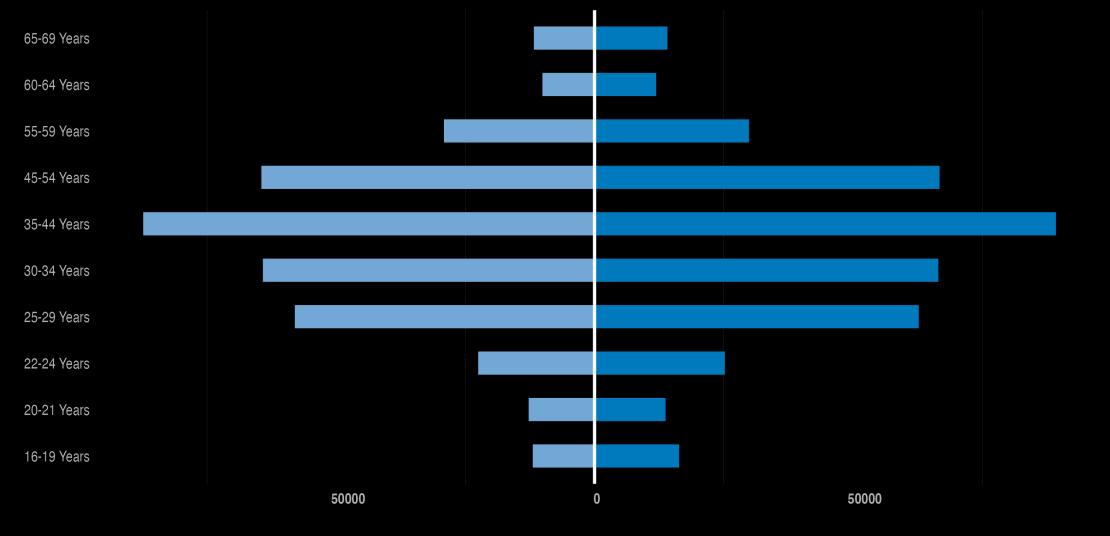
Resident Workers: Gender
Figure 14: Labor Force by Age and Binary Sex, ACS 2023
While Philadelphia’s labor force has grown in recent years, employment outcomes vary by race, ethnicity, and educational attainment.
Based on Census data and ACS data, individuals between the ages of 25 and 34 make up the largest portions of Philadelphia’s population and labor force. For both men and women, labor force participation among these age cohorts is between 80% and 87%, higher than the overall rate. Source:
The gendergap is calculatedas the difference betweenfemale and male Labor Force Participation Rates (LFPR). The map (Map 2) highlights the gendergap in LFPR across PhiladelphiaCounty,derived from the 2023 ACS.
Areas with darkerblueshades, particularly in North and Northeast Philadelphia, indicatesignificantdisparities where men's participation ratesare much higher than women's. Centraland Southern Philadelphiashowing up as lighterblue areas, indicatingmore balanced LFPR between genders.
Female Male
Map 2: Labor Force Participation Rate (%) GenderGap, ACS 2023
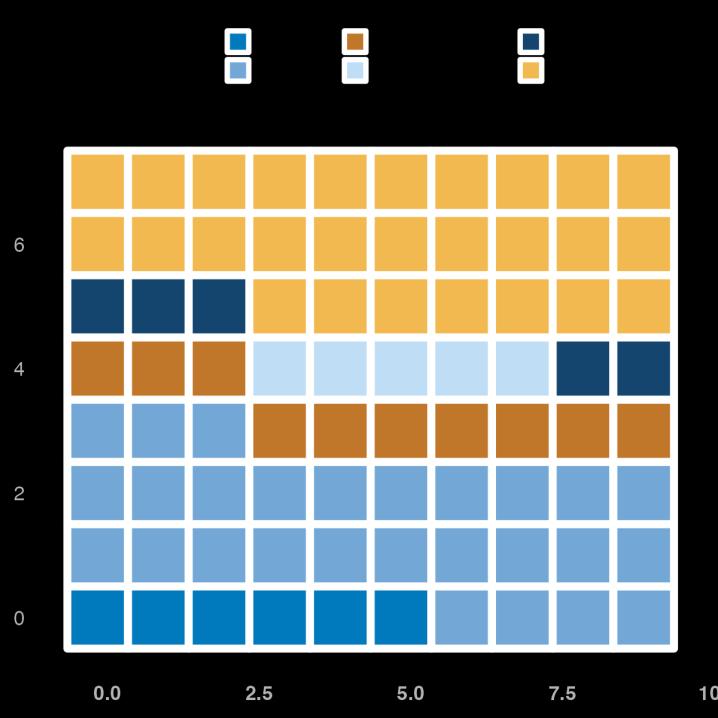
Resident Workers: Ethnicity
Residents of color are more likely to be out of the labor force and unemployed.
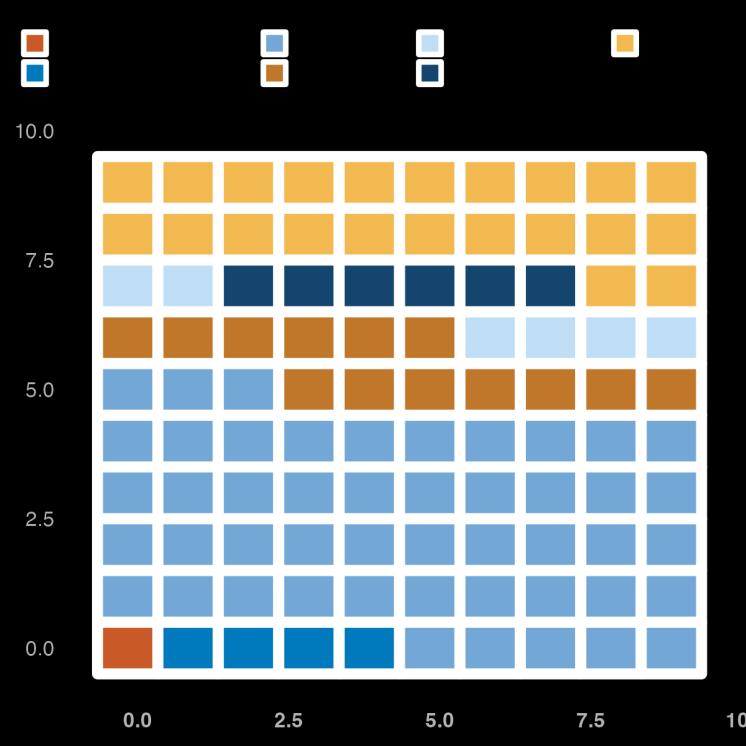
The grid charts (Figure 20 and Figure 21) provide a compelling visual representation of labor force participation and unemployment rates by race, using a 10x10 grid where each square represents 1% of the total. These charts reveal critical insights into the economic realities of different ethnic groups in Philadelphia.
The white population leads with a participation rate of 28%, followed closely by the black population at 27%. Asian and Hispanic populations have participation rates of 6% and 10%, respectively. Other racial groups, including American Indians, Pacific Islanders, and those identifying as two or more races, show lower participation rates.
The black population faces the highest unemployment rate at 48%, significantly surpassing other groups. The white population has an unemployment rate of 22%, while the Hispanic and Asian populations face rates of 13% and 4%, respectively.
Figure 15: Labor Force Participation Rate by Race, ACS 2023
Figure 16: Unemployment Percentage by Race, ACS 2023
Educational Attainment and Geospatial Pattern
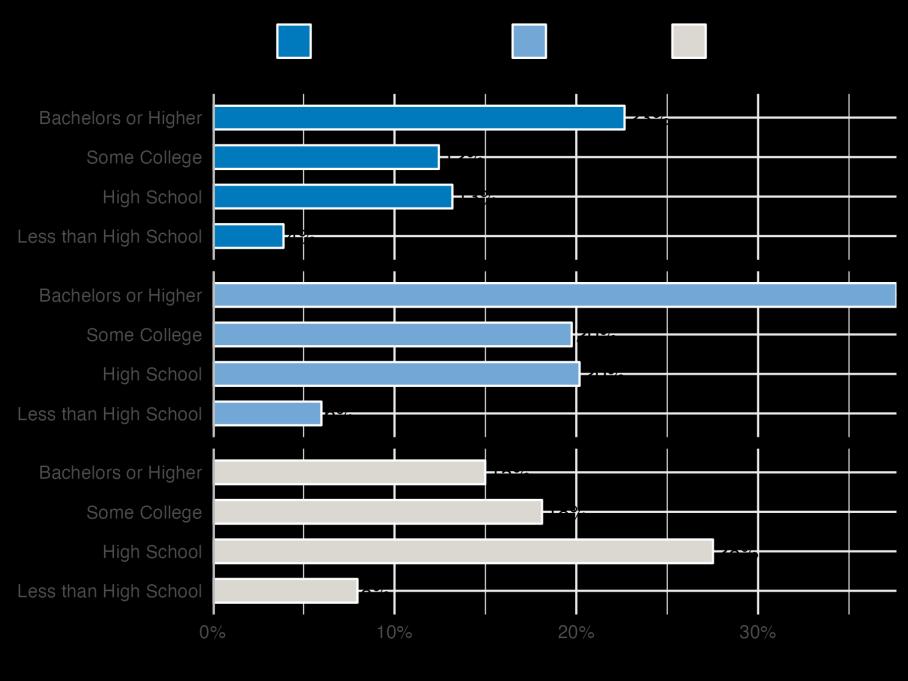
According to ACS 2023 data, in Philadelphia, individuals with a bachelor's degree or higher show the highest labor force participation and employment rates, along with the lowest unemployment rates. Conversely, those with less than a high school diploma face the most significant challenges, with the lowest participation and employment rates and the highest unemployment rates.
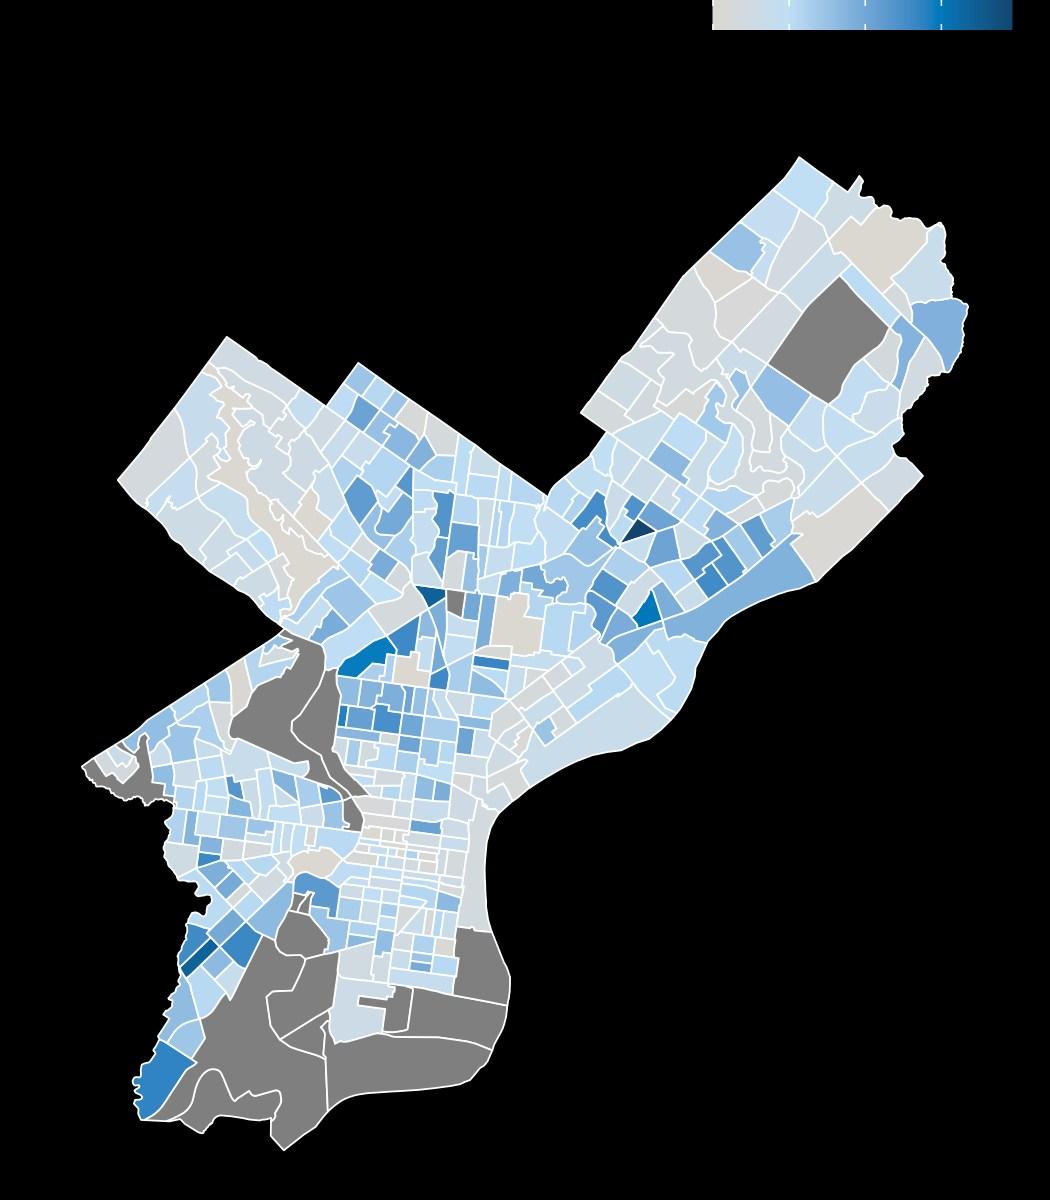
The map reveals notable geographic disparities in unemployment, with higher unemployment rates concentrated in North, Northeast, and Southwest Philadelphia. These areas have been experiencing economic challenges, suggesting a need for targeted interventions and support programs to address unemployment.
Meanwhile, the lighterareas, such as parts of Center City and Northwest Philadelphia, show lower unemployment rates and better conditions.
Map 3: Unemployment Rate (%) by Census Tract in Philadelphia, ACS 2023
Figure 17: Proportion of Employment and Labor Force Participation by Educational Attainment, ACS 2023
Geospatial Inflow & Outflow
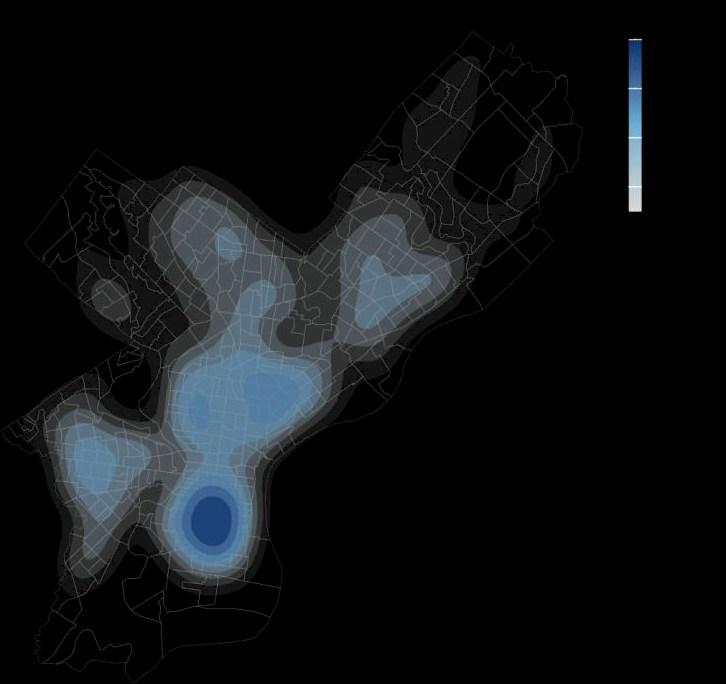
Philadelphia is intrinsically connected to its suburban neighbors. Nearly half of all primary jobs in the city are held by workers who commute from outside the city limits.
Commuting patterns have greatly changed in the years since COVID-19. According to 2022 ACS 5year estimates, darker shades in Map 4 and Map 5 indicate higher concentrations of employed residents and employed workers. The dense areas are found in Center City and parts of South Philadelphia.
Map 4: Residents Densityof Employment in Philadelphia, Total All Jobs, LEHD 2022
599,926
Total All Jobs Commute Out
15% Of Resident Workers Relied on Public Transportation in 2022
17% Of Resident Workers Had No Access to a Vehicle in 2022
Map 5: Workers Density of Employment in Philadelphia, Total All Jobs, LEHD 2022
676,054
Total All Jobs Commute In
Detailed Industry and Occupation Tables
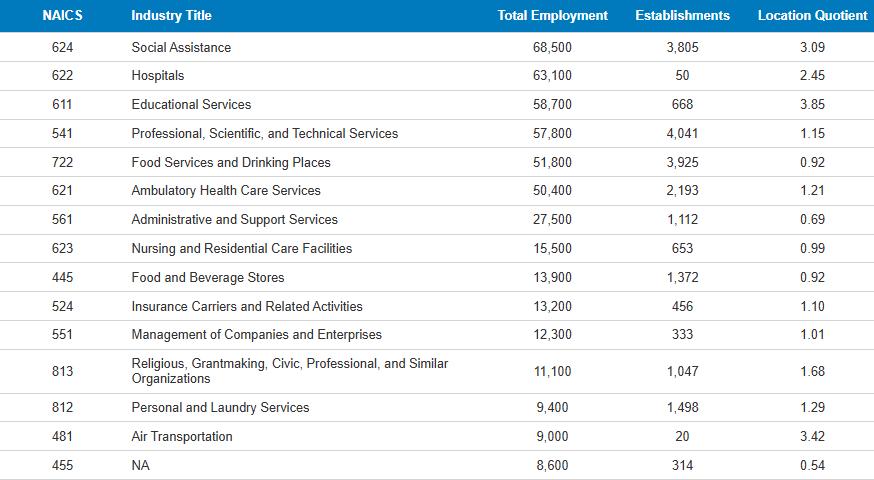
Appendix Table 1: Largest Detailed Industry Sectors in Philadelphia, Q4 2024
From the Quarterly Census of Employment and Wages, this table shows the 15 largest industry sectors by total employment. These data are released on a roughly six-month delay.
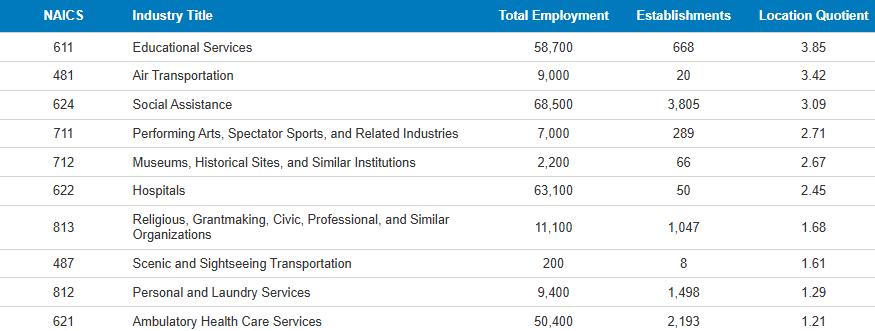
Appendix Table 2: Most Specialized Detailed Industry Sectors in Philadelphia, Q4 2024
From the Quarterly Census of Employment and Wages, this table shows the 10 most specialized industry sectors by total employment. These industries are disproportionately important to Philadelphia’s economy. These data are released on a roughly six-month delay.
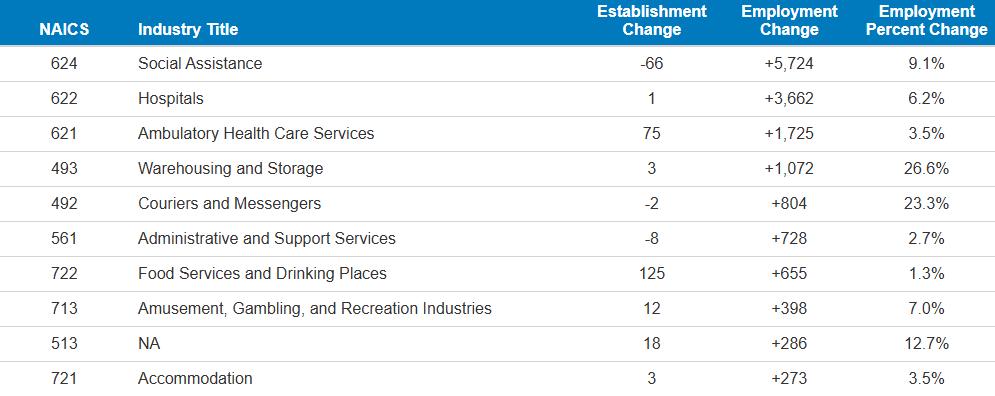
Appendix Table 3: Detailed Industry Sectors in Philadelphia with Largest Year-Over-Year Growth,
Q4 2024
From the Quarterly Census of Employment and Wages, this table shows the 10 industry sectors with the largest annual employment growth. These data are released on a roughly six-month delay.
Publishing Industries
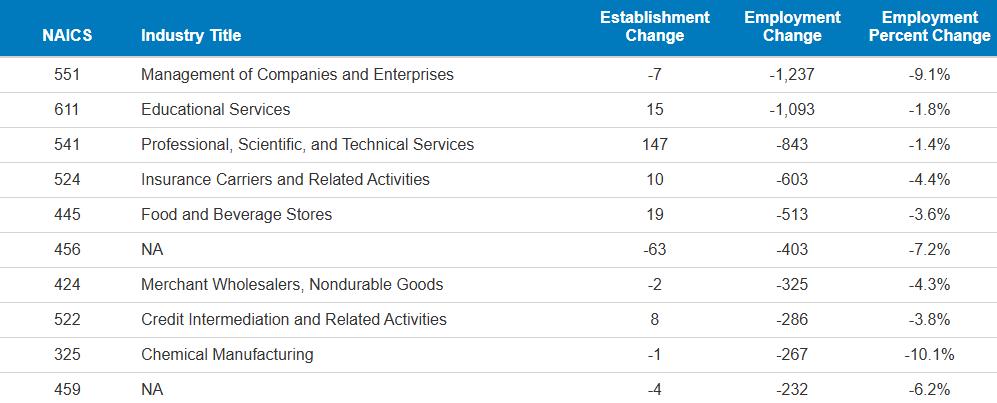
Appendix Table 4: Detailed Industry Sectors in Philadelphia with Largest Year-Over-Year Declines, Q4 2024
From the Quarterly Census of Employment and Wages, this table shows the 10 industry sectors with the largest annual employment declines. These data are released on a roughly six-month delay.
Clothing, Clothing Accessories, Shoe, and Jewelry Retailers
Office Supplies, Stationery, and Gift Retailers
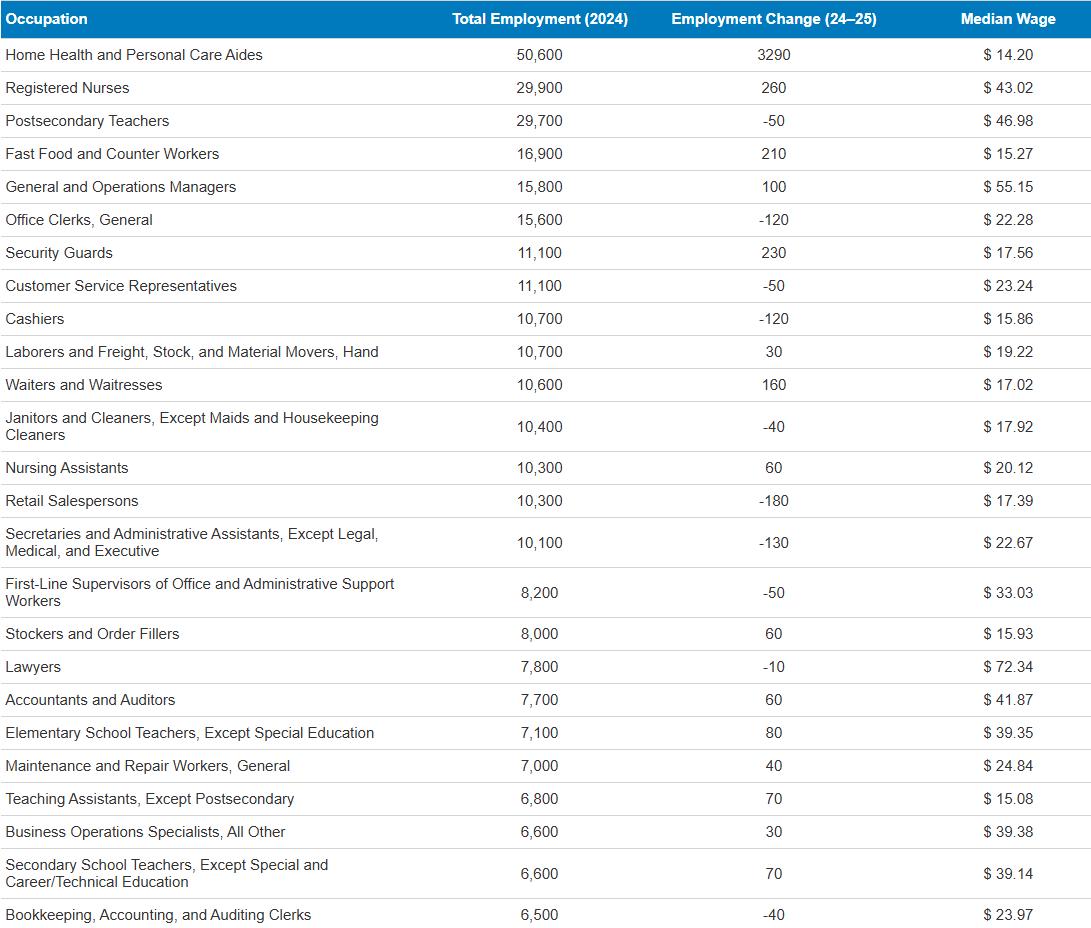
Appendix Table 5: Largest Occupations in Philadelphia with Employment Change from January 2024 to January 2025
Based on estimates derived from the Quarterly Census of Employment and Wages, this table shows the 25 largest occupation by total employment. These data are released on a roughly nine-month delay. Source: Philadelphia