Prepared by Philadelphia Works, Inc.


Using the latest available data, this quarterly update offers insight into Philadelphia’s labor market, industry mix, and economic development.
Page 03
The most recent data available on Philadelphia’s economy.
In 2018, Philadelphia’s institutionalandcommunity leaders collaboratedto develop a comprehensive workforce development strategy. This document, Fueling Philadelphia’s Talent Engine, calls on Philadelphia Works, Inc. to serve as the city’s hub of labor market and economic reportingand analysis. Under this mandate, this quarterly report provides insight into key measures of economicactivity, providing leaders across public and private institutions an easy-to-access update on how Philadelphia’s economy and labor force continue to evolve.
Page 11
Exploring recent trends in employer demand through job postings and other sources.
Page 16
Demographic, social, and economic characteristics of Philadelphia’s labor force.
For more insight into Philadelphia’s labor force, economic characteristics, and the employment dynamics, visit the Philadelphia Works website.
Detailed employment information for important industries and occupations in Philadelphia.
Philadelphia's labor market reflects both resilience and challenges in Q3 2024's economic landscape. While employment numbers remained relatively stable, unemployment edged higher, and the rising cost of living continues to outpace national averages.
• The unemployment rate reached 4.9%, with the number of unemployed residents increasing to 37,048. Despite this uptick, the labor force remained robust at 752,649, while total employment held at 715,602, demonstrating the market's underlying stability.
• Behind the numbers lies a changing economic landscape. Professional services workers are seeing healthy wage gains of 6.5%, while many service sector employees face more modest increases. Healthcare and education long the bedrock of Philadelphia's economy continue to drive employment but with slower wage growth than in previous quarters.
• Meanwhile, the cost of living, particularly housing and everyday services, continues to rise faster here than the national average.
• The job market shows signs of careful calibration, with 118,390 postings this quarter reflecting more selective hiring practices. Notable disparities exist across the city, with higher unemployment rates concentrated in North, Northeast, and Southwest Philadelphia. These patterns suggest the need for targeted support in specific communities.
“Continued economic growth is critical to the future of our city and region, and is dependent upon a strong, skilled workforce.”
Fueling Philadelphia’s Talent Engine


Employment in Philadelphia
September2024
Estimated Total Labor Force
752,649 + 8,259 year-over-year
Estimated Total Employment
715,602 + 5,577 year-over-year
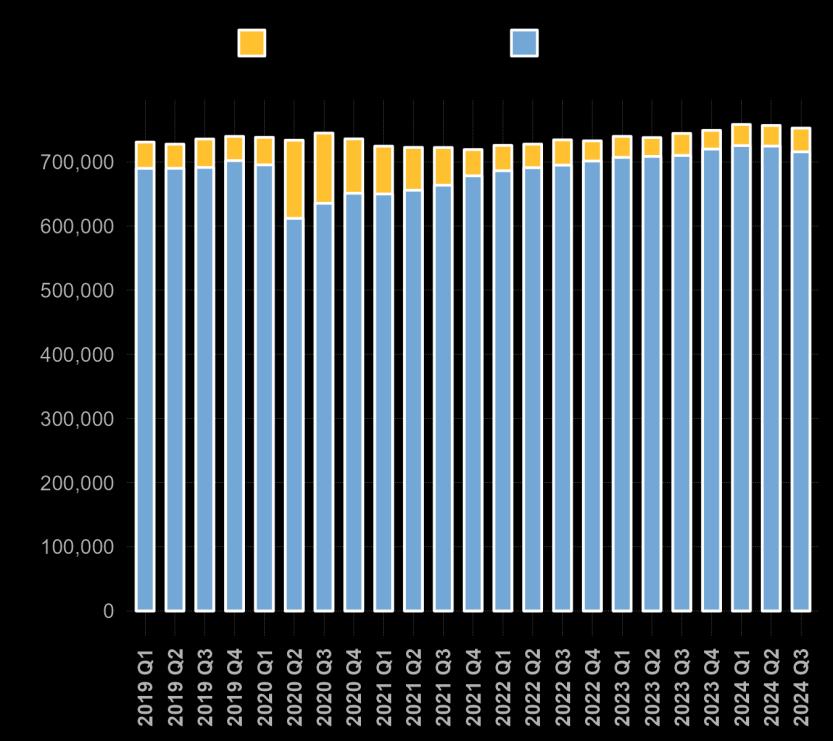
Philadelphia's workforce shows resilience amid economic pressures. The labor force reached 752,649 in Q3 2024, while total employment hit 715,602.
These gains demonstrate sustained growth, with year-over-year increases in both the labor force (+8,259) and employment (+5,577). Healthcare and education continue to drive growth, accounting for over 650,000 jobs.
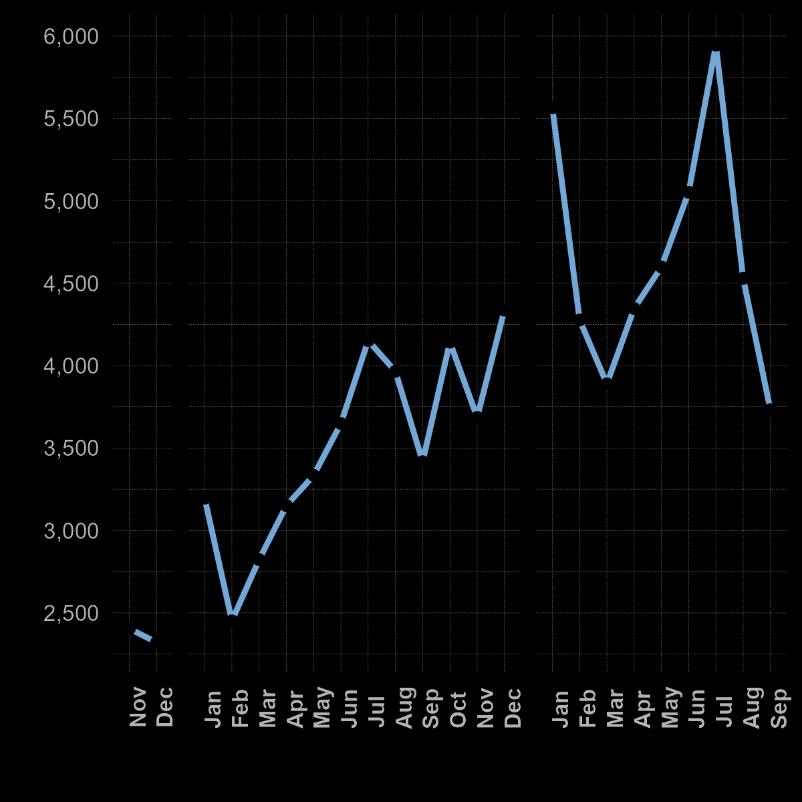
Figure 1:
Labor Force and Total EmploymentTrend inPhiladelphia: January 2019 to September 2024
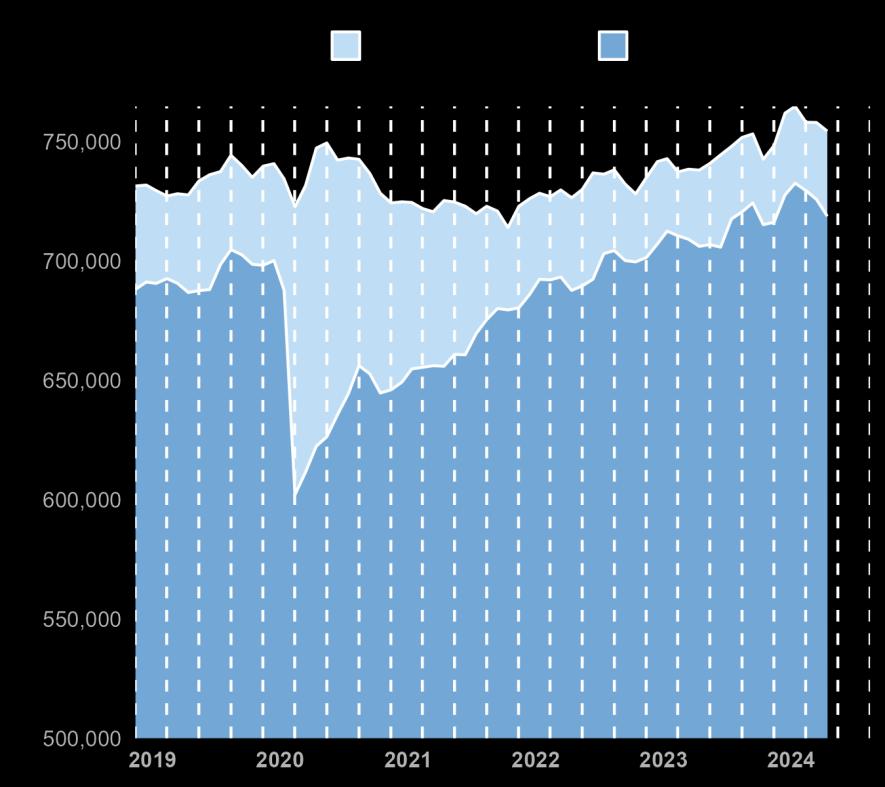
Figure 2
Total Employment Relative to January 2019 by Geography
Unemployment in Philadelphia
September 2024
Estimated Unemployment Rate
4.9% + 0.27points year-over-year
Estimated Unemployment
37,048 + 2,683 year-over-year
Behind September's 4.9% unemployment rate lies a complex puzzle of economic change. While 37,048 Philadelphians are seeking work up from last year many industries are still hiring.
From bustling hospital corridors to busy construction sites, the city's traditional economic engines keep humming. Yet some sectors face headwinds, particularly affecting neighborhood retail and service jobs.
It's a reminder that Philadelphia's economic story, like the city itself, is written neighborhood by neighborhood.
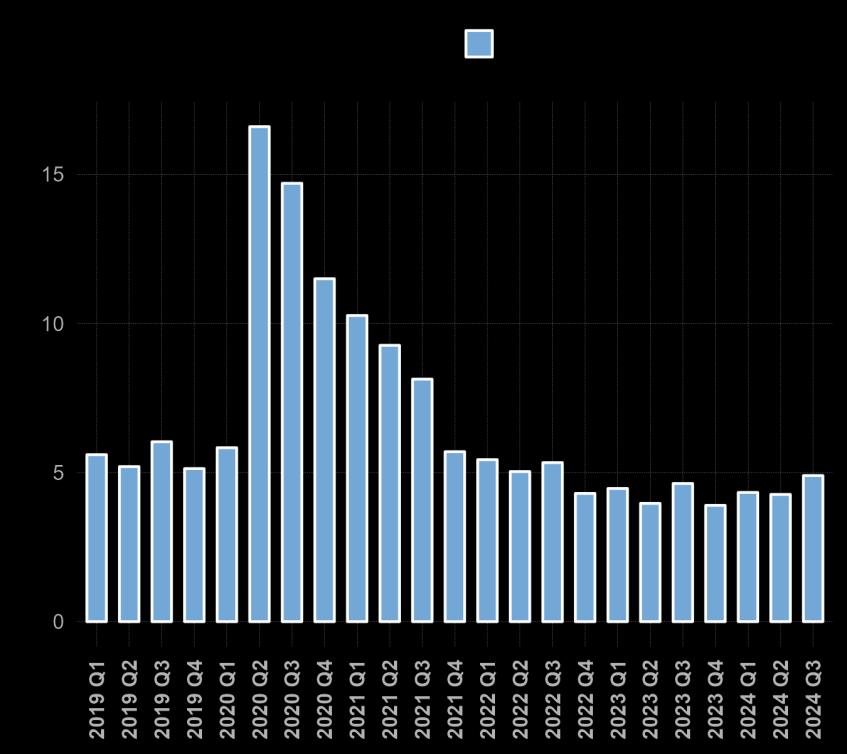
3: Unemployment Rate Since January 2019 in Philadelphia
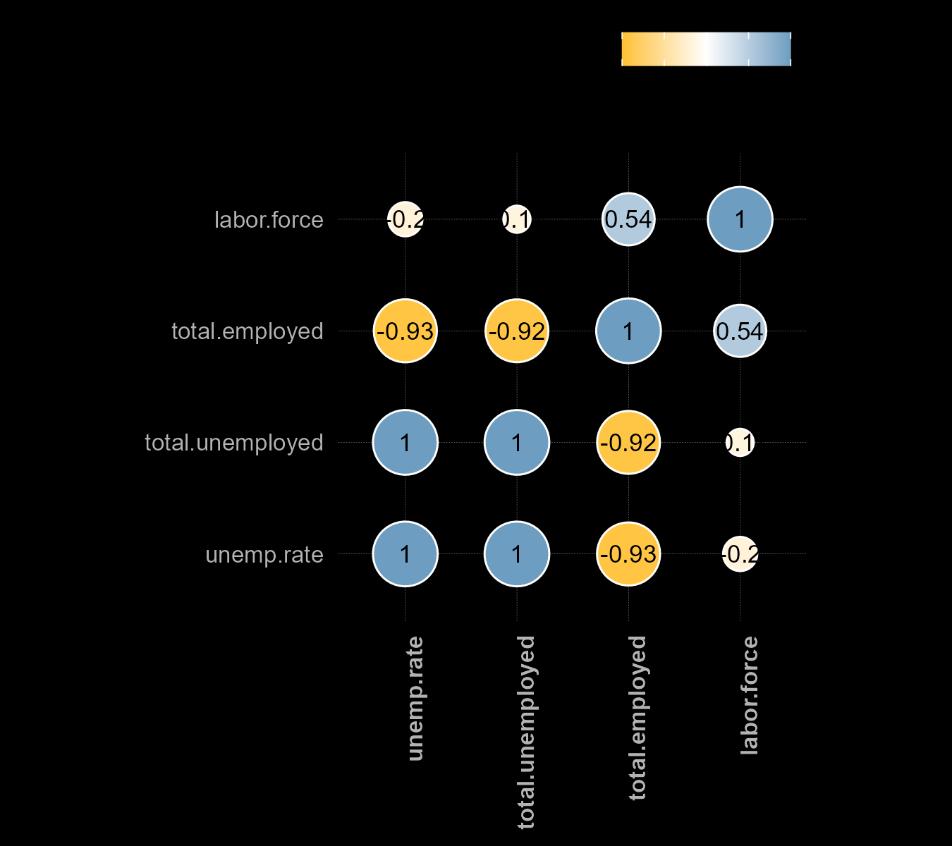
4: CorrelationMatrix of Four FeaturesSince January 2019

Philadelphia's job market tells a story of resilience and adaptation in Q3 2024. Behind the numbers a labor force of 752,649 and employment at 715,602 are thousands of Philadelphians navigating a changing workplace landscape.
After a promising start in the first half of the year, when unemployment held steady around 4.3%, the third quarter brought new challenges with a 4.9% of unemployment rate in October 2024.
Healthcare and education continue to anchor the economy, but other industries show signs of adjustment. The growing labor force up by over 8,000 from last year points to continued confidence in local job prospects, even as employers and workers adapt to evolving market demands.
The story behind these numbers reveals Philadelphia's distinctive strengths. While coastal peers like New York and Los Angeles still work to regain their footing, Philadelphia's diverse economy continues to push forward.
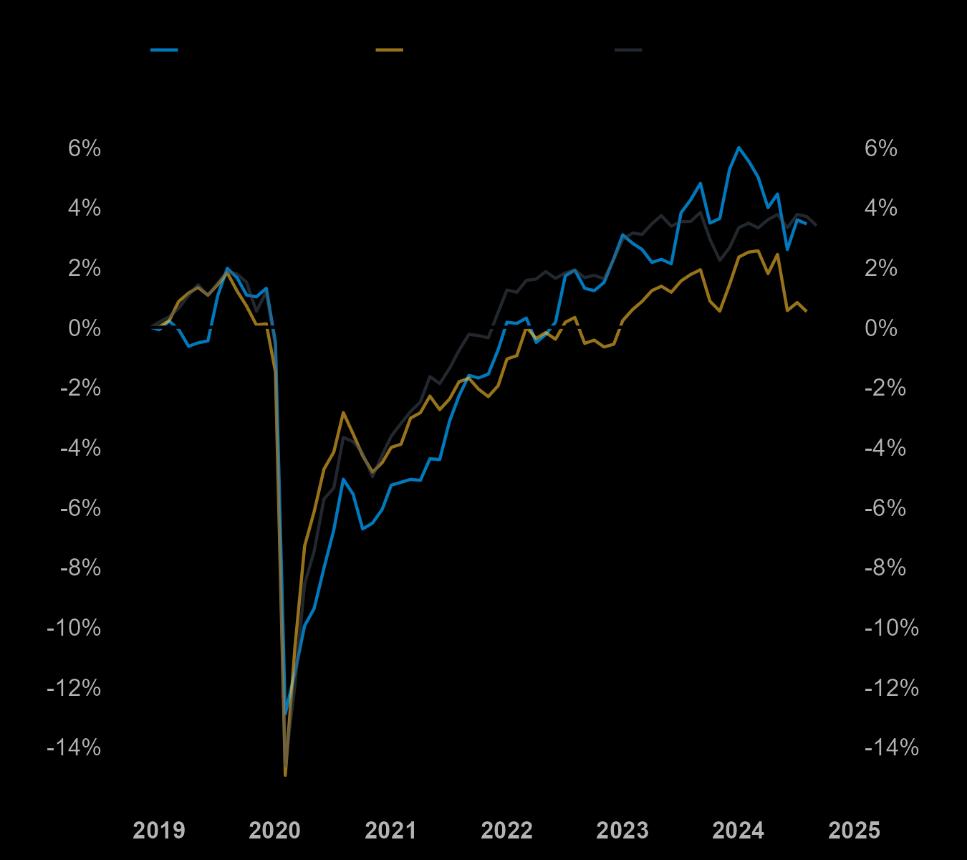
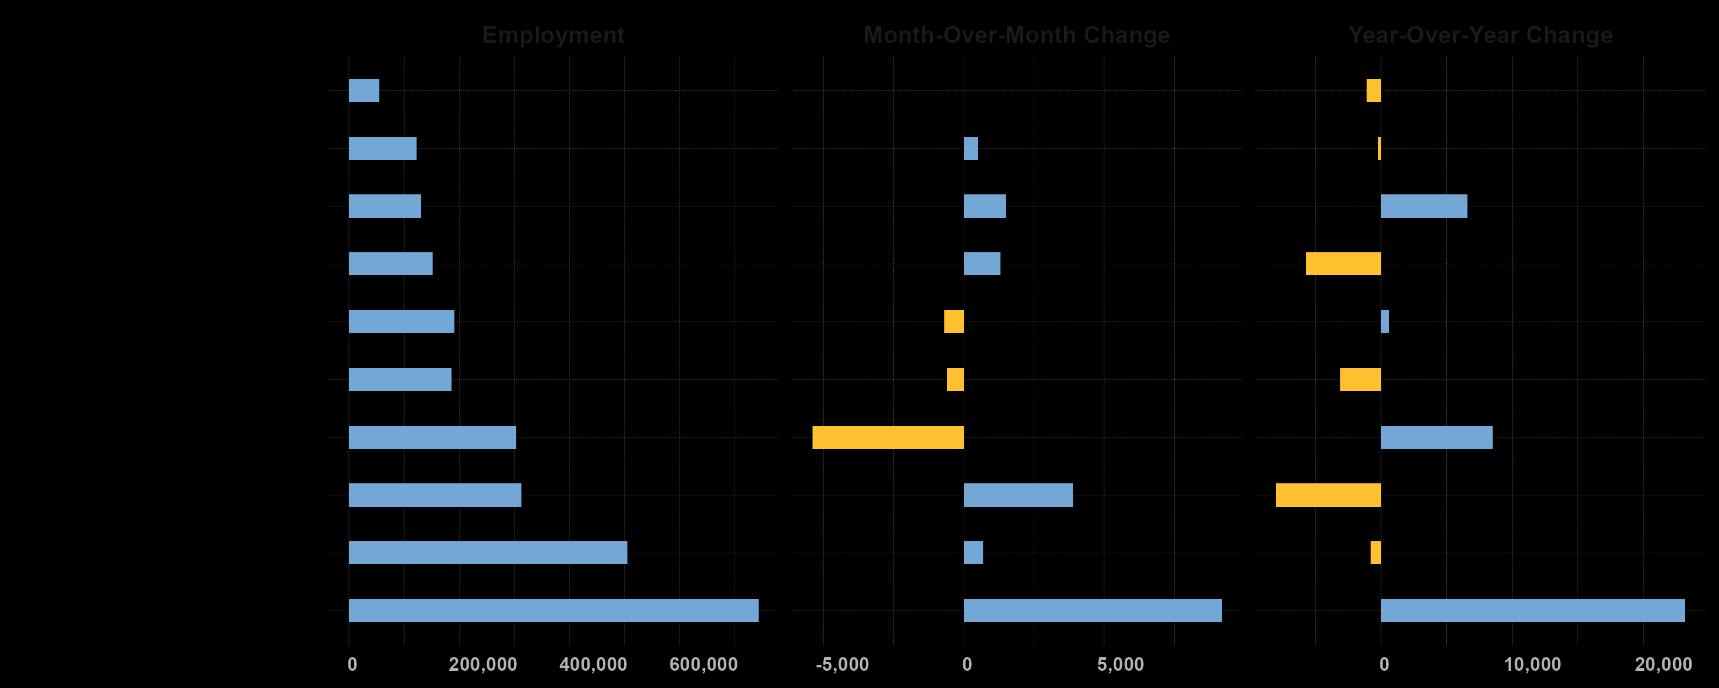
Figure 7: EmploymentChange Relative to Pre-Pandemic Employment,February2020 to September 2024
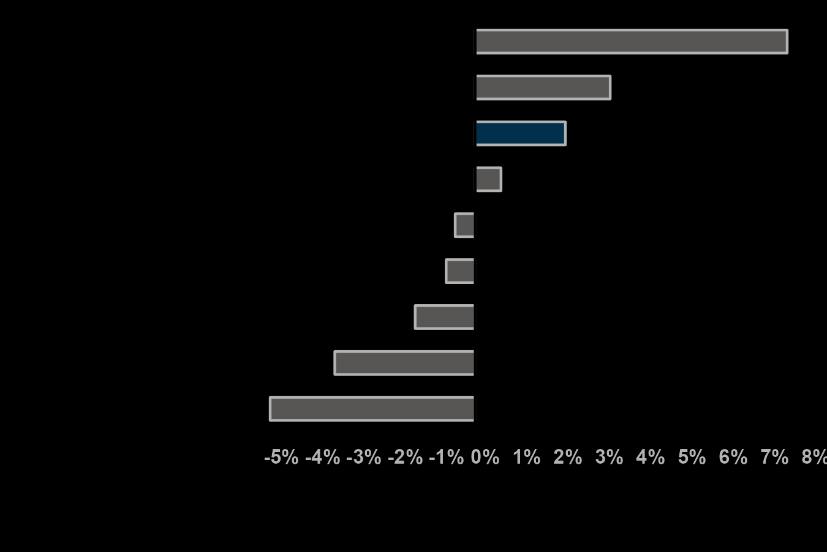
Figure 8: Relative EmploymentChange Year-Over-Year, September 2024
Education and healthcare remain powerful engines of growth, adding over 20,000 jobs year-over-year. Meanwhile, leisure and hospitality shows encouraging momentum, and construction activity signals ongoing confidence in the city's future.
Yet the data tells a nuanced tale. Month-to-month employment shifts suggest an economy in transition, with some sectors facing adjustment periods. But Philadelphia's proven ability to maintain steady growth even as other major cities struggle—points to underlying economic durability that continues to set it apart in the national landscape.
Figure 9: Regional Employmentby IndustrySector in Philadelphia MSA, September 2024
In addition to looking at industry development from a temporal perspective, a spatial perspective provides another distincthighlight. The American Community Survey (ACS) has been collecting data about the social, economic, demographic, and housing characteristics of the U.S. population with geographic information. We are analyzing 2023 ACS data and geodata to provide communities with current information for policy decision-making and further solutions.
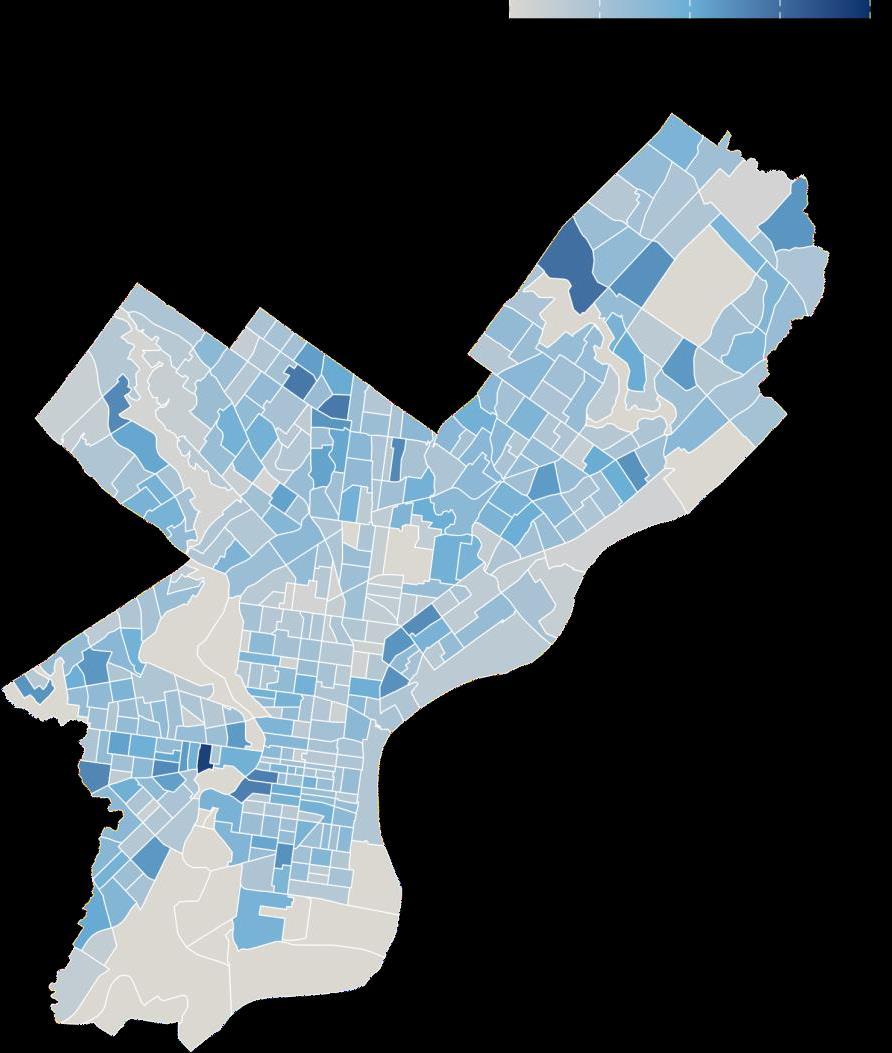
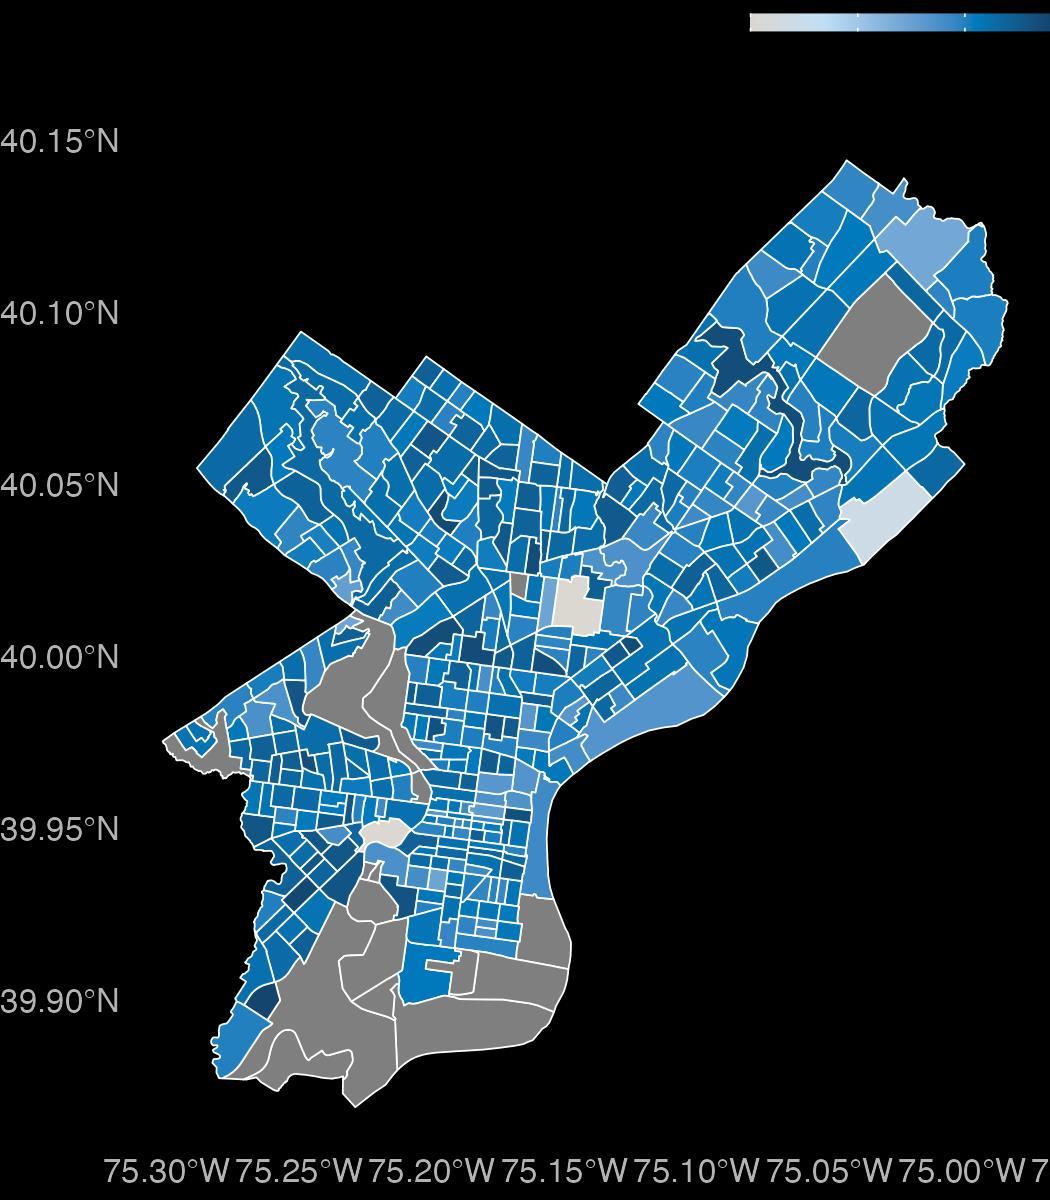
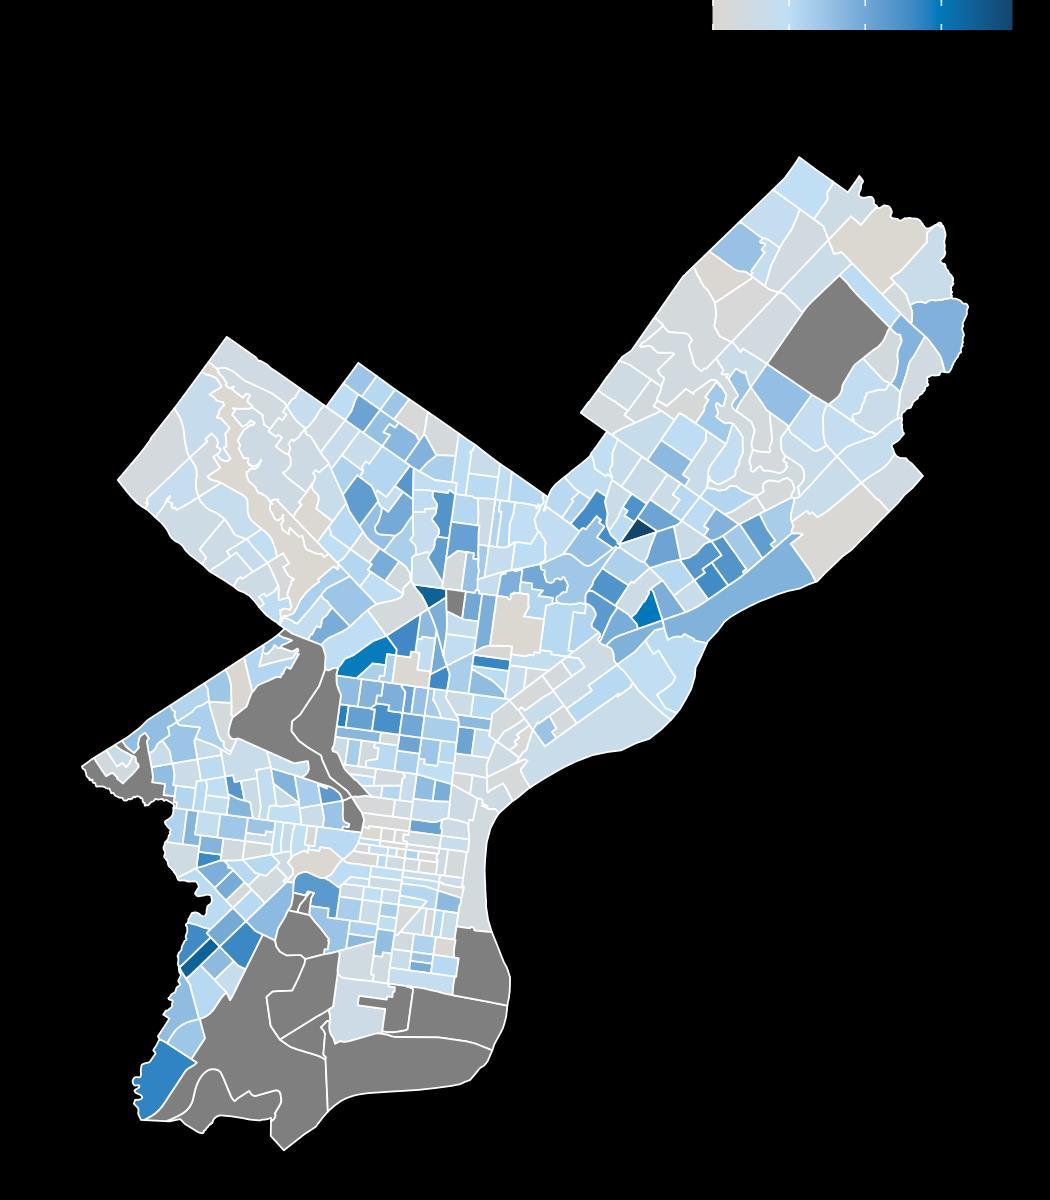
The regional economy in Philadelphia County is primarily driven by the Education and Health Services sector, which has shown predominant demand and growth in general. The map (Map 1) illustrates the geospatial distribution of sector development and growth at the census tract level in Philadelphia County.
Dark blue areas represent the highest concentration of employment in Education and Health Services, mainly in the west, center, and north of Philadelphia, near major health care centers and institutions. It also indicates a high density of employed individuals in those areas. Lighterblue areas have relatively fewer facilities for Education and Health Services, while the grey areas indicate no related clustered Education and Health Services.
Map 1: Education and Health Services
Employed Individuals Distribution, ACS 2023
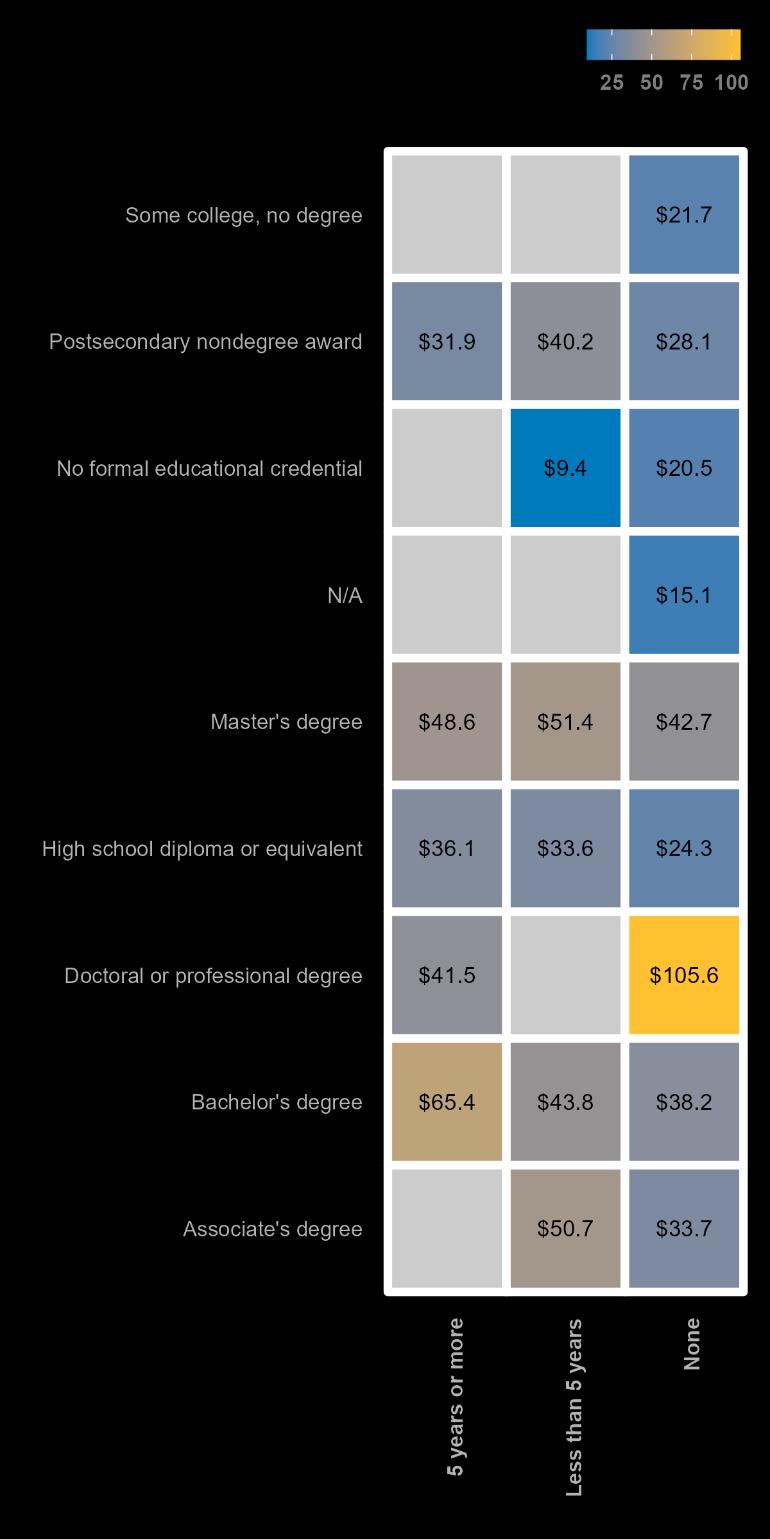
A modern workplace rewards both formal education and practical experience. While advanced degrees open doors to higher starting salaries, substantial work experience proves equally valuable
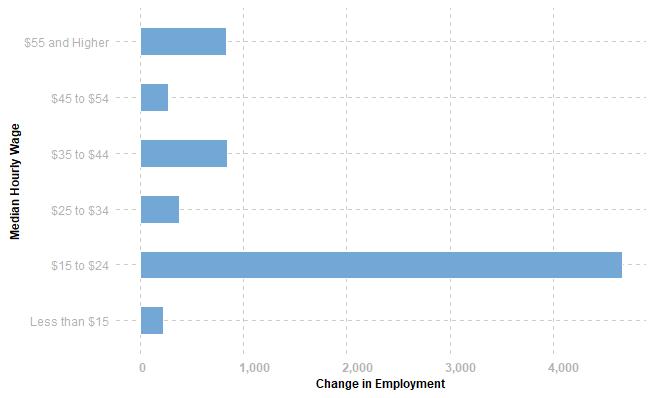
Philadelphia's workforce is seeing meaningful wage gains, particularly in middle-income jobs. The most robust growth appeared in positions paying $15 to $24 per hour, while steady increases continued in higher brackets of $25-44 per hour, painting a picture of broad-based wage advancement.
Education and experience emerge as powerful forces in determining earning potential. Those with doctoral degrees and extensive experience can command up to $105.6 per hour, while bachelor's degree holders see their earnings climb from $38.2 to $65.4 as they gain experience. Even workers without formal degrees are finding paths to higher wages through experience, with some reaching $20.5 per hour.
10: Relation Between Education Level, Median Hourly Earnings and Work Experience,2023 to 2024
11: Relation BetweenEducationLevel, MedianHourly Earnings and Work Experience, Jan 2023 to September 2024
A notable rise in claims from healthcare workers, particularly home health aides (628 claims), emerged as a leading indicator of sector-specific challenges. Security guards and customer service representatives followed closely in unemployment filings, suggesting shifts in service-related positions.
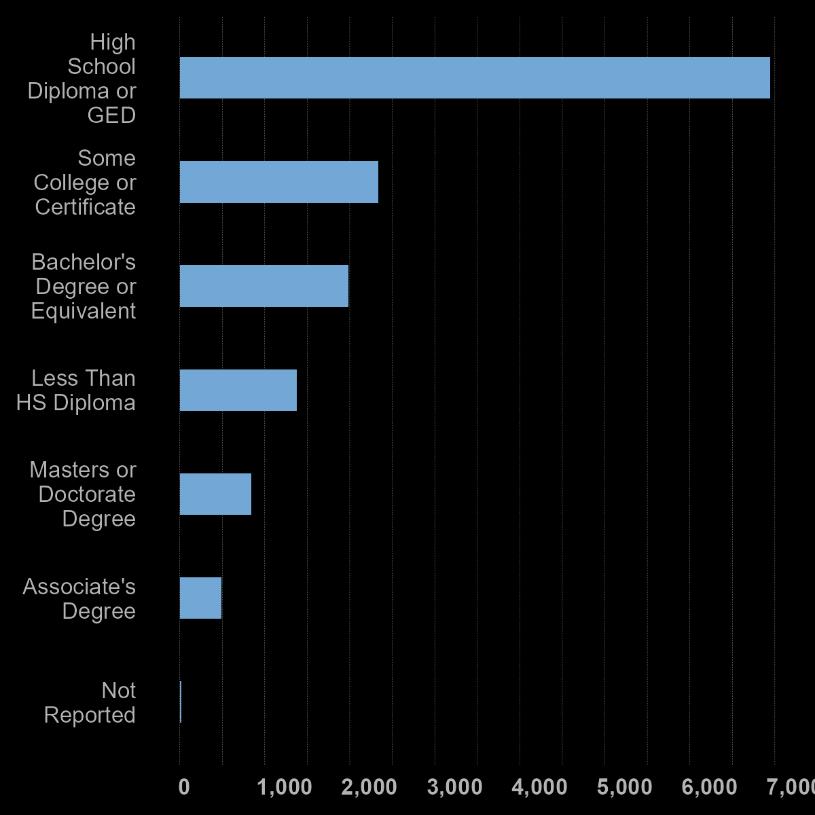
While high school graduates filed the largest share of claims at 7,046, a significant number of workers with some college (2,370) and bachelor's degrees (1,996) also sought unemployment support, indicating changes across various skill levels.
The data points to targeted pressures in frontline services rather than broad-based job losses. Healthcare, security, and customer service positions traditionally stable employment sources in Philadelphia showed the most movement, potentially signaling structural changes in these key sectors.
13: ReportedEducational Attainment of Philadelphia Claimants, January to

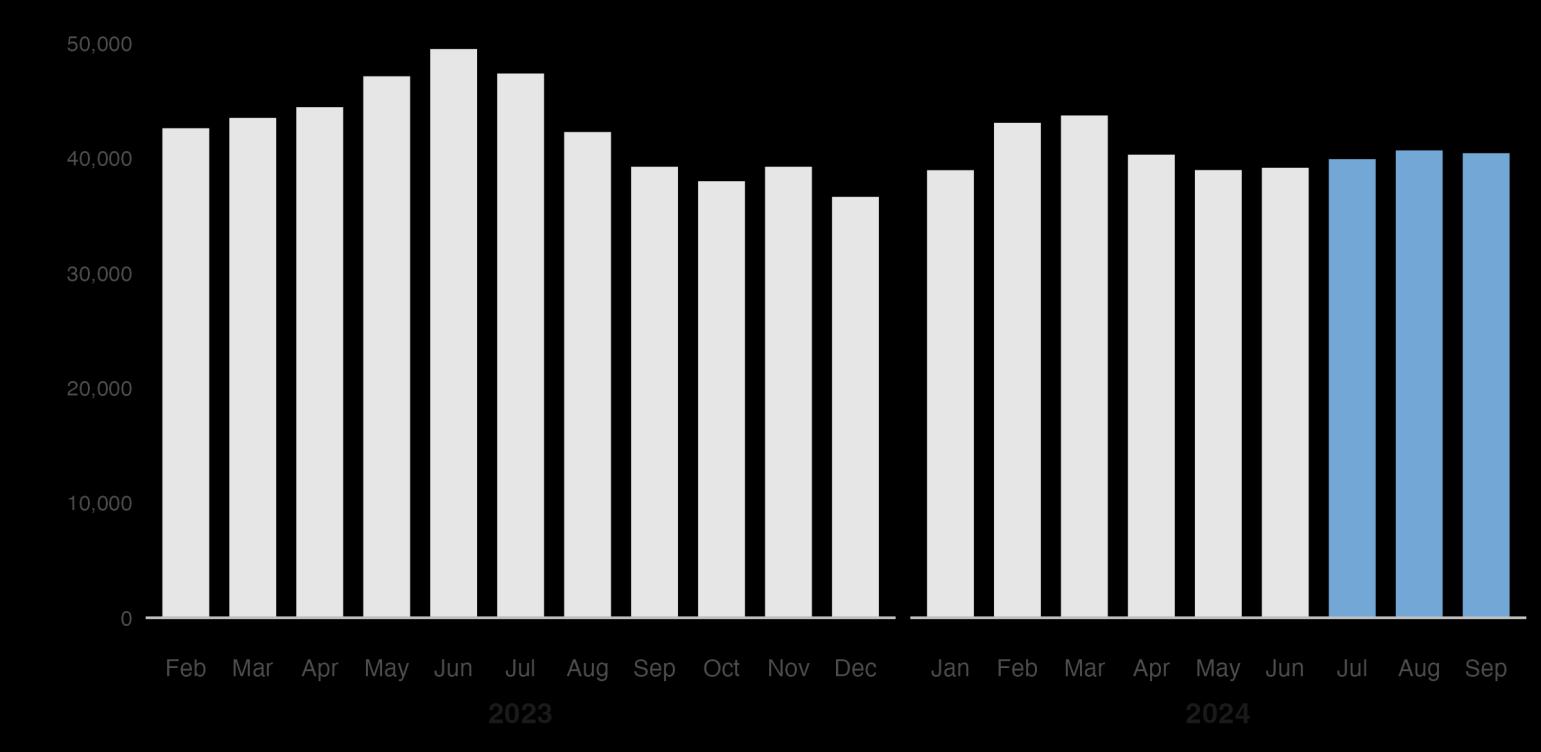
Philadelphia employers have shown recovering demand for labor over the last two years. However, this quarter saw a decline in job postings, following national trends of dampened demand.
Philadelphia's employment landscape remains rich with opportunity. After a bustling start to 2024, when help-wanted signs seemed to pepper every corner, the city's employers posted 118,390 job openings in Q3 a sign that hiring managers are becoming more selective but haven't closed their doors.
The dip of 4,154 job postings from last quarter tells a story of careful calibration rather than retreat. Employers are posting jobs with more strategic intent.
Q3 2024
Total Job Postings
118,390
Change in Total Postings Over Previous Quarter
-4,154
14: Monthly Job Postings in Philadelphia County, Previous 18 Months


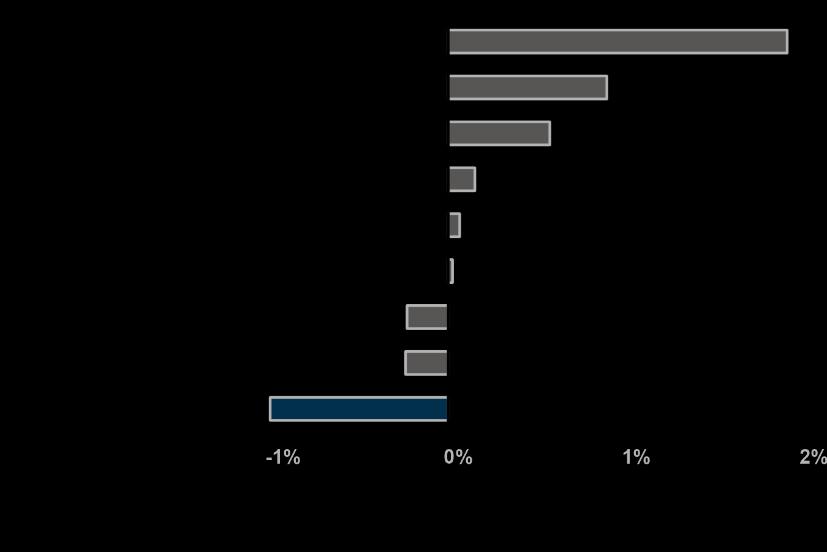
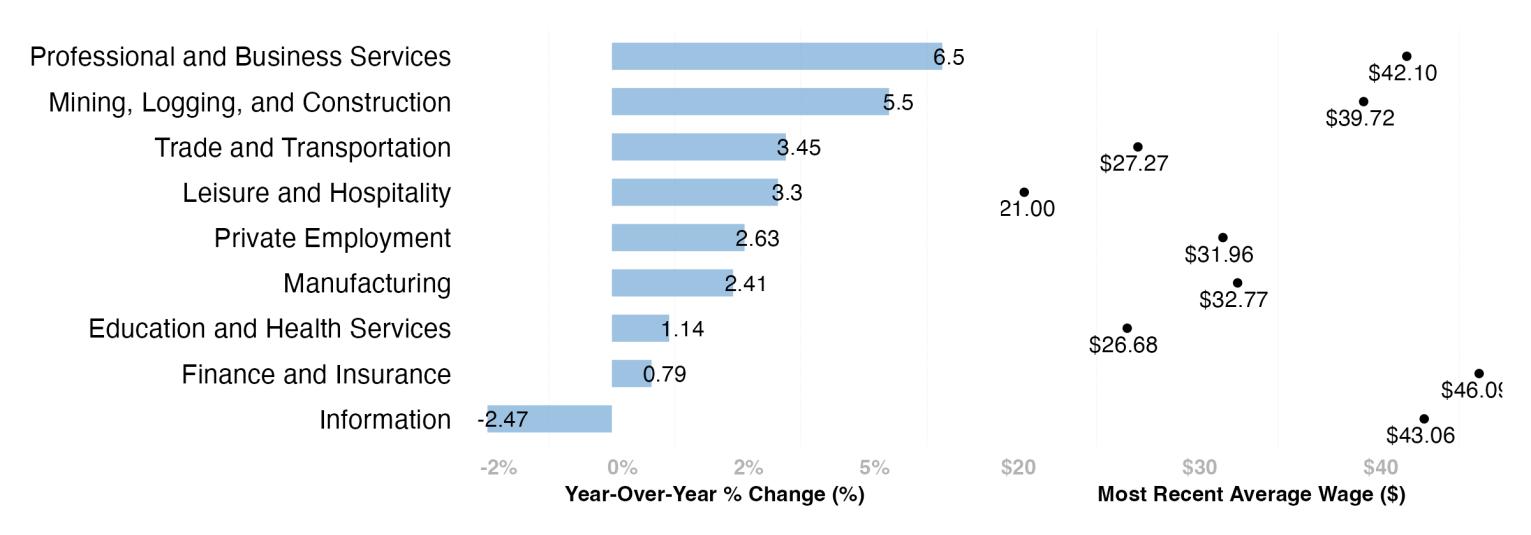
While Pennsylvania's professional services workers are seeing their paychecks grow by a robust 6.5%, with average wages hitting $42.10 per hour, Philadelphia's overall wage growth has taken a different path, lagging behind both state and national trends. The story isn't uniform across industries Construction workers are seeing solid gains of 5 5%, and hospitality workers' wages are up 3 3%, offering a bright spot in the service sector Meanwhile, the information sector faces headwinds with a 2.47% decline, suggesting a shifting technological landscape.
15: PennsylvaniaYear-over-YearWage Growth, September 2024
After riding high in early 2022, the city's wage growth has moderated more sharply than its peers, hinting at deeper structural changes in how the local economy rewards its workforce. This pattern of adjustment, while challenging for many workers, may signal an economy finding its post-pandemic equilibrium.
16: Year-over-YearChange inAverageHourly Wages, All Private Employment
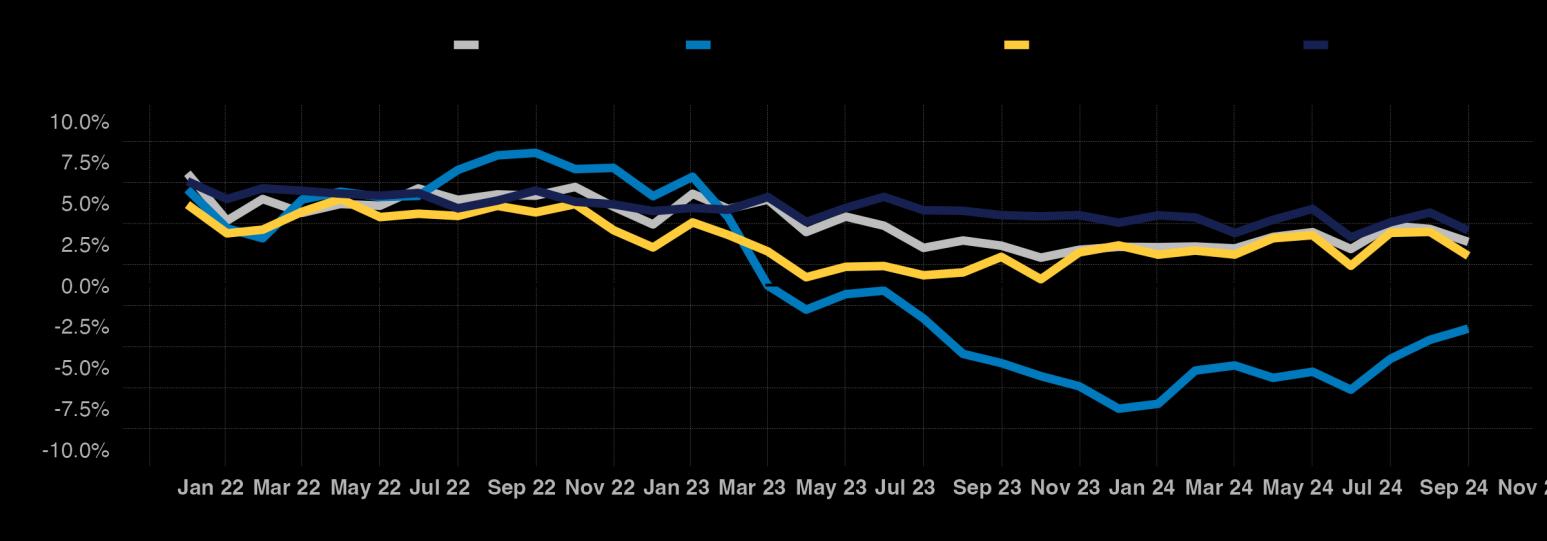
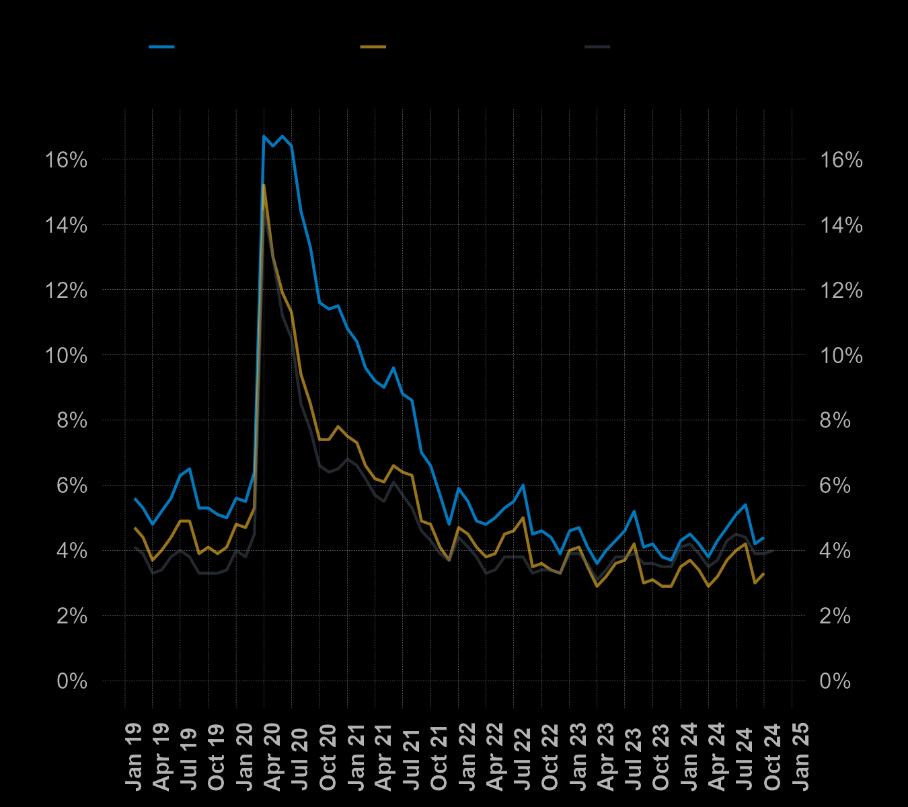
Figure 17: Bimonthly Year-Over-YearInflationAccordingtothe ConsumerPrice Index,2021 to Present
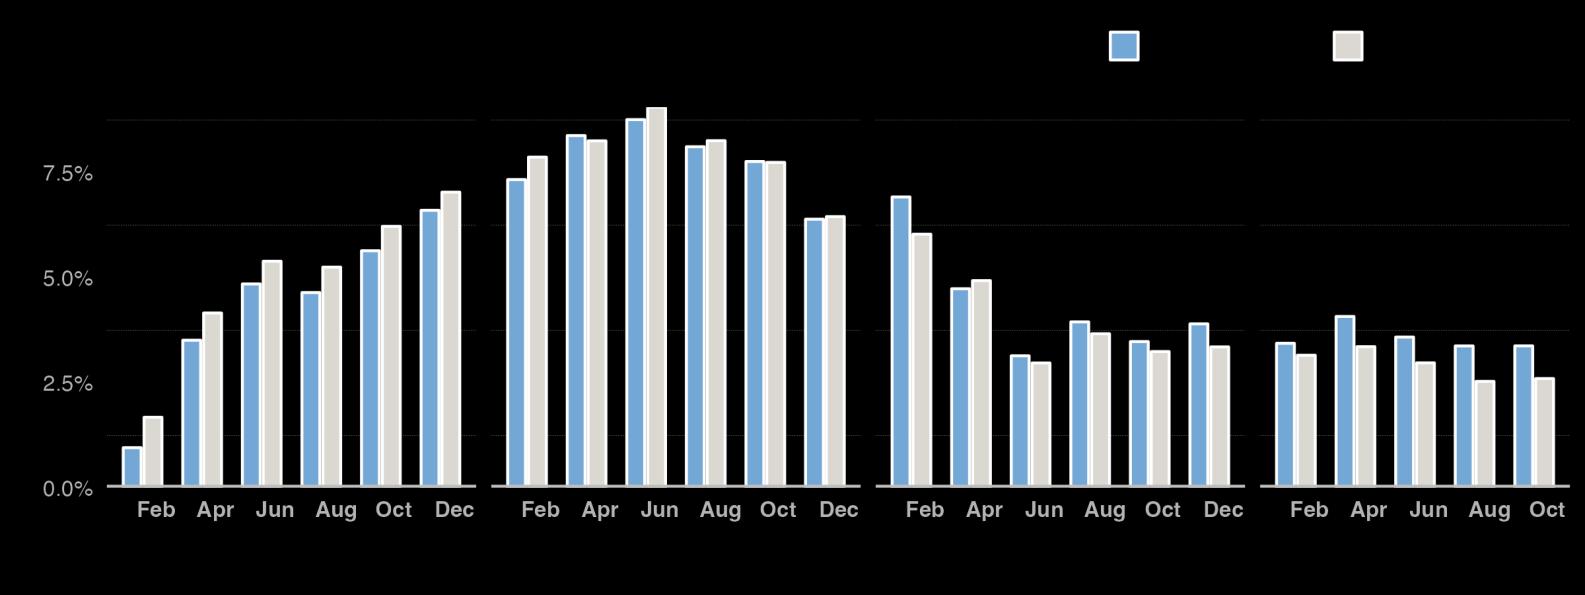
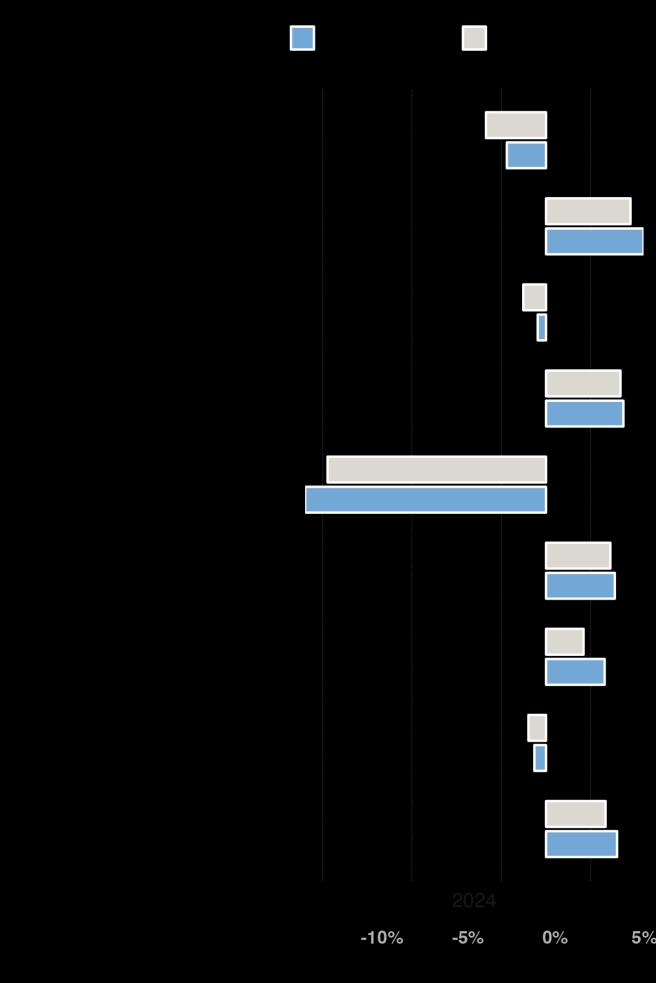
Figure 18: Bimonthly Year-Over-Year Change of InflationBucket , 2024
Philadelphia's cost of living story has taken some unexpected turns. While both the city and nation have moved past the sharp price spikes of 2022, Philadelphia's inflation path now shows its own character, running slightly above national levels since late 2023.
The details tell a more nuanced story.
Philadelphians are finding some relief at the gas pump and on utility bills compared to national averages. However, housing costs and everyday services continue to press upward more strongly in the city than across the country. It's a mix that particularly affects urban residents, with housing and service costs touching many aspects of daily life.

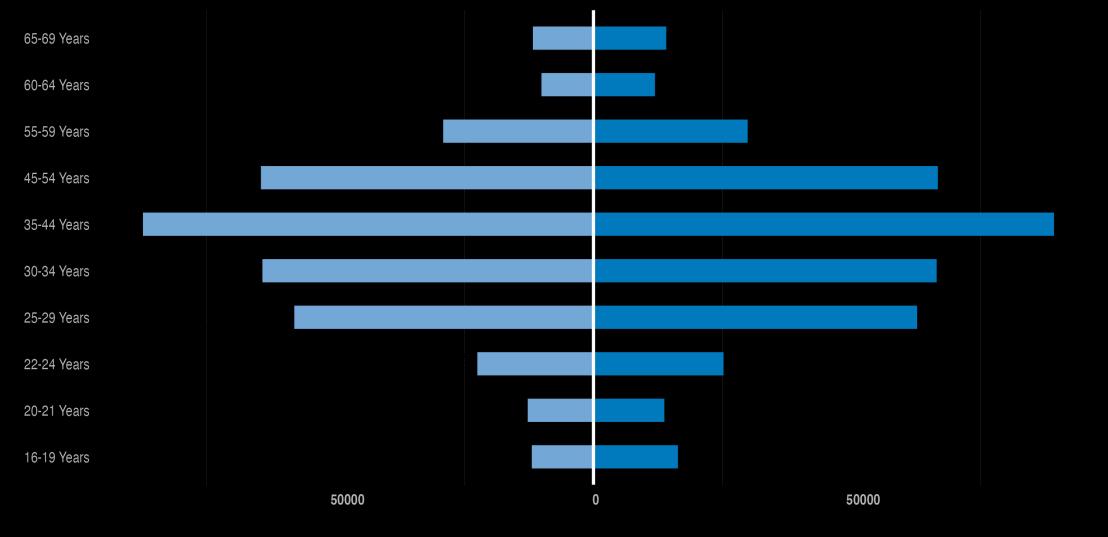
Based on Census data and ACS data, individuals between the agesof 25 and 34 make up the largest portions of Philadelphia’s population and labor force For both men and women, labor force participation among these age cohorts is between 80% and 87%, higher than the overall rate.
Figure 19: Labor Force by Age and Binary Sex, ACS 2023 Female Male
Map 2: Labor Force Participation Rate (%) GenderGap, ACS 2023
While Philadelphia’s labor force has grown in recent years, employment outcomes vary by race, ethnicity, and educational attainment.
The gender gap is calculated as the difference between female and male Labor Force Participation Rates (LFPR). The map (Map 2) highlights the gender gap in LFPR across Philadelphia County, derived from the 2023 ACS.
Areas with darker blue shades, particularly in North and Northeast Philadelphia, indicate significant disparities where men's participation rates are much higher than women's. Central and Southern Philadelphia showing as lighterblue areas, saw a more balanced LFPR between genders.
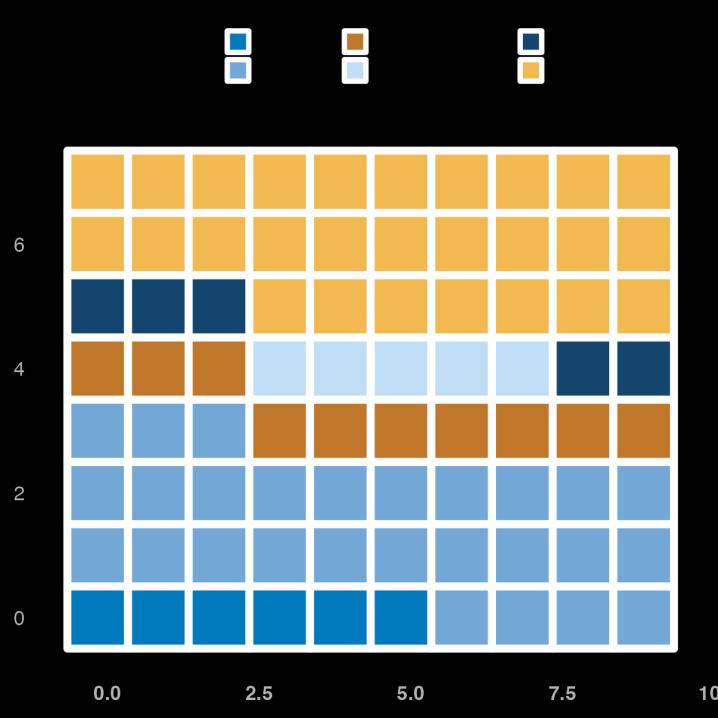
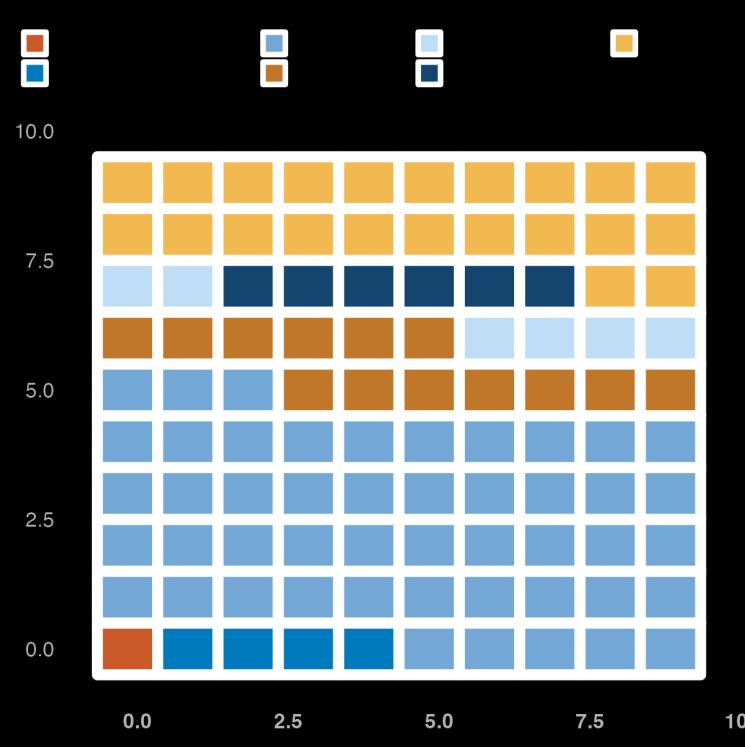
The grid charts (Figure 20 and Figure 21) provide a compelling visual representation of labor force participation and unemployment rates by race, using a 10x10 grid where each square represents 1% of the total. These charts reveal critical insights into the economic realities of different ethnic groups in Philadelphia.
The white population leads with a participation rate of 28%, followed closely by the black population at 27%. Asian and Hispanic populations have participation rates of 6% and 10%, respectively. Other racial groups, including American Indians, Pacific Islanders, and those identifying as two or more races, show lower participation rates.
The black population faces the highest unemployment rate at 48%, significantly surpassing other groups. The white population has an unemployment rate of 22%, while the Hispanic and Asian populations face rates of 13% and 4%, respectively.
According to ACS 2023 data, in Philadelphia, individuals with a bachelor's degree or higher show the highest labor force participation and employment rates, along with the lowest unemployment rates.
Figure 22: Proportion of Employmentand Labor Force Participation by Educational Attainment, ACS 2023

The map reveals notable geographic disparities in unemployment, with higher unemployment rates concentrated in North, Northeast, and Southwest Philadelphia. These areas have been experiencing economic challenges, suggesting a need for targeted interventions and support programs to address unemployment.
Meanwhile, the lighterareas, such as parts of Center City and Northwest Philadelphia, show lower unemployment rates and better conditions.
Conversely, those with less than a high school diploma face the most significant challenges, with the lowest participation and employment rates and the highest unemployment rates.
Map 3: Unemployment Rate (%) by Census Tract in Philadelphia, ACS 2023
Philadelphia is intrinsically connected to its suburban neighbors. Nearly half of all primary jobs in the city are held by workers who commute from outside the city limits.
Commuting patterns have greatly changed in the years since COVID-19. According to 2022 ACS 5year estimates, darker shades in Map 4 and Map 5 indicate higher concentrations of employed residents and employed workers. The dense areas are found in Center City and parts of South Philadelphia.
Map 4: Residents Densityof Employmentin Philadelphia , Total All Jobs, LEHD 2021
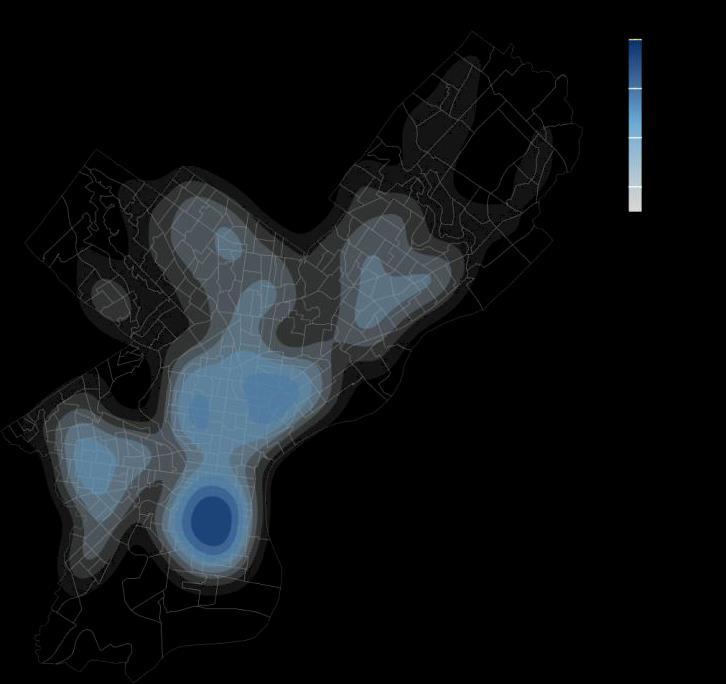
599,926
Total All Jobs Commute Out
15%
Of Resident Workers Relied on Public Transportation in 2021
17%
Of Resident Workers Had No Access to a Vehicle in 2021
Map 5: WorkersDensity of Employment in Philadelphia, Total All Jobs, LEHD 2021
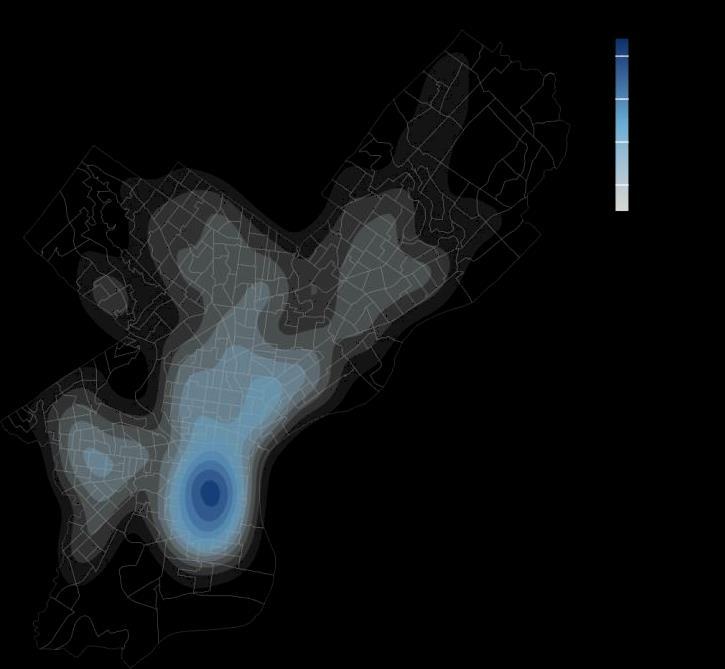
676,054
Total All Jobs Commute In

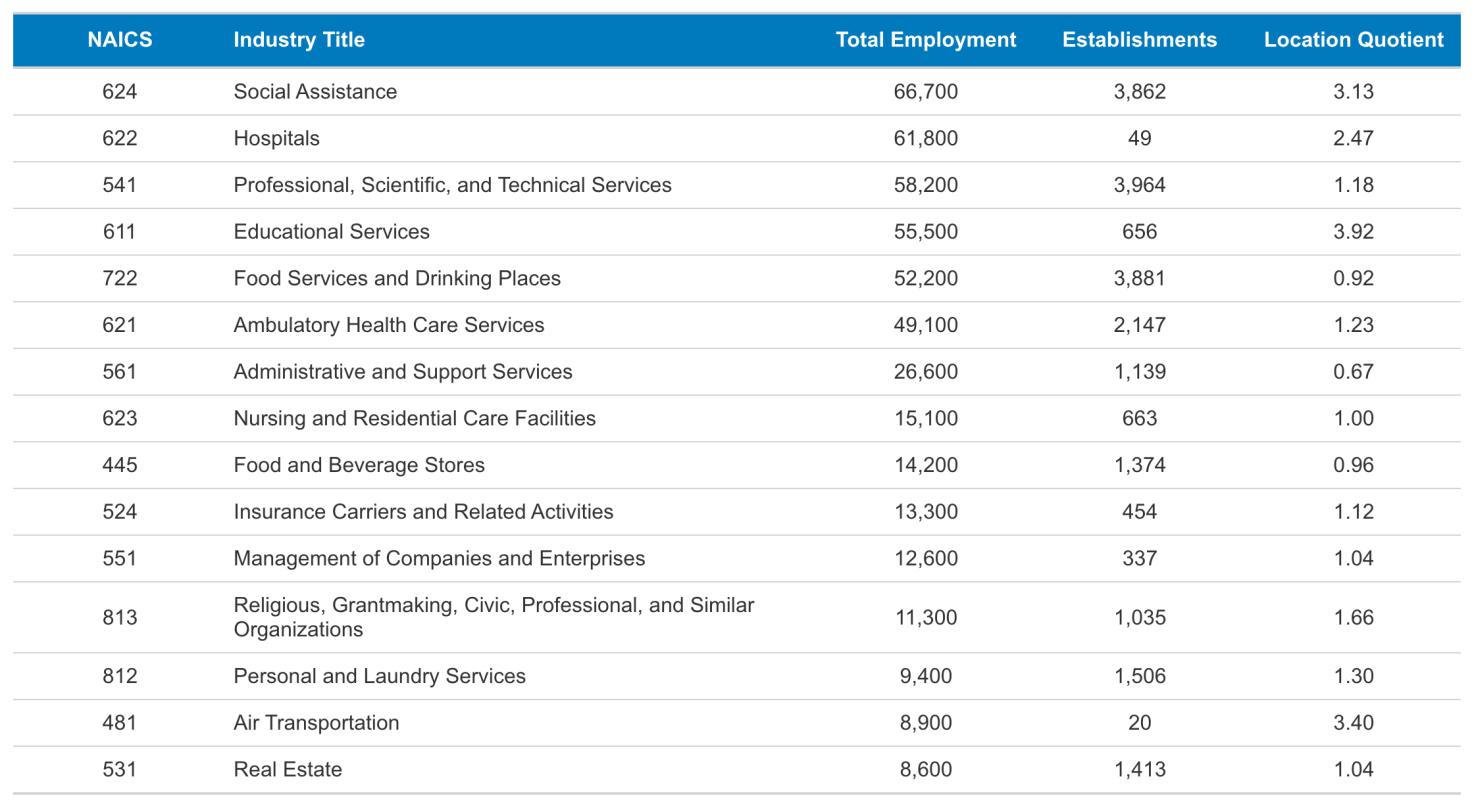
Appendix Table 1: Largest Detailed Industry Sectors in Philadelphia, Q3 2024
From the Quarterly Census of Employment and Wages, this table shows the 15 largest industry sectors by total employment. These data are released on a roughly six-month delay.
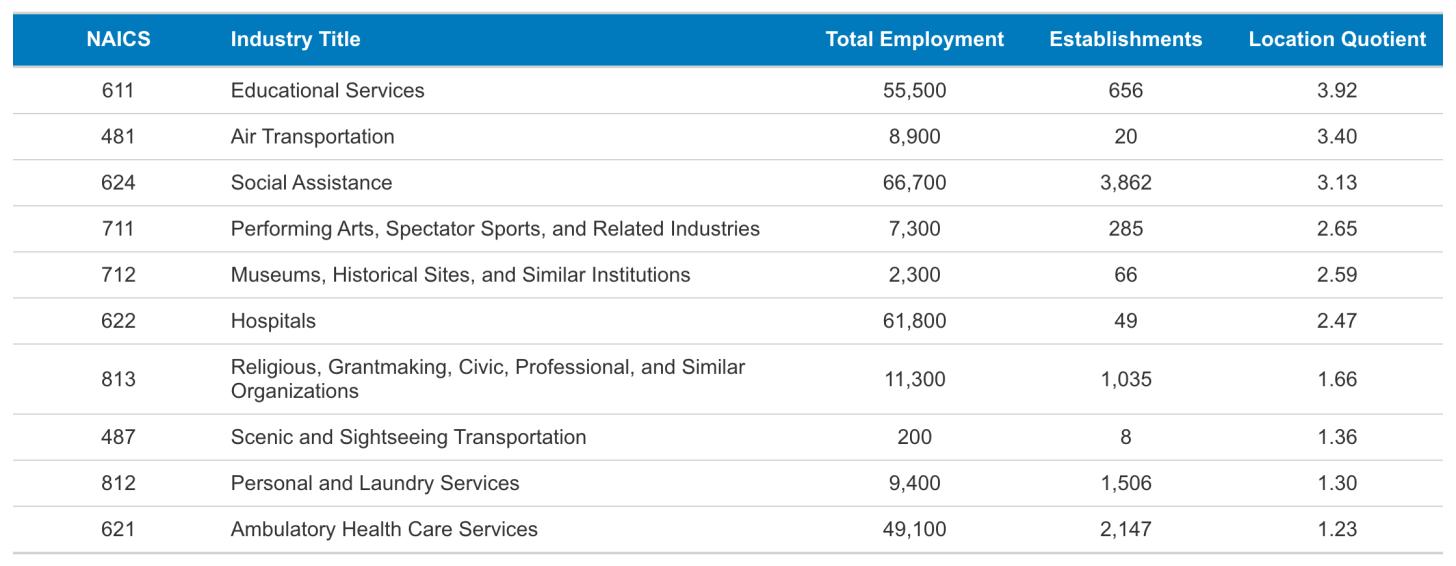
From the Quarterly Census of Employment and Wages, this table shows the 10 most specializedindustry sectors by total employment. These industries are disproportionately important to Philadelphia’s economy. These data are released on a roughly six-month delay.
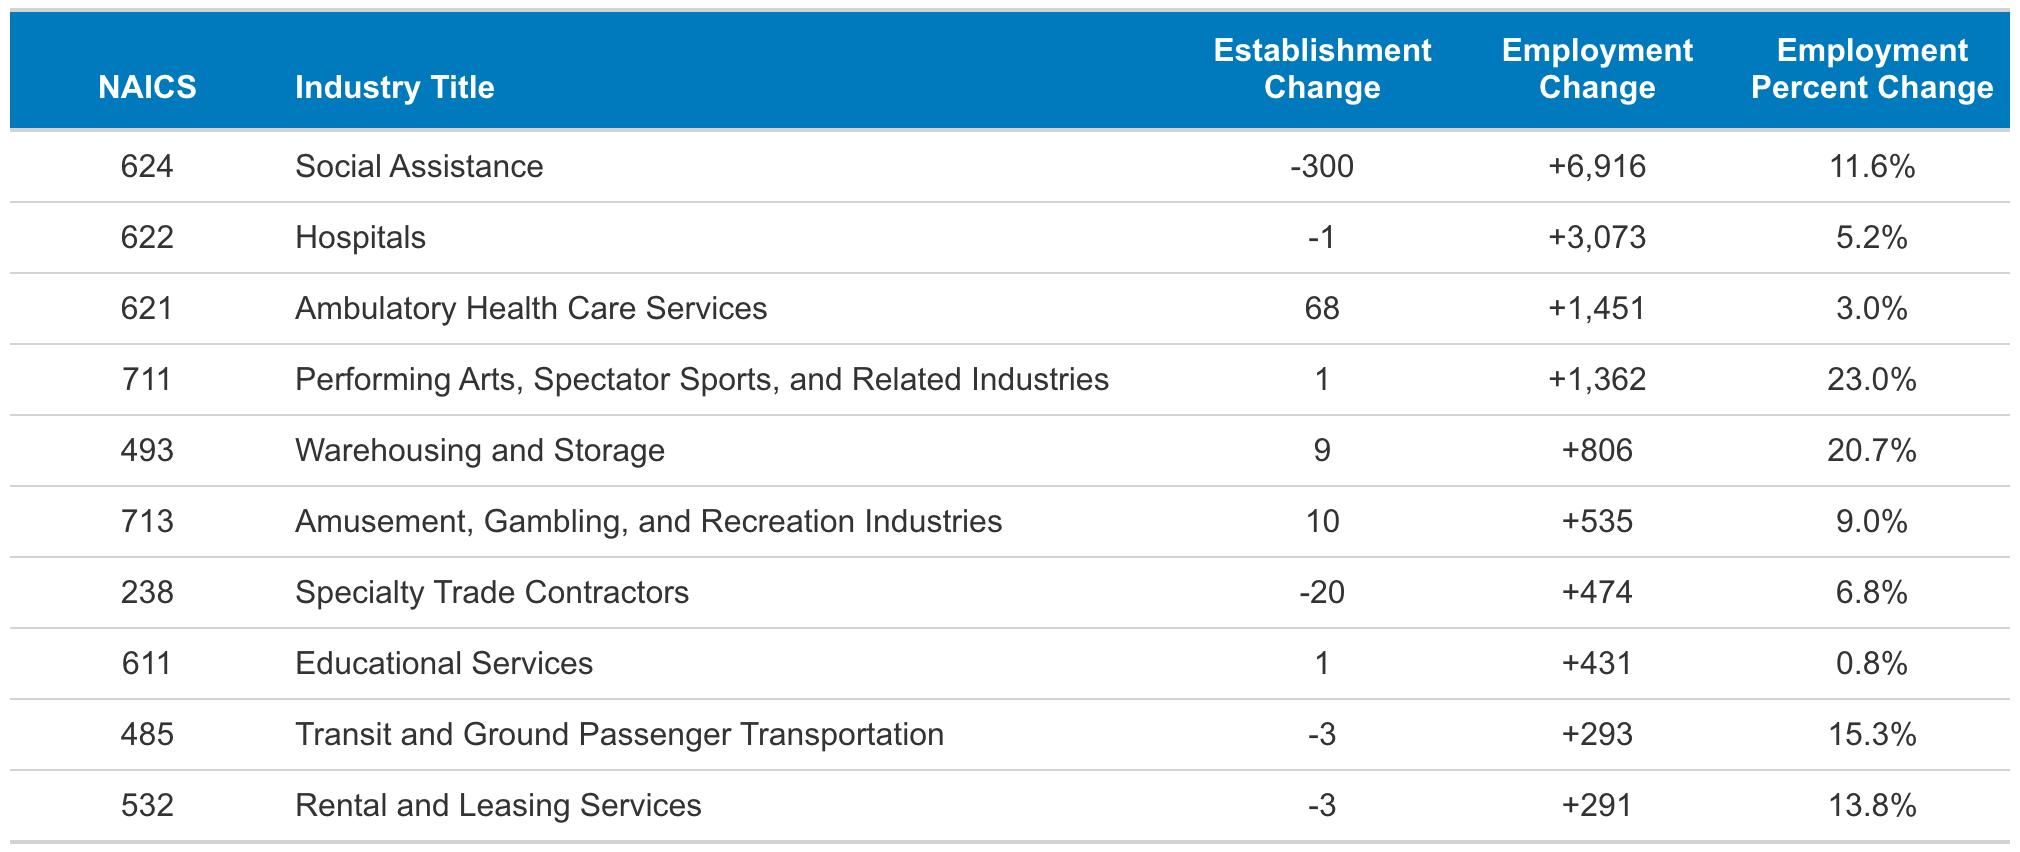
From the Quarterly Census of Employment and Wages, this table shows the 10 industry sectors with the largest annual employment growth. These data are released on a roughly six-month delay.
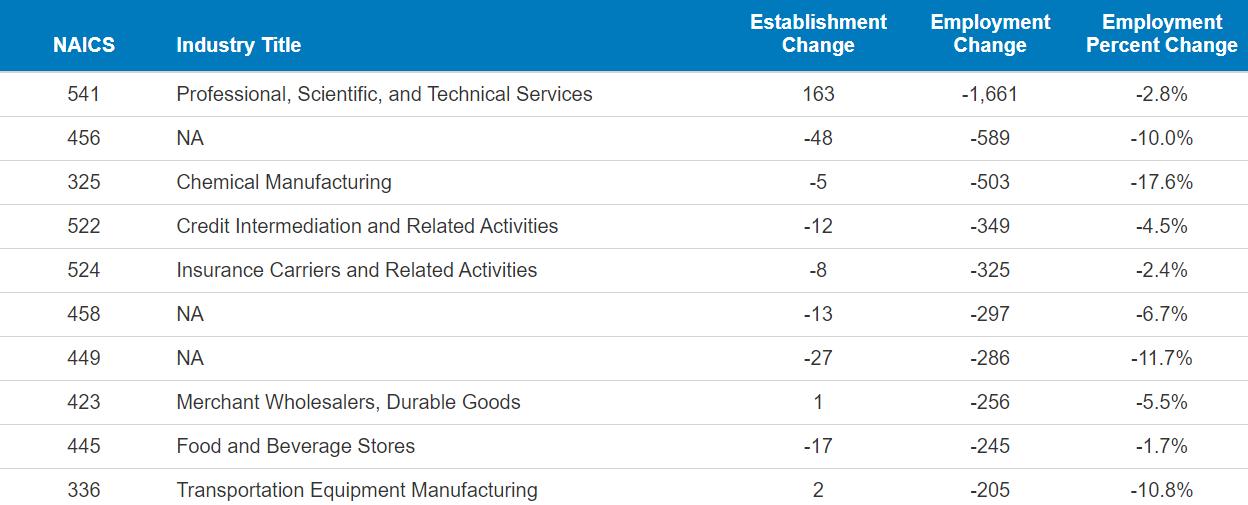
From the Quarterly Census of Employment and Wages, this table shows the 10 industry sectors with the largest annual employment declines. These data are released on a roughly six-month delay.
Clothing, Clothing Accessories, Shoe, and Jewelry Retailers
Furniture, home furnishings, electronics, and appliance retailers
Source: Philadelphia Works
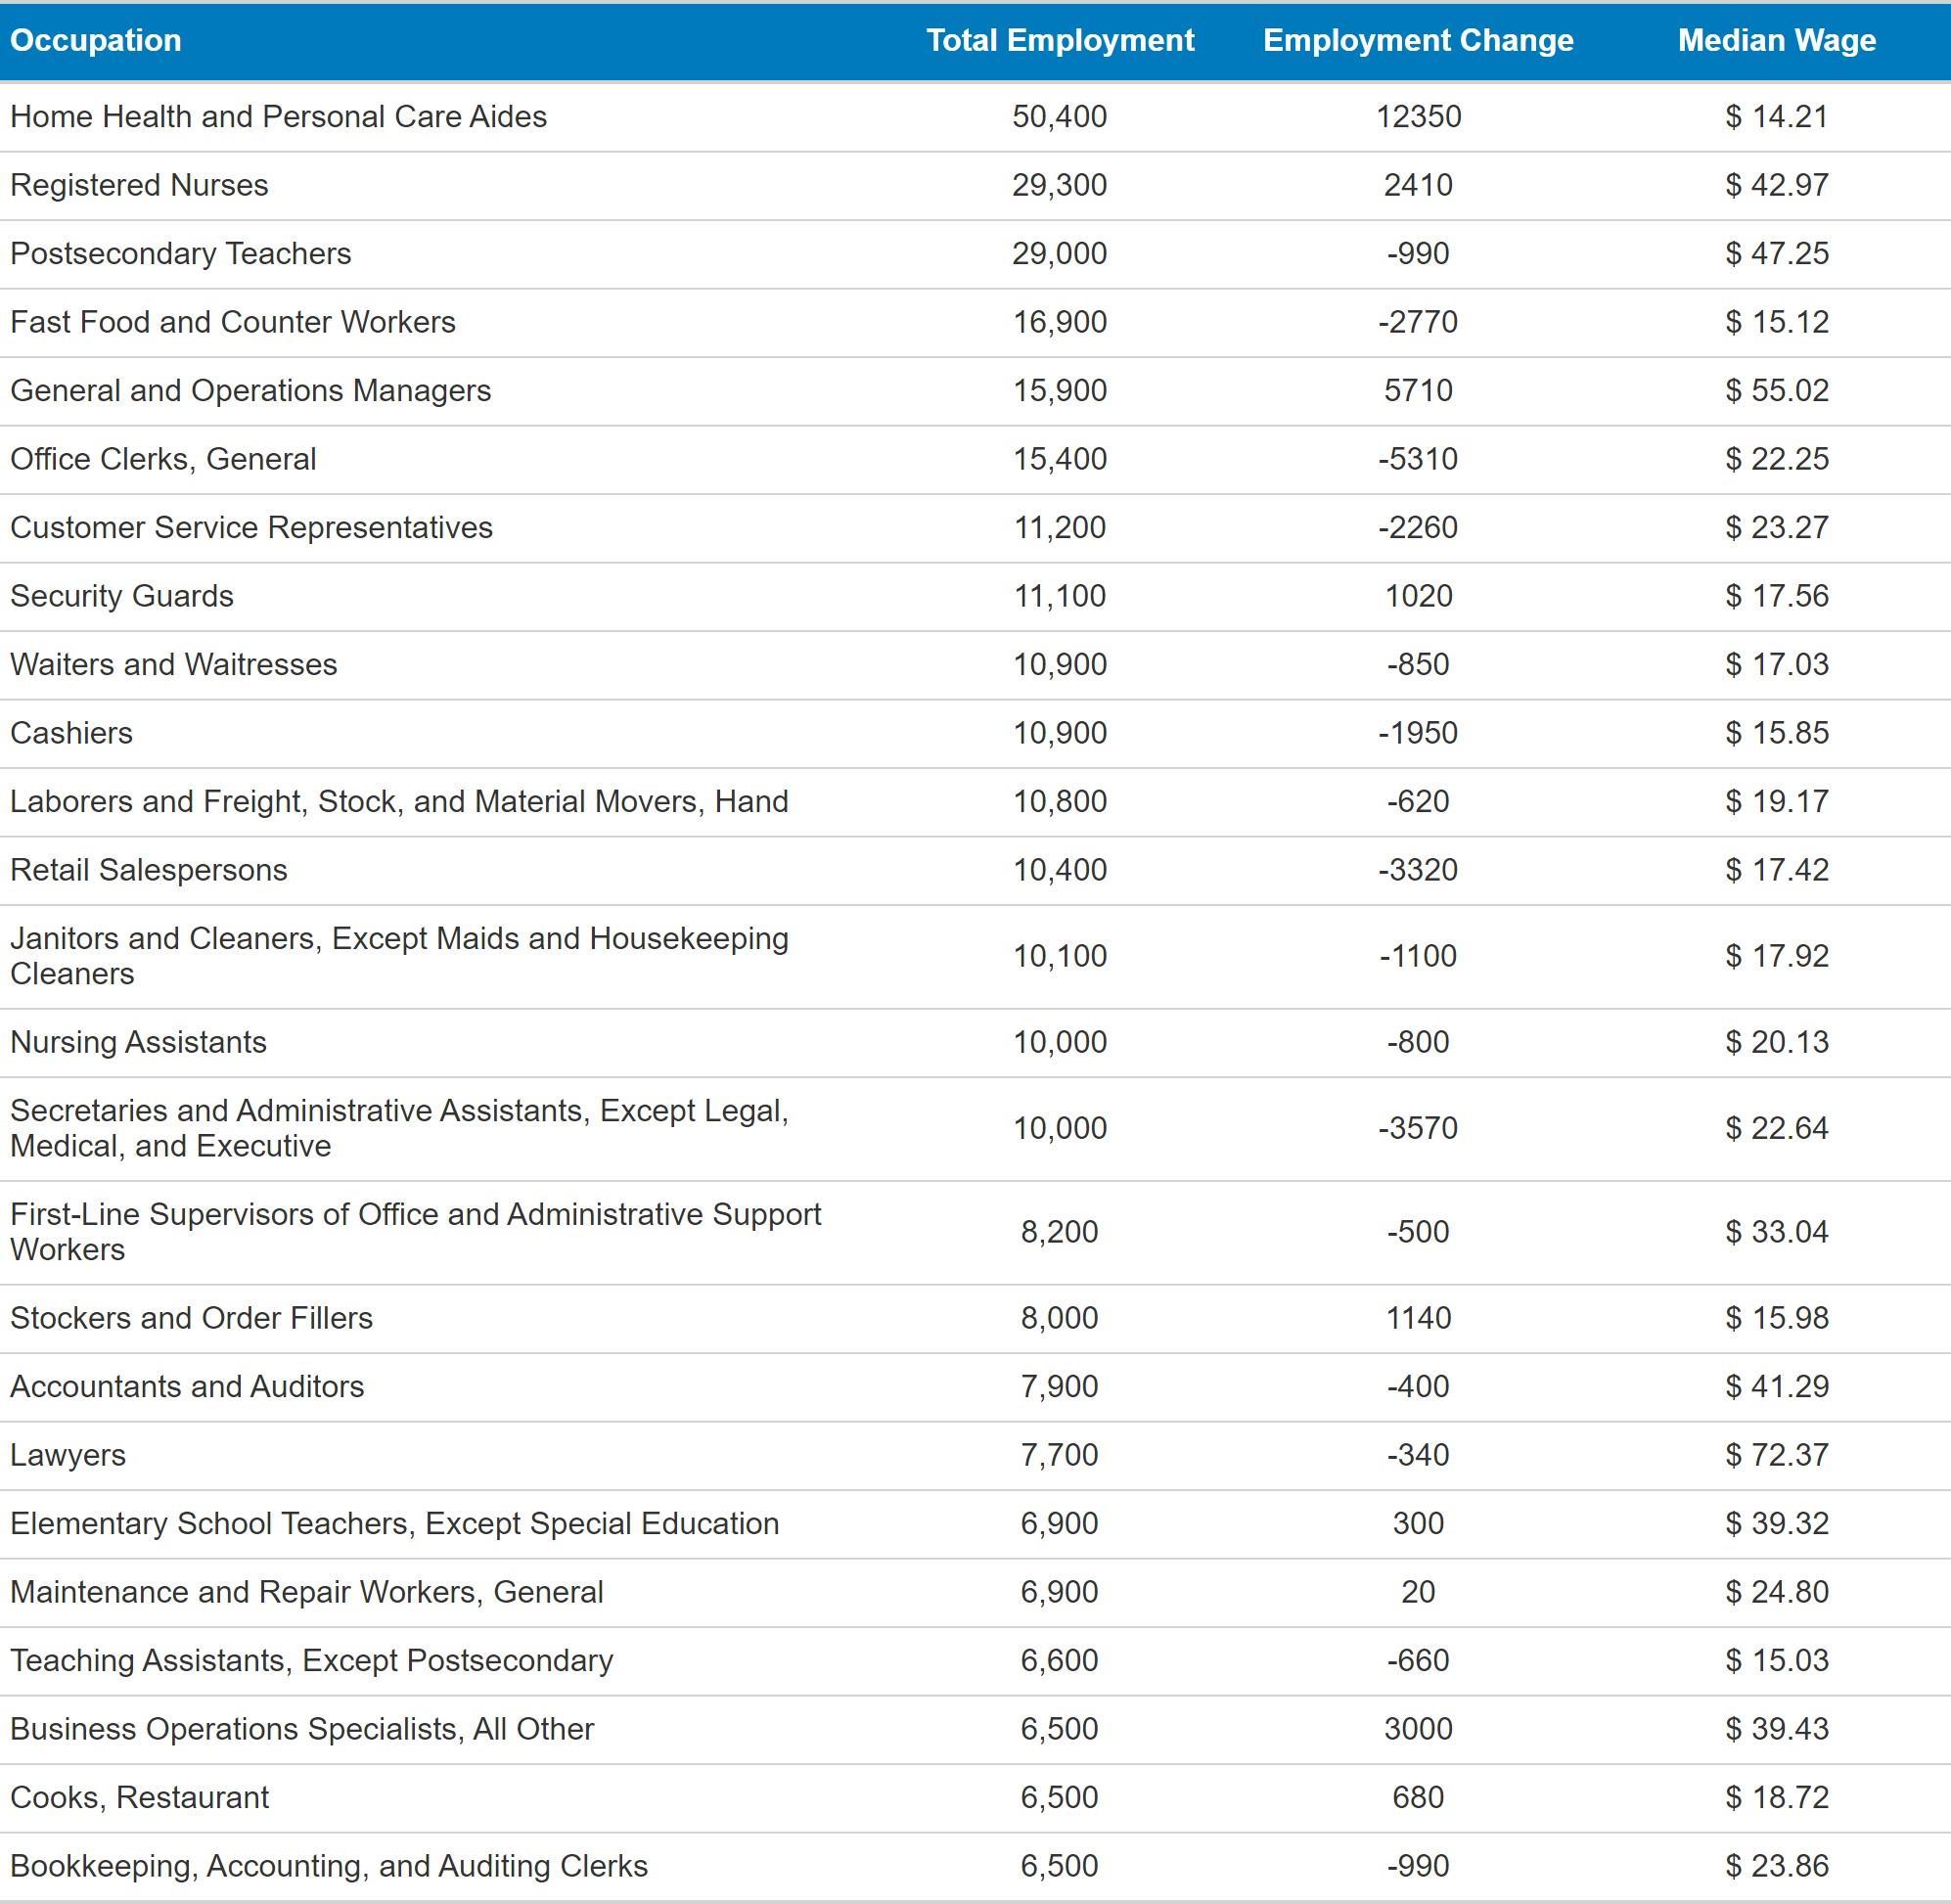
Appendix Table 5: Largest Occupations in Philadelphia with Employment Change from 2019 to 2024
Basedon estimates derived from the Quarterly Census of Employment and Wages, this table shows the 25 largest occupation by total employment. These data are released on a roughly nine-month delay.