Philadelphia Works Inc - Quarterly Report - March 2025
Philadelphia’s Quarterly Labor Market Report
In 2018, Philadelphia’s institutional and community leaders collaborated to develop a comprehensive workforce development strategy. This document, Fueling Philadelphia’s Talent Engine, calls on Philadelphia Works, Inc. to serve as the city’s hub of labor market and economic reporting and analysis.
Continued economic growth is critical to the future of our city and region, and is dependent upon a strong, skilled workforce.
Under this mandate, this quarterly report provides insight into key measures of economic activity, providing leaders across public and private institutions an easy-to-access update on how Philadelphia’s economy and labor force continue to evolve.
Fueling Philadelphia’s Talent Engine
Page 03
Immigrant Research
The latest ongoing research about Philadelphia’s workforce.
Page 06
Employment Trend
The most recent data available on Philadelphia’s economy.
Page 14
Employer Demand
Exploring recent trends in employer demand through job postings and other sources.
Page 19
Philadelphia’s Labor Force
Demographic and socioeconomic characteristics of Philadelphia’s labor force.
Page 24
Appendix: Detailed Tables
Detailed employment information for important industries and occupations in Philadelphia.
Executive Summary
Using the latest available data, this quarterly update offers insight into Philadelphia’s labor market, industry mix, and economic development.
For more insight into Philadelphia’s labor force, economic characteristics, and employment dynamics, visit the Philadelphia Works website.
At the close of 2024, Philadelphia's labor market faced a more tentative outlook. Although the city maintained a generally robust workforce, the final quarter saw notable signs of cooling. In December 2024, employment dipped moderately to 703,239 and the labor force eased to roughly 735,317. While unemployment rates remained relatively stable at 4.4%, this minor uptick signals caution among businesses and a growing hesitance among job seekers, influenced by economic uncertainty and policy debates at state and national levels.
Q4 2024 data reflects a labor market seeking equilibrium: many employers are tightening recruitment amid elevated operating costs, while maintaining demands for specialized and higher-skilled talents. Across sectors, professional services continued to lead wage growth. In contrast, the manufacturing sector faced headwinds.
Inflation remained stubbornly elevated in housing and utilities, exacerbating the cost-of-living pressures in Philadelphia compared to national trends. As the city enters 2025, targeted policy interventions— particularly addressing skills mismatches, seasonal shifts, and cost-of-living concerns—will be critical to ensuring that Philadelphia's labor market regains its resilience.
Current Research
Immigrants Research in Philadelphia
Immigrants Concentration in Philadelphia
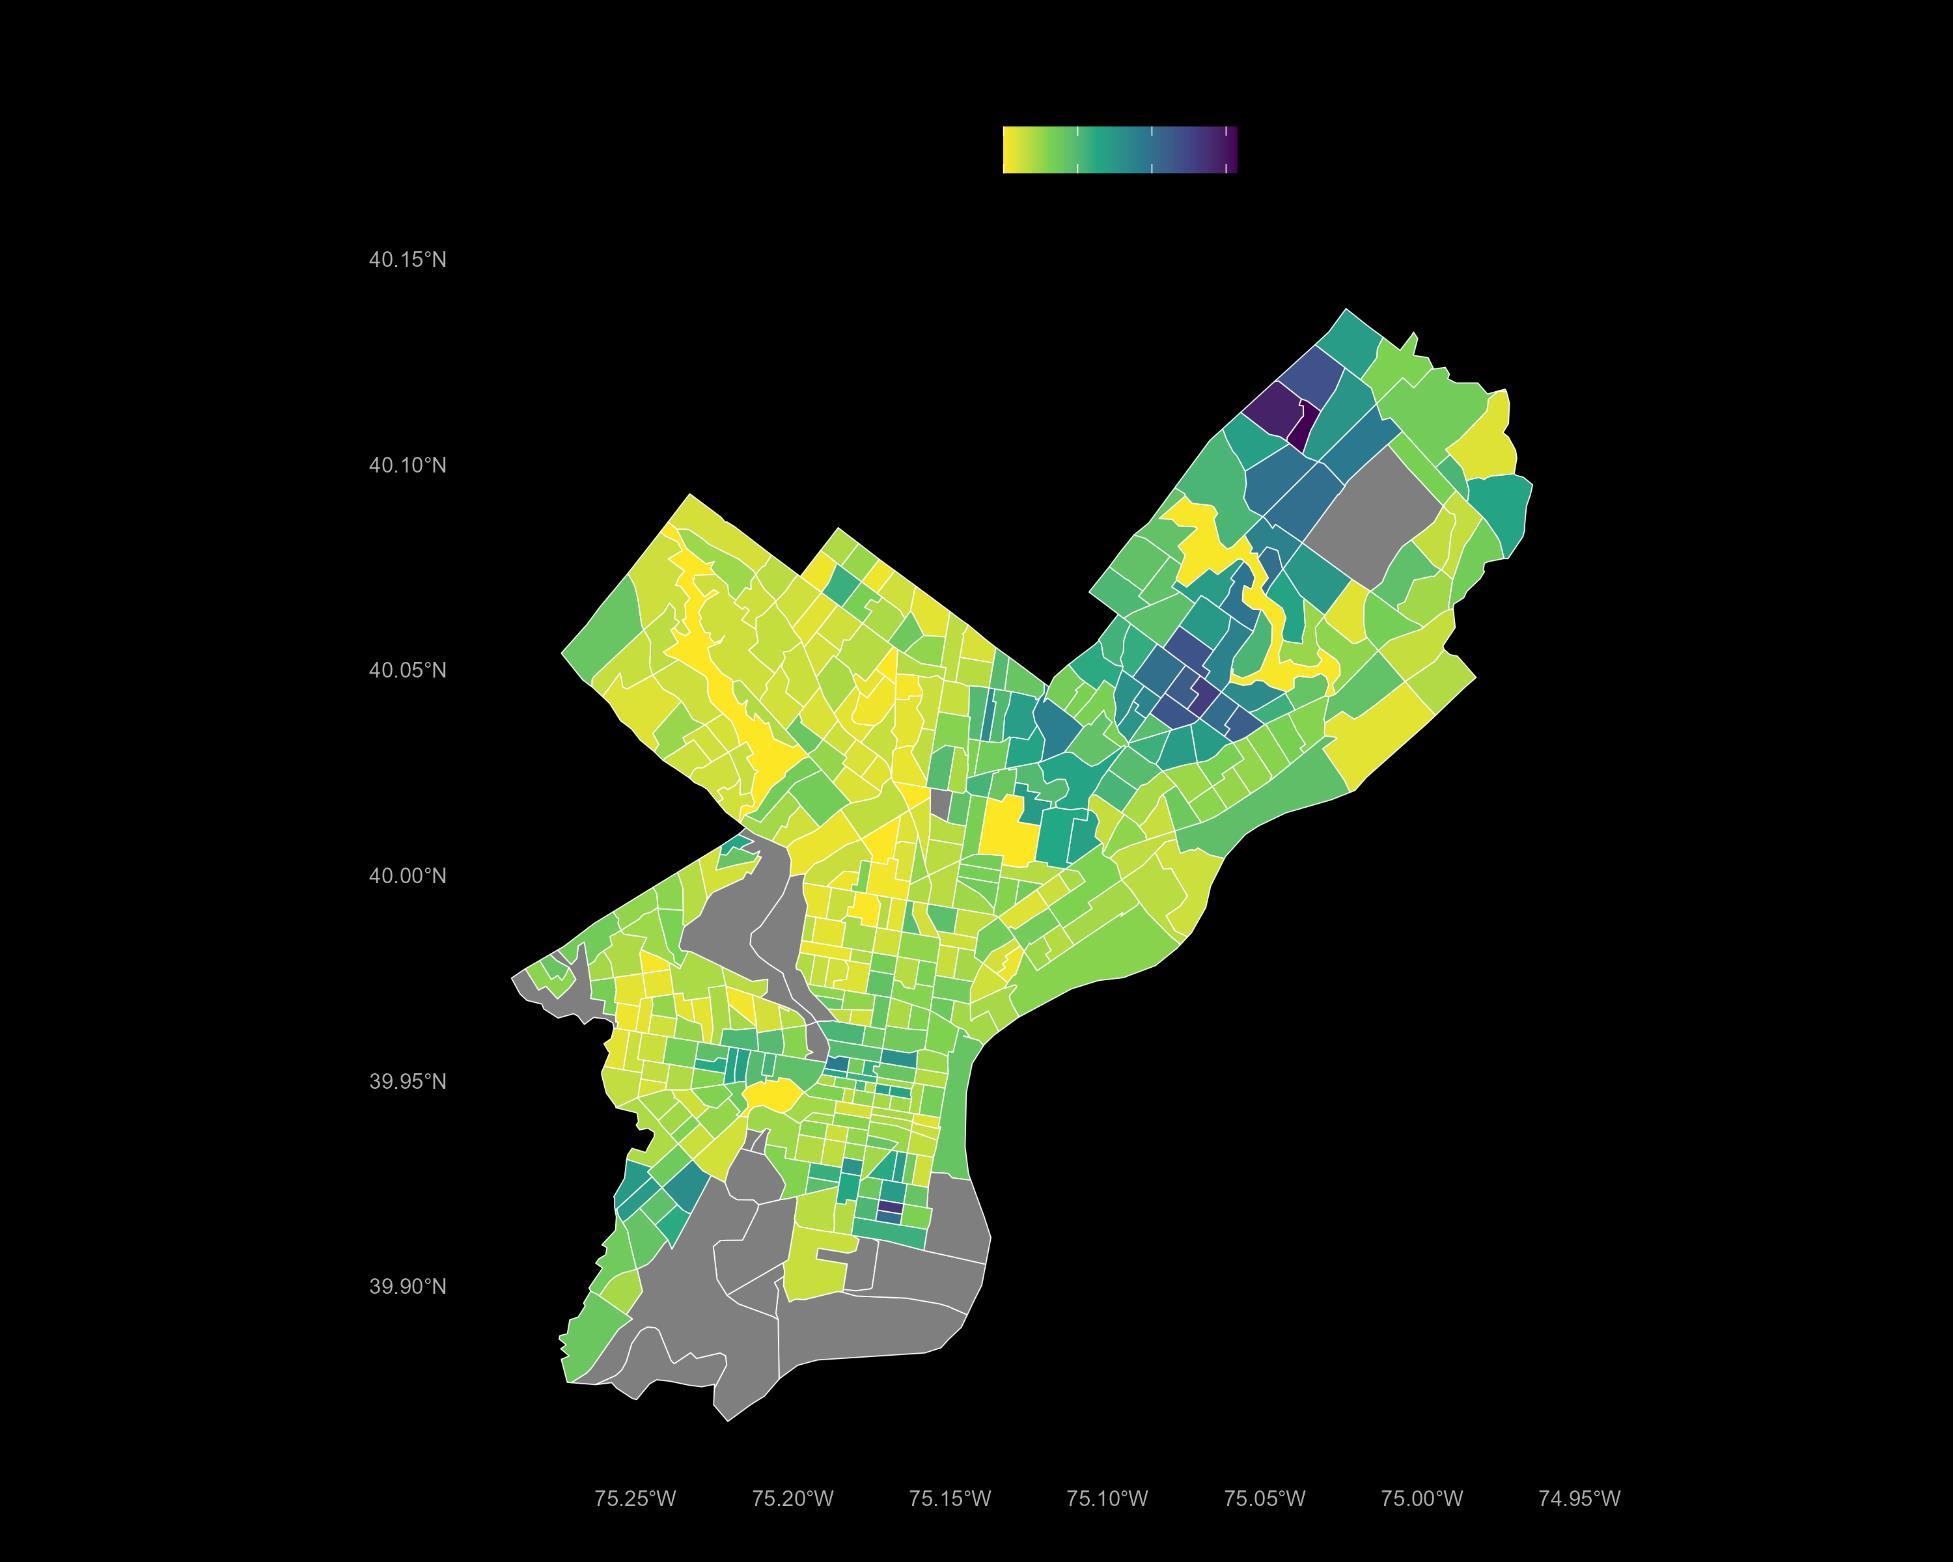
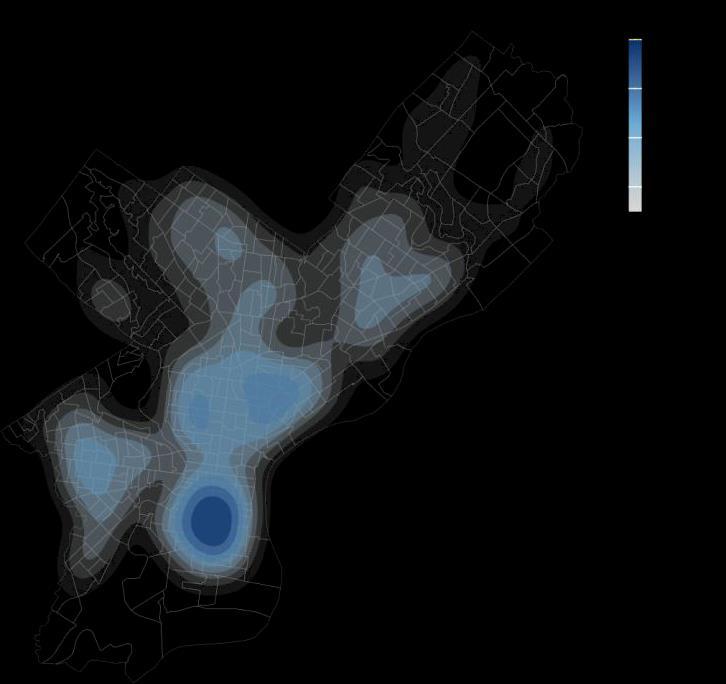
Philadelphia’s immigrant community is a vibrant mosaic—comprising 15% of the county’s total population, with over 230,000 foreign-born individuals among 1.58 million residents in 2023, according to the Census 2023 ACS Data. From 2013 to 2022, Philadelphia County witnessed steady growth in its foreign-born population, with annual increases ranging between 1.5% and 3.8%. However, in 2023, the trend reversed slightly, marking a 0.8% decline the first such decrease observed in over a decade. Most of foreign-born individuals are clustering in the northwest Philadelphia and South Philadelphia.
Northeast Philadelphia and pockets in Southwest appear to have notably higher concentrations of immigrant communities.
China (14%), India (7%), and the Dominican Republic (6.7%) constitute the largest shares of Philadelphia’s foreign-born population, while a diverse range of other countries from Vietnam and Jamaica to Haiti and Brazil each contribute smaller yet significant proportions.
Map 1: Foreign-born Individuals Distribution in Philadelphia, ACS 2023 PUMS
Immigrants Concentration by Industry
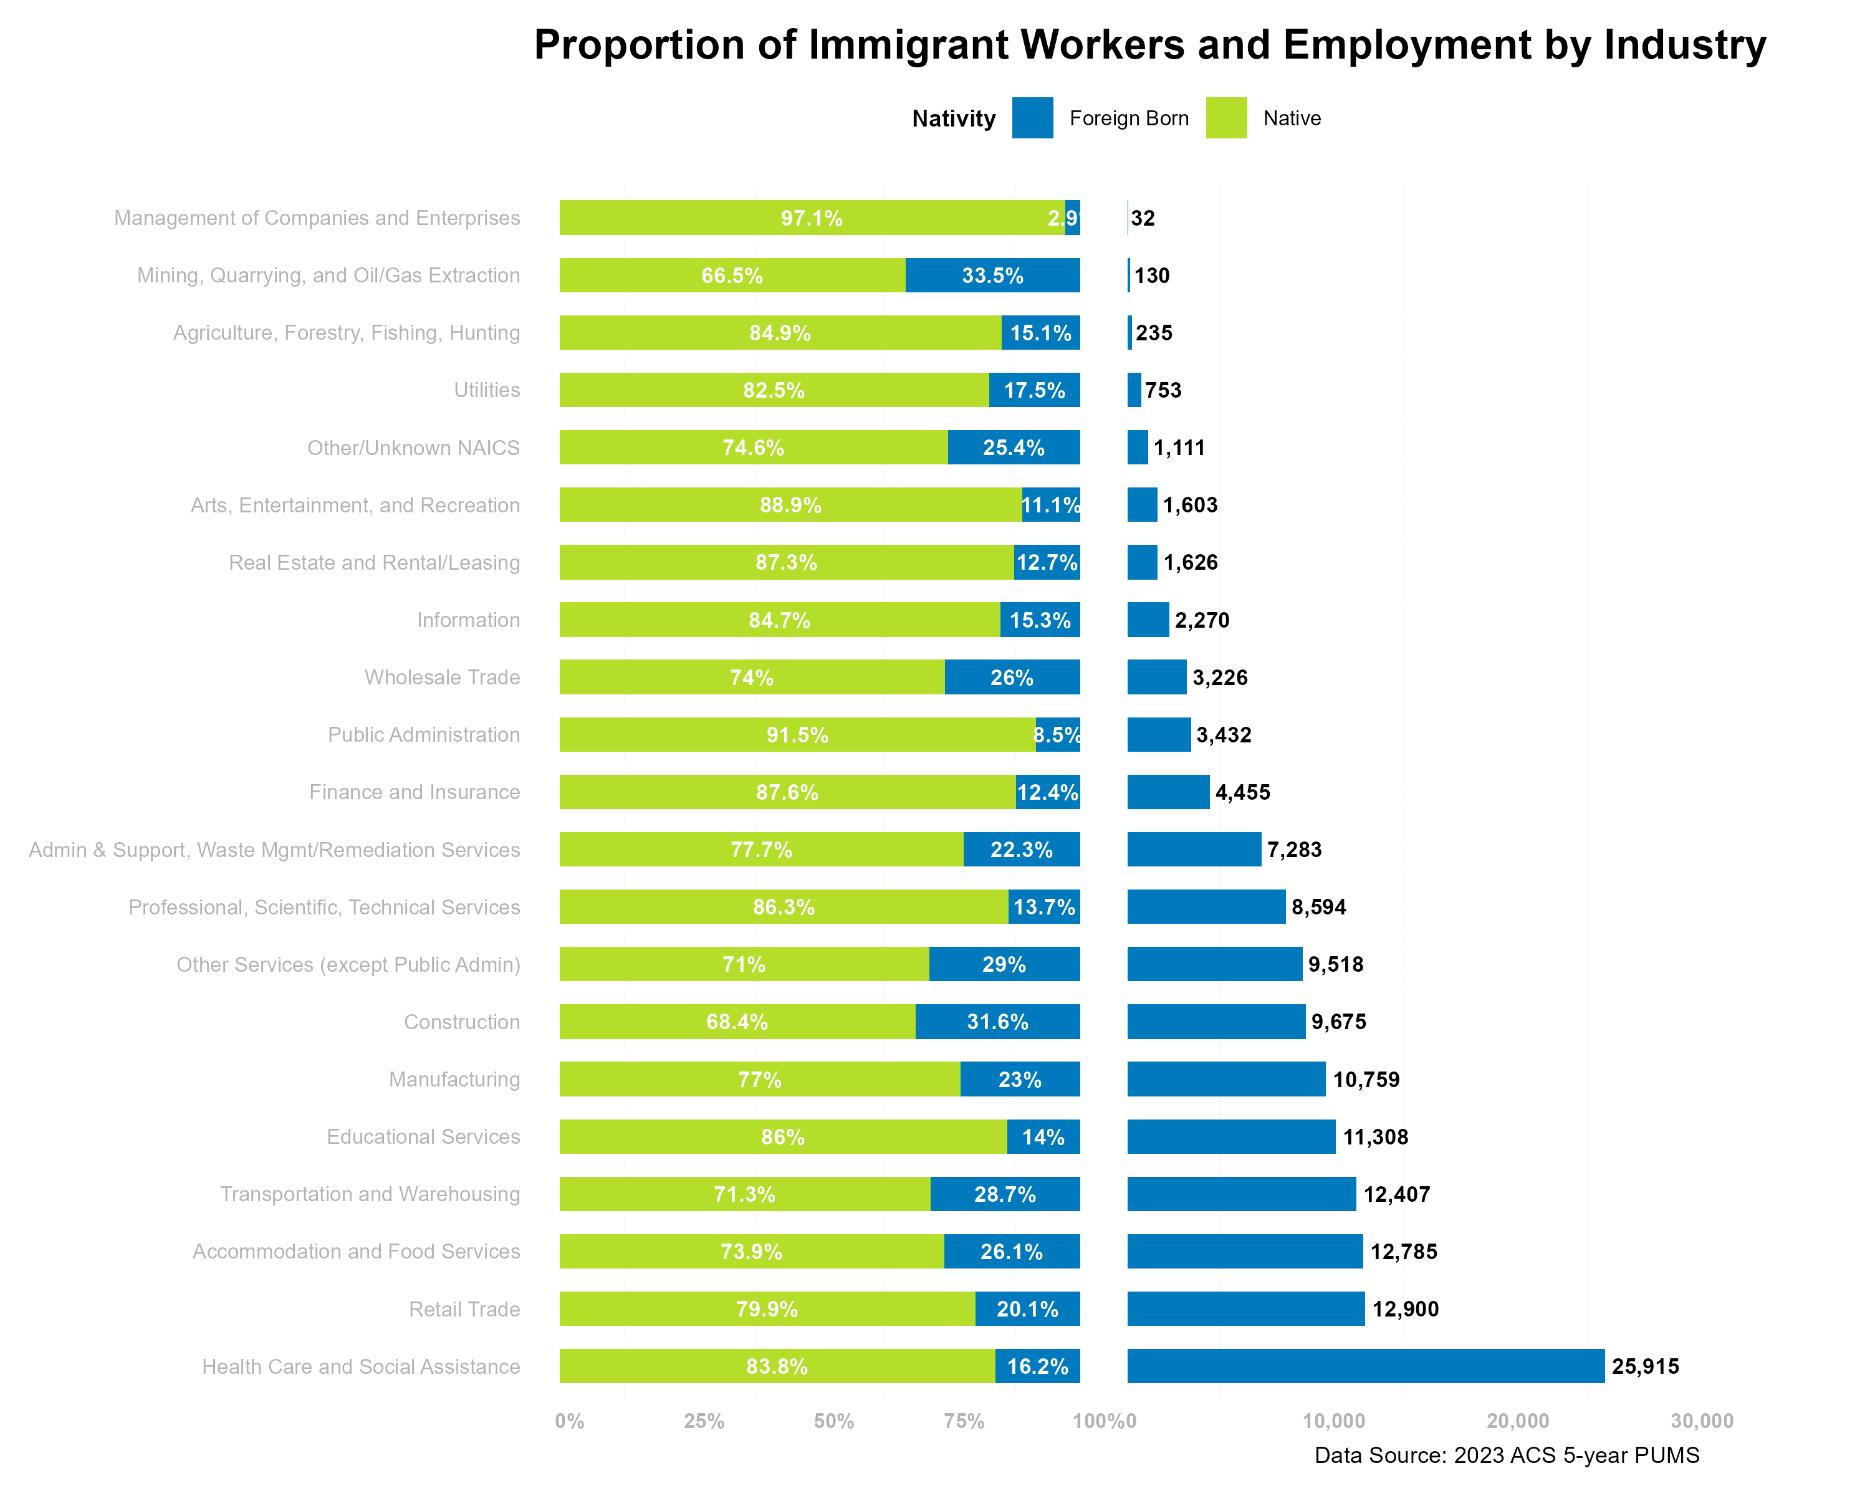
About 59.7% foreign-born individuals are registered in the labor force market. Whether immigrants are delivering health care, stocking shelves, preparing meals, or building the city’s future, foreignborn workers form an indispensable part of the workforce. Among ACS 5-year PUMS dataset, nowhere is this more evident than in Health Care and Social Assistance, which employs over 25,900 foreign-born individuals about 16.2% of that sector’s total workforce. Retail Trade employs around 12,900 immigrants (about 20% of the sector), Accommodation and Food Services has nearly 12,800 foreign-born employees (roughly 26%), and Transportation and Warehousing counts over 12,400 immigrants (close to 29% of its workforce). Construction and Manufacturing also see significant immigrant participation, at 31.6% and 23.0% of their respective labor forces. For more upcoming information, please stay tuned for a completed version of immigrant research related to job opportunities and policy supports.
Figure 1: Proportion of Immigrant Workers and Employment by Industry
Overall Employment Trends
Employment in Philadelphia
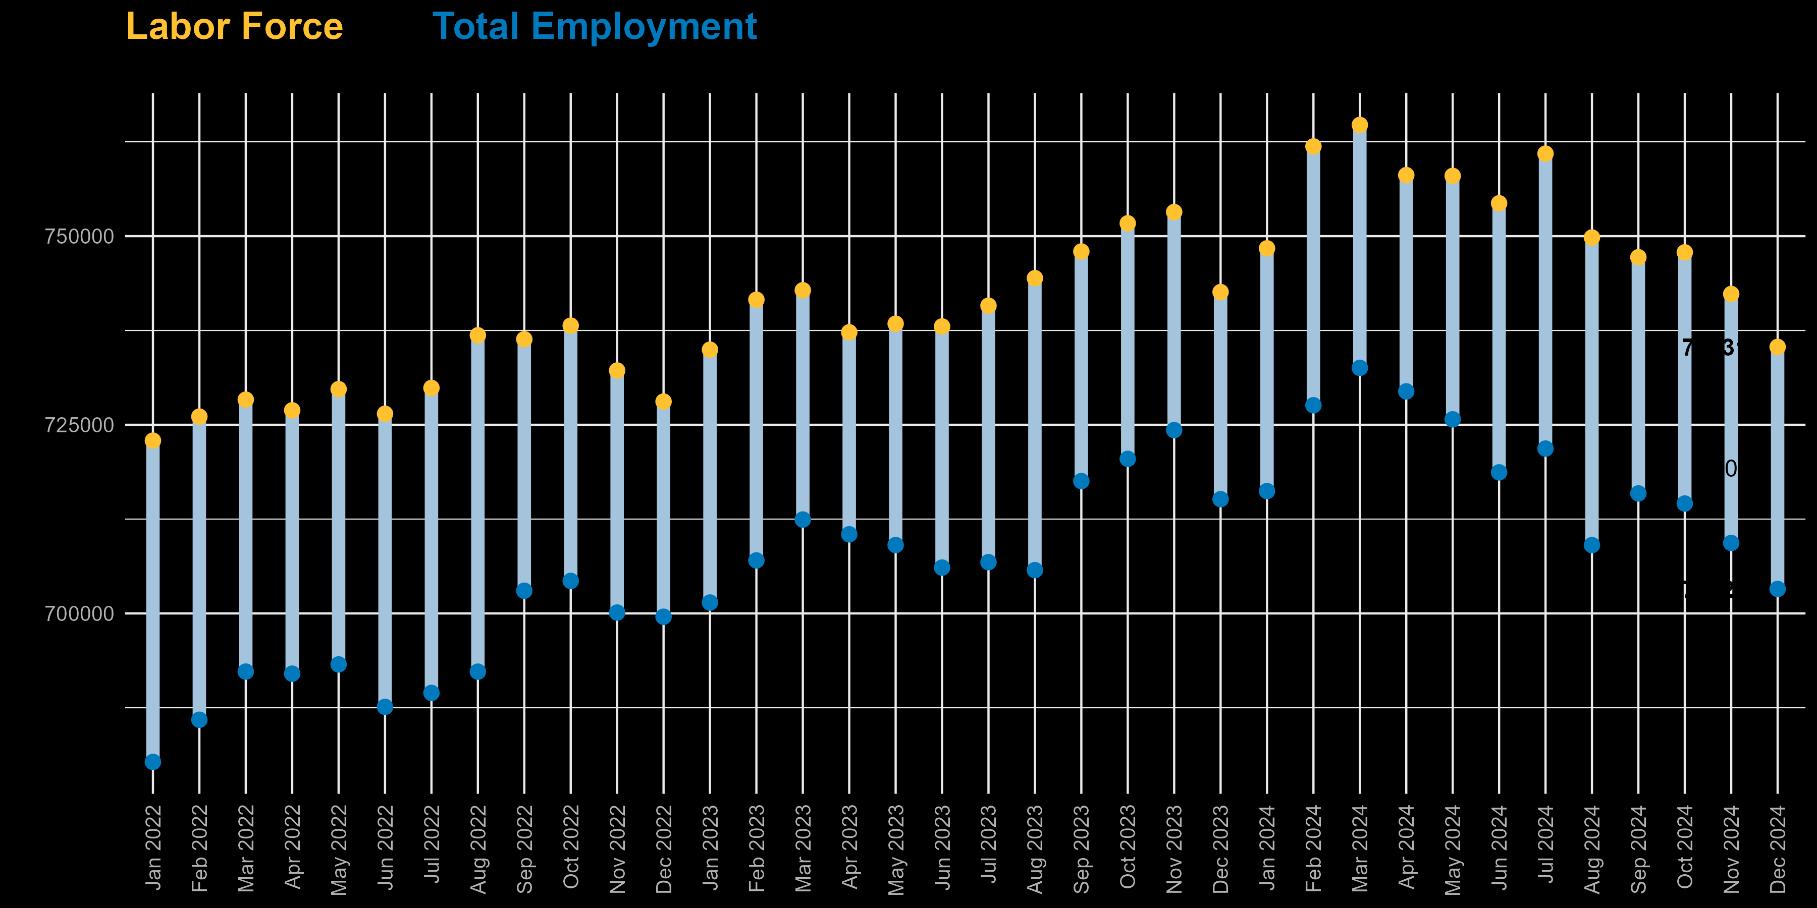
Philadelphia’s labor market closed out 2024 with a slight downturn. In December, the total labor force stood at 735,317, while employment dipped to 703,239. The fourth quarter, often marked by holidayseason job surges, instead saw a cooling trend with rising unemployment.
While employment remains historically strong, the late-year dip raises questions about whether economic uncertainty, slowing demand, or structural mismatches in skills and job openings are weighing on Philadelphia’s workforce.
Total Labor Force in December 2024
735,317
Total Employment in December 2024
703,239
Figure 2: Trend inPhiladelphia: January 2022 toDecember 2024
Unemployment in Philadelphia
Unemployment Rates in December 2024 4.4%
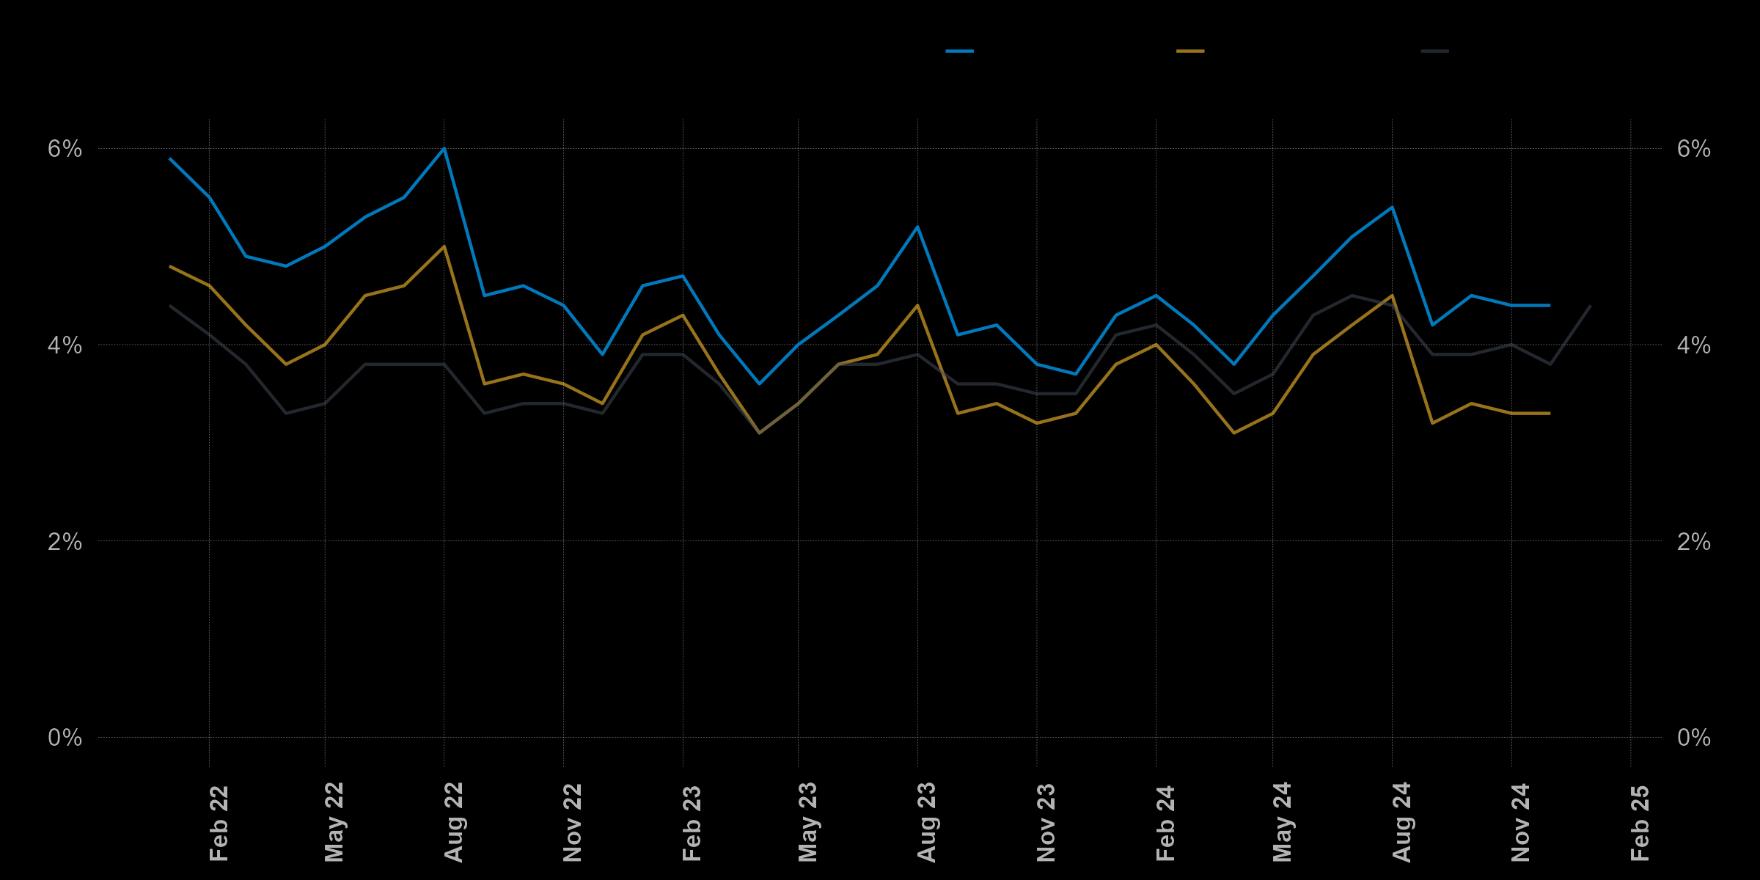
Philadelphia's unemployment rate ended 2024 at 4.4%, slightly above both the Pennsylvania and national averages. Nationally, Federal Reserve policies to stabilize inflation have tempered job growth, particularly in sectors sensitive to interest rates, such as finance and real estate.
As 2025 begins, Philadelphia's challenge remains clear: bridging the gap between job seekers and available roles while ensuring wage growth keeps pace with inflation and cost-of-living increases.
Figure 3: UnemploymentRate Since January 2022 Within 3 Regions
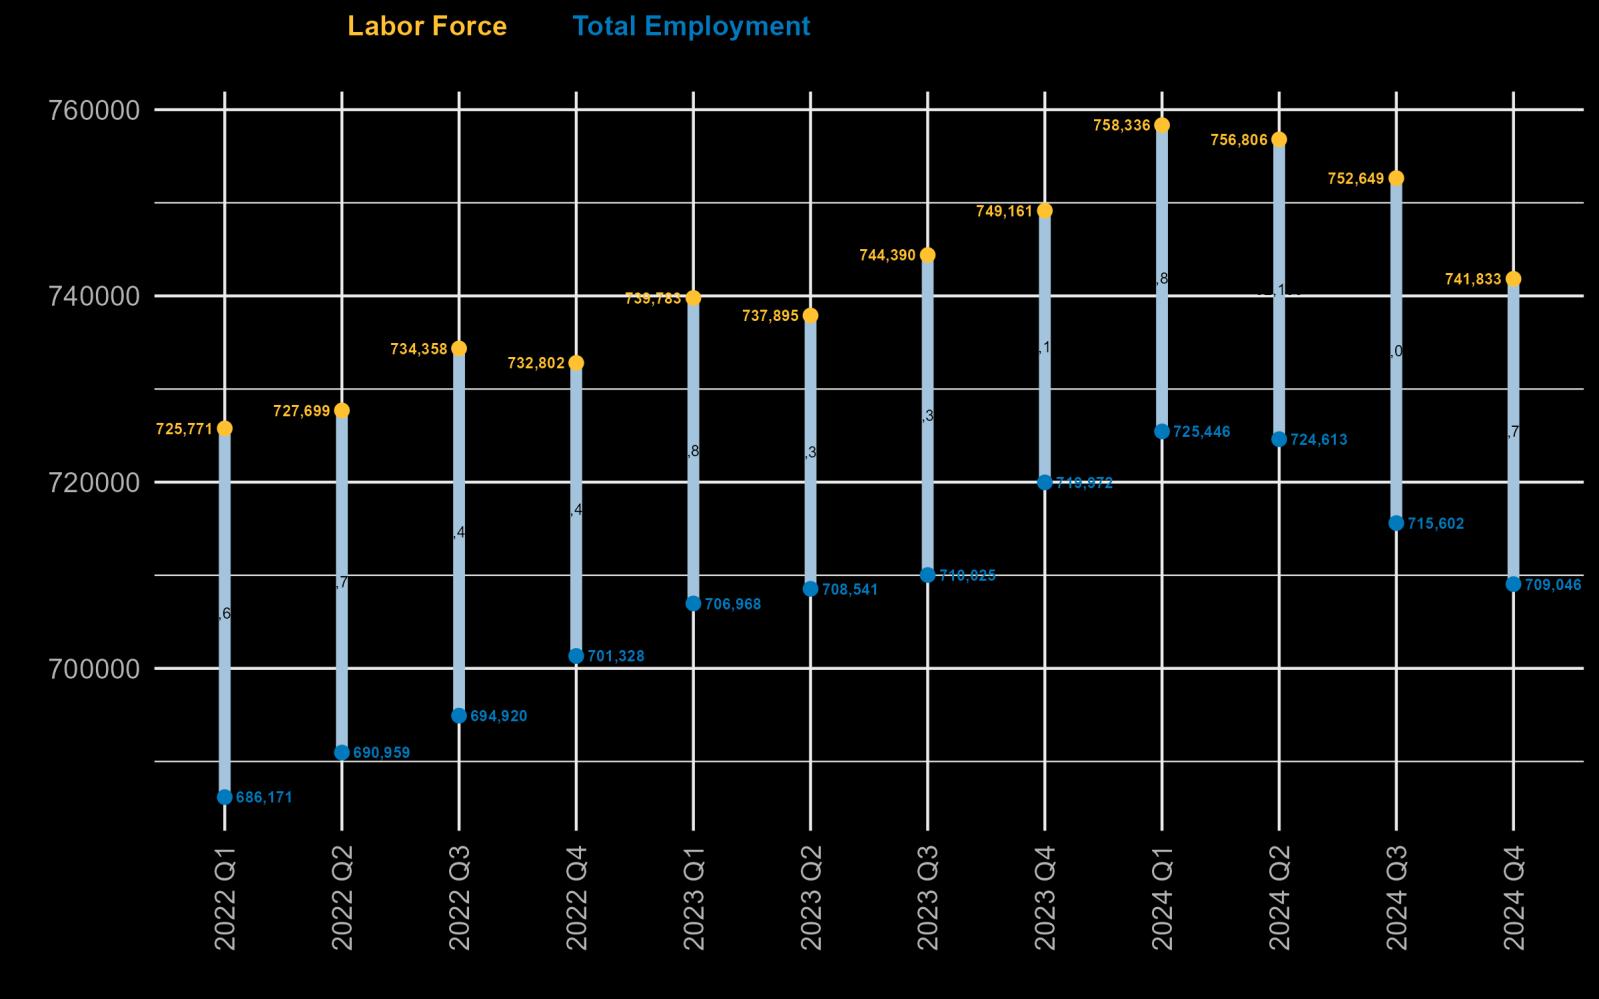
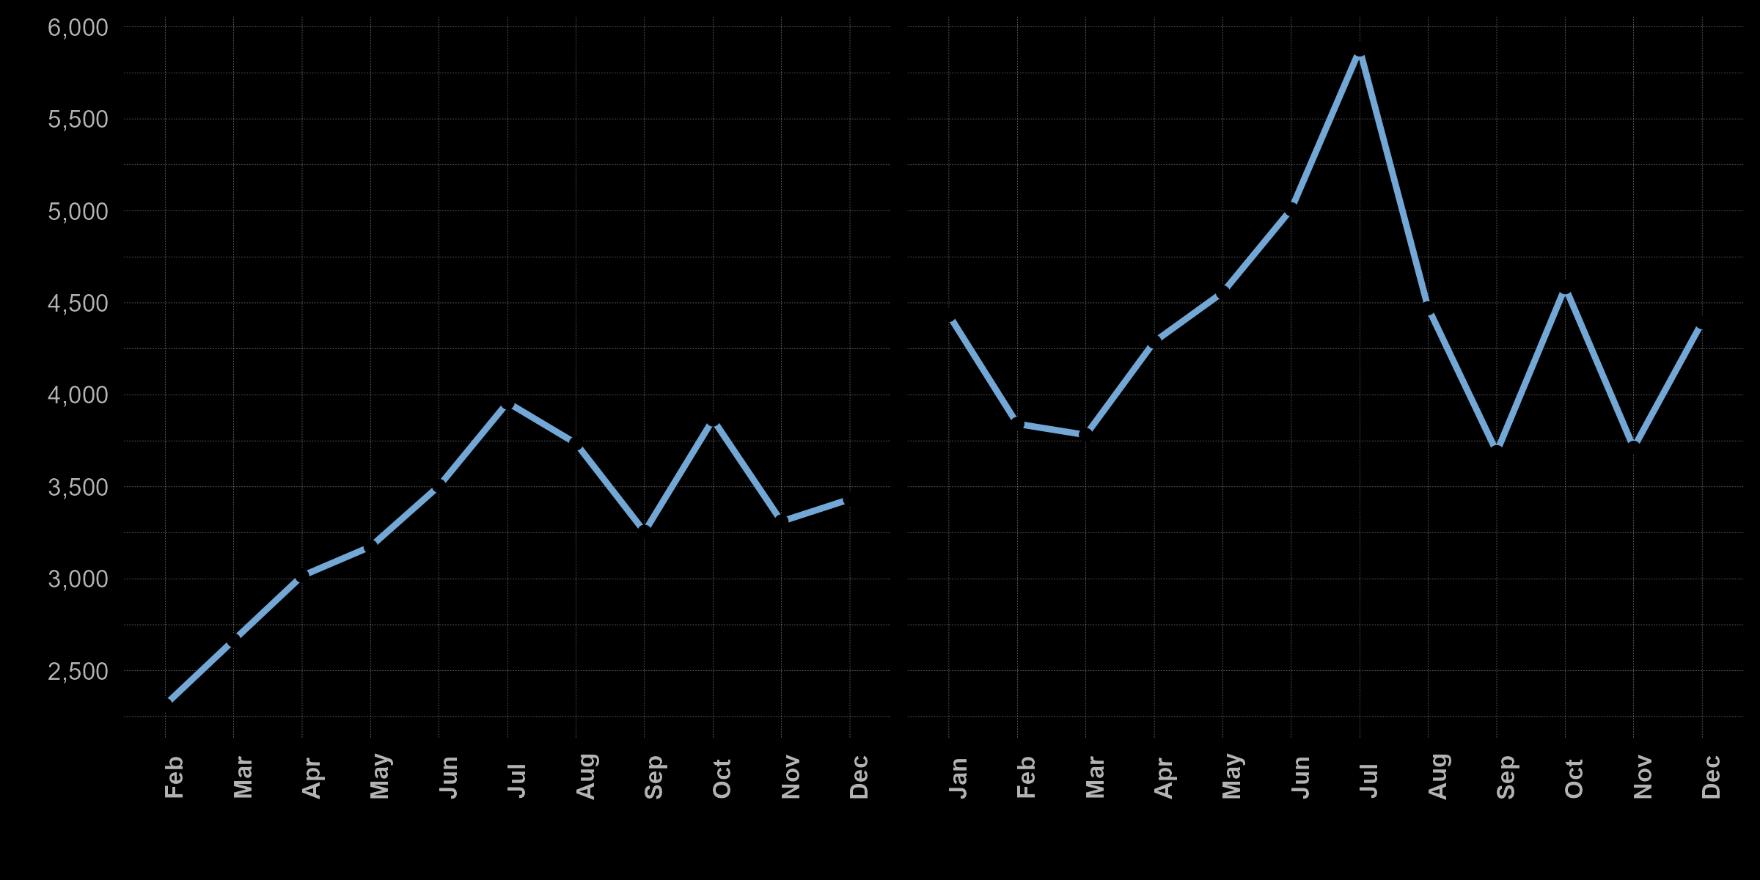
Quarterly Comparison
In Q4 2024, Philadelphia's labor market showed a noticeable slowdown. The mean value of total labor force dipped from 752,649 in Q3 to 741,833, and employment declined from 715,602 to 709,046. This downward trend in late 2024 not only suggests the seasonal shifts but also indicates a potential mismatch between available opportunities and worker skills are prompting more individuals to step back from the job search.
At the same time, current political debates over workforce development and uncertainties in state funding have contributed to a more cautious hiring climate. Although Philadelphia's long-term recovery remains intact, the modest dip in these mean values points to short-term challenges that need addressing.
Figure 4: Quarterly Mean Value Comparisonin Philadelphia, Previous 24 Months
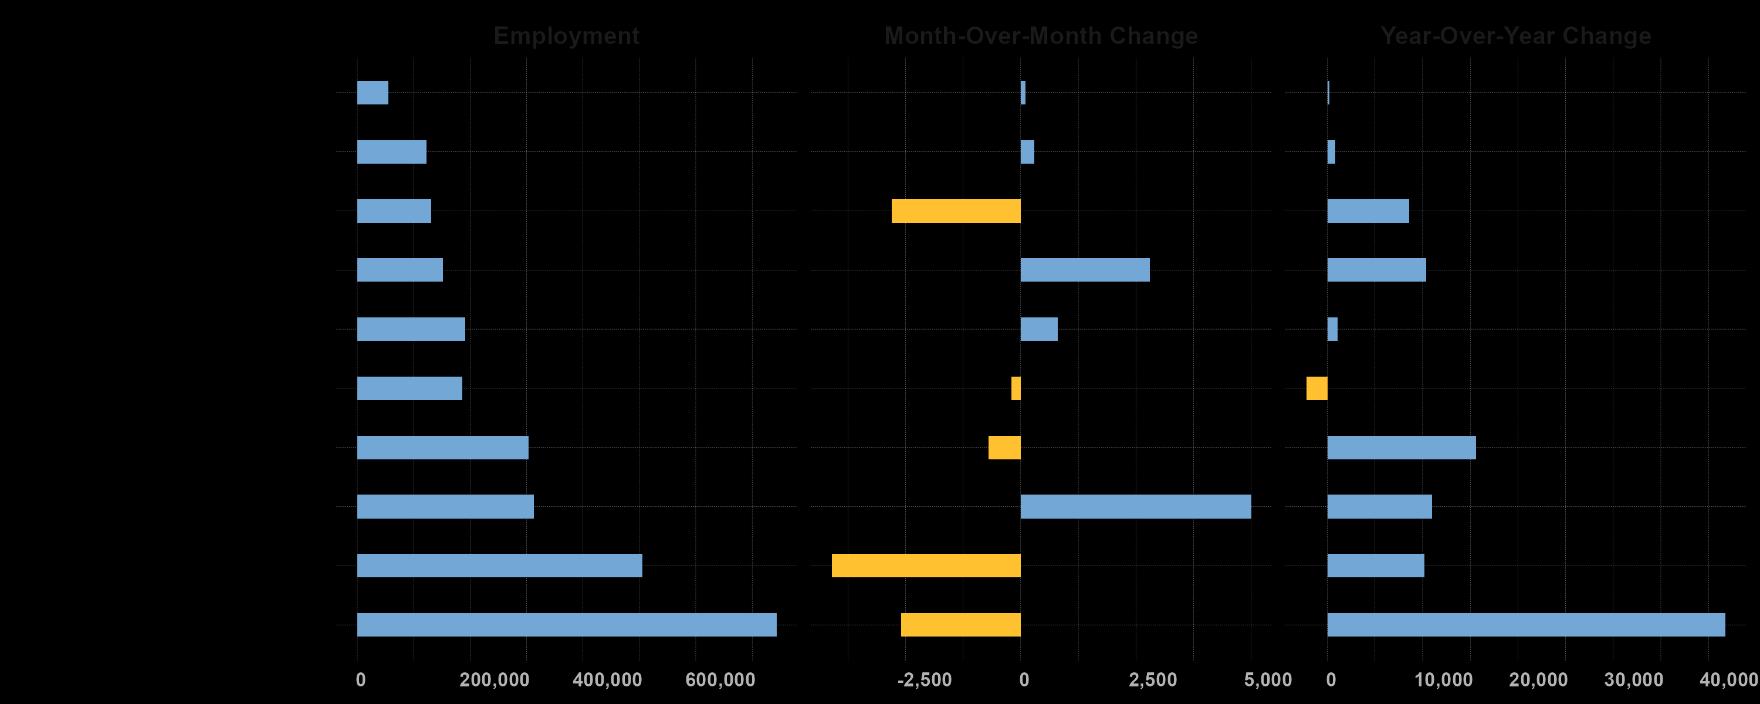
Philadelphia MSA Industry
The Philadelphia MSA continues to show mixed signals across industries.
In December 2024, Education and Health Services, the region’s largest industry sector, showed a robust year-over-year gain of 41,800 jobs but lost 2,600 monthly positions. Retail Trade posted the biggest monthly jump, adding 5,000 jobs, while Professional and Business Services (-4,100) and Mining, Logging, and Construction (-2,800) led the monthly declines.
Despite a moderate pickup in Finance and Insurance (+800) and Information (+100), Manufacturing continued its downward trend with a 2,200-job loss over the year. In contrast, certain sectors particularly Retail and Transportation and Utilities are on the upswing, whereas others, including Manufacturing and Leisure and Hospitality, are losing some of their earlier momentum.
Figure 5: Regional Employment by Industry Sector in Philadelphia MSA, December 2024
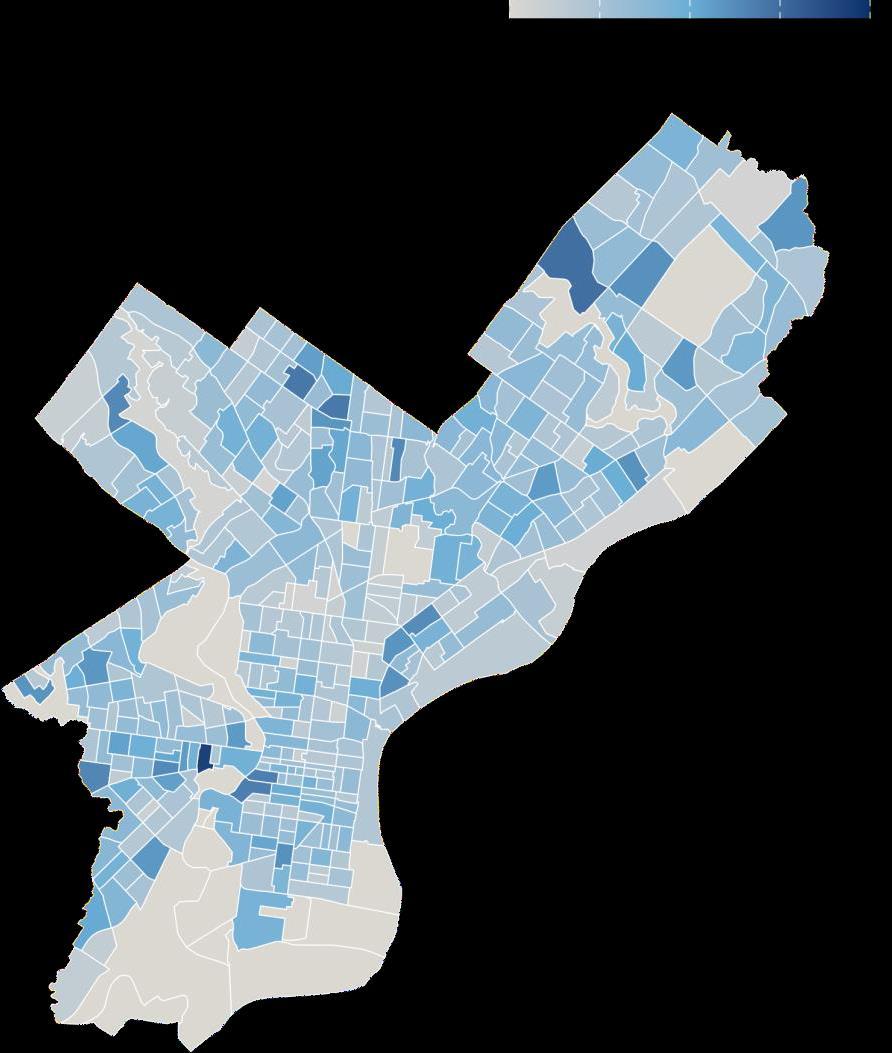
Industry Geospatial Concentration In Philadelphia
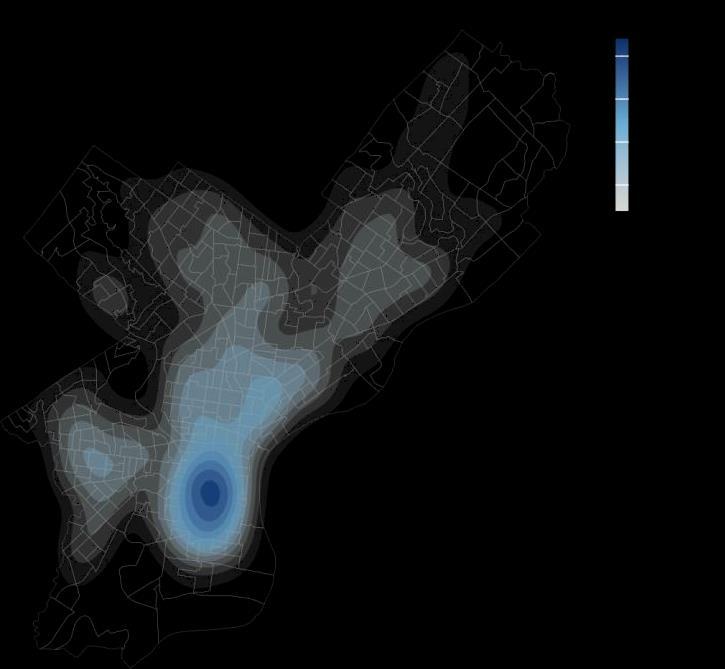
Map 2: Education and Health Services Employed Individuals Distribution, ACS 2023
The regional economy in Philadelphia County is primarily driven by the Education and Health Services sector, which has shown predominant demand and growth in general.
The map (Map 2) illustrates the geospatial distribution of this industry sector growth at the census tract level in Philadelphia County.
Lighter blue areas have relatively fewer facilities for Education and Health Services, while the grey areas indicate no related clustered Education and Health Services.
Dark blue areas represent the highest concentration of employment in Education and Health Services, mainly in the west, center, and north of Philadelphia, near major health care centers and institutions. It also indicates a high density of employed individuals in those areas.
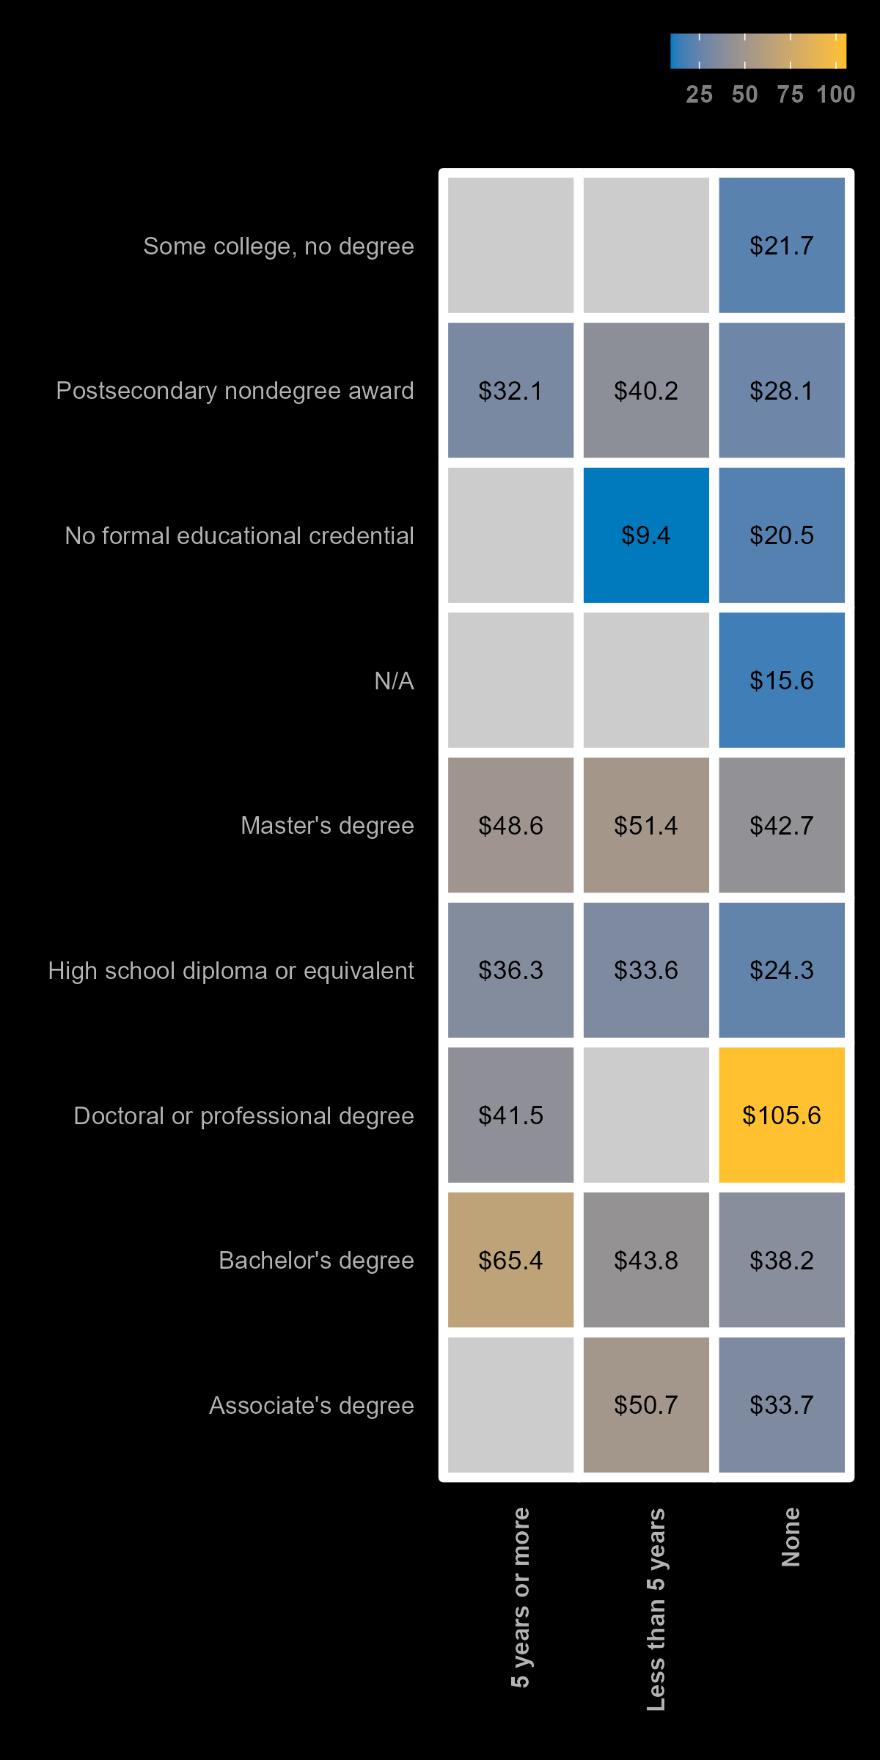
Education and Wage
Philadelphia’s wage data confirms a well-known pattern: higher education typically translates into higher earnings, with the difference becoming more pronounced over time.
Education and experience emerge as powerful forces in determining earning potential. Those with doctoral degrees and extensive experience can command up to $105.6 per hour, while bachelor's degree holders see their earnings climb from $38.2 to $65.4 as they gain experience. Even workers without formal degrees are finding paths to higher wages through experience, with some reaching $20.5 per hour.
This trend underscores the crucial role of advanced learning, whether it’s a traditional four-year program or specialized certification, in securing higher wages and greater long-term earning potential. However, the data also highlights persistent disparities: not everyone has equal access to or success within these educational pathways, raising questions about how best to expand opportunity across the city’s diverse workforce.
Figure 6: Relationship Between EducationLevel, Median Hourly Earnings and Work Experience, January2024to
Recent Unemployment Claims
Unemployment Claims in December 2024
4,395
Unemployment claims increased steadily from early 2023, peaking at 5,877 in July 2024 before easing back to 4,395 in December 2024.
A notable rise in claims from healthcare workers, particularly Home Health Aides (817 claims), emerged as a leading indicator of sector-specific challenges. Meanwhile, Landscaping & Groundskeeping Workers (332) and Construction Laborers (318) also appear highly vulnerable.
Home Health Aides
Landscaping & Groundskeeping Workers
Construction Laborers
Laborers & Freight, Stock & Material Movers
Security Guards
Figure 7: Monthly Initial Unemployment Claims by Philadelphia Residents, Previous 24 Months
Employer Demand
Trends in Job Postings
Overall Trends
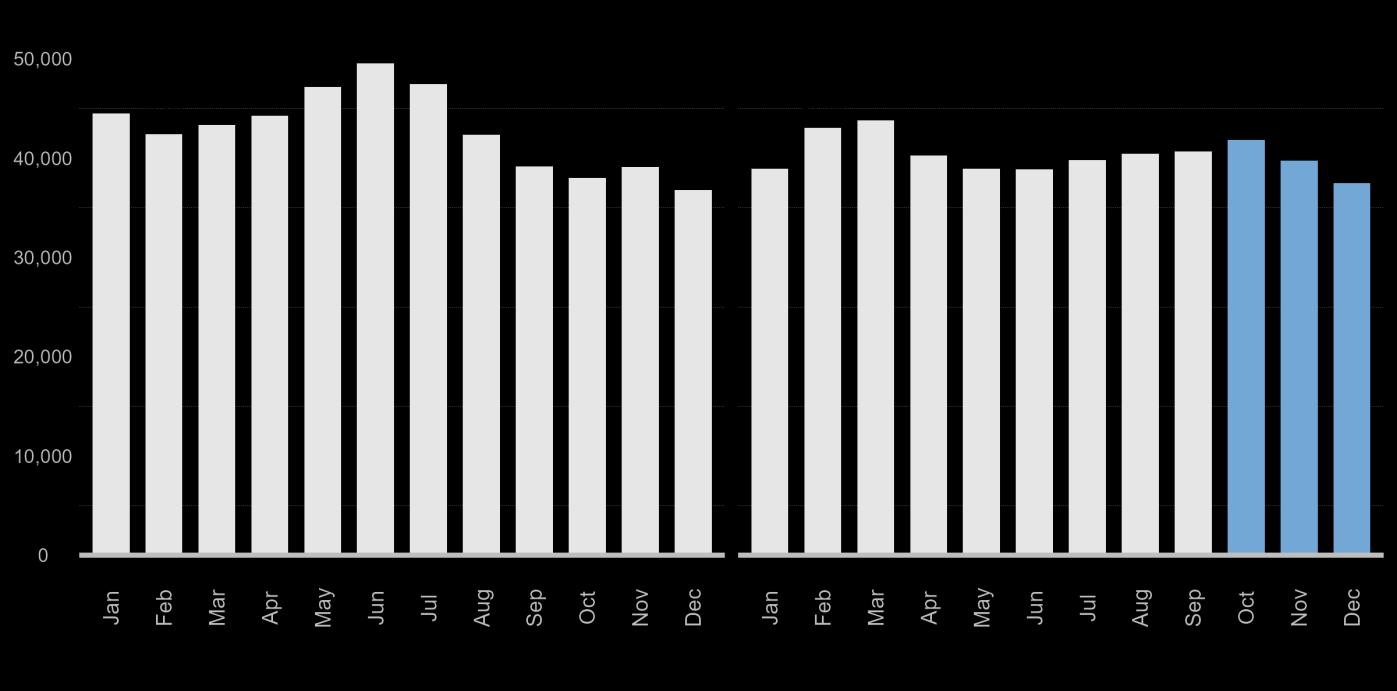
Philadelphia employers have shown recovering demand for labor over the last two years. However, this quarter saw a decline in job postings, following national trends of dampened demand.
Philadelphia’s job postings edged downward in the latter months of 2024, reversing the mid-year upswing and settling around 37,000 by December 2024. This drop suggests that employer demand, while still robust compared to early 2023 levels, has been tapering off amid rising economic headwinds and caution in hiring.
In Q4 2024, the dip of 4,791 job postings from last quarter tells a story of careful calibration rather than retreat in the job market. Despite the dip, average postings for 2024 overall still surpassed 2023 levels. Yet, the softer late-year figures hint at a more subdued hiring environment as Philadelphia heads into 2025.
8: Monthly Job Postings in PhiladelphiaCounty, Previous24 Months
Total Unique Postings in Q4 2024
997,930
Figure
Top In-demand Skills and Certifications
Project Management
Marketing
Nursing
Auditing
Finance
BoardCertified/Board Eligible
Wage Growth in Pennsylvania
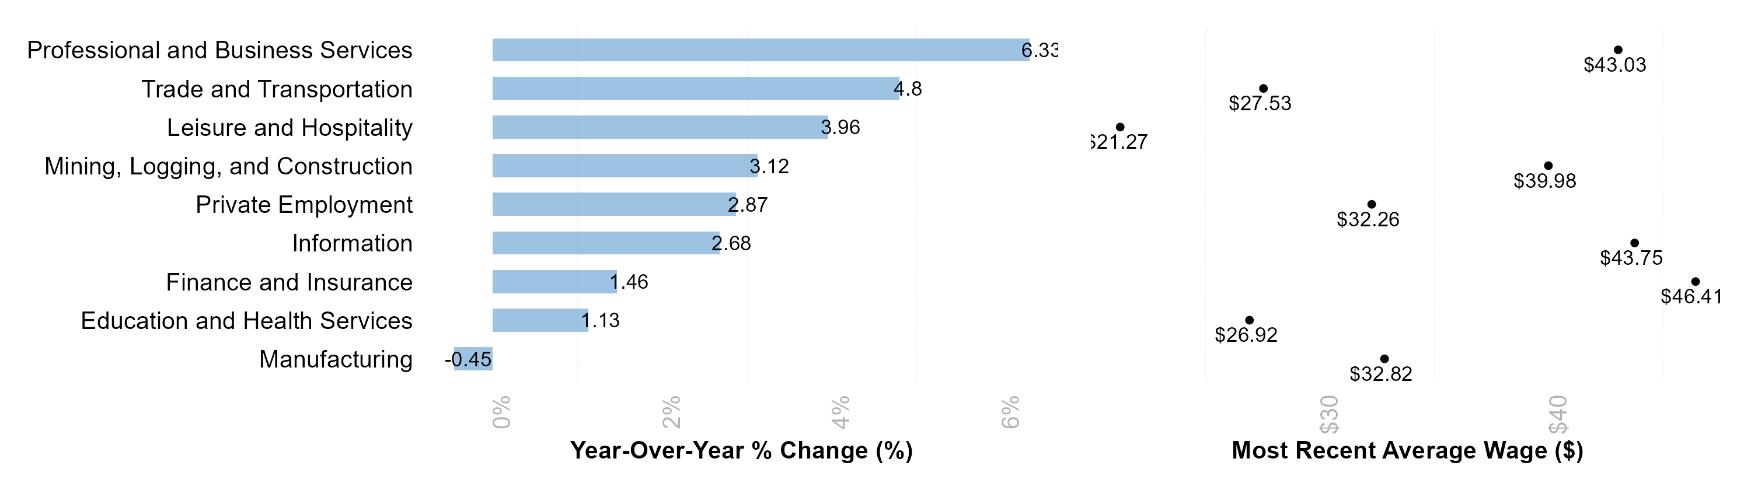
The labor market in Pennsylvania continues to reward high-skill professional services while revealing persistent challenges for traditional manufacturing roles. In December 2024, Professional and Business Services outpaced all other industries with a 6.3% year-over-year wage increase, pushing the most recent average hourly pay to $43 03 Trade and Transportation followed closely at 4 8%, while Leisure and Hospitality recorded a solid 3 96% bump By contrast, Manufacturing wages declined slightly(0.45%) settling at $32.82, the only sector to post negative growth.
Figure 10: PennsylvaniaYear-over-YearWage Growth, December 2024
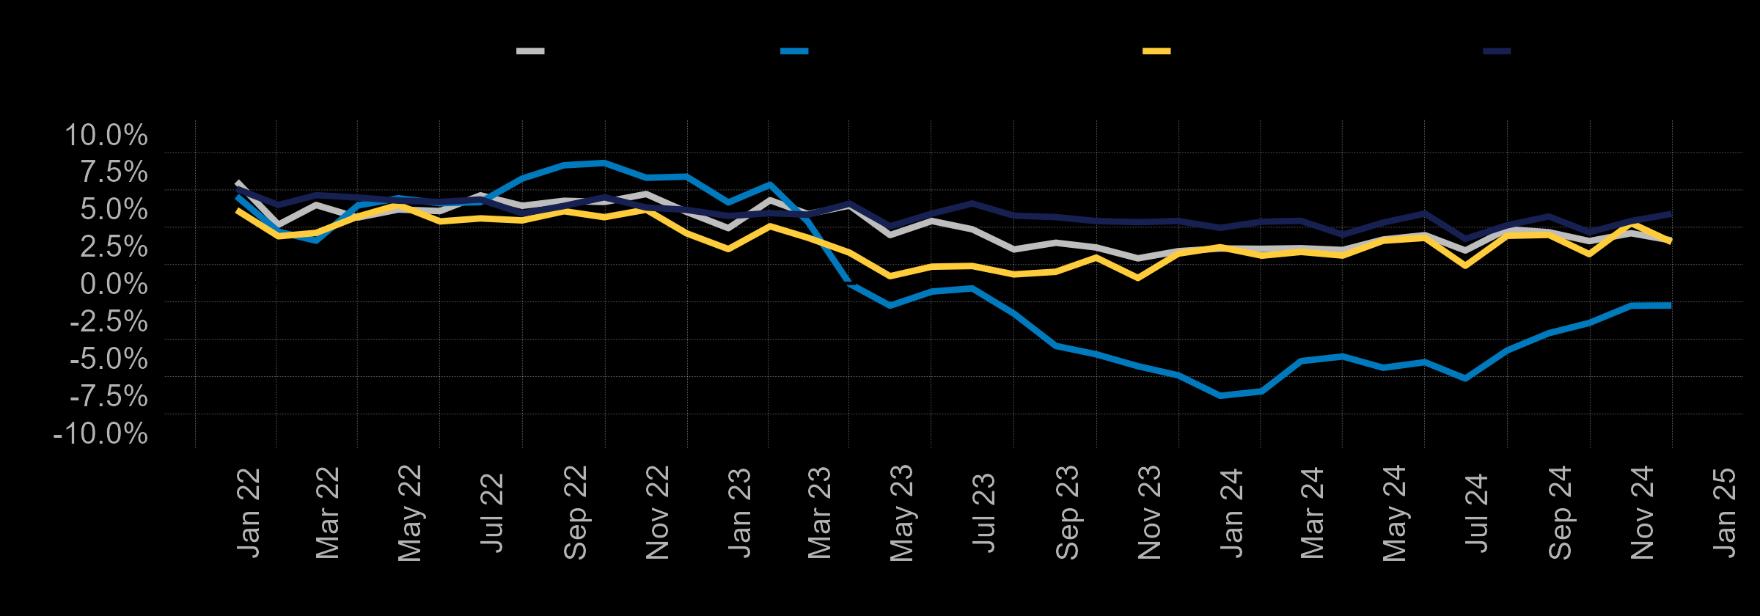
Philadelphia’s wage growth dipped below both the Pennsylvania and national averages in mid-2023 and has struggled to regain momentum. By late 2024, it appears to be stabilizing but still trails the U.S. pace. Meanwhile, the state’s wage trend has been steadier, hovering just below the national level
Figure 11 Year YearChange inAverageHourly Wages, All Private Employment
Inflation
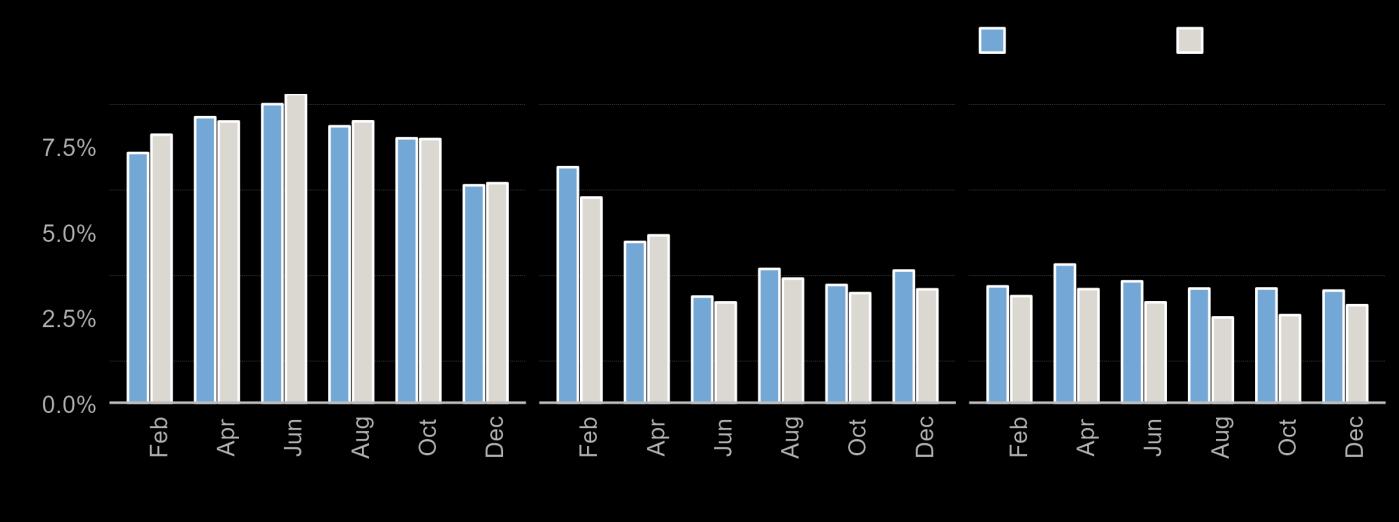
Figure 12: Bimonthly Year-Over-YearInflationAccordingtothe ConsumerPrice Index,2021 to Present
Bimonthly inflation surged through much of 2022, with year-over-year rates regularly surpassing 7%, before gradually easing in 2023 as monetary tightening took hold. By late 2024, inflation had stabilized around the mid-3% range.
This moderating trend reflects the impact of higher interest rates and improved supply conditions, though many households continue to feel the pinch of elevated living costs.
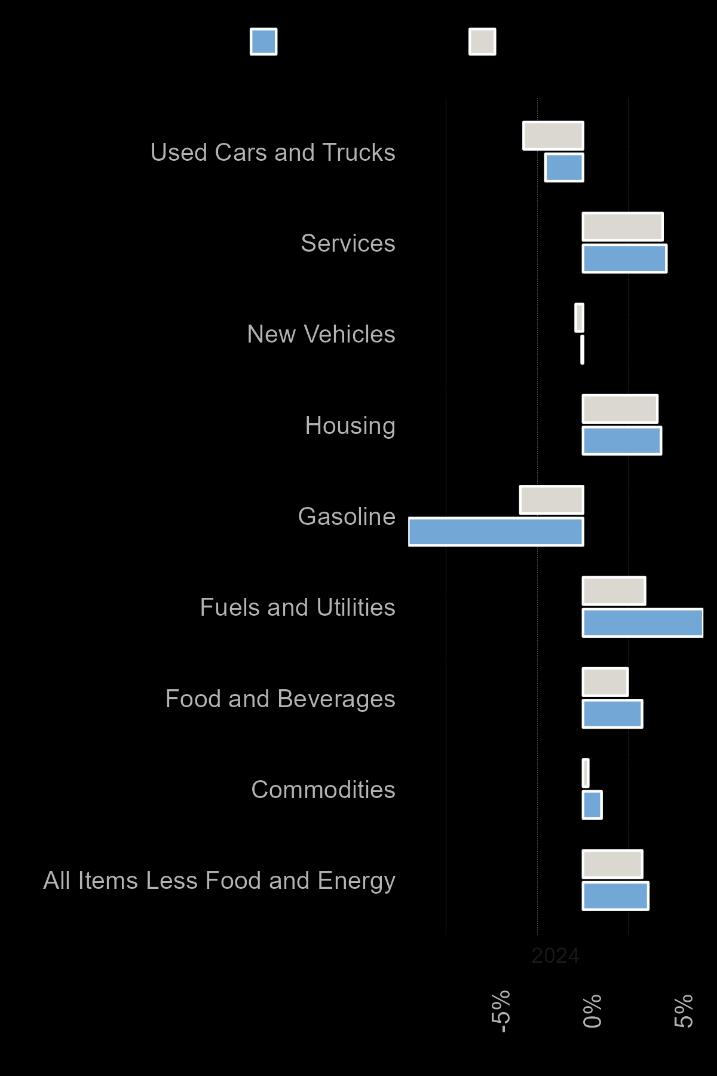
Philadelphia’s inflation picture in December 2024 reveals distinctive local pressures. Housing and energy-related costs in the city continue to outpace national trends, which means a tight rental market and local supply constraints, while consumers benefit from a sharp drop in gasoline prices. These divergent trends highlight how localized economic forces such as intense housing demand and energy market volatility are shaping the cost of living differently in Philadelphia compared to the broader U.S. landscape.
Figure 13: Bimonthly Year-Over-Year Change of InflationBucket , 2024
Resident Workers
Philadelphian Labor Force
Resident Workers: Gender
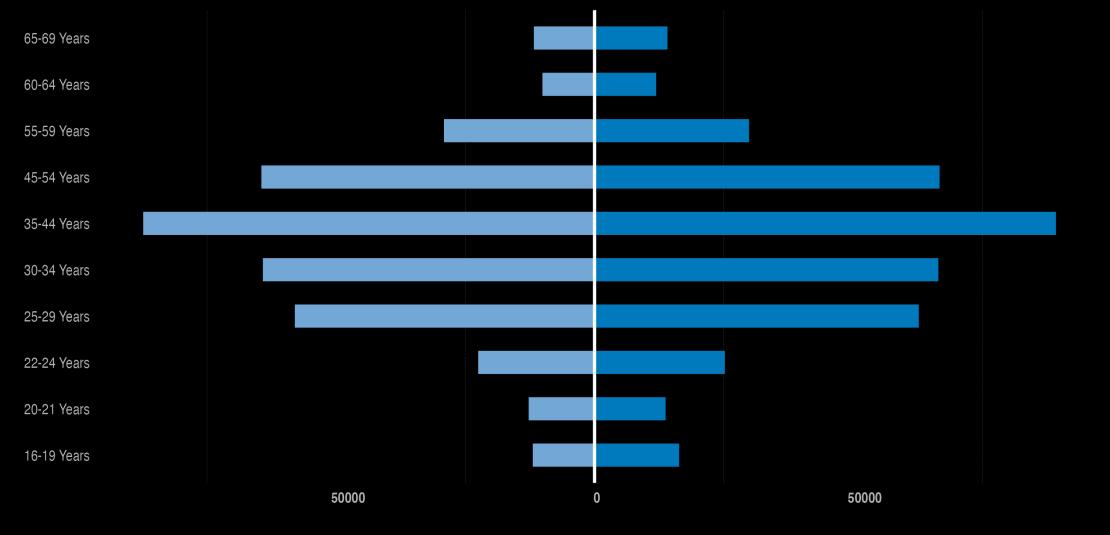
Figure 14: Labor Force by Age and Binary Sex, ACS 2023
While Philadelphia’s labor force has grown in recent years, employment outcomes vary by race, ethnicity, and educational attainment.
Based on Census data and ACS data, individuals between the agesof 25 and 34 make up the largest portions of Philadelphia’s population and labor force. For both men and women, labor force participation among these age cohorts is between 80% and 87%, higher than the overall rate. Source:
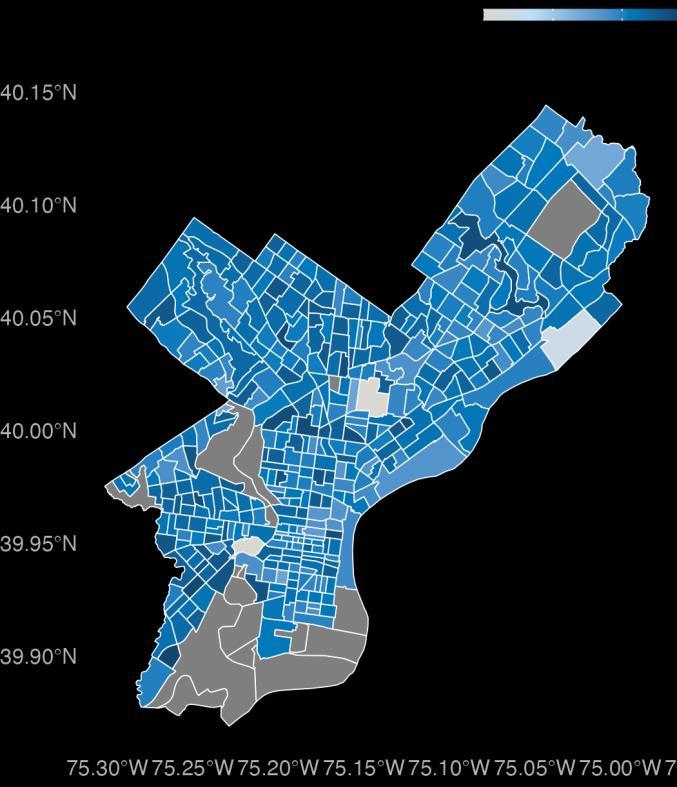
Thegender gapiscalculated by subtractingthe maleLabor Force Participation Rate(LFPR)fromthe female LFPR.
Map3, basedon2023ACS data, showsthisgapacross Philadelphia County. Areasin darkerblue particularly in North and Northeast Philadelphia indicate that women’s participation rates exceed men’s. Meanwhile, lighter blue areas inCentral and Southern Philadelphiapoint toa morebalancedorslightly male-leaning LFPR.
Female Male
Map 3: Labor Force Participation Rate (%) GenderGap, ACS 2023
Resident Workers: Ethnicity
Residents of color are more likely to be out of the labor force and unemployed.
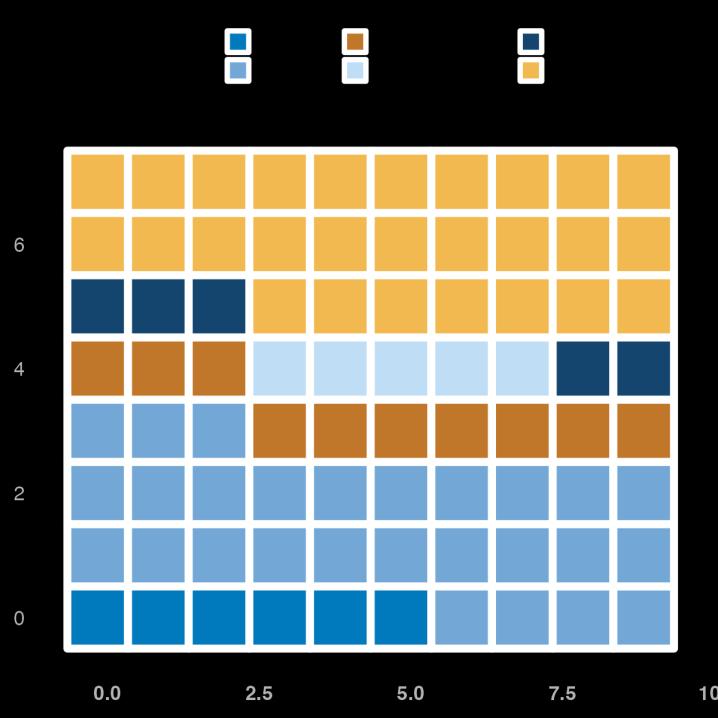
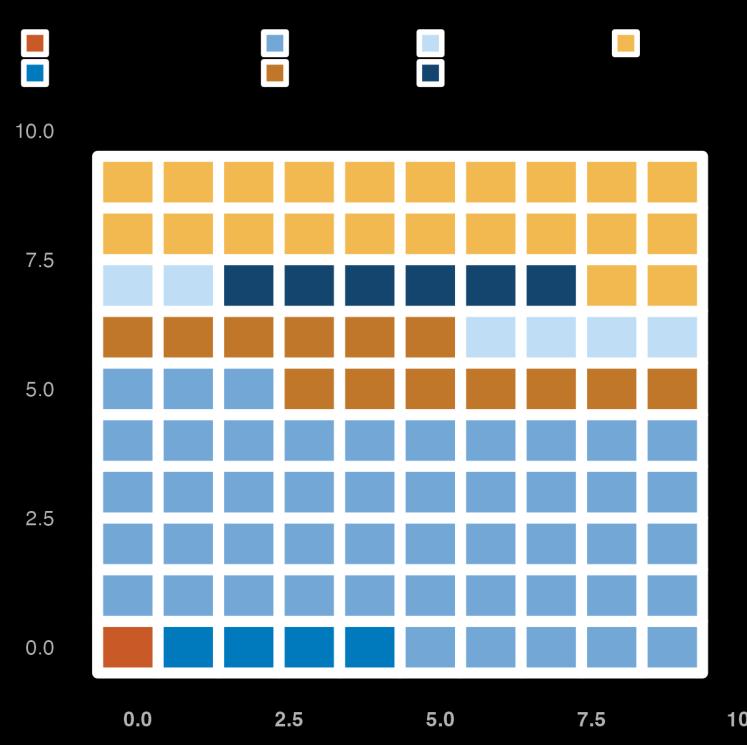
The grid charts (Figure 20 and Figure 21) provide a compelling visual representation of labor force participation and unemployment rates by race, using a 10x10 grid where each square represents 1% of the total. These charts reveal critical insights into the economic realities of different ethnic groups in Philadelphia.
The white population leads with a participation rate of 28%, followed closely by the black population at 27%. Asian and Hispanic populations have participation rates of 6% and 10%, respectively. Other racial groups, including American Indians, Pacific Islanders, and those identifying as two or more races, show lower participation rates.
The black population faces the highest unemployment rate at 48%, significantly surpassing other groups. The white population has an unemployment rate of 22%, while the Hispanic and Asian populations face rates of 13% and 4%, respectively.
Figure 15: Labor Force ParticipationRate by Race, ACS 2023
Figure 16: Unemployment Percentage by Race, ACS 2023
Educational Attainment and Geospatial Pattern
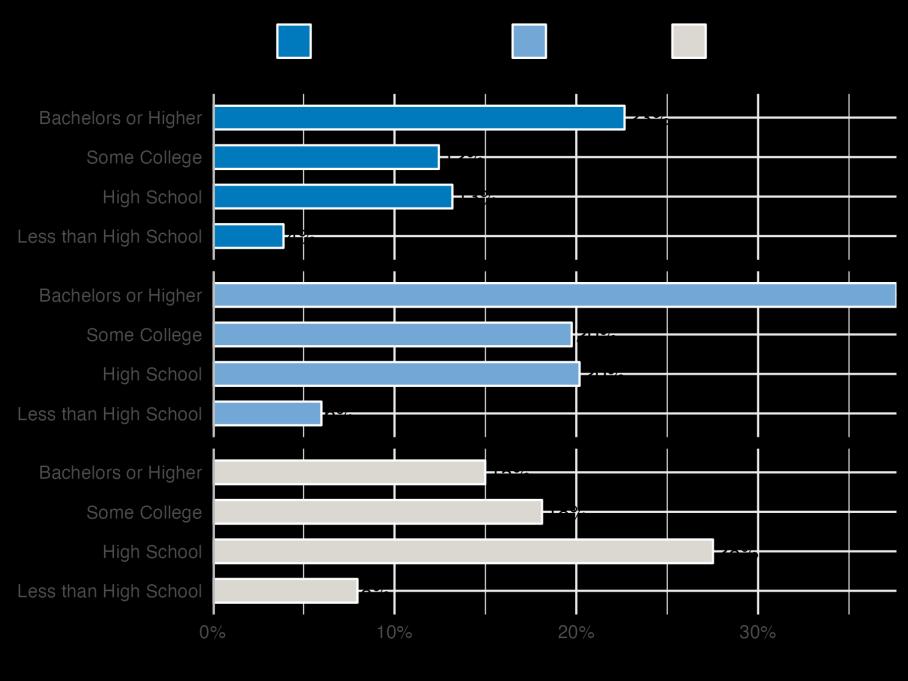
According to ACS 2023 data, in Philadelphia, individuals with a bachelor's degree or higher show the highest labor force participation and employment rates, along with the lowest unemployment rates. Conversely, those with less than a high school diploma face the most significant challenges, with the lowest participation and employment rates and the highest unemployment rates.
17: Proportion of Employmentand Labor Force Participation by Educational Attainment, ACS 2023
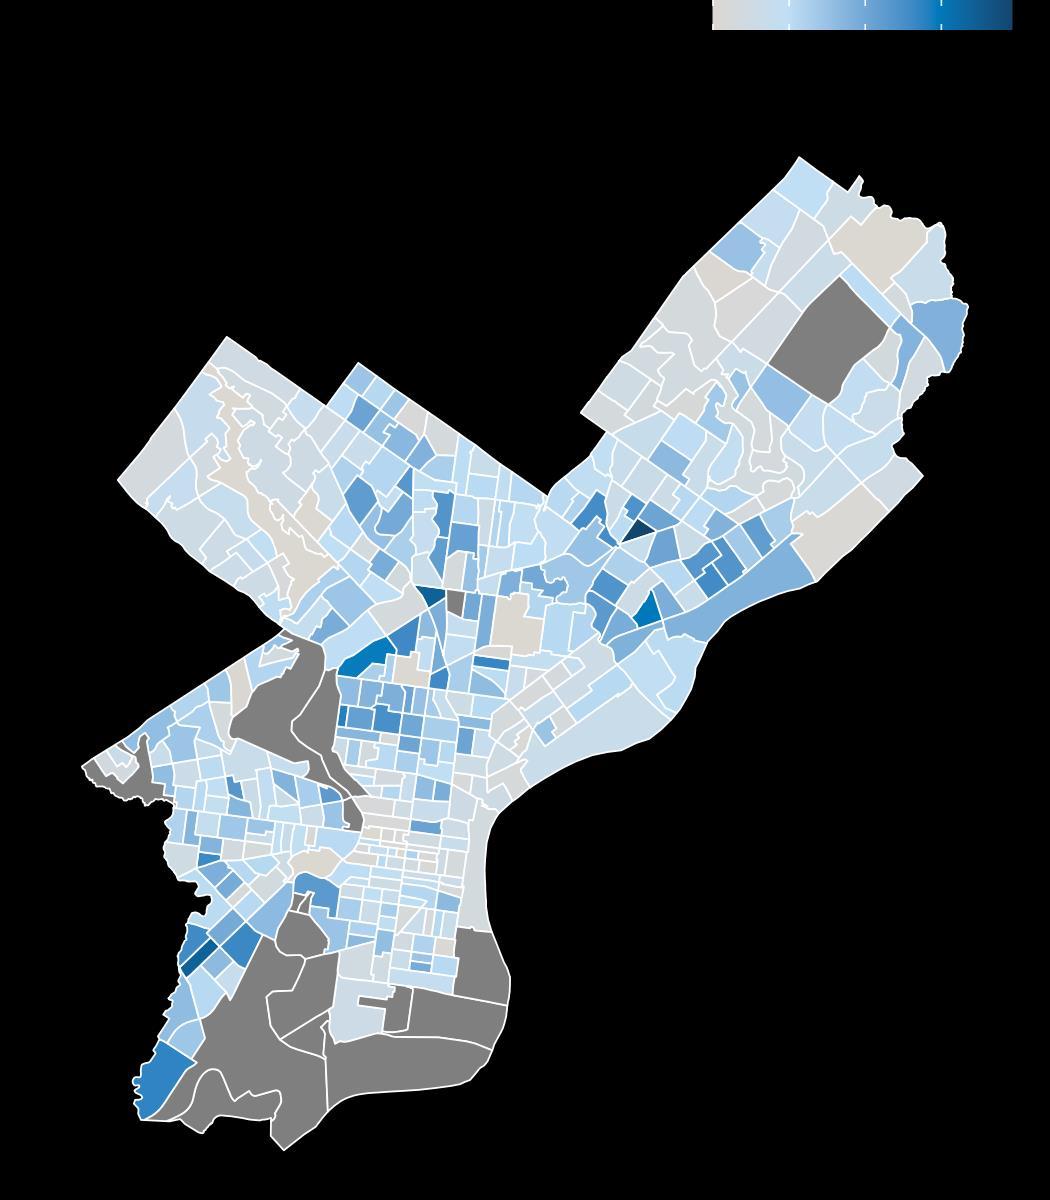
The map reveals notable geographic disparities in unemployment, with higher unemployment rates concentrated in North, Northeast, and Southwest Philadelphia.
These areas have been experiencing economic challenges, suggesting a need for targeted interventions and support programs to address unemployment.
Meanwhile, the lighterareas, such as parts of Center City and Northwest Philadelphia, show lower unemployment rates and better conditions.
Map 4: Unemployment Rate (%) by Census Tract in Philadelphia,ACS 2023
Figure
Geospatial Inflow & Outflow
Philadelphia is intrinsically connected to its suburban neighbors. Nearly half of all primary jobs in the city are held by workers who commute from outside the city limits.
Commuting patterns have greatly changed in the years since COVID-19. According to 2022 ACS 5year estimates, darker shades in Map 4 and Map 5 indicate higher concentrations of employed residents and employed workers. The dense areas are found in Center City and parts of South Philadelphia.
Map 5: Residents Densityof Employmentin Philadelphia, Total All Jobs, LEHD 2021
599,926
15%
Of Resident Workers
Relied on Public Transportation in 2021 17%
Of Resident Workers
Had No Access to a Vehicle in 2021
Map 6: Workers Density of Employment in Philadelphia, Total All Jobs, LEHD 2021
676,054
Appendix
Detailed Industry and Occupation Tables
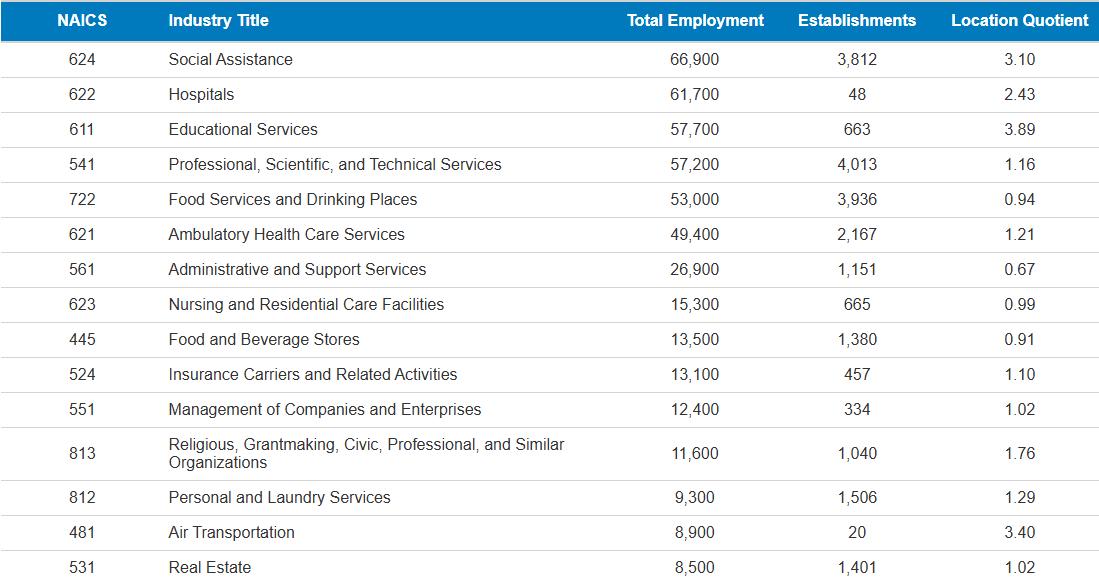
Appendix Table 1: Largest Detailed Industry Sectors in Philadelphia, Q4 2024
From the Quarterly Census of Employment and Wages, this table shows the 15 largest industry sectors by total employment. These data are released on a roughly six-month delay.
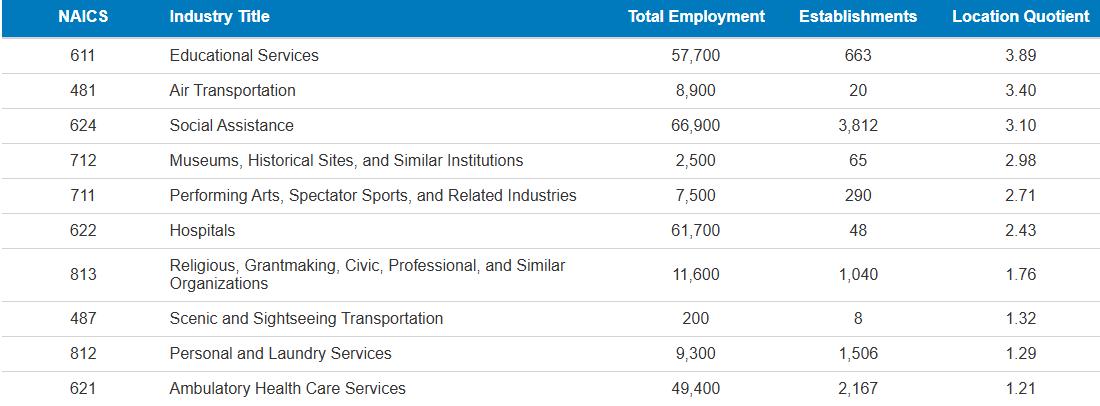
Appendix Table 2: Most Specialized Detailed Industry Sectors in Philadelphia, Q4 2024
From the Quarterly Census of Employment and Wages, this table shows the 10 most specialized industry sectors by total employment. These industries are disproportionately important to Philadelphia’s economy. These data are released on a roughly six-month delay.
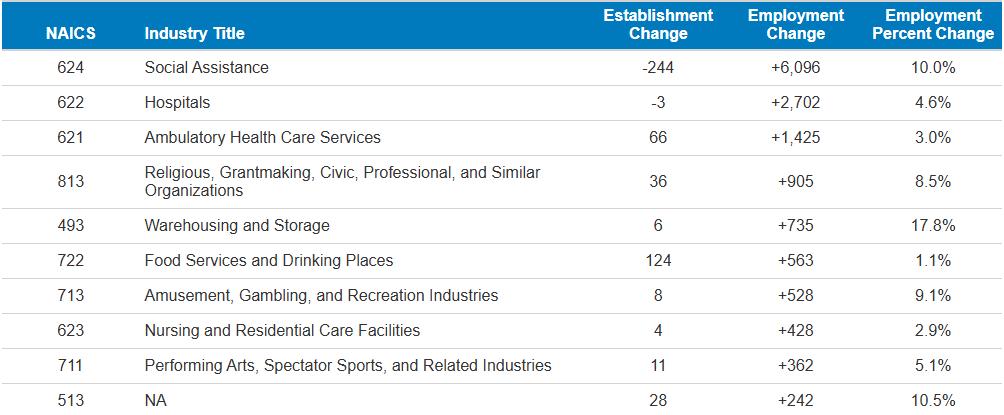
Appendix Table 3: Detailed Industry Sectors in Philadelphia with Largest Year-Over-Year Growth,
Q4 2024
From the Quarterly Census of Employment and Wages, this table shows the 10 industry sectors with the largest annual employment growth. These data are released on a roughly six-month delay.
Publishing Industries
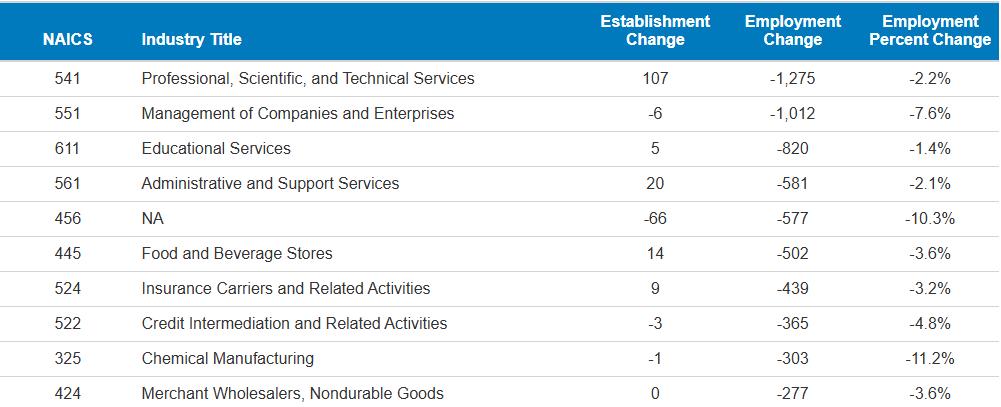
Appendix Table 4: Detailed Industry Sectors in Philadelphia with Largest Year-Over-Year Declines, Q4 2024
From the Quarterly Census of Employment and Wages, this table shows the 10 industry sectors with the largest annual employment declines. These data are released on a roughly six-month delay.
Clothing, Clothing Accessories, Shoe, and Jewelry Retailers
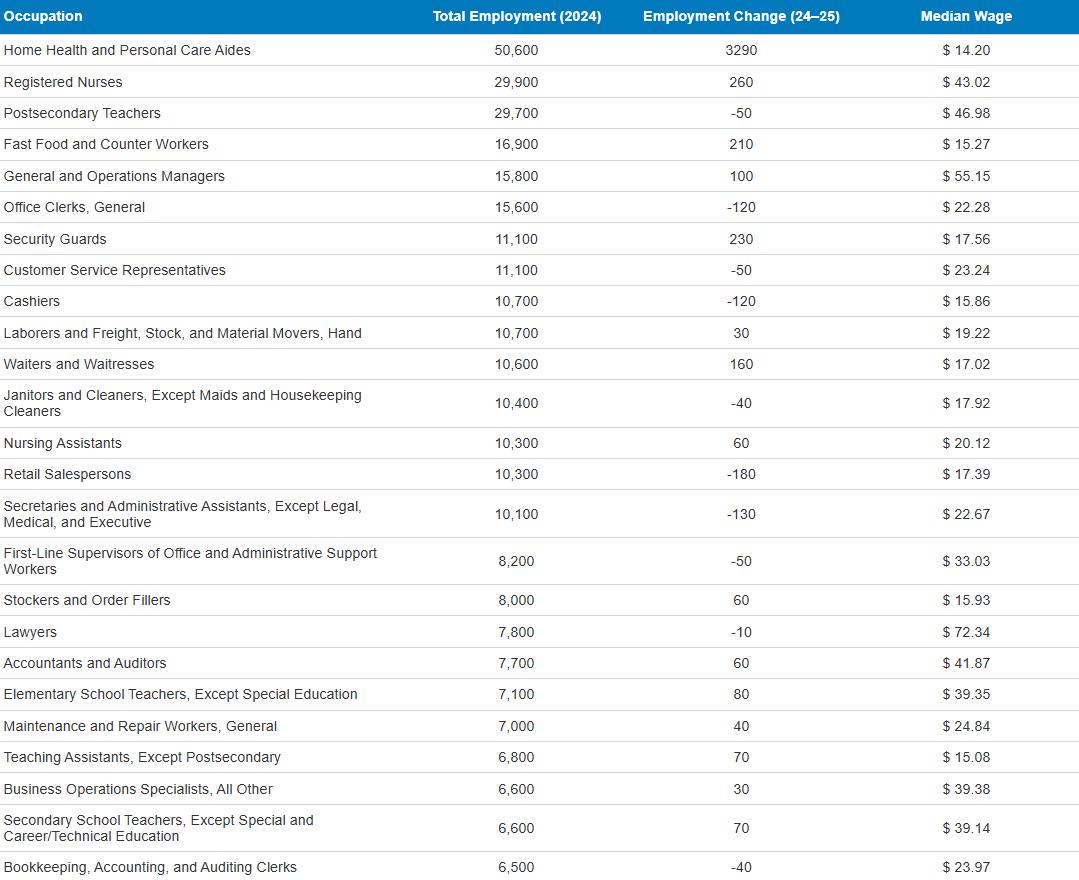
Appendix Table 5: Largest Occupations in Philadelphia with Employment Change from January 2024 to January 2025
Basedon estimates derived from the Quarterly Census of Employment and Wages, this table shows the 25 largest occupation by total employment. These data are released on a roughly nine-month delay. Source: Philadelphia