Prepared by Philadelphia Works, Inc.


Using the latest available data, this quarterly update offers insight into Philadelphia’s labor market, industry mix, and economic development.
In 2018, Philadelphia’s institutionaland community leaders collaborated to develop a comprehensive workforce development strategy. This document, Fueling Philadelphia’s Talent Engine, calls on Philadelphia Works, Inc. to serve as the city’s hub of labor market and economic reporting and analysis.
Under this mandate, this quarterly report provides insight into key measures of economic activity, providing leaders across public and private institutions an easy-to-access update on how Philadelphia’s economy and labor force continue to evolve.
Philadelphia Works engagement with the local economy and workforce
Page 07
The most recent data available on Philadelphia’s economy. Page 15
Exploring recent trends in employer demand through job postings and other sources.
For more insight into Philadelphia’s labor force, economic characteristics, and the employment dynamics, visit the Philadelphia Works website.
Demographic, social, and economic characteristics of Philadelphia’s labor force. Page 25
Detailed employment information for important industries and occupations in Philadelphia.
Philadelphia’s economy continues to face a dynamic landscape in the postpandemic era, with a blend of recovery and ongoing challenges. While employment levels remain strong, economic uncertainties, including inflation and labor market fluctuations, persist. Here are the key highlights for Q2 2024:
• The unemployment rate in Philadelphia rose to 5.1% in June 2024, up from 3.8% in April. The number of unemployed individuals increased significantly, totaling 39,122 by the end of June. Despite these fluctuations, the labor force remained stable at around 760,000 throughout the quarter, and total employment ended at 721,134 in June.
• Sector performance varied: Leisure and Hospitality added 3,000 jobs, while Education and Health Services saw a decrease of 3,800 jobs. Wage growth across sectors was modest, and Philadelphia’s inflation rate (3.59%) continued to outpace the national average (2.97%), which highlights ongoing cost pressures.
“Continued economic growth is critical to the future of our city and region, and is dependent upon a strong, skilled workforce.”
Fueling Philadelphia’s Talent Engine
• The Consumer Price Index (CPI) a measure of inflation continued its upward trend, with Philadelphia’s CPI reaching 3.59% in June 2024, higher than the national average of 2.97%. Wage growth across the private sector showed modest gains but remained subdued compared to previous years, which shows ongoing economic adjustments influenced by broader monetary policies.
• Geographic disparities in unemployment are notable, with higher unemployment rates concentrated in North, Northeast, and Southwest Philadelphia, indicating areas in need of targeted interventions and support programs. Individuals aged 25 to 34 saw the highest labor force participation rates, with significant engagement from both men and women in this cohort. Higher educational attainment correlates with higher participation and employment rates and lower unemployment rates.

High Priority Occupations (HPOs)
Philadelphia Works, Inc. invited employers, workforce and education partners, and the public to contribute to the list of High Priority Occupations (HPOs) for Philadelphia County for the 2024-2025 period.
The Pennsylvania Department of Labor & Industry generates this list annually to identify key occupations that require investment in workforce training and education, aiming to fill positions that offer family-sustaining wages, meet employer demand, and align with career pathways to middle-skilled jobs.
Philadelphia Works, Inc. has revised all submissions and submitted the final in June.
The finalized 2024 HPO lists was made available in August 2024 and will guide workforce development efforts from August 1, 2024, through July 31, 2025.
The HPO lists are crucial for aligning workforce initiatives with the needs of the local economy to ensure that investments in training and education directly support occupations with high demand and strong wage potential.
• Over 198,000 households in Philadelphia County received cash public assistance or SNAP benefits in 2022, according to the American Community Survey. Programs like TANF aim to support low-income individuals but face challenges with eligibility requirements that can disqualify recipients due to small income increases or changes in occupation.
• Our analysis, using a generalized benefit cliff model and Census microdata from IPUMS USA, identifies over 7,700 households in Philadelphia near the benefit cliff, where even a $1/hour wage increase could result in losing social services. Households at risk are more likely to be led by African Americans, women, and individuals with some college education but no degree.
• This research underscores the importance of policy reforms to provide stability and support for households transitioning off public assistance programs.
• Reforming TANF implementation, enhancing supportive services, and offering universal benefits in areas like housing, healthcare, and childcare could improve outcomes for recipients.
• African American households, women, and those with some college but no degree are disproportionately at risk of falling off the benefit cliff.
• Further research is needed to explore additional demographic impacts and refine policy recommendations to prevent benefit cliffs and promote financial stability for at-risk populations.
is a federal block grant that offers cash assistance and other services to pregnant individuals and families with children. TANF
The cash grant in Pennsylvania has not been adjusted since 1990, with 50% of its real value estimated to have been lost due to inflation.

A TANF recipient can have no more than $1,000 in countable resources including money in any bank and savings accounts and the value of a second car. Additionally, an eligible recipient must have total net countable income below the cash grant size for their household type.
Increase the cash grant to 50% of the federal poverty line
Adjust For Cost-of-living to match inflation.
Increasing the cash grant size to be at least 50% of the federal poverty line would more than double what is currently available. These low cash grant amounts minimize the benefit cliff effect for TANF.
Raise Earned Income Disregard from 50% to 75%.
Eliminate administrative barriers and involuntary work requirements.
Adopt effective poverty reduction policies like the expanded Child Tax Credit of 2021
Expand the social safety net for housing, healthcare, and childcare.
Support Workers Earning Low Wages through measures like unionization.
"Various changes to TANF could lead to better outcomes "

Is formerly known as food stamps and provides food benefits to families with low-income to supplement their grocery budget so they can afford the nutritious food essential to health and well-being.
7,500+ vulnerable households identified in Philadelphia County using SNAP income limits and Census data.
Census microdata shows heads of these vulnerable households are less likely White-alone and more likely women.
Heads of these households are less likely to only have a high school diploma, while more likely to have completed some college, but with no degree.
"Based on just SNAP income limits, these 7,500 households are within $1 an hour of losing social services"
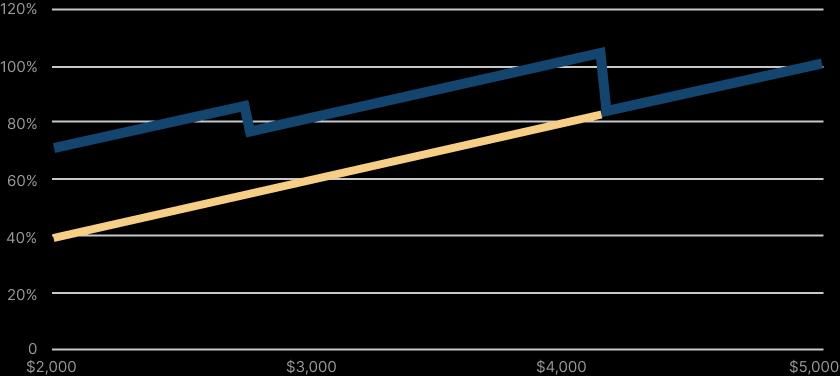
The SNAP cliff model assesses the percentage of a self-sufficient wage a household achieves with their income plus social services ("wage adequacy").
Because they lose access to SNAP and childcare subsidies
An income increase from $4,100 to $4,200 per month a family's wage adequacy drops from 107% to 84%
DEMOGRAPHICS OF HEADS OF HOUSEHOLDS ON THE SNAP CLIFF

Using Census microdata, we find that households on our general cliff have a higher share of African-American heads of households, as well as women.
Of Heads of Households on the Cliff
Of Philadelphia County Heads of Households


Employment in Philadelphia
June2024
Estimated Total Labor Force
760,256
+19,836 year-over-year
Estimated Total Employment
721,134
+18,594 year-over-year
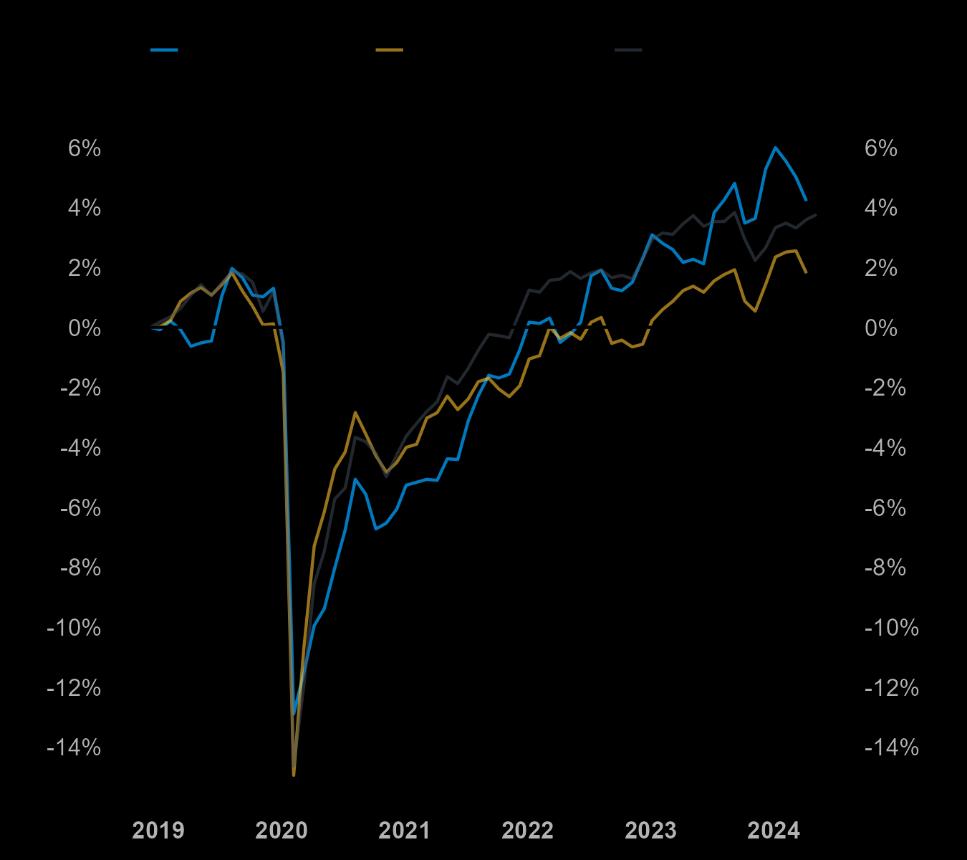
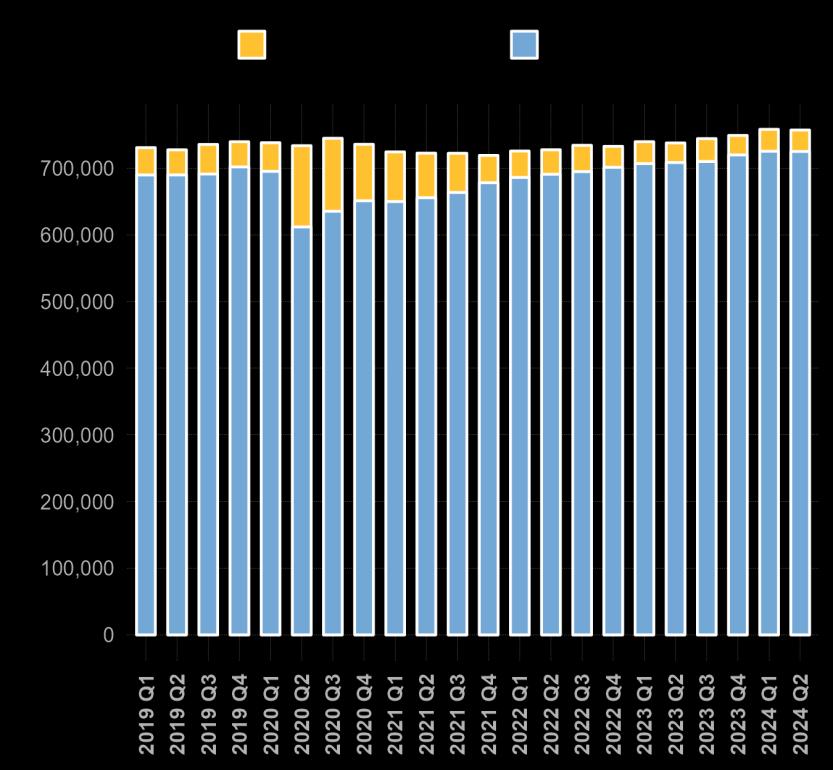
Philadelphia’s labor market continues to show resilience and growth. The total labor force reached 760,256 in June 2024, marking an annual increase of 19,836. Similarly, total employment grew to 721,134, reflecting an annual growth of 18,594.
In recent months, Philadelphia County has seen sustained improvements in both labor force size and employment levels. Since January 2019, employment trends at the county level have mirrored national growth, demonstrating a steady recovery trend.
Figure 1:
Labor Force and Total EmploymentTrend in Philadelphia: January 2019 to June 2024
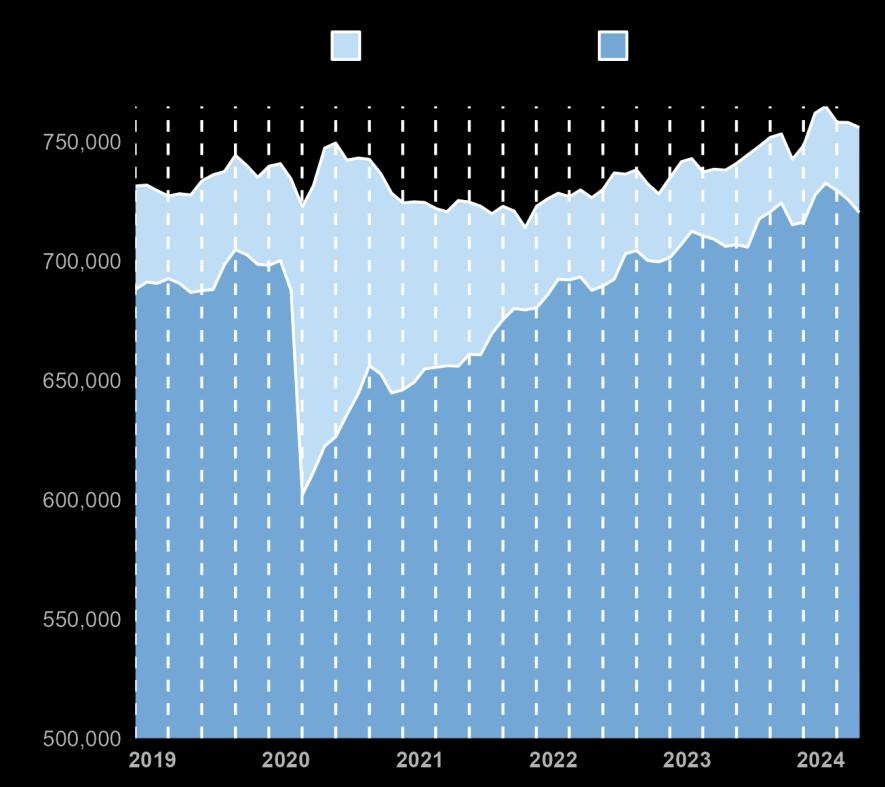
Figure 2
Total Employment Relative to January 2019 by Geography
June2024
Estimated Unemployment Rate
5.1% + 0.1 points year-over-year
Estimated Unemployment
39,122 + 2,866 year-over-year
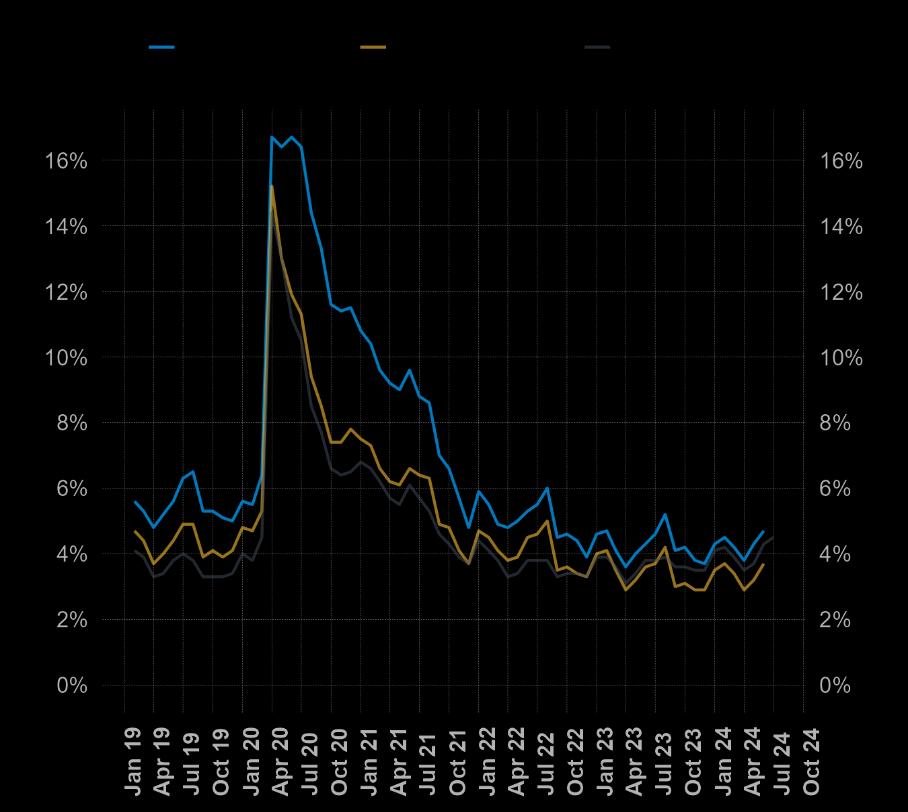
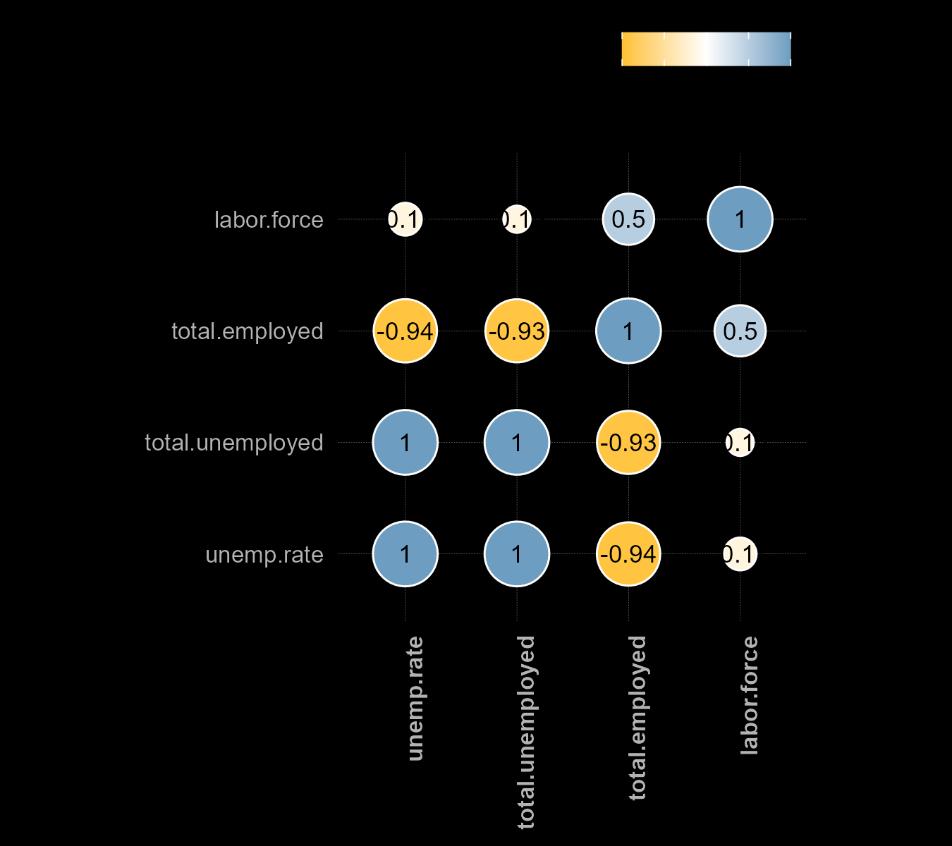
Figure 4: CorrelationMatrix of Four Features Since January 2019
Despite a robust labor force, unemployment rates have risen. Philadelphia's unemployment rate rose to 5.1% in June 2024, which reflects a significant increase of 1.0 percentage point compared to the previous year. The total number of unemployed individuals grew by 6,926 over the same period, reaching 39,122. This increase in unemployment has been notable since April 2024 in second quarter, where the rate was at 3.8%.
By the end of Q2 2024, the unemployment rate showed fluctuations, primarily driven by shifts in the labor market and economic conditions, and it has been ongoing challenges in achieving full employment recovery.

Philadelphia's labor market remained strong in Q2 2024, despite facing challenges such as inflation and rising unemployment. The labor force hit 760,256 in June, showing steady growth despite some economic headwinds.
Employment continued to climb, reaching 721,134. However, the unemployment rate rose to 5.1% by the end of the quarter, a slight uptick from earlier in the year. The rise in unemployment may point to underlying issues such as skills mismatches or sector-specific downturns.
The labor force showed moderate growth in Q2. The gains seen in Q1 2024 gave way to more tempered growth in Q2, highlighting the need for targeted interventions to bolster job creation and support sectors that are lagging.
Relative to other large cities, Philadelphia’s regional economy has proven to be resilient. Philadelphia is one of the top four metro areas to have maintained positive job growth both in the last year and since pre-pandemic levels
Figure 7: Employment Change Relative to Pre-Pandemic Employment, February2020 to June 2024
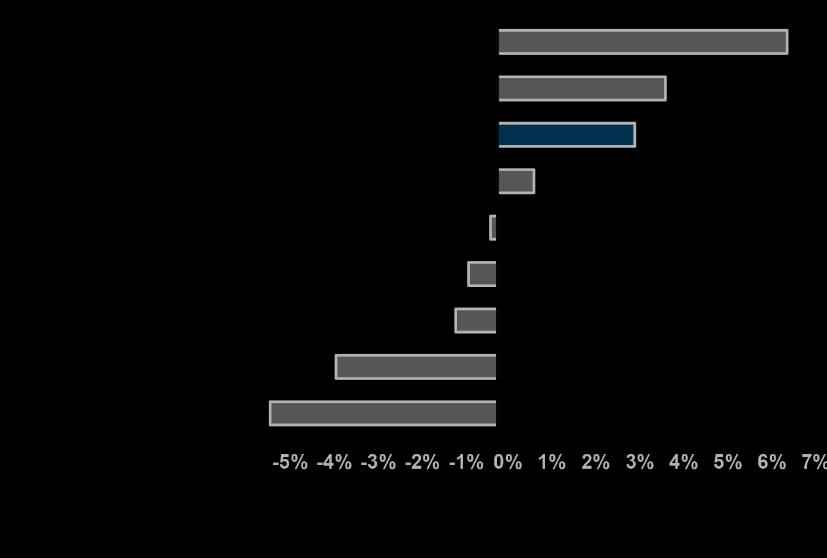
Figure 8: Relative Employment Change Year-Over-Year, June 2024
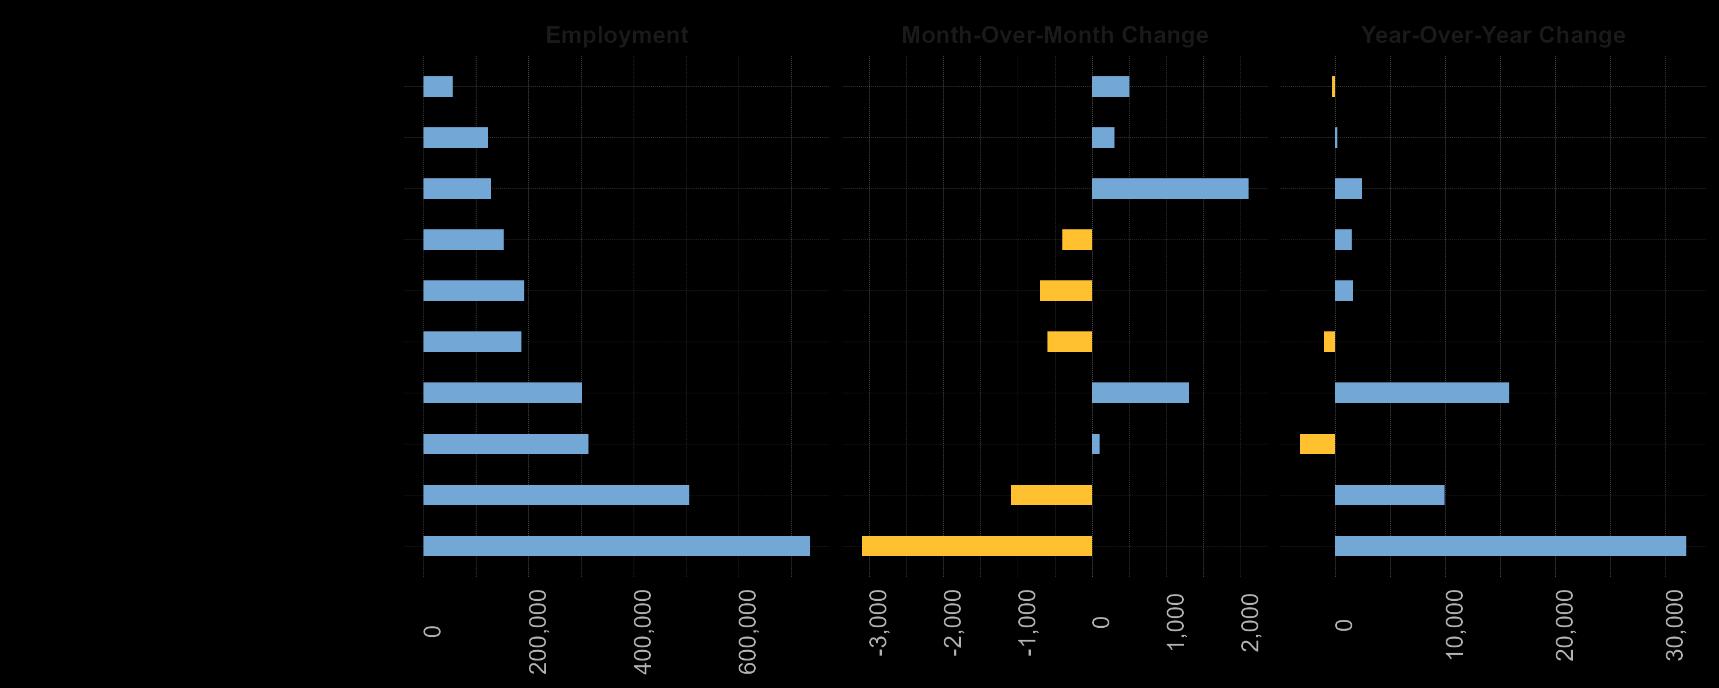
In June 2024, Philadelphia's employment trends show Education and Health Services maintaining a strong lead, while Leisure and Hospitality experienced notable month-over-month growth, highlighting dynamic shifts across key sectors.
9: Regional Employment by Industry Sector in PhiladelphiaMSA, June 2024
In addition to looking at industry development from a temporal perspective, a spatial perspective provides another distinct highlight. The American Community Survey (ACS) has been collecting data about the social, economic, demographic, and housing characteristics of the U.S. population with geographic information. We are analyzing 2022 ACS data and geodata to provide communities with current information for policy decision-making and further solutions.
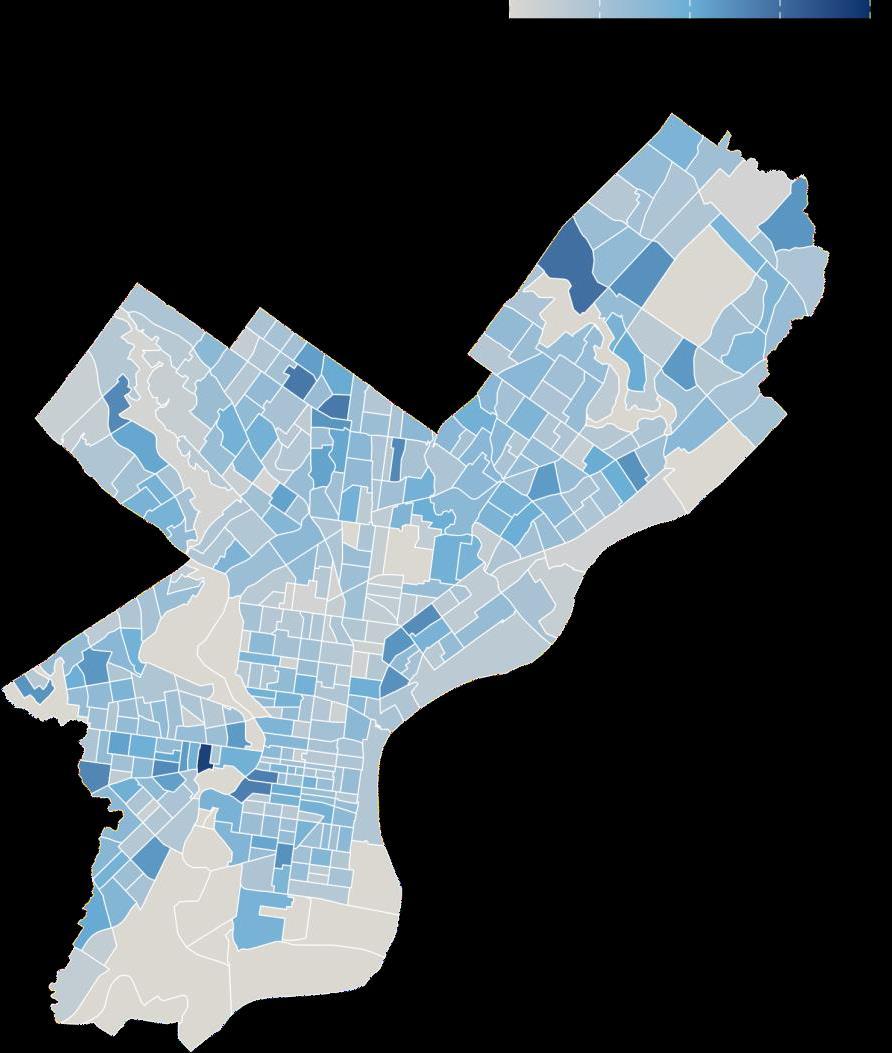
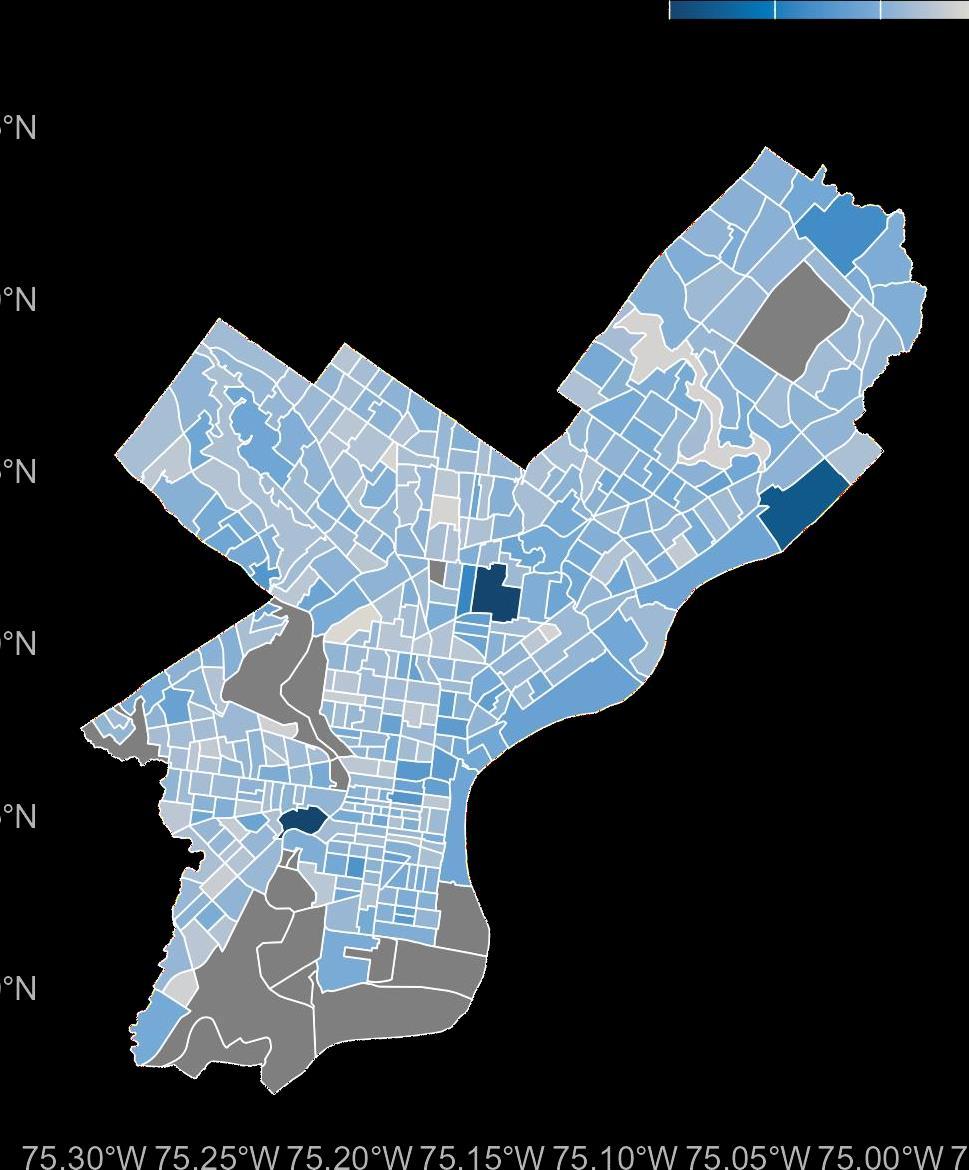
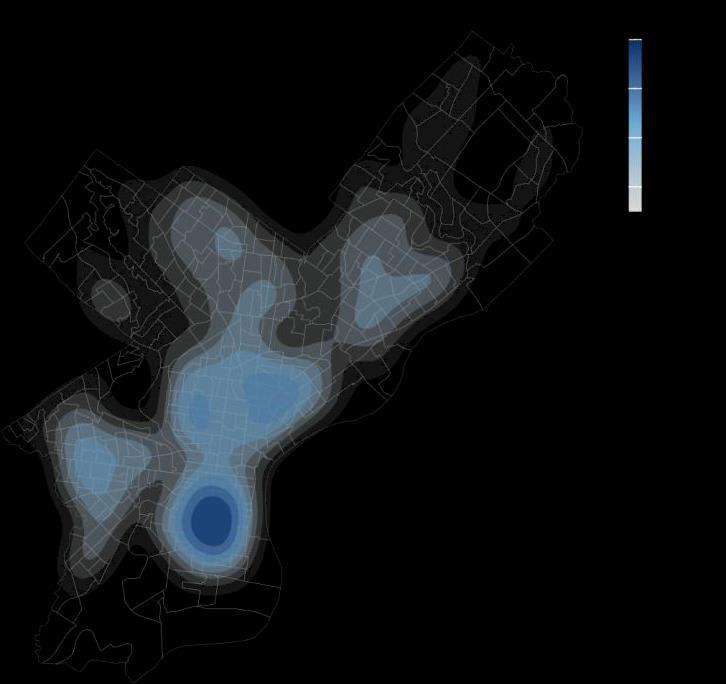
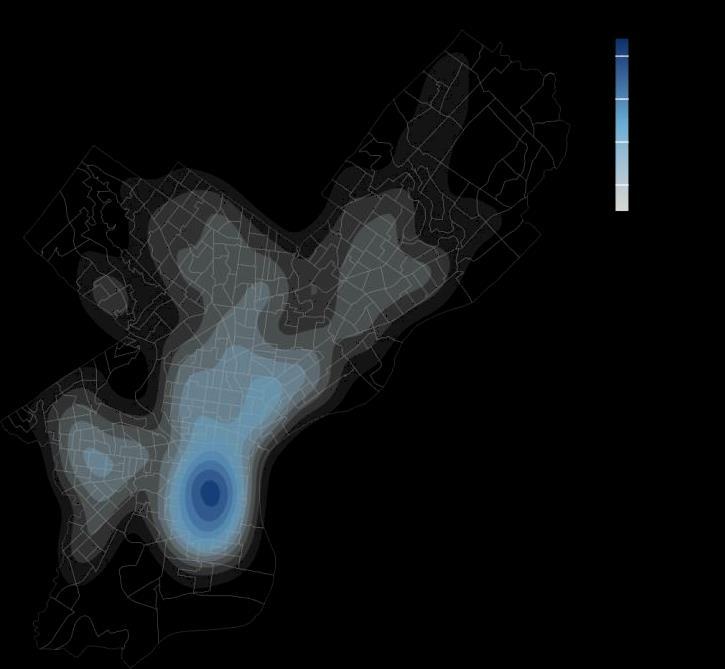
The regional economy in Philadelphia County is primarily driven by the Education and Health Services sector, which has shown predominant demand and growth in general. The map (Map 1) illustrates the geospatial distribution of sector development and growth at the census tract level in Philadelphia County.
Dark blue areas represent the highest concentration of employment in Education and Health Services, mainly in the west, center, and north of Philadelphia, near major health care centers and institutions. It also indicates a high density of employed individuals in those areas. Lighter blue areas have relatively fewer facilities for Education and Health Services, while the grey areas indicate no related clustered Education and Health Services.
Map 1: Education and Health Services
Employed Individuals Distribution, ACS 2022
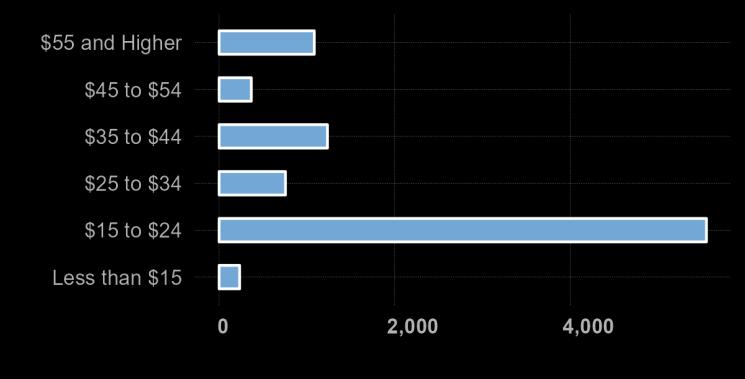
From 2023 to 2024, Philadelphia saw the most significant employment growth in the $15 to $24 hourly wage range. Employment in higher wage ranges ($25 to $34 and $35 to $44) also grew steadily, though changes in low and high-wage jobs were smaller.
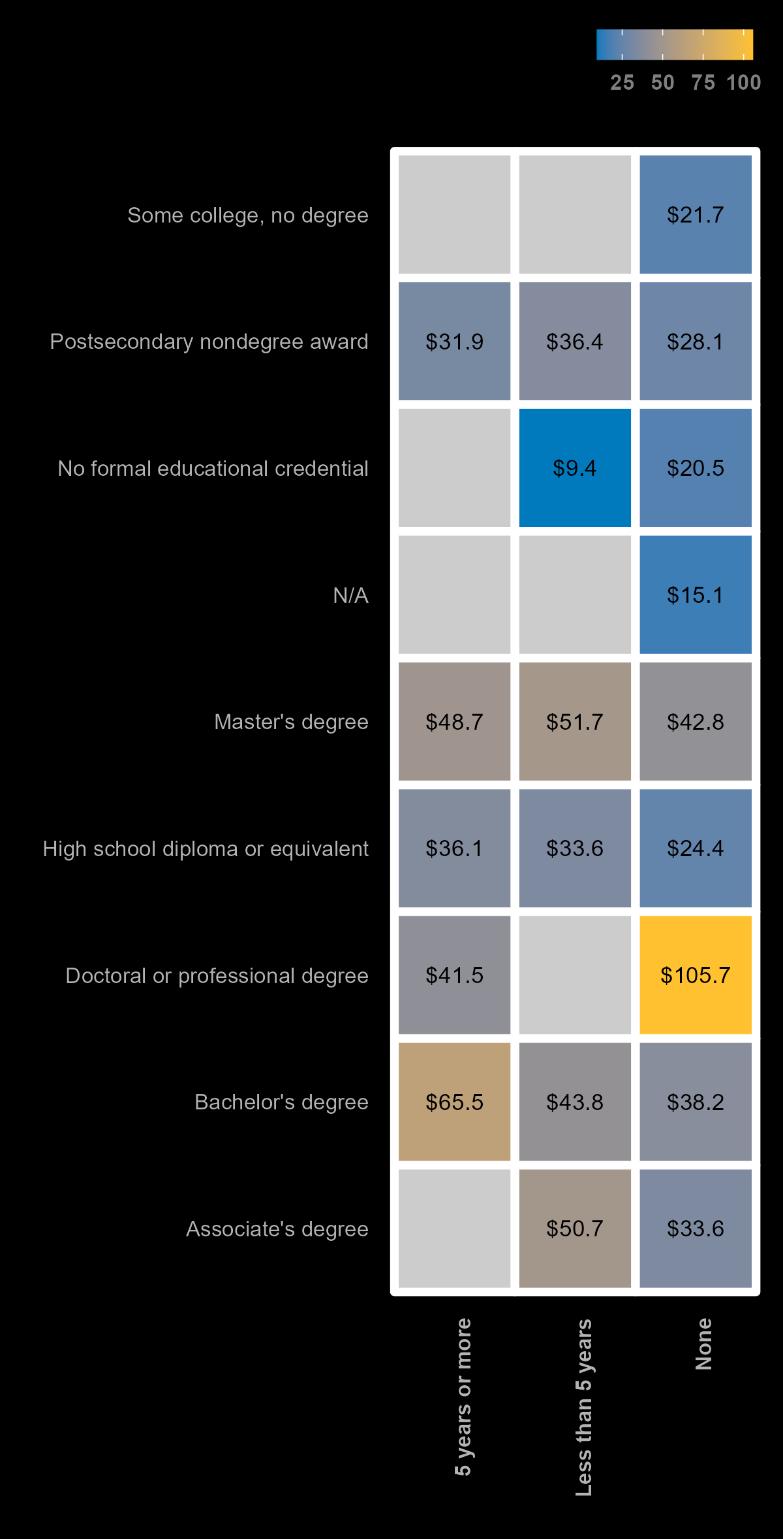
As highlighted in Figure 11, individuals with higher education and substantial work experience command the highest wages. Those with a doctoral or professional degree and extensive experience can earn up to $105.7 per hour.
Master’s degree holders earn up to $51.8 per hour with less than five years of experience, while bachelor’s degree holders can earn up to $65.5 per hour with more than five years of experience. High school diploma holders, even with over five years of experience, earn up to $36 per hour.
Unemployment Compensation (UC) claims reveal notable job losses in key sectors for the first half of 2024. Home Health Aides lead with 628 claims, followed by Bus Drivers, School or Special Client (286 claims), Security Guards (255 claims), Teacher Assistants (215 claims), and Cashiers (173 claims).
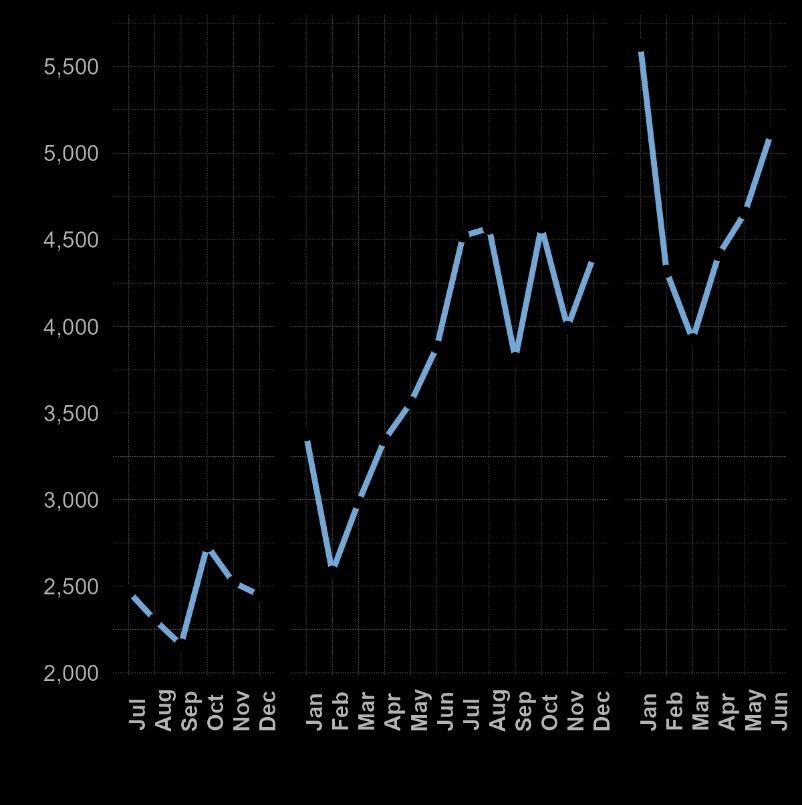
In the first half of 2024, the highest number of initial unemployment claims was recorded in January, with 5,623 claims. This was followed by a steady decline until March, with claims dipping to 3,923, before a gradual increase through June, ending at 5,116 claims.
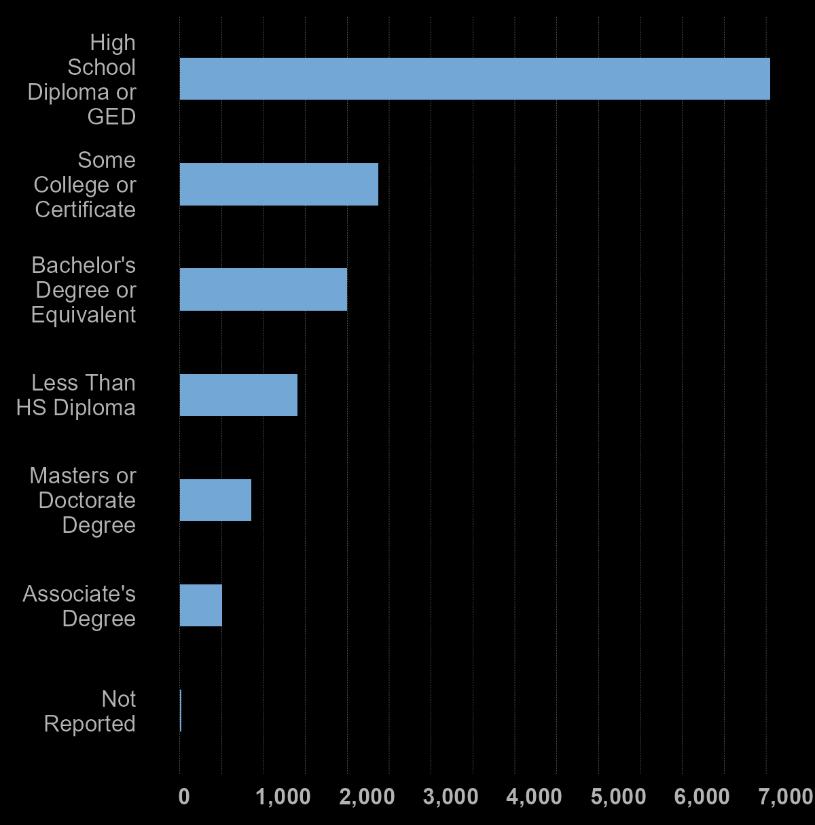
Most unemployment claimants from January to June 2024 had a high school diploma or GED, totaling 7,046 claims. A significant number of claimants also had some college education or certificates (2,370 claims) or a Bachelor's degree (1,996 claims).
Figure 13: ReportedEducational Attainment of PhiladelphiaClaimants, January to June 2024

Philadelphia employers have shown recovering demand for labor over the last two years. However, this quarter saw a decline in job postings, following national trends of dampened demand.
Lightcast scrapes local job postings to provide data on employer demand based on occupation, industry, and a variety of other details.
In Q2 2024, Philadelphia County recorded 40,280 unique job postings in June, slightly higher than 38,960 postings in May and 40,220 in April. This moderate rise in job postings from May reflects a slight recovery in the local job market after the first quarter’s decline, where March saw 43,670 postings, followed by a dip in February and January, with 43,080 and 38,920 postings, respectively.
The slight fluctuation in job postings throughout the year points to ongoing challenges in labor demand, possibly influenced by seasonal patterns and broader economic factors.
14:
Q2 2024 Unique Job Postings
40,280
Change in Total Postings Over Previous Quarter
-6,210

In Q2 2024, job postings continued to reflect strong recruitment needs across the healthcare, education, and technology sectors in Philadelphia County.
The University of Pennsylvania led with 31,567 job postings and 4,659 unique openings, followed by Comcast with 11,088 postings and 993 unique postings.
Top employers also included ShiftMed (9,132 postings), Penn Medicine (4,793 postings), and Thomas Jefferson University Hospital (3,723 postings).


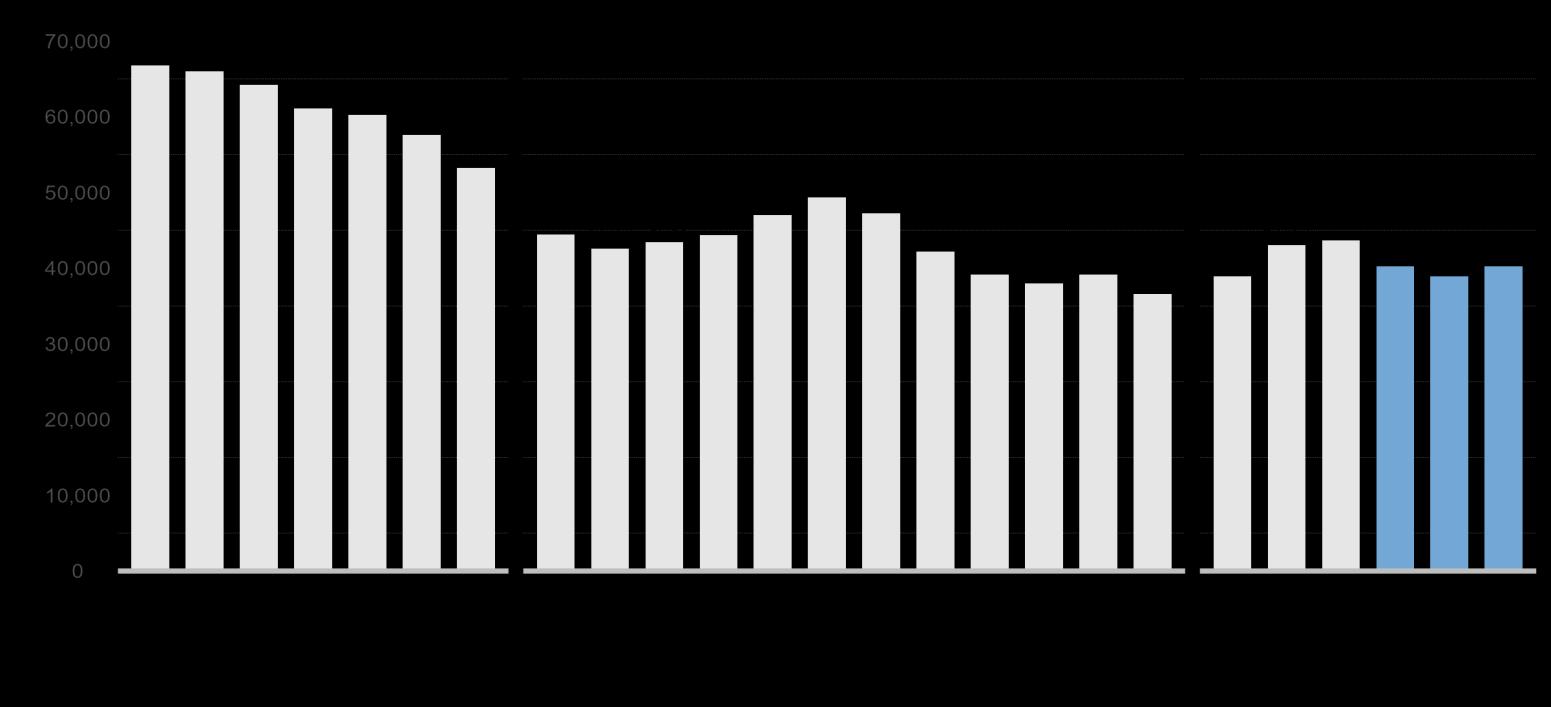
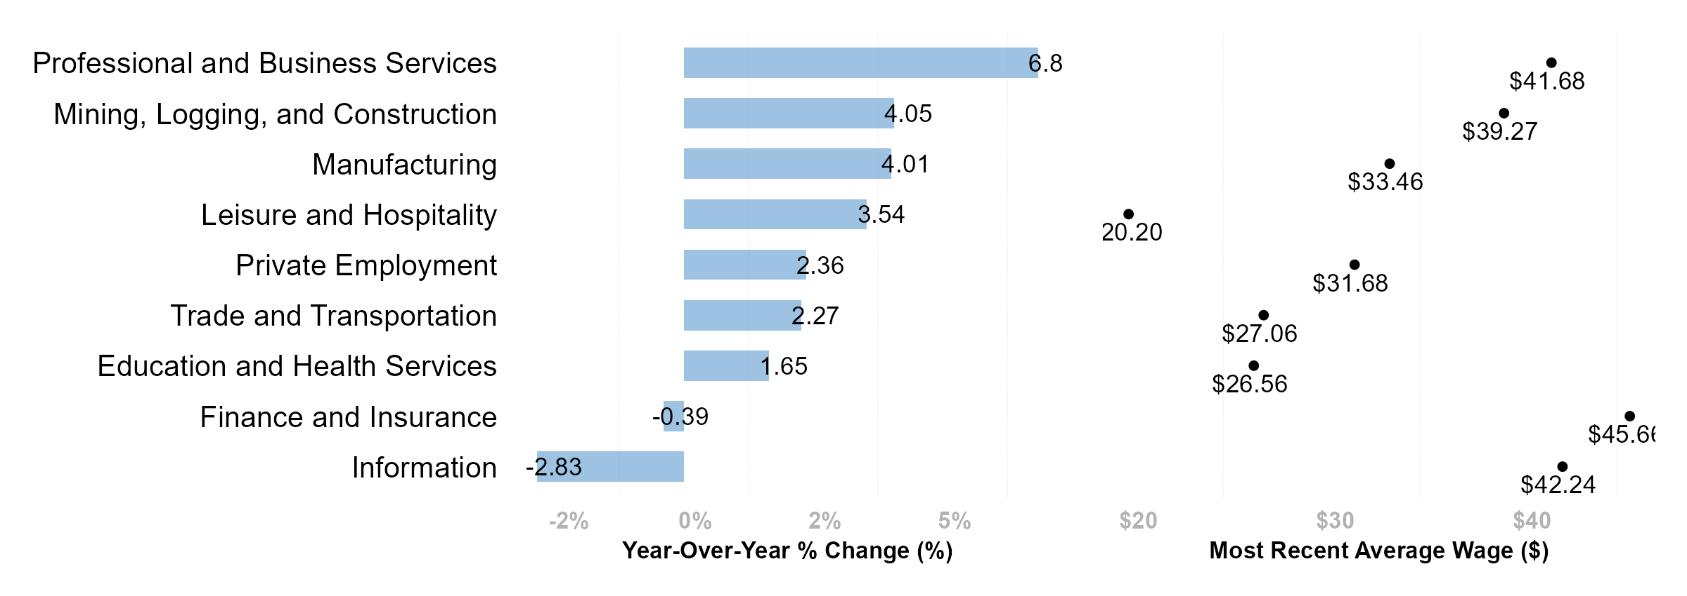
Statewide*, in June 2024, Professional and Business Services saw the highest wage growth at 6.8%, with an average wage of $42.24, followed by Mining, Logging, and Construction (4.05%, $39.27) and Manufacturing (4.01%, $33.46). Leisure and Hospitality wages grew by 3.54% to $20.20, while Private Employment and Trade and Transportation increased modestly Education and Health Services had a smaller gain of 1.65%, and wages in Finance and Insurance and Information sectors declined, with the latter facing the largest drop at 2 83%
15: PennsylvaniaYear-over-YearWage Growth, June 2024
Wage growth in Philadelphia County has been lower than state and national averages since mid-2023, with a significant dip early in 2023 before stabilizing. The Philadelphia Metro area follows a similar pattern, though with less volatility. Overall, wage growth across all regions has seen a downward trend, particularly in Philadelphia County.
16: Year-over-YearChange in AverageHourly Wages, All Private Employment
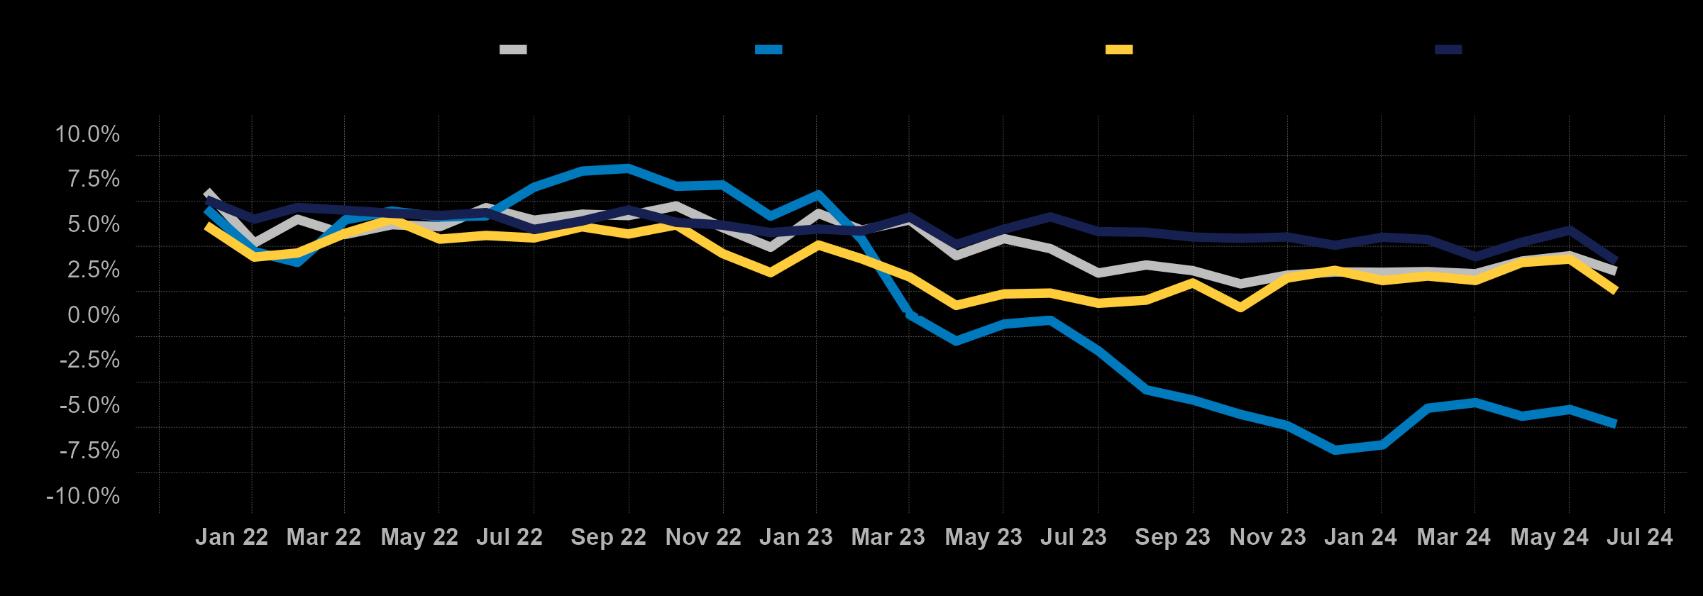
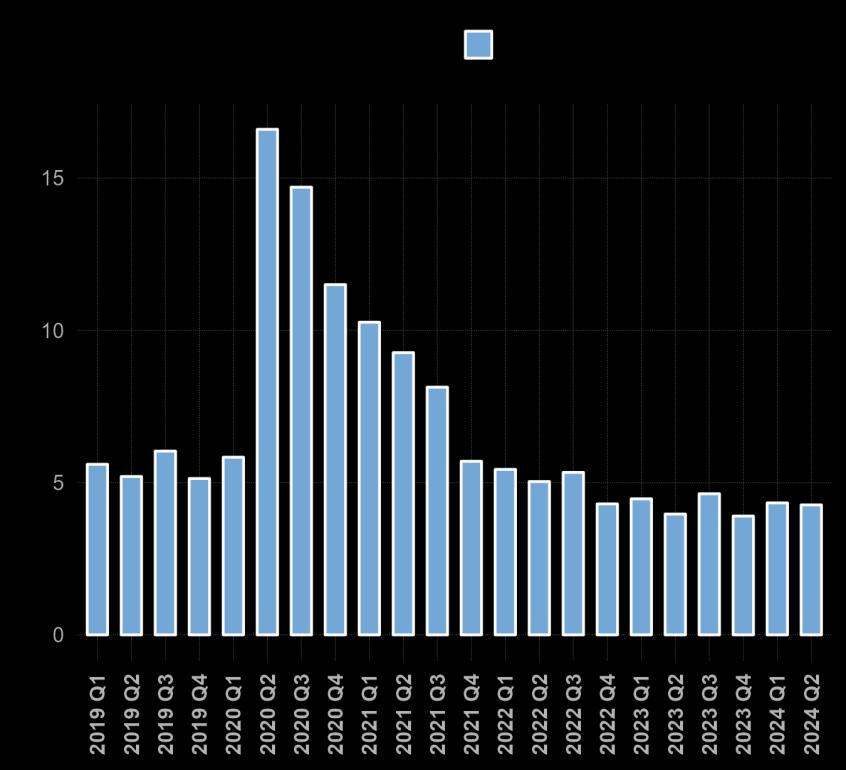
Figure 17: Bimonthly Year-Over-YearInflation Accordingto the ConsumerPrice Index, 2021 to Present
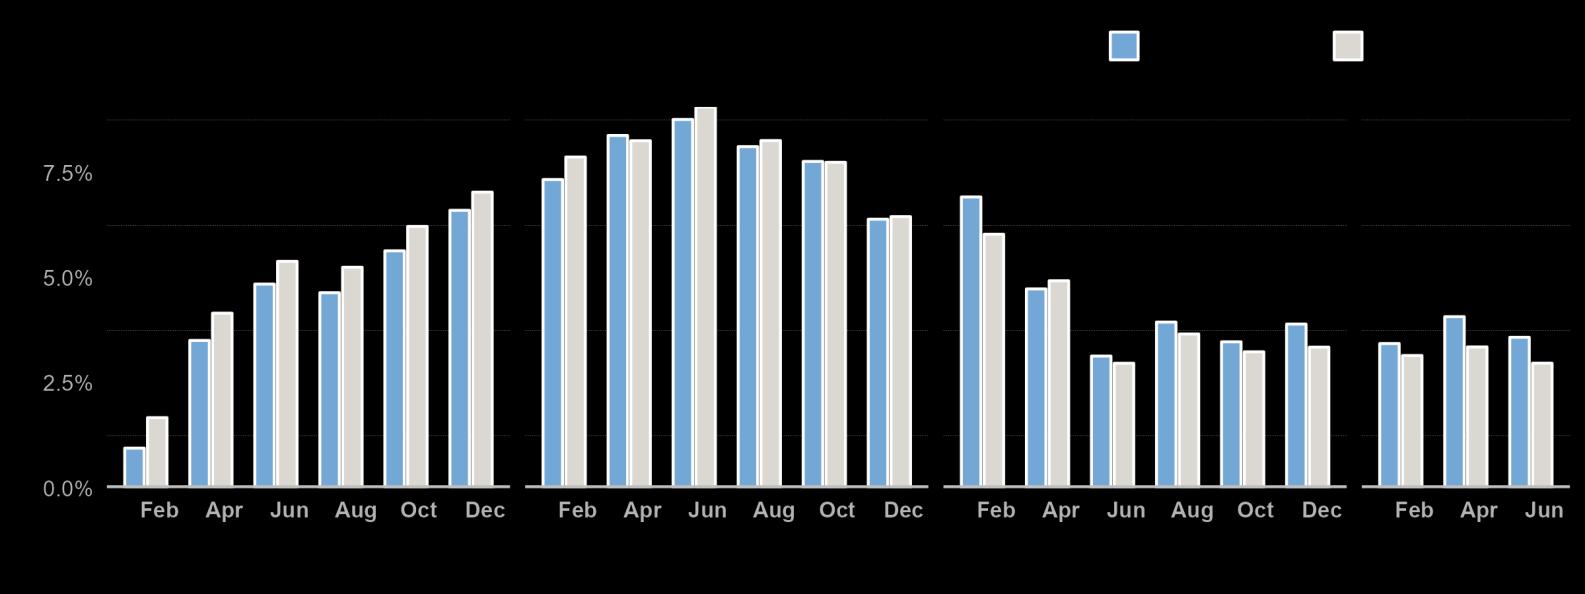
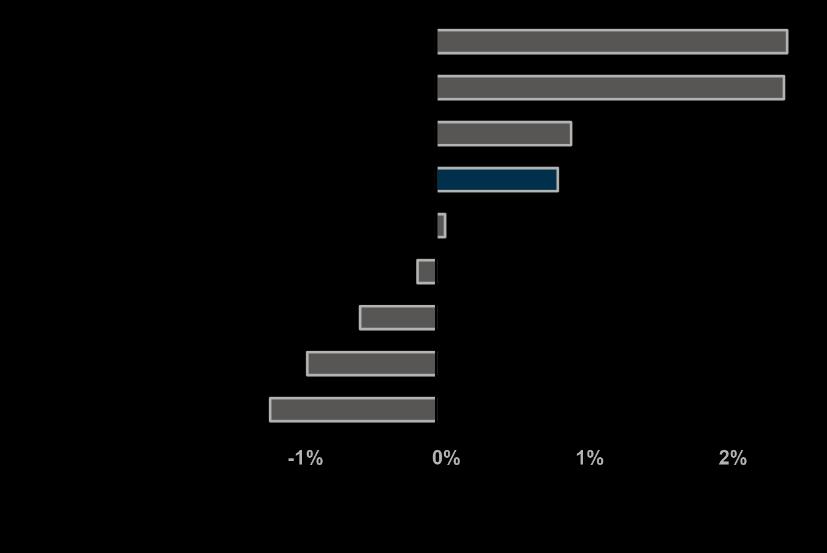
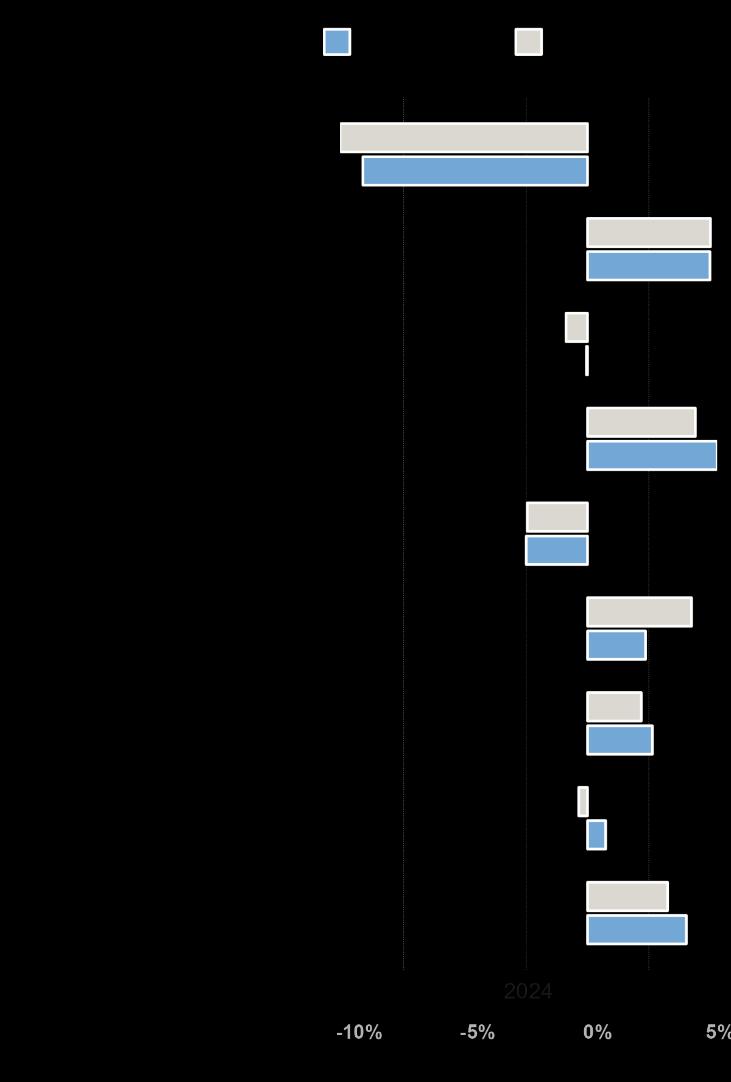
Figure 18: Bimonthly Year-Over-YearChange of InflationBucket , 2024
Like the United States, Philadelphia battled persistent inflation back in 2022. While inflation cooled down after the start of 2023, inflation as measured by the Consumer Price Index (CPI) has crept up slowly in Philadelphia to start 2024. Philadelphia's CPI measurement is below what it was in 2022 but has read higher than the national level since June 2023.
Breaking down inflation, Philadelphia has seen less severe fuel and utilities inflation compared to the United States, with stronger inflation in housing and commodities. In addition, while used cars and truck inflation has been cooler compared to the national level, inflation for new vehicles has remained high in the region at the start of 2024.

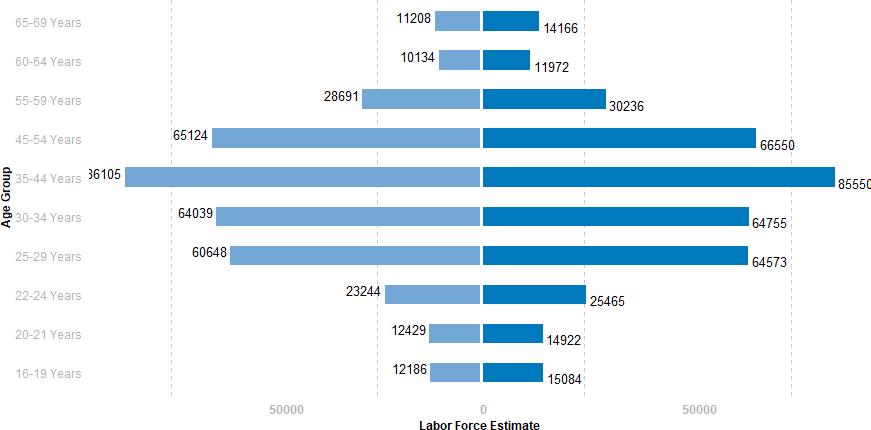
Based on Census data and ACS data, individuals between the ages of 25 and 34 make up the largest portions of Philadelphia’s population and labor force. For both men and women, labor force participation among these age cohorts is between 80% and 87%, higher than the overall rate.
Figure 19: Labor Force by Age and Binary Sex, ACS 2022
Female Male
Map 2: Labor Force Participation Rate (%) GenderGap, ACS 2022
While Philadelphia’s labor force has grown in recent years, employment outcomes vary by race, ethnicity, and educational attainment.
The gender gap is calculated as the difference between female and male Labor Force Participation Rates (LFPR). The map (Map 2) highlights the gender gap in LFPR across Philadelphia County, derived from the 2022 ACS.
Areas with darker blue shades, particularly in North and Northeast Philadelphia, indicate significant disparities where men's participation rates are much higher than women's. Central and Southern Philadelphia showing as lighter blue areas, saw a more balanced LFPR between genders.
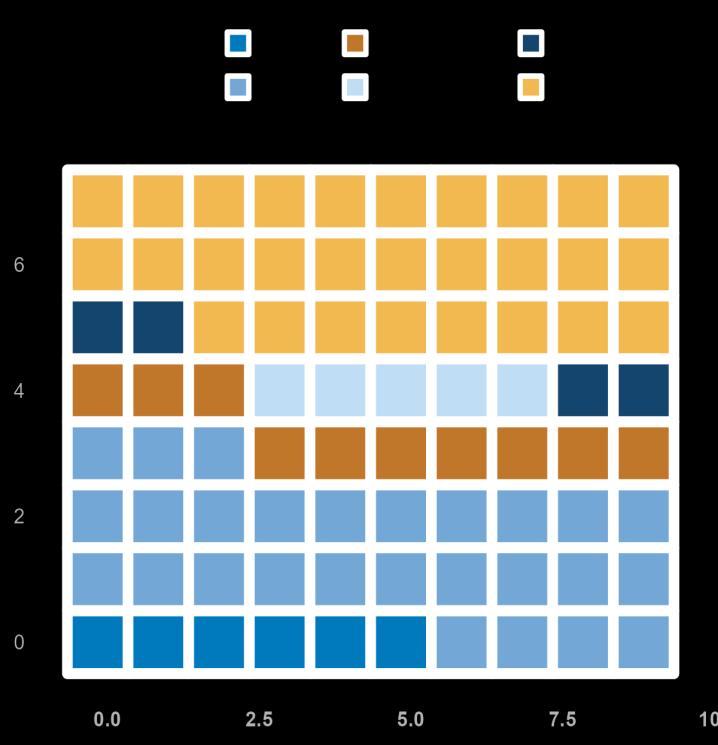
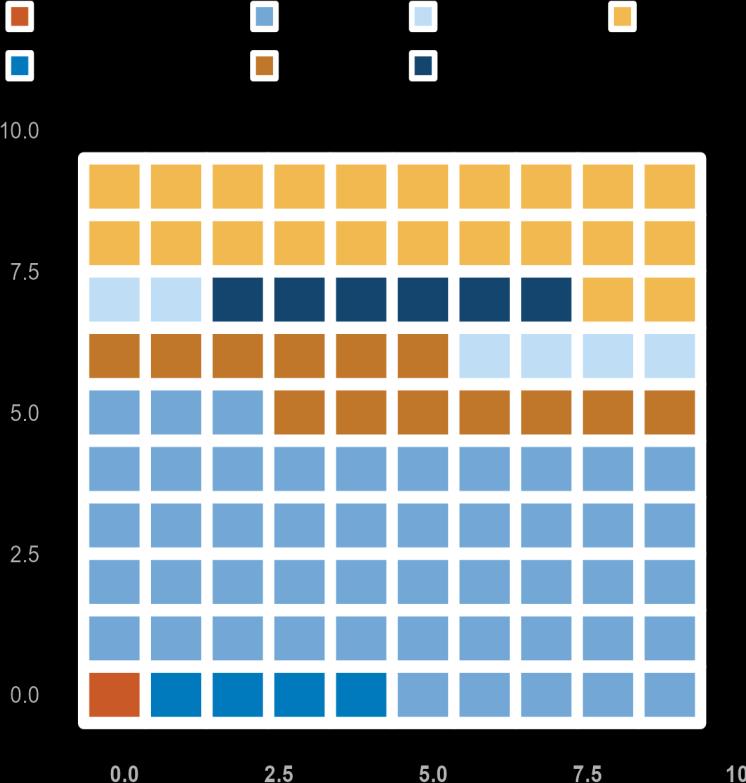
The grid charts (Figure 20 and Figure 21) provide a compelling visual representation of labor force participation and unemployment rates by race, using a 10x10 grid where each square represents 1% of the total. These charts reveal critical insights into the economic realities of different ethnic groups in Philadelphia.
The white population leads with a participation rate of 28%, followed closely by the black population at 27%. Asian and Hispanic populations have participation rates of 6% and 10%, respectively. Other racial groups, including American Indians, Pacific Islanders, and those identifying as two or more races, show lower participation rates.
The black population faces the highest unemployment rate at 48%, significantly surpassing other groups. The white population has an unemployment rate of 22%, while the Hispanic and Asian populations face rates of 13% and 4%, respectively.
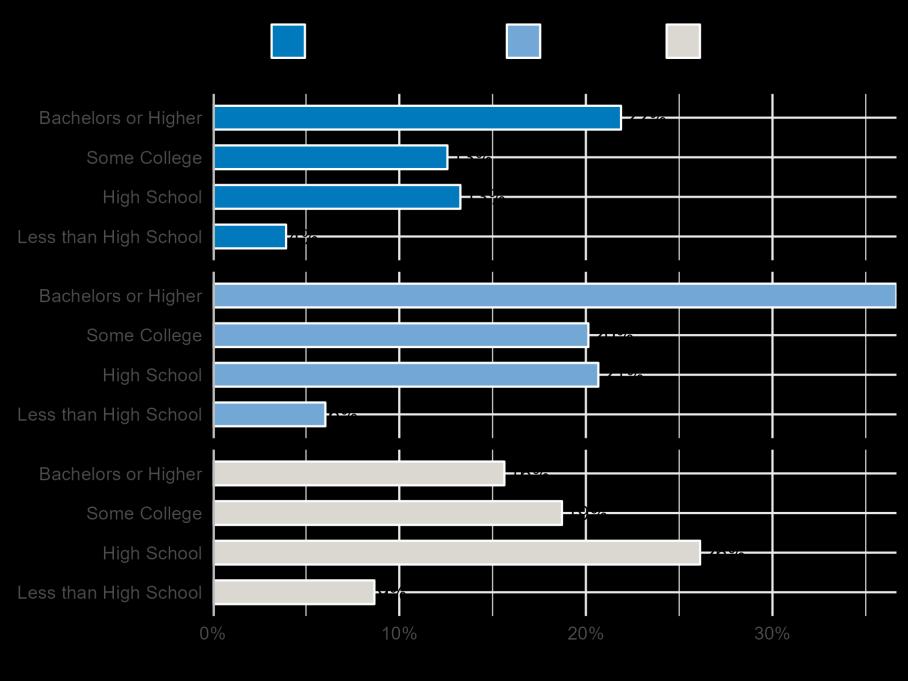
According to ACS 2022 data, in Philadelphia, individuals with a bachelor's degree or higher show the highest labor force participation and employment rates, along with the lowest unemployment rates.
Figure 22: Proportion of Employment and Labor Force Participation by Educational Attainment,ACS 2022
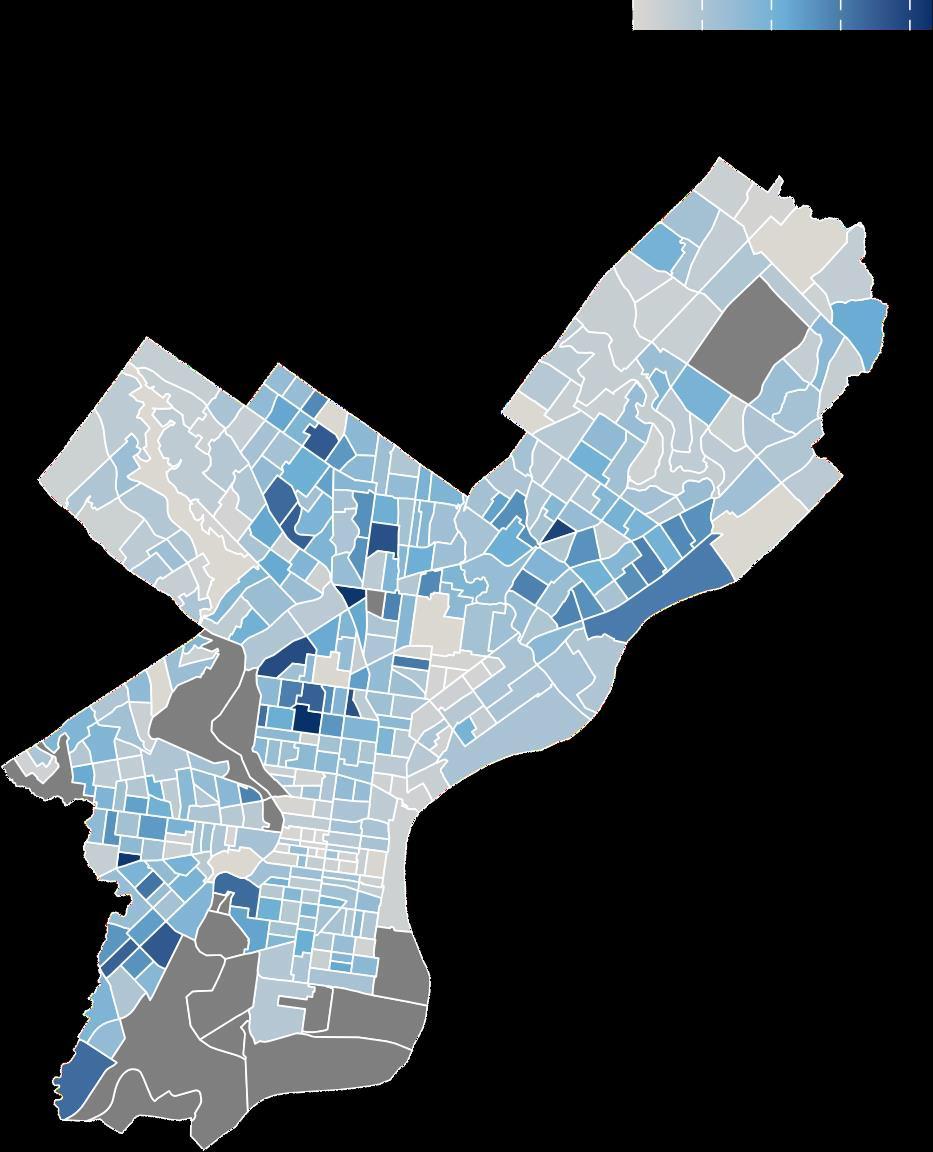
The map reveals notable geographic disparities in unemployment, with higher unemployment rates concentrated in North, Northeast, and Southwest Philadelphia. These areas have been experiencing economic challenges, suggesting a need for targeted interventions and support programs to address unemployment.
Meanwhile, the lighterareas, such as parts of Center City and Northwest Philadelphia, show lower unemployment rates and better conditions.
Conversely, those with less than a high school diploma face the most significant challenges, with the lowest participation and employment rates and the highest unemployment rates.
Map 3: Unemployment Rate (%) by Census Tract in Philadelphia, ACS 2022
Philadelphia is intrinsically connected to its suburban neighbors. Nearly half of all primary jobs in the city are held by workers who commute from outside the city limits.
Commuting patterns have greatly changed in the years since COVID-19. According to 2022 ACS 5year estimates, darker shades in Map 4 and Map 5 indicate higher concentrations of employed residents and employed workers. The dense areas are found in Center City and parts of South Philadelphia.
Map 4: Residents Densityof Employment in Philadelphia, Total All Jobs, LEHD 2021
599,926 Total All Jobs Commute Out
15%
Of Resident Workers Relied on Public Transportation in 2021 17%
Of Resident Workers Had No Access to a Vehicle in 2021
Map 5: WorkersDensity of Employment in Philadelphia, Total All Jobs, LEHD 2021
676,054 Total All Jobs Commute In

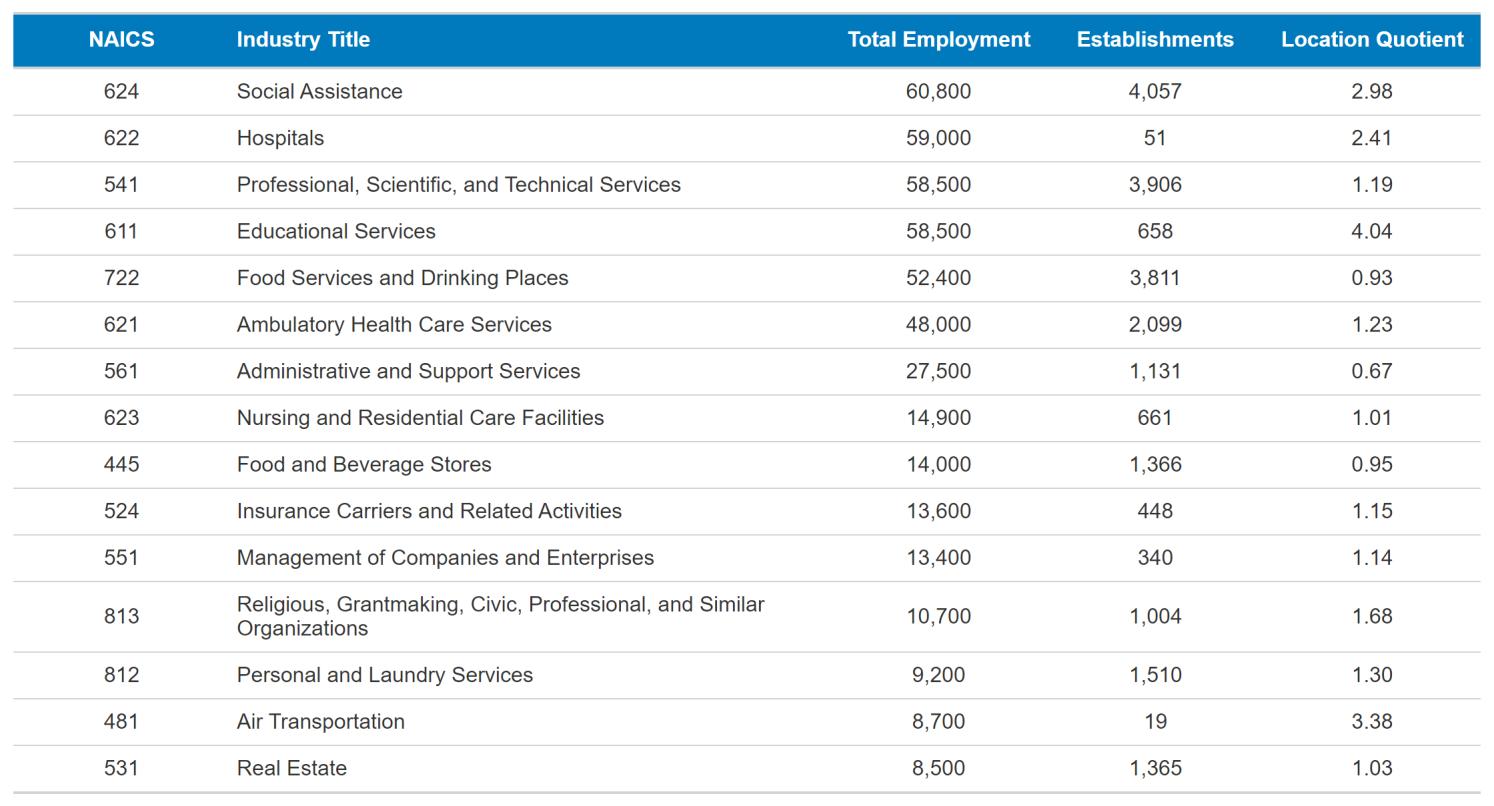
Appendix Table 1: Largest Detailed Industry Sectors in Philadelphia, Q1 2024
From the Quarterly Census of Employment and Wages, this table shows the 15 largest industry sectors by total employment. These data are released on a roughly six-month delay.
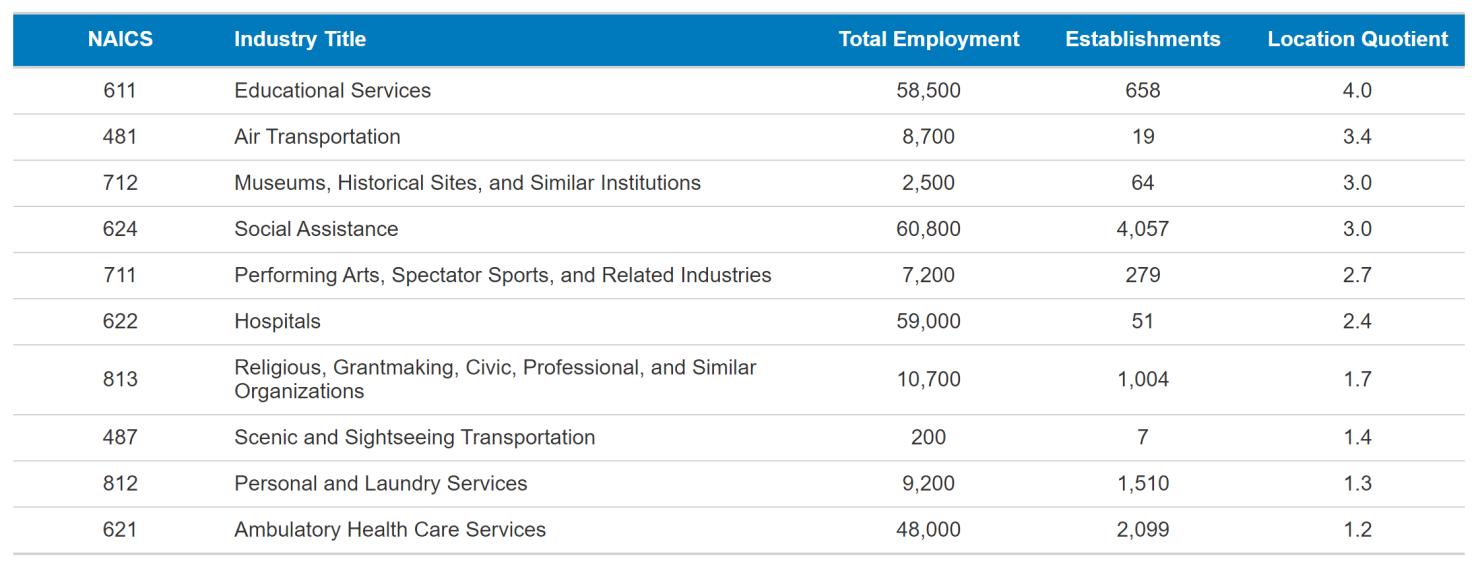
Appendix Table 2: Most Specialized Detailed Industry Sectors in Philadelphia, Q1 2024
From the Quarterly Census of Employment and Wages, this table shows the 10 most specialized industry sectors by total employment. These industries are disproportionately important to Philadelphia’s economy. These data are released on a roughly six-month delay.
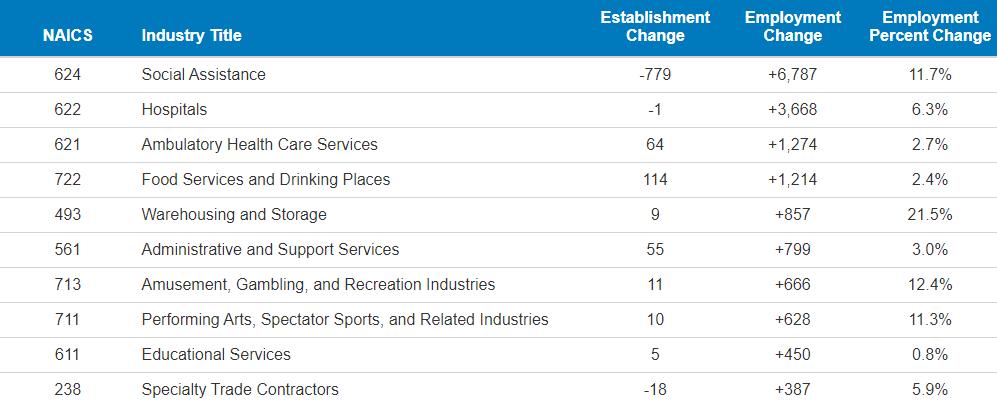
From the Quarterly Census of Employment and Wages, this table shows the 10 industry sectors with the largest annual employment growth. These data are released on a roughly six-month delay.
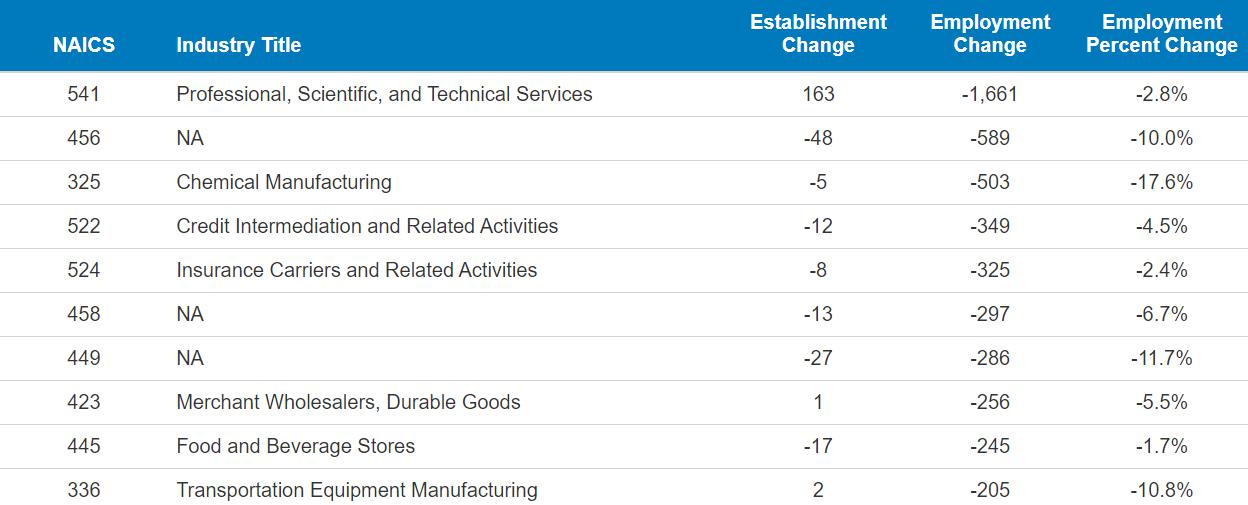
From the Quarterly Census of Employment and Wages, this table shows the 10 industry sectors with the largest annual employment declines. These data are released on a roughly six-month delay.
Health and Personal Care Retailers
Clothing, Clothing Accessories, Shoe, and Jewelry Retailers
Furniture, home furnishings, electronics, and appliance retailers
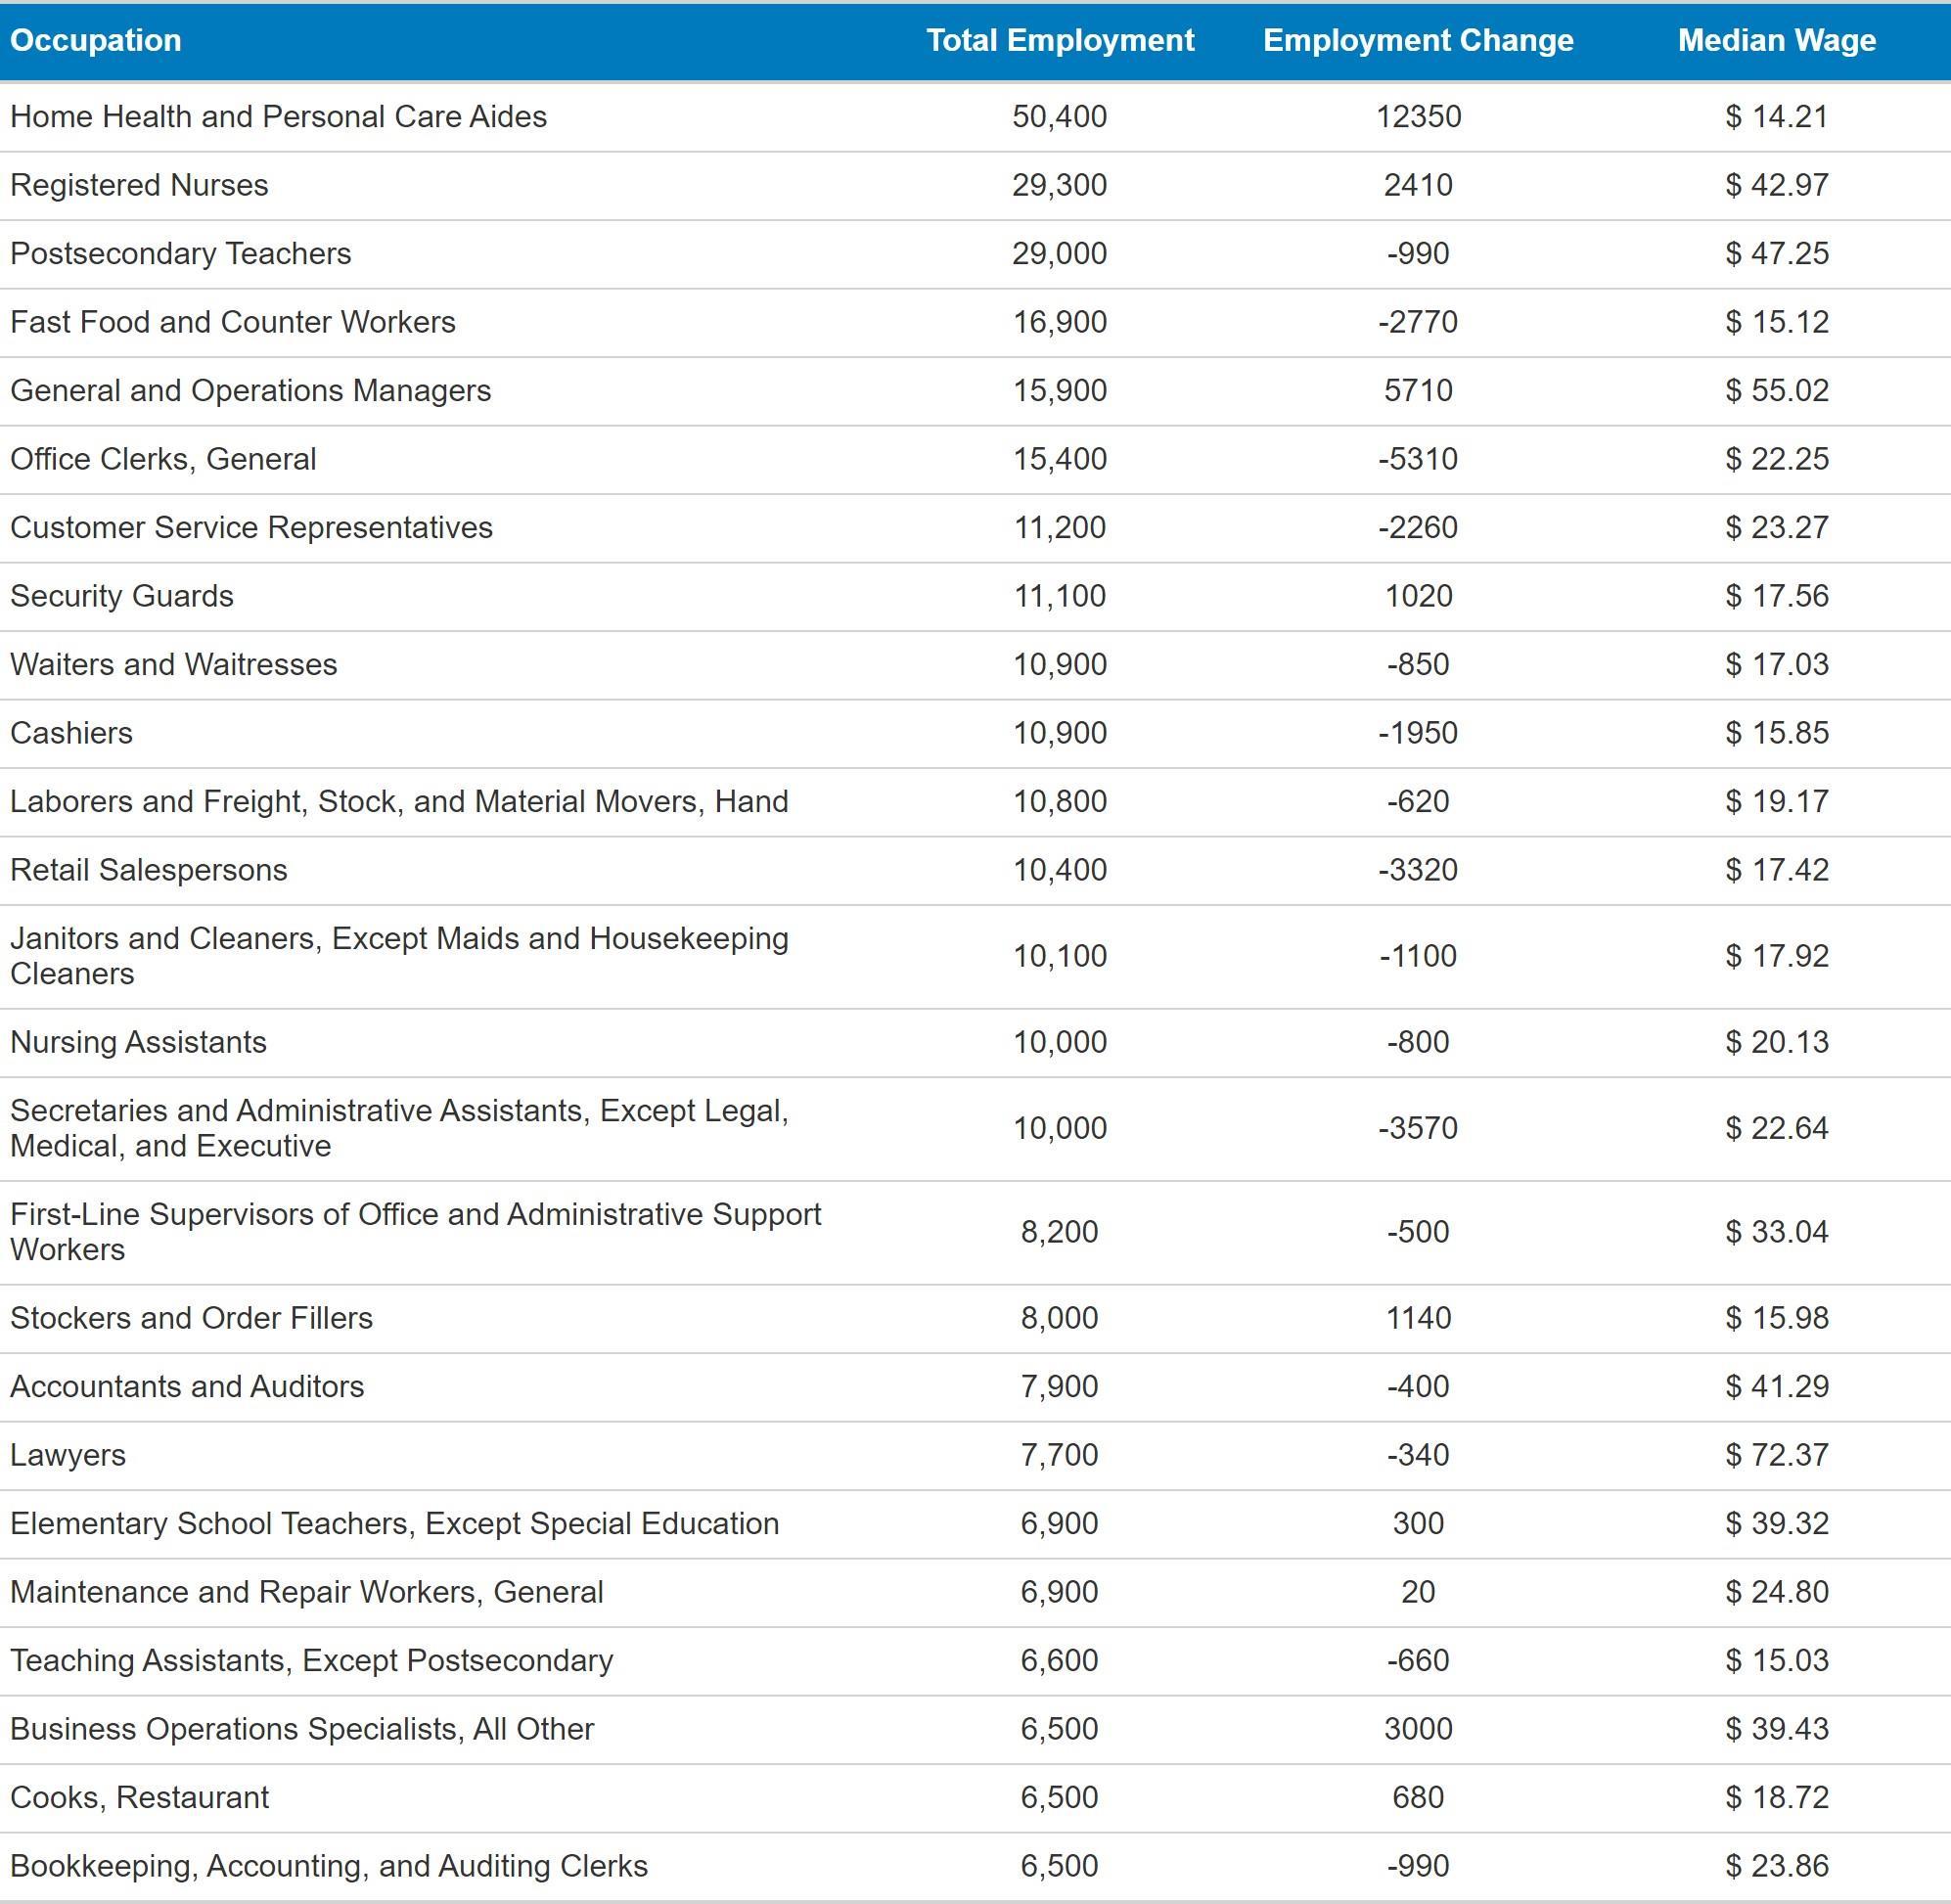
Appendix Table 5: Largest Occupations in Philadelphia with Employment Change from 2019 to 2024 Based on estimates derived from the Quarterly Census of Employment and Wages, this table shows the 25 largest occupation by total employment. These data are released on a roughly nine-month delay.