Using the latest available data, this quarterly update offers insight into Philadelphia’s labor market, industry mix, and economic development.
In 2018, Philadelphia’s institutionaland community leaders collaboratedto develop acomprehensive workforce developmentstrategy.This document, Fueling Philadelphia’s TalentEngine, calls on PhiladelphiaWorks, Inc. to serve as the city’s hub of labor marketand economic reportingand analysis. Underthis mandate, this quarterly reportprovides insight into keymeasures of economicactivity, providingleaders across public and private institutions an easy-to-access update on how Philadelphia’seconomy and laborforce continueto evolve.
For more insight into Philadelphia’s labor force, economic characteristics, and the employment dynamics, visit the Philadelphia Works website.
Overall Employment Trends
The most recent data available on Philadelphia’s economy.
Employer Demand
Exploring recent trends in employer demand through job postings and other sources.
Philadelphia’s Labor Force
Demographic, social, and economic characteristics of Philadelphia’s labor force.
Page 03 Page 11 Page 16 Page 21
Tables
Detailed employment information for important industries and occupations in Philadelphia.
Executive Summary
Philadelphia’s economy continues to navigate post-pandemic challenges and opportunities as it adapts to the "new normal."
While overall employment remains robust, with levels at or beyond preCOVID benchmarks in most industries, economic uncertainties such as inflation, rising interest rates, and labor shortages persist. Here are the key highlights for Q1 2024:
• The unemployment rate in Philadelphia stood at 4.2% in March 2024, a slight increase from the previous year. Despite this, the number of unemployed individuals has risen by 2,866, totaling 32,196. Over Q1 2024, the unemployment rate has shown stability with minor fluctuations.
• The total labor force in Philadelphia reached 763,736 individuals, with an annual increase of 21,911. Total employment also grew to 732,540, reflecting an annual increase of 20,102. However, the labor force saw a modest upward trend into the new year following the previous quarter.
“Continued economic growth is critical to the future of our city and region, and is dependent upon a strong, skilled workforce.”
Fueling Philadelphia’s Talent Engine
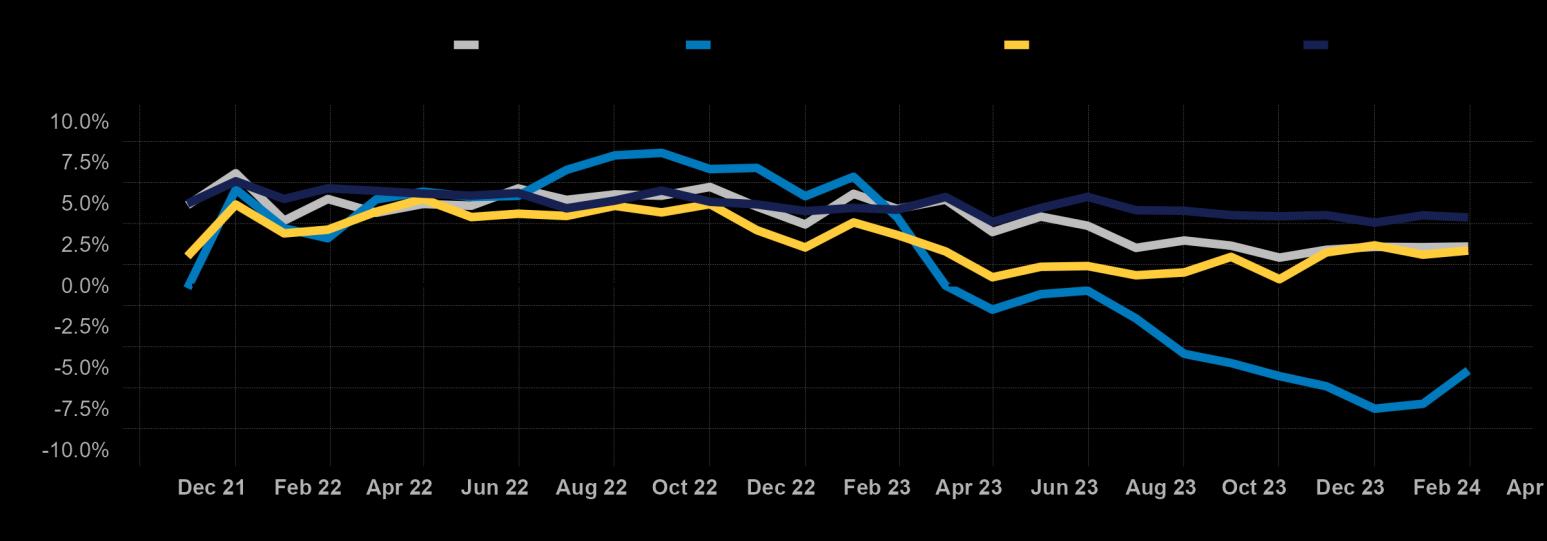
• The Consumer Price Index (CPI) -- a measure of inflation -- has shown a gradual increase in early 2024, although it remains below 2022 levels. Philadelphia’s CPI has been higher than the national average since June 2023. Wage growth in the private sector has decelerated, influenced by the Federal Reserve’s policies to curb inflation. Wage growth, which peaked in early 2022, saw a decline through 2023, reaching its lowest point in February 2024.
• Geographic disparities in unemployment are notable, with higher unemployment rates concentrated in North, Northeast, and Southwest Philadelphia, indicating areas in need of targeted interventions and support programs. Individuals aged 25 to 34 saw the highest labor force participation rates, with significant engagement from both men and women in this cohort. Higher educational attainment correlates with higher participation and employment rates and lower unemployment rates.
Past and
Overall Employment Trends
Employment in Philadelphia
March 2024
Estimated Total Labor Force
764,736
+21,911 year-over-year
Estimated Total Employment
732,540
+20,102 year-over-year
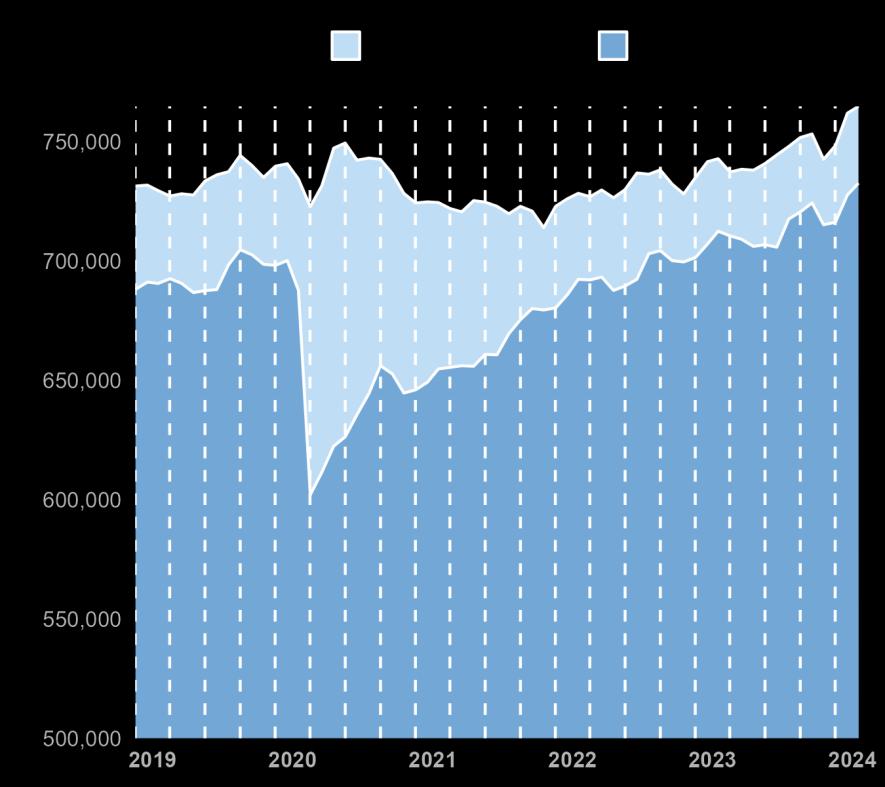
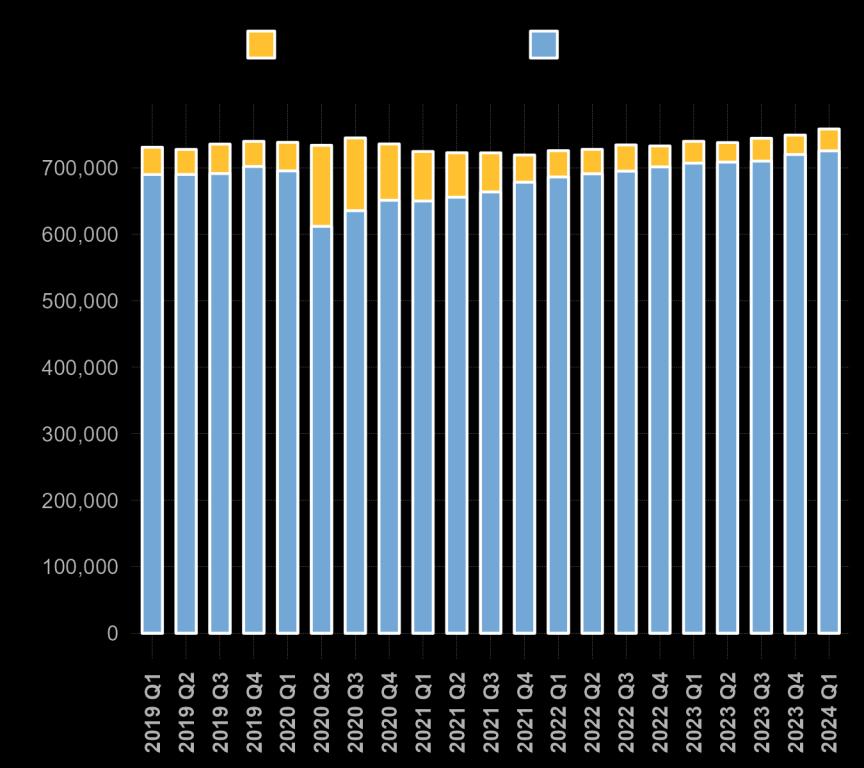
Philadelphia's labor market showed remarkable growth. The total labor force expanded to its highest level in Q1 2024, estimated at 764,736 individuals, with a year-over-year increase of 21,911. Mirroring this trend, total employment also rose to 732,540, with a notable annual growth of 20,102.
In recent months, Philadelphia County has experienced significant gains in both the size of its labor force and the number of employed residents. Since January 2019, employment has shown a consistent upward trend at both the county and national levels.
Figure 1:
Labor Force and Total EmploymentTrend inPhiladelphia: January 2019 to March 2024
Figure 2
Total Employment Relative to January 2019 by Geography
Unemployment in Philadelphia
March 2024
__________ Estimated Unemployment Rate
4.2%
+0.1 points year-over-year
__________ Estimated Unemployment
32,196
+2,866 year-over-year
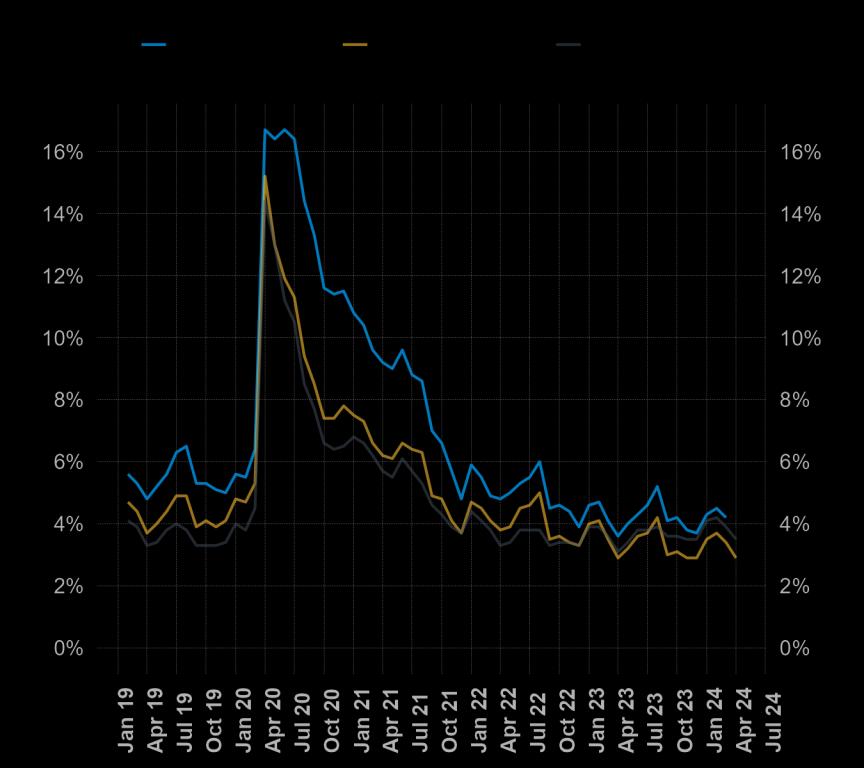
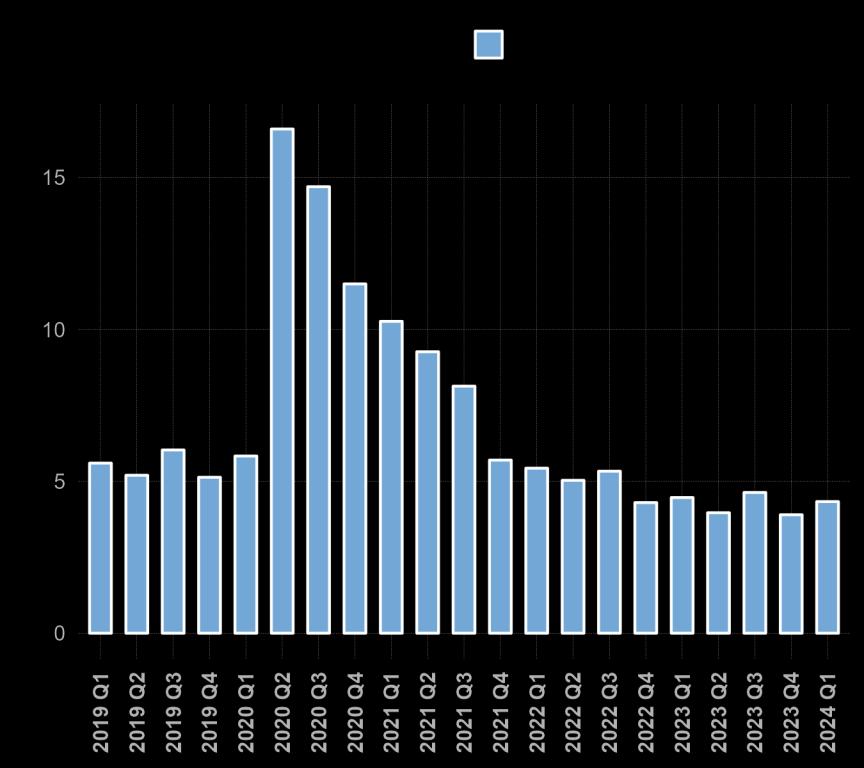
Philadelphia's unemployment rate in March 2024 stands at 4.2%, a slight increase of 0.1 percentage points compared to the previous year. The total number of unemployed individuals has risen by 2,866 over the same period, reaching 32,196. By the end of 2023 and into early 2024, the unemployment rate has stabilized at lower levels, although slight fluctuations are evident.
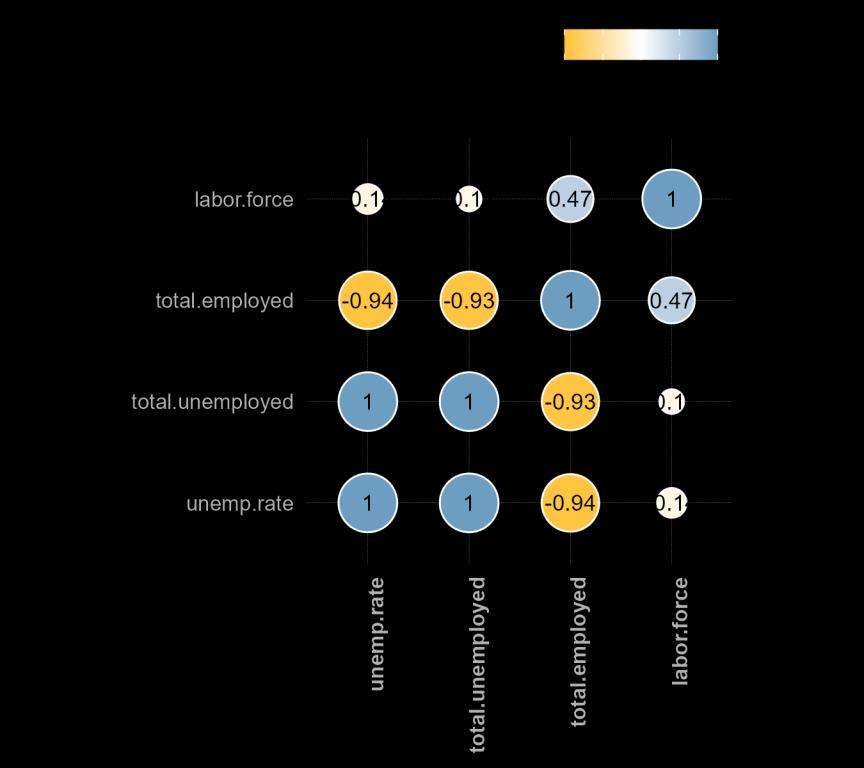
The correlation matrix (Figure 4) underscores the intricate connections between the labor force, employment, and unemployment. It shows a strong positive relationship (0.47) between the labor force size and total employment, and a strong negative correlation (-0.94) between total employment and the unemployment rate. This means that as employment rises, the unemployment rate typically falls.
4: CorrelationMatrix of Four Features Since January 2019
Figure
Figure 3: UnemploymentRate Since January 2019 in Philadelphia
Quarterly Comparison
Philadelphia's labor market demonstrated strong resilience and growth. In Q1 2024, the labor force exhibited significant dynamism, reaching a new highest level in March 2024.
Since Q2 2022, employment has maintained consistent and positive growth alongside solid labor force expansion.
Following the previous quarter (Q4 2023), the labor force in Q1 2024 continued a modest upward trend into the new year. Additionally, the average unemployment rate in Q1 2024 held steady at around 4%, consistent with Q1 2023 but relatively higher than Q4 2023. Since Q1 2023, the unemployment rate has fluctuated in a seasonal pattern due to seasonal events.
Figure 5: Labor Force and EmploymentSince January 2019 in Philadelphia
Figure 6: UnemploymentRate Since January 2019 in Philadelphia
New Normal: PhiladelphiaRegion
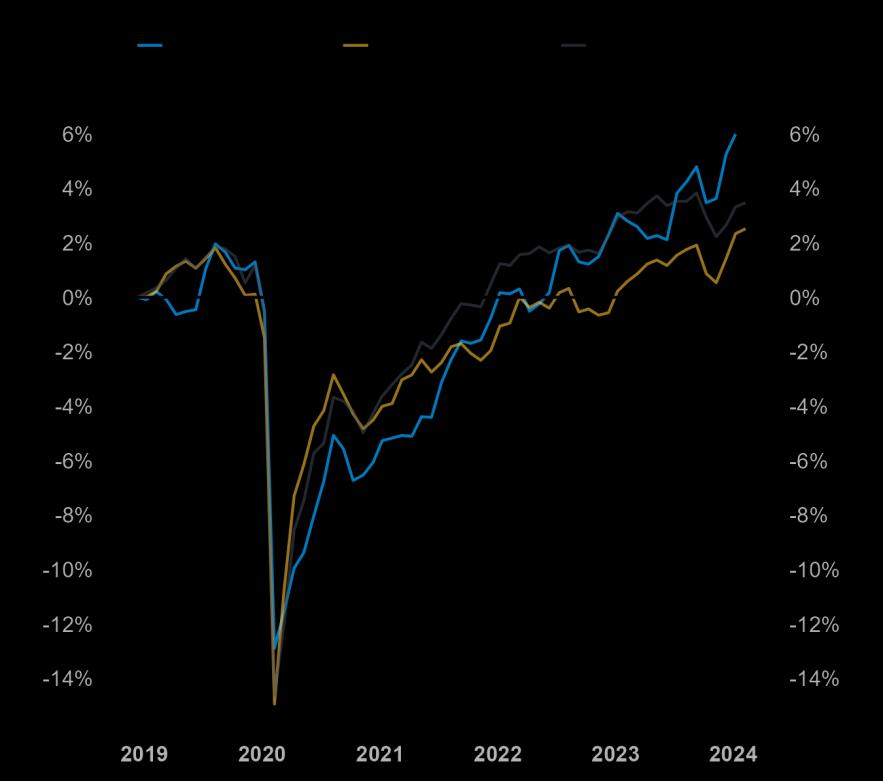
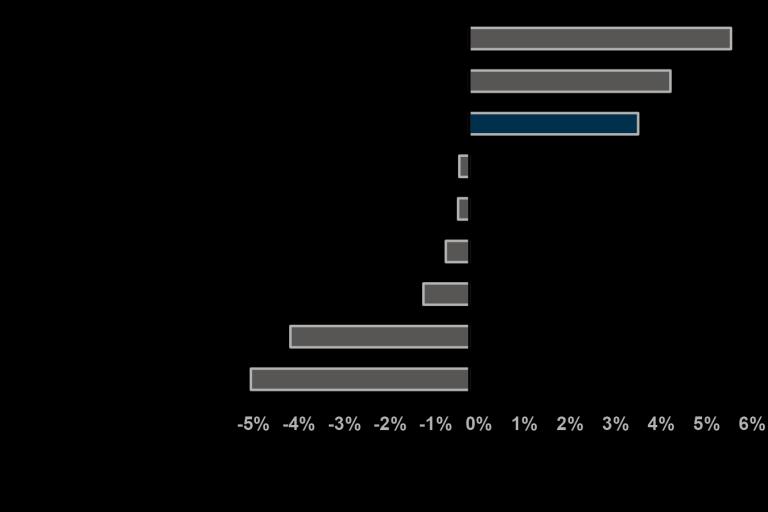
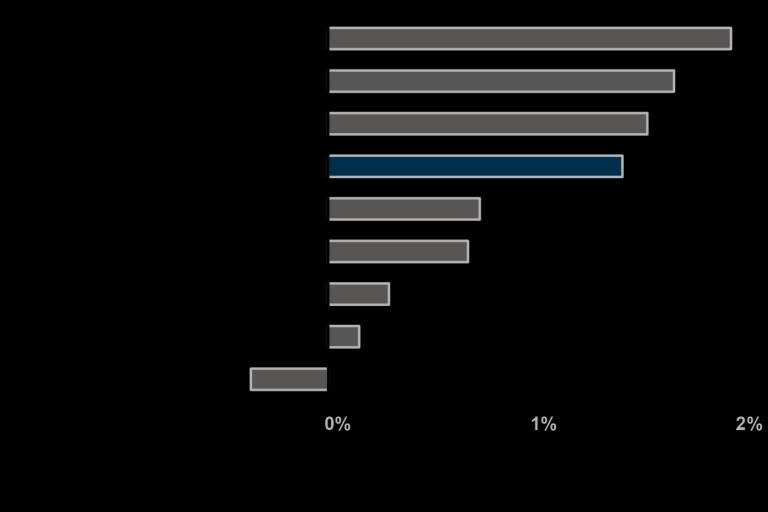
Relative to other large cities, Philadelphia’s regional economy has proven to be resilient. Philadelphia is one of the top four metro areas to have maintained positive job growth both in the last year and since pre-pandemic levels.
Figure 7: EmploymentChange Relative to Pre-Pandemic Employment, February2020 to March 2024
Figure 8: Relative EmploymentChange Year-Over-Year, March 2024
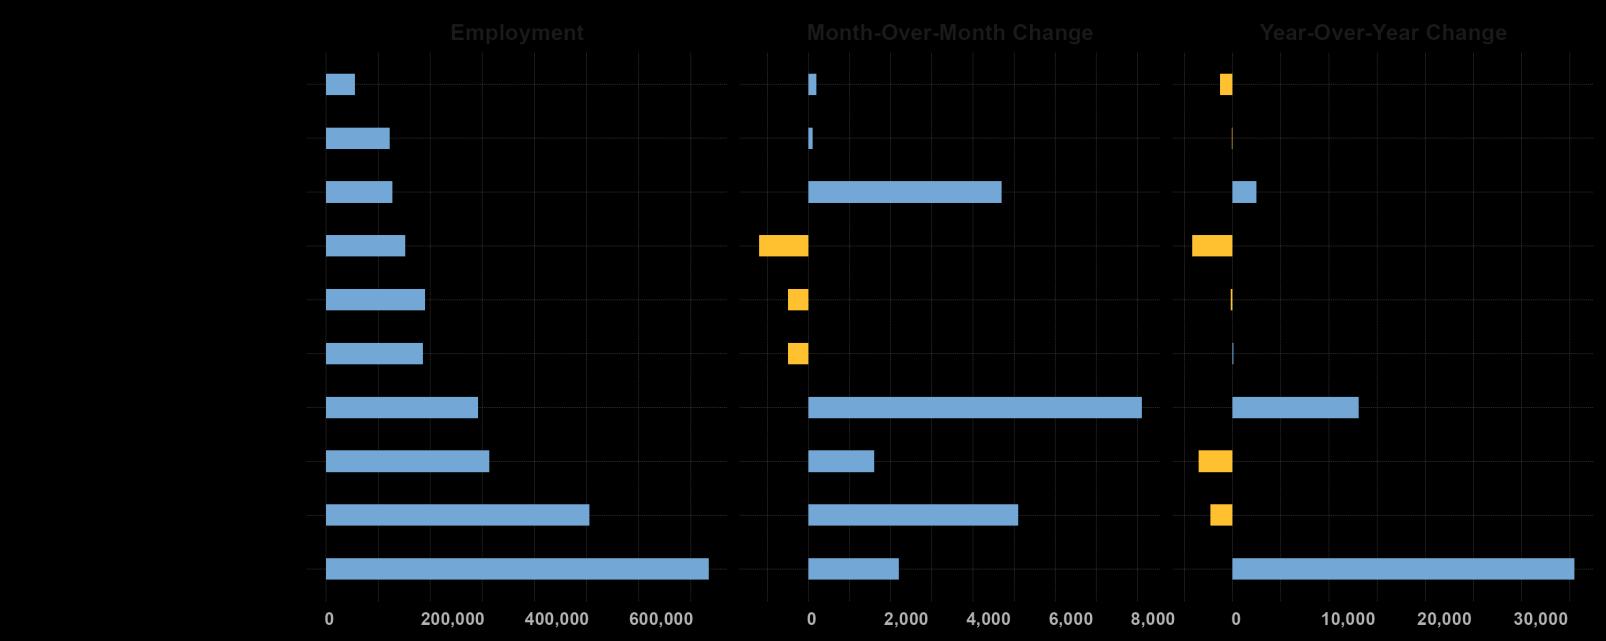
The snapshot of Philadelphia MSA employment highlights Education and Health Services as the major industry, with a significant employment base and annual growth. Leisure and Hospitality, in particular, increased significantly in Q1 2024 with consistent annual growth.
9: Regional Employmentby IndustrySector in PhiladelphiaMSA, March 2024
Figure
Industry Geospatial Concentration
In addition to looking at industry development from a temporal perspective, a spatial perspective provides another distinct highlight. The American Community Survey (ACS) has been collecting data about the social, economic, demographic, and housing characteristics of the U.S. population with geographic information. We are analyzing 2022 ACS data and geodata to provide communities with current information for policy decision-making and further solutions.
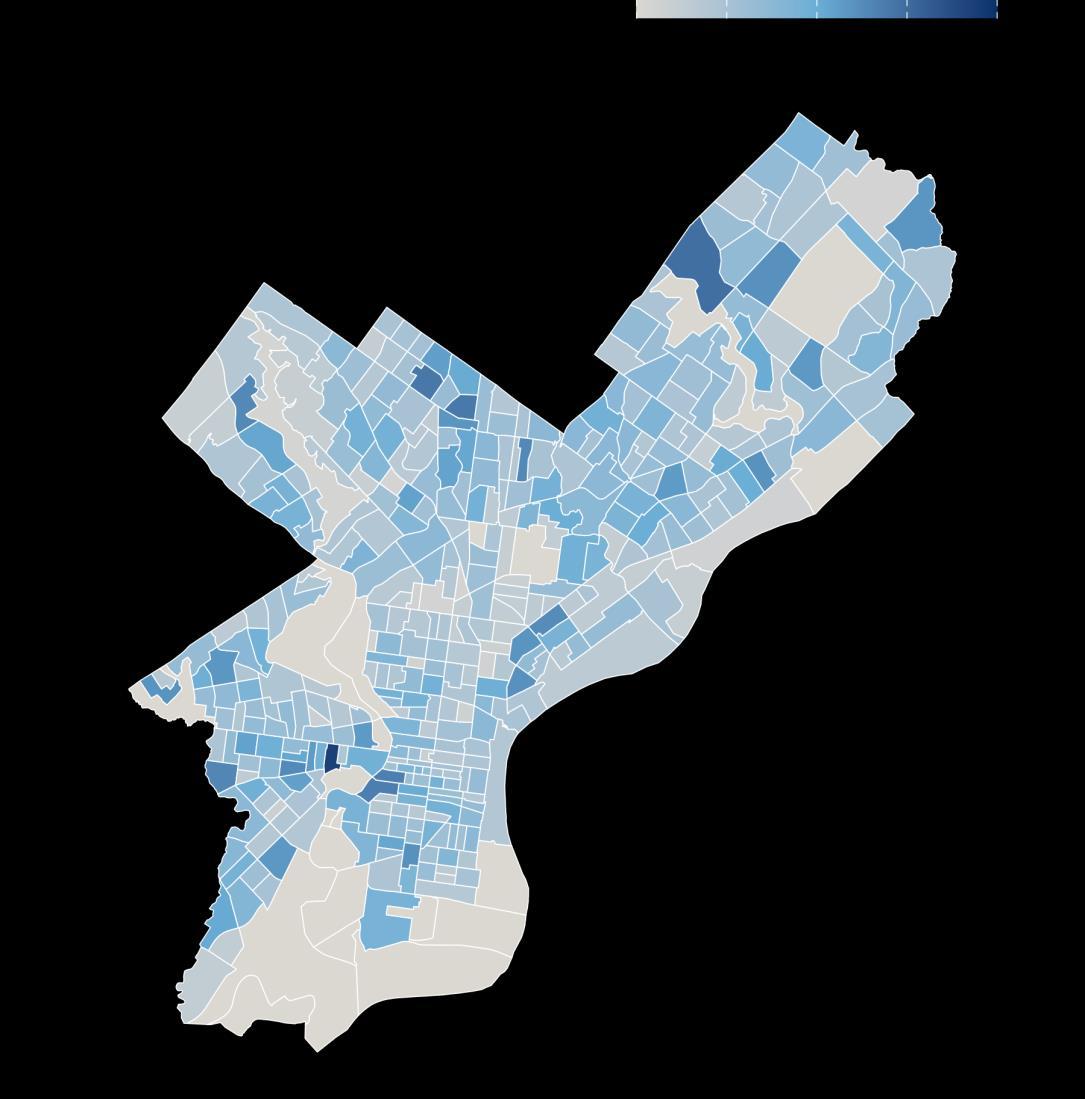
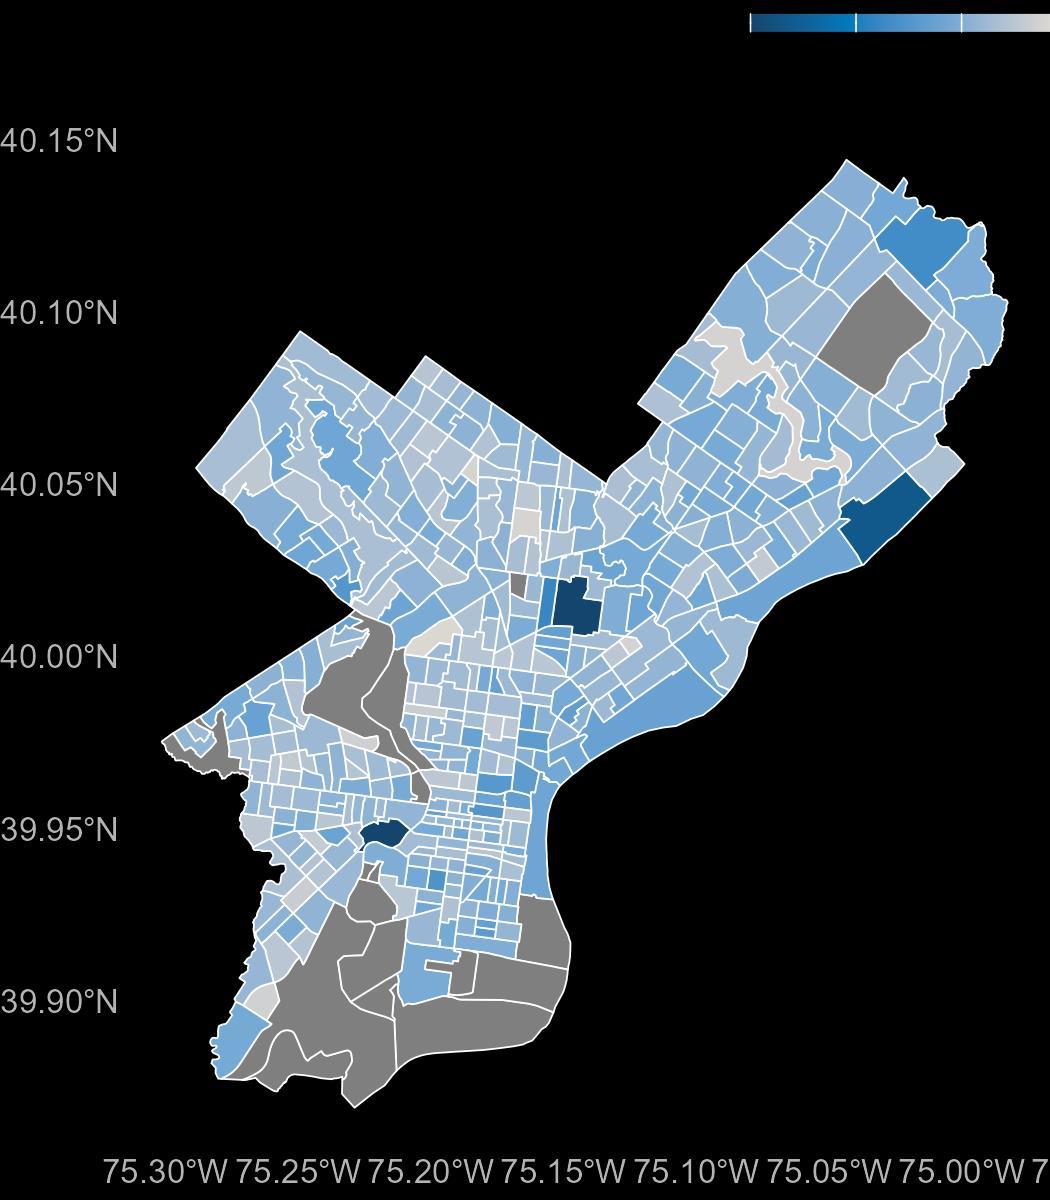
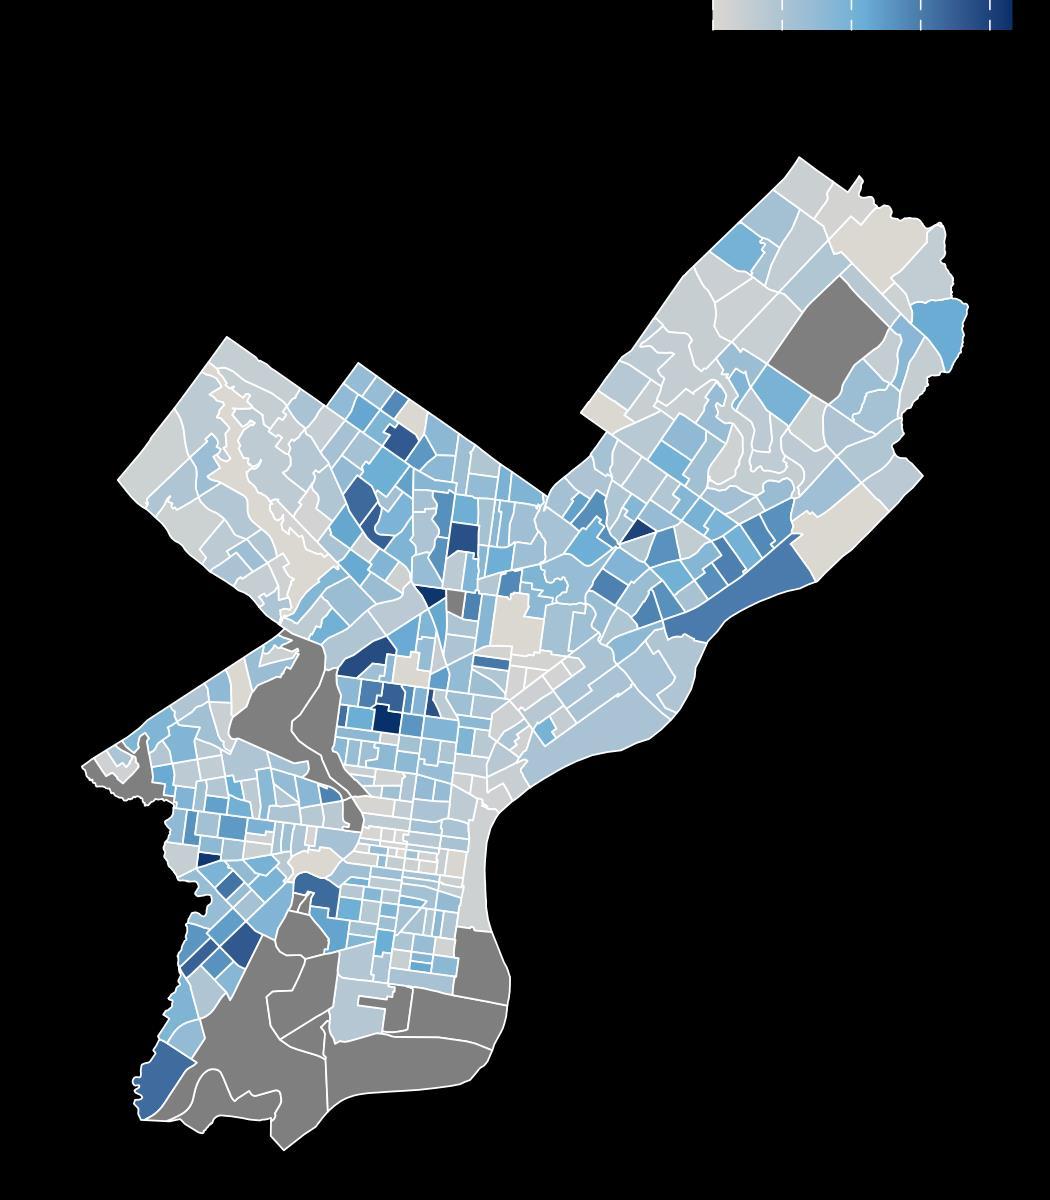
The regional economy in Philadelphia County is primarily driven by the Education and Health Services sector, which has shown predominant demand and growth in general. The map (Map 1) illustrates the geospatial distribution of sector development and growth at the census tract level in Philadelphia County.
Dark blue areas represent the highest concentration of employment in Education and Health Services, mainly in the west, center, and north of Philadelphia, near major health care centers and institutions. It also indicates a high density of employed individuals in those areas. Lighter blue areas have relatively fewer facilities for Education and Health Services, while the grey areas indicate no related clustered Education and Health Services.
Map 1: Education and Health Services
Employed Individuals Distribution, ACS2022
Education and Wage
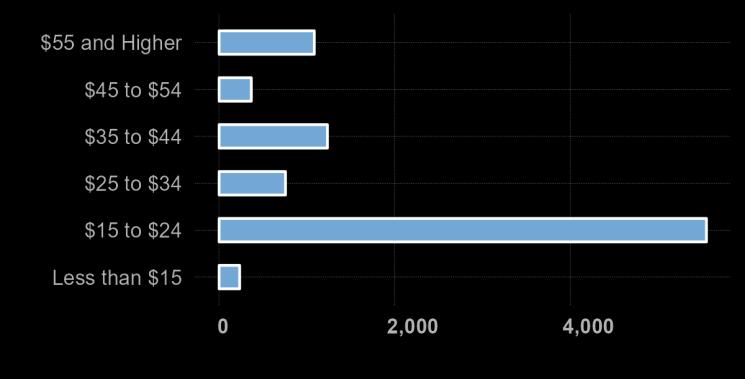
In Philadelphia, from 2023 to 2024, employment in the $15 to $24 hourly wage range saw the most significant change (Figure 10), indicating an expansion in mid-wage jobs. Employment changes in low and high-wage occupations were relatively smaller. Employment in middle-income jobs ($25 to $34 and $35 to $44 wage ranges) grew steadily during this period.
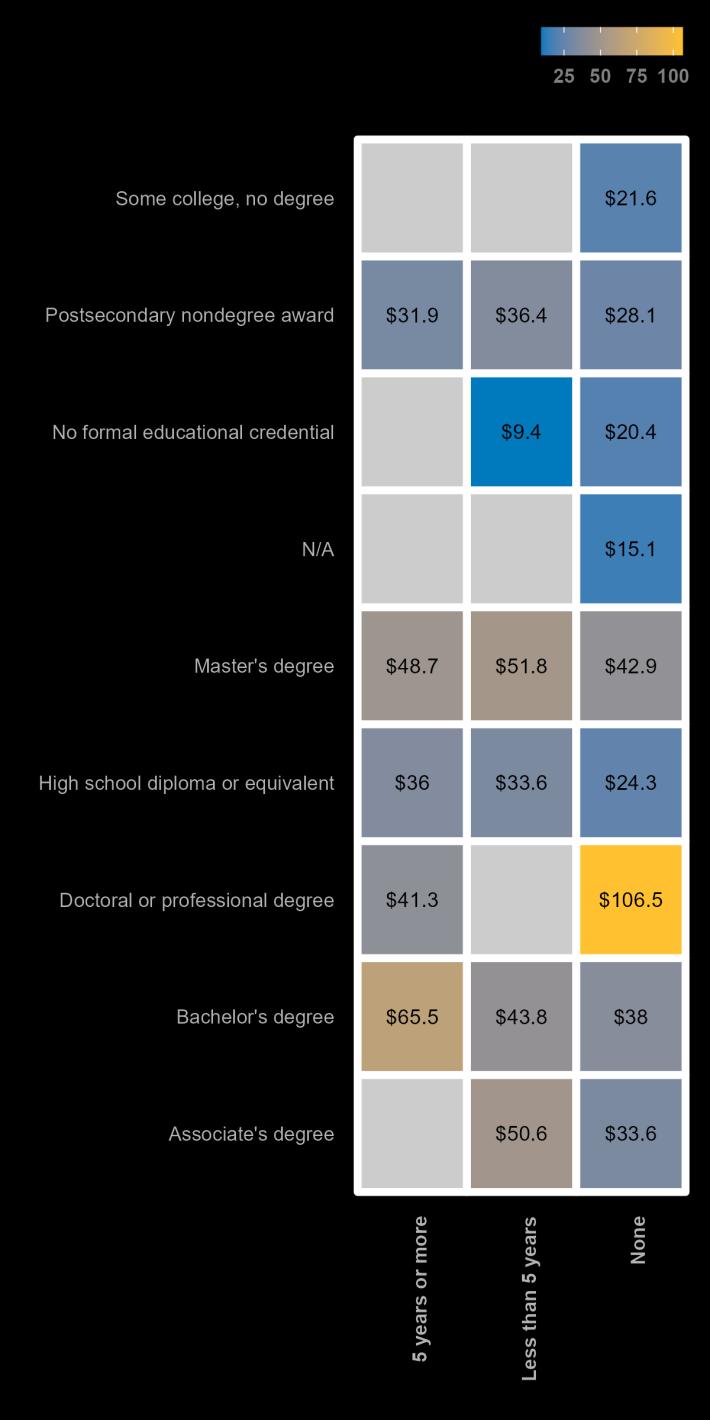
As the heatmap (Figure 11) shows, individuals with doctoral or professional degrees and extensive work experience earn the highest wages. Master's degree holders can earn up to $51.8 per hour with less than five years of experience. Bachelor's degrees also provide strong earnings, with individuals earning up to $65.5 per hour with more than five years of experience. Lower educational levels result in significantly lower earnings, with high school diploma holders earning up to $36 per hour even with over five years of experience.
Figure 10: Relation BetweenEducationLevel, Median Hourly Earnings and Work Experience, 2023 to 2024
Figure 11: Relation BetweenEducationLevel, MedianHourly Earnings and Work Experience, 2023 to 2024
Recent Unemployment Claims
UC Claims highlight significant job loss in key sectors. Home Health Aides lead with 861 claims. Other heavily impacted occupations include Security Guards (279 claims), Customer Service Representatives (240 claims), and Laborers & Freight Movers (231 claims).
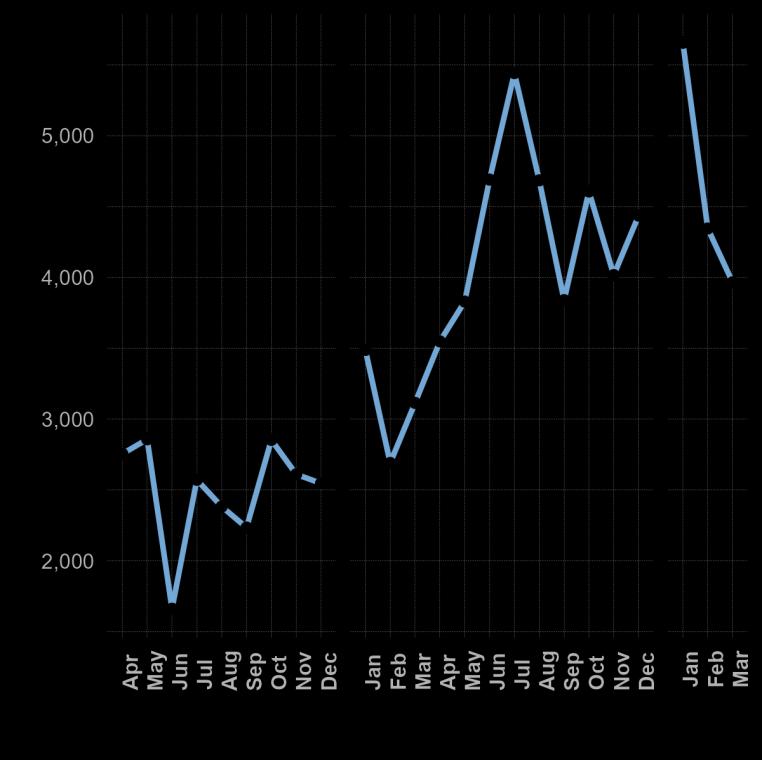
In the past two years, the highest number of initial unemployment claims was recorded in January 2024, with 5,657 claims, followed by 5,443 claims in July 2023.
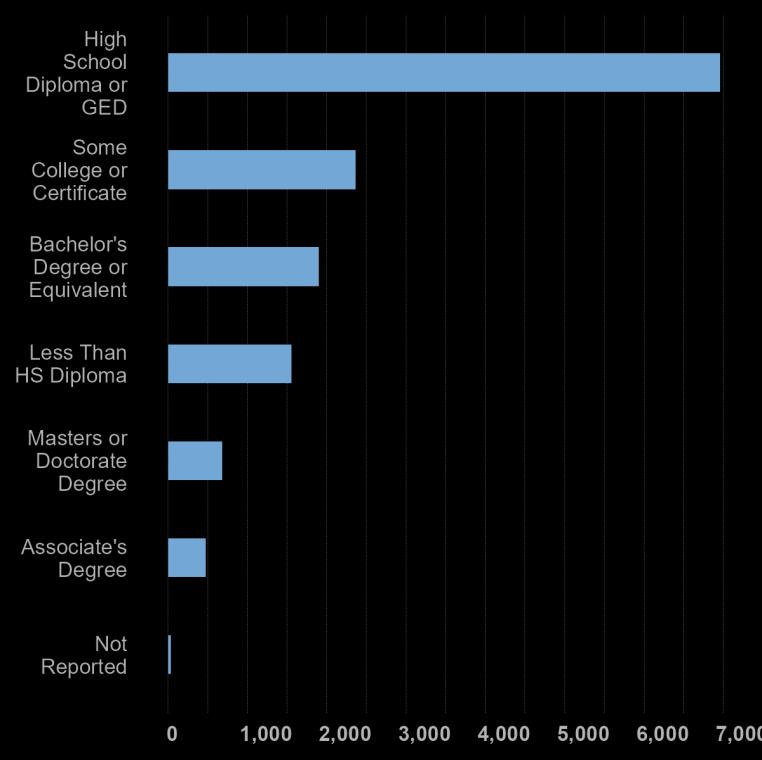
Overall, in Q1 2024, the monthly claims showed a downtick. The majority of unemployment claimants from January to March 2024 had a high school diploma or GED, accounting for 6,957 claims. Significant numbers were also seen among those with some college education or certificates (2,365 claims) during the Q1 2024.
Figure 13: ReportedEducational Attainment of PhiladelphiaClaimants, Januaryto March 2024
Figure 12: MonthlyInitial UnemploymentClaims by PhiladelphiaResidents, Previous 24Months
Employer Demand: Overall Trends
Philadelphia employers have shown recovering demand for labor over the last two years. However, this quarter saw a decline in job postings, following national trends of dampened demand.
Lightcast scrapes local job postings to provide data on employer demand based on occupation, industry, and a variety of other details.
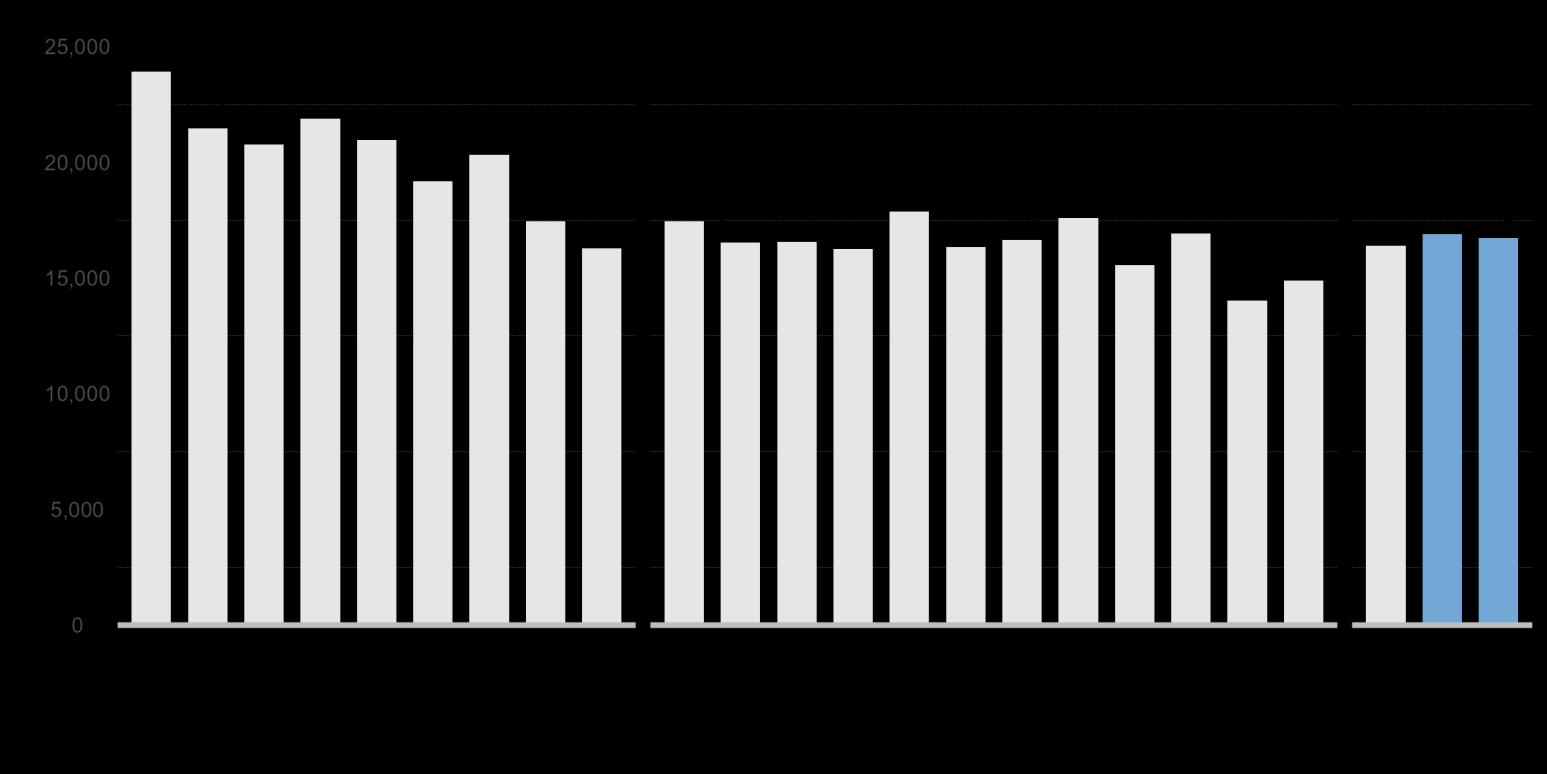
According to the latest estimates, in Q1 2024, Philadelphia County recorded 33,640 unique job postings, a decrease of 15,187 postings from the previous quarter. This notable drop indicates a potential cooling in the local job market, which could be attributed to seasonal fluctuations or broader economic factors.
14:
2024 __________ Unique Job Postings
33,640
Change in Total Postings Over Previous Quarter
-15,187
Figure
Monthly Job Postings in PhiladelphiaCounty, Previous 18 Months
In Q1 2024, job postings reflected strong recruitment needs in the education, healthcare, and technology sectors in Philadelphia County.
The University of Pennsylvania led job postings with 14,966 openings, followed by Comcast with 6,401.
Project Management and Nursing were the most sought-after skills, with 4,230 and 4,080 postings, respectively. Marketing, Data Analysis, and Auditing also saw high demand.
Valid Driver's Licenses and Registered Nurse (RN) certifications topped the in-demand certifications list, followed by Basic Life Support (BLS) and CPR certifications.
Employer Demand: Wage Growth in Pennsylvania
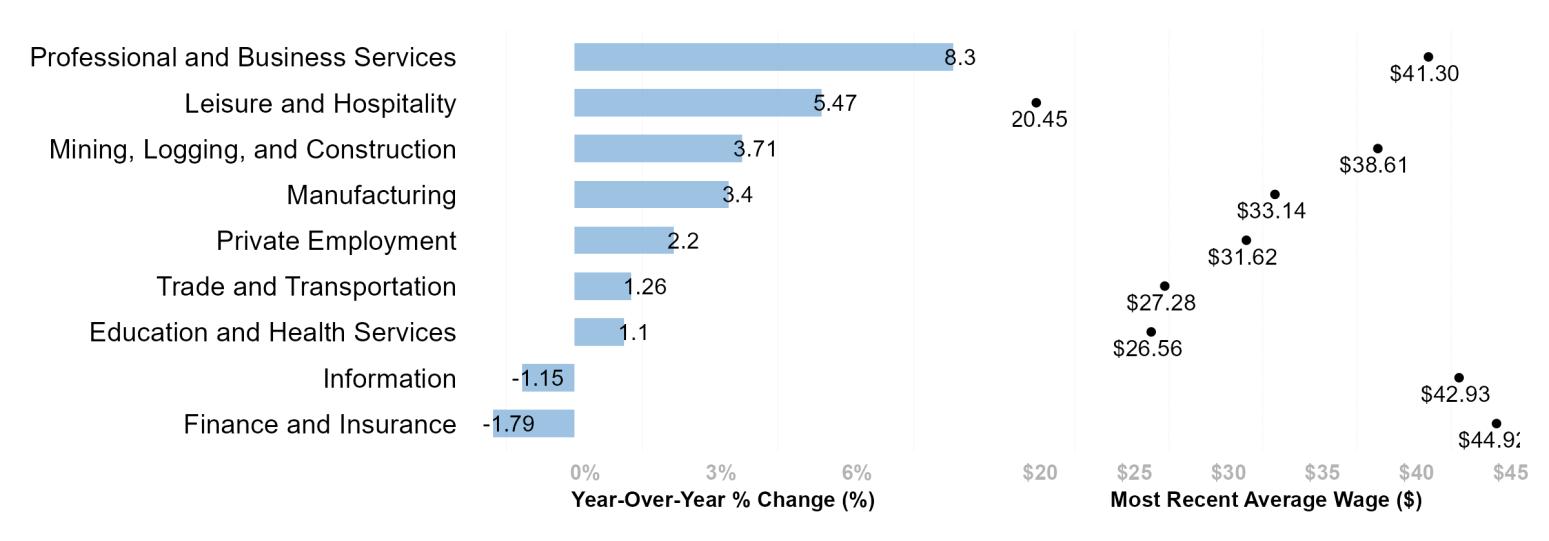
Statewide*, Professional and Business Services saw the highest year-over-year wage growth at 8.3% as of March 2024, with an average wage of $41.30, followed by Leisure and Hospitality at 5.47%, albeit with the lowest wage levels Meanwhile, the Information and Finance and Insurance sectors experienced wage declines of -1 15% and -1 79%, respectively, despite having relatively high wages of $42 93 and $44 92
In Philadelphia County, private wage growth has decelerated, suggesting that the Federal Reserve's interest rate policies to curb inflation are taking effect. The BLS data (Figure 16) reveals a general downward trend in wage growth, with significant fluctuations over the period Notably, wage growth peaked around early 2022 but showed a decline through 2023, reaching its lowest point in February 2024
Figure 16: Year over YearChange inAverage Hourly Wages, All Private Employment
Figure 15: PennsylvaniaYear-over-YearWage Growth, March 2024
Employer Demand: Inflation
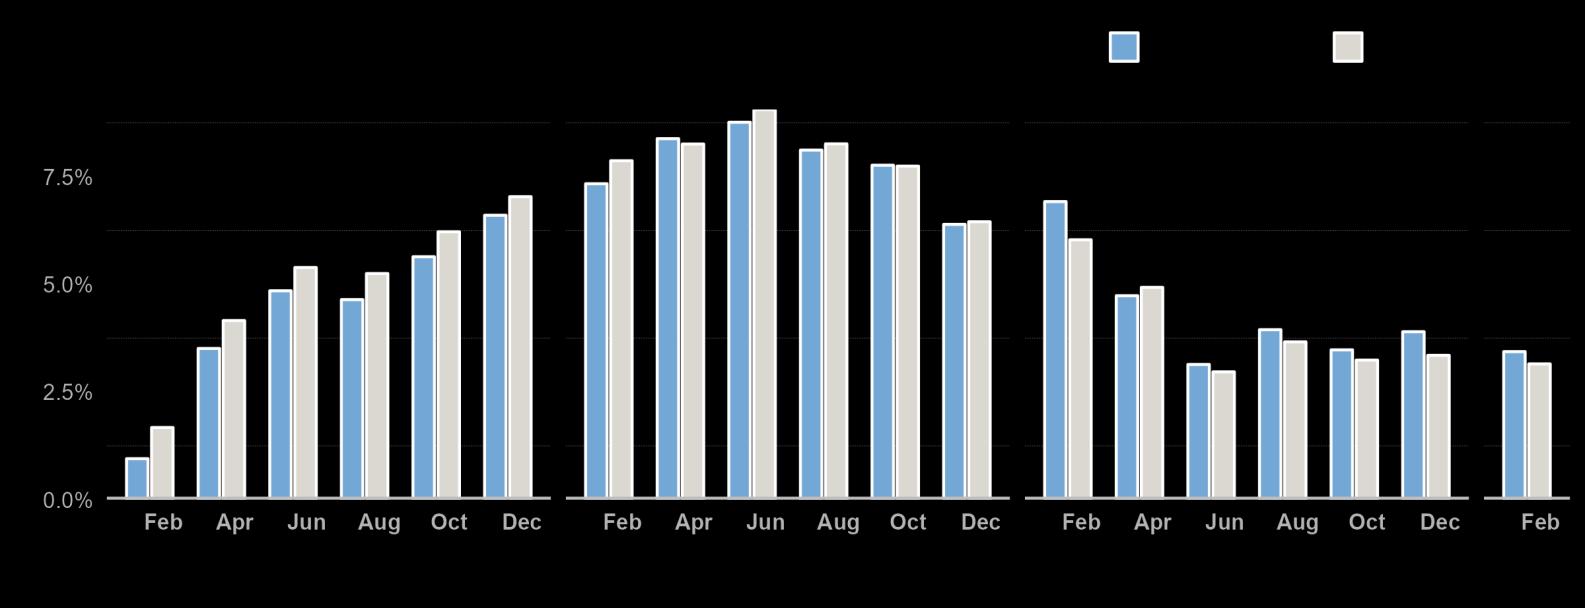
Figure 17: Bimonthly Year-Over-YearInflationAccordingtothe ConsumerPrice Index, 2021 to Present
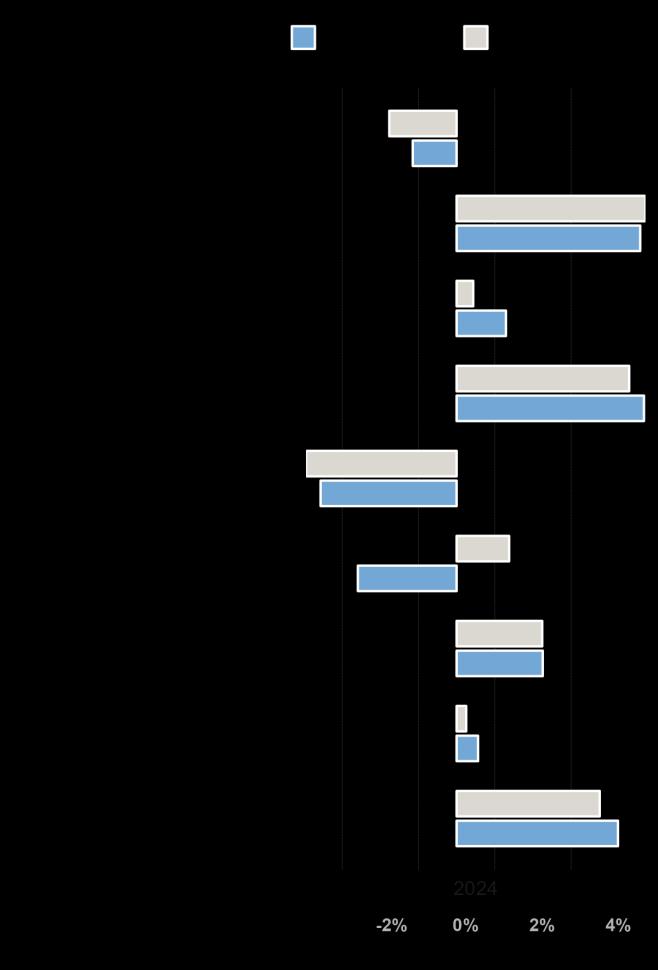
Figure 18: Bimonthly Year-Over-YearChange of InflationBucket , 2024
Like the United States, Philadelphia battled persistent inflation back in 2022. While inflation cooled down after the start of 2023, inflation as measured by the Consumer Price Index (CPI) has crept up slowly in Philadelphia to start 2024. Philadelphia's CPI measurement is below what it was in 2022 but has read higher than the national level since June 2023.
Breaking down inflation, Philadelphia has seen less severe fuel and utilities inflation compared to the United States, with stronger inflation in housing and commodities. In addition, while used cars and truck inflation has been cooler compared to the national level, inflation for new vehicles has remained high in the region at the start of 2024.
Resident Workers: Gender
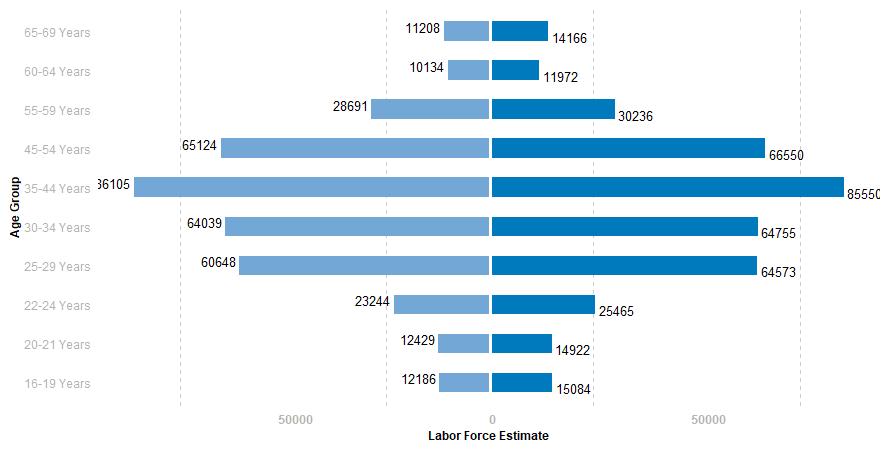
Based on Census data and ACS data, individuals between the ages of 25 and 34 make up the largest portions of Philadelphia’s population and labor force. For both men and women, labor force participation among these age cohorts is between 80% and 87%, higher than the overall rate.
Figure 19: Labor Force by Age and Binary Sex, ACS 2022
Female Male
Map 2: Labor Force Participation Rate (%) GenderGap, ACS 2022
While Philadelphia’s labor force has grown in recent years, employment outcomes vary by race, ethnicity, and educational attainment.
The gender gap is calculated as the difference between female and male Labor Force Participation Rates (LFPR). The map (Map 2) highlights the gender gap in LFPR across Philadelphia County, derived from the 2022 ACS.
Areas with darker blue shades, particularly in North and Northeast Philadelphia, indicate significant disparities where men's participation rates are much higher than women's. Central and Southern Philadelphia showing as lighter blue areas, saw a more balanced LFPR between genders.
Resident Workers: Ethnicity
Residents of color are more likely to be out of the labor force and unemployed.
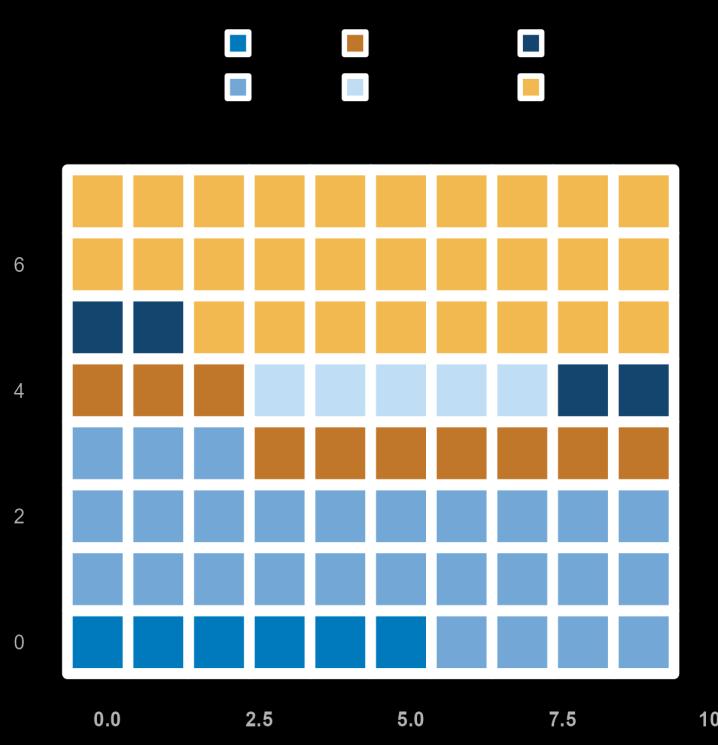
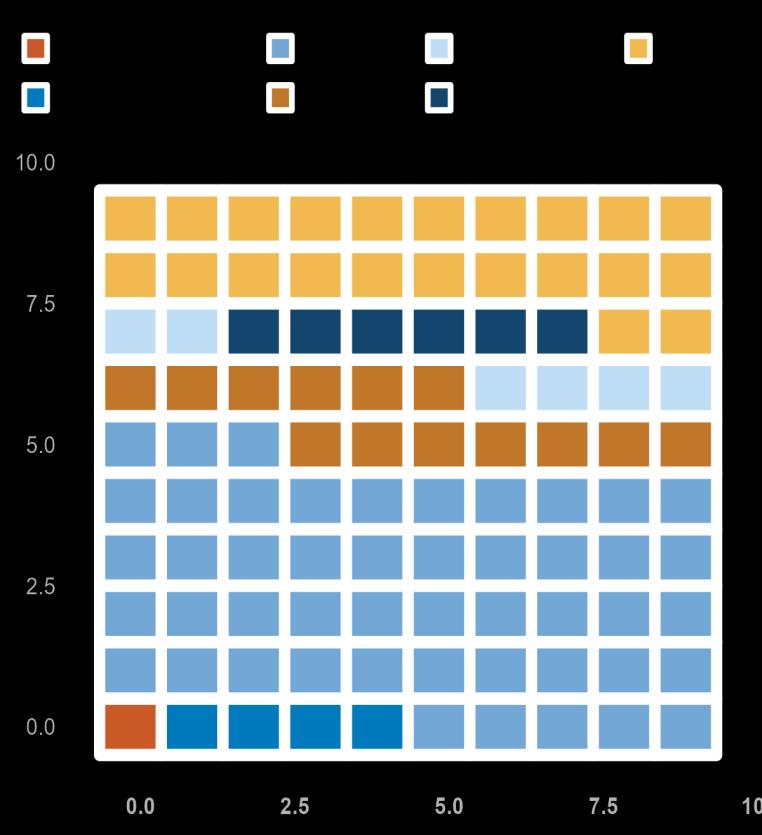
The grid charts (Figure 20 and Figure 21) provide a compelling visual representation of labor force participation and unemployment rates by race, using a 10x10 grid where each square represents 1% of the total. These charts reveal critical insights into the economic realities of different ethnic groups in Philadelphia.
The white population leads with a participation rate of 28%, followed closely by the black population at 27%. Asian and Hispanic populations have participation rates of 6% and 10%, respectively. Other racial groups, including American Indians, Pacific Islanders, and those identifying as two or more races, show lower participation rates.
The black population faces the highest unemployment rate at 48%, significantly surpassing other groups. The white population has an unemployment rate of 22%, while the Hispanic and Asian populations face rates of 13% and 4%, respectively.
Figure 20: Labor Force Participation Rate by Race, ACS 2022
Unemployment: Educational Attainment and Geospatial Pattern
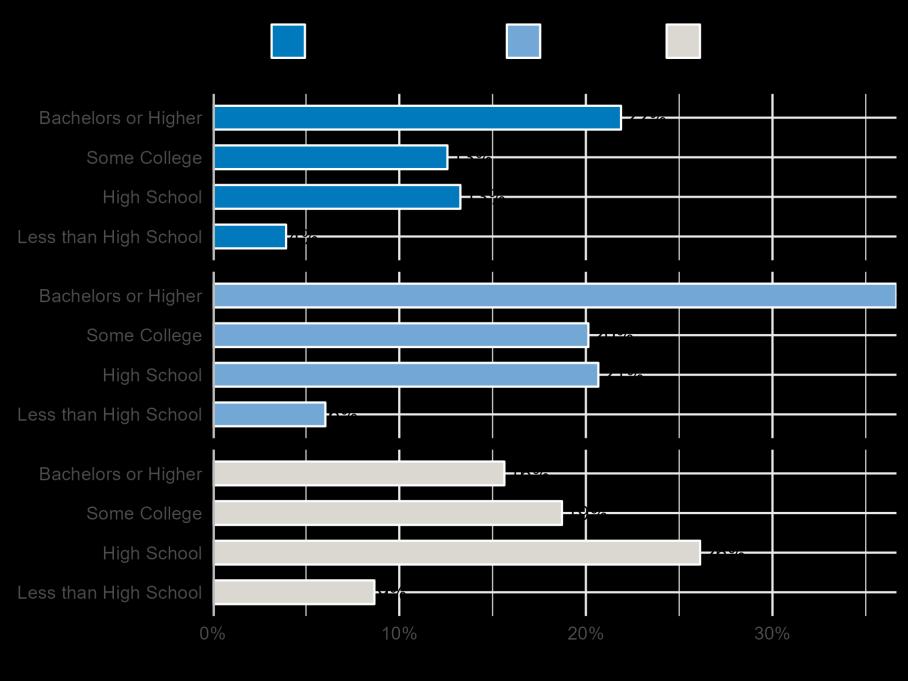
According to ACS 2022 data, in Philadelphia, individuals with a bachelor's degree or higher show the highest labor force participation and employment rates, along with the lowest unemployment rates.
Figure 22: Proportion of Employmentand Labor Force Participation by Educational Attainment, ACS 2022
The map reveals notable geographic disparities in unemployment, with higher unemployment rates concentrated in North, Northeast, and Southwest Philadelphia. These areas have been experiencing economic challenges, suggesting a need for targeted interventions and support programs to address unemployment.
Meanwhile, the lighter areas, such as parts of Center City and Northwest Philadelphia, show lower unemployment rates and better conditions.
Conversely, those with less than a high school diploma face the most significant challenges, with the lowest participation and employment rates and the highest unemployment rates.
Map 3: UnemploymentRate (%) by Census Tract in Philadelphia, ACS2022
Source:
Resident Workers: Geospatial Inflow-Outflow
Philadelphia is intrinsically connected to its suburban neighbors. Nearly half of all primary jobs in the city are held by workers who commute from outside the city limits.
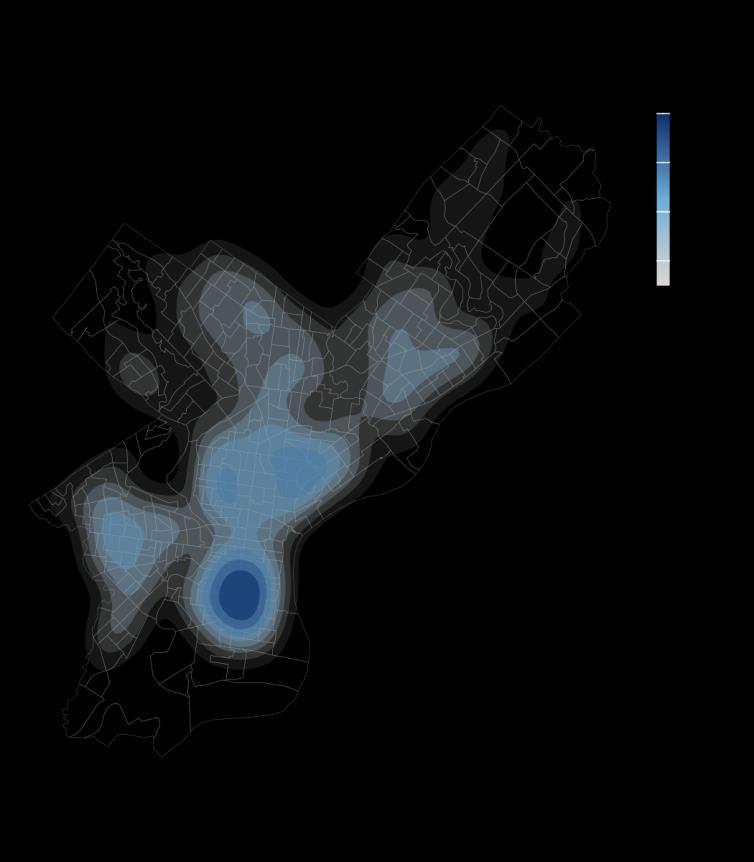
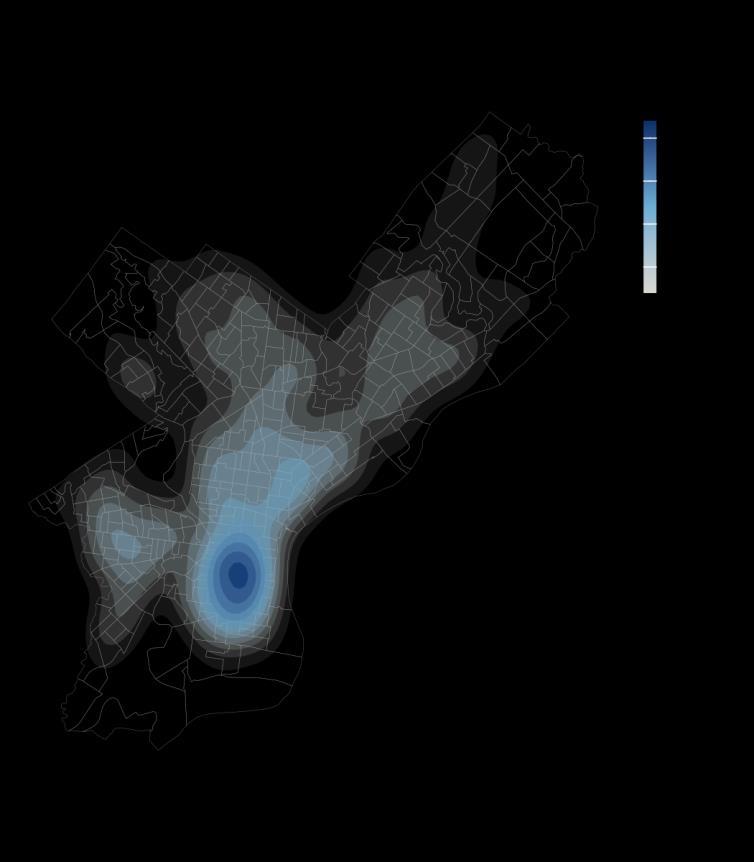
Commuting patterns have greatly changed in the years since COVID-19. According to 2022 ACS 5year estimates, darker shades in Map 4 and Map 5 indicate higher concentrations of employed residents and employed workers. The dense areas are found in Center City and parts of South Philadelphia.
Map 4: Residents Densityof Employmentin Philadelphia, Total All Jobs, LEHD 2021
599,926
Total All Jobs Commute Out
15%
Of Resident Workers Relied on Public Transportation in 2021 17%
Of Resident Workers Had No Access to a Vehicle in 2021
Map 5: Workers Density of Employment in Philadelphia, Total All Jobs, LEHD 2021
676,054
Total All Jobs Commute In
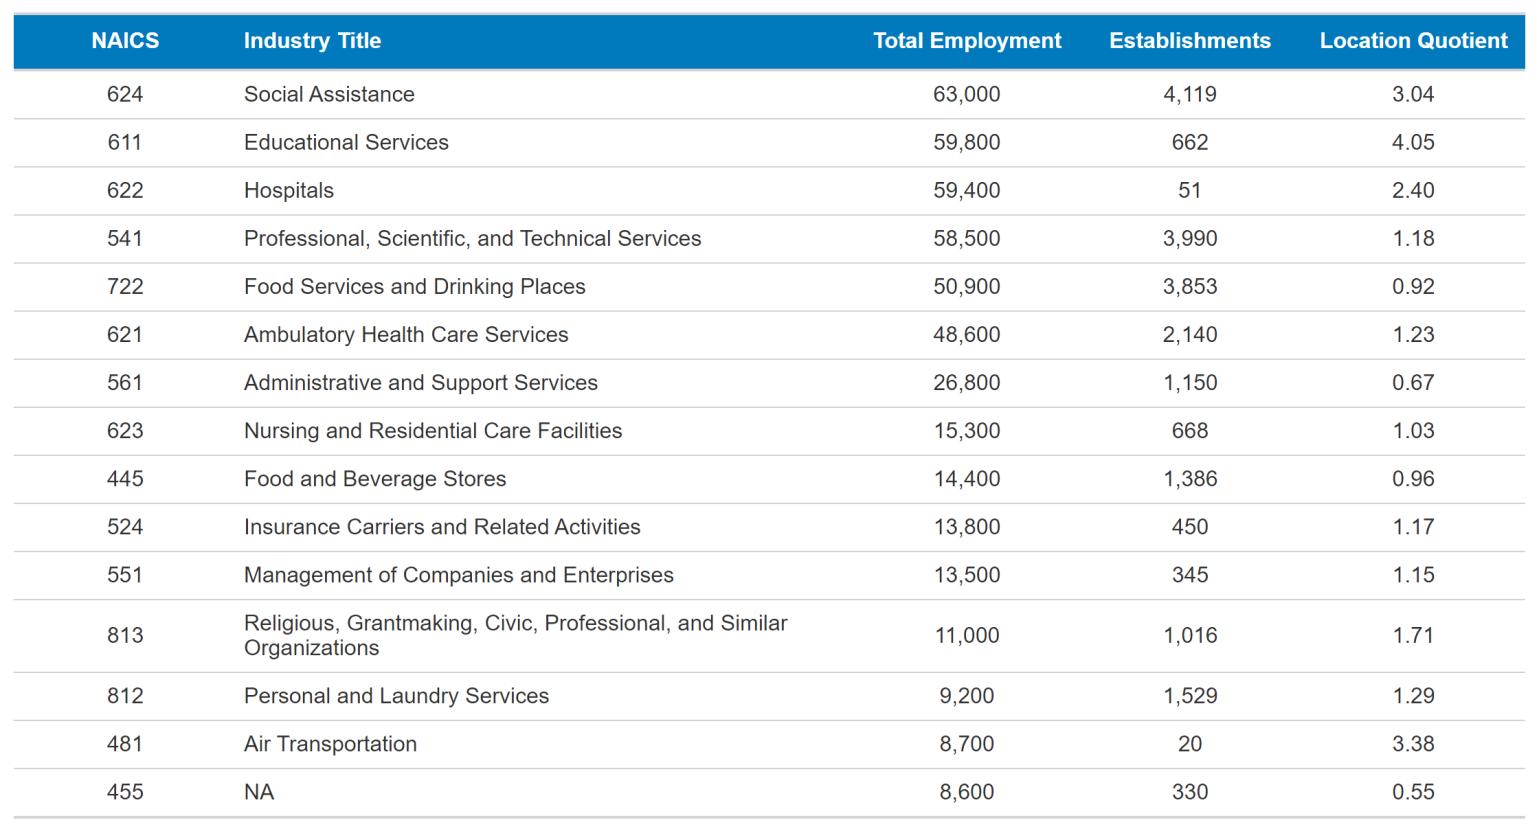
Appendix Table 1: Largest Detailed Industry Sectors in Philadelphia, Q3 2023
From the Quarterly Census of Employment and Wages, this table shows the 15 largest industry sectors by total employment. These data are released on a roughly six-month delay.
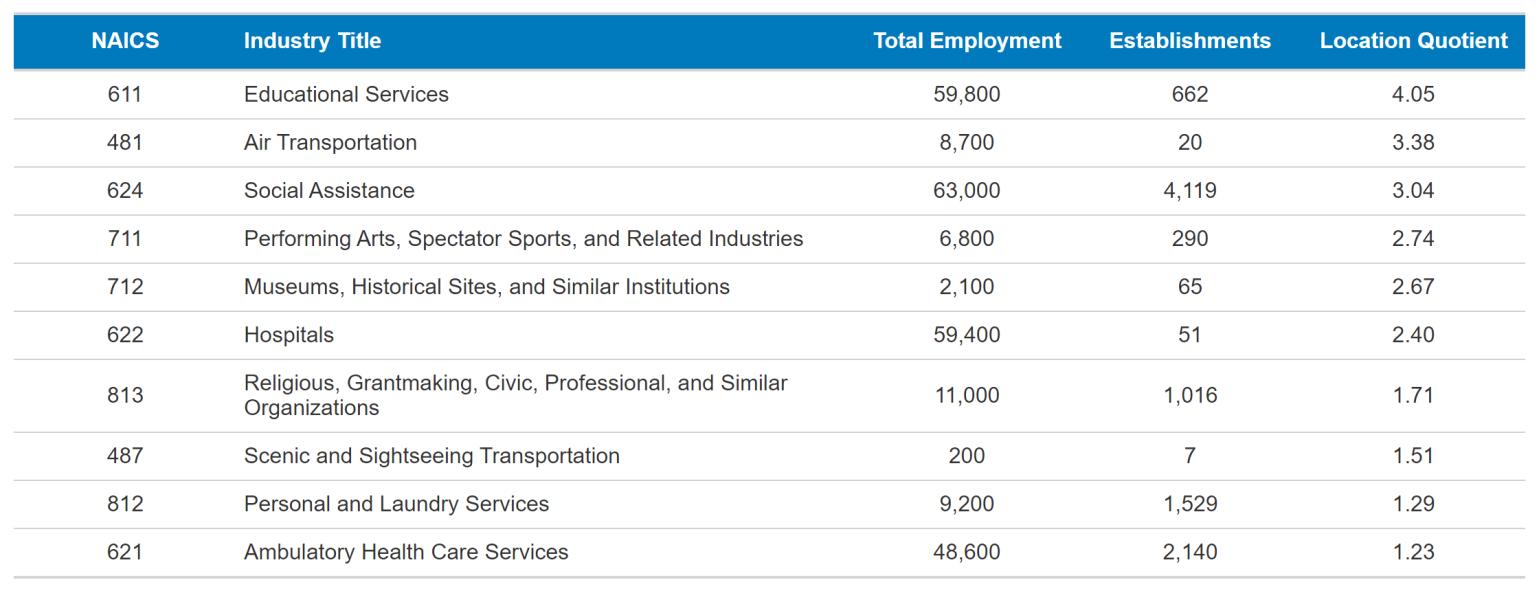
Appendix Table 2: Most Specialized Detailed Industry Sectors in Philadelphia, Q3 2023
From the Quarterly Census of Employment and Wages, this table shows the 10 most specialized industry sectors by total employment. These industries are disproportionately important to Philadelphia’s economy. These data are released on a roughly six-month delay.
Source: Philadelphia
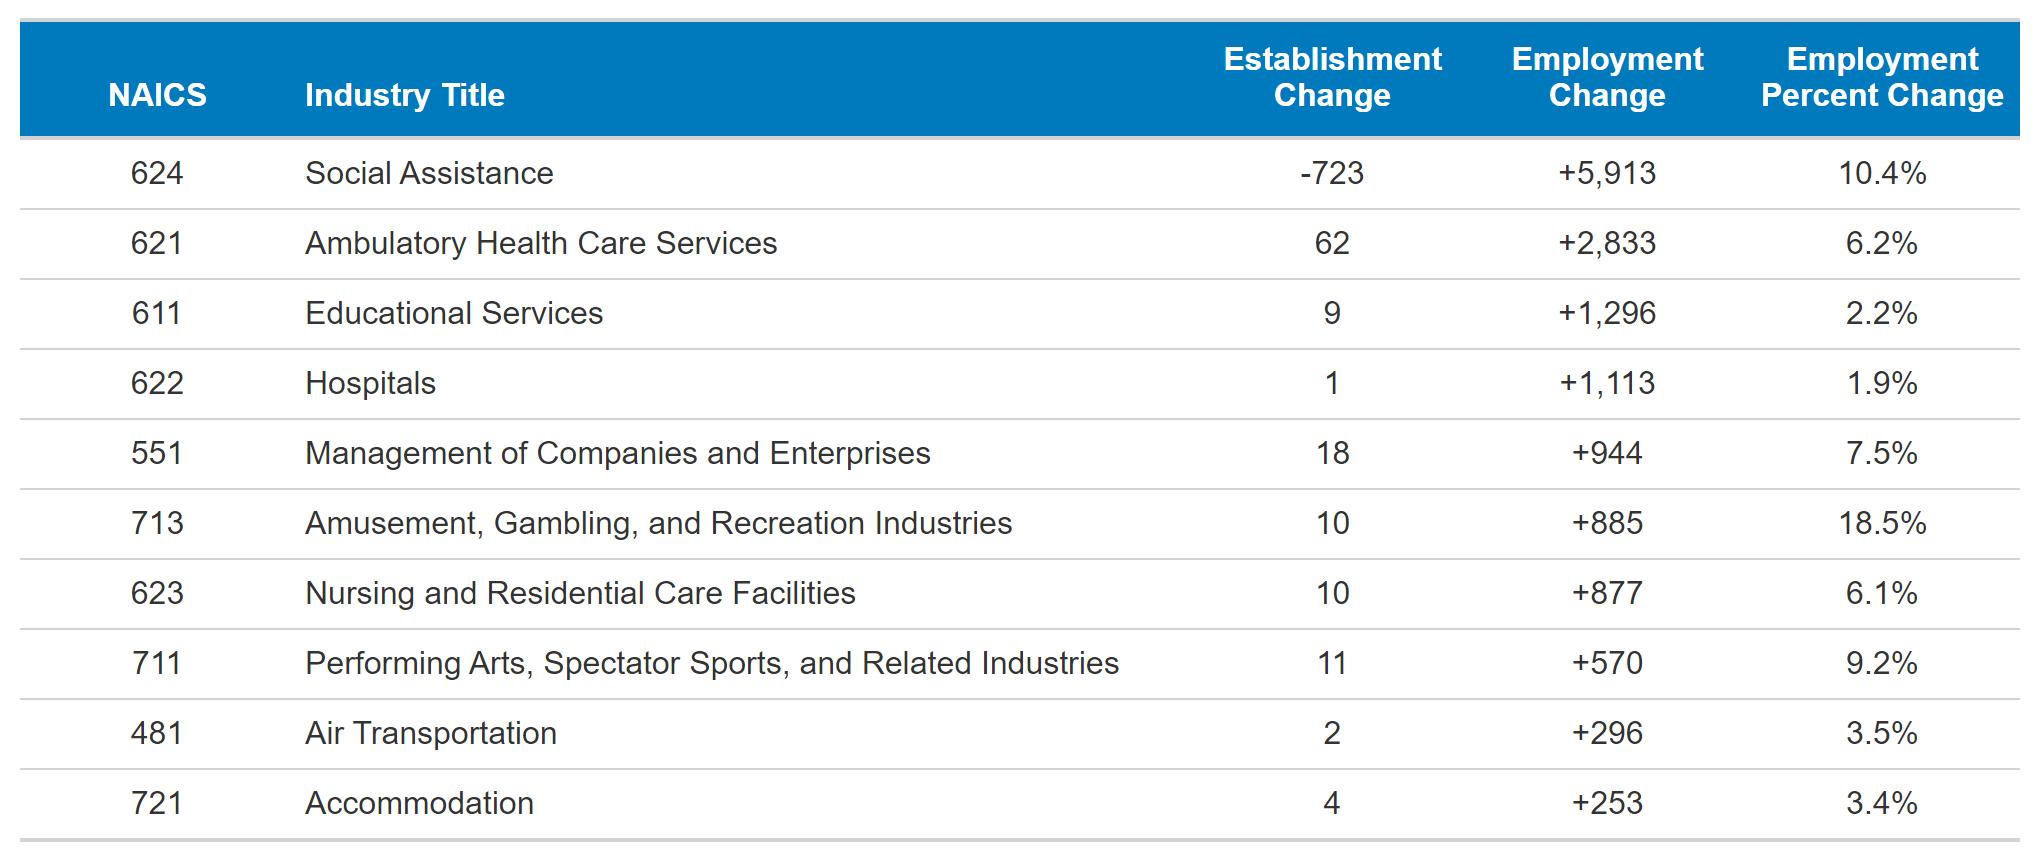
Appendix Table 3: Detailed Industry Sectors in Philadelphia with Largest Year-Over-Year Growth, Q3 2023
From the Quarterly Census of Employment and Wages, this table shows the 10 industry sectors with the largest annual employment growth. These data are released on a roughly six-month delay.
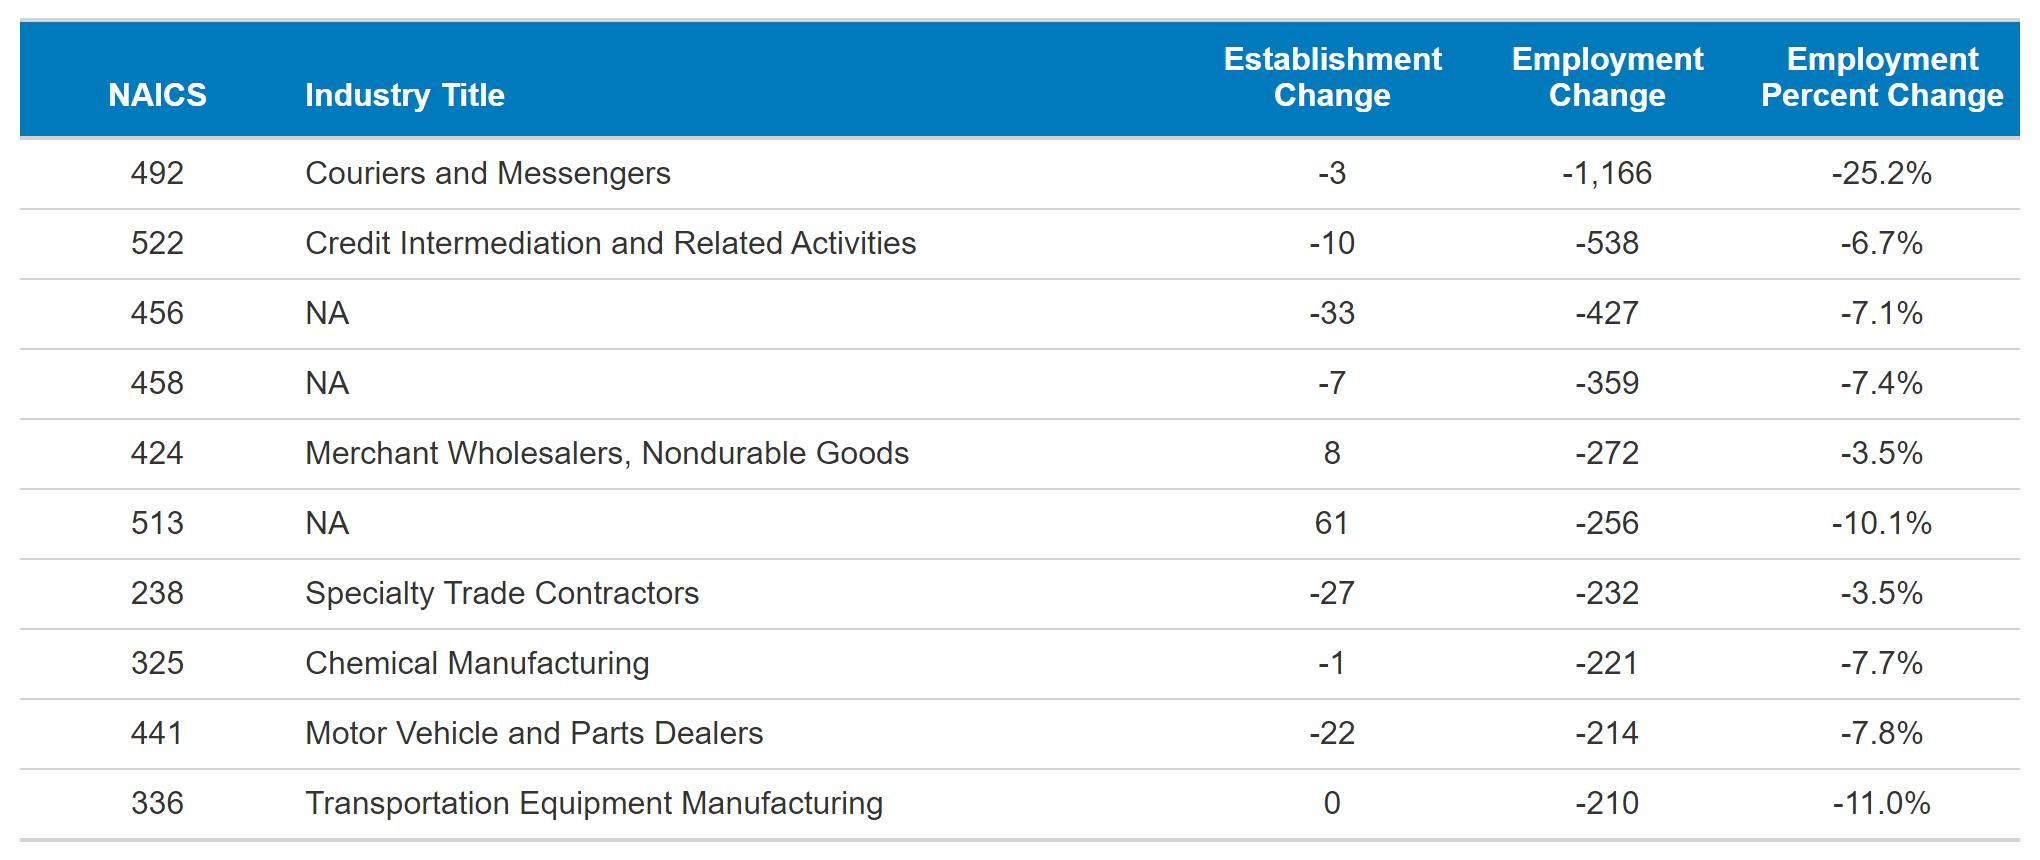
Appendix Table 4: Detailed Industry Sectors in Philadelphia with Largest Year-Over-Year Declines, Q3 2023
From the Quarterly Census of Employment and Wages, this table shows the 10 industry sectors with the largest annual employment declines. These data are released on a roughly six-month delay.
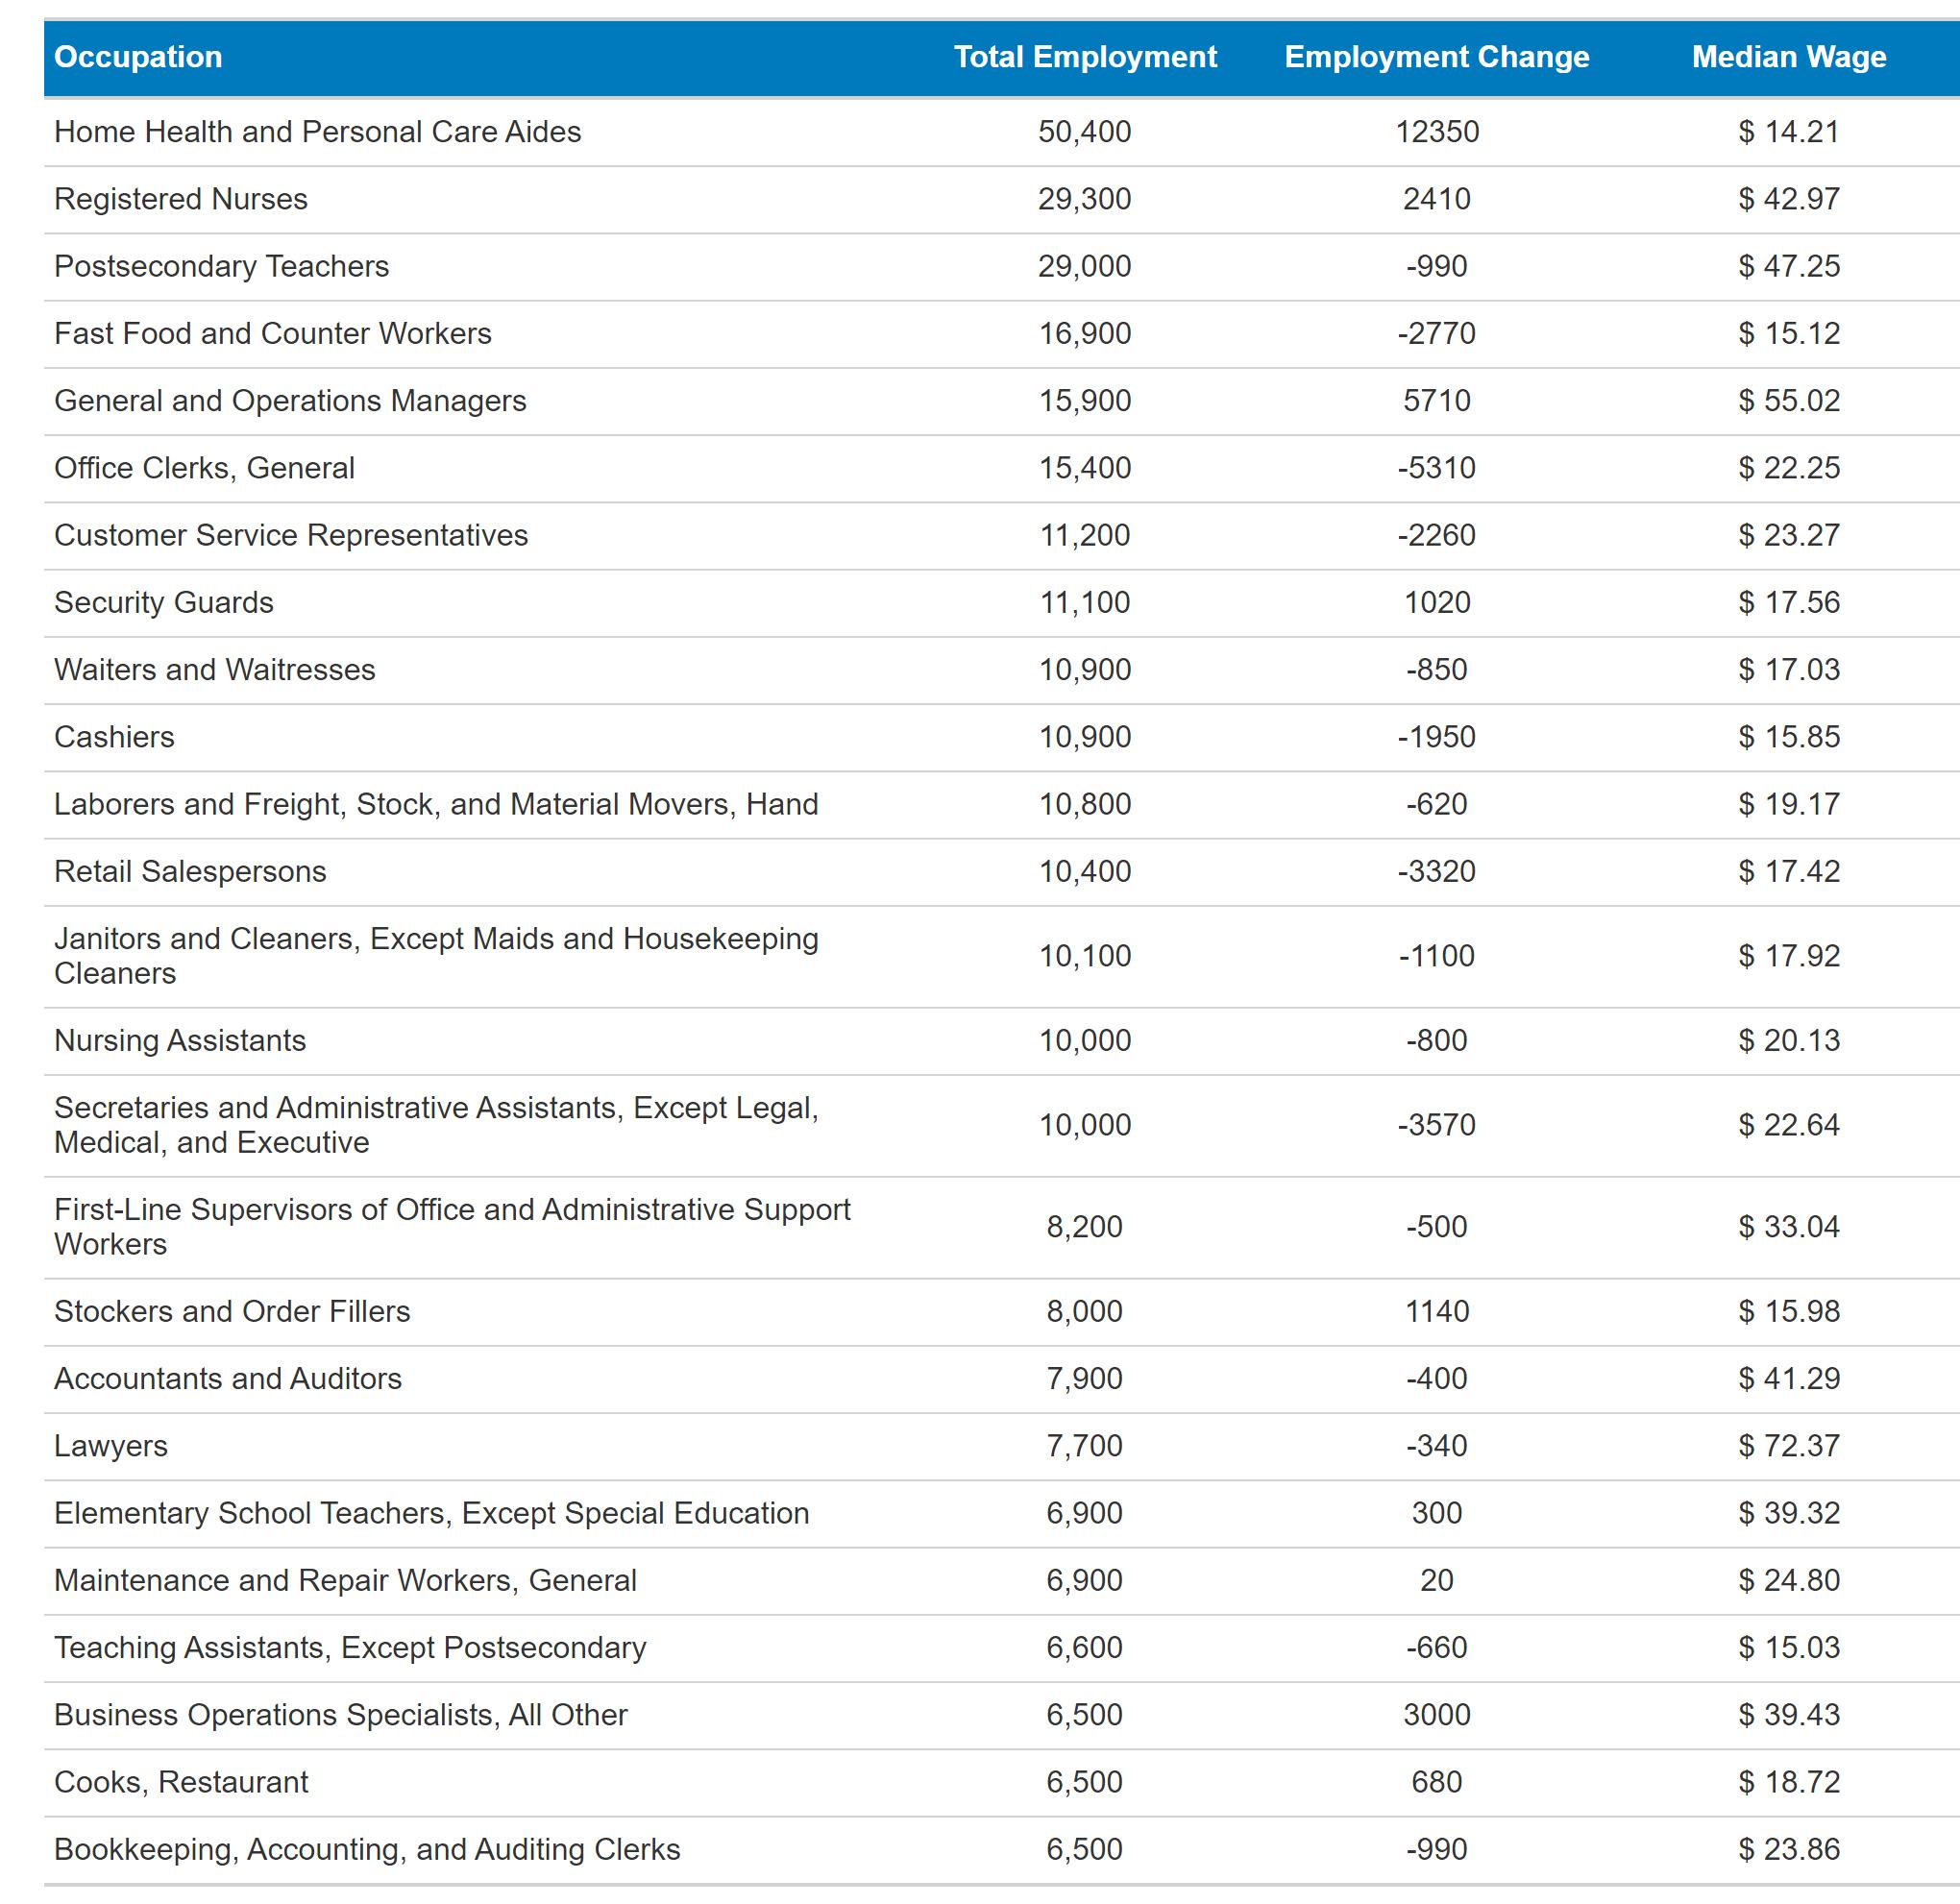
Appendix Table 5: Largest Occupations in Philadelphia with Employment Change from 2019 to 2024
Based on estimates derived from the Quarterly Census of Employment and Wages, this table shows the 25 largest occupation by total employment. These data are released on a roughly nine-month delay.