
MAGAZINE | JULY/AUGUST 2023
AUTOMATED MOISTURE CONTROL
Euromel® Melamine The state-of-the-art HP technology


Euromel® Melamine - the leading and most advanced technology for the production of high-quality melamine used in wood-based products, laminates, moulding compounds and fire-extinguishing foams in the last 40 years.


Delivers high purity, high consistency melamine with total zero pollution (TZP) with extremely lower energy consumption using 30% lesser steam import and 20% lower fuel utilisation than the closest competitor
Euromel® Melamine Process is now used in 28 plants worldwide, accounting for more than 8 million tonnes of melamine produced cumulatively, making it the most traded and widely used melamine worldwide.

CONTENTS
32 The Quest For Zero Accidents
Lucia Castillo Nieto, International Fertilizer Association (IFA), France, examines the measures in place to improve safety in fertilizer plants, and considers the actions producers can take to reach zero accidents.
The Quest for Zero Accidents
36 Safety In The Ammonia Sector
Venkat Pattabathula, SVP Chemical Plant Services, Australia, reviews some of the major incidents related to ammonia production and outlines how design improvements have contributed to a more efficient industry.
44 Toxic Gas Detectives
Murtaza I. Gandhi and Anthony G. Sarrack, Baker Engineering and Risk Consultants, Inc., USA, discuss the application of various gas detection technologies in fertilizer plants and the role they play in strengthening toxic shelter-in-place (SIP).
53 A Defence Against Damage
Paul J. Kowalski, The Equity Engineering Group (E2G), USA, discusses the approaches to managing high-temperature hydrogen attack (HTHA) risk in different fertilizer facilities.

57 Mitigating The Risk Of HTHA


Paresh Haribhakti and Ketan Upadhayay, TCR Advanced Engineering, India, outline how fertilizer producers can proactively detect high-temperature hydrogen attack (HTHA) to enhance plant safety.
61 Managing The Hazards Of Fertilizer Dust
Kyle Langley, Vortex Global, USA, explains how fertilizer dust exposure can be effectively mitigated to ensure a safer and more sustainable future for agriculture.
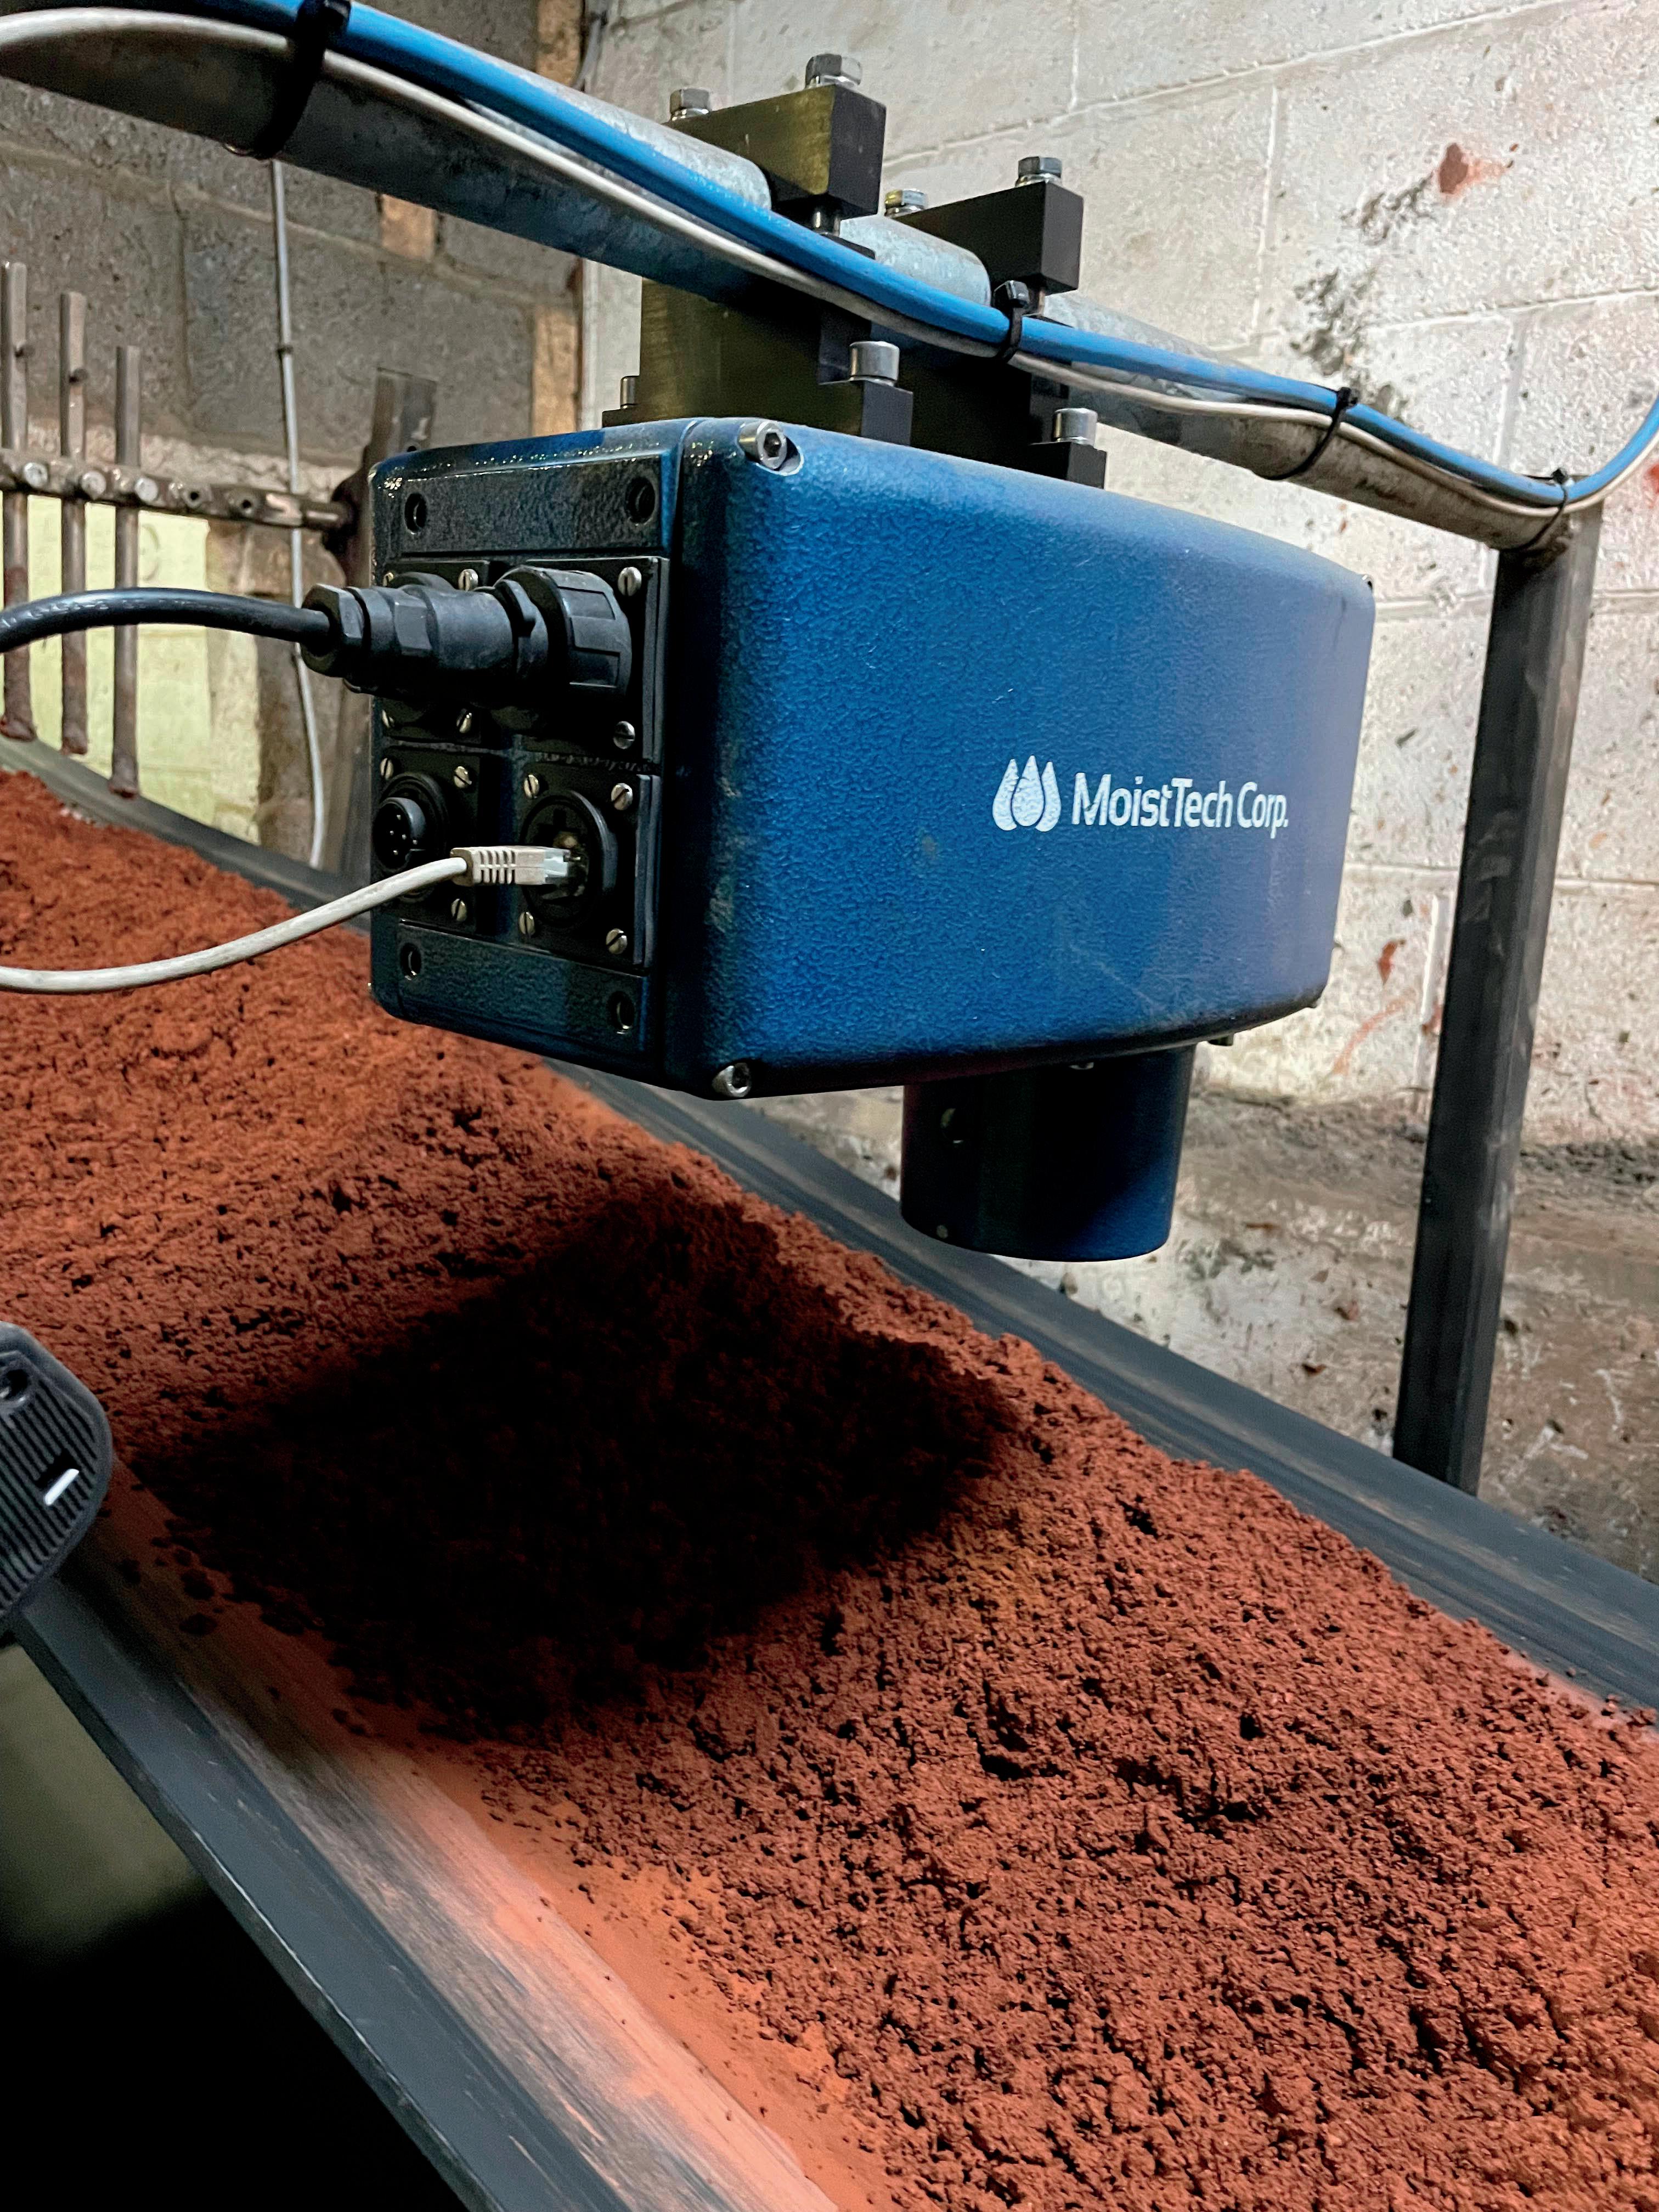
Fluctuating moisture levels can cause significant changes to the quality of various types of manufactured products. These inconsistencies mean the final product will have varying quality levels depending on where in production they were created. Accurately detecting moisture levels frequently throughout the process allows for line adjustments as needed that improve the overall functionality and efficiency of the facility. MoistTech Corp. manufactures the diamond standard in moisture measurement sensors, service, and support.

ON THE COVER 03 Comment 05 News 10 The Potash Market: A Changing Landscape Shane Le Capitaine, FEECO International, Inc., USA, discusses the critical role of potash drying in a diverse and evolving industry. 16 A Push Towards Digitalisation Luc Dieltjens, Stamicarbon, the Netherlands, outlines the benefits of moving towards digitalisation in the fertilizer industry in order to ensure a more sustainable future. 21 Accelerating The Pace Of Change Fernanda Martins and Stephen Reynolds, AVEVA, Brazil and USA, discuss the role of digital solutions in accelerating the pace of change in the ammonia industry. 25 The Laboratory Robot Revolution Lucas de Clercq, Alsys International, the Netherlands, examines the move towards laboratory automation in fertilizer plants in line with the increasing demands of the industry. 29 The Idea Of Integration Guido Canti, Eurotecnica, Italy, and Marc Wieschalla, thyssenkrupp Uhde, Germany, examine the advantages of integrating a melamine plant with an existing urea plant. follow @WorldFertilizer like World Fertilizer join World Fertilizer Copyright© Palladian Publications Ltd 2023. All rights reserved. No part of this publication may be reproduced, stored in a retrieval system, or transmitted in any form or by any means, electronic, mechanical, photocopying, recording or otherwise, without the prior permission of the copyright owner. All views expressed in this journal are those of the respective contributors and are not necessarily the opinions of the publisher, neither does the publisher endorse any of the claims made in the advertisements. Printed in the UK. CBP019982
10
Lucia Castillo Nieto, International Fertilizer Association (IFA), France, examines the measures in place to improve safety in fertilizer plants, and considers the actions producers can take to reach zero accidents. F ertilizer central for healthy and successful crop growth in agriculture. It provides plants the essential nutrients to grow and thrive. However, the chemical industrial processes and mining involved in has made remarkable strides in improving production plant safety and security, driven by combination of regulatory mandates, technological breakthroughs, and industry-wide initiatives. Associations such as the International Fertilizer Association (IFA) are key players in the transformation, promoting the efficient and responsible production, distribution, and use of plant nutrients. Members Safety and security play leading role in order to ensure that the industry adheres to the highest safety standards and commits to continuous improvement. (SHE) principles, which require them to establish and improve their safety, security, health and environmental performance through annual objectives, targets or key performance indicators, among other actions. Process safety management One of the drivers of progress in plant safety in the fertilizer industry has been focus on process safety management (PSM). mitigating risks associated with the manufacturing and handling of fertilizers. One example of process safety is the implementation of rigorous monitoring systems and controls to prevent chemical leaks, fires, or explosions. Fertilizer plants employ advanced process control technologies to continuously monitor key variables such as temperature, pressure, and chemical deviations from safe operating conditions and trigger automated responses or alarms to prevent maintenance, periodic safety audits, and thorough inspections of storage tanks and pipelines help ensure the integrity of the manufacturing process, minimising the risk of incidents that could surrounding environment. 32
Pop-A-Plug ® Tube Plugs


ASME PCC-2 Compliant Heat Exchanger Tube Plugging System


Trusted by fertilizer plants around the world as their go-to solution for heat exchanger tube leaks, Pop-A-Plug Tube Plugs from CurtissWright are engineered for optimal performance throughout the life cycle of equipment. Controlled hydraulic installation eliminates welding and time-consuming pre-/post-weld heat treatments that can cause damage to tubes, tube sheet ligaments, and joints.


• No Welding Required
• Pressure Ratings Up to 7000 PsiG (483 BarG)


• Simple Hydraulic Installation


• Helium Leak Tight Seal to 1 x 10⁻¹⁰ cc/sec


• 100% Lot Tested to Ensure Unmatched Quality


• ASME PCC-2 Recommended Tube Plugging Repair Methods


• Wide Range of Sizes& ASME/ASTM Certified Materials Available


877.383.1029 l est-sales@curtisswright.com l cw-estgroup.com/wf-23

CONTACT US
MANAGING EDITOR
James Little james.little@palladianpublications.com
SENIOR EDITOR
Callum O’Reilly callum.oreilly@palladianpublications.com
DEPUTY EDITOR
Emily Thomas emily.thomas@palladianpublications.com
EDITORIAL ASSISTANT
Jack Roscoe jack.roscoe@palladianpublications.com
SALES DIRECTOR
Rod Hardy rod.hardy@palladianpublications.com
SALES MANAGER
Ryan Freeman ryan.freeman@palladianpublications.com
PRODUCTION
Kate Wilkerson kate.wilkerson@palladianpublications.com
ADMINISTRATION MANAGER
Laura White laura.white@palladianpublications.com
DIGITAL ADMINISTRATOR
Leah Jones leah.jones@palladianpublications.com
EVENTS MANAGER
Louise Cameron louise.cameron@palladianpublications.com
EVENTS COORDINATOR
Stirling Viljoen stirling.viljoen@palladianpublications.com
DIGITAL CONTENT ASSISTANT
Merili Jurivete merili.jurivete@palladianpublications.com
COMMENT
EMILY THOMAS, DEPUTY EDITOR

Like many others, I have watched in disbelief as chaos has unfolded across Europe in what has been dubbed ‘the summer of extremes.’ Wildfires have spread across the Greek islands of Rhodes and Corfu in the midst of an extreme heatwave, with tens of thousands of tourists and residents forced to evacuate across land and sea. Raging winds have also made suppressing the blazes considerably more challenging, leaving travellers and locals alike in limbo. Similarly, the sky has been filled with haze for weeks in Canada and the US as a product of ongoing wildfires. While it is part of a natural cycle for Canada’s boreal forests to burn, experts have noted that the fires have continued to intensify; thus far, the country’s wildfires have scorched forests totalling the size of the state of Virginia, and fire services and governments are scrambling to keep up.1
Such extraordinary conditions follow a period of extreme weather conditions experienced all over the world. Temperatures recently rose to over 50°C in parts of the US and China, and across the globe, warnings of danger to life by high temperatures have been expressed. For instance, Death Valley in California recently hit 53.9°C, whilst China recorded its highest temperature of all time at 52.2°C in the Xinjiang region. This summer alone has seen four climate records broken, including the hottest day and the hottest June on record, marine heatwaves, and record-low Antarctic sea-ice.
Record-breaking and abnormal conditions such as this are set to become more frequent, with heatwaves expected to be more intense and last longer than ever. Scientist, Dr Frederieke Otto, from Imperial College London, recently claimed: “What we are seeing at the moment is exactly what we expect in a world where we are still burning fossil fuels.” World Meteorological Organisation MO Secretary-General, Prof Petteri Taalas, has also spoken out on the issue, re-emphasising the importance of cutting greenhouse gas emissions as quickly as possible, and proposing that efforts must be stepped up “to help society adapt to what is unfortunately becoming the new normal.” 2 As the climate crisis moves into unchartered territory, The International Energy Agency has urged that no new oil, gas or coal projects are proposed.
The fertilizer industry has undoubtedly recognised its role as a key contributor to greenhouse gas emissions, and has since shown its commitment to net zero and low-carbon pathways. The International Fertilizer Association, for example, has assured the public that its members are hard at work pioneering new technologies to produce ammonia from sustainable, carbon-neutral inputs.3
Moreover, at the recent Agriculture Innovation Mission for Climate (AIM for Climate) Summit in Washington, D.C, more than 20 countries gathered to discuss the acceleration of clean technologies and sustainable solutions in agriculture. At the Summit, FCDO Minister for Indo-Pacific, Anne-Marie Trevelyan, discussed the threats of climate change, and hailed innovation, research and ingenuity as the pillars to tackle climate change, biodiversity loss and food insecurity. Trevelyan went on to announce that the UK would join the Global Fertilizer Challenge, committing £3 million to a new research consortium. The consortium is said to be focused on developing alternative fertilizers to boost sustainability and productivity, and will encourage spending on the development of climate-resilient agricultural innovations.
SUBSCRIPTIONS
In a bid to help the fertilizer industry meet net zero targets and boost sustainability, the UK has also made grants of £51 million for the Farming Innovation Programme in 2023, encouraging researchers, farmers, and businesses to come together in research and development projects. A data-sharing solution for farmers has been a product of the programme, in which farmers can support each other in measuring and monitoring soil health patterns.4
The fertilizer industry can therefore be seen to be doing its bit towards meeting looming climate targets, and we can hope that other industries follow suit and keep their cool as the climate debate heats up. While none of us have the power to reverse global warming overnight, we can certainly aim to slow it down, meaning greenhouse gas emissions will peak as soon as possible, and are reduced rapidly thereafter. As Dr Otto states, “We are in a new era, but we still have time to secure a liveable future for many.”
1. www.npr.org/2023/07/21/1188618934/canada-wildfires-answers
2. www.bbc.co.uk/news/science-environment-66229057
3. www.fertilizer.org/key-priorities/climate-change/
4. www.gov.uk/government/news/uk-leads-the-way-on-agricultural-innovation-at-washington-dc-climate-summit
JULY/AUGUST 2023 | WORLD FERTILIZER | 3 World Fertilizer (ISSN No: 2398-4384) is published 8 times a year by Palladian Publications Ltd, UK. World Fertilizer Subscription rates: Annual subscription: £50 UK including postage £60 overseas (postage airmail) Two year discounted rate: £80 UK including postage £96 (postage airmail). Subscription claims: Claims for non receipt of issues must be made within 3 months of publication of the issue or they will not be honoured without charge.
Palladian Publications Ltd, 15 South Street, Farnham, Surrey GU9 7QU, UK Tel: +44 (0) 1252 718 999 Website: www.worldfertilizer.com
YOUR SPECIALIST & PARTNER FOR
fully automatic OPEN MOUTH bagging machines
high-performance FORM-FILL-SEAL bagging machines

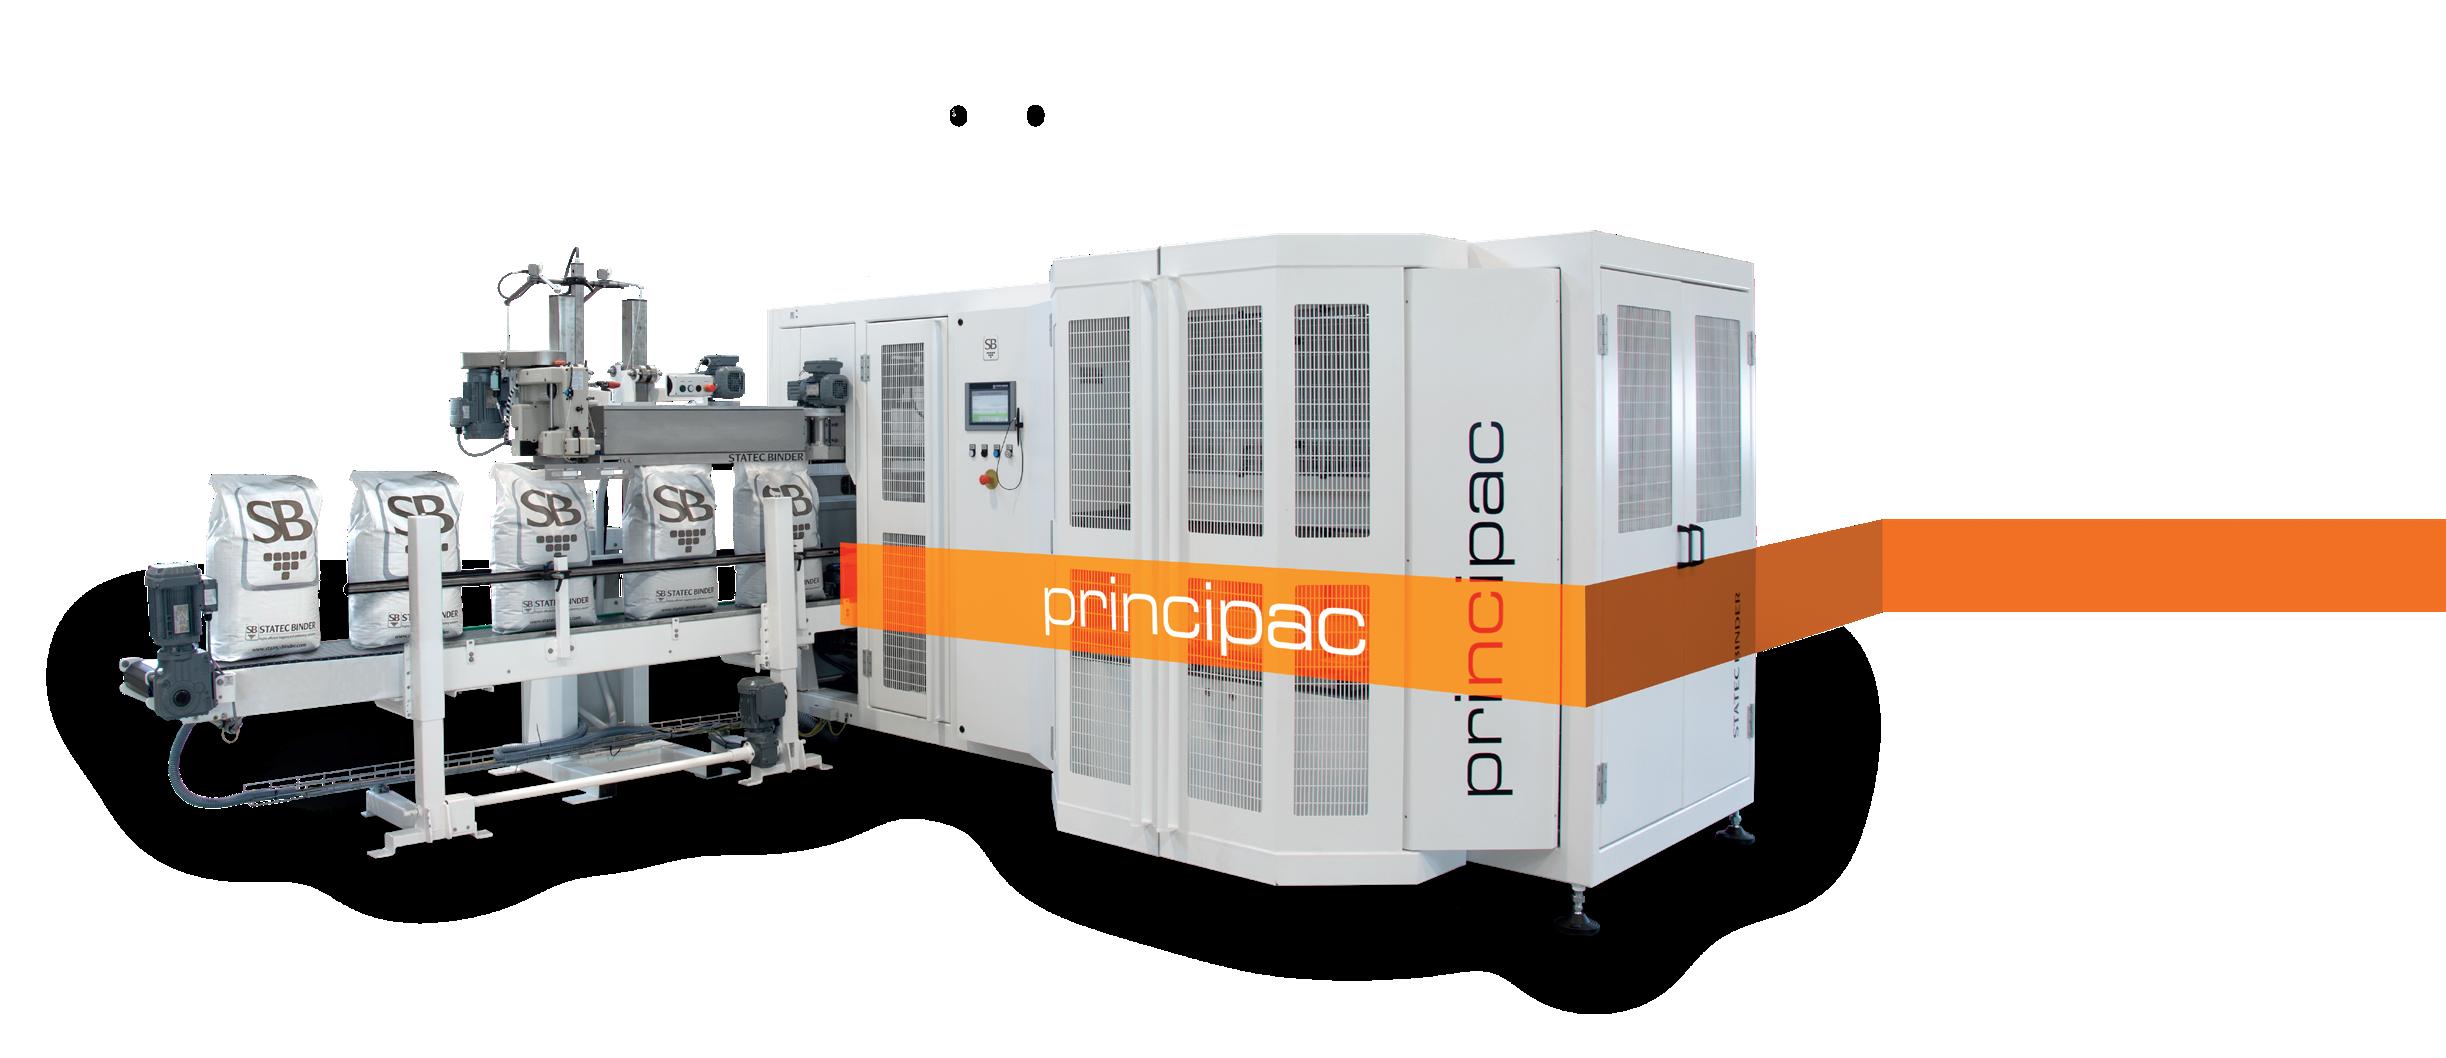


STATEC BINDER your strong and reliable partner stands for ... highest quality, high-performance and absolute reliability
more than 45 years of experience in customized and flexible solutions over 1,800 machines successfully installed worldwide global customer service and everything from a single source
www. statec-binder.com
E-Mail:
STATEC BINDER GmbH Industriestrasse 32, 8200 Gleisdorf, Austria Tel.: +43 3112 38580-0
office@statec-binder.com
WORLD NEWS
AFRICA NextChem Holding announces new fertilizer project
MAIRE S.p.A.has announced that its subsidiary NextChem Holding, through Stamicarbon, part of the Sustainable Technology Solutions business unit, has been awarded licensing and proprietary equipment contracts related to an ammonia and urea complex for an overall value of approximately €100 million. This award follows the licensing and process design package contracts awarded by the same client and announced in August 2022.
The integrated ammonia and urea complex in Sub-Saharan Africa will have a capacity of 4600 tpd of ammonia and 8000 tpd of urea in two production trains. The project, which is expected to be operational in 2026, aims to address the growing demand for high-quality fertilizers in the region and, thanks to the plant’s strategic location, globally. The complex will use Stamicarbon’s nitrogen technology and proprietary equipment which will allow energy consumption to be reduced and ammonia emissions to be minimised.
Alessandro Bernini, MAIRE CEO, commented: “We are very proud of this project, which will adhere to the highest environmental standards, thanks to cutting-edge technologies able to maximise energy efficiency and effectively reduce emissions. Such a scope is in line with MAIRE’s 10-year strategic plan to support the global food security and agricultural industry with innovative and sustainable solutions. This record-breaking award, which will generate a double-digit profitability, further confirms our global leadership in nitrogen technological solutions and our concrete commitment to reduce the carbon footprint of the fertilizer industry in the region, where we are creating value to support its industrial and social development.”
UK CF Fertilisers announces proposal to close Billingham ammonia plant
CF Fertilisers UK Limited has announced a proposal to permanently close the ammonia plant at its Billingham complex in order to secure the long-term sustainability of its business in the UK and more efficiently serve its customers in the country. The company intends to continue to produce ammonium nitrate fertilizer and nitric acid at the Billingham site using imported ammonia, as it has for the last 10 months following its decision to temporarily idle the plant in August 2022.
CF Fertilisers UK has made this proposal due to its forecast that producing ammonia at Billingham will not be cost-competitive for the long-term compared to importing ammonia due primarily to projected high natural gas prices in the UK, relative to other regions, and the impact of carbon costs. Additionally, shutdowns in recent years of industrial customers’ UK operations that had consumed significant ammonia volumes for their businesses have created a supply-demand imbalance for ammonia production at the Billingham complex. The company believes that ample global availability of ammonia for import, including from CF Industries’ North American production network, will enable more cost-competitive and efficient production and sales of ammonium nitrate fertilizer and nitric acid for its UK agriculture and chemicals customers moving forward.
The company’s proposal to permanently close the ammonia plant at its Billingham complex could result in up to 38 redundancies at the site, in relation to which it will be entering into the required collective redundancy consultation process with its recognised union, Unite, and elected employee representatives. The company anticipates that some of the proposed redundancies might be avoided by redeployment opportunities.
SPAIN Trammo and Iberdrola sign agreement for purchase and sale of green ammonia
Trammo SAS has announced the signing of a framework agreement for the purchase of green ammonia from Iberdrola, a leader in renewable energies with 40 GW of installed capacity worldwide and the ambition to double its current portfolio to 80 GW by 2030.
Trammo expects to purchase and distribute up to 100 000 tpy of green ammonia in Europe starting in 2026 from Iberdrola’s plant in Spain, which will be supported by 500 MW of new renewable energy.
JULY/AUGUST 2023 | WORLD FERTILIZER | 5
USA thyssenkrupp Uhde and Johnson Matthey increase ammonia synthesis capacity at Koch Fertilizer facility
Workingin collaboration, thyssenkrupp Uhde and Johnson Matthey have delivered a product solution to increase the ammonia capacity at Koch Fertilizer’s Fort Dodge, Iowa, USA, facility. During the revamp of the existing ammonia plant, the team integrated the uhde® dual-pressure process, which was installed upstream of the existing ammonia synthesis loop.
Koch Fertilizer performed a US$140 million revamp at its Fort Dodge facility to further improve reliability, environmental and safety performance. The investment is expected to increase ammonia production capacity by 85 000 tpy.
To help achieve the additional capacity, process experts from thyssenkrupp Uhde developed a new cartridge insert for the existing pressure shell based on latest design principles. Thanks to thorough scheduling, most of the installation work was done while the existing plant was running. Commissioning of the new uhde ammonia converter was smooth with Johnson Matthey on-site support, and did not impact plant start-up time.
A key challenge was the very low ammonia synthesis operating pressure of only 960 psig/66 barg, which could be solved by combining Johnson Matthey’s high-performance catalyst KATALCOTM 74-1 with an adapted process design from thyssenkrupp Uhde. This joint solution enabled the increased ammonia synthesis capacity. The same combination of the efficient uhde dual pressure process for ammonia production and KATALCOTM 74-1 catalyst from Johnson Matthey is already used in some of the world’s largest ammonia plants operating with capacities of more than 1 million tpy of ammonia.
Thore Lohmann, Executive Director Fertilizer & Methanol at thyssenkrupp Uhde, said: “We have worked hand in hand with our customers and our partners at Johnson Matthey to make this happen. With our engineering and plant building expertise, we have ensured a smooth integration of the uhde dual pressure process. The same approach can be applied in many other plants as well.”
EUROPE Grupa Azoty Group successfully passes Fertilizers Europe audit for fertilizer products

TheProduct Stewardship Programme audit is an initiative by Fertilizers Europe, an organisation representing the largest European fertilizer producers. The audit reaffirmed that the Grupa Azoty Group’s fertilizer products comply with the highest standards. DNV auditors evaluated various parameters throughout the process, such as the benchmarks implemented during product design, technological processes, distribution, and the genuine fulfilment of fertilizer characteristics declared by the group. The audit covered the main production facilities located in Kedzierzyn-Kozle, Police, Pulawy, and Tarnów.
As a member of Fertilizers Europe, the Grupa Azoty Group is required to partake in recertification audits under the Product Stewardship Programme every three years. The successful completion of such audit confirms that the auditee adheres to the highest international standards in fertilizer production, facilitating the use of advanced production techniques and safety procedures in accordance with European regulations.
WORLD NEWS 6 | WORLD FERTILIZER | JULY/AUGUST 2023 NEWS HIGHLIGHTS Fertiberia to supply green fertilizer to UK retail company ATOME announces update on its Paraguay operations NeuRizer announces significant milestone in the approval process for new urea project ICL provides updates on potash agreement in China Visit our website for more news: www.worldfertilizer.com
BRING YOUR UREA PLANT INTO THE 21ST CENTURY
DEFINING DIGITAL SOLUTIONS FOR FERTILIZER PLANTS
To optimize urea plants for the future, Stamicarbon has a portfolio of digital services to harness the power of real-time data. The real-time plant data will be turned into meaningful information by using urea know-how to enhance the insights and control and drive continuous optimization.
• INCREASE CAPACITY
• REDUCE ENERGY USE
• REDUCE EMISSIONS
• IMPROVE PLANT PERFORMANCE BASED ON PREFERRED KPI’S
• REDUCE PLANT DOWNTIME
• IMPROVE MARGINS
For more information on our Digital Products visit www.stamicarbon.com/digital
Nitrogen technology licensor of MAIRE Group
WORLD NEWS
DIARY DATES
AIChE 2023 Safety in Ammonia Plants & Related Facilities Symposium
20 – 24 August 2023
Munich, Germany aiche.org/conferences/annualsafety-ammonia-plants-andrelated-facilities-symposium/2023
ANNA 2023
10 – 15 September 2023
Varna, Bulgaria anna-eu.com
ANGOLA Minbos Resources Ltd signs MOU with Grupo Carrinho for supply of Cabinda phosphate rock
Minbos Resources Ltd has announced that it has signed a binding MOU with Grupo Carrinho for the supply of Cabinda phosphate rock to be used as fertilizer.
The MOU represents a significant milestone as the first offtake for Cabinda phosphate rock signed with one of Angola’s largest agro-industrial groups.
The fertilizer supply agreement is for up to 869 000 t of Cabinda phosphate rock over the first seven years of production (to 2030), representing 66% of Stage 1 production over the corresponding period.
The MOU includes a proposed pricing mechanism, pegging the relative agronomic effect of Cabinda phosphate rock fertilizer to the price of triple super phosphate. The pricing mechanism is in line with the assumptions used in the definitive feasibility study.
Carrinho has a 1 million tpy grain and oil processing facility in Benguela, fed by a network of silos in the Huambo and Huila Provinces. It is backed by a sovereign guarantee to support the development of the Benguela Facility, providing smallholder farmers with fertilizer and training, enabling them to supply grain and oil seed to the facility.
Turbomachinery & Pump Symposium
26 – 28 September 2023
Houston, Texas tps.tamu.edu
Sulphur + Sulphuric Acid 2023 Conference & Exhibition
06 – 08 November 2023
New Orleans, USA events.crugroup.com/sulphur/home
The MOU outlines that Minbos will supply Cabinda phosphate rock to Carrhino’s Benguela facility, through the Port of Lobito, beginning in the 2023/2024 growing season.
Other key components of the agreement include a technical collaboration with Carrinho and Minbos to optimise the use of the Cabinda phosphate rock, including sharing field trial results, involvement in future trials and demonstrations with small and large-scale commercial farmers.
The MOU is subject to successful Carrinho-Instituto de Investigação Agronómica/Minbos field trials to affirm the suitability of the Cabinda phosphate rock as a fertilizer.
Minbos does not consider this to be a material risk given that it has already demonstrated the suitability and efficacy of Cabinda phosphate rock as a fertilizer in the Minbos-IIA field trials.
Commenting on the MOU, CEO Lindsday Reed, said: “It’s hard to underestimate how important this offtake agreement is for Minbos and our plans to be Angola’s largest supplier of fertilizer. Angola is undergoing a fundamental economic overhaul as the government seeks to diversify its economy away from oil and gas and has agriculture firmly in its sights, with boosting crop yields inextricably linked to food security. This is a proud day for the company as we begin our development and production journey. To have so much of our initial production spoken for by one major partner allows us to plan for new stages and wider customer engagement. We look forward to working in partnership with the Carrinho group and the Angolan government to ensure that our Cabinda phosphate rock fertilizer is applied where it can help. We share their vision and commitment to Angola to contribute to the food and nutritional self-sufficiency of all Angolan people. As the market in Angola continues to develop, we look forward to growing our business with groups like Carrinho with the knowledge that Angola’s agricultural market is in its infancy and, as our fertilizer lifts yields for smallholder farmers, their appetite for our product will continue to grow.”
8 | WORLD FERTILIZER | JULY/AUGUST 2023


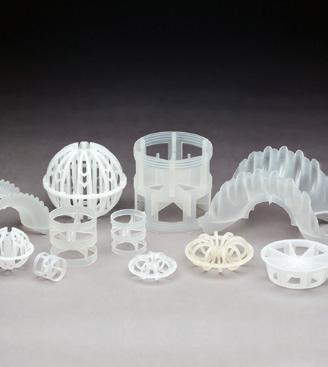
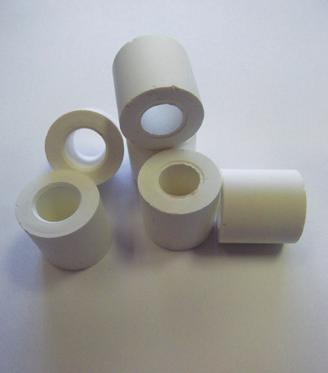
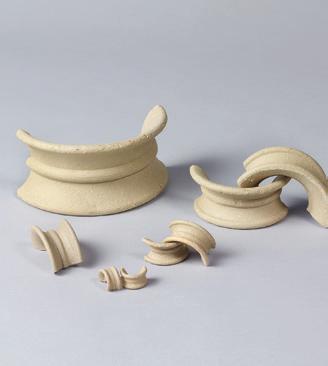

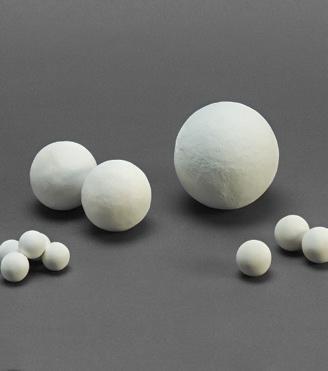
A World Leader in Catalyst Support Media KEY PROCESS COMPONENTS FOR NITROGEN AND PHOSPHATE FERTILIZER PRODUCTION FACILITIES Christy Catalytics, LLC Certified ISO 9001:2015 Tel.: +1-314-773-7500 CATCO@christyco.com www.christycatalytics.com
Arecognition of its role in maximising crop production, to the accelerating adoption of SOP, and more.
Despite these changes, however, one aspect of the industry that has not changed is the role drying plays in bringing this essential nutrient to market.


How the potash market is changing
The potash industry is undergoing shifts of a scale not seen since the switch from leaching and evaporation of potash from burnt wood ash in a pot (hence the name pot ash) to the advent of commercial production methods. Some of the dominating trends currently underway are included in this article.

Shane Le Capitaine, FEECO International, Inc., USA, discusses the critical role of potash drying in a diverse and evolving industry.
10

11
Growing recognition of potassium’s role in crop production
Once outshone by nitrogen and phosphorus, scientists are discovering that potassium plays a more important role in
optimising crop production than initially thought, particularly when it comes to a plant’s ability to tolerate stress.
The nutrient is increasingly being considered a vital ingredient for meeting future global food supply requirements, particularly in the face of climate change.
SOP over MOP
Potash fertilizers have historically been made up of muriate of potash, or MOP. As crop nutrition becomes more specialised, however, sulfate of potash (SOP) is becoming a favoured alternative. SOP boasts significantly reduced chlorides, added sulfur, and lower salinity, making it ideal for many high-value crops.
Wet granulation of potash increasing

The growing demand for specialised fertilizer products has also expanded the market for potash fertilizers produced by wet granulation. An alternative to compaction, wet granulation, also commonly called pelletising or agitation agglomeration, produces a round, granular product that offers many benefits over granules produced via compaction, including faster nutrient delivery.
This change, combined with the increasing use of SOP, has also added to a rise in the use of testing facilities such as the FEECO Innovation Center, where potash fertilizer granulation and drying process parameters can be tested and refined to produce a product with the desired specifications.
New players hitting the market
While Canada remains the largest potash producer, newcomers are vying for market share, with Australia and Africa working quickly to develop their own domestic industries in the wake of growing demand.
From mine to market: Drying occurs multiple times
Drying remains one of the most important steps in bringing mined potash to market, no matter where it is mined, or what form it is in, occurring several times throughout the path of potash from mine to field.
On the mining side
Most MOP and SOP fertilizers are produced using large evaporators to produce the crystal, which eventually gets dried further in a centrifuge. After the centrifuge, the remaining moisture is typically dried in a rotary dryer prior to further processing.

Drying accomplishes a few crucial objectives as discussed below:
Reduced shipping costs
When working with material at the capacities required by the fertilizer industry, small costs quickly add up, and paying to ship water infringes on profits.
Potash miners therefore dry their product in order to minimise shipping costs and ensure economic efficiency.
Preparation for fertilizer production and caking prevention
No matter how potash will be further processed for use as a fertilizer, a dry and consistent product is essential.
12 | WORLD FERTILIZER | JULY/AUGUST 2023
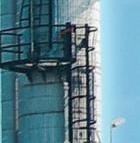
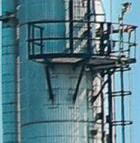
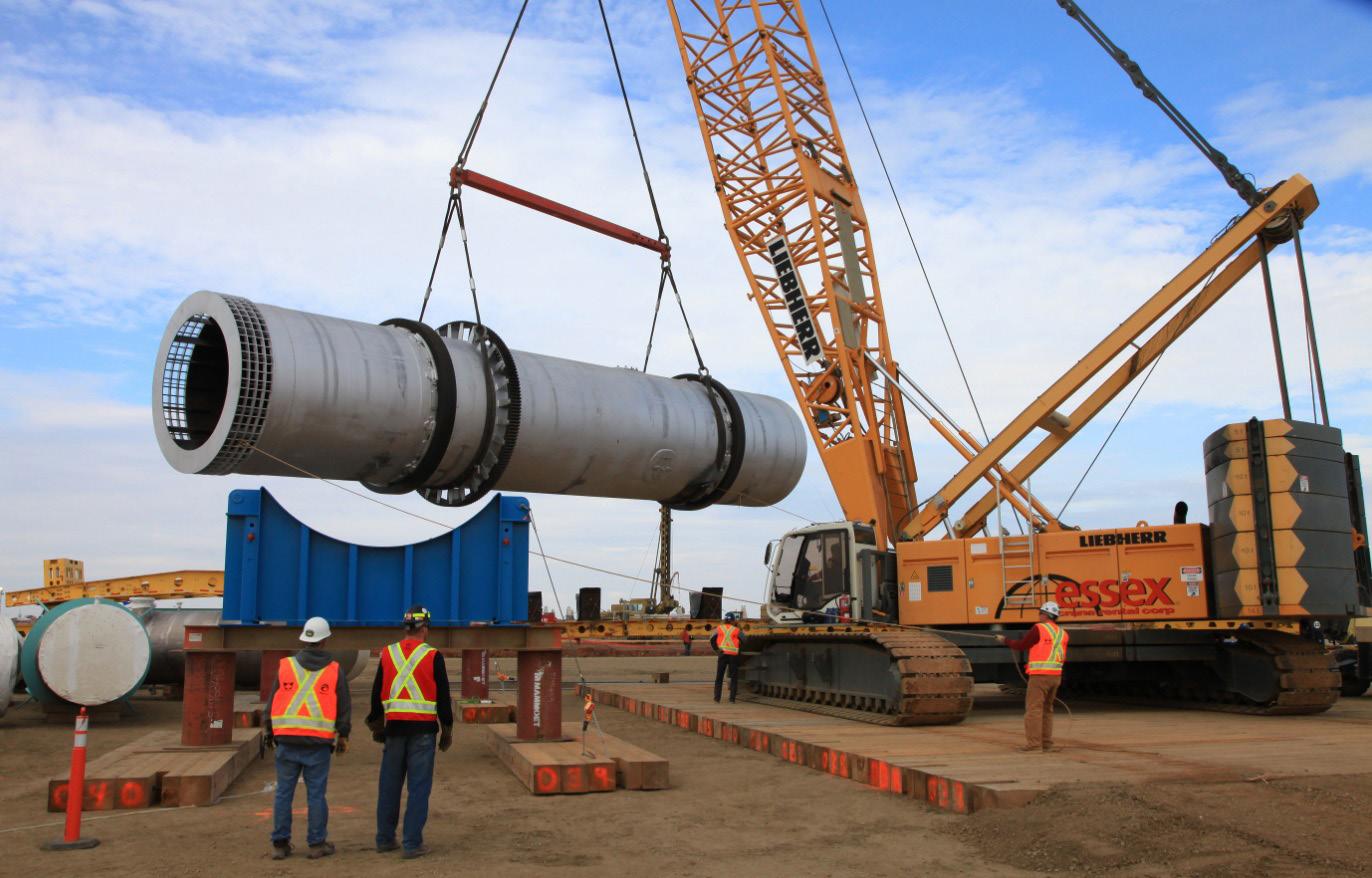
Figure 1. Potash dryer being prepared for installation.
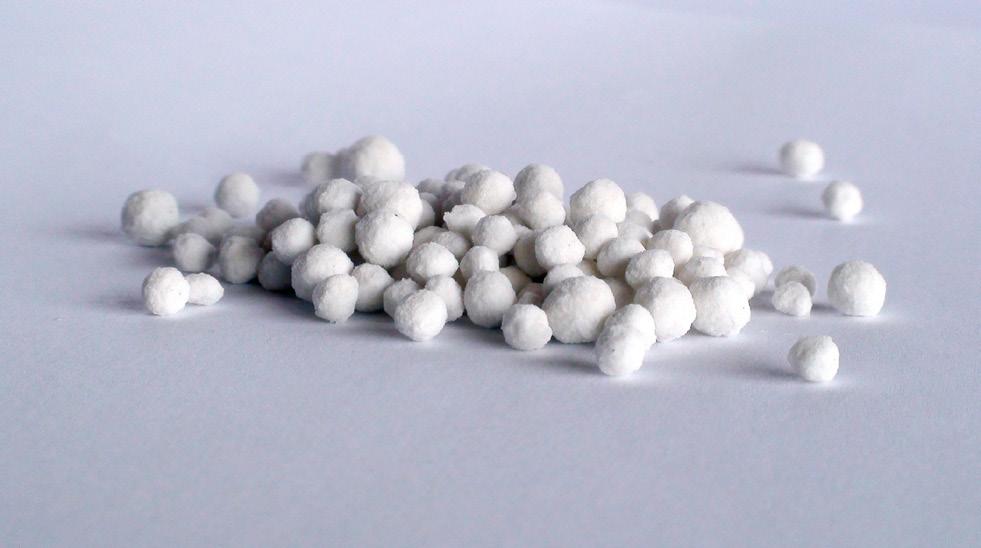
Figure 2. SOP prodcued via wet granulation.
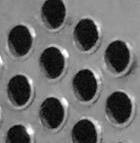
Figure 3. Glazed potash compaction granules.
Figure 4. Potash dryer prepared for shipment.
Invisible. Invaluable.
Black & Veatch has over 80 years of experience executing projects that maximize throughput and uptime on facilities’ operating assets. With minimal disruptions to operations, we work behind-the-scenes to complete projects safely, on time, and to the highest quality standards.
• From front-end project phases to full EPC, Brownfield to Greenfield.
• Plants completed in sizes ranging from 50 to 2,500 metric tons per day.

• Projects include studies, revamps, ammonia storage, and terminal facilities.

Let’s find ways to help you.
Wet feedstock would not only clog up production equipment, but it would also allow material to cake during shipping or storage.
Caking is not only a nuisance, but it is also a danger in that it can cause unpredictable breakaway of pile sections, endangering nearby workers. A caked feedstock also prevents consistent metering into the production process.
On the fertilizer production side
Drying is also a vital step in producing a finished fertilizer product acceptable to the market. Both SOP and MOP may be processed by either compaction granulation or wet granulation. And while drying is not always required in compaction granulation circuits, it can help to improve product quality.
How drying is used in the compaction process
Though not always used, some compaction processes employ a drying step that can produce a superior product. This is carried out through a finishing step referred to as glazing.
Granules coming off of the compaction line are fed to a dryer, and water is sprayed onto the heated product, which, upon flashing off, creates a recrystallised surface on the granules that fills in surface cracks and is much less prone to degradation and attrition.
How drying is used in the wet granulation (agitation agglomeration/pelletising) process
All potash production lines employing wet granulation require a drying step after granule formation. As a wet agglomeration technique, granule formation occurs in part as a result of a liquid binder being added. This binder not only helps to facilitate agglomeration, but it also helps to meet the required end product crush strength.
Because this liquid binder is added, a subsequent drying step is needed to dry the product for bagging, storage, or transport. If the product was not dried, caking would be inevitable, shipping costs would be higher (not to mention inefficient), and the product would not hold its form throughout subsequent handling and storage. Drying also helps to discourage growth of bacteria in the product.
Design aspects of a high-performance potash dryer
Drying plays an integral role in bringing a quality potash product from mine to market. When coupled with potash’s challenging characteristics and a high-capacity production setting, the essential nature of the drying process necessitates a properly designed dryer, whether for use at the mine site or the fertilizer production plant.
A poorly designed potash dryer will not only be unable to withstand the rigours of potash processing, but also has the potential to impact product quality. For these reasons, the industry tends to favour rotary dryers for carrying out their potash drying needs. The following should be considered in designing a rotary dryer for potash:
Materials of construction
Potash, whether in the form of SOP or MOP, is notoriously corrosive, with the potential to cause significant damage. In addition to corrosion, impurities in SOP and MOP can also be a concern. It is therefore imperative to select adequate materials of construction during the design stages.
14 | WORLD FERTILIZER | JULY/AUGUST 2023
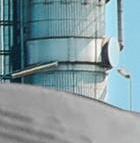
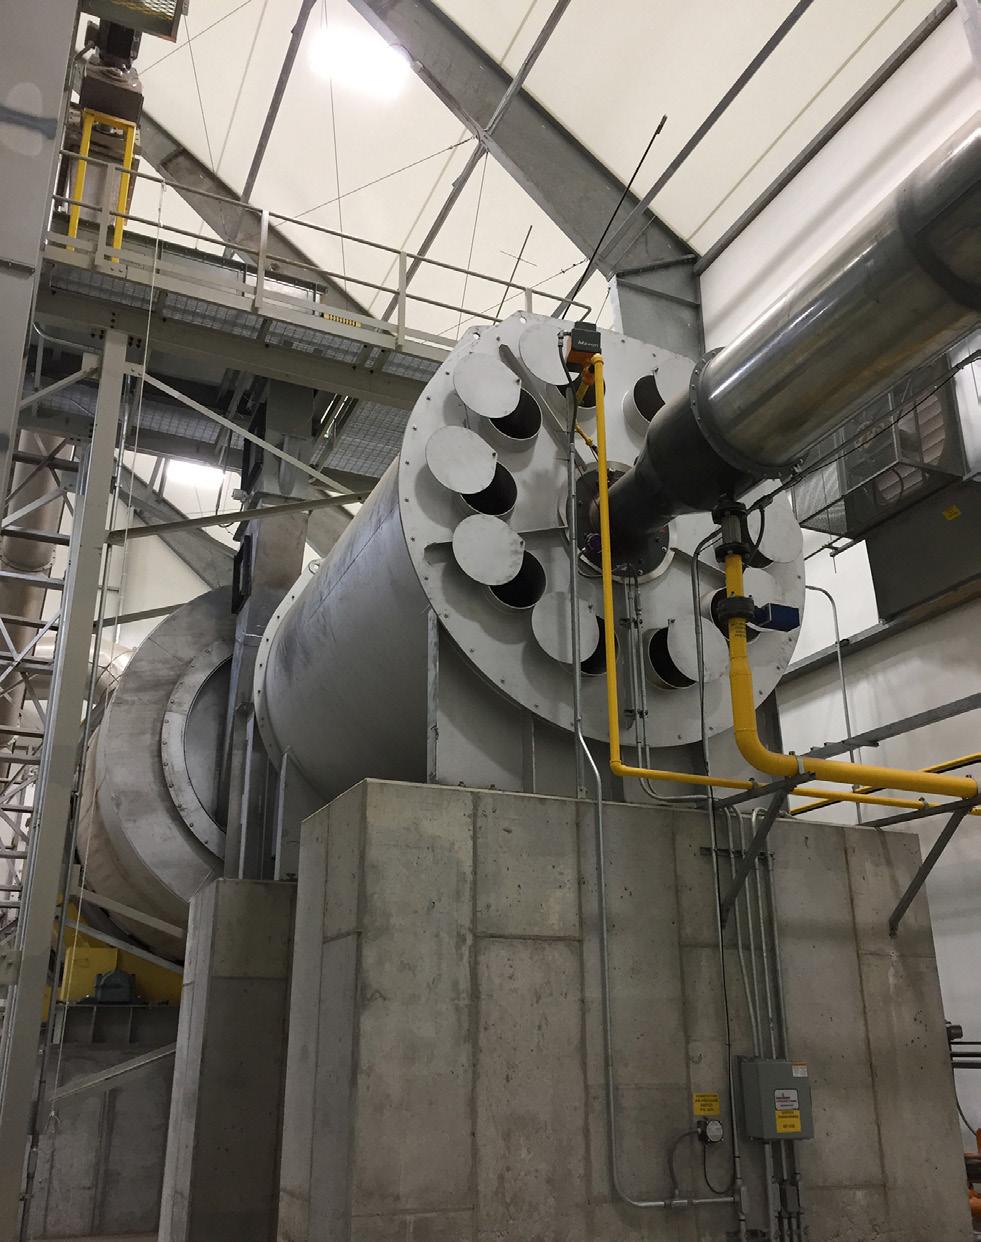
Figure 5. Burner and combustion chamber on a rotary dryer.
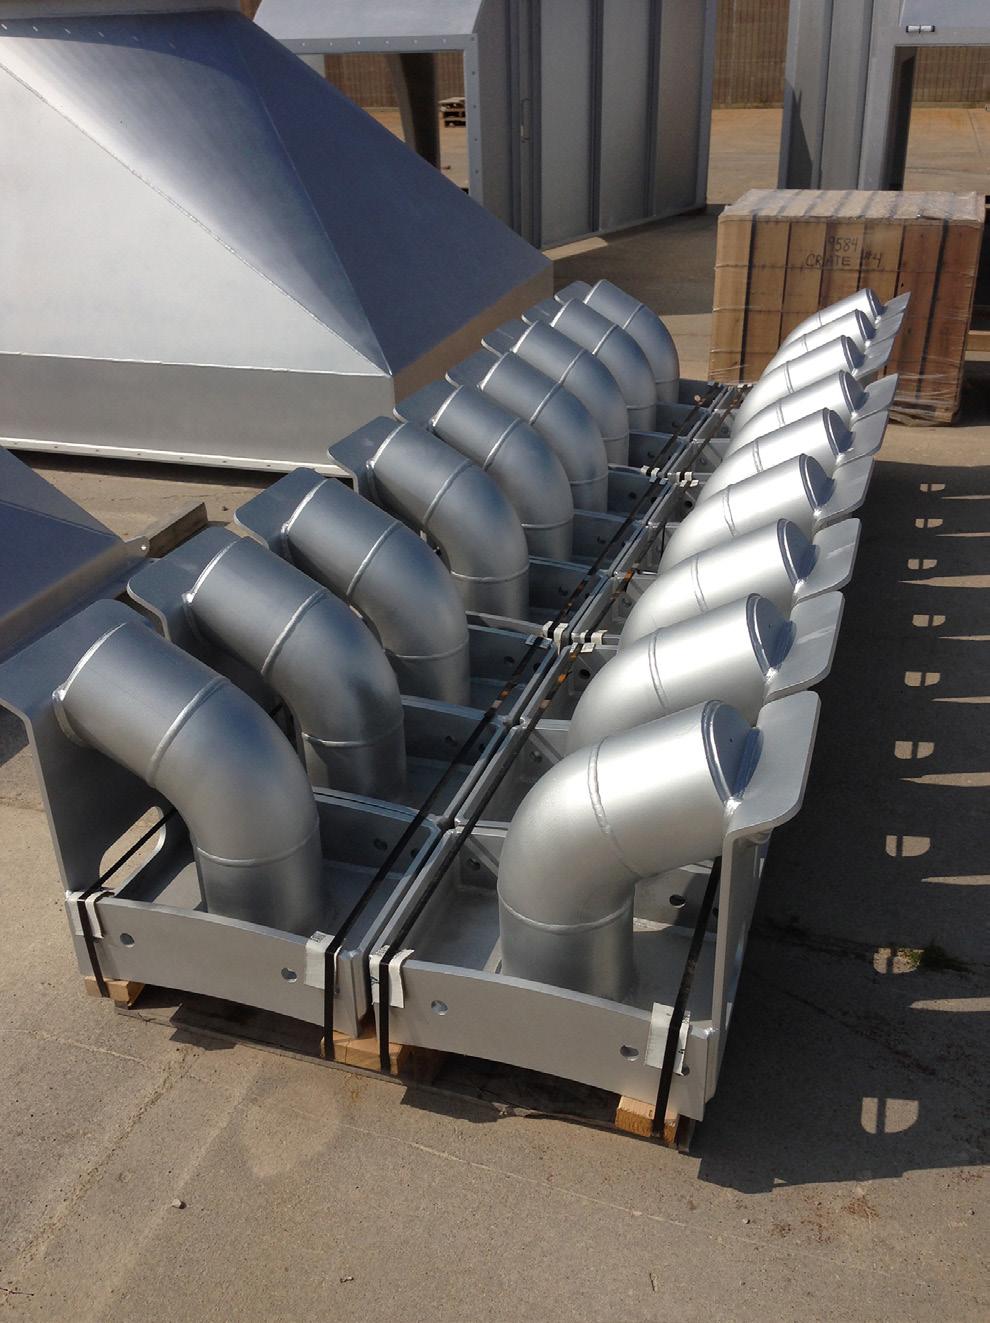
Figure 6. Ball and tube-type knocker assemblies being prepared for shipment.
As such, all or a portion of most potash dryers are constructed of stainless steel or nickel alloys. Such materials are much more effective at preventing corrosion than the traditionally chosen carbon steel.
Airflow configuration
Potash is prone to discolouration and degradation during the drying process, both of which lower its market value. To maintain product integrity, potash dryers should be designed with a co-current or parallel airflow, in which the material and products of combustion move through the drum in the same direction.
This co-current configuration prevents potash from becoming overheated and degrading. In contrast, a counter-current airflow would put potash in contact with the hottest air at its driest point, creating the opportunity for overdrying, discolouration, and attrition.
Potash dryer add-ons
In addition to the design considerations mentioned above, potash dryers are also typically equipped with the following for optimal processing:
Combustion chamber


A combustion chamber, incorporated into the inlet end of the dryer, promotes product integrity by preventing direct contact between potash and the burner flame. Combustion chambers house the combustion reaction and resulting flame, which could otherwise cause degradation or risk overdrying.
Knockers
Potash is also prone to clumping and build-up during the drying process. To mitigate this, dryers are equipped with knockers. While various designs are available, all knocking systems serve to ‘knock’ the drum as it rotates, dislodging any material that may be sticking to the interior of the drum shell. A wear plate protects the outside of the drum shell.
Screw conveyors are also sometimes employed in the fight against clumps and back spill at the inlet, as they can be used to ‘throw’ material into the dryer, breaking up any clumps and keeping the material away from the inlet of the dryer.
Conclusion
The diverse and evolving nature of the potash industry has resulted in many changes, but the critical role drying plays at both the mine site and fertilizer processing plant remains unchanged. Whether producing SOP or MOP, drying at the mine site helps to reduce shipping costs and provide a product suitable for fertilizer production, while drying at the fertilizer plant ensures the product is produced in alignment with continuously rising market standards.
Producing premium potash fertilizer products depends largely on the drying process, but dryers must be designed to handle the corrosive and clumping-prone nature of potash, with careful consideration given to the materials of construction, airflow configuration, and dryer components.
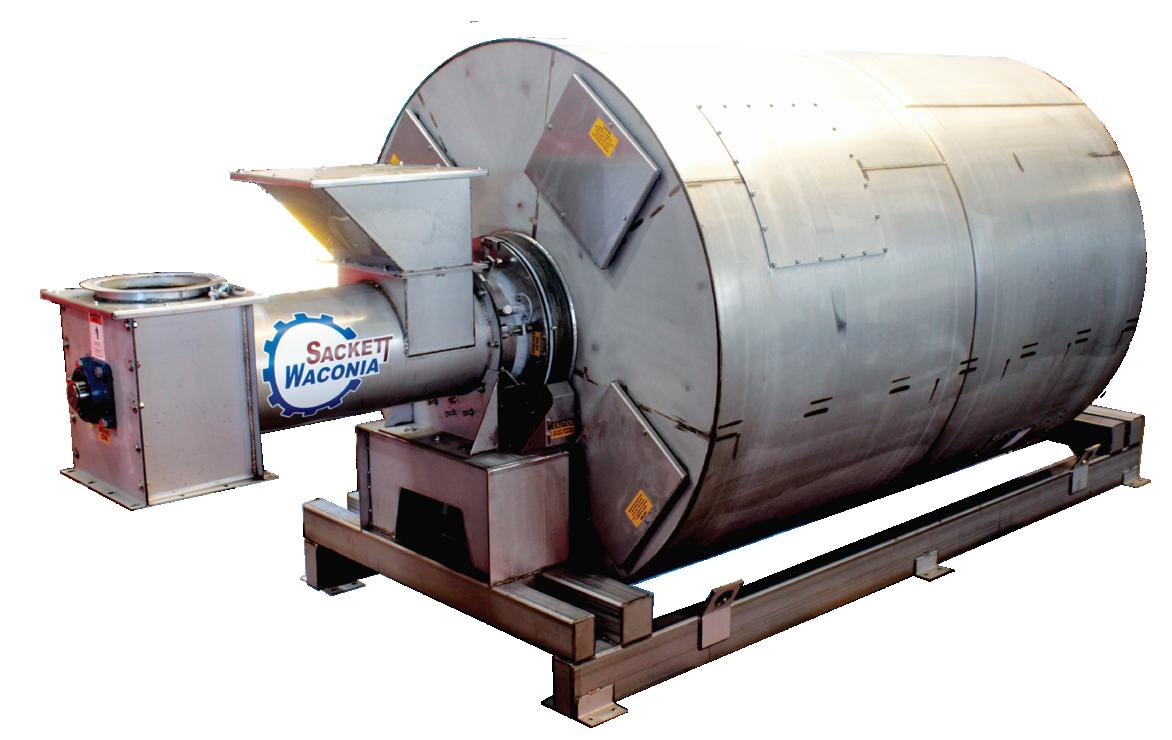
The Orbital Mixer
Delivers flexibility, quality and consistency, a premium batch blender, The Orbital Precision Blender can meet the needs of agriculture today
Precision blending is only possible using complete circulation. The orbital mixers tumbling drum uses a unique baffle system to eliminate unmixed pockets of fertilizer ingredients to deliver precision blends or to eliminate pockets of unmixed ingredients. This tumbling drum uses a unique baffle system and trough to simultaneously carry and pass materials, distributing even micro and trace ingredients.
Short, effective blending cycles ensure products that maximize nutrient use efficiency whether being used in tower systems, AccuBlendTM systems or standalone floor arrangements. The coating and impregnation blend quality of the Orbital is excellent for bagging operations.
Precision solutions by SackettWaconia.com Precision-Crafted Batch Blending Technology 1701 S. Highland Ave • Baltimore, MD 21224 • (410) 276-4466 680 Tacoma Blvd • Norwood Young America, MN 55368 • (952) 442-4450
A PUSH
TOWARDS digitalisation
Luc Dieltjens, Stamicarbon, the Netherlands, outlines the benefits of moving towards digitalisation in the fertilizer industry in order to ensure a more sustainable future.
Before looking into digital solutions, it is important to examine the factors driving the push towards digitalisation. Upon analysing the process, three primary drivers can be identified.
Firstly, there is the need for an efficiency increase. For centuries, people have tried to increase productivity by approaching things in a smarter fashion, achieving the same (or more) with less effort, and lowering the whole cost of the process.
Secondly, there is the opportunity factor, allowing industries to expand the possibilities of technology and do things that could not be done before, achieving new targets and increasing the value of product, consequently generating additional revenues with less impact on the environment.
Finally, more and more can and will be done by machines (computers, robots, automated tools etc.) and less by man, although good cooperation between the two is still inevitable. It is, meanwhile, generally accepted that machines take care of routine and repetitive jobs, while people are still taking care of creativity and improvisation to develop new things. The digitalisation process could only have progressed with technical and technological developments.
The Stami Digital Process Monitor is an example of digitalisation in the fertilizer industry. It could potentially enable an increase in plant capacity and reduced energy consumption, while aslo reducing environmental impacts, unlocking incentives for carbon emissions reduction. Using the Stami Digital Process Monitor as a case study, this article discusses how digital solutions can support the industry's journey toward a more sustainable future.
Looking at plant models
Urea producers increasingly recognise the substantial value of employing virtual plant models in both offline and online model-based applications to reach extensive process knowledge.
Different classes of models can be developed based on the level of prior knowledge, including knowledge-driven models, data-driven models, and grey-box models. Knowledge-driven models, also called first-principle models, are developed based on first
16
17
principle analysis and, therefore, require full phenomenological knowledge about the underlying mechanisms. In contrast, data-driven models, also called black-box models, are proposed for situations in which the physical understanding of the urea process is absent or irrelevant (these models are based on experimental data fitted to (typically) simple equations). There are many possible combinations of knowledge-driven and data-driven models between the two extremes. The prior knowledge offered by the simplified first principles analysis
forms the core of a so-called grey-box model, while data-driven methods can compensate for fractions that cannot be modelled efficiently in terms of phenomenological models.
A process model of the urea plant, serving as the engine of the Stami Digital Process Monitor, is purely knowledge-driven. The mathematical model developed includes mass and heat transfer equations, reaction kinetics, vapour-liquid equilibria, and hydrodynamic aspects and covers the entire plant. In total, the plant model consists of more than 5000 linear and non-linear equations. An equation-oriented flow sheeting program ensures fast solutions to large and complex problems.
Digital plant architecture
Depending on different requirements, the Stami Digital Process Monitor architecture can enable various functionalities, including real-time optimisation, predictive control, data reconciliation, virtual (soft) sensors, process performance monitoring, and comprehensive plant monitoring systems.
As illustrated in Figure 1, the real-time plant data is unidirectionally communicated to the process monitor engine, which runs in a secured cloud environment. The plant data is processed by the plant model, which calculates the KPI and soft sensor key variables and is made available to the plant operators and all other stakeholders.
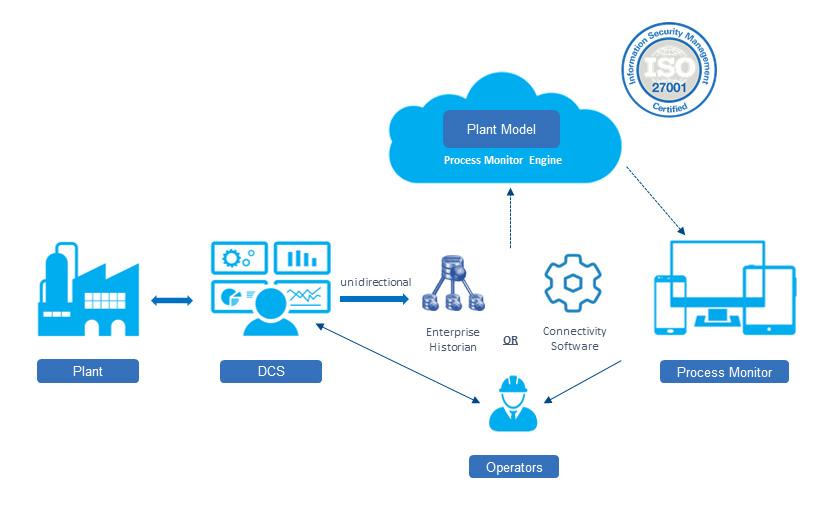
The process monitor feeds the real-time data of a urea plant to a rigorous plant model, which calculates KPIs, such as plant load, energy consumption and emissions, as well as a variety of soft sensor key variables such as equipment efficiency, equipment load, and reactor load, and shows them on a dashboard.
Designing the model
The production of the plant model for Stamicarbon's process monitor consists of two steps: the consulting phase and the data reconciliation phase.
The project starts by conducting interviews with plant experts and operators as they play a key role in exploiting historical data. The experiences and expertise of those involved in day-to-day operations provide valuable insight into relevant process changes and the performance of measuring devices, etc. An in-depth analysis of the plant operation can be made with a validated plant model and historical plant data. The report will generally provide information on several aspects, including the evaluation of plant sensors, identification of plant constraints along with proposed solutions, assessment of achieved operation in relation to key variables, analysis of low-frequency oscillations and disturbance rejection (such as day and night rhythm), as well as recommendations for improvements.
At the data reconciliation stage, historical DCS data is collected from the operation and subsequently used to validate the model to ensure that it represents the process accurately. The measured data typically contains random errors and, less frequently, may also contain systematic errors. The role of the data reconciliation is to identify and correct deviations and therefore provide reliable information for updating the model parameters or to conclude systematic sensor errors.
For process control engineers, offline validation can be viewed as a feedback process, aiming to bring the model predictions on target to the process measurements. This is similar to how feedback is used in a control application to bring
18 | WORLD FERTILIZER | JULY/AUGUST 2023
Figure 1. Stami Digital Process Monitor architecture.
Figure 2. Reactor temperature validation.
180 186 time DCS MODEL Reactor temperature 185 184 183 182 181 degr.C Key variables Equipment: stripper Stripper efficiency 06-06-2019 21:05:09 0.78 mol/mol Here’s an oversight of all key variables. Stripper tube load 06-06-2019 21:05:09 73.97 kg/h/tube Equipment: LPCC LPCC N/C ratio 06-06-2019 21:05:09 1.912 mol/mol LPCC crystallization temperature 06-06-2019 21:05:09 79.3673 degC Equipment: reactor LPCC N/C ratio (mol/mol) Reactor H/C ratio 06-06-2019 21:05:09 0.4610 mol/mol Reactor inert pressure 06-06-2019 21:05:09 633671.113 bara Reactor yield 06-06-2019 21:05:09 100.59 t/h 1.0 1.5 2.0 Oct 17, 2019, 1:04:00 PM LPCC N/C ratio (mol/mol): 1.727
Figure 3. Soft sensor key variables.
AMMONIA STORAGE TANKS
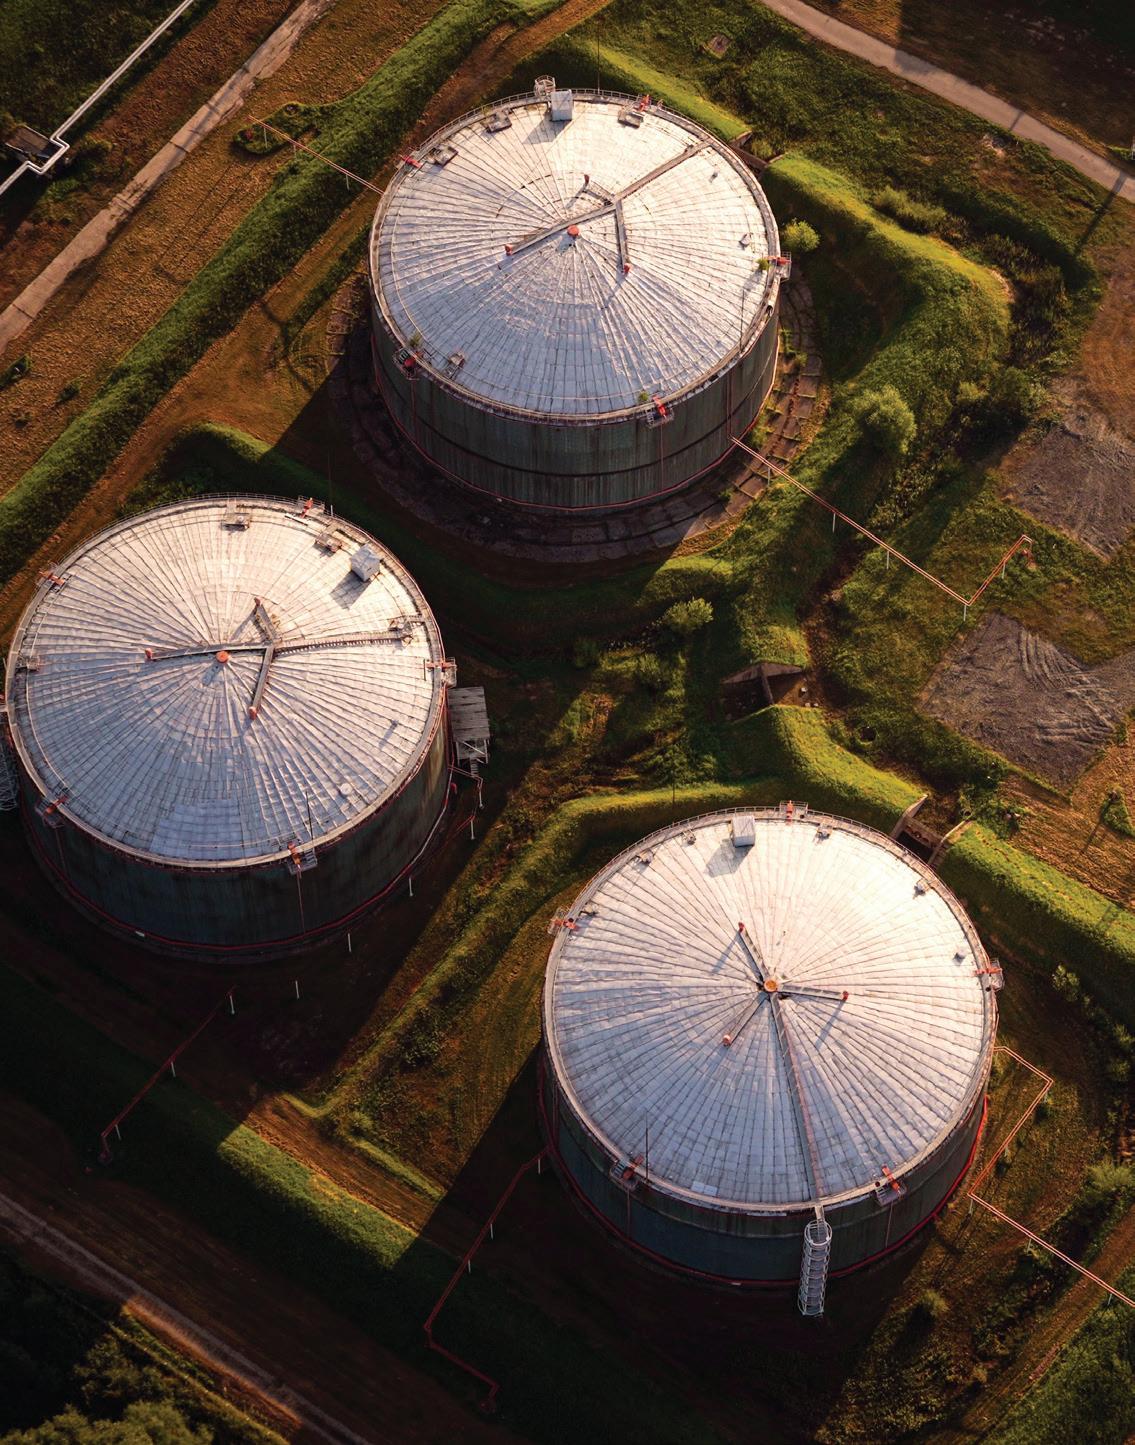
Maximize Reliability and Efficiency with a Comprehensive Solution to your Ammonia Tank Inspection Program
Ammonia storage systems carry significant consequences, making thorough inspections crucial. Determining the right inspection strategy for a particular tank can be difficult when balancing inspection techniques with any identified damage to date and potential damage mechanism propagation. With E²G | The Equity Engineering Group, Inc., you can gain confidence in your ammonia tank inspection strategy and frequency. Our comprehensive approach enhances confidence in inspection results, empowering you to make informed decisions.
E²G delivers a multi-disciplinary approach that leverages API 581 risk-based inspection (RBI), European Fertilizer Manufacturer’s Association (EFMA) qualitative RBI, advanced probabilistic analysis, and finite element analysis (FEA) to offer a better understanding of the expected probability of failure.
Choose E²G for an optimized ammonia tank inspection strategy that is focused on safety and reliability.
SERVICE AREAS
⊲ Risk-Based Inspection (RBI)
⊲ Tank Fitness-for-Service (FFS)
⊲ Damage Mechanism Reviews
⊲ Finite Element Analysis (FEA)
⊲ Structural Analysis
BENEFITS
REDUCE RISK OF UNEXPECTED FAILURE INCREASE
REMAINING LIFE
OPTIMIZE
OPERATIONAL
TANK
SAFETY IMPROVE
DESIGN
ANSWERS FOR TODAY. INSIGHTS FOR TOMORROW. P: +1.216.283.9519 © 2023 E²G | The Equity Engineering Group, Inc. VISIT CONTACT OUR TEAM www.E2G.com Sales@E2G.com
measured values to requested target values or within ranges. A validation example is illustrated in Figure 2.
The urea reactor outlet temperature is typically a critical variable in urea synthesis (Figure 2). To some extent, it represents urea conversion in the reactor, assuming other interacting variables are constant. The plot shows the model-predicted temperature compared with the DCS reading over a period of two weeks. Accuracy is the level of agreement between the predicted and DCS values, while reliability is the degree to which the prediction errors vary.
The accuracy of identification and reliability of validation are sensitive to the size of the corresponding datasets. The required size of the historical data is typically one to two months.
Once the advanced consult and validation phases have been completed, the Stami Digital Process Monitor provides real-time KPI, soft sensor key variables information, and real-time insights, that will help to maximise efficiency and increase production.
Soft sensor key variables
Key variables (KVs) characterise the technical and economic performance of the urea process. Once KVs are fixed, the
operating points are fixed. KVs are normally determined by offline sample analysis in a laboratory. One of the drivers of process modelling was to give operators and process engineers a reliable and accurate estimation of key variables. This would allow them to arrive at the optimum operating point and assist them in troubleshooting activities. For example, the urea yield in a reactor is fully characterised by its key variables N/C, H/C, retention time, and system pressure. Only N/C can be measured in real-time, whereas H/C and system pressure are determined by offline sample analysis in a laboratory. Calculation of retention time would require a total mass balance calculation over the reactor.
The Stami Digital Process Monitor produces these real-time soft sensor key variables (Figure 3), enabling advanced process monitoring and optimised control of urea plants.
Troubleshooting
The Stami Digital Process Monitor also provides means for troubleshooting the plant operation by comparing the plant DCS values with those calculated by the plant model, as per the example shown in Figure 4.
In the trend graph, the DCS data is shown in blue, and the values calculated by the model are shown in black. It was found that a flush valve unintentionally remained open, which explained the relatively large difference shown in the highlighted area. Stamicarbon's technology will immediately show such a difference, which will trigger the plant operator for corrective actions and prevent unnecessary loss of production.
Another troubleshooting example is shown in Figure 5. In this case, the trend shows a constant offset between the compressor load as per the DCS value shown in red, and the value calculated by the process model. The root cause of this particular offset was found in a wrongly configured density compensation of the orifice. As a result, the compressor can be pushed to a higher capacity, leading to a higher plant load.
Features
The process monitor provides a range of features, including real-time monitoring of all key variables in the plant, reducing the need for offline laboratory analyses, reliable real-time monitoring of ammonia emissions to comply with stringent regulations duplication of sensors by the model to identify deviations, addition of a soft N/C meter for specific plant configurations, and prediction of flammability limits in the absence of a hydrogen converter, supported by a dynamic graphical interface displaying the operating point relative to the flammable area. Altogether, these features allow producers to achieve sufficient savings and boost efficiency, reliability and safety.
Conclusion
The availability of technology to process plant data can be used to optimise urea plant operations. Stami Digital is an example of this and can help producers to train employees, improve plant effectiveness and boost plant productivity through remote guidance, process monitoring, automatic plant optimisation and process simulation. With the current focus on efficiency and sustainable transformation, moving towards digitisation in the fertilizer industry can enable increased plant capacity, and reduce energy consumption, holding significant potential for increasing plant safety, minimising environmental impact, and unlocking incentives for carbon emission reduction.
20 | WORLD FERTILIZER | JULY/AUGUST 2023
Figure 4. Troubleshooting – feed stream to the wastewater section.
density compensation
Benefit: Revamp possibilities.) 0 0 200 400 600 800 1000 1200 1400 60000 kg/h hours DCS MODEL 50000 30000 40000 20000 10000 Operator forgot to close flush valve 0 1 19 37 55 73 91 109 138 156 174 194 212 230 271 289 307 325 343 361 379 397 415 433 451 469 487 5 50 t/h time DCS MODEL Compressor load Root cause: Wrong density compensation for orifice Benefit: Revamp possibilities 45 40 35 30 25 20 15 10
Figure 5. Troubleshooting – compressor load offset. (Root cause: Wrong
for orifice.
ACCELERATING THE PACE OF CHANGE

Fernanda Martins and Stephen Reynolds, AVEVA, Brazil and USA, discuss the role of digital solutions in accelerating the pace of change in the ammonia industry.
The commercial use of green ammonia, or renewable ammonia, started a little over a century ago. Initially it was popular in areas where hydropower was largely available, but it was replaced by fossil-fuel based ammonia in around 1960 due to economic reasons. Ammonia has played an important role in food security worldwide, mostly being produced to meet agricultural industry demand.1
Lately, with the increasing pressure for carbon abatements, green ammonia is attracting investments again and the ammonia market is expected to triple by 2050.2 Green ammonia can be an important vector to the energy sector, and its use is expected to be diversified.
Between now and 2050, clean ammonia (blue and green) should rise as a critical decarbonisation solution, not only to produce fertilizers but also for industrial applications, shipping fuel, hydrogen carrying and power generation.3
While green ammonia appears to be a great pathway towards a sustainable future, operators will have to improve the infrastructure required to increase production at scale.
Multiple organisations, such as industrial companies, technology and software providers, governments, and research institutions, will need to work together to transform the energy sector, and reach their net zero goals.
Digital solutions will play a critical role to
help accelerate the pace of change as it can bring all pieces of the solution together. Areas that can be directly improved by digital solutions include:
n Speeding up engineering from the conceptual phase to full capacity to support the rapid scale of new facilities and infrastructure.
n Increasing the predictability of critical assets to ensure reliable supply.
n Improving data management and information sharing across the multiple players within the ecosystem.
Scaling up new facilities and infrastructure
Investments in new facilities and infrastructure to produce green ammonia
21
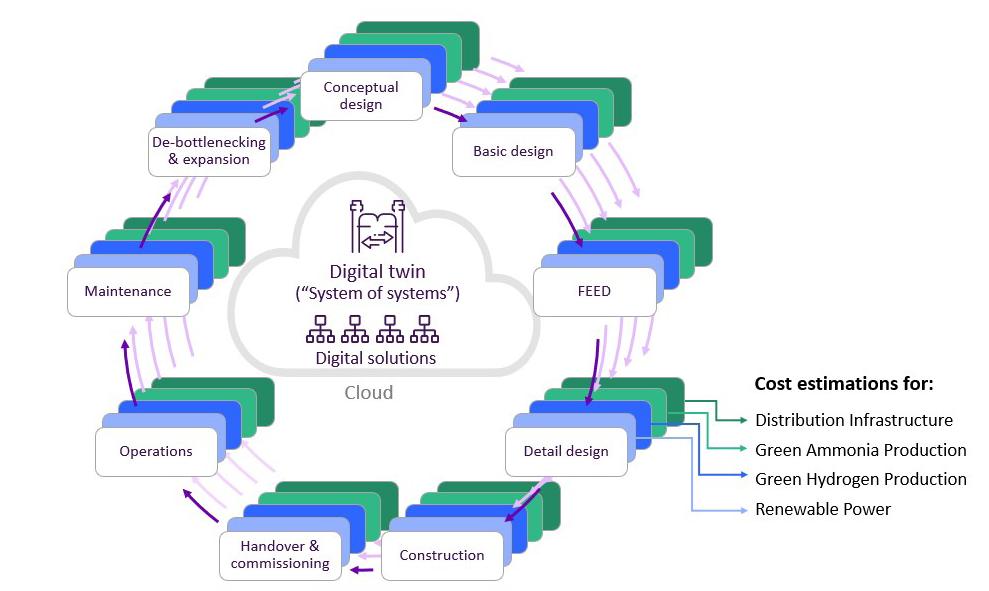
implicates the need for major CAPEX projects. The feasibility evaluation must consider the construction of new facilities and adaptation of existing ones to deliver a complete chain that will include renewable power generation, electrolysis for hydrogen production, ammonia process and infrastructure for distribution. Beyond evaluating cost-effective designs, the levelised cost of ammonia (LCOA) must be considered. The LCOA will include all layers of costs, from conceptual design to full operations and maintenance for the elements in the ammonia production chain. The first version of the digital twin is based on process simulation and master planning models, all integrated in the same digital platform. The LCOA then accounts for the potential production demand, with the potential renewable energy supply across the year based on historical weather variations.4 The digital twin will evolve through the project lifecycle as more information is available (Figure 1).
The multiple phases of these complex CAPEX projects generate iterative processes to validate previous assumptions at
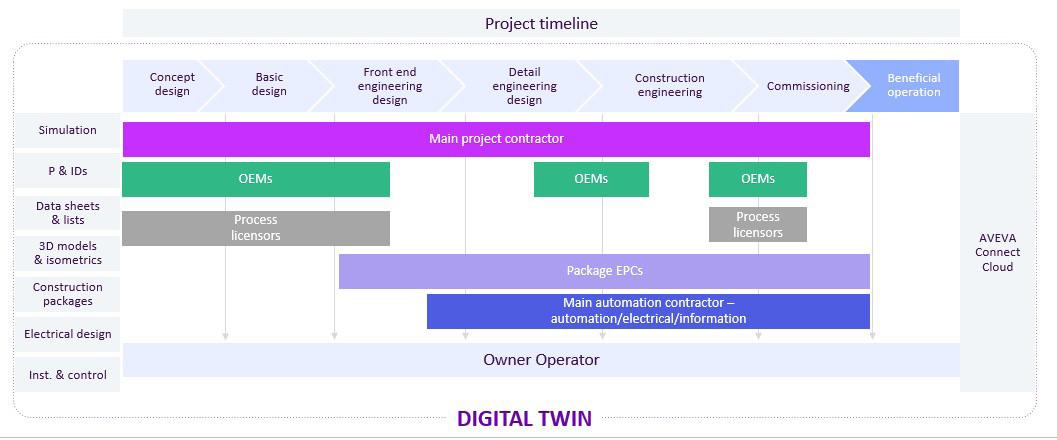
every step. Conventionally each phase can be handled by a specific set of digital solutions, such as process simulators, 3D software and engineering databases, among others. This is still true today, but the digital package for each phase can be completely integrated using a common platform in the cloud, enabling a data-centred approach. When a common set of data is available in the cloud connecting all the required digital solutions, all the relevant parties work with the same information and towards the same goals through a reliable digital twin.5 The phrase 'all parties' refers to the parties inside of the engineering, procurement and construction (EPC) companies (process, mechanical, instrumentation, engineers, managers, etc). and outside of the EPC (other EPCs, process licensors, OEMs, the main automation contractor, and the owner operator). Figure 2 demonstrates how all the companies involved in the project rely on different information for each phase of the project.
The digital twin built in the engineering phase helps increase collaboration and information access and reliability.
Organisations that adopt this digital engineering approach can:
n Significantly increase engineering efficiency with less rework.
n Improve design quality since the tools and time are available to evaluate better options.
n Ensure the project is executed on time and budget.
n Improve on start-up and commissioning (15% improvement on schedule4) and better handover to operations through an effective digital package.
n Extend the value of digital investments since the engineering digital package can be quickly connected to operational data after the plant’s start-up, improving both operations and maintenance.
Ensuring predictability and reliability
A critical element to ensure that the clean ammonia production responds to market demand is the reliability of the renewable power supply. For this, two modelling approaches can be used:
Rigorous process simulation combined with weather prediction
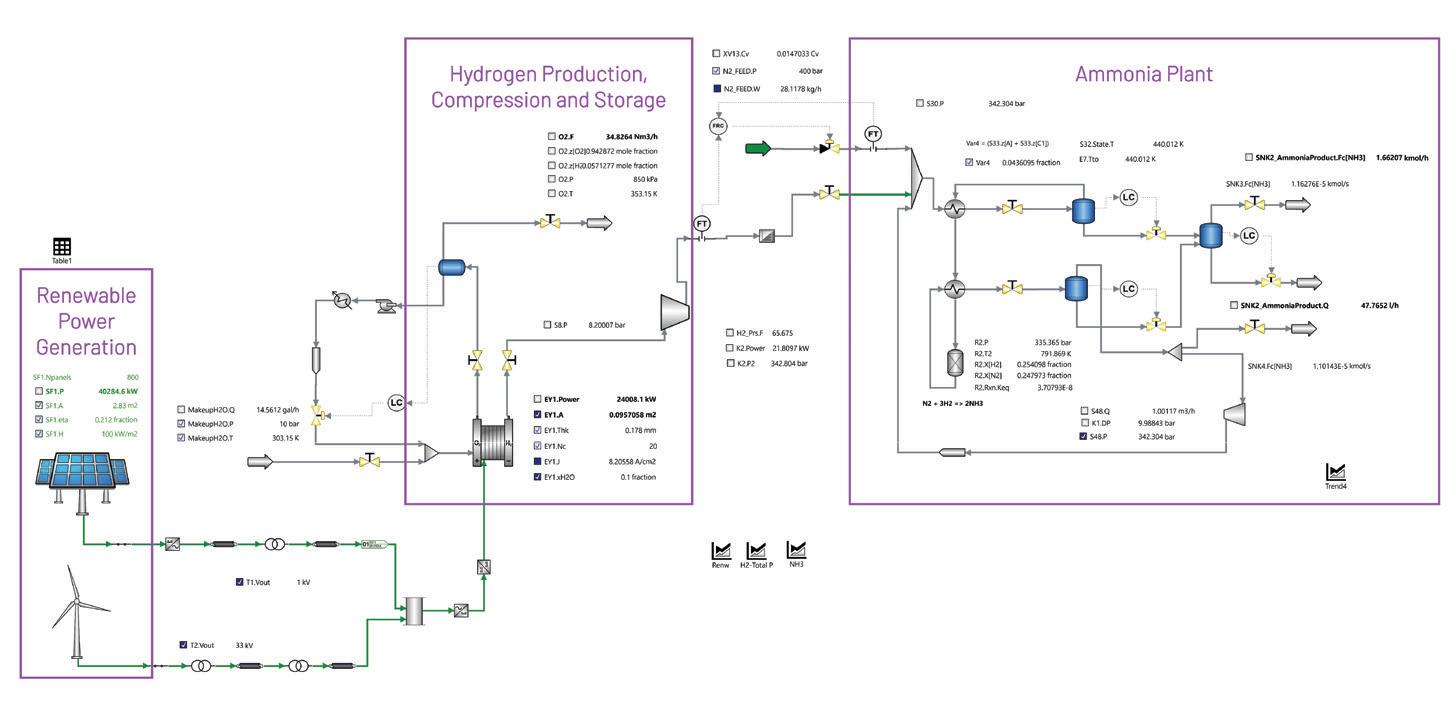
If the digital engineering approach is being used, the owner of the plant will have a detailed process simulation model containing renewable power generation, and hydrogen and ammonia processes. By connecting the simulation with the weather prediction, it is possible to estimate renewable power generation for both solar and wind types, and clarify whether green hydrogen will be available at the required level or not. If demand is lower than desired for a given period, then the decision can be made in advance to acquire electric energy from another source or, to use blue hydrogen instead to ensure the most cost-effective solution every time. The digital twin that is initially configured to estimate the LCOA can be used in the operational phase to evaluate the operational costs when needed. Figure 3 presents the complete simulation of the clean ammonia production chain, from renewable power generation to hydrogen and ammonia production (simplified version).
22 | WORLD FERTILIZER | JULY/AUGUST 2023
Figure 1. First digital twin: cost estimation structure.
Figure 2. Project timeline and relevant players.
Figure 3. Simulation of the clean ammonia production chain (simplified version).


Creating A Better Tomorrow SAFER, FASTER, EASIER CONNECTIONS All you need is an impact driver for chain assembly • Safer installation • Faster maintenance • Easier field connections Regal Rexnord, RexPro, Rex, Browning, Link-Belt, McGill, Rollway, Sealmaster and TB Wood’s are trademarks of Regal Rexnord Corporation or one of its affiliated companies. © 2022, 2023 Regal Rexnord Corporation, All Rights Reserved. MCAD23044E • Form# MB0139E Mechanical Components • Belts + Sheaves • Bushings • Torque overload devices • Idlers Bearings • Mounted • Unmounted • Specialty Industrial Chain • Engineered • Roller • Leaf • Traction Wheels + Sprockets Additional products engineered for strength and durability To learn more and schedule a demo visit: regalrexnord.com/RexPro
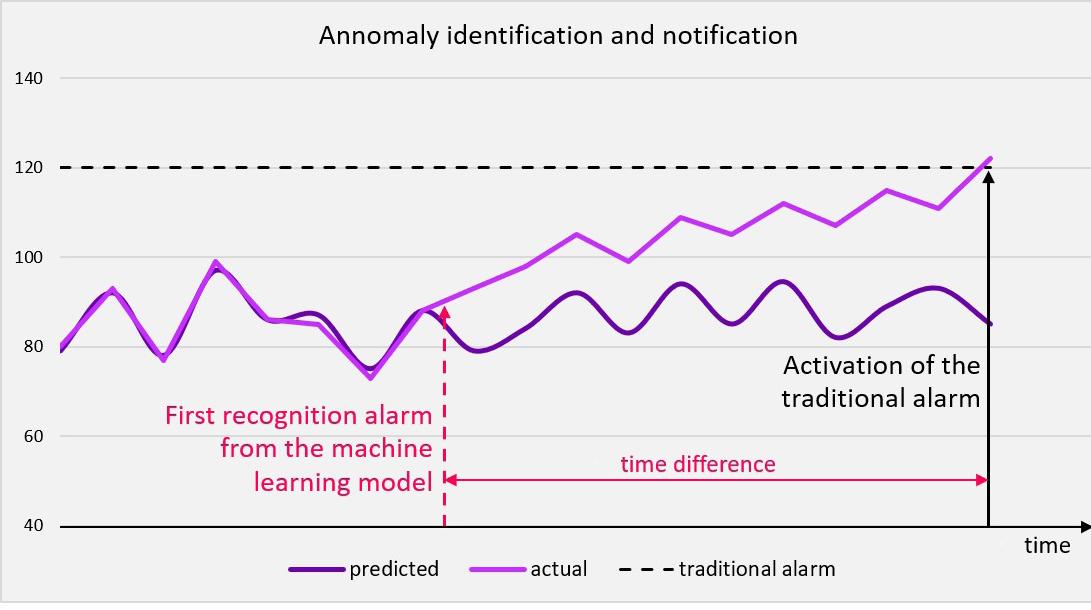
Machine learning models to predict anomalies and timely correction
Another aspect that can compromise ammonia production is the loss of efficiency, and even failures of any equipment in the production chain. From critical assets such as wind turbines, the hydrogen electrolyser, and the ammonia reactor, to secondary equipment like pumps and compressors, any failure can cause productivity loss or an unplanned shutdown. Machine learning models use historical and real time data to predict abnormal behaviour of equipment well before any alarm can be activated. The latest technology is easier and faster to deploy and expand across multiple assets. The early identification of issues allows the maintenance team to plan the repair procedures for when the best resources will be available, in terms of both people and materials.
Figure 4 compares the moment when the machine learning model predicts the anomaly (first recognition alarm from the machine learning model) and the moment when an alarm would be activated if no action was taken to fix it (activation of the traditional alarm). The machine learning model can recognise the behaviour deviation much earlier due to the sensitivity of the model. The time difference indicated in Figure 4 can be weeks and sometimes even months, which means significant anticipation of information to enable the best corrective action.
Improving collaboration across the ecosystem
Gartner predicted that by 2023, organisations capable of sharing data across the ecosystem would outperform their peers in business value metrics. But in 2022, less than 5% of data sharing programs would be properly structured.6 Industrial companies are still struggling to ensure access to trusted data and are relying on disparate systems to access information. It is virtually impossible to replace the multitude of systems acquired and configured over many years. The best strategy is to create a digital roadmap to explore past digital investments and expand the value by integrating information instead of systems.
Companies in the green ammonia production chain will face the challenge of balancing new demands and ensuring reliable supply. A critical step to ensure profitable operations in this environment is to leverage data within the organisation and among partners. One of the key digital investments must be a digital platform that allows data sharing in the cloud. The data sharing platform must make operational data available to authorised users,
applications, and analysis tools in different locations. This solution reduces time and effort to gather data, and standardises and securely shares critical information. Some of the most relevant uses for the data sharing platform are:
n Performing timely advanced data analysis based on real-time data, contextual information, analytical tools, and accessible dashboards.
n Monitoring assets locally and remotely, aggregating IIoT and sensor data from multiple sources inside and outside of the control network.
n Creating new business models using an industrial data-driven services approach.
n Enabling a connected industrial community through bi-directional sharing of selected data among multiple players.7
It is important to ensure that the digital data sharing platform to be adopted is:
n Optimised for industrial data.
n Ready to use for SaaS (Software as a Service).
n Possible to scale on demand.
n Able to protect critical operations.
n Capable of managing information in a secure way.
Conclusion
Scaling-up the clean ammonia production chain is not an easy task. In this article, AVEVA has explored how digital solutions will play a critical role in designing better and faster, reducing project risks, operating more reliably, and managing the ecosystem to ensure profitable business.
Beyond adopting digital solutions, companies will have to change the way they work. Many companies like process licensors, EPCs, industrial software providers, and operating organisations, already understood the value of working closer and more of this type of collaboration should be seen from now on. The only way to reach the desired net zero goals is to increase partnerships among the different players to speed up technological development and infrastructure construction, while ensuring profitable and sustainable operations across the production chain.
References
1. 1921–2021: A Century of Renewable Ammonia Synthesis, MDPI (https://www.mdpi.com/2673-4079/3/2/11 )
2. Yara Clean Ammonia, Yara (https://www.yara.com/ siteassets/investors/057-reports-and-presentations/ other/2022/yca-capital-markets-day-full-length.pdf )
3. Forecast distribution of ammonia demand worldwide in 2050, by application, Statista (https://www.statista. com/statistics/1345785/forecast-distribution-ofglobal-ammonia-demand-by-application/
4. The digital delivery of a complex hydrogen network, Spring Global Hydrogen Review, https://www.aveva. com/content/dam/aveva/documents/archive/ Spring%20Global%20Hydrogen%20Review_2023_ AVEVA.pdf.coredownload.inline.pdf )
5. Unified Engineering: From concept to digital twin, AVEVA (https://explore.aveva.com/unifiedengineering-whitepaper/p/p/1 )
6. Data sharing is a business necessity to accelerate digital business, Gartner (https://www.gartner.com/ smarterwithgartner/data-sharing-is-a-businessnecessity-to-accelerate-digital-business )
7. AVEVATM Data Hub Datasheet, AVEVA https:// www.aveva.com/content/dam/aveva/documents/ datasheets/Datasheet_AVEVA_DataHub_22-11.pdf
24 | WORLD FERTILIZER | JULY/AUGUST 2023
Figure 4. Comparison of machine learning model alarm and traditonal alarm notifications.
The fertilizer industry has a rich history dating back centuries, with the first chemical fertilizers being developed in the mid-19th century. As the industry has grown and evolved, so has the importance of quality control. Initially, fertilizer quality was a rudimentary process, largely based on visual assessments and simple chemical tests. However, with the industrial revolution and the advent of advanced scientific methods, the focus shifted towards more accurate and consistent analysis methods.
In the early 20th century, quality control mainly involved checking for the presence of essential nutrients such as nitrogen, phosphorus, and potassium. However, as the understanding of plant nutrition evolved, the analysis expanded to include a wider range of nutrients and other quality parameters.
By the latter part of the 20th century, with the exponential growth of the fertilizer industry and increased competition, maintaining consistent product quality became a crucial differentiating factor. This placed an even greater emphasis on accurate, reliable, and efficient quality control methods.
Today, quality control in fertilizer production has become a highly sophisticated process. It involves complex chemical analysis, high-performing technology, and rigorous procedural standards. Despite these advancements, quality control analysis continues to face numerous challenges that can impact efficiency, accuracy, and safety. In response to these challenges, innovative solutions are emerging to revolutionise the quality control process, and laboratory automation is at the forefront of this transformation.
Lucas de Clercq, Alsys International, the Netherlands, examines the move towards laboratory automation in fertilizer plants in line with the increasing demands of the industry.
25
The importance of quality control in the fertilizer industry
Quality control is an indispensable part of the fertilizer production process. It ensures that the end products meet set industry standards and customer expectations. Beyond adherence to standards, quality control analysis in fertilizer production guides critical decisions that directly impact the efficiency and profitability of operations.
The importance of quality control cannot be overstated. It is an instrumental process that ensures product consistency, compliance with industry standards, and satisfaction of customer expectations. It provides essential data to make informed decisions that directly impact the production process, overall efficiency, and profitability.
Quality control has multiple facets in fertilizer production. Analysis involves testing for essential nutrients such as nitrogen, phosphorus, and potassium, as well as a range of
micro-nutrients, ensuring they are present in the correct proportions. Any deviation in these compositions can significantly affect the fertilizer's efficacy, with potential implications for crop yield and quality.
Moreover, quality control also involves monitoring for any unwanted or potentially harmful substances. This ensures the fertilizer's safety and environmental impact, which are crucial factors considering the heightened global focus on sustainable agricultural practices.
However, the impact of quality control extends beyond product quality; it also plays a crucial role in operational efficiency. Accurate and fast results from quality control analysis are vital for steering the production process.
Producers need reliable data to adjust production parameters in real-time, optimise the use of raw materials, consumption of energy, and avoid wastage. Delays in obtaining analysis results can disrupt production schedules, leading to inefficiencies and increased costs.
In an industry where margins can be thin, and the market is constantly evolving, the speed and accuracy of quality control analysis can make a significant difference. The faster and more accurately a manufacturer can test their products, the more quickly it can respond to any issues, adjust its processes, and ultimately bring its products to market.


Challenges in quality control analysis
Despite its importance, quality control analysis in the fertilizer industry is fraught with challenges. Manual sample preparation and analysis is time-consuming and prone to errors. These errors can lead to inaccurate results, affecting the reliability of the data used for steering production decisions. Furthermore, the process' manual nature can delay analysis, disrupting production schedules, and hindering operational efficiency.
As the fertilizer industry expands and grows more complex, so do the challenges associated with quality control analysis. The task of ensuring consistent quality in the face of rising production volumes and more stringent regulatory standards can be daunting. Several significant challenges stand out, highlighting the need for innovative solutions.
One of the most significant challenges stems from the sheer scale of operations.
Fertilizer production runs 24 hours, seven days a week, with samples for analysis arriving continuously, even overnight. This places immense pressure on laboratories to maintain uninterrupted operations. Laboratories often need to work in shifts to keep up, which can lead to increased operational costs and potential inconsistencies due to varying analyst efficiency across different shifts.
Another significant challenge lies in the precision required in quality control analysis. In a field where small errors can lead to substantial consequences, the level of accuracy needed is exceptionally high. A minor discrepancy in the composition analysis of a fertilizer batch can lead to faulty production adjustments, potentially impacting the entire batch's quality. This could lead to wasted resources, increased
26 | WORLD FERTILIZER | JULY/AUGUST 2023
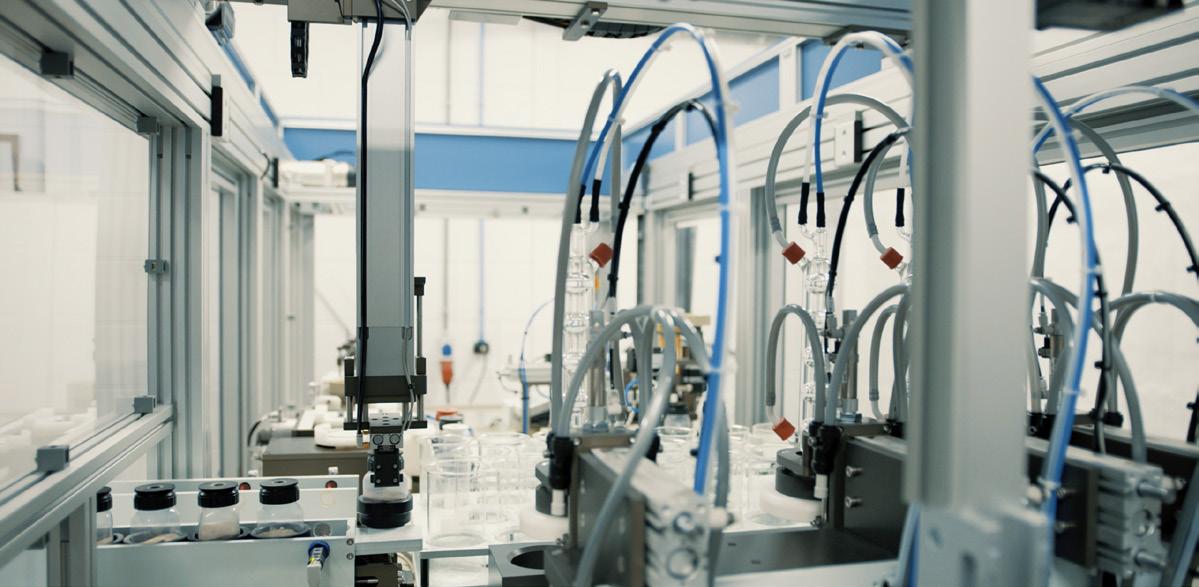
Figure 1. A sample of fertilizer is introduced by the operator to the robot.
Figure 2. The sample of fertilizer is recognised by the robot and will execute the sample preparation method, including analysis.
Figure 3. After preparation in the robot, the sample is introduced to the preferred analytical device.
Moisture content can affect product quality and equipment function, making it a crucial focus point in proactive avoidance of quality control issues.
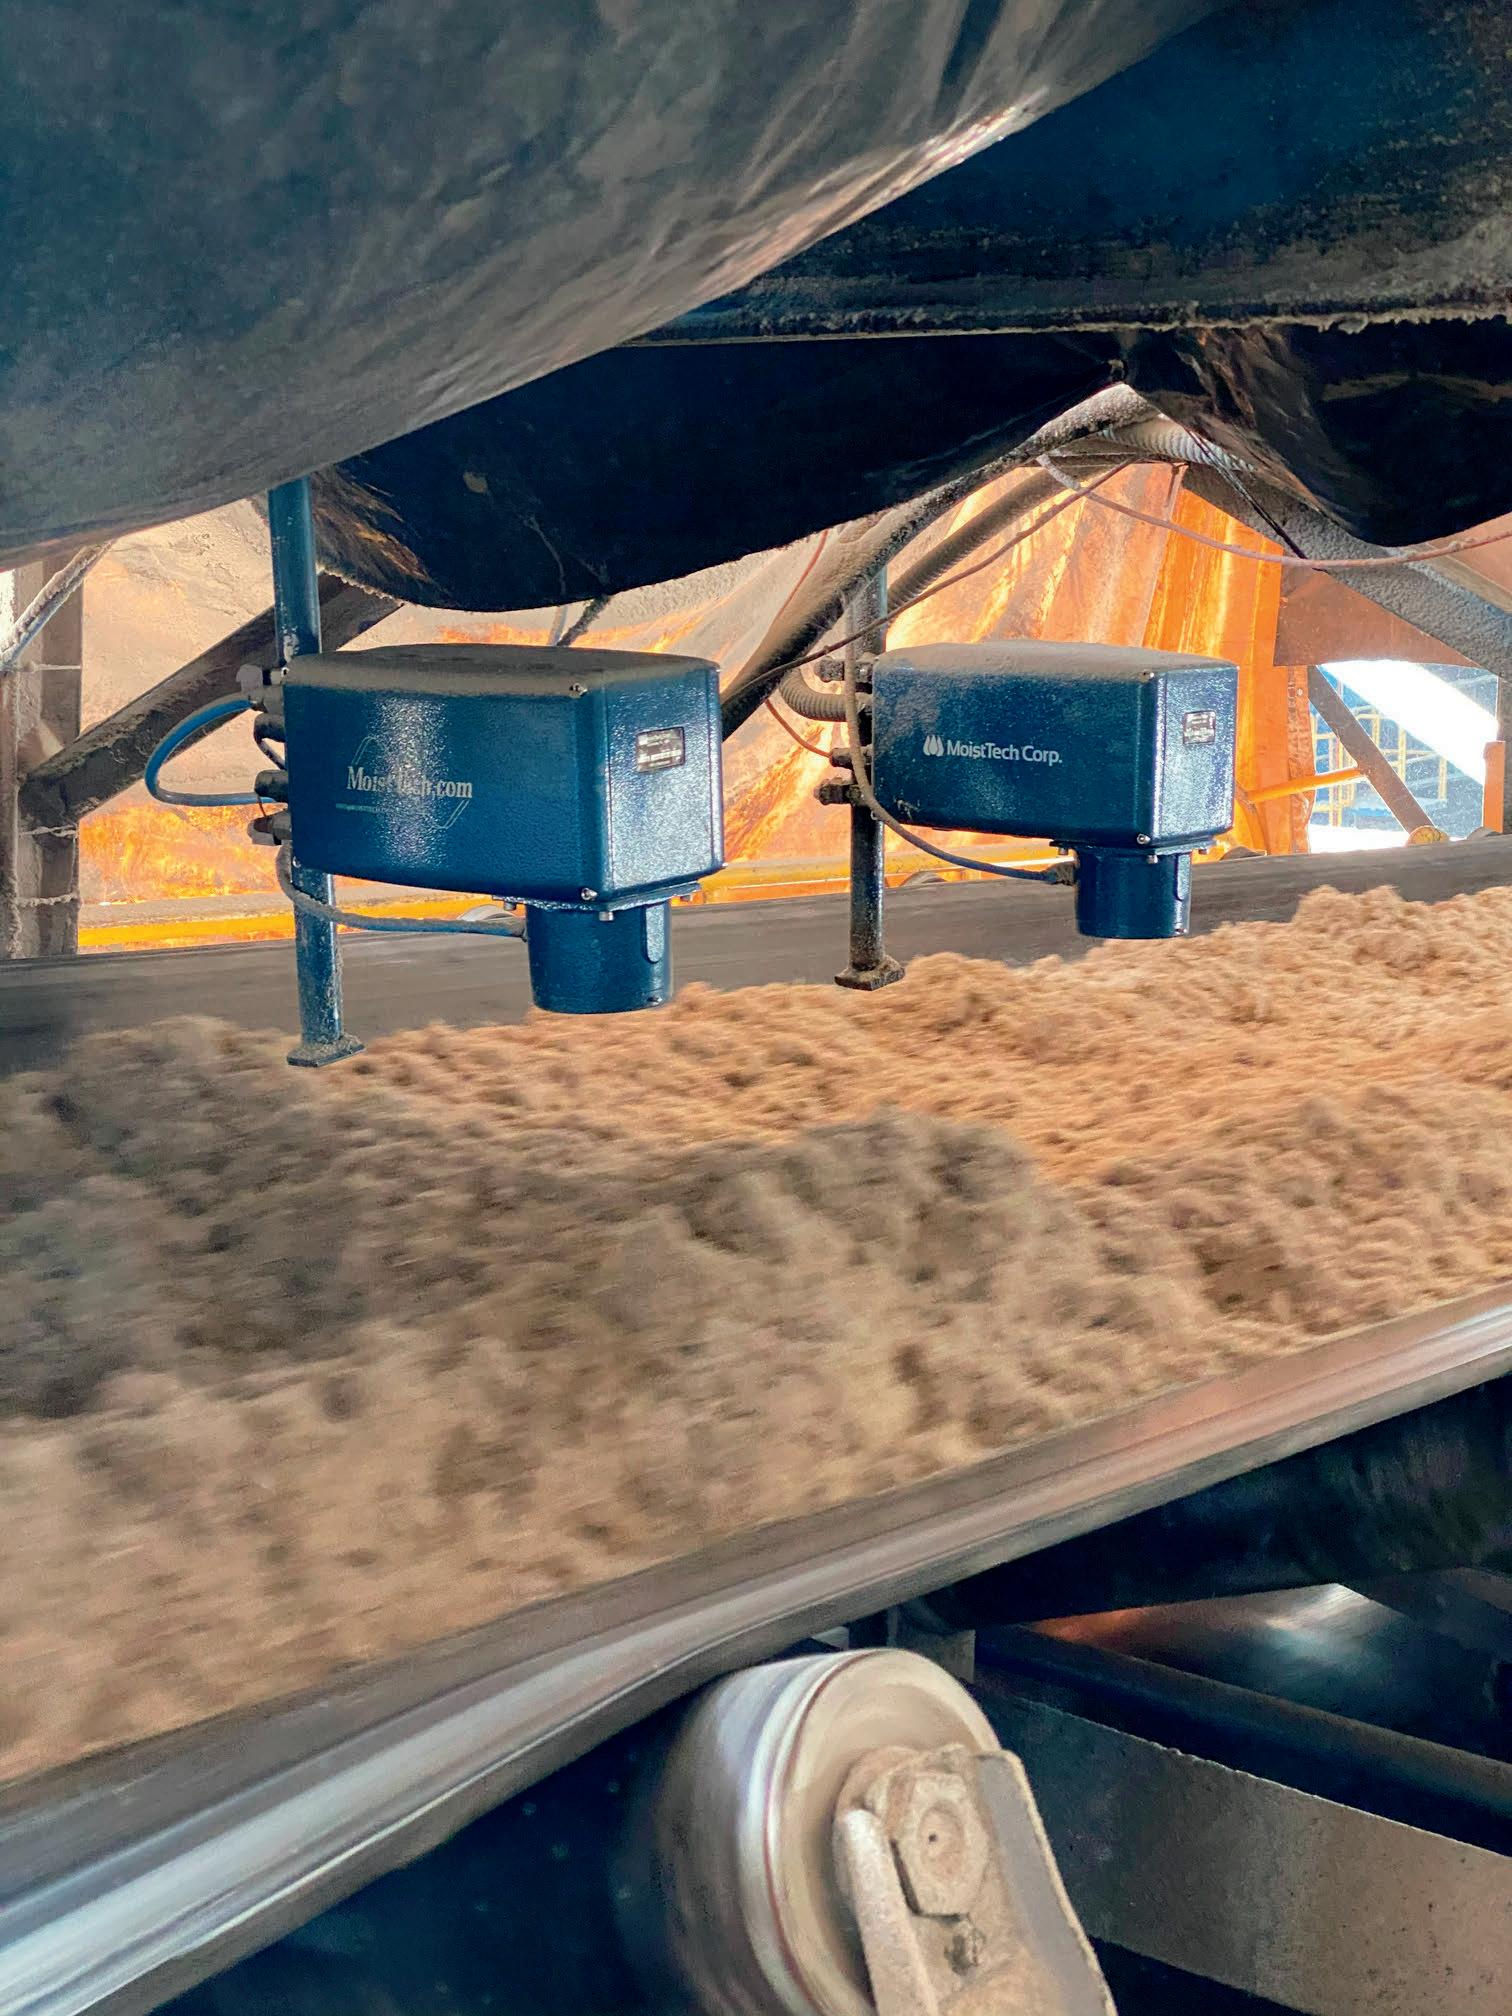

MoistTech’s NIR (near-infrared) sensor optimizes the manufacturing process, allowing for immediate adjustments & increased product quality.
CONSTANT ONLINE MONITORING IMMEDIATE QUALITY IMPROVEMENTS

Allows for a constant, non-contact solution to moisture measurement directly on the production line in real time
Product quality, energy costs, lower waste, process optimization, increased efficiency and more!
CREATE CLOSED LOOP PROCESS
Measuring moisture directly on the production line produces instant, accurate data that can be easily communicated to a PLC - creating a closed loop process
MOISTURE
Automate Moisture Measurement with MoistTech MoistTech Corp +44 113 8680413 +1 941-727-1800 info@moisttech.com
MEASUREMENT & CONTROL
costs, and even potential damage to the company's reputation if substandard products reach the market.
Further, maintaining this high level of accuracy consistently is a formidable task. Analysts are required to perform at 100% all of the time, which can be mentally and physically exhausting. Moreover, the manual nature of many laboratory tasks can lead to variations in results, affecting the reliability of the data.
The handling of potentially hazardous materials also poses safety challenges. Fertilizers contain a range of chemicals, some of which can pose safety risks. Ensuring safe handling and analysis procedures is crucial to protect the lab staff and maintain a safe working environment.
In addition to these, keeping pace with evolving industry standards and regulations is challenging. The regulatory landscape for the fertilizer industry continues to evolve, driven by increased emphasis on sustainability and environmental protection. Laboratories need to constantly update their analysis methods and procedures to comply with these changing standards.
These challenges underscore the need for innovation in laboratory quality control. With growing pressures on efficiency, accuracy, safety, and compliance, laboratories need solutions that can help them stay ahead, maintain high standards, and drive operational excellence.
Transforming quality control
A multitude of challenges are faced in a typical quality control laboratory in the fertilizer industry. The issues range from maintaining high levels of accuracy and precision, coping with the continuous influx of samples, and ensuring safe handling of potentially hazardous substances, to the daunting task of working 24/7 to keep up with the demand.
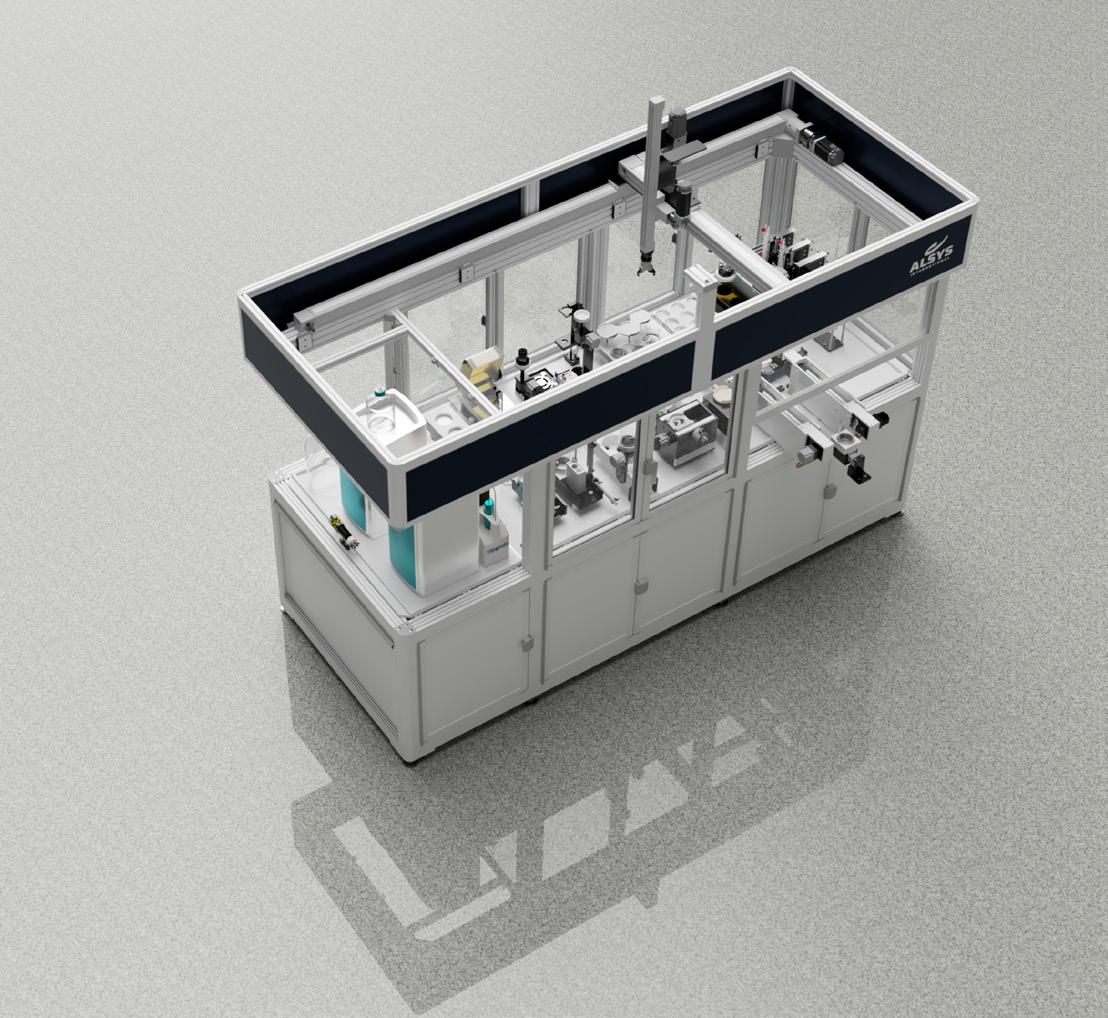
Alsys International has developed a solution to the quality control process in the fertilizer industry. The company's first robot was designed to meet the specific needs of fertilizer quality control laboratories.
Over the years, Alsys International has upgraded its technology to keep pace with the evolving needs of the industry. The company's robots have high accuracy levels and an uptime of 99.7%, and are designed to deliver consistent, reliable performance.
Implementing laboratory automation
Embracing automation in the laboratory is not just about acquiring a new machine – it is about embarking on a collaborative journey towards transforming laboratories. The first step towards implementing an automated solution is understanding laboratory goals. It is important to consider the key quality parameters that need to be monitored, the volume of samples the laboratory handles, and how quickly results are needed, as well as any safety and compliance requirements.
With this understanding, choosing the right analysis technique for automation should be simple. It is essential to remember that the journey toward automation starts with existing analysis methods. Alsys robots are designed to integrate with different selected analysis techniques, automating the sample preparation process to deliver accurate, consistent results quickly.
Once the analysis technique has been chosen, the analysis device is connected to the international laboratory robot. This ensures a flow of operations, from sample preparation to analysis. The company’s robots are designed to work in harmony with analysis devices, delivering prepared samples and then moving on to the next batch. The results tested by the robot are then connected to the laboratory information management system (LIMS).
Robots as a connector between production and results
Alsys robots are armed with software which act as a catalyst for a strategic shift in production steering. The key to this transformation lies in the speed and accuracy of the data generated, and the intelligent application of this information within the factory's processes.
The robot software provides a precise data stream, minimising the delays associated with traditional quality control methods. The quick access to accurate data equips factories with the insights needed to make informed adjustments to their production parameters.
The power of software lies in its connectivity. It enables direct communication of the quality control results back to the factory's control system. This feedback loop allows for real-time process adjustments, leading to enhanced optimisation of raw materials and energy use.
By utilising software such as this, factories can potentially achieve an annual reduction of 1.5 – 2% in raw material and energy consumption. The implications are significant: substantial financial savings, improved operational efficiency, and a lower environmental footprint.
Conclusion
When navigating the intricacies of the 21st century, the need for efficient and effective quality control in the fertilizer industry is undeniable. With increasing demands for operational efficiency, safety, and regulatory compliance, the adoption of laboratory automation is not merely an option, but an essential progression.
28 | WORLD FERTILIZER | JULY/AUGUST 2023
Figure 4. A phosphate robot for determining different products of phosphates (solids and liquids).
The i dea of
n t e g r a t i o n
Guido Canti, Eurotecnica, Italy, and Marc Wieschalla, thyssenkrupp Uhde,
Germany, examine the advantages of integrating a melamine plant with an existing urea plant.

The use of mineral fertilizer is an essential component of sustainable agriculture. Mineral fertilizers are applied in order to balance the gap between the nutrients required for optimal crop development and the nutrients supplied by the soil and available organic sources. One of the most used mineral fertilizers is urea, obtained from carbon dioxide and ammonia. Both reactants are brought together under high pressure, forming carbamate as an intermediate product and urea and water in the second step. Finally, urea is concentrated and solidified either by prilling or granulation.
Ammonia plants are typically designed to produce market-grade ammonia, with a side stream of carbon dioxide at the same time. This latter stream is sometimes captured, vented to the atmosphere or, more often, used as a feedstock for urea production. The amounts of ammonia and carbon dioxide provided by an ammonia plant are usually not balanced for the stoichiometric production of urea. In most cases, ammonia is present in excess.
Additional sources of carbon dioxide are present in most ammonia/urea plants, namely the reformer flue gases and boiler flue gases. Using the excess ammonia together with the additional
29
carbon dioxide source allows for a capacity increase of 10 – 15% of the urea plant. This capacity increase can be executed by modifying the synthesis loop either by adapting the existing equipment or adding a section, depending on the technology of the plant and its size or age. Should urea capacity increase be required, concepts like the debottlenecking without licensor involvement, the 'more in, more out' approach, or the MP add-on based on Stamicarbon technology, are viable solutions to comply with end-user desires. A capacity increase above 10%, and as high as 100% can be achieved. However, often the ammonia plant should also be revamped in order to provide higher amounts of ammonia. If it is required to keep the energy consumption at its current level or even lower it, older Stamicarbon plants can be equipped with an MP Flash, a low-energy technology which reduces the steam consumption of the urea melt process. In the event that a different licensor technology is used within the existing melt
plant, there are different technologies available that can be used to reduce their energy consumption.
As the demand for urea grows by 2 – 3% per year, and at an even slower pace when challenged with plant debottlenecking, it can be useful to think about alternative products to solidified urea fertilizer, such as Ad Blue (diesel exhaust pollution control) or melamine. While the modifications to an existing urea melt plant are relatively simple, the same upgrade on the finishing section (either prilling or granulation) can prove to be difficult.
Prilling towers cannot be modified and a granulation section is rather tight in terms of acceptable flowrates. However granulation plants are usually designed with an additional margin for recovery after washing, which could be up to 10%. With a capacity increase of the melt plant, the recovery capability reduces.
Melamine, a direct derivative of urea melt, can be considered for debottlenecking, ensuring a complete utilisation of any excess ammonia/carbon dioxide and producing a valuable compound.
The integration of a melamine plant into an existing urea plant can be a cost-effective and efficient way to produce melamine, upgrading it to a multi-product plant. Melamine can be used for the production of plastics, laminates, and other industrial applications.
Prices Melamine vs. Urea (source: ICIS ILOR, Indexmundi)
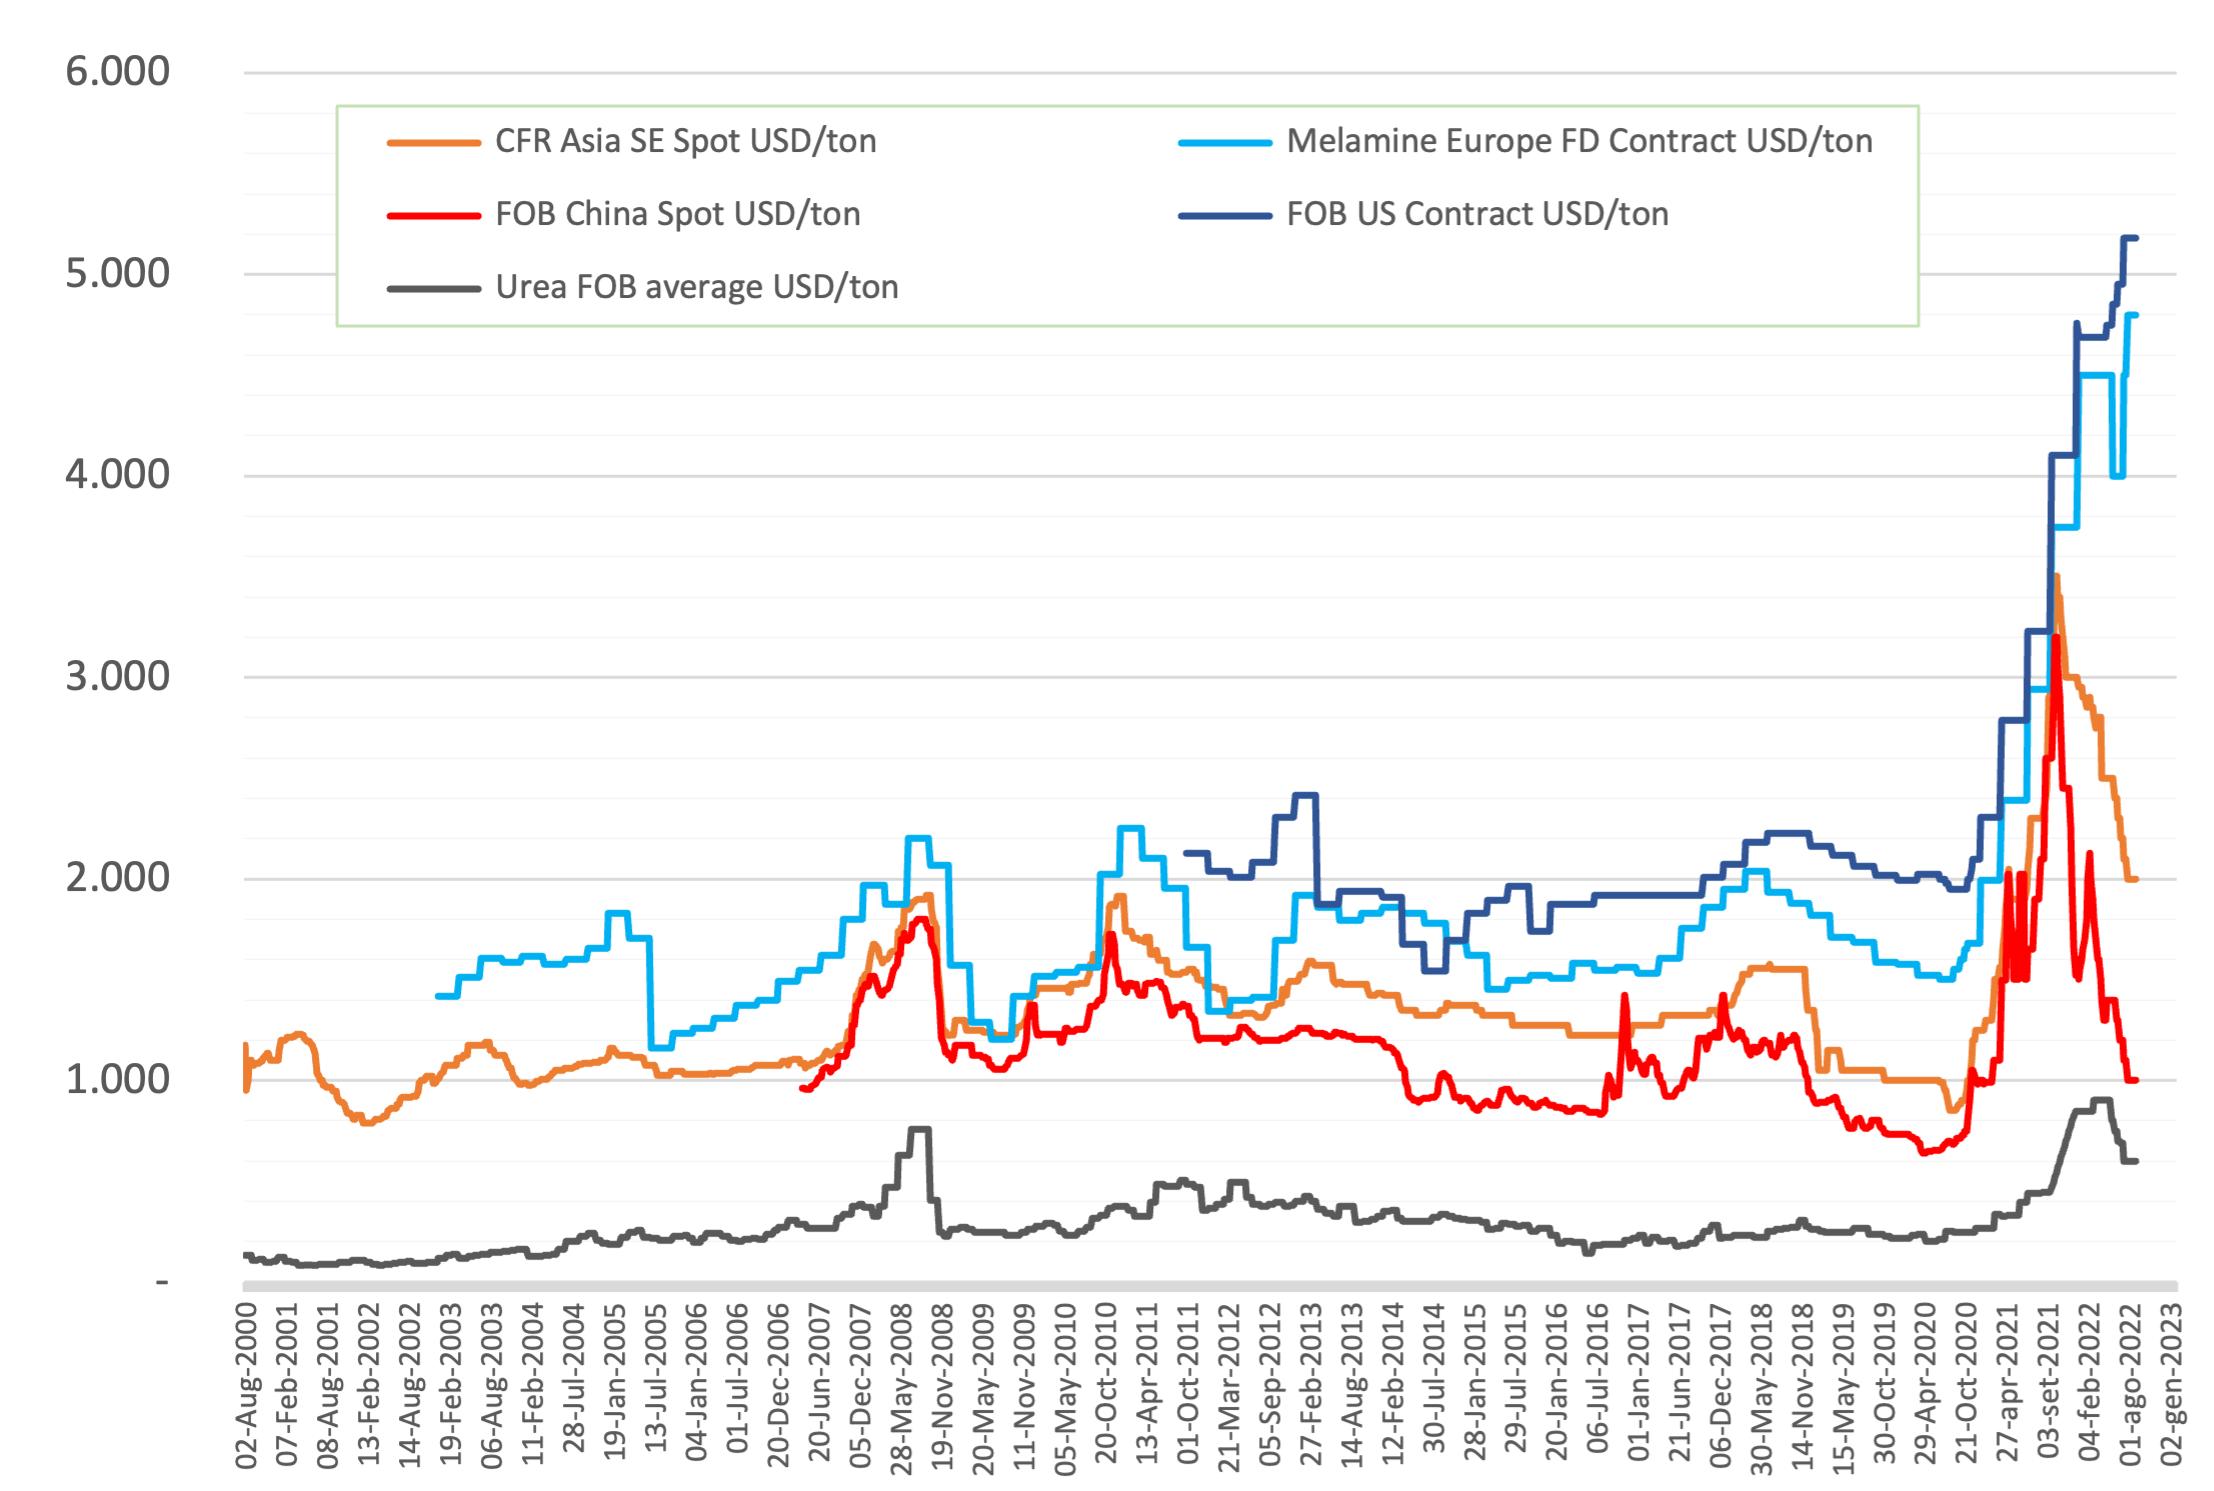
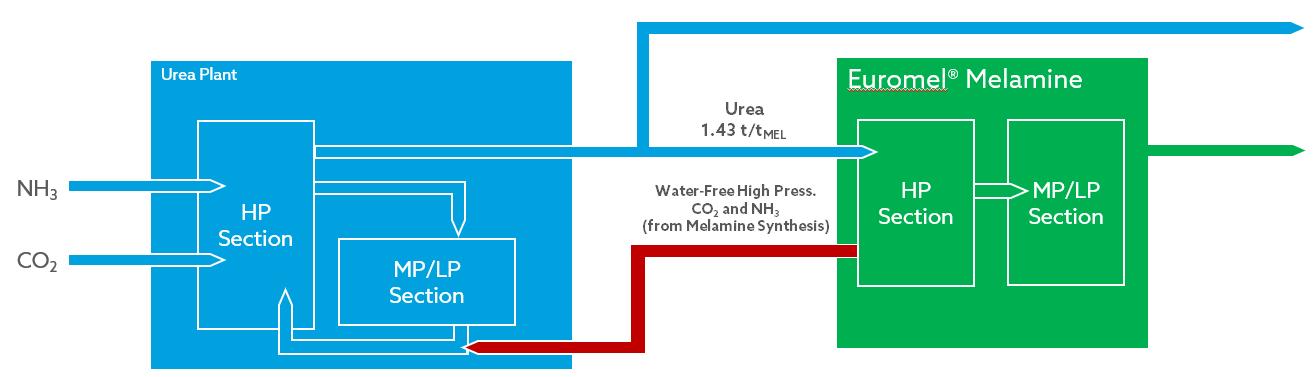
To produce melamine, urea molecules are joined under pressure in an endothermic non-catalytic reaction that generates melamine, ammonia and carbon dioxide. These off-gases are sent back to the urea plant to be recovered as fresh urea.
A second feed stream of ammonia ensures the complete transformation of urea to melamine and guarantees that no by-products are formed. All ammonia is fully recovered in the urea plant, with no modification of the ammonia balance of the complex.
A leading melamine licensor, Eurotecnica SpA, has recently marketed its
30 | WORLD FERTILIZER | JULY/AUGUST 2023
Figure 1. Typical Euromel® plant integration scheme.
No Description Measure to revamp Preperation for later connection to the melamine
Table 1. Measures to link a urea plant with a melamine plant.
plant.
1 Export of urea solution (70 – 75%) from the urea solution tank; a dedicated evaporation to concentrate up to 99.7% will be provided in the melamine plant.
Installation of a t-piece downsteam of the pump and modification of the pump to handle higher flow.
Installation of a spool piece downstream of the pump which can be exchanged with a t-piece later on.
2 Import of a carbamate condensate directly to the HP synthesis loop.
Installation of a tie-in on urea synthesis loop.
Installation of a tie-in with blind upstream urea sythensis loop. © EUROTECNICA
Figure 2. Price development of melamine and urea.1
fifth generation (G5) technology which improves the process by minimising energy consumption and helps ensure its long-standing 'no solid, no liquid' effluent policy, thus offering the concept a total zero-pollution plant.
One of the main features of this technology is its ability to simplify the integration of the melamine plant with its urea counterpart by means of a single liquid carbamate tie-in.
The integration of a melamine plant into an existing urea plant offers several advantages. One of the main advantages is the ability to use the existing infrastructure and resources of the urea plant, which can result in significant cost savings. The integration also allows for a more efficient use of raw materials, as the by-products of the melamine production process can be reused as feedstock for the urea production process.
An existing urea plant can be safely and smoothly modified for the connection with a melamine plant; at the same time, an increase in capacity can be achieved by using, for example, the existing overproduction of ammonia. This results in positive effects on the urea plant such as:
n Higher ammonia plant utilisation.
n No need to revamp the prilling or granulation section.
n Unchanged guarantees on urea quality.
n No loss of ammonia and carbon dioxide, which are fully recovered in the urea plant.

n Easy integration with the existing facilities.
n No changes in the water balance (scrubbing water for the melamine plant is taken from the waste-water system of the urea plant).
The same advantages can be obtained whether a new urea plant is under design, or an existing facility has to be revamped.
Either for a newly built urea plant or an existing plant, the modifications required to link melamine and urea plants can be easily implemented and are briefly described in Table 1. Licensor and EPC contractor know-how about high-pressure pumping, as required for the high-pressure carbamate or urea’s ammonia pump, is essential as a number of streams exceed 100 bar. Additionally, proven experience with carbamate-resistant materials and process familiarity with the most energy-efficient coupling with the urea plant can be the pivotal point in determining the profitability of the resulting complex.
As carbon dioxide captured in melamine production is stored in this compound for long-term periods, such production can also be seen as a contributor to mitigate climate change. Melamine production, in itself, has a negative carbon footprint; its economic exploitation does benefit the complex end-user without any impact on the environment in terms of greenhouse gases release.
Melamine is also a high-value product. This is reflected in the price, which was between US$1600 – US$1700/t in 2022. Because both urea and melamine tend to crystallise easily, an EP or EPC contractor experienced in urea technologies can transfer their knowledge to the other process, contributing to a well-working melamine plant. thyssenkrupp Uhde GmbH (Uhde) has gained more than 60 years of experience building and revamping various urea melt and granulation plants. The company's business Unit, Udhe, has developed its own solutions within the licensor designs, and has begun advancing these technologies. Uhde has developed an emission-free vent stack within the urea melt plant and the application of self-regulating pumps, which cannot cavitate and are used for the melt delivery from the urea plant to the granulation plant, or melt flushing in the evaporation unit of the urea plant in order to dissolve any biuret deposits efficiently. Reduced emissions and higher availability of the plant can be seen as a result. Know-how is essential for a high-quality execution and can make the difference when it comes to determining plant safety, reliability and efficiency.
Combing this know-how with the leverage of the latest generation of melamine technology, can ensure that environment preservation and fast payback time are achieved by the end-user.
Pressure vessels and heat exchangers.
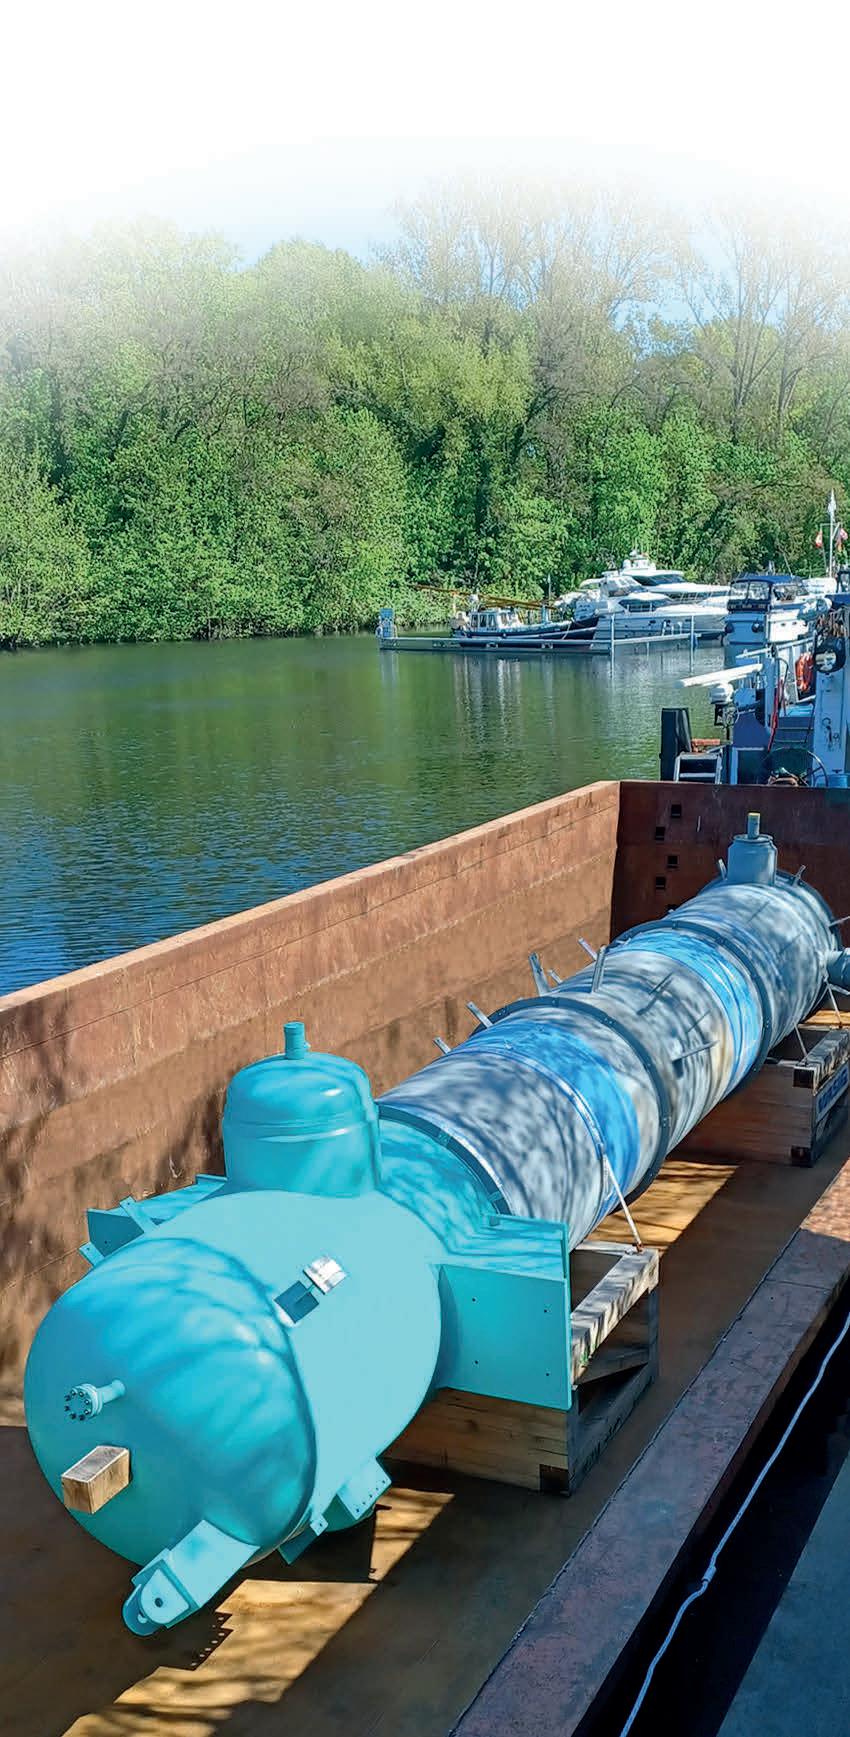
BORSIG solutions for the ammonia industry.
→ waste heat recovery systems
→ waste heat boilers for ammonia, methanol
a nd hydrogren plants
→ synloop waste heat boilers for ammonia plants
→ synthesis gas coolers
d ownstream of partial oxidation of oil or natural gas
We look forward to welcoming you at our booth, 67th Annual Safety in Ammonia Plants Symposium 2023.
1. ICIS ILOR (melamine), Indexmundi (urea).
References
www.borsig.de
The Quest
Lucia Castillo Nieto, International Fertilizer Association (IFA), France, examines the measures in place to improve safety in fertilizer plants, and considers the actions producers can take to reach zero accidents.
32
for Zero Accidents
Fertilizer is central for healthy and successful crop growth in agriculture. It provides plants the essential nutrients to grow and thrive. However, the chemical industrial processes and mining involved in fertilizer production comes with inherent hazards. Over the past two decades, the fertilizer industry has made remarkable strides in improving production plant safety and security, driven by a combination of regulatory mandates, technological breakthroughs, and industry-wide initiatives.
Associations such as the International Fertilizer Association (IFA) are key players in the transformation, promoting the efficient and responsible production, distribution, and use of plant nutrients. Members include fertilizer producers, traders and distributors, and other actors in the fertilizer value chain. Safety and security play a leading role in order to ensure that the industry adheres to the highest safety standards and commits to continuous improvement.
All IFA members have adopted 12 IFA Safety, Health, and Environment (SHE) principles, which require them to establish and improve their safety, security, health and environmental performance through annual objectives, targets or key performance indicators, among other actions.
Process safety management
One of the drivers of progress in plant safety in the fertilizer industry has been a focus on process safety management (PSM). Process safety in the fertilizer industry involves preventing and mitigating risks associated with the manufacturing and handling of fertilizers. One example of process safety is the implementation of rigorous monitoring systems and controls to prevent chemical leaks, fires, or explosions. Fertilizer plants employ advanced process control technologies to continuously monitor key variables such as temperature, pressure, and chemical concentrations. These systems can detect deviations from safe operating conditions and trigger automated responses or alarms to prevent potential accidents. Furthermore, regular equipment maintenance, periodic safety audits, and thorough inspections of storage tanks and pipelines help ensure the integrity of the manufacturing process, minimising the risk of incidents that could harm employees or the surrounding environment.
33
Sulphur + Sulphuric Acid 2023 Conference & Exhibition


Understand the key market and technical developments shaping the industry


RETURNINGTO THE UNITED STATES

Now in it’s 39th year, the event continues to be an essential annual forum for the global sulphur and acid community to learn, connect and do business.


You can expect an expanded market outlooks agenda, including expert insights from CRU’s analysis teams on major supply and demand markets, including sulphur, sulphuric acid and phosphates, plus additional industry updates from key players from across the supply chain.


Sponsors:


Supporters:
For more information or to book your place, please visit: www.sulphurconference.com
Minerals

39th Oil | Gas | Fertilizers | Metallurgy | Industrial
November 6-8, 2023 • Sheraton New Orleans, Louisiana
Today
Register
The implementation of process and occupational safety management practices has had a significant impact on safety performance in the fertilizer industry and has helped to establish a culture of safety and accountability within the industry. According to the IFA's 2022 Safety Benchmark, the industry's overall incident rate has decreased by 54% since 2008.
The annual IFA Safety Benchmark provides a means for companies to assess their safety performance against industry peers. This benchmark includes a range of lagging indicators related to safety management, such as incident rates and total recordable injuries for both company employees and contractors. IFA also recommends members participate in the anonymous National Safety Council’s Employee Safety Perceptions Survey that enables companies to gain first-hand insights into leading indicators from their workers. Together, the survey and the benchmark allow IFA members to identify areas of concern, to build concrete action plans, and to track their safety performance over time.
Further measures
The Protect & Sustain product stewardship certification provides independent verification of a company's commitment to sustainable practices, including SHE and product security management. To achieve certification, companies must meet a set of rigorous standards based on relevant quality, environmental, health and safety requirements of the ISO 9001, 14001, 45001, and the responsible care certifications, in addition to tailored standards for the fertilizer supply chain regarding product security.
Product security is another crucial priority in the fertilizer industry to prevent misuse of nitrogenous fertilizers, particularly in war zones where the misuse could have adverse consequences. This is why fertilizer companies voluntarily implement stringent security measures, such as controlled access to storage facilities and monitoring systems that track the movement of products throughout the supply chain. The Protect & Sustain certification helps members maintain these product security measures, therefore ensuring the safeguarding of their products. Additionally, the fertilizer industry collaborates with regulatory authorities to enforce regulations related to the sale and distribution of fertilizers, ensuring they are used for their intended purpose and not diverted for illicit activities.
To further promote collaboration and learning, associations like IFA facilitate practice sharing among its members, with a range of online and offline events, workshops, training, publications, and awards. One example of this is the biennial Green Leaf Award (GLA). It has two categories – one for nitrogen producers and one for phosphate and potash mining companies – and recognises fertilizer companies that have demonstrated exceptional performance in the areas of safety, health, and environment. The GLA is based on a set of environmental and safety management criteria,
including incident rates, risk assessments, and emergency response plans. It is independently judged and is an opportunity for IFA members to share their individual safety programmes with their international peers and the public.
Conclusion
These initiatives, governmental regulations, and more have contributed to significant progress in production plant safety in the fertilizer industry over the past two decades. Looking forward, however, there will always be room for improvement and a need to focus on the goal of reaching zero accidents, particularly in the areas of process safety (e.g. increasing inspections, maintenance and risk assessments) and measurements through leading indicators (e.g. training, surveys, hazard identification and prevention). The growing interest of ESG rating agencies in plant safety is going to play a major role in the future, as international investors want to minimise the risks of reputational damage.
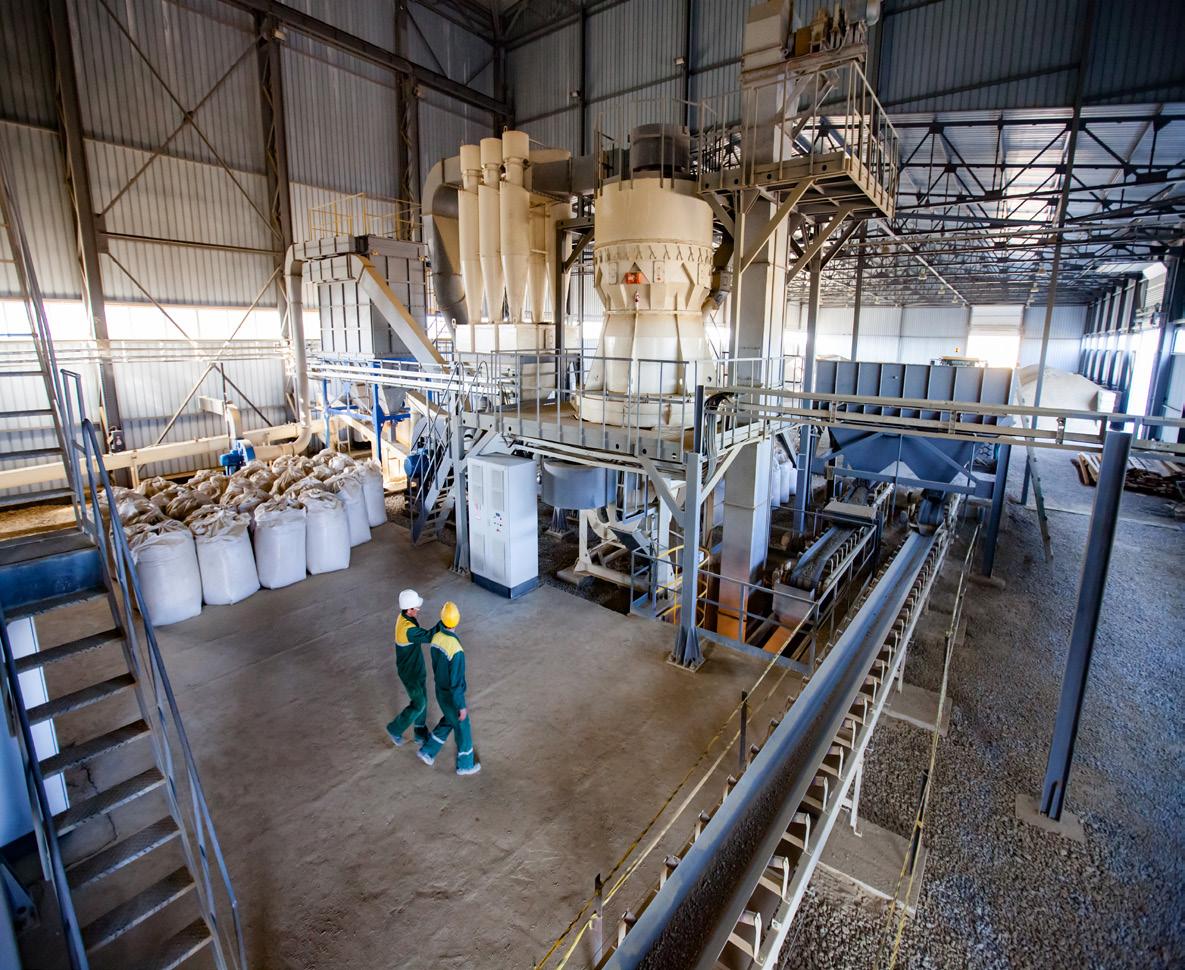
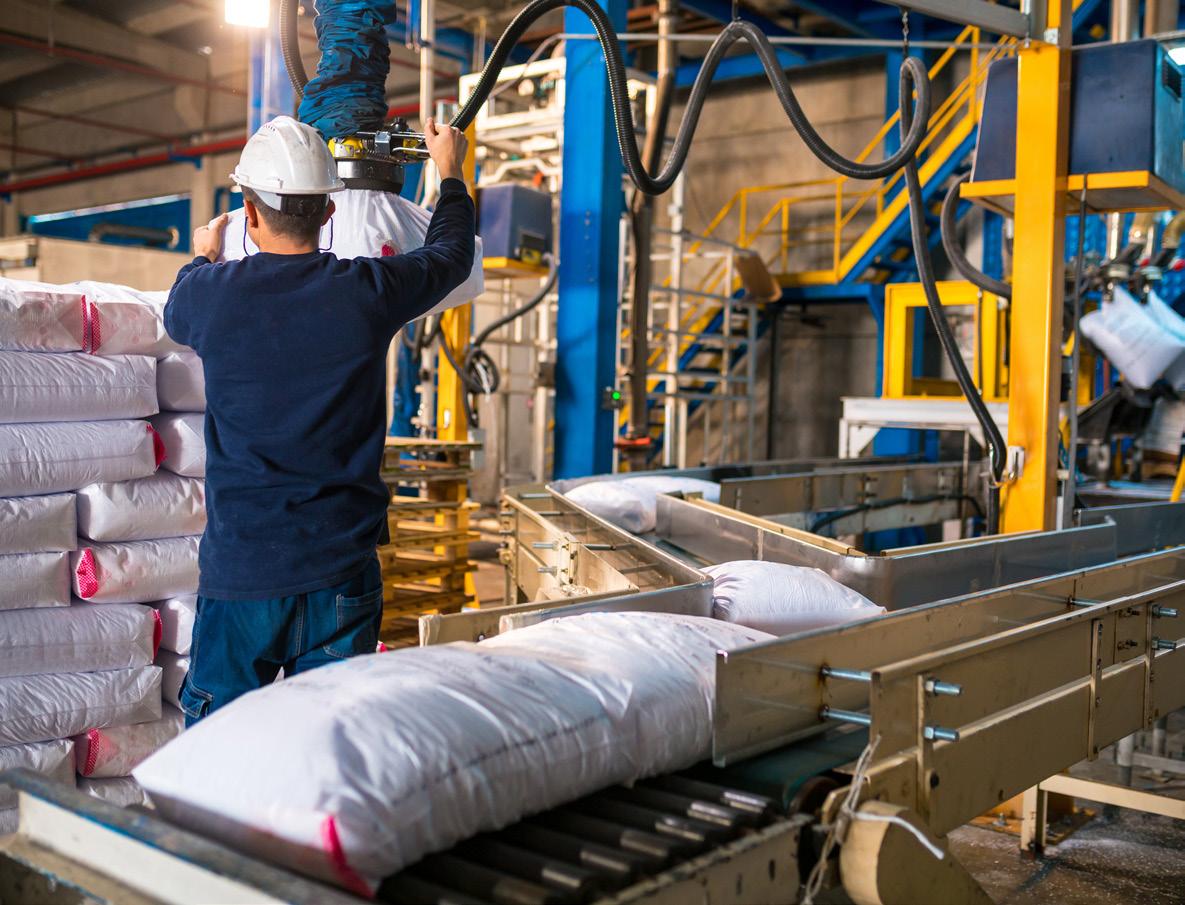
JULY/AUGUST 2023 | WORLD FERTILIZER | 35
Figure 1. Workers in a fertilizer production facility.
IN THE AMMONIA SECTOR
36
It has been more than 110 years since the discovery of ammonia synthesis, which was first made on a commercial scale in 1913. The synthesis of ammonia from its elements was vital as the world's population could not have grown from 1.6 billion in 1900 to today's 8 billion without large-scale ammonia production.
This article provides a comprehensive review of some of the major incidents related to ammonia production, and those reported in fertilizer news. Various ammonia storage incidents presented at AIChE symposiums were also reviewed.
Ammonia is one of the largest chemicals produced globally, with approximately 85% used to manufacture fertilizers.
As an important raw material for the fertilizer industry, more than 180 million tpy of ammonia are produced worldwide.
About 20 million tpy of ammonia is traded at the international level, and the rest is consumed locally to manufacture fertilizers and industrial chemicals.
According to U.N. reports, over the last 20 years, the global ammonia industry has grown six-fold, from about 30 million tpy to about 180 million tpy.
The American Institute of Chemical Engineers (AIChE) organisation has played an essential role in providing a platform, which has helped improve the safety of ammonia plants, and save lives and expenses. The information shared at the symposiums also prevented many similar incidents due to people being aware of what had happened elsewhere.
Knowledge of the bad experiences has helped others to avoid them, and knowledge of positive experiences and design improvements has contributed to a more efficient industry.
The primary safety incidents that include fires, explosions, and equipment failures are discussed below, some of which led to fatalities and lost time incidents.
Major incidents in ammonia plants
An explosion of an MDEA storage tank
In August 1999, an explosion occurred in an MDEA storage tank at Alaska Nitrogen Products' (ANP) plant in Kenai, Alaska, and propelled the tank off its base and into the air. The tank had landed on an adjacent air-cooled heat exchanger filled with synthesis gas. The impact of the tank on the air-cooled heat exchangers initiated a second explosion and fire. Three operators received minor injuries.
A reverse-flow phenomenon caused process gas to enter the storage tank, ignited by an unknown source. After this incident, ANP installed check valves in the MDEA system and equipped the storage tank with an inert gas-blanketing system. Process hazard analysis (PHA) was conducted on the MDEA system, and operating procedures were revised to improve operator awareness of reverse flow and other start-up/shutdown conditions.
Failure of mole sieve dryer
At 11:30 pm on 24 May 2000, the C.F. Industries Donaldsonville, Louisiana, Ammonia Plant 3 molecular
Venkat Pattabathula, SVP Chemical Plant Services, Australia, reviews some of the major incidents related to ammonia production and outlines how design improvements have contributed to a more efficient industry.
37
sieve vessel (109-DC) failed catastrophically. The failure resulted from a delayed hydrogen crack originating at the toe of a repaired fillet weld. The crack propagated into the vessel head to a critical flaw and fast-fractured through the shell thickness. The vessel shell continued to fast-fracture from the origin into approximately 40 fragments in less than one-tenth of a second. Vessel fragments were projected throughout Ammonia Plant 3, Urea Plant 2, and the adjacent offsite operating areas, causing extensive damage to equipment in the fragment's path. The resulting fire from escaping process gas caused burn injuries to several personnel working in the local area.
The vessel was externally insulated and was removed from service to replace the desiccant. A routine inspection of the vessel prior to refilling found a crack in the fillet
welds joining the outlet collector to the shell. The crack almost completely covered the circumferential length of the weld. It was only in the weld and not in the parent material. The weld was ground out, pre-heat was performed with a torch, and a 0.5 in. x 0.5 in. fillet weld was laid back down. The completed weld was inspected visually and deemed ok.
The vessel had failed on its first cycle after being placed back into service. This cycle was a routine operation (drying) and did not go through a heat cycle. After failure, the fragment distances were measured to verify the pressure the vessel was subjected to. This analysis indicated it was operating under normal pressure conditions at the time of failure.
The vessel fragments were studied in detail to determine the initiation point of the failure and the root cause. The initiation point was at the toe of the replaced fillet weld. High residual stress was present in the parent metal, and the heat-affected zone had a very high hardness. The stress could have been reduced by PWHT, and the hardness indicated poor re-heat control. There was also no H 2 bake-out employed. The repair procedure was incorrect because the vessel material was misidentified as C-½Mo (by a handwritten note on the drawing) when it was Mn -½Mo (SA302 Gr B). The outlet collector was made of SA516 Gr 70. Although no failures have been noted for Mn-½Mo material, it is supposedly better than C-½Mo as per Nelson curves.
In response to this incident, CFI retained a third party to audit their mechanical integrity programme (as the CFI investigation team noted several minor deviations in the development of the repair procedure). CFI has adopted all recommended changes.
An explosion of the auxiliary boiler
On 30 May 2002, the ammonia plant of Petrokemij Fertiliser Company in Croatia was started up after a four-day shutdown. At 4 pm, while the auxiliary boiler pilot was being lit, the boiler with five forced draft burners exploded, injuring two people.
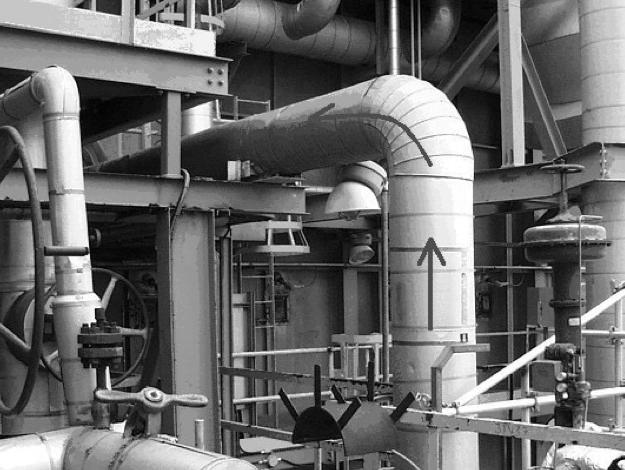
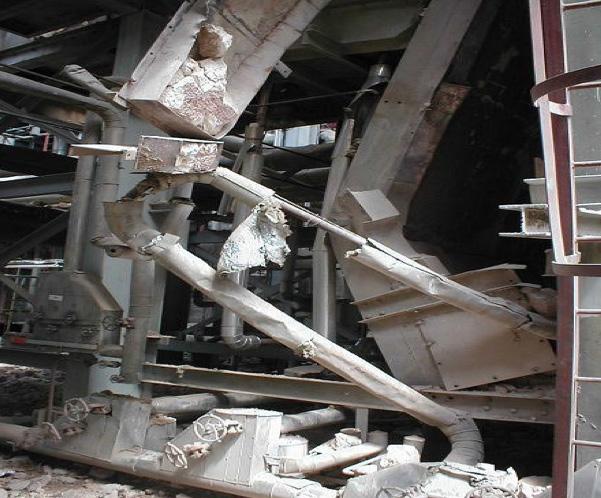
The walls of the auxiliary boiler and parts of the convection section walls were damaged (Figure 1). Extensive damage to structural steel, ducting, firebrick, and piping in the vicinity of the auxiliary boiler occurred. The equipment free from damage included the burners, the burner wall and the boiler tubes.
The subsequent repair took 70 days.
The post-mortem investigation found that the manual block valves for the burners had leaked, and the upper burner valves were likely not fully closed. When the operator turned on the electronic igniter, an explosive mixture was in the firebox. Petrokemija now recommends following the European standard, which includes:
38 | WORLD FERTILIZER | JULY/AUGUST 2023
Figure 1. The auxiliary boiler walls.
Figure 2. Projectile start point.
PATHWAY BLUE
MAKE THE ENERGY TRANSITION YOUR BUSINESS.
Meet the fuel of the future today. Produce blue ammonia at the highest capacity with the lowest possible levelized cost. Decarbonize at mega scale while increasing the value of your ammonia product. Integrate blue ammonia solutions today to meet the demand of tomorrow.
Blue Ammonia. Tomorrow’s fuel. Ready today.

NH3
n Two shut-off valves per burner.
n Safety trip valves (double block and bleed on fuel supply).
n Burner block valve leak check (permissive system) – burner management system.
Steam explosion in an ammonia plant
On 21 October 2002, an explosion occurred in a superheated steam line when Saskferco was starting up its ammonia plant in Saskatchewan, Canada (Figure 2). A steam explosion is a violent vapourisation that occurs when water hits a hot surface. A steam explosion in a UK steel works in 1975 caused fatalities, but in Saskferco's case, the explosion's impact did not injure anyone.
Saskferco was unaware of a steam explosion but the company could not get the steam to superheat the temperature on a start-up. After shutting down and investigating, they found the ‘can’ on their process gas/steam superheater was broken, allowing steam to bypass it. They also found the plug from a downstream attemperator (BFW quench).
Contributing factors to the explosion were:
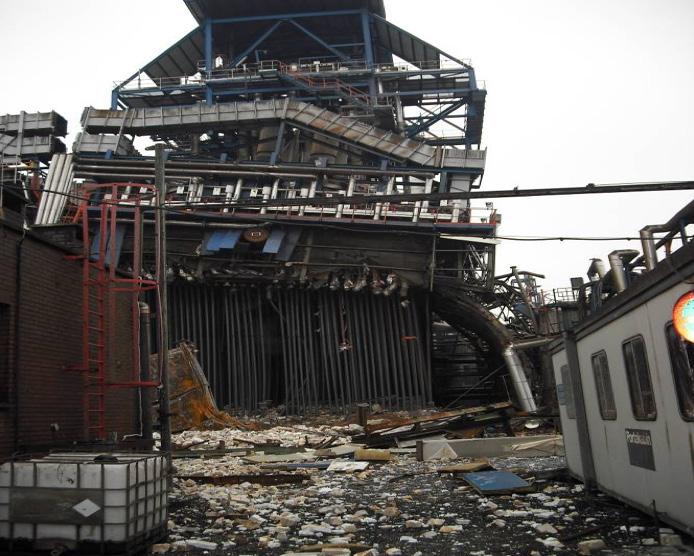
n Overfilling the steam drum upstream from the steam superheater coil.
n A faulty attemperator valve led to boiler feedwater entering the superheater.
n A faulty check valve on the steam drum.
The leaking attemperator allowed water to hit hot steel and vapourise explosively. A slug of water blew back to the superheater, carrying the attemperator nozzle. Steam trapped ahead of the slug over-pressured an internal superheater component and damaged it.
The incident cost Saskferco about three days of downtime and minor repair costs.
Synthesis converter start-up heater failure
In February 2005, a fire occurred in a synthesis loop start-up heater that resulted from a rupture in one of the four coils. This led to a major backend outage at Incitec Pivot's ammonia plant in Brisbane, Australia. The failure was due to localised overheating of a coil section caused by inadequate flow of syngas. The failure occurred during the restart following a backend trip. The coil failure resulted in a significant fire and explosion and consequently, instrumentation, control valves and piping were seriously damaged. This resulted in a significant outage of the plant.
An investigation of this incident identified the root cause as an override of the Critical Equipment Trip System (CETS), which is now part of plant SIS. The pilot burners in the start-up heater had lighting issues caused by the flame scanners' poor performance. Hence, the operating practice was establishing the pilot burners forcing a flow signal on the fail-safe controller that defeats the low syngas flow trip. Although the flame scanners were attended to, the overriding practice continued. The post-incident remedial actions included the following:
n A new procedure for bypassing the trip system which included a rigorous risk assessment.
n Modifying the start-up heater operating procedure, updated with all current alarms and set points. The operating instructions were revised to reinforce that low syngas flow trip on main burners should never be overridden during start-up.
n Adding additional engineering improvements such as differential pressure measurement across the coils, and thermocouples on each coil to measure tube wall temperatures and alarms.
Explosion in Benfield storage tank
The former AMI Agrolinz Melamine International became 100% of the Borealis Group as of 2007. Ammonia Plant 1 is an Uhde design of 1974 with a capacity of 859 tpd, currently debottlenecked to 1000 tpd. Plant 2 is a Humphreys & Glasgow reforming design of 1968 vintage, with an Uhde synthesis loop (1991) and a capacity of 550 tpd.
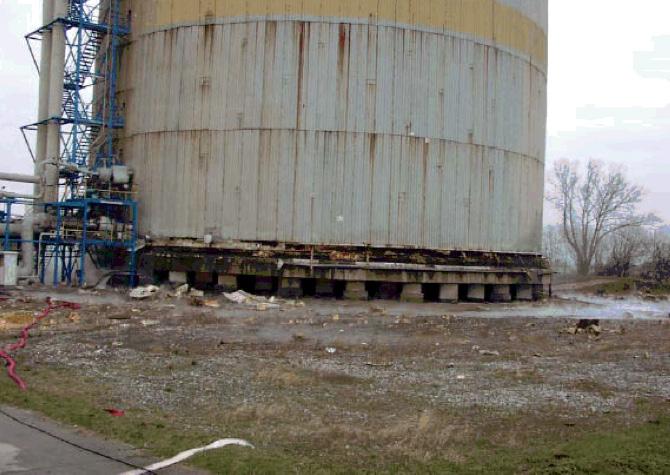
40 | WORLD FERTILIZER | JULY/AUGUST 2023
Figure 3. Damaged reformer after the explosion.
Figure 4. The Rostick tank.
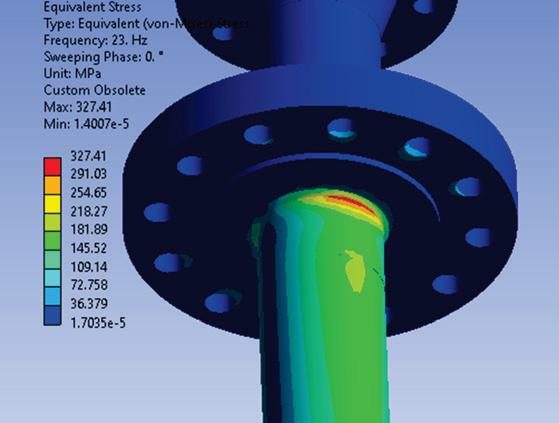
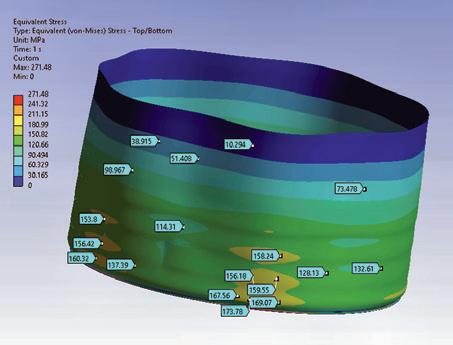
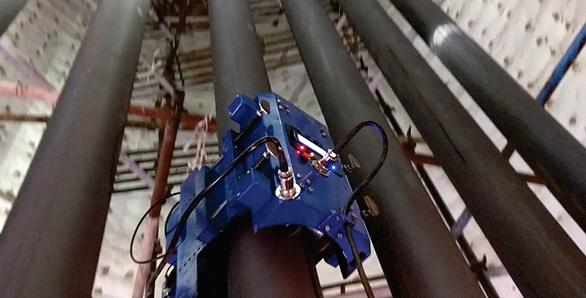


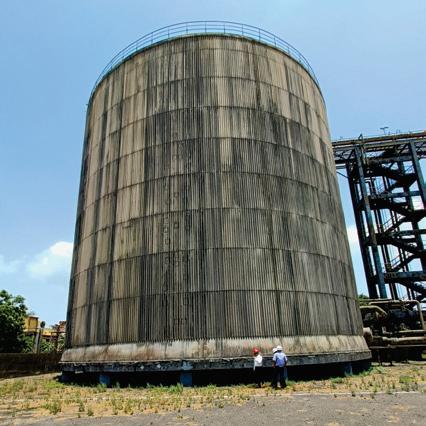

CO 2 removal in Plant 1 utilises a Benfield solution, whereas CO 2 removal in Plant 2 uses Selexol.
The incident occurred in Plant 1 in December 2006, and the Benfield storage tank was at the centre of the incident.
The storage tank was being used to boil off excess water that had accumulated in the tank from the collection drains of the Benfield system. Questions were raised regarding whether the existing atmospheric vent (200 mm diameter) was large enough to handle the significant quantities of steam without over-pressuring the tank. A decision was reached where an additional vent of 300 mm was needed.
An explosion occurred during the installation of the additional 300 mm vent at the top of the tank, resulting in two fatalities to contract workers attempting to install the new vent and one severely injured employee. Sparks from a grinder entered the tank and were the ignition source. The entire tank roof (weight 2600 kg) was displaced 10 – 15 m vertically and 50 – 60 m horizontally.
Many investigations were carried out, and the explosion was considered to have occurred due to the accumulation of hydrogen from corrosion of the carbon steel in the apex of the roof where the new vent was to be installed. Gas checks were not possible at this location.
The conclusion was that although corrosion of CO 2 /carbonate solutions is very complex, corrosion can occur, and significant amounts of hydrogen can be generated even under very alkaline conditions. Making the tank from stainless steel is an option, but a nitrogen purge is the best solution to avoid hydrogen accumulation.
Explosion in a primary reformer furnace
The ammonia plant in this instance was built in 1968 in Belgium. The auxiliary boiler shared the convection zone and primary reformer arch burners, but also had tunnel burners that exited the primary and steam superheat burners below the steam superheat coil. The groups of burners all had pressure controllers. Isolation in the event of a trip could be carried out by shutting the pressure controllers in the control room and the outside operators isolating each burner.
On 26 June 2009, a lightening strike on power lines resulted in an entire site shut down. The night shift restarted the boiler before going home. The first job for the day shift was to start the superheat burners. They lined the gas up and put it in the igniter when an enormous explosion occurred (Figure 3). The two operators involved were both seriously injured with broken bones and burns.
A picture of the remains of the primary reformer showed that the equipment had no walls left, tubes were visible and the roof had collapsed onto the tube tops. The primary reformer walls were stopped by the secondary on one side, the convection zone on another, the pipe rack, and the control room (located 15 m away).
The cause was identified as the night shift had isolated gas to the tunnel and superheat burners in the field but not to the reformer arch burners, and the pressure controller to the reformer was still in auto. The day shift workers found the tunnel burners isolated and assumed that the arch burners were also isolated, but they were not. Hence, when they lined up the gas to the superheater burners, gas started
going into the reformer box via the pressure controller. It mixed with the air and just needed an ignition source.
The control room, which was nearby the furnace and not blast-proof, was minimally damaged.
There was an inherent weakness in the process safety system, no operational discipline (checklist was not followed on start-up), no interlock system, and a lack of experience on the part of on-shift operators for start-up procedures.
The plant was out of operation for 11 months – two months for demolition and nine months for reconstruction. A new automated burner management system proposed by KBR was accepted and installed in the recommissioning stage.
Ammonia storage incidents
Examples of tank failures are summarised below.
Rupture of a cryogenic ammonia tank
On 20 March 1989, an accident took place in a Lithuanian fertilizer plant, which destroyed a 10 000 t ammonia storage tank.
The whole ammonia tank was dislodged from its foundation, smashed with great force through the surrounding wall of reinforced concrete and finally landed about 40 m from the foundation.
Devastation around the tank was enormous and liquid ammonia around the plant site was 70 cm deep. Large quantities of ammonia evaporated, the ammonia gas caught fire and the whole plant area was engulfed in flames.
About 32 000 people were evacuated from a nearby town, the rescue operation continued for three days and the total fatalities were seven, with 57 people injured.
It was reported that the ammonia tank over-pressured due to a rollover of its contents, resulting from the warm ammonia being supplied to the bottom of the tank while at the same time, tank refrigeration compressors were out of service.
Failure of the inner shell of a double integrity ammonia storage tank
A failure occurred in Coromandel Fertilisers' 5000 t tank in India. Initially commissioned in 1998, the tank needed to be decommissioned and repaired. A level transmitter with a high-level alarm measured the liquid level in the tank's annular space. The transmitter was falsely reading zero because the as-built drawings were incorrect. The operators took no action to drain the annulus because they thought the tank did not have a high level, which was in fact 6.5 m. Splashing from the inner tank during ship unloading had diverted ammonia to the annulus.
The inner cup was drained to 0.813 m before ship unloading began. The hydrostatic head of ammonia in the annulus acting on the bottom plate fractured the bottom side plates and circumferential weld.
A decision was made to decommission the tank for inspection when the liquid level in the annulus came to light. The tank repair included removing and refilling the bottom sand layer, repairing and replacing shell courses and the bottom plate, and other modifications.
To prevent a recurrence, the tank was de-rated to 4865 t, and the settings of alarms and trips were changed to
42 | WORLD FERTILIZER | JULY/AUGUST 2023
provide at least 500 mm of free board between the maximum allowable liquid and overflow levels. A separate instrument was added to record the tank's inner cup and annulus levels. A parallel independent level indication was also provided for the annulus. All indicators were changed to fail-safe. A temperature indicator with a low-temperature alarm was installed to monitor the annulus temperature. An interlock was set to trip the ammonia pumps at an annulus ammonia depth of 400 mm. The annulus drain line was permanently connected to the drain pot and routine draining of the annulus every weekend was instituted. The siphon breaker in the tank's liquid inlet line was modified so that the top hole of the dip pipe was above the tank's maximum liquid level. All documents were updated to reflect as-built conditions.
Tank failure at Yara
While recommissioning a repaired atmospheric ammonia storage tank, overpressure ruptured the tank during the cool-down step (Figure 4). The ammonia release caused injuries and a fatality. The tank was recommissioned after a drain valve had been replaced. The tank had been drained and purged. The incident occurred in 2005 at Yara's Rostick plant in Germany.
Yara followed the European Fertilizer Manufacturers Association (EFMA) guidelines for decommissioning and recommissioning atmospheric ammonia storage tanks. The EFMA guidelines state that a sufficient volume of an ammonia water mixture (20% ammonia) should be placed in the tank to entirely cover the bottom before introducing
liquid ammonia for cool-down. The purpose of the water is to prevent liquid ammonia from impinging on the floor plates and causing them to cool rapidly in the presence of oxygen, resulting in SCC.
After cooling the tank, Yara began draining the aqua, and the tank failed. The failure occurred on the floor at the outer tank seam, allowing liquid ammonia to escape.
Yara had introduced enough aqua to fill the tank to 25 cm to cover the entire bottom regardless of slope. However, a layer of oil had floated to the top of the aqua. The draining disrupted the oil film, allowing liquid ammonia to mix with the aqua and to generate enough heat to boil off liquid ammonia rapidly. The ammonia vapour overwhelmed the pressure relief system and caused the floor-to-outer-cup seam to fail. An investigation found that the pressure in the tank had possibly reached two barg.
Conclusion
This article has highlighted some of the most significant incidents in the ammonia industry over the last 25 years. The industry has since learnt many lessons by sharing these stories at international symposiums and conferences. Technology licensors, EPC companies, equipment vendors and catalyst suppliers have all contributed to the developments in making ammonia plants inherently safer and more reliable with improved design, fabrication and catalyst performance. Hence, the safety incidents have been reduced, and now, the industry focuses on inherently safer design (ISD) with the least dependence on human factors. Nevertheless, further efforts are still required to train plant operations teams.
The Doyle and EMT Alliance

Can provide you with all the Blending, Bagging and Transport equipment you need.

High Speed Bagging Line
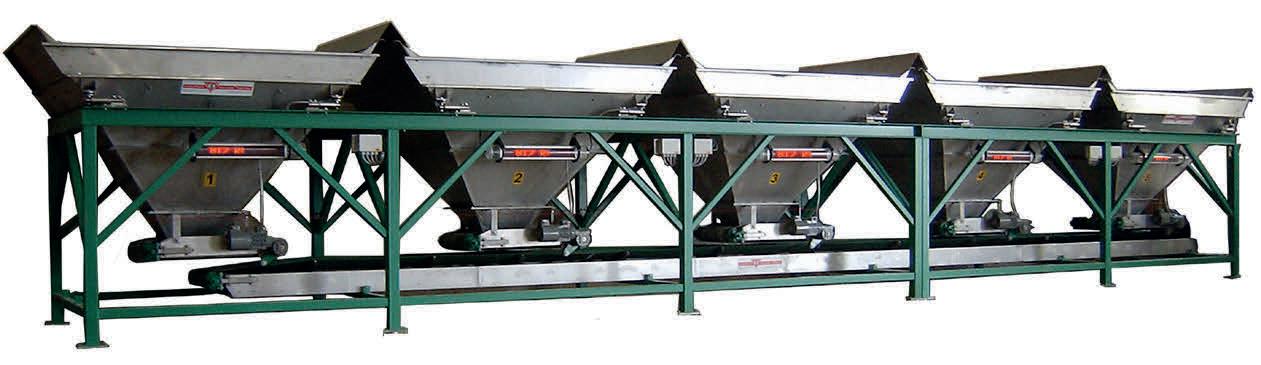
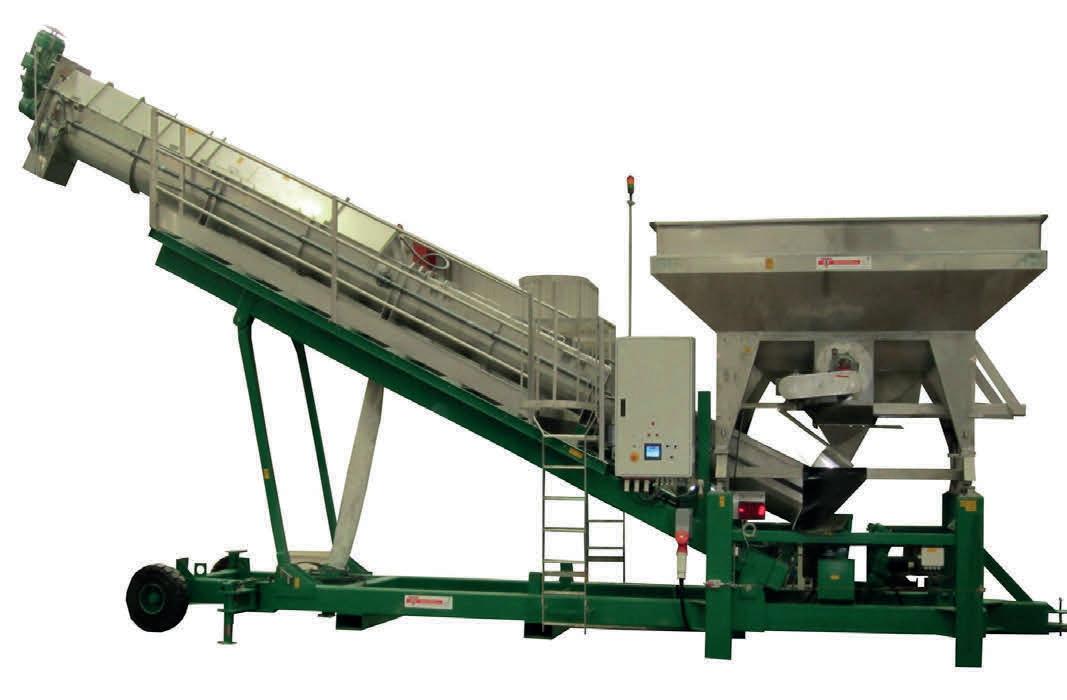
* For big bags - jumbo bags.
* Capacity 50 to 70 ton m³ per hour.
* 120 kg to 1250 kg bags.
* Suitable for granular and powder materials.
* Available with dust reducing system.
Weighcont Blender
* Capacity of 20 to 200 ton per hour.
* Unlimited number of hoppers.
* Computer controlled.
* Custom built.
Fertilizer Inhibitor Treating Unit
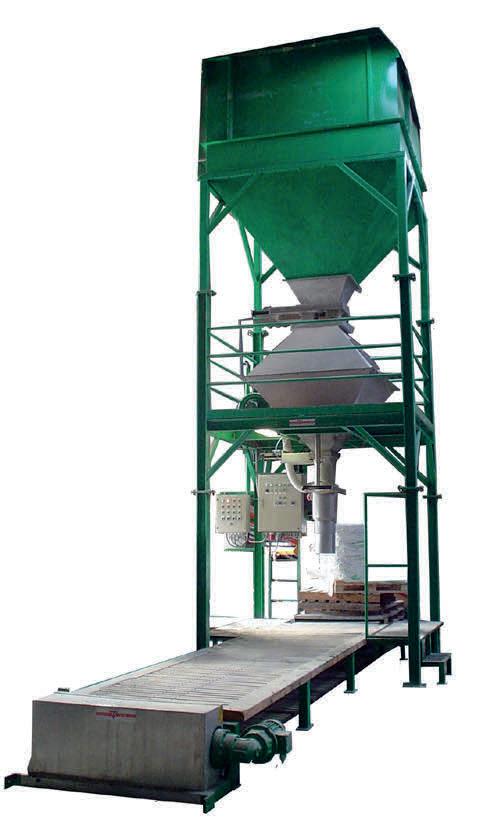
* Portable.
* Stainless steel.
* Computer controlled.
* High Capacity120 m³ per hour.
EMT
Molenpad 10, 1756 EE ‘t Zand The Nederlands. Tel.+31 (0) 224 591213 email: emt@emt.tech
www.emt.tech
Shamrock Blender
* Capacity of 25 to 70 ton/m³ per hour.
* Machine size 4,5-5,4-7-9-11,5-14 ton.
* Easy and gentle blending process.
* Blending and weighing are separated.
Doyle Equipment Manufacturing 1 Jack Doyle Industrial Drive, Palmyra, MO. 63461 USA. Tel. +1(217) 222-1592 & +1(573) 300-4009 doyle@doylemfg.com, www.doylemfg.com
Murtaza I. Gandhi and Anthony G. Sarrack, Baker Engineering and Risk Consultants, Inc., USA, discuss the application of various gas detection technologies in fertilizer plants and the role they play in strengthening toxic shelter-in-place (SIP).
The fertilizer industry is a critical sector that plays a significant role in supporting agricultural production and food security worldwide. However, the production and handling of fertilizers can expose workers and nearby communities to hazardous chemicals and toxic gases. Therefore, it is crucial to implement appropriate safety measures, including the installation of reliable toxic gas detection systems, to ensure the prompt detection and mitigation of toxic gas releases in fertilizer plants. This article focuses on toxic gas
detection in fertilizer plants as an essential tool for shelter-in-place (SIP) emergency responses to protect workers from toxic hazards.
Key aspects of a highly effective toxic risk mitigation strategy for SIP are as follows:
n Timely, reliable detection of toxic gases in order to take actions such as:
§ Outdoors – isolate heating, ventilation, and air condition (HVAC) prior to impact by the toxic plume and issue guidelines for evacuation once the plume clears.

44

45
§ At the SIP HVAC inlet – ensure reliable, timely isolation when the toxic plume impacts the building.
§ Within the SIP – provide informed decisions for evacuation from the SIP by providing information about the toxic concentrations outside.
n Timely, reliable isolation of ventilation systems to avoid ingression of toxic gases.
n Establish a leak-tight SIP volume to minimise infiltration.
§ Establish a secondary barrier to minimise the impact of toxic air infiltration. Use a room or set of rooms within the SIP building as the protected space(s) to address impacts due to doors being opened after the toxic plume impacts the building.
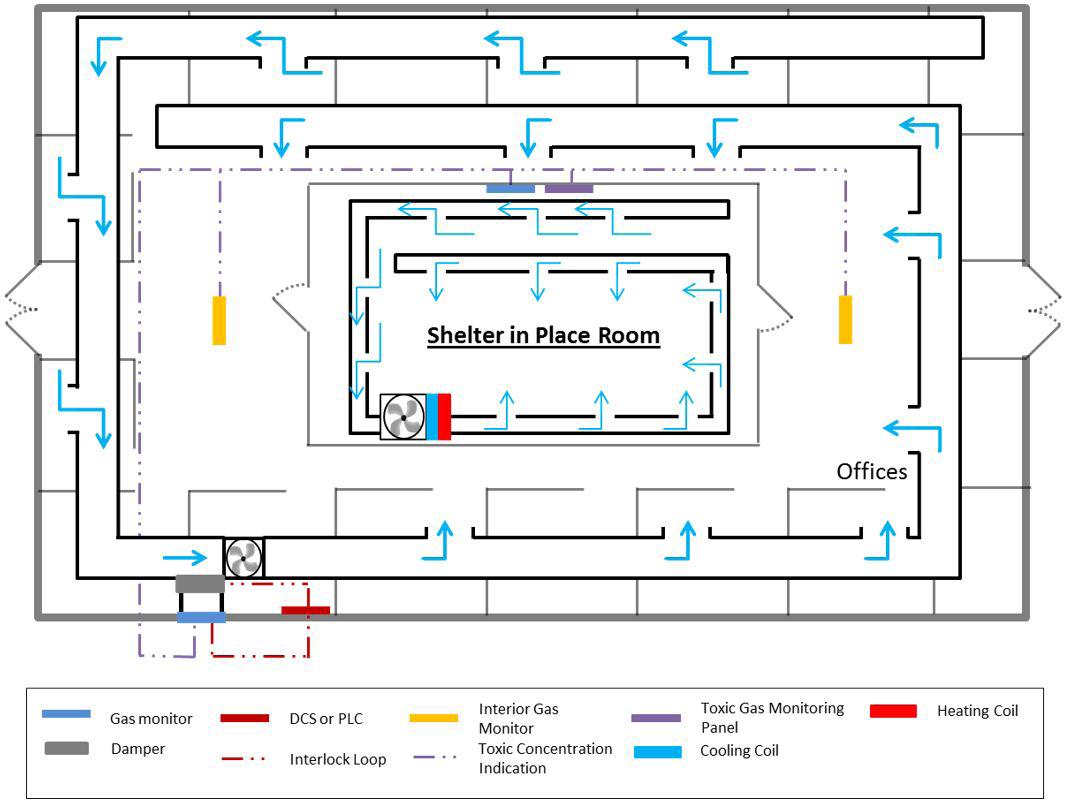
§ Address occupancy/volume/tightness to ensure that any CO 2 buildup and/or O 2 depletion issue is understood.
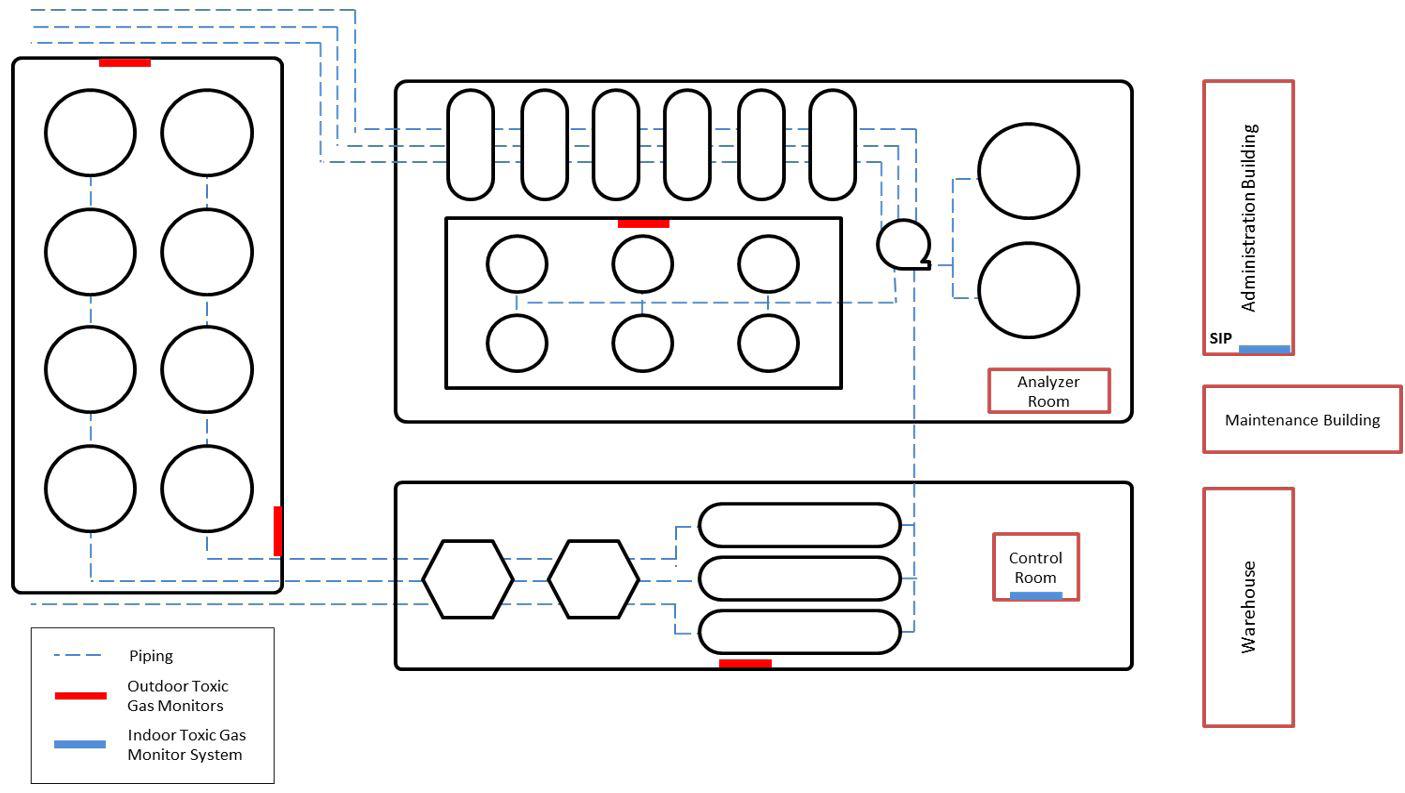

n Train personnel and provide instructions to ensure that sheltering activities are performed properly.
n Provide an effective backup/evacuation plan.
§ Provide indoor toxic gas monitoring for the SIP.
§ Develop procedures that identify when to evacuate the SIP.
§ Train personnel so that they take appropriate actions.
§ Provide clear communication channels between the SIP location and emergency response personnel.
§ Maintain reliable, appropriate escape packs to allow safe evacuation.
Additional enhancements can be implemented to further reduce toxic risk or to improve comfort levels within the shelter location. These include the following:
n Implement a filtration/scrubbing system to reduce toxic concentration.
n Provide reliable, efficient purging of SIP to reduce effective infiltration rate.
n Provide an air-supplied header with full face respirators to allow long-term occupancy by essential personnel (typically limited to control room locations – this is intended only for trained personnel).
n Enable heating and cooling systems to remain functional without causing any ingression or potential path of infiltration.
n Provide potable water and lavatory.
n Include sealed windows and/or cameras to better reveal outdoor conditions to the SIP occupants.
n Establish outdoor/additional indoor toxic gas monitoring.
Aspects of an effective risk mitigation strategy for SIPs are addressed in more detail below.
Toxic gas detection
Fertilizer manufacturing facilities with severe toxic hazards, such as ammonia, should be equipped with toxic gas monitoring technology to ensure that personnel are made aware of possible toxic gas infiltration in their work area. Effective monitoring will
46 | WORLD FERTILIZER | JULY/AUGUST 2023
Figure 1. Toxic gas monitor.
Figure 3. Plant toxic gas detection system.
Figure 2. Toxic gas detection system for SIP.
BRINGING EDUCATION AND INDUSTRY TOGETHER.
SHORT COURSES: SEPTEMBER 25, 2023


SYMPOSIA: SEPTEMBER 26 – 28, 2023

GEORGE R. BROWN CONVENTION CENTER • HOUSTON, TX
The Turbomachinery & Pump Symposia is recognized worldwide as the industry’s must-attend event. Connect with more than 4,750 delegates, meet with leading suppliers, observe product demos, and get answers to your technical questions. We look forward to seeing you in Houston!


4,750 ATTENDEES
365 EXHIBITING COMPANIES


45 COUNTRIES
TPS.TAMU.EDU


#TPS2023
HOSTED BY
allow personnel to take appropriate actions in response to the hazard.
To be effective, toxic gas monitoring should be provided in these areas:
n Ventilation intake of the SIP.
n Inside the SIP.
n Outside of the SIP.
The most important location for toxic gas monitoring is at the ventilation system intake of each occupied building intended to be used as an SIP. Without toxic gas monitors at the ventilation intake, a highly reliable ventilation system isolation strategy cannot be implemented.
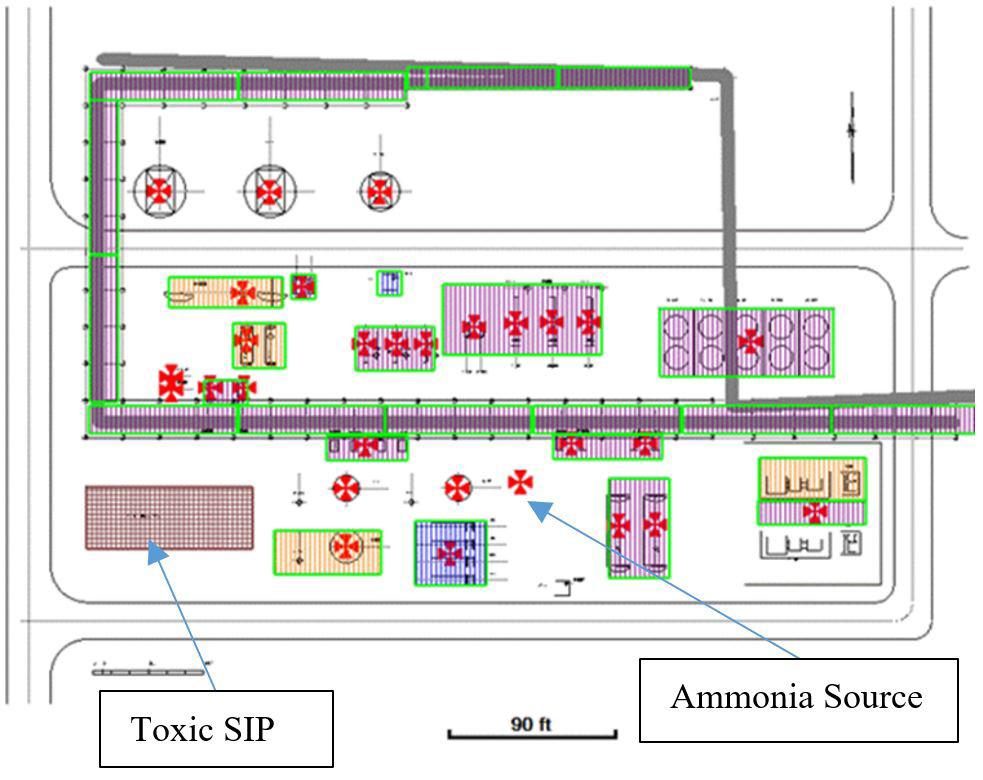
Functional requirements are as follows:
n Short response time.
n Highly reliable.
n Practical concentration threshold.
n Appropriate design for the toxins of interest.
Because it is possible for the SIP environment to become dangerous, it is important for the SIP to also provide toxic gas monitoring for the indoor environment. It is not critical for indoor toxic gas monitors to have as short a response time as the ventilation intake monitors, because indoor concentration will not rise as quickly as the concentration at the ventilation intake (outdoors). It is important that the indoor toxic gas monitors are maintained to be reliable and are appropriate for the toxins of interest (toxins with potential to cause dangerous concentrations within the SIP). It is not as important to establish interlocks or alarms on indoor toxic gas monitors, as occupants who are sheltering in place would almost certainly pay close attention to the monitors, and are likely to have the necessary training and knowledge to act appropriately. In addition, actions would likely be taken as conditions degrade, so timeliness and responsiveness are not nearly as critical as with ventilation isolation.
To take full advantage of the safety afforded by a SIP, it is important for occupants to remain within it while it continues to provide a safe environment. Providing proper PPE will allow occupants to evacuate the SIP before it
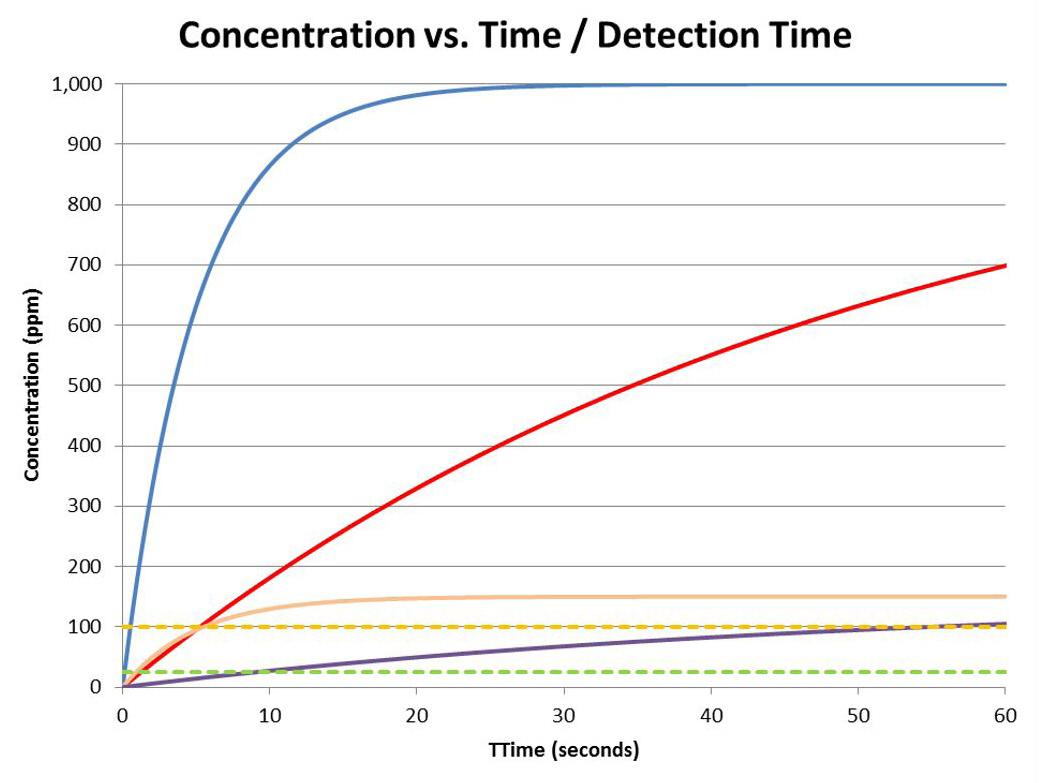
48 | WORLD FERTILIZER | JULY/AUGUST 2023
Case Buildong section Wind direction OV for 15 min - no HVAC isolation Ov for 30 min - no HVAC isolation OV for 15 min - with HVAC isolation OV for 30 min - with HVAC isolation 1 Admin - no detection 90 41.1% 76.8% 1.9% 4.7% 1 Admin - no detection 112.5 41% 76.8% 1.9% 4.7% 1 Admin - no detection 67.5 39.7% 75.8% 1.7% 4.4% 2 Admin - with detection 90 0.6% 0.6% 0.6% 0.6% 2 Admin - with detection 112.5 0.6% 0.6% 0.6% 0.6% 2 Admin - with detection 67.5 0.5% 0.5% 0.6% 0.6%
Figure 4. Example concentration profiles and alarm setpoints. Table 1. Building occupant vulnerability – Cases 1 and 2.
Figure 5. Example of a plant with toxic source and SIP.
becomes dangerous to remain within it. Although indoor toxic gas monitors within the SIP do not need to have alarms, it is important for outdoor concentration thresholds to be established and understood by occupants of the SIP. Without this understanding, occupants may evacuate the SIP even though the environment within it is safe, and the outdoor toxic gas concentration is highly lethal. The lack of pre-established concentration thresholds and response actions may also result in occupants remaining within the SIP as the conditions become too dangerous to remain.
In addition to toxic gas monitors at ventilation intake and within the SIP (shown in Figure 2), it is also essential to provide reasonably thorough toxic gas monitoring within outdoor areas of the plant as shown in Figure 3.
Providing toxic gas monitoring in areas where releases are most likely to occur (pumps, compressors, loading/unloading areas, etc.) improves the likelihood that the hazard will be detected before the SIP is impacted. This allows ventilation to be isolated (reduce ingression), and assists in determining when it is safe to evacuate the SIP after the release has been isolated.
Outdoor monitoring should provide real time concentration readings to emergency response personnel so they can provide helpful advice regarding evacuation routes and mustering points. The information may also be used to identify the release location so it can be rapidly isolated.

It is critical to select appropriate instrumentation for toxic gas detection and concentration monitoring. For example, the detectors and associated instrumentation must be designed for the material as well as the concentration ranges that may occur. Detectors also need to be located appropriately to ensure that vapours are reliably detected in a timely manner. Point gas detectors vs open path should be considered. Point gas detectors are contact type detectors and require the gas to come into contact with the sensor.
If not laid out correctly, the most expensive and responsive sensor may fail to detect a release. Open path detectors (typically infra-red or laser based) provide the product of toxic gas concentration and distance along lines of interest between sensors, which helps determine if the area under the detector coverage is impacted by a gas release.
Open path detectors are generally more expensive than point gas detectors, but as they do not require contact with the gas, fewer detectors may be needed to adequately cover a given area and may be more practical in some cases, for example, where an existing toxic gas system is being upgraded and the new detection system can interface with the existing PLC/DCS in the area. Costs may be similar for point detectors vs an open path system in terms of supporting hardware and software, as well as training of personnel.
Other aspects for selection of gas detectors are the signal generation/response time and the alarm setpoint. Response time is the time taken by a sensor to generate
Maximize SMR Performance with the Powerhouse Partnership of Blasch StaBloxTM and BD Energy Systems’ TOP Technology
With Blasch StaBlox Reformer Flue Gas Tunnel System and BD Energy Systems’ patented Tunnel Optimal Performance (TOP) Technology, you can expect:


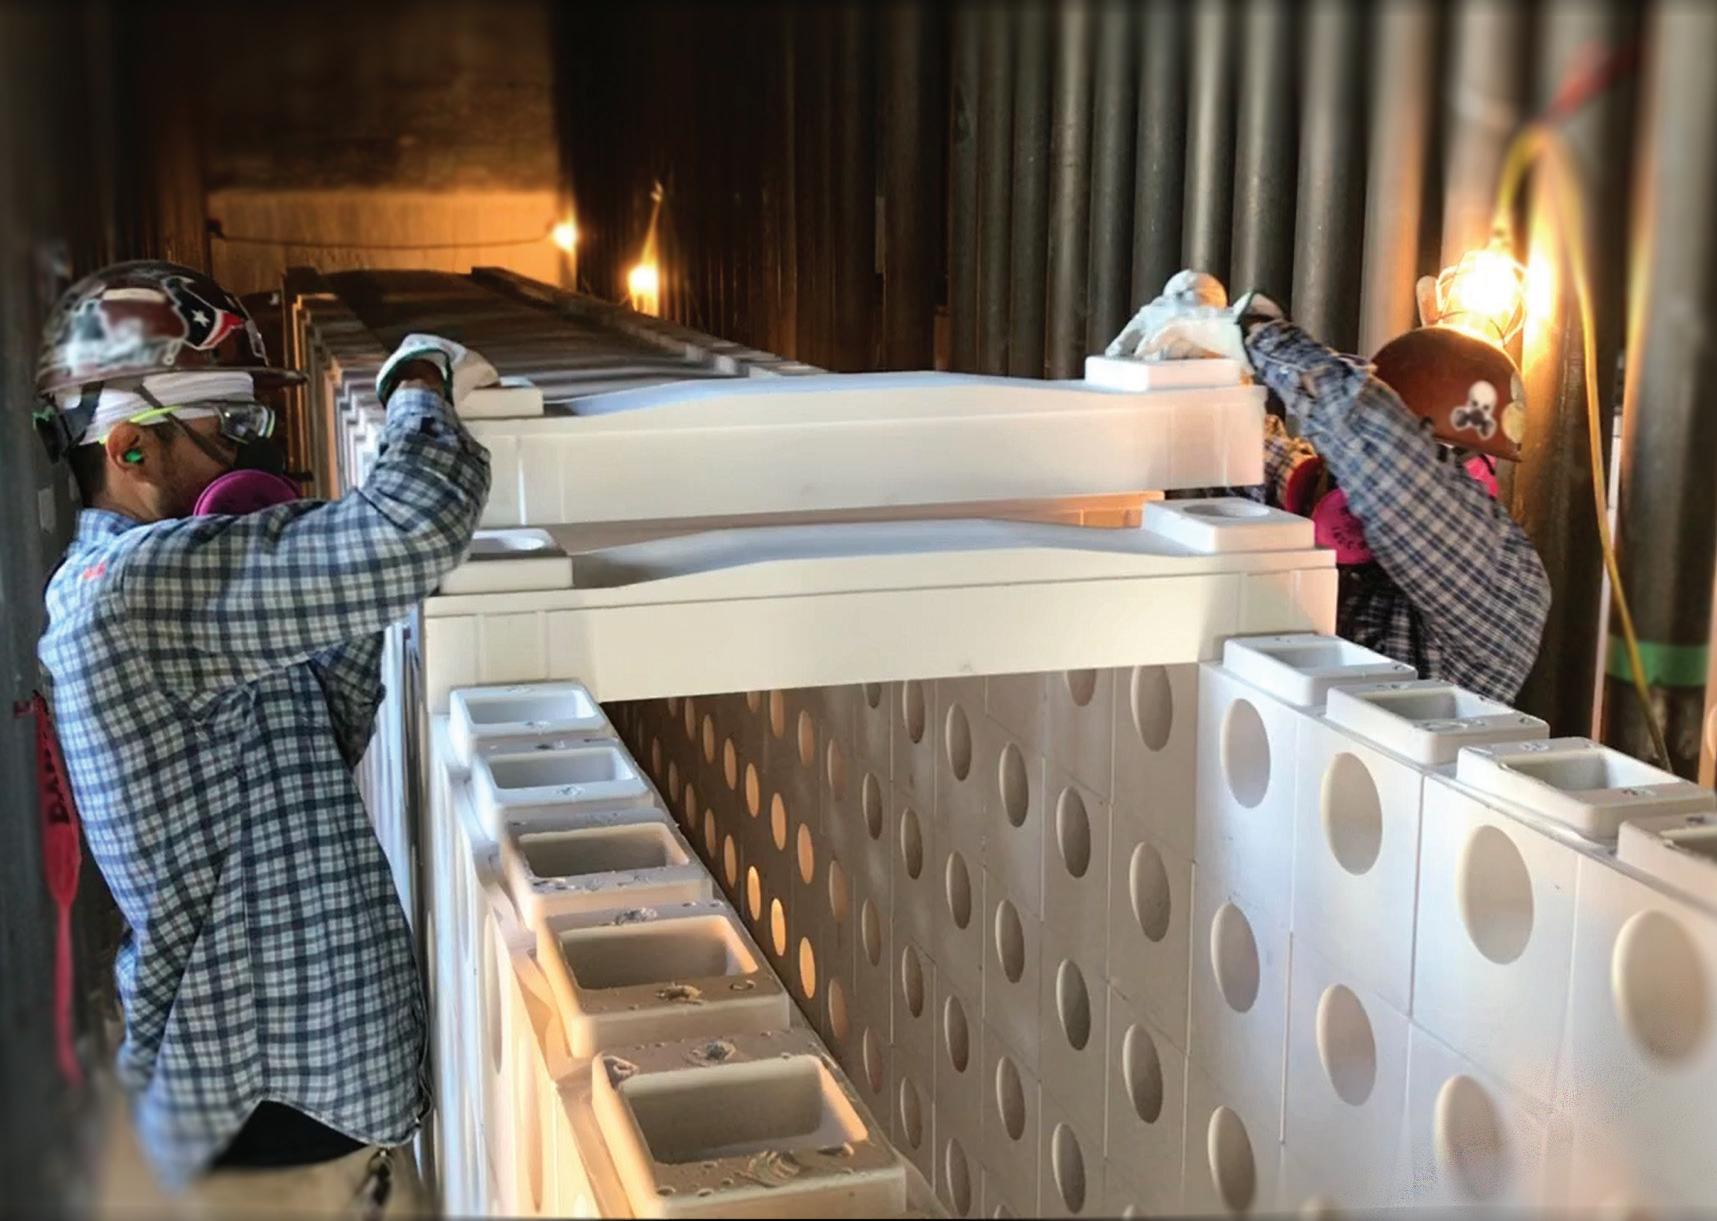
Improved temperature uniformity that can significantly increase output with less risk to catalyst tubes
Reduced pressure drop saves energy

Significantly faster installation time can shorten outages
Available for immediate shipment to meet unexpected needs
580 Broadway | Albany, NY 12204 | 518-436-1263 | www.blaschceramics.com Visit Blasch and BD Energy Systems at these upcoming conferences: AIChE Safety in Ammonia, August 20-24 Scan the QR code to learn more about StaBloxTM
a signal after coming in contact with a gas. It can be thought of as the amount of time the system lags behind the actual gas concentration. It is an important parameter in all cases where rapid response is desired, for instance, it is crucial for detectors on the HVAC inlet to respond quickly to ensure that the toxic gases drawn in by the ventilation system are minimised. However, response timing is not important for detectors within the SIP because conditions change relatively slowly, and actions that occur in response to the alarm are not immediate.
Figure 4 shows a range of different gas concentration vs time profiles for a hypothetical HVAC inlet toxic gas detection system. The importance of response time and alarm setpoint is discussed for each example concentration profile to clarify this point.
For the purple line, maximum concentration is only marginally higher than the high setpoint (100 ppm), and is about five times as high as the lower setpoint (25 ppm).
If the detector has a 30 sec. response time, and the alarm setpoint is 25 ppm, it would alarm approximately 40 sec. after the toxic gas initially reaches the detector (10 sec. to reach 25 ppm plus 30 sec. response time). However, if the alarm setpoint were 100 ppm, it would take 85 sec. (55 sec. to reach 100 ppm plus 30 sec. response time).
The extra 45 sec. to reach the alarm setpoint in this example may be critical in a real-world situation.
The orange line shows a more rapid concentration rise, so alarm setpoint is less important, since the amount of time it takes for gas concentration to rise from the 25 ppm alarm setpoint to 100 ppm is only about 5 sec. In that example, the alarms would be tripped at approximately 31 sec. or 36 sec. after toxic gases initially reached the target for the low and high setpoints, respectively.
The red line indicates that the rate at which concentration rises to the maximum concentration is slower, but since the maximum concentration is dramatically higher than the alarm setpoints, the time it takes to rise from the lower to higher setpoints is short (very similar to the orange case, at about 5 sec.).
The blue line is an example showing that the effect of an alarm setpoint is negligible for the timing of an alarm, because the maximum concentration is dramatically higher than the alarm setpoints being considered, and the concentration rises quickly to that level.
Although a lower alarm setpoint means a shorter alarm delay, it is also more likely to result in nuisance alarms. Alarm setpoints should be optimised with consideration of the types of toxic gas concentration profiles that might occur, the importance of alarm timing, and the likelihood of nuisance alarms.
General characteristics of toxic gas detectors
Toxic gas detectors are generally electro-chemical, point-type sensors. Some vendors have toxic line-of-sight gas detectors, which are not covered in this paper, but typically use infra-red or laser based sensors.
Electrochemical sensors operate by reacting with the gas of interest and producing an electrical signal
proportional to the gas concentration. Gas that comes in contact with the sensor first passes through a small capillary-type opening and then diffuses through a hydrophobic barrier and eventually reaches the electrode surface. This approach is adopted to allow the proper amount of gas to react at the sensing electrode. The gas that passes through the barrier then reacts with the sensor and produces an equivalent electrical signal.
Some of the key characteristics to look for when selecting toxic gas detectors are described below:
Detection range
The range in PPM depends on the specific gas. The sensor should be chosen based on the gas of interest. For NH 3 , the range is normally 0 – 100 ppm or 0 – 500 ppm. Consideration should also be made for the location. For instance, the sensors inside the building could have a lower range, while those outside could be a higher range.
Response time
Time for the concentration of the gas in contact with the sensor to reach 90% of its full scale value, or T90, should be approximately one minute. Faster response time is generally advantageous, especially for external sensors. For sensors inside the room, a higher response time may be acceptable as the building prevents rapid buildup of gas, hence the approximately one minute response time has no impact on the overall SIP response.
Accuracy
10% of reading or 5% of full scale value are acceptable. Toxic detectors average about 10% accuracy across manufacturers.
Nuisance readings
Nuisance readings or false alarms can reduce the overall reliability of the system. Alarm setpoints should be low enough to alert personnel of toxic gas concentration buildup, but high enough to reduce nuisance alarms/trips – this is more important for outside sensors, as inside sensors should usually indicate a zero value.
Humidity
Sensors are designed to operate at certain relative humidity (typically 15 – 90% RH). Provision should be made to operate the sensor in the permitted environment. In high humidity conditions, prolonged exposure can cause excessive water buildup and create leakage. In low humidity conditions, the sensor can dry out.
Installation location
The location of sensors should be determined using consequence based tools (the best location is wherever the sensor comes in contact with toxic gas for maximum possible credible release scenarios). For SIPs, it is critical that detection be provided at the HVAC inlet to ensure timely HVAC isolation when needed. Within the SIP, the location of detectors is not important, since concentration would typically rise slowly and readily disperse throughout
50 | WORLD FERTILIZER | JULY/AUGUST 2023
GLOBAL NETWORKING... LOCAL RESULTS. Connect with suppliers and producers active in the Ammonium Nitrate and Nitric Acid market , meet technical leaders and share your experiences and knowledge, and discuss the latest innovative technologies.


VISIT OUR WEBSITE TO REGISTER

10-15th SEP 2023
ASTOR GARDEN HOTEL VARNA, BULGARIA
the protected volume. Ease of maintenance and calibration should also be considered when choosing a location.
Calibration
Some manufacturers require separate calibration gas and more frequent calibration. Sensors like these should be provided with calibration kits to reduce maintenance times. Other manufacturers have auto calibration where a sample gas is always present in the sensor body, thereby not requiring an external calibration gas assembly. Calibration and testing of detectors should be performed at least at the manufacturer’s recommended frequency. If the governing standard in the area or calculations require more frequent testing, that standard should be followed.
Test gases and sample gases
To achieve proper calibration of the sensor, it is important to have the correct concentration of test and sample gases. If the gas concentrations of the sample gas and the actual process gas do not match within the tolerance range, the response during a release may be delayed.
Diagnostics
Sensors provide diagnostics which signal 'end of life', 'out of calibration', 'signal issues', etc. Diagnostics should be closely monitored to improve accuracy and reduce nuisance readings.
Hazardous area classification
Sensor assembly should be classified according to the area of installation.
Regional and national certifications
Local certification requirements should be met.
IEC61508 certification
Safety Integrity Level (SIL) certification is available for certain devices. If the toxic gas detection is part of an automatic action associated with a specific reliability requirement (e.g., HVAC shutdown), that certification should be considered.
Case study
An example of a fertilizer manufacturing facility is shown in Figure 5. The facility manufactures and stores ammonia for use in nitrogen-based fertilizers. There is only one building in the plant (marked with brown dashes), and it is set up as a toxic SIP. There is an ammonia release source approximately 130 ft (40 m) from the building. A 0.5 in. release from the source is expected to reach over 1500 ft (457 m) at 90% lethality levels for an assumed exposure duration of 10 min.
It should be noted that red crosses in the figure indicate different release sources.
Source parameters
n Ammonia at pressure of 150 psig, 70°F, pressurised liquid.
n Unlimited inventory, 0.5 in. release at 3.3 ft (1 m) elevation.
Building parameters
n Wood trailer, with HVAC air changes of 0.6 ACH (air changes per hour).
n Isolated building (toxic SIP) 0.5 ACH at 5 mph wind speed.
n SIP room inside building 0.15 ACH.
n Egress delay after source isolation: 5 min.
Case 1 (without detection)
n Time to HVAC isolation: 3 min.
Case 2 building parameters (with detection)
n Time to HVAC isolation: 1 min.
n Evacuation from SIP (Building) at NH 3 concentration: 500 ppm.
n PPE availability: 95%.
In Case 1 for a 15-min. duration shelter inside the building, the occupant vulnerability (OV), or chance of fatality, is approximately a 40% for all the dominant wind directions as shown in Table 1. For a 30 min. duration, OV is approximately 75%. In both scenarios, all personnel are sheltering in place and not evacuating. Also, the HVAC isolation has failed to occur, since this is a manual shutdown and not based on gas concentrations in the HVAC duct.
For Case 1 with successful HVAC isolation, the OV values reduce to <2% and <5%, respectively, for 15 min. and 30 min. duration sheltering. Since the HVAC was successfully isolated within 3 min., the concentration inside the SIP room within the building was estimated to be approximately 1500 ppm. Evacuation is estimated 5 min. after the source is isolated; total time for personnel exposure is 26 min.
As shown in Table 1, for Case 2, OV for a 15 min. and 30 min. exposures with and without HVAC isolation is approximately 0.6%. Due to toxic gas detection inside the SIP, personnel evacuate when the indoor concentration in the SIP room reaches 500 ppm. With 95% success probability for PPE, OV is calculated to be significantly lower than Case 1.
Conclusions
Toxic gas releases in fertilizer plants can cause serious health issues, environmental damage, and property damage. Therefore, it is critical to implement effective toxic gas detection systems as part of SIP emergency responses to protect building occupants in the event of an unintentional release of ammonia or other toxic gas in fertilizer manufacturing. Toxic gas detectors play a very important role in making a toxic SIP highly effective. It is important to select appropriate detectors for use, place them in proper locations, maintain them to ensure reliability, and implement automatic HVAC isolation to support SIP effectiveness and backup plan reliability.
References
1. CHOU, J., (1999). Hazardous Gas Monitors, A Practical Guide to Selection, Operation and Applications. McGraw-Hill and SciTech Publishing.
52 | WORLD FERTILIZER | JULY/AUGUST 2023
High temperature hydrogen attack (HTHA) can be a pervasive damage mechanism in fertilizer production facilities. HTHA is often a concern in syngas loops in equipment such as reformer waste heat boilers, high temperature shift converters, and interconnected piping, as well as methanators and ammonia converters in some cases. Subsequently, this damage mechanism needs to be considered when selecting materials of construction for new fabrication, or when evaluating existing facilities for risk. In general, HTHA begins at temperatures of ~200°C (400°F) and higher, but high temperatures are not the only factor contributing to damage. Unfortunately, failures from HTHA often result in sudden, catastrophic ruptures as opposed to small leaks. These failures often occur during start-up (SU) and/or shut-down (SD) procedures when operating temperatures are relatively lower, but operating pressure (and therefore stress state) is still high. HTHA damage is cumulative and once damage occurs it cannot be reversed. In other words, while high temperatures are one of the necessary factors for HTHA damage, once damage is initiated, the material properties (namely, fracture toughness) are still degraded, even at lower operating temperatures. The aim of this article is to provide an overview of several approaches to managing HTHA risk in both new constructions, and existing facilities.
Paul J. Kowalski, The Equity Engineering Group (E2G), USA, discusses the approaches to managing high-temperature hydrogen attack (HTHA) risk in different fertilizer facilities.

53
Looking at HTHA
HTHA occurs when gaseous hydrogen (H2) diffuses through the steel and reacts with carbon (C) within the metal matrix to form methane gas (CH4). Once the methane gas is formed, the CH4 molecules are too large to diffuse back out of the steel and begin to form micro voiding at the grain boundaries. Given enough time, the micro-voids will grow into micro-fissures, then into micro-fissures to macro-fissures, and eventually coalesce into crack-like flaws. Additionally, as the carbon reacts to form methane, the steel will also decarburise, or deplete the carbon within the steel matrix, which would further weaken the material properties. Again, HTHA damage also reduces fracture toughness, which renders equipment more susceptible to brittle fracture.
HTHA damage often initiates in welds and heat-affected zones where weld residual stress (WRS) and possible bending moments are highest (Figure 1).
The API RP 941 Nelson curves are shown in Figure 2, and represent acceptable operating conditions (temperature and hydrogen partial pressure) relative to the materials of construction to avoid HTHA. If the operating coordinate lies above and/or to the right of a given curve, then that material would be considered to be susceptible to HTHA damage. Generally, increasing the chromium and molybdenum content of the steel increases resistance to HTHA, as can be seen in the Nelson curves (i.e., 1.25Cr-0.5Mo is more resistant to HTHA relative to ‘plain’ carbon steel). Additionally, carbon steel has two different curves based on PWHT status (e.g, PWHT’d or non-PWHT’d). This differentiation was introduced into the most recent eigth edition of API 941 (2016) as further understanding was ascertained. In addition to operating conditions, the overall stress state of a given component strongly impacts the location and severity of the HTHA damage. Non-PWHT’d carbon steel contains a significantly higher weld residual stress (WRS) profile relative to PWHT’d carbon steel, hence the more limiting curve. C-0.5Mo equipment and piping is now screened with the PWHT’d carbon steel Nelson curve.
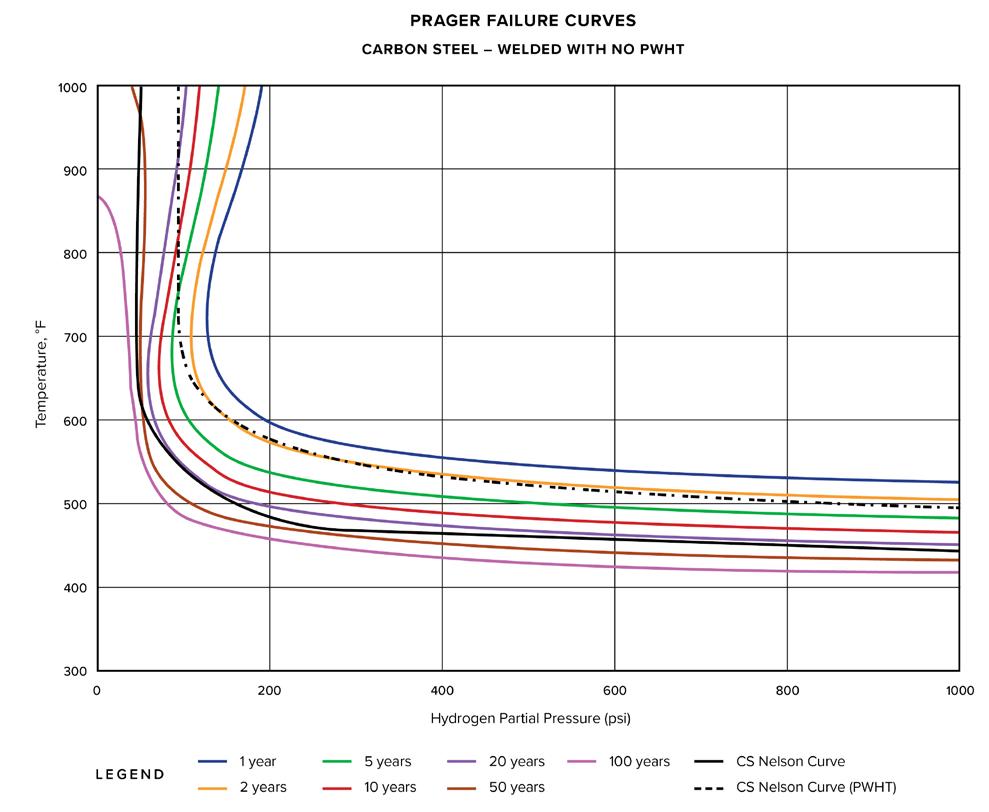
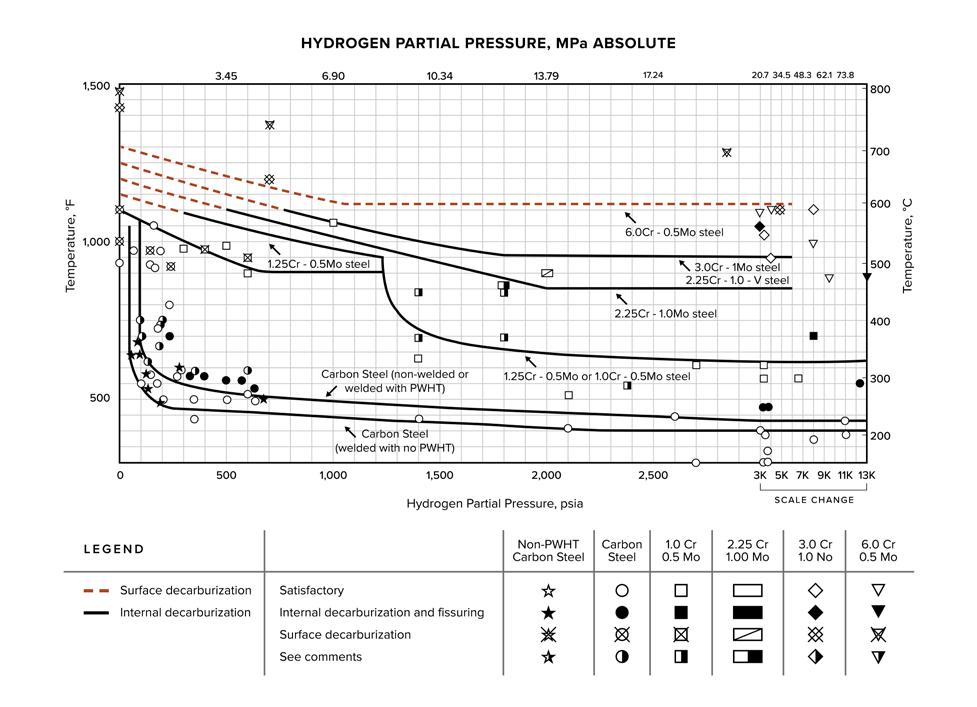
HTHA screening methodologies: Level 1
When evaluating existing facilities for HTHA risk, a common ‘Level 1’ screening (analogous to API 579 FFS approaches) exercise involves reviewing an entire processing unit to determine which fixed equipment and piping may be susceptible to HTHA damage. It is generally most efficient to perform this screening exercise at the P&ID level to confirm that all components within a given unit are captured (piping process lines would likely be missed if performed at the PFD level). First, a spreadsheet is typically created with line items for all piping line numbers and fixed equipment that operates at 400°F or higher. This spreadsheet should include the line numbers/names, fixed equipment tag numbers, material of construction, and PWHT status. Effectively, this screening exercise involves applying a single operating condition (temperature and hydrogen partial pressure) to each line item in the spreadsheet.
This typically requires close collaboration with plant operators to ensure assigned operating conditions are accurate and representative. Furthermore, when assigning operating conditions, it is generally helpful to review daily average PI temperature data for the past few years, if available, and appropriately conservative to assign the maximum historical temperature as the documented operating temperature. Hydrogen partial pressure calculations may also be provided from PI data, but more often, a fixed value of hydrogen partial pressure is provided by plant operators. Temperature typically has a much more significant impact on HTHA damage than hydrogen partial pressure (i.e., an increase of 25˚F is more limiting than an increase of 25 H2 psia).
Once the scope of the screening exercise has been developed and the operating conditions are assigned to each line item, the operating coordinates are plotted on the corresponding Nelson curve for comparison. A ‘green’, ‘yellow’, and ‘red’ risk ranking is applied to each line item. A ‘red’ risk ranking applies to line items currently operating on, or above the respective Nelson curve. The 'yellow’ risk ranking corresponds to line items operating within a safety factor of the Nelson curve (typically 50°F/50 H2 psia, or 50°F/25 H2 psia for non-PWHT’d CS), and the ‘green’ risk ranking equates to line items operating below the Nelson curve when including the safety factor. The action items for each risk ranking will vary by owner-user, the ‘yellow’ risk ranking however generally involves monitoring future temperature to

54 | WORLD FERTILIZER | JULY/AUGUST 2023
Figure 2. API 941 Nelson curves.
Figure 3. Example of time-based Nelson curves.
Figure 1. llustration of increased stress at welds/HAZs.
ensure that operation does not creep above the Nelson curve in the future, and/or placing an integrity operating window (IOW) limit on temperature to confirm operation below the Nelson curve into the future. The ‘green’ risk ranking typically requires no further action while ‘red’ risk rankings generally warrant inspection, replacement, or advanced fitness-for-service (FFS) evaluations.
HTHA screening methodologies: Level 2 fitness-for-service
Currently, Nelson curves are ‘time-independent’, and they only provide a go/no-go criterion for operation, whereas they do not provide insight on remaining life. E2G for example is currently working with several engineering firms to develop time-based Nelson curves for future editions of API 941. Figure 3 shows an example of time-based Nelson curves (i.e., Prager curves in honour of Dr. Martin Prager who contributed significantly to the API 941 technical basis document) for non-PWHT’d CS. It should be noted that such figures are for example only and should not be used for application. While sharing a similar slope to the existing Nelson curves, an estimated remaining life can be determined from Figure 3, based on exact operating coordinates. This figure represents an example of the likely next iteration of API 941 Nelson curves, and each material ‘type’ would have its own set of time-based curves. It is important to note that the 20-year Nelson curve roughly aligns with the existing non-PWHT CS Nelson curve, implying the ‘design life’ of the current Nelson curves may be approximately 20 years. This alignment helps illustrate the time-dependent nature of HTHA; operation slightly above the Nelson curve is typically not expected to result in rapid failure, rather from periods of extreme temperature, or long durations above the Nelson curve. This is an important observation when discussing the Level 2 FFS approach.
Until the final time-based Nelson curves are formally implemented into API 941, more advanced FFS techniques may be required. Following a Level 1 screening exercise, follow up Level 2 fitness-for-service is typically required for 'yellow' and 'red' risk ranked components (those operating on, or above the Nelson curve) to quantitatively justify continued operation. Effectively, an appropriate remaining life may be estimated to assist in guiding future operations (e.g., temperature limit IOWs), determine future inspection intervals, and enforce safe future operation until eventual replacement. This model is based on state-of-the-art test data and model validation from a recent joint industry project (JIP) to better understand the mechanism of HTHA. Crack-growth testing of carbon steel and C-0.5Mo material
in hydrogen autoclaves have been used to determine crack-growth rates which may be used in Level 2 FFS assessments.
Generally, the remaining life and inspection interval is based on the estimated crack-growth rate, HTHA inspections of equipment, and establishing the critical flaw size (via FFS).

Coupling the FFS evaluation with inspection is vital to ensure understanding of the state of damage in equipment. Once a critical flaw size is established, it is important to use proper inspection to verify the current crack-like flaw size to index into the FFS model. Another benefit of the previously mentioned JIP is advancement in NDE techniques and operators. Generally, time-of-flight diffraction (TOFD) is used in conjunction with phased array ultrasonic testing (PAUT) and TFM/FMC (total focusing method/full matrix capture) to inspect for HTHA. It is also important to ensure the inspection personnel is individually certified in using these techniques.
Often, the end result of the Level 2 FFS assessment is justifying extended operation for a given component, usually by at least two turnaround cycles if not longer. As an owner-user, this typically saves millions of dollars by being able to delay replacement, both from component construction/installation costs, as well minimising downtime that would have been required for replacement. In E2G's experience, approximately 85 – 90% of equipment or piping can be successfully qualified using Level 2 techniques. Very rarely are advanced Level 3 finite-element-analysis (FEA) assessments required.
Conclusion
Throughout the entire fertilizer and related products production pipeline, numerous equipment items and interconnected piping are exposed to high temperature ~200°C (400°F) hydrogen environments, rendering these components potentially susceptible to HTHA damage. Unfortunately, failures due to HTHA often occur with significant consequence (both personnel/community safety and financial). This article has presented a general overview of recommended approaches to economically and efficiently screen and risk-rank entire plants for HTHA damage based on material of construction, PWHT status, and operating conditions (temperature and hydrogen partial pressure). When medium (yellow) to high (red) risk components are identified, advanced FFS methodologies that have recently been developed are presented which may be used to significantly extend the life-cycle of ageing, susceptible components, ultimately realising significant savings. From Level 1 screenings to Level 2 FFS, to equipment inspections, it is critical to involve personnel highly experienced in managing HTHA risk for the entire process.

AUGUST
20
Attend the 67th Annual Safety in Ammonia Plants & Related Facilities Symposium
A century of ammonia synthesis technology with an emphasis on continual progress in ammonia plant safety.
✔ Collaborate with over 400 industry attendees from more than 40 countries
✔ Learn from others how to promote safety, operability, and reliability at your company
✔ Attend high quality technical presentations covering a range of safety and reliability topics
✔ Hear a roundtable discussion about industry incidents and near misses
✔ Receive an overview of what products are available to improve safety performance
✔ Meet vendors, service providers, and exhibitors, o ering access to the latest technical innovations
SAVE WHEN YOU REGISTER BY AUGUST 12
Register and learn more about Ammonia aiche.org/ammonia
Symposium attendees will learn the latest safety developments, safety incident studies, technological advancements, and maintenance improvements. You are invited to be part of the program. For general information about the Ammonia Symposium, please contact Ilia F. Killeen at 646-495-1316 or iliak@aiche.org.
© 2023 AIChE 8195_23 • 04.23
ORGANIZED BY
8195_23_Ammonia23_AIChE_Journal_Ad_PRESS_20230404.indd 1 4/4/23 1:56 PM
–
2023 THE
6 REASONS TO JOIN US IN 2023 GERMANY
24,
WESTIN GRAND MUNICH
Interested in Sponsoring at this event? Contact iliak@aiche.org
Book your group rate for AIChE Ammonia 2023
Safeguarding industrial operations involving hydrogen is a critical concern, particularly in fertilizer production. The destructive impact of high-temperature hydrogen attack (HTHA) can lead to catastrophic brittle fractures in plant equipment without warning. Therefore, ensuring the integrity of equipment that is exposed to HTHA environments is of the utmost importance to prevent accidents and economic losses.
Traditional methods such as the advanced ultrasonic backscatter technique (AUBT) were effective, but required advanced skills for early detection of HTHA damage. While the renowned Nelson curves have addressed HTHA concerns, a tragic incident at the Tesoro Anacortes refinery in 2010, resulting in seven casualties, highlighted the need for a comprehensive solution
beyond Nelson curves. To effectively mitigate HTHA damage, a risk-based assessment approach, combined with advanced non-destructive testing techniques such as high sensitivity wet fluorescent magnetic testing (HSWFMT) was required.
Time of flight deflection (TOFD), phase array ultrasonic testing (PAUT), full matrix capture/total focusing method (FMC/TFM), and in-situ metallography, have emerged enabling precise early detection of HTHA damage.
Unveiling HTHA: A key damage mechanism
It has been observed that the carbon and low-alloy steels used for piping, pressure vessels and heat exchangers exposed to high-temperature, high-pressure hydrogen service experience a loss of their strength and ductility, leading to catastrophic
Paresh Haribhakti and Ketan Upadhayay, TCR Advanced Engineering, India, outlines how fertilizer producers can proactively detect high-temperature hydrogen attack (HTHA) to enhance plant safety.
Mitigating the risk of HTHA Mitigating the risk of HTHA

57
brittle fracture. This type of damage is known as HTHA, or ‘hydrogen attack’.1 In ammonia plants, the most susceptible locations in which HTHA can occur are those near the ammonia converter outlet, high-temperature shift converter, the outlet nozzle of catalytic equipment, and the inlet nozzle of an exchanger, methanator, etc. The damage due to HTHA can occur at temperatures above 200°C and at hydrogen partial pressure of 0.80 MPa.2
At high temperatures, the molecular hydrogen thermally dissociates into atomic hydrogen (also known as nascent hydrogen). The root cause of HTHA is this atomic hydrogen that diffuses into the steel and reacts internally with the carbides (more precisely Fe3C i.e., cementite for plain carbon steel, or M3C i.e., alloy carbides for low-alloy steels) to produce methane (CH4) bubbles along the grain boundaries or at non-metallic inclusions in the steel. As methane is insoluble in steel, it accumulates as gas bubbles in small pockets at grain boundaries and inclusions that are present in steel. Eventually, there is build-up of methane gas pressure to form cavities and fissures within the steel that ultimately unite to form cracks.
The characteristic feature of HTHA damage is hydrogen-induced decarburisation at the surface and/or in the interior of the part, and fissuring and/or cracking at grain boundaries of steel. The surface decarburisation accounts for a drop in the surface hardness of the steel, whereas the internal decarburisation can lead to formation of fissures, blisters or cracks. The fissuring results in a significant and permanent drop in ductility of the steel. The extent of damage can be assessed by optical microscopy and advanced NDE techniques. Figure 1 is an optical micrograph showing internal decarburisation and the hydrogen induced fissures in steel. HTHA damage occurs in four stages, namely the incubation period, followed by the second and third stages of surface and internal decarburisation causing partial deterioration of mechanical properties and the final stage of fissuring and cracking. Figure 2a represents onset of HTHA, whereas Figure 2b corresponds to fissuring and cracking.

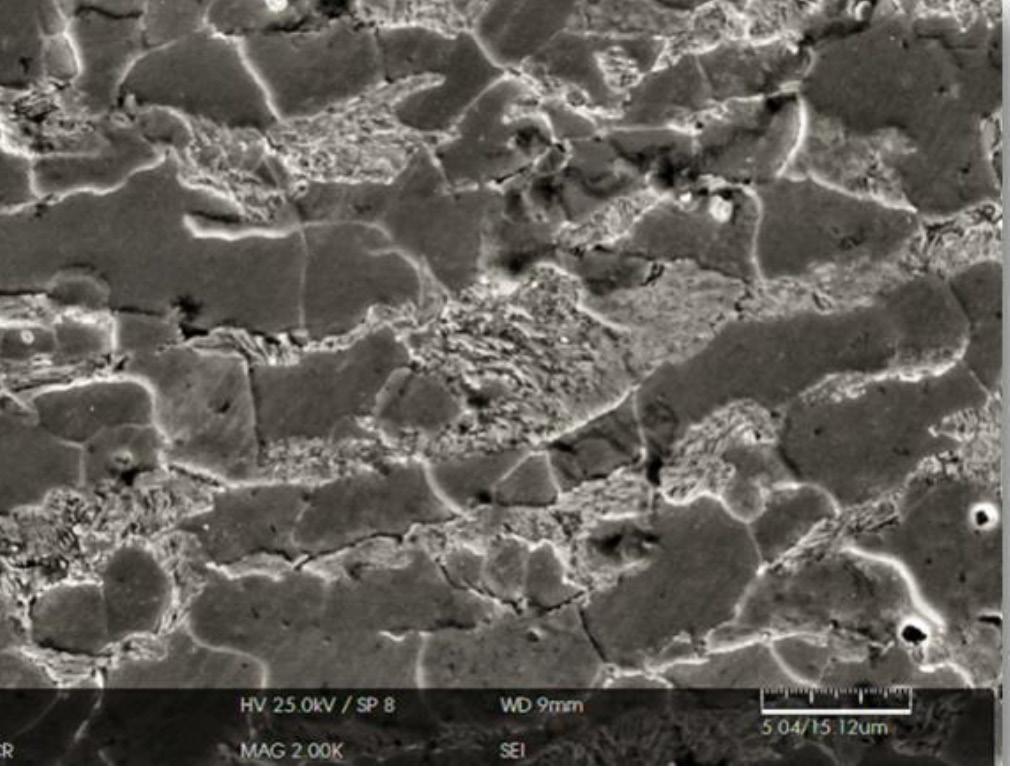
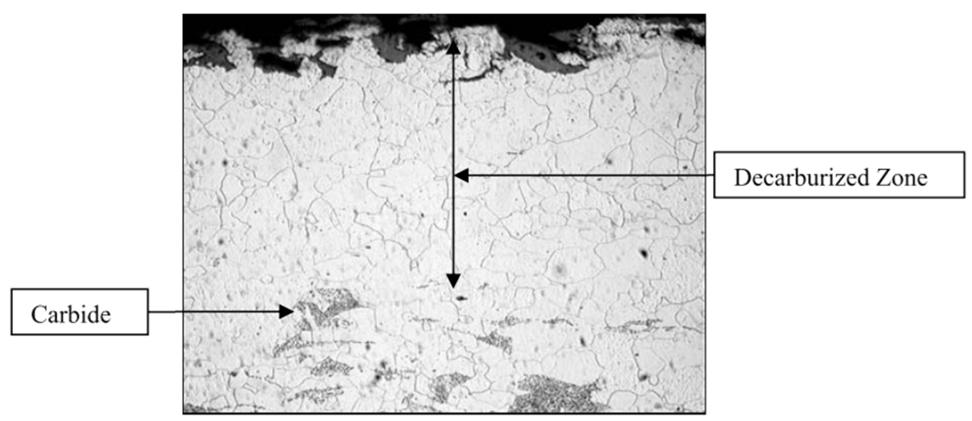
Failures due to HTHA have mainly been reported in the case of plain carbon steels and low-alloy steels. Welds of carbon steel equipment and pipelines, either with post-weld heat treatment (PWHT) or without PWHT are susceptible to failure due to HTHA. Likewise, low alloy steels of the type C-Mo, Cr-Mo and Cr-Mo-V are also prone to HTHA.3 The carbide stabilising elements such as chromium, molybdenum, vanadium and niobium in low-alloy steels offer improved resistance to HTHA compared to carbon steels due to greater stability of their carbides compared to cementite.
Ammonia process technology and the potential of HTHA
Ammonia is one of the most frequently used global chemical products in the production of nitrogen-rich agricultural fertilizers such as urea, ammonium nitrate, diammonium phosphate (DAP) and mono-ammonium phosphate (MAP).
The hydrogen required for ammonia synthesis in the Haber-Bosch process4 is produced by reacting methane (natural gas) with steam in the presence of a nickel catalyst at 770°C in the primary reformer, and in the presence of air at 735°C in the secondary reformer, respectively followed by removal of water, carbon monoxide and carbon dioxide in shift converters. The nitrogen from air is then mixed with hydrogen and the resultant gas mixture is compressed to 20 – 30 MPa pressure and fed to the ammonia synthesis reactor in the presence of the iron catalyst to form ammonia. With the advancements in science and technology and further understanding of the Haber-Bosch process, new processes/technologies of the ammonia synthesis have
58 | WORLD FERTILIZER | JULY/AUGUST 2023
Figure 1. Optical micrograph showing internal decarburisation and the hydrogen induced fissures, at 200 x magnification.
Figure 2a. SEM micrograph displaying the formation of voids along the grain boundaries of pearlite, indicating onset of HTHA.
Figure 2b. SEM micrograph showing the final stage of formation fissures and micro-cracks.
been evolved. Some of the new processes/technologies for ammonia synthesis area include:5
n The MWK or Kellogg process.
n The KBR or Kellogg Brown & Root process.
n The Haldor Topsoe process.
n TKIS or thyssenKrupp Industrial Solutions' processes.
n The LAC or Linde Ammonia Concept process.
n Udhe Krupp's processes.
n Toyo Engineering and Casale's technologies.
Since steels are liable to HTHA normally above a temperature of 200°C, all the above processes that employ different grades of steel for equipment and pipelines have a potential threat as far as damage due to HTHA is concerned.
Basis of evaluation of HTHA damage
To effectively mitigate the risk of HTHA in the fertilizer industry, a thorough evaluation of various factors is necessary. These factors include the material of construction (MOC) of equipment, operating temperature, partial pressure of hydrogen, and exposure time. The evaluation should also consider the presence of carbide-stabilising alloying elements in low-alloy steels, such as chromium, molybdenum, vanadium, and niobium, which offer greater resistance to HTHA compared to plain carbon steels.
The evaluation process begins with understanding the properties and behaviour of the MOC under hydrogen exposure. This includes examining the composition, microstructure, and mechanical properties of the material. Grain size, impurities, and the stability of carbides are also important factors that influence the material's susceptibility to HTHA.
Operating temperature plays a critical role in HTHA risk assessment. High temperatures accelerate the diffusion of hydrogen into the material, increasing the likelihood of damage. The evaluation should determine the maximum allowable temperature for the MOC based on its HTHA resistance and the specific process conditions.
The partial pressure of hydrogen in the operating environment is another significant factor. Higher hydrogen partial pressures increase the potential for hydrogen absorption and subsequent HTHA. The evaluation should establish safe limits for hydrogen partial pressure, considering the material's HTHA resistance and the process requirements.
Exposure time is an essential consideration in evaluating the risk of HTHA. Prolonged exposure to hydrogen at elevated temperatures can lead to cumulative damage. Therefore, the evaluation should assess the expected service life of the equipment, and consider the time-dependent nature of HTHA.
In addition to these primary factors, the evaluation may also consider secondary factors that influence HTHA susceptibility. These can include the presence of residual or operating stresses, the type of weld (with or without PHWT), and the level of impurities in the material.
To support the evaluation process, empirical data, field experience, and industry standards such as API Recommended Practice (RP) 941 and API RP 581 can provide valuable guidance. These resources provide
information on material performance, operating limits, and inspection guidelines based on historical data and research.
Nelson curve for HTHA assessment
American Petroleum Institute (API) Recommended Practice (RP) 941,6 entitled 'Steels for Hydrogen Service at Elevated Temperatures and Pressures in Petroleum Refineries and Petrochemical Plants' is an industrial standard (which uses graphical representation/curves known as Nelson curves), that has been followed over the years to help decide the suitability of a material for hydrogen service. Nelson curves are the plots of partial pressure of hydrogen vs operating temperature to which a steel is exposed, and predict the conditions in which HTHA can occur/will not occur for different steels (Figure 3). Operating conditions that fall above the curve point towards the risk of HTHA, whereas Figure 3 indicates the situations where the damage due to HTHA is unlikely. Nelson curves define the operating limits to avoid decarburisation and fissuring of steel in hydrogen service. However, of late it has been realised that risk of damage due to HTHA cannot be solely judged on the basis of Nelson curves because of several limitations:
n The Nelson curve does not take into account time in service.
n Damage due to HTHA also depends on factors such as grain size, level of impurities, stability of carbides, type of weld (i.e., with or without PHWT), and acting or residual stress. These factors are not taken into consideration by the Nelson curves.
n Nelson curves are subject to revision from time to time. History says that based on experience, the curves for carbon and C-1/2 Mo steels are lowered with respect to temperature scale.
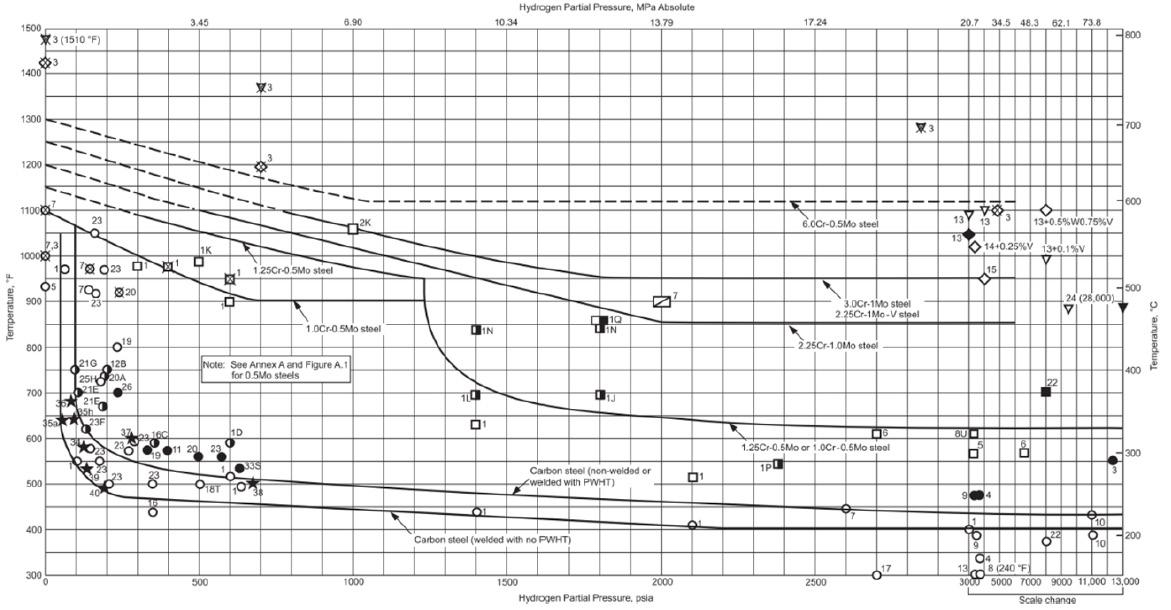
n Most of the data used in developing earlier curves is based on steels in annealed condition. This does not apply to normalised or quenched and tempered steels.
Inspection methodology for HTHA
Traditionally, AUBT is used for detection of damage due to HTHA. It is used as a screening tool to identify the presence of micro-cracks in parent material. However, it has limited data recording capability and is highly dependent upon technicians' skill.
Some of the modern inspection techniques used for detecting damage due to HTHA7 are:
n High sensitivity wet fluorescent magnetic testing (HSWFMT).
n Time of flight diffraction (TOFD).
n Phased array ultrasonic testing (PAUT).
n Full matrix capture/total focusing methods (FMC/TFM).
Among the non-ultrasonic techniques, HSWFMT is used especially for non-PWHT carbon steels where cracking is most likely related to welds.
TOFD is a preferred method for inspection of HTHA related damage of welds and heat affected zones. In a TOFD system, transmitter and receiver probes are placed on opposite sides of a weld. The longitudinal sound waves passed between the probes detect, locate, and estimate the size of the flaws based on the time of flight of any diffracted beam. TOFD calculates the response time of low-amplitude waves that are diffracted by the tips of discontinuities.
Instead of a single transducer and beam, the PAUT technique uses specialised multi-element ‘array’ transducers. This technique uses programmed piezoelectric elements that pulse individually at calculated time intervals, along with angled ultrasonic beams, to provide 3D images that can unveil difficult-to-detect cracks or flaws. It is used to detect clusters of methane voids and micro-fissures.
The FMC method uses standard phased-array ultrasonic probes to acquire data from every possible pulse-receive element (typically 16 to 64) combination of the probe array. The data captured by FMC is post-processed using a signal
processing routine such as TFM that reconstructs the information to produce high-resolution two-and three-dimensional images for interpretation purposes. The combination allows for higher detection of small defects, such as those in the early stage of HTHA.
Some of the shortcomings of empirical Nelson curves were addressed by API RP 581, Risk-Based Inspection Technology, Third Edition (2016)8, which provides quantitative risk-based inspection (RBI) methods. Based on the recommendations of API 581, a more stringent set of conditions are laid down that permit the use of components affected by HTHA. These include past history of HTHA damage during service, MOC of the component, upper limit of operating temperature, hydrogen partial pressure, manufacturing method, PWHT, etc. It is possible to identify the risk involved in hydrogen service as offline study, and depending on the risk assessment, inspection guidelines can be framed with the help of metallurgical experts that have experience in the field of HTHA.
Conclusion
Mitigating the risk of HTHA in the fertilizer industry requires a systematic approach that includes evaluation, risk assessment, inspection, and defining the operating window. By evaluating factors such as MOC, operating temperature, hydrogen partial pressure, and exposure time, plants can identify equipment and processes that are susceptible to HTHA. Utilising advanced inspection techniques, such as HSWFMT, TOFD, PAUT, and FMC/TFM, enhances the detection capabilities for early-stage HTHA. Defining the operating window establishes specific limits to ensure safe operation and minimise the risk of HTHA-related failures. By implementing these strategies, the fertilizer industry can effectively mitigate the risk of HTHA and ensure the safety and reliability of their operations.
References
1. VISWANATHAN, R., Damage Mechanisms and Life Assessment of High Temperature Components. ASM International, 1989, p. 352.
2. High Temperature Hydrogen Attack (HTHA) in Ammonia Plants. UreaKnowHow.com. Technical Paper, June 2020. Available at: “https:// ureaknowhow.com/wp-content/uploads/2020/05/2020-06-UKHHigh-Temperature-Hydrogen-Attack-HTHA-in-Ammonia-Plants.pdf
3. NELSON, G.A., "Hydrogenation Plant Steels." Proceedings API, 29M (III), 1949, p. 163.
4. APPL, M., "The Haber-Bosch Process and the Development of Chemical Engineering." A Century of Chemical Engineering. New York: Plenum Press, 1982, pp. 29-54.
5. PATTABATHULA, V., RICHARDSON, J. "Introduction to Ammonia Production." AIChE. cep, September 2016, p. 69.]
6. API Recommended Practice 941. "Steels for Hydrogen Service at Elevated Temperatures and Pressures in Petroleum Refineries and Petrochemical Plants." 8th Edition, 2016, Addendum 1, August 2020.
7. NAGESWARAN, C., "Maintaining the Integrity of Process Plant Susceptible to High Temperature Hydrogen Attack. Part 1: Analysis of Non-Destructive Testing Techniques." Health and Safety Report, RR1133, TWI Ltd, 2018.
8. API Recommended Practice 581. "Risk-Based Inspection Methodology." 3rd Edition, with Addendum 1 (2019) and Addendum 2 (2020).
9. HARIBHAKTI, P., JOSHI, P B., KUMAR,R., Failure Investigation of Boiler Tubes: A Comprehensive Approach, ASM international 2018.
60 | WORLD FERTILIZER | JULY/AUGUST 2023
Figure 3. Operating limits for steels in hydrogen service to avoid HTHA.6
HAZARDS
Kyle Langley, Vortex Global, USA, explains how fertilizer dust exposure can be effectively mitigated to ensure a safer and more sustainable future for agriculture.

Fertilizers are vital to modern agriculture, enhancing plant growth and improving crop yields. However, handling and storing these materials can generate dust particles with significant risks to human health and the environment. This article will delve into the different types of fertilizers, their potential hazards, and how having proper material handling components can help reduce exposure to fertilizer dust.
Types of fertilizers and dust generation
There are three primary categories of fertilizers: organic, synthetic, and bio-fertilizers. Organic fertilizers originate from natural sources like animal manure, compost, or plant matter. Synthetic fertilizers are chemically manufactured compounds supplying specific nutrients such as nitrogen, phosphorus, and potassium. Bio-fertilizers consist of living microorganisms that enhance nutrient availability in the soil.
Fertilizer dust generation occurs during production, transportation, and application, with factors like abrasion, mechanical handling, and air displacement contributing to dust particle formation.
61
The loading of fertilizers can also generate dust particles, especially when it is done in bulk. During the loading process, friction can be created between fertilizer and the wall of the container, or between different components of the fertilizer itself. Additionally, if the material is being loaded with a scoop or shovel, this can cause additional abrasion and air displacement – both of which contribute to dust particle formation. Other factors that can lead to dust generation during loading include excessive vibration from conveyor belts and mechanical handling devices like hoppers and augers. Furthermore, any sudden changes in temperature or humidity during the loading operation can trigger condensation, which can create airborne dust particles.
To reduce exposure to fertilizer dust during loading operations, dry bulk storage equipment should be used whenever possible. These systems are designed to optimise airflow and contain any loose materials that could disperse into the environment. Keeping surfaces clean and free of buildup will help minimise abrasion and dust production. Proper maintenance for mechanical handling equipment is also essential as worn parts or loose connections are common sources of dust escape.
Human health impacts
Human health impacts of fertilizer dust emissions can be far-reaching and devastating. Inhalation of airborne particles can cause damage to the lungs, leading to serious respiratory illnesses such as asthma, bronchitis, and chronic obstructive pulmonary disease (COPD). Prolonged exposure can also damage the heart and circulatory system, increasing the risk of developing cardiovascular problems such as heart attacks and strokes.
In addition to direct inhalation risks, fertilizer dust can also have indirect effects on human health. For example, when it is deposited onto crops or in watersheds, this dust can contaminate food and water supplies with toxins that can cause further
health issues. Airborne deposits of soil containing fertilizer residues often lead to increased air pollution levels in nearby areas. This air pollution can exacerbate existing respiratory conditions or trigger new ones in people who live close to sources of fertilizer dust.
It is therefore essential that steps are taken to reduce exposure to fertilizer dust emissions. Proper manufacturing components are one solution which has proven effective for limiting the impact of these hazardous particulates in the manufacturing and loading aspects of fertilizer production. By using technologies like dust tight slide gates, diverters, and loading spouts along with inline or remote filtration devices, these manufacturing components not only help protect against immediate effects but also against long-term consequences that could arise from sustained exposure.
Environmental consequences
Fertilizer dust also poses threats to the environment. Soil degradation can occur when excessive dust accumulates on the ground, altering the soil's physical and chemical properties. Dust particles can be transported by wind or water, leading to water pollution and harm to aquatic life. Wildlife can be affected if contaminated food sources are consumed or dust particles are inhaled.
In addition to soil degradation, fertilizer dust can have detrimental effects on nearby ecosystems. Wind-borne particles can travel long distances, causing acid rain in areas far away from their source. This acidic rain can damage plants and soil structure, leading to the destruction of vegetation and disruption of nutrient cycling. Additionally, nitrogen-rich fertilizers can lead to eutrophication when they enter aquatic environments like rivers or lakes; these waters become overly enriched with nutrients which encourages algae growth and reduces oxygen levels in the water. This lack of oxygen is toxic for fish and other aquatic organisms, with the potential to devastate entire populations.
The impact of fertilizer dust on air quality is equally concerning. These particulates contribute to ground level ozone formation, a major component of smog which is known to cause a range of health problems including respiratory illnesses, eye irritation, and other adverse effects on lung tissue. Fertilizer dust also contributes significantly to climate change as it contains high levels of black carbon; this carbon absorbs heat from the sun and raises temperatures in the atmosphere as well as in bodies of water.
Ultimately these environmental impacts are not only damaging for animals and ecosystems but also for human beings that rely upon them for resources or recreation. It is therefore essential that steps are taken to minimise our exposure to fertilizer dust emissions, both through appropriate safety measures such as wearing face masks or respirators while handling materials, and by using proper dry bulk components which help contain and divert hazardous particulates away from workers before they reach breathing zones.
Dry bulk equipment: Reducing exposure to fertilizer dust
Pieces of dry bulk equipment, such as those supplied by Vortex, offer solutions for minimising the risks associated with fertilizer dust. Key products and their benefits include:
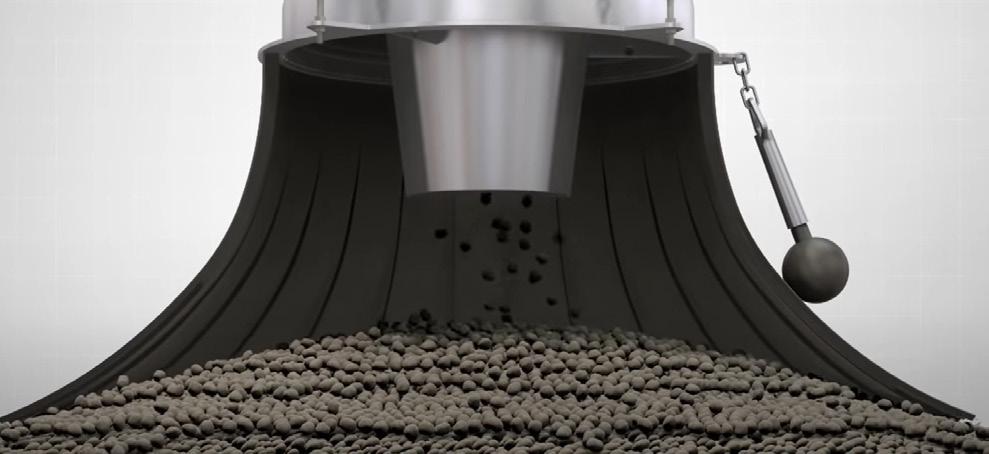
n Filtration systems: These systems actively displace dust-laden air from the source, separate dust particles from the air,
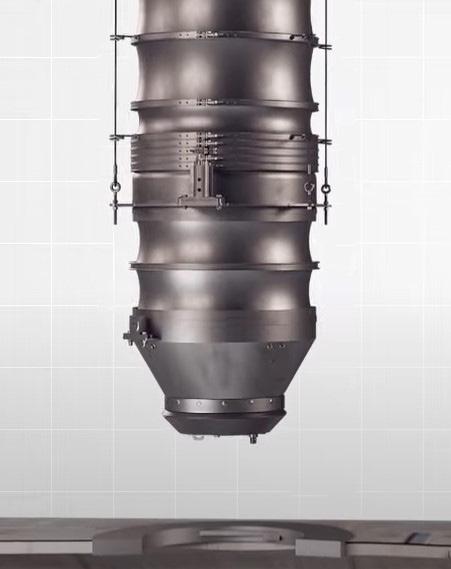
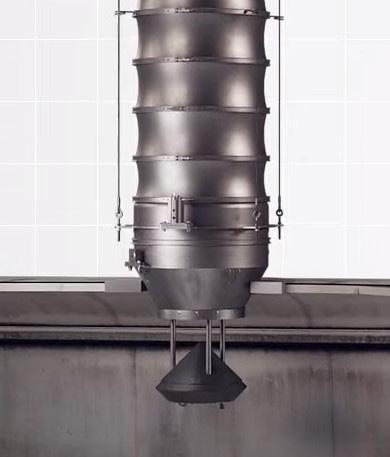
62 | WORLD FERTILIZER | JULY/AUGUST 2023
Figure 2. Self sealing discharge – extended (left) and retracted (right).
Figure 1. Dust control skirt.
exhaust the cleaned air into the atmosphere, and re-entrain the filtered dust back into the load. This process not only reduces waste but also improves profitability by loading out the dust as product. The in-line filtration system of the Vortex loading spout further enhances dust control by continuously purging dust from the filters, thereby increasing their service life and reducing the risk of clogs or overflow. This self-contained system eliminates the need for a central dust collection system, streamlining operations and reducing potential hazards in the workplace.
n Loading spouts: These are designed for precise material loading, and effectively contain dust emissions with overlapping rubber strips that act as a dust skirt and an outer sleeve. When combined with dust collection (in-line or remote) these design features drastically reduce dusting during load out to near zero levels.
n Dust control skirt: This optional detachable feature allows the loading spout to easily switch between open and enclosed loading applications, eliminating the need for multiple spouts.
n Self-sealing discharge: The cone-in-cone design provides a self-sealing discharge that minimises material spillage and dust emissions. This device is designed for use on trucks and rail cars with compatible hatches. The discharge extends into the hatch while filling, and closes once the spout is retracted from the hatch.

n Dust-tight slide gates: The implementation of dust-tight slide gates is an essential aspect of maintaining a safe and efficient fertilizer production facility. These specialised gates are designed to secure the flow of dry bulk materials, such as raw
ingredients and processed fertilizer products, while preventing the escape of dust particles into the surrounding environment. The various types of slide gates that can be employed in a fertilizer plant include manual or automatic gates, roller or knife gates, and specialised gates engineered for unique applications. The selection of a dust-tight slide gate is crucial, as it ensures optimal sealing and material containment, contributing to a cleaner and more controlled production process.
n Dust-tight diverters: Diverter valves play a crucial role in the effective control and management of fertilizer dust emissions, ensuring both product quality and safety in various industrial processes. Designed to provide a reliable solution for handling dry bulk materials, these specialised valves are engineered to facilitate seamless material flow while preventing dust leakage during transfer processes.

Implementing dry bulk equipment such as Vortex's in fertilizer handling facilities can lead to reduced health hazards, cost savings from minimised product loss, and improved operational efficiency.
Conclusion


Fertilizer dust presents significant hazards to human health and the environment. Understanding the different types of fertilizers and the potential risks is crucial in addressing these challenges. By incorporating dry bulk equipment into handling processes, facilities can effectively mitigate fertilizer dust exposure, ensuring a safer and more sustainable future for agriculture.

• Market analysis
• In-depth technical articles
• In-depth regional analysis by key players in the industry
• Comprehensive technical reviews covering all aspects of fertilizer production, from plant optimisation and automation to blending, bagging, and dispatch

| Related Facilities Symposium 51 | ANNA-EU 2023 13 | Black & Veatch 49 | Blasch Precision Ceramics Inc./ BD Energy Systems 31 | BORSIG Gmbh OBC | Casale SA 09 | Christy Catalytics 34 | CRU Group 02 | Curtiss-Wright EST Group 59 | DSH Systems 19 | E²G | The Equity Engineering Group, Inc. 64 | WORLD FERTILIZER | JULY/AUGUST 2023 AD INDEX 43 | EMT/Doyle Equipment Manufacturing IFC | Eurotecnica 63 | Ludman Industries OFC, 27 | MoistTech Corp. IBC | Neelam Aqua and Specialty Chem (P) Ltd. 23 | Regal Rexnord 15 | Sackett-Waconia 55 | Sohar Sulphur Fertilizers LLC 07 | Stamicarbon 04 | STATEC BINDER GmbH 41 | TCR Advanced Engineering 39 | Topsoe 47 | Turbomachinery & Pump Symposia 2023 64 | World Fertilizer
Register at www.worldfertilizer.com Global coverage of the Fertilizer Industry WF_Generic.indd 1 27/07/2022 11:29

Our purpose is to develop the future of our customers’ plants, both new and revamped, from the technology to the design and construction. Our mission is to ensure high e iciency, reliability, low emissions with fully integrated digital support.
www.casale.ch | info@casale.ch