
10 minute read
Streamlined operations

Luiz Soriano and Dave Winquist, Siemens Energy, USA, consider how to maximise reciprocating compressor efficiency.
Industrial operators are under intense pressure to reduce carbon dioxide (CO2) emissions and improve sustainability. Transitioning away from conventional energy sources to low-carbon alternatives is often viewed as the primary means of achieving these goals. However, reducing the energy required to operate equipment by increasing efficiency continues to be one of the fastest and most cost-effective means of decarbonisation. While the downstream oil and gas sector has made progress on this front, significant opportunities still exist to enhance the energy efficiency of key processes, particularly those that rely on power-intensive equipment, such as compressors. By using high-efficiency compressors, operators can reduce the total energy consumption of their plant and associated emissions. Siemens Energy recently authored an article in the May 2022 edition of Hydrocarbon Engineering which highlighted the role that compressors play in decarbonising downstream processes.1 Whereas that article focused on the use of compressors in hydrogen service, this article will go one step further by discussing important design attributes of process reciprocating compressors, and the impact that they have on energy consumption during operation.
Compressor operating requirements
Process reciprocating compressors are designed according to the API 618 standard, and have historically been applied in mission-critical refinery and petrochemical processes (see Figure 1). To minimise the risk associated with unplanned shutdowns and resulting loss of revenue, many original equipment manufacturers (OEMs) and end users have prioritised metrics, such as availability/uptime and mean time between failures (MTBF), over efficiency during the design process.
In today’s market, however, there is an increasing demand for compressors in green hydrogen production facilities, which have a completely different operating philosophy than a refinery. Although loss of revenue remains a top concern, most hydrogen production plants run intermittently and at partial load, for extended periods of time.
For the purposes of this article, all design comparisons will be based off a reciprocating compressor in an application with the following process parameters: n Compressor model: HHE-VL process reciprocating compressor. n Application: hydrogen. n Suction pressure: 345 psig. n Discharge pressure: 1100 psig. n Suction temperature: 110˚F. n Flow: 12 000 lb/hr. n Gas: 100% dry hydrogen. n Rated power: 3430 kW. n Operation: continuous – 8000 hr/yr. 4000 hr at 100% load; 2400 hr at 75% load; 1600 hr at 50% load.
Capacity control
Capacity control is critical to reciprocating compressor energy efficiency as it enables end users to compress only as much hydrogen as is needed. Today, there are several capacity control systems available for process reciprocating compressors, each with different CAPEX, OPEX, and turndown capabilities. Table 1 describes the most common systems, sorted by their potential to save energy.
Improper selection of the capacity control system will ultimately impact the operator’s ability to adjust capacity and meet demand, therefore wasting energy and increasing CO2 emissions. This is particularly the case if the power for compression is not generated from a low-carbon energy source.
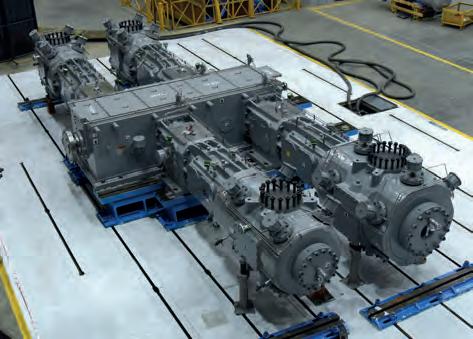
Figure 1. API 618 process reciprocating compressor, HHE-VG class.
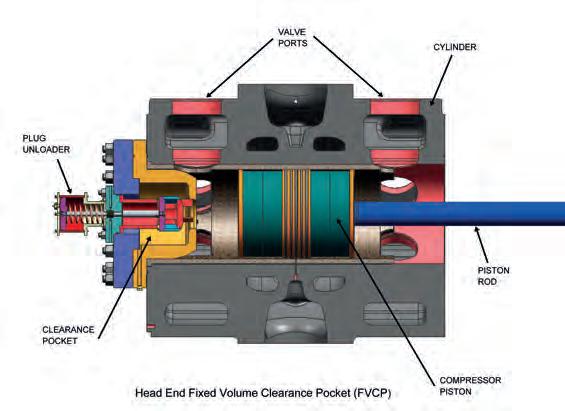
Figure 2. Head end fixed volume clearance pocket.
Operating pattern
Deciding what type of capacity control system to use is highly contingent on the operating pattern of the compressor. The compressor unit defined in this article’s case study has two partial load scenarios. Based on this, the following capacity control systems were selected (see Figure 2): n 75% step with fixed volume clearance pocket installed on the head end of both cylinders. When the system is active, the cylinder clearance on the head end will be increased, therefore reducing flow through the cylinder. n 50% step with valve unloader system installed on the head end of both cylinders. When the system is active, the unloaders will open the head end of the cylinder to the suction side and compression cannot occur, as there is no volume reduction of the gas.
Table 2 describes the required power for each of these operating cases.
The lack of a capacity control system altogether would cause the operator to spend 50% of its annual operating time recycling the hydrogen gas through the compressor, leading to substantial wasted energy and higher CO2 emissions as a consequence.
It should be noted that speed control is also an available option for capacity control. However, it is not typically used for process reciprocating compressors because the compressors operate at ‘slow speeds’. As a result, turndown capabilities are limited.
Compressor valves
Valves are another critically-important attribute to consider when it comes to reciprocating compressor efficiency. Loss of pressure across the valves is one of the major sources of wasted energy during operation. Minimising losses requires engagement early in the design phase so that the OEM has a clear
Table 1. The most common capacity control systems available for process reciprocating compressors
System Objective Turndown capability Acquisition cost Energy savings
Stepless capacity control system Variable volume clearance pockets2
Fixed volume clearance pockets Valve unloaders
Recycle
Controls flow by delaying suction action
Reduces flow by adding cylinder clearance
Reduces flow by adding cylinder clearance
Unload cylinder end by opening cylinder end to inlet side Recycle gas across compressor through recycle line Infinite (100 – 30%)
Infinite (100 – 55%)
Pre-defined fixed steps (100 – 55%) Pre-defined fixed steps $
Infinite (100 – 0%) $ No energy savings
understanding of all process conditions and operating cases, including during non-normal or upset scenarios.
Once the compressor operating pattern has been defined, it is possible to design a valve that meets the expected performance during the normal envelope of operation, while guaranteeing acceptable performance under all other circumstances.
There are several factors that will impact valve efficiency during operation. It is not the objective of this article to address them all. During the design phase, however, one important task is to guarantee proper effective flow area (EFA) of the valve. EFA is defined as “the equivalent area of the gas flow path through the valve if considered as a single hole/orifice”.
For the reciprocating compressor in this article’s case study, Siemens Energy considered poppet style valves with three different EFAs. The impact of the different EFAs on overall power consumption is shown in Table 3.
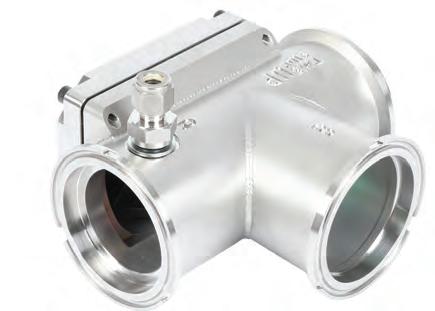
Different valve designs can have very different EFAs. Siemens Energy recommends the magnum valve (see Figure 3) for its process reciprocating compressors in low molecular weight applications, which is a poppet style valve. The magnum valve has industry-leading performance and millions of operating hours in highly-demanding applications.
Driver selection
Typically, process reciprocating compressors are driven by slow, fixed-speed electric motors. Several developments in
Table 2. Required power for each operating case
Case Required power (kW)
the field of motor technology over the last decade have enabled increases in overall efficiency – normally above 95% for most applications. However, there are still important decisions that must be made when it comes to the type of motor that will be used. Synchronous motors are more efficient than the induction equivalent by around 1 – 2%. This difference in energy efficiency can become significant as the rated power of the compressor increases.
In North America, the industry rule-of-thumb is to apply synchronous motors for compressors with rated power
Capacity (kg/hr)
Power consumption (%)
Design (full) 3084 5611 100 75% step 2315 4205 75.1 50% step 1533 2770 50.4
Table 3. The impact of the different EFAs on overall power consumption Valve selection EFA/end (in.2) Pressure drop across valve (%) Power consumption at design (kW) Difference (%)
Best fit 9.66/6.10 2.4/1.5 3084 0 Undersized by 1 in.2 7.90/4.62 3.6/2.5 3131 1.5 Undersized by 2 in.2 6.10/3.30 6.0/5.0 3253 5.5
THE DAWN OF A NEW ERA FOR COMBUSTION ANALYSIS
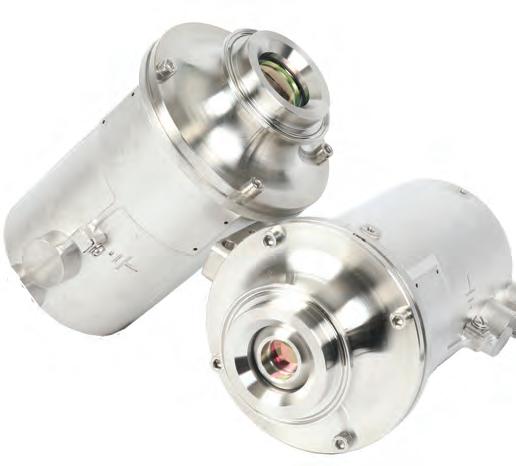
T-Flange LaserGas™ III Ultra

VISIT US AT ACHEMA 2022, HALL 11.1 STAND G74
to learn more about our innovative T-flange solution.
Combine our LaserGas™ III O2 and the LaserGas™ CO Ultra analyzers with the T-Flange, benefit from: - Process control and safety with low CAPEX and OPEX - Independent measurements with high precision and high dynamic range for large stacks - Hot-swap analyzers mounted on the T-Flange www.neomonitors.com
above 1500 kW. There are other advantages to consider when using a synchronous motor, such as lower utility fees through reduced peak demand, no power factor penalty, increased system capacity, and increased voltage levels in the electrical system.
For this case study, only the efficiency of the motors was considered, without any supporting power factor correction equipment, such as additional capacitor banks. While these would help to reduce OPEX associated with the induction motor, it would result in higher CAPEX. Forward-looking design decisions can help mitigate both CAPEX and OPEX of the motor selection. Regional preferences and experience of the operator with a particular motor design may also influence the selection process.
With a power demand of 3085 kW at 100% load, the compressor in the case study would require a main driver nominally rated for 3430 kW per API 618 5th edition. Using this rating, an efficiency comparison of synchronous vs induction motor can be made, and was considered in this instance.
Summary of cost and emissions reductions
Considering all of the compressor design attributes discussed in this article, along with the motor design, the difference in energy costs and CO2 emissions between a hypothetical worst and best-case compressor design scenarios can be considered. A summary of these results is presented in Table 4 (see notes at the bottom of the table).
As can be seen from Table 4, the energy consumption in the best-case scenario is 23.5% lower than the worst-case scenario. This would translate into more than US$500 000 in annual monetary savings for the end user. In addition to this, a total of 2560 t of CO2 would be avoided during the same period, which is equivalent to annual CO2 emissions from 630 passenger vehicles.4
Other considerations
Although the design attributes discussed in this article constitute major contributors to compressor energy efficiency, several additional factors should be addressed during the design phase which were not discussed. Among these include: n Efficient design of the pulsation dampener system that allows for reasonable pressure drop. n Pressure packing design that optimises leakage rates. n Jacket and packing coolant system that ensures sufficient heat transfer during operation – without parenthesis.
Minimum hardware solutions are always preferred; however, there may be specific applications where capacity control is best achieved by multiple smaller units with on/off functionality. Depending on the operational pattern intended, this could result in a configuration that is more energy efficient.
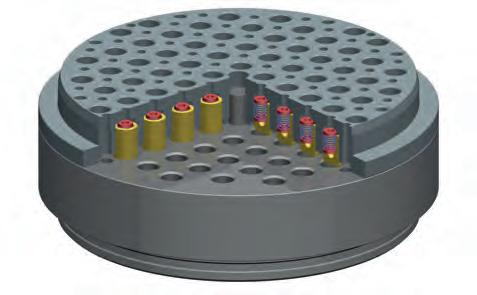
Figure 3. Dress-Rand magnum valve.
Conclusion
Table 4. Summary of cost and emissions reductions
Factor
While the latest report issued by the Intergovernmental Panel on Climate Change (IPCC) indicates that real progress is being made on the fight against climate change, we are still far from the Paris Agreement target of keeping global warming under 1.5˚C by the year 2100.5 Immediate actions are required to collectively reduce CO2 footprint, including an accelerated shift towards low-carbon energy sources. Enhancing the energy efficiency of processes and equipment will also be an important contributor, providing the added benefit of lowering electricity spend.
Unit of measurement Best case scenario Worst case scenario
Required power for compression Valve efficiency kWh
Motor efficiency % 20 344 800 24 672 000
100 94.5
96 synchronous 94 induction
Total power consumption kWh Energy cost Demand charge US$ US$ Total energy cost US$ 21 192 500 27 437 196
1 517 383 1 964 503
142 800
1 660 183 205 779
2 170 282
Total CO2 emission t 8689
Assumptions are as follows: - US average electricity cost for industrial use = US$0.0716/kWh3 - Average CO2 emission from non-renewable source = 0.41 kg/kWh4 - Demand charge = US$42 KVA/yr 11 249
References
1. ‘The Role of Compression in
Downstream Decarbonisation’,
Hydrocarbon Engineering, (May 2022), pp. 23 - 26. 2. ‘Variable capacity control technology facilitates efficient operation for reciprocating compressors’,
Hydrocarbon Processing, (March 2020). 3. US Energy Information
Administration, www.eia.gov 4. US Environmental Protection
Agency, www.epa.gov 5. Sixth Assessment Report of the
Intergovernmental Panel on
Climate Change, Working Group II
Contribution, March 2022, https:// www.ipcc.ch/report/ar6/wg2/
