11 minute read
Big data in catalysis


Christoph Hauber and Tilman Sauer, hte GmbH,
Germany, discuss how integrated database designs enable holistic approaches in R&D.

Since the early days of the advancement of the chemical industry, catalyst development has been a tedious and repetitive task. One example of this is Alwin Mittasch, Assistant to Carl Bosch at BASF in the 1910s. He led catalyst development for the Haber-Bosch synthesis, which required 20 000 experiments and screening of over 3000 catalyst formulations until the optimal sample was found. It is hard to imagine how many resources were required to run these tests for over a decade, and how many more to handle the analog data that they produced.
Fortunately, today, with help of computers, sensors and automation, laboratory experiments can be carried out in much safer, faster and more comprehensive ways. This article focuses on how a software tool can be designed holistically to generate, organise and evaluate big data for catalysis. hte GmbH has developed a fully-integrated workflow that centres around a powerful data management system. The myhte system collects data from every step of the catalyst testing workflow, such as catalyst synthesis, reactor loading, and actual testing – including online GC data, sample logistics, and product analysis. Based on the data acquired, configurable automated calculation routines generate characteristics such as conversion, yields, selectivities, or kinetic data. These results are presented in powerful and highly-flexible report formats, which enable the scientist to decide on improvements for future catalyst synthesis.
In order to determine the performance of a catalyst, one needs to know its most important parameters, such as mass and heat transfer, structure, surface, and chemical composition; the raw materials used; and the chemical and mechanical stability of the carrier and of the active phase. Some of these properties can be easily measured with analytical devices, e.g. X-ray diffraction for the phase composition, or Brunauer-Emmett-Teller (BET) for characterisation of the microstructure, while others require testing under relevant conditions of the chemical process that the catalyst was designed for. This certainly makes development more complex, and many different experiments are required to ultimately obtain sufficient data to set up a kinetic model for the process, or to identify one of many different catalyst candidates with the best properties for a given task. As such, parallelisation of the reactor system has been proven to accelerate research but, as stated in the ‘Handbook of Heterogeneous Catalysis’: “the information technology (IT) systems managing these data and reducing them in such a way as to identify the best catalysts in each run are of utmost importance”.1
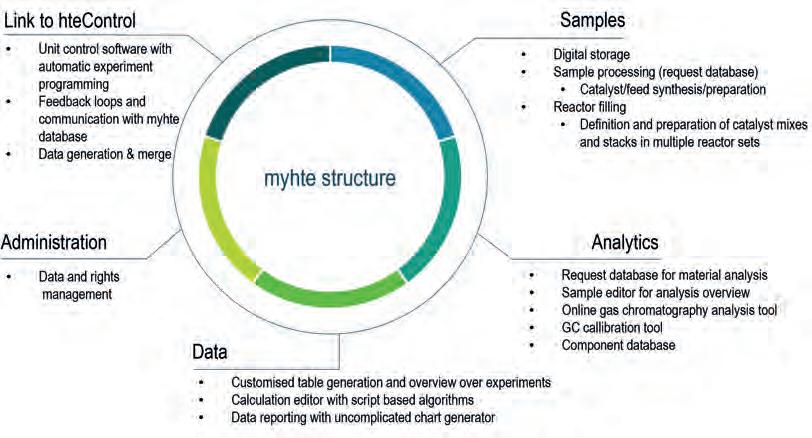
In order to handle all of these tasks, data input and output is structured in different inventories and data management systems, which each cover the steps that are necessary to handle the development process (e.g. chemical feeds and samples, analytical services [on and offline], catalyst synthesis, loading, and the data reporting section from generated data by test units).
The following section focuses on a generic catalyst development project and how digital integration is helping with its realisation. myhte’s user and permission management system makes it possible to restrict access to each project created within the database to certain users so that information can be shared on a need-to-know basis.
Catalyst design and preparation
The performance of a catalyst strongly depends on its preparation history. The choice of ingredients, various parameters of different process steps leading to the final
catalyst, and its chemical composition may have a significant impact on the catalyst’s performance. Therefore, it is essential to capture and store the information mentioned above. This builds the foundation for the subsequent detection of structure-performance relationships. A new synthesis request module in the system now allows its users to design a catalyst preparation process, guide the technician through the execution, and capture all necessary preparation parameters.
The system’s chemical inventory describes the ingredients of catalyst preparation along with chemical composition, purity, and mass fractions. When designing a catalyst preparation, myhte automatically calculates the necessary amounts of all ingredients based on multiple weight or molar ratios of elements, components, materials, and quantity information.
Additionally, the user can pick from a set of customised process steps with different parameters and data types to describe the preparation of a precursor or the final catalyst. The recipe can then be flexibly adjusted and multiplied by using factors for ingredients, ratios, amounts, and process step parameters. This makes it possible to easily describe the preparation of a zeolite with two different organic templates, two different Si/Al ratios, and four calcination temperatures, resulting in 16 different materials that can later be tested in a parallel reactor unit.
Once the recipe is ready, a synthesis request can be transmitted to the operator who is then guided through the process and can enter the actual values – such as ingredient weights and parameter values – directly in the software. For quality control purposes, differences between the specified and actual weight are displayed directly during preparation. The barcodes of all ingredients used must fit the specified ingredients, otherwise an error statement is issued to the user. This prevents ingredients from becoming mixed up. The materials created, as well as their genealogy, are then stored in a library.
The preparation tool is not limited to catalyst synthesis, and also covers the preparation steps for liquid feedstocks, such as filtration, drying, spiking, and mixing of different components, paving the way for further laboratory 4.0 approaches.
Material characterisation
Material analysis is an important step within the evaluation process. myhte offers integrated LIMS functionality to meet this need. All newly-created materials (precursors, catalysts, etc) are identified by a unique barcode that links the material to its specific project, material type, derivate, and ancestor. Certain analyses can be requested via a barcode within the system, and the results are automatically imported and stored.
Once the catalysts have been prepared, or in case commercially-available catalysts need to be tested in a fixed-bed reactor, a reactor filling design can be set up. In this step, the operator defines the necessary physical catalyst preparation steps (sorting, sieving), how a reactor is designed, and how it should be loaded (e.g. definition of single zones in the reactor, catalyst mixtures, embedding, as well as a hardware geometry description and the sealing procedure). The filling design is displayed in an interactive graphic, and changes are displayed instantly.
Filling is then requested and is addressed by a technician who proceeds with the actual filling process. In addition to mass control, height is measured by a laser-controlled device, ensuring the right volume for the requested catalyst zone. The final quality check after a leakage test is the measurement and reporting of pressure drop for each reactor.
Material testing
Figure 1. myhte data warehouse repositories. Material testing in a high throughput unit is the most time-consuming part of each project. In addition to thorough quality checks, the highly-complex laboratory units require tuning to ensure that they are fit for use for a specific type of chemical process. The experiments themselves may take weeks or even months, depending on the nature of the experimental plan and chemistry. For a material to be tested in an experimental and mostly-automated configuration, several requirements need to be met: n Test equipment needs to be safe for the designated experiment, whereby modules that monitor
experimental parameters and automatically react at user-determined thresholds may increase the level of control. n Relevant parameters need to be tracked in order to properly document the experiment. n Determining whether an experiment is successful requires meaningful analysis methods. n Experiments could be carried out manually, but flexible programming of an entire experiment plan guarantees reproducibility, ensures quality and control over each experimental step, and saves time for similar future tests. n Experimental data needs to be recorded during an experiment, whereby the dynamic development of the experiment has to be traced in sufficiently small increments. n Experimental data from different sources, e.g. sample weights, analysis results, and unit sensors, needs to be merged and correctly assigned to a common timestamp and reactor within a dataset. n Merged data needs to be evaluated during a running experiment. n A feedback loop using evaluated data as a control variable for automatic process control is beneficial for simulating established industrial processes. So-called iso-conversion operation, where reactor temperatures are controlled by a control variable to maintain a constant conversion, help to simulate industrial processes.
High throughput units equipped with hteControl and linked to a myhte server fulfil the above criteria. All unit-dependent operations are managed by the process automation software, and results are uploaded to the database. Raw data, e.g. from a gas chromatograph – usually one of the most important analysis methods for the evaluation of catalytic processes – is displayed in the peak assignment section in the system, where each unique peak from one chromatogram within a defined measurement time is displayed, and can be assigned to a specific component. This significantly reduces the amount of quality control required for the experiment, as all of the analytical data of one project for one detector is displayed in a single window. Retention time drifts can easily be detected by plotting retention times vs the injection time. Outliers and new or unknown peaks are marked automatically, and filtering data allows control for single reactor positions or single experiments. The same assignment methods can be used for the chromatographic analysis of offline samples. Other analytical methods that only contain single values are directly imported to the data table and linked to the barcode of the offline sample.
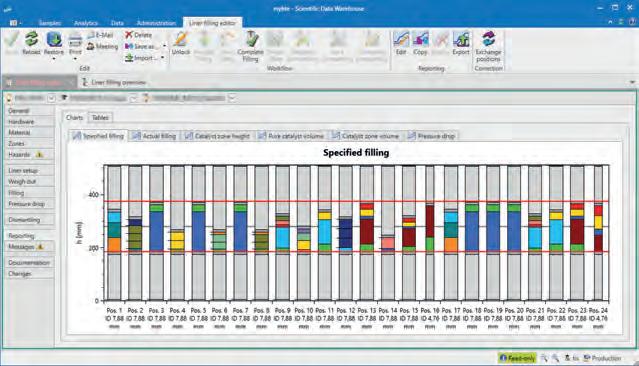
Figure 2. Example of reactor filling of 16 reactors with different catalyst stacks (software screenshot).
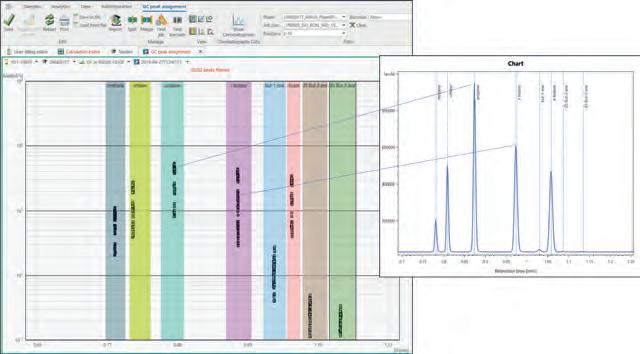
Figure 3. myhte peak assignment: each square represents one peak within a chromatogram within a series of measurements of one experiment (software screenshot).
Data evaluation and reporting
As an example, typical spreadsheets from one experiment in a 16-fold reactor unit running for 8 – 10 weeks contain several hundred columns and several thousand rows. With the additional information gathered from analytics and sample preparation, the complexity of big data becomes clear: the set is large in volume and has a variety of sources that are carefully calibrated, so veracity and validity are given. Velocity is one of the challenges, however, and at the end the outcome should be valuable to the stakeholders. As such, the data processing engine should be capable of working with this amount of data.
It must also be able to incorporate data from different sources and to qualify, quantify, display and simplify the data to the point where a non-expert can comprehend the results at a glance. In myhte, the evaluation is script-based and the user can


LH2


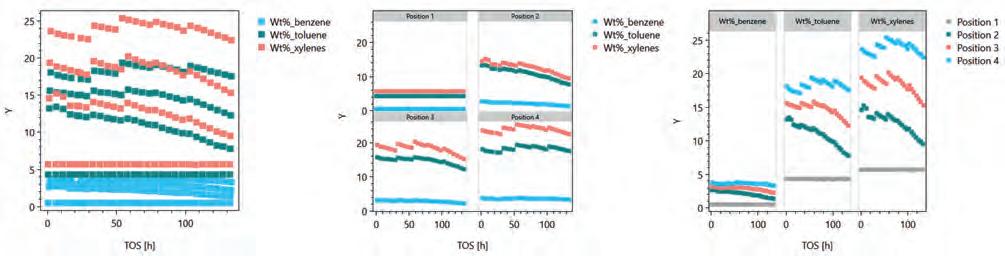
Figure 4. An example of unstructured vs structured charts: data split into different segments by reactor position or by different chemical component.
choose a large number of different operations to write an algorithm that generates the output data. This includes the simple calculation of rates, conversion, yields and selectivities; creation of statistical parameters such as standard deviations, mean, or median values; interpolation of data; and more. Smart filters and the option to create customised data tables help to condense large datasets in useful key parameters. All columns can be displayed in rendered, interactive charts that help the reader to understand the uncountable data points in a structured manner.
Conclusion
Catalysis development depends on a variety of multidisciplinary steps, each of which produce data that needs to be captured, related and connected in a central data repository that is accessible by multiple users. This facilitates communication and information exchange between different members of a project team, and helps to structure development projects. Convenient access to the heterogeneous data formats that come with catalyst development helps to maintain an overview and the ability to validate all aspects within the development, testing, and evaluation programme. The system described in this article offers an all-encompassing solution that undergoes continuous development in order to extend scientific capabilities not only for catalysts but also for battery materials and electrolysis technology.
Reference
1. ‘Handbook of Heterogeneous Catalysis’, (2008), p. 63.
Fewer components, more reliability.
Proven Zero Leakage Valve Solutions™
• Integral seat eliminates a leak path • Improved process safety, availability, and efficiency • Withstands extreme thermal shock • Less susceptible to buildup of solids, particulates, slurry, viscous media