

Returning to growth

Tallinn, 7 May 2024

OF
OECD ECONOMIC SURVEY
ESTONIA
@OECD @OECDeconomy oe.cd/estonia

The economy is expected to return to growth next year
year on year % change
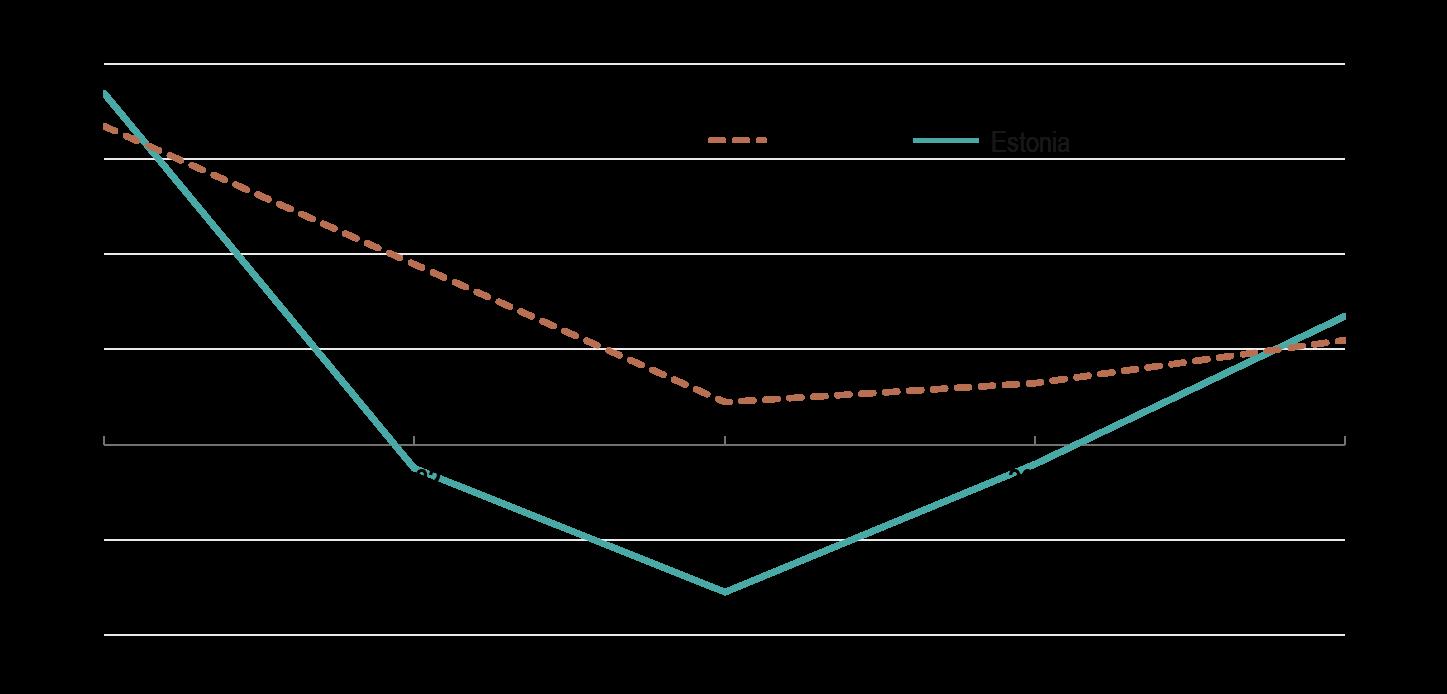
Source: OECD Economic Outlook 115 database.
GDP
Growth is projected to recover slowly
Source: OECD.
Real GDP growth (%) 2022 2023 2024 2025 -0.4 2.6 -0.5 -3.1 19.6 27.3 23.2 18.5 Public debt, Maastricht definition (% of GDP) 9.1 2.1 3.9 19.4 Inflation (%)
-3.4 -3.7 -3.2 -1 Government budget balance (% of GDP)

Stabilising the
economy while rebuilding fiscal buffers
Fiscal policy should support the recovery
Note: Shaded area corresponds to Economic Outlook 115 projection.
Source: OECD Economic Outlook 115 database.
% of GDP -6 -5 -4 -3 -2 -1 0 1 2 2010 2011 2012 2013 2014 2015 2016 2017 2018 2019 2020 2021 2022 2023 2024 2025
Headline budget balance
Addressing long-term fiscal pressures to ensure fiscal sustainability
Current tax and spending policies
Path assuming a medium-term objective of -1% and offsetting ageing costs
Implementing structural reforms
Note: The “Current tax and spending policies” scenario assumes that the structural primary fiscal balance before accounting for ageing-related costs remains constant at 2025 levels and the balance declines with rising ageing costs and interest expenditure. The “Path assuming a medium-term objective of -1% and offsetting ageing costs” scenario offsets ageing costs and assumes that the underlying primary structural balance of -1% of GDP is achieved in 2026 and is held constant thereafter. The “Implementing structural reforms” scenario adds to the previous scenario implementation of a package of structural reforms noted in the Economic Survey.
Source: OECD calculations based on OECD Economic Outlook database and OECD Long-Term Model. General government debt % of GDP 0 5 10 15 20 25 30 35 40 45 2023 2024 2025 2026 2027 2028 2029 2030 2031 2032 2033 2034 2035 2036 2037 2038 2039 2040

Boosting productivity
Productivity growth needs to be raised
Source: OECD Productivity Database.
Output per hour worked Constant prices, (2000=100) 2000 2002 2004 2006 2008 2010 2012 2014 2016 2018 2020 2022 Estonia Latvia Lithuania Poland Euro area 300 260 180 140 100 380 340 220
Continue enhancing innovation activities
Note: CEE countries are defined as Czechia, Hungary, Poland and the Slovak Republic. Nordic countries are defined as Denmark, Finland, Norway and Sweden.
Source: OECD.
Research and development expenditure % of GDP, 2021 0.0 0.5 1.0 1.5 2.0 2.5 3.0 Latvia Lithuania CEE Estonia Nordic countries OECD Business Government Higher education
A. Use of Customer Relationship Management
Note: CEE countries are defined as Czechia, Hungary, Poland and the Slovak Republic. Nordic countries are defined as Denmark, Finland, Norway and Sweden.
Source: ICT Access and Usage by Business Database, OECD.
progress is needed to maximise the benefits
the digital transformation
Further
from
software % of all firms, 2023
Intelligence % of all firms, 2023 0 5 10 15 20 25 30 35 40 Latvia Estonia CEE OECD Lithuania Nordic countries 0 2 4 6 8 10 12 14 Latvia Lithuania CEE Estonia OECD Nordic countries
B. Use of Artificial
Expanding childcare and fathers’ leave to help close the gender pay gap
A. Enrolment in early childhood education
and care
% of children, 2020 or latest available
B. Duration of available paid parental leave
Number of weeks, 2022
Note: CEE countries are defined as Czechia, Hungary, Poland and the Slovak Republic. Nordic countries are defined as Denmark, Finland, Norway and Sweden. Panel B shows the difference between median wages of men and women, relative to the median wages of men; OECD refers to the average of the 38 member countries; wages are the gross earnings of full-time dependent employees; data are from 2021 for Austria, Chile, Denmark, Finland, France, Germany, Greece, Hungary, Iceland, Ireland, Israel, Italy, Portugal, Sweden, Argentina, Bulgaria, Croatia and Romania, 2020 for Belgium, Poland and Switzerland, 2018 for Slovenia and Türkiye, and 2014 for Luxembourg.
Source: OECD Family database.
0 10 20 30 40 50 60 70 80 90 100 CEE Estonia Latvia Lithuania OECD Nordic countries 0-2 year olds 3-5 year olds 0 10 20 30 40 50 60 70 80 90 100 Nordic countries OECD Estonia Lithuania Latvia Mothers Fathers
Towards better and more sustainable healthcare
Life expectancy has risen significantly but there is room to further improve health outcomes
Note: CEE countries are defined as Czechia, Hungary, Poland and the Slovak Republic. Nordic countries are defined as Denmark, Finland, Norway and Sweden.
Source: OECD Health at a Glance 2023.
Life expectancy at birth Years 65 67 69 71 73 75 77 79 81 83 85 Latvia Lithuania CEE Estonia OECD Nordic countries 2021 2000
Expanding the coverage of health insurance
Note: CEE countries are defined as Czechia, Hungary, Poland and the Slovak Republic. Nordic countries are defined as Denmark, Finland, Norway and Sweden. Healthcare coverage is defined as a sum of
Source: OECD Health at a Glance 2023.
and private primary health coverage.
total public coverage
Healthcare insurance coverage Share of population, 2022 80 85 90 95 100 Latvia Nordic countries Lithuania OECD CEE Estonia
Reducing out- of-pocket payments on healthcare by
low-income households
Note: CEE countries are defined as Czechia, Hungary, Poland and the Slovak Republic. Nordic countries are defined as Denmark, Finland, Norway and Sweden.
Source: OECD Health at a Glance 2023.
Out-of-pocket payments on healthcare % of spending on health, 2021 or latest year available 0 5 10 15 20 25 30 35 Nordic countries OECD CEE Estonia Latvia Lithuania
Expanding support for long-term care
Spending on long-term care
Note: CEE countries are defined as Czechia, Hungary, Poland and the Slovak Republic. Nordic countries are defined as Denmark, Finland, Norway and Sweden.
Source: OECD Health at a Glance 2023.
% of GDP, 2021
latest year available 0.0 0.5 1.0 1.5 2.0 2.5 3.0 Latvia Estonia CEE Lithuania OECD Nordic countries
or
Lowering
mortality, including by extending the use of performance -linked payments in primary care
Note: CEE countries are defined as Czechia, Hungary, Poland and the Slovak Republic. Nordic countries are defined as Denmark, Finland, Norway and Sweden.
Source: OECD Health at a Glance 2023.
Treatable mortality rates Deaths per 100 000 inhabitants (standardised rates), 2021 or latest year available 0 20 40 60 80 100 120 140 160 180 Nordic countries OECD Estonia CEE Lithuania Latvia
More training places for nursing and medical graduates can help address staff shortages
A. Number of nursing graduates Per 100 000 inhabitants, 2021
B. Number of medical graduates
100 000 inhabitants, 2021
Note: CEE countries are defined as Czechia, Hungary, Poland and the Slovak Republic. Nordic countries are defined as Denmark, Finland, Norway and Sweden.
Source: OECD Health at a Glance 2023.
0 20 40 60 80 100 Latvia Lithuania Estonia CEE OECD Nordic countries
0 5 10 15 20 25 30 EST OECD Nordics CEE LTU LVA Lithuania Latvia Estonia
Per
Expanding cancer testing programmes
Screening rates
Share of population, 2020
Note: The data refer to self-reported screening rates. 1. The cervical cancer the screening programme targets 30–65 years old women, and the screening rate is expressed as a share of the 15+ female population. 2. The breast cancer screening programme targets all 50-69 years old women, and the screening rate is expressed as a share of all women aged 50-69. 3. The colorectal screening programme targets 60-69 years old men and women, and the screening rate is expressed as a share of the total population aged 50-74.
Source: Eurostat.
0 10 20 30 40 50 60 70 80 Low income High income
cancer1 Breast cancer2 Colorectal cancer3 Estonia Estonia Estonia EU EU EU
Cervical
Reducing obesity by taxing sugar and unhealthy foods
Note: CEE countries are defined as Czechia, Hungary, Poland and the Slovak Republic. Nordic countries are defined as Denmark, Finland, Norway and Sweden. The EU average is weighted. No data is available for Ireland.
Source: OECD Health at a Glance EU 2023.
Overweight (including obesity) rates among adults Share of total population, 2019 0 10 20 30 40 50 60 70 80 EU Nordic countries Estonia Lithuania Latvia CEE Total Men Women

Accelerating the climate transition
Achieving climate change targets calls for faster emissions reductions
Note: Includes emissions from land use, land use change and forestry (LULUCF). The shaded area shows targets consistent with EU’s Fit for 55 objectives.
OECD Greenhouse Gas Emissions Database.
Greenhouse gas emissions Millions of CO2 equivalent 0 5 10 15 20 25 30 35 40 1990 2000 2010 2020 2030 2040 2050
Source:
Carbon prices should be
Note: CEE countries are defined as Czechia, Hungary, Poland and the Slovak Republic. Nordic countries are defined as Denmark, Finland, Norway and Sweden. ETS refers to emissions trading system. Net effective
prices across sectors net of fossil fuel support.
increased
and faster
further
average
average carbon rates are calculated as weighted
carbon
Carbon Rates
Net effective carbon tax rates EUR per tonne of CO2, 2021 -10 0 10 20 30 40 50 60 70 80 90 CEE Estonia Latvia OECD Lithuania Nordic countries Carbon tax Emissions trading system permit price Fossil fuel subsidy Fuel excise tax Net effective carbon rate
Source: OECD Net Effective
database.
The rise in renewables needs a stronger electricity grid Source: International Energy Agency. Wind and solar energy supply % of total electricity production 0 2 4 6 8 10 12 14 16 18 2001 2003 2005 2007 2009 2011 2013 2015 2017 2019 2021 Wind Solar PV Solar photovoltaic
Investing in public transport to reduce emissions
Note: CEE countries are defined as Czechia, Hungary, Poland and the Slovak Republic. Nordic countries are defined as Denmark, Finland, Norway and Sweden. Source: ODYSEE-MURE database.
Workers
public transport,
foot % of all workers 0 5 10 15 20 25 30 35 40 Latvia EU Nordic countries Estonia CEE 2019 2000
commuting by
by bicycle or on
For more information

Disclaimers:
The statistical data for Israel are supplied by and under the responsibility of the relevant Israeli authorities. The use of such data by the OECD is without prejudice to the status of the Golan Heights, East Jerusalem and Israeli settlements in the West Bank under the terms of international law. This document and any map included herein are without prejudice to the status of or sovereignty over any territory, to the delimitation of international frontiers and boundaries and to the name of any territory, city or area.
26
OECD
oe.cd/estonia
OECDEconomy
