“Keio Academy of New York promotes trans-Pacific, trans-cultural and trans-disciplinary learning. The mission of Keio Academy of New York is to develop, foster and utilize “Tri-cultural’ education by combining the best of Japanese, American and Keio cultures, to produce graduates who have a strong sense of “moral-independence” and “self-reliance” which has been a Keio tradition since Keio Gijuku’s establishment by Fukuzawa Yukichi in 1858.”
Research Review: Keio Interdisciplinary Journal Encouraging Learning & Teaching
Library of Congress ISSN: 2831-4638
Published by Keio Academy of New York, October 2024
3 College Road Purchase, New York
Supervisor of Research
Editor-in-Chief
Christopher de Lozier
Editorial Committee
Christopher de Lozier
Junko Hayami
Michael Kovens
Leah Mortenson
From the Editor
It continues to be my honor to announce the publication of the third issue of Research Review: Keio Interdisciplinary Journal Encouraging Learning and Teaching at Keio Academy of New York. The publication of this third edition is testimony to the continued commitment to excellence by the faculty of Keio Academy of New York and is a reiteration of the renewal of our mission to provide a Tricultural and bilingual education in Japanese and English. Keio Academy remains a unique teaching and learning environment. Its teachers, varied in their backgrounds and expertise, embody the curriculum necessary to provide 21st century students with the broad education they need to become self-reliant, morally independent, responsible and productive members of society in this rapidly changing world. Research Review: Keio Interdisciplinary Journal Encouraging Learning and Teaching continues to be a model of lifelong learning and a commitment to the encouragement of learning and teaching.1
In this Issue…
This third issue of Research Review is a special issue with science at Keio Academy of New York as the central focus. As the main feature, Keio Academy science and tech teacher Michael Kovens brings to publication eight of his students’ articles from hard science topics studied in his class. But to start things off, Professor Tatsumi introduces us to two of his young critical literary thinkers from his 2024 Headmaster’s Bookclub, with their personal reading, analysis and association of Kazuo Ishiguro’s, Never Let Me Go. To wrap things up, one of our teachers-intraining delivers a creative analysis on humor In language. Enjoy!
1 Mr. Christopher de Lozier. Since Mr. de Lozier left Keio NY in September 2024, Dr. Leah Mortenson has assumed the role of Editor-in-Chief.
Please note: this issue of Research Review was overseen and edited by former Editor-in-Chief
Table of Contents
The Headmaster’s Book Club
Kazuo Ishiguro’s Narrative of the Vanishing: An Introduction Page 1
Takayuki Tatsumi
Who I Want to Be: A Reading of Never Let me Go Page 4
Kana Yamabe
Never Let Me Go: A Reflection on Graduation Page 6
Hitomi Kunihiro
Science at Keio Academy
Honors Biology Lab Reports Introduction Page 8
Michael Kovens
Pathology Lab Report Page 10
Rima Mitani
Ebola virus transmission experiment Page 16
Takeaki Konishi
Pathology Lab Report: Werefox Game – Who got an infection of Echinococcus? Page 23
Miki Nakayama
The role of immunity, medical prevention, and their combination in protecting the Keio community from a flu outbreak Page 37
Hitomi Kunihiro
COVID-19 Immunology Lab Report: How Keio Academy survived COVID-19 Page 45
Haruto Izumi
Immunology Project Lab Page 54
Yoshiaki Shimizu
Immunology Lab Report: Echinococcus with Weredog Game Page 63
Mirai Nakai
Gastric Cancer Inheritance Experiment Page 79
Koichiro Komoto
The Untold Truth About Laughing Your @$$ Off: Humor In Language Page 92
Binh (Ben) Luu
Headmaster’s Book Club 2024 Kazuo Ishiguro, Never Let Me Go
Kazuo Ishiguro’s Narrative of the Vanishing: An Introduction
Takayuki Tatsumi
Professor Emeritus, Keio University
Headmaster, Keio Academy of New York
I met Kazuo Ishiguro (1954-), the 2017 Nobel Laureate in Literature, a couple of times at Keio University, Mita; thanks to Hiroshi Hayakawa, current president of Hayakawa Publishing and Keio alumnus, he paid visits to Tokyo in 2001 after the publication of When We Were Orphans (2000) and in 2015 on the occasion of the 125th anniversary of Keio’s Faculty of Letters. What amused me most is that he served as witness to the marriage between Atsushi Hayakawa, vice president of Hayakawa Publishing and his bride. Attending their wedding ceremony at Imperial Hotel in May 2015, I was deeply impressed with his insightful speech redefining marriage as a foreign language ruled by regularities and irregularities: there is no rule without exceptions.
Accordingly, when Hitomi Kunihiro asked me if it is possible to form a book club with special emphasis on dystopia, I sent her my list of major dystopian novels including Ishiguro’s:
H.G. Wells, The Island of Dr.Moreau (1896)
Aldous Huxley, Brave New World (1932)
George Orwell, 1984 (1949)
Ray Bradbury, Fahrenheit 451(1953)
Kurt Vonnegut, Cat’s Cradle (1963)
J.G.Ballard, High-Rise (1973)
William Gibson, Neuromancer (1984)
Margaret Atwood, The Handmaid’s Tale (1985)
William Gibson & Bruce Sterling, The Difference Engine (1990)
Michael Crichton, Jurassic Park (1990)
Kazuo Ishiguro, Never Let Me Go (2005)
Paolo Bacigalupi, The Windup Girl (2009) and more
Given that Orwell’s radical concept of 1984 has been inherited and updated by Bradbury and Atwood, it is true that the literary subgenre of dystopian fiction sounds stimulating in this dystopian age. However, I was also curious to know how the boarders of Keio Academy of New York read Ishiguro’s boarding school novel. Hitomi also said Ishiguro’s novel overlapped with her own experience at a British boarding school. Thus, we decided our text and started the book club from this past February. The members are:
Hitomi Kunihiro (12th, Y)
Miki Nakayama (12th, N)
Ayano Tamura (12th, Y)
Tamaki Kamada (12th, N)
Mimi Suzuki (12th, N)
Ying Chang (11th, Y)
Kana Yamabe (10th, Y)
A close reading of Never Let Me Go convinced me that it is highly plausible that given the British literary heritage the author inherited from Jane Austen, Charles Dickens, George Eliot and Henry James, the readers will misconceive this novel as another realist novel describing human beings raised at a typical public school recalling Woking Grammar School in Surrey Ishiguro studied at in the 1970s. Please note that the story of the novel gets started in the 1970s, when cloning technology is available. Accordingly, this novel creates an alternate history of the 1970s featuring Hailsham as an organ farm. This is the reason why the provider of the donor cell is called “a possible,” not mother or father. It is apparent that Ishiguro had in his mind the concept of “possible worlds” speculated by a German Enlightenment philosopher Gottfried Leibniz.
Furthermore, we should be keenly aware that the characters of the novel including the narrator are not typical teenagers but clones whose organs were to be donated for transplantation. Of course, the life of Hailsham students might very naturally induce you to compare the story with numerous boy-meets-girl narratives. If you are an avid fan of hard science fiction, you might feel like dismissing cloning technology as out of date in the wake of the discovery of iPS cell (induced pluripotent stem cell) made possible by John B. Gurdon and Shinya Yamanaka, the winners of the Nobel Prize in Physiology or Medicine 2012. Nonetheless, even today in the mid-2020s, this novel does not get old-fashioned, following the example of Daniel Keyes’s novel Flowers for Algernon (novella 1959/novel 1966) that has persistently kept appealing to many readers across generations. This novel is highly readable, for Ishiguro’s question itself is very simple and essential: “Do clones have souls?” You should feel free to paraphrase this question as “Do robots have souls?” or “Do Artificial Intelligences have souls?” or “Do ChatGPT have souls?”
Very lately I had a chance to see Ishiguro’s adaptation in 2022 of Akira Kurosawa’s masterpiece “Ikiru” originally produced in 1952. When faced with death, the protagonist Kanji Watanabe, a Civic Hall civic section chief as performed by Takashi Shimura, radically transforms his lifestyle; as a typical bureaucrat Mr. Watanabe has long taken for granted the way of passing the buck, not rocking the boat. And yet, one day he is diagnosed with cancer and told he has little time left to live. It is this death sentence that invited Mr. Watanabe to comprehend the meaning of life and start helping parents to build a playground for children in his local neighborhood. In the 2023 version “Living” directed by Oliver Hermanus Ishiguro very carefully composed his screenplay and tactfully transplanted Kurosawa’s postwar Tokyo in postwar London, featuring the late style of another typical bureaucrat Rodney Williams of London County Council living a life of routine as performed by William Nighy. One day a young woman who recently took up a position at a Lyons Corner House restaurant told him that Rodney was nicknamed as “zombie.”
At this point I could not help but construct an analogy between clone and zombie, both hovering between life and death and reviving the discourses of the vanishing we are likely to forget in our media-saturated reality. Herein lies the essence of the literature of Kazuo Ishiguro.
Who I Want to Be: A Reading of Never Let me Go
Kana Yamabe Keio Academy of New York
Never Let Me Go by Kazuo Ishiguro starts from where the narrator of this book, Kathy, talks about her life as a “carer” who takes care of the “donors”. Not knowing that this book is a dystopian novel, we can see her story as a normal adolescent memory and how she grew up in an orphanage like boarding school called Hailsham. After realizing that the students in Hailsham are actually clones and they are born only to donate their organs to humans, the reader may think this story is just a dystopian novel that is predicting the problem that may occur in the future.
But I thought that this book is talking about why we suddenly feel strong anxiety, or why our future is not always a sure thing that we can rely on.
Reading this book makes us think of a simple but hard question about what we consider “human beings” are. After living as a boarding student, I realized that the hard part is that we see many parts of other people’s personality. This means that humans are more complicated than we expected them to be. Talking with different people, inside the room, outside the room, morning and evening, during test week, like this many people’s personalities differ in various kinds of situations. It is a natural thing and you may realize this without experimenting with dormitory life. But you have to “live” with the person even if you see the parts you cannot love or accept. Taking a distance will not help because you are physically near. After reading this book, I thought Kathy went through the same problem while she lived in Hailsham and shared a house called Cottage. Her nearest friend Ruth had different personalities and it must have been a dilemma for Kathy to talk to a person who has both sides that she can adore and not.
By knowing one character Kathy, I thought I could have been friends with her if we were in the same world line. Just like me, Kathy gets hurt by other people, swept away by rumors, outburst the anger to others and seeks for hope and tries to accept the unfavorable future even though it is dark and there is nothing she can change by herself.
But I suddenly remembered that Kathy is not a “human”, at least not deserved as a human being since she is a clone. When somebody treats people by taking away their “hope”, I think they are dehumanizing the person. The most recognizable scene of Kathy and her friends
trying to accept the reality is where they went to see the boat sitting beached in the marshes (Chapter Nineteen). A boat that is unknown where it came from and no one really cares about it but is sure that it is left there in Norfolk. I think this scene symbolizes lack of hope. They cannot go anywhere or run away from the truth but just sit there like the boat, without anyone’s notice that they are suffering. After reading this part I thought the problem is not whether the clone can behave like human or not but whether we can treat a creature who behaves like humans as “humans” or not.
In reality I think it is a difficult thing to consider clones as the same human beings. I think one of the reasons why we may make clones in the future despite the fact that we cannot treat them fairly is because of our egos that we want to make the world more convenient or we want to live longer like in this book. From many egos and prides, we can get hurt. Even though our world is right now prohibiting making human clones, as long as too many egos are existing we always have the risk that we can get hurt or hurt someone like Kathy and other students in Hailsham. This book reminds us of the importance of knowing that we are always living in an unstable world. That is why we feel strong anxieties. But if we can make a choice not to hurt others, it can be a loving thing to do that leads to true happiness. As long as we look ahead and take the right actions, we may make our world a surer place to live in.
Looking at it now, I think my anxiety towards the boarding school was because I was afraid of other people’s egos and that they might hurt me while living with them. Since they are not my family, I was not sure if there would be someone who cares about me if I got hurt. Luckily, I have someone who cares about me in my dormitory and some people that I care about. If I was in Kathy’s world I would seek for a person who would be concerned about us too. We can defend ourselves against self-centered egos. Moreover, even if we suffer from them, we can still walk forward. I want to be that kind of person who cares about others, not be the one who hurts.
Never Let Me Go: A Reflection on Graduation
Hitomi Kunihiro Keio Academy of New York
Staring at the list of possible dystopian novels our newly formed book club will discuss, I still remember the instant attraction I felt toward Kazuo Ishiguro’s Never Let Me Go. The idea of reading a novel set in a boarding school while being in one myself felt like a great way to bring closure to my three years at Keio Academy of New York.
This novel follows the journey of thirty-one-year-old Kathy H, a clone created to donate her organs until death, as she recalls her youthful days. Hailsham, introduced early in the story, is a boarding school where Kathy grew up. From late-night chats with the girls after lights out to occasional quarrels among friends, the first third of the novel is filled with nostalgic memories of Hailsham. Kathy also remembers the less loving aspects of Hailsham, such as Madame, a frequent visitor, who avoided Kathy and her friends as if they were spiders, and the guardians, who kept the students in the dark about their roles in society.
Even though Kathy’s experience at Hailsham was not always glamorous, her time there was invaluable to her. At the beginning of the novel, Kathy searches for Hailsham, getting excited whenever she sees a pavilion, thinking she has found it. This search signifies more than a physical location; it represents her quest for belonging and a desire to reconnect with her past.
Hailsham symbolizes innocence and ignorance. The idyllic appearance of the boarding school masks the grim reality of the students' true purpose. This setting becomes a miniature controlled society, sheltering children from the harsh truths of their existence. The seemingly nurturing environment is laced with manipulation and control, reflecting how society can create comforting illusions to conceal uncomfortable truths. Through Hailsham, Ishiguro explores themes of complicity and the loss of innocence as the students gradually uncover the reality of their futures. The school represents a place of both cherished memories and profound betrayals, encapsulating the complex emotions that arise from discovering one's predetermined fate.
Kathy’s attachment to Hailsham underscores the theme of memory and the need to hold onto the past. Despite the grim reality of what Hailsham represented, it was also a place where Kathy experienced genuine emotions and relationships. Her search for Hailsham is, in essence, a search for a part of herself that she fears might be lost. It is a testament to the complexity of human emotions, where even a place associated with pain and loss can be cherished for the sense of identity and history it provides.
After graduating from Keio Academy of New York, I found myself relating to Kathy in ways I couldn’t when I was still at school. At night, my blanket from school, with its familiar scent of my roommate and me, brings comfort, taking me back to the tiny, messy room we shared for three years. Like Kathy, who kept her collections from Hailsham in a box, I still have
the school’s timetable as my phone’s wallpaper, fearing that changing it would mean letting go. Everywhere I look, Keio follows me—from the sight of the same energy drink my friends chugged before exams in a convenience store to struggling to finish my Chinese takeaway, a reminder of countless days spent ordering food with a friend now off to a different university. When I am bored, I don’t imagine what my college life will look like; I close my eyes and remember as much of Keio as I can, fearing I might forget the little details that brought smiles on seemingly impossible days.
In Chapter 10, once Kathy and her friends move into the Cottages, a place of residence after Hailsham, she talks about missing her Hailsham days. Some students try to find pieces of Hailsham in their new lives, only to realize the Cottages is a completely different place. Though most of Kathy’s friends are still with her, some things cannot be replicated. Similarly, upperclassmen often say Keio University is not a bigger version of Keio Academy of New York. I can already imagine trying to piece together the brand-new puzzle of college life, only to find that no matter how hard I try, the finished product will not be of my beloved high school.
From the beginning of the novel to the end, Kathy looks back on her life, not forward. With her career as a carer approaching its end, it is only a matter of time before she begins her donations. But for us, the class of 2024, we have a whole life ahead. In this sense, I am different from Kathy, whose joyous moments exist only in the past.
Though it is challenging to move on from Keio Academy of New York, we have the opportunity to do what Kathy could not: look forward. As we transition into the next chapter of our lives, it is essential to carry the memories and lessons from Keio with us while being prepared to create new experiences and accomplishments. The time has come for us to step into the uncertainty of the future with our heads held high, knowing we will always be there for each other.
In conclusion, while Kathy H's journey in Never Let Me Go is marked by a longing for the past, we, the class of 2024, have the privilege and the challenge of looking ahead. Our time at Keio Academy of New York has prepared us not just to remember, but to grow and thrive in the world beyond. Let us cherish the past, live in the present, and look forward to a future full of possibilities.
Honors Biology Lab Reports Introduction
Michael Kovens Keio Academy of New York Science & Technology Department
12th grade honors biology class completed a series of projects during the year in which they move through the scientific process to develop a deeper understanding of topics of their choosing. Lab reports were written to detail the scientific process, as the students performed it, as well as their findings. Student reports are collected here, spread across three different projects based on questions and topics students submitted when asked about their interests. Submissions included:
• What is the relationship between rabies and hydrophobia in humans?
• How did COVID-19 spread around the world?
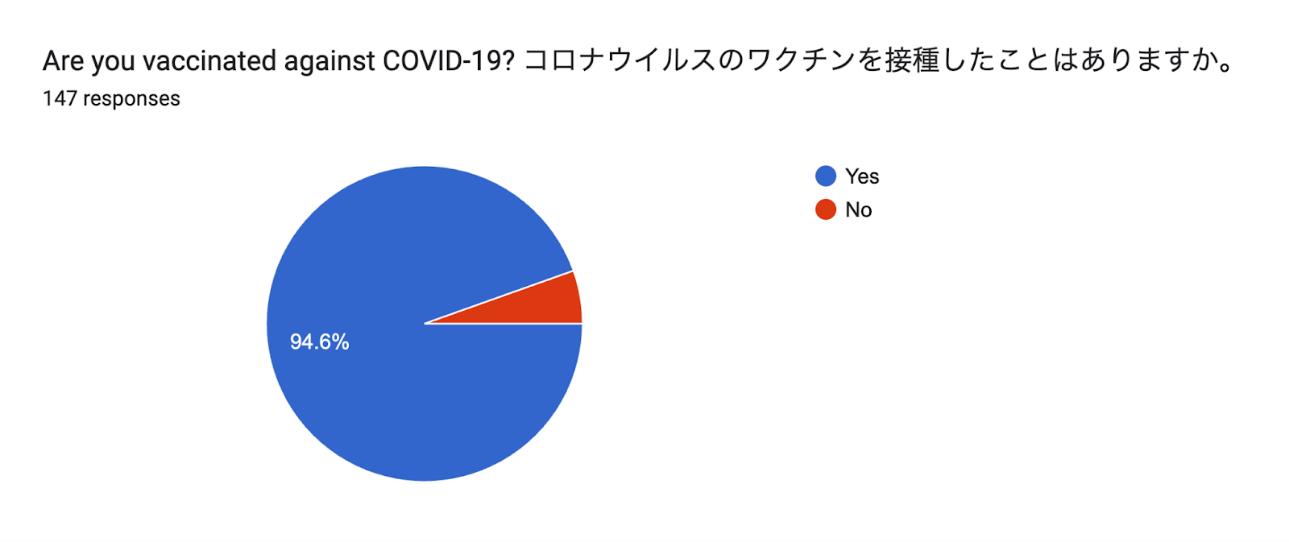
• What are the long term effects of the COVID-19 vaccine?
• What is immunity?
• Who is at high risk for Alzheimer’s?
• How do doppelgangers happen?
From these specific questions, projects were designed to guide students in answering their questions through a practical exploration of pathology, immunology, and genetics.
For the first project, teams of 2-3 students chose a specific disease caused by a microbial pathogen to research. They were then charged with designing a modeling experiment to answer the question, “How would an epidemic of the disease spread through the Keio Academy of New York (KANY) population?”. Team A, comprised of Rima Mitani and Hitomi Kunihiro, focused on bubonic plague. Team B, comprised of Reo Yokota and Haruto Izumi, focused on COVID-19. Team C, comprised of Takeaki Konishi, Yoshiaki Shimizu, and Koichiro Komoto, focused on Ebola. Team D, comprised of Miki Nakayama and Mirai Nagai, focused on echinococcosis. Student work through this project is represented by the following contents:
• Pathology Lab Report by Rima Mitani
• Infection status of Covid -19 in Keio Community by Reo Yokota
• Ebola virus transmission experiment by Takeaki Konishi
• Pathology Lab Report: Werefox Game – Who got an infection of Echinococcus? by Miki Nakayama
For the second project, teams of 2-3 students researched the immune response to a specific disease caused by a microbial pathogen. They were then charged with designing a modeling experiment to answer the question, “How would immunity and medically-developed therapies protect the KANY community from an epidemic of the disease?”. The students chose to remain
in the same teams with the same diseases of focus from the first project, with the exception of Team A changing their focus to influenza. Student work through this project is represented by the following contents:
• The role of immunity, medical prevention, and their combination in protecting the Keio community from a flu outbreak by Hitomi Kunihiro
• COVID-19 Immunology Lab Report: How Keio Academy survived COVID-19 by Haruto Izumi
• Immunology Project Lab by Yoshiaki Shimizu
• Immunology Lab Report: Echinococcus with weredog game by Mirai Nakai
For the third project, students chose a specific genetic disorder to independently research. They were then charged with developing pedigrees to display various paths of inheritance of the disorder as evidence to answer the question, “Is it possible to make a population that is 100% wild-type or 100% mutant-type within 3 new generations?”. Student work through this project is represented by the following contents:
• Gastric Cancer Inheritance Experiment by Koichiro Komoto
Abstract
Pathology Lab Report
Rima Mitani Keio Academy of New York
The black death, a historical pandemic caused by the bacterium Yersinia pestis, had three types of plague; primary bubonic, septicemic, and pneumonic. In the black death experiment, the desk represents a well and dice were prepared. The players who visited the infected well would be classified as infected people and dice would determine infected players’ faith. Through an experiment in the setting of a flea bites, determined the morbidity rate and mortality rate of the black death of total population and infected people. Although the hypothesis was 70% for morbidity rate and 60% for mortality rate, results indicated much lower value, 50% for morbidity and 37.5% for total population and 74.0% for infected people mortality. The experiment was limited to flea bites and did not include contacting contaminated fluids or tissues and infectious droplets, therefore the experimental data gaps occurred from the actual data.
Introduction
The black death is one of the infectious diseases which causes most deaths. It is a global epidemic of bubonic plague that spread around the world in the mid-1300s. It is caused by the bacterium called Yersinia pestis (History.com Editors, 2010). Y. pestis is created by pPCP1 Plasmid, pCD1 plasmid, pMT1 plasmid, ribosomes, cytoplasm, bi-polar staining, a chromosomal DNA, which surrounded by cell membrane, slime envelop, and cell wall. There are three types of plague of black death; primary bubonic plague, septicemic plague, and pneumonic plague. flea bites, contact with contaminated fluid or tissues, and infectious droplets. Bubonic plague is the most common plague of the three plague (Phillips, 2017). In addition, for those pests, there are three ways to be infected. Because there are three major ways of plague, it has a much higher risk of being infected to the black death, which means it is easier to take Y. pestis into a human's body and cause death from that harmful bacteria. First, fleas visit the body areas with dead rodents because of disease and it increases the risk of infection. The fleas see a new host after the rodent dies. It commonly leads to primary bubonic plague and septicemic plague. Second, people contact contaminated fluid or tissue and are highly infected. This also commonly leads to bubonic plague and septicemic plague as well as flea bites. Third, coughing droplets who have disease causes the plague bacteria in the air and through the air, the other person also becomes infected. This airborne infection is not common and the only way to transmit the plague between people. This plague is not the same as others, it leads to pneumonic plague (CDC, 2024). The way to invade the tissue of the host will change depending on the type of plague. For bubonic plague, the Yersinia pestis which is described in the beginning enters at the bite of fleas and travels through the lymphatic system to the closest lymph node where it replicates (WHO, 2022). That lymph node turns out inflamed, tense and painful and is allowed to be called “bubo” which has the same meaning as “bubonic”. Pneumonic plague is which bubonic plague advanced and spread to the lungs. In septicemic plague, Yersinia pestis bacteria spread through the bloodstream and cause septicemia which is a blood infection (Harvard Medical School, 2024). Symptoms of
bubonic plague take around 2 days to 6 days after flea bites and people who are infected may cause high fever, chills, muscle aches, headache. For septicemic plague, it includes nausea, vomiting, diarrhea and abdominal pain. By samples of the patient’s blood, sputum, or lymph node aspirate, the health worker could diagnose (CDC, 2019). The mortality rate of this is around 30 to 75%, this is 1 person in 3 people to three third in total, it includes all 3 plagues (Phillips, 2017). Mortality rate will change depending on the types of plague. Bubonic plague is 10 to 15% of treated. Septicemic plague is 40% of treated. Pneumonic plague is 100% of treatment (Bandolier, n.d.).
In this experiment, measure the morbidity rate of black death from three major ways; flea bites, contact with contaminated fluid and tissues, and infectious droplets. Each one of them is at extremely high risk of being infected. Thus, as hypothesized, the morbidity rate of the black death for the total population will be 70% and the mortality rate of the black death for the total population will be 60% in the experiment.
Material and Method
Eight participants each prepared the computers to use digital dice. Also, two overseers prepared a computer which is able to access a random number generator. In this black death experiment, the disease was transmitted through the infection method of “flea bites”. Four desks resembling “wells” were assigned within the classroom and one of them was “flea infested”. It would be decided by overseers by using a random number generator and changed at the start of each round. In the total experiment, there were five trials, and, in each trial, there were two rounds. The participants were moved to one of the wells which they chose. Once the participants had settled, the overseers announced which well was “flea infested”. The participants who are in “flea infested” rolled some dice by their computer to decide their fate and their fate were told to overseers to record. If the participant rolled a number between 3 to 6, the participant recorded died. If the participant rolled a number 1 or 2, the participant recorded survived. The second round was started after excluding the dead participants. All of the numbers who died, survived, and not infested were recorded by overseers for each round in a data Tables 1-5. If a surviving infested participant in the first round chose the infested well again in the second round, they were automatically dead. If an uninfected participant in the first round chose the infested well in the second round, they were able to roll some dice with the same rule. At the end of a trial, the participants’ status was returned to a healthy state. The same process was repeated for 5 trials and the results were recorded by overseers in data Tables 1-5.
Result
In trial 1, 2 infected participants survived, 2 participants died out of 4 infected participants. In total, 6 participants survived, and 2 participants died out of 8 participants (Table 1). In trial 2, 0 infected participants survived, 3 participants died out of 3 infected participants. In total, 5 participants survived, and 3 participants died out of 8 participants (Table 2). In trial 3, 2 infected participants survived, 3 participants died out of 5 infected participants. In total, 5 participants survived, and 3 participants died out of 8 participants (Table 3). In trial 4, 0 infected participants survived, 4 participants died out of 4 infected participants. In total, 4 participants survived, and 4
participants died out of 8 participants (Table 4). In trial 5, 1 infected participant survived, 3 participants died out of 4 infected participants. In total, 5 participants survived, and 3 participants died out of 8 participants (Table 5). The average morbidity rate was 50.0%. All p-values were above 0.05 and no outliers were found (Table 6). The average mortality rate of the total population was 37.5% and the standard deviation of the total population was 8.84. All p-values were above 0.05 and no outliers were found (Table 7). The average mortality rate of the infected people was 74.0% and the standard deviation of the infected people was 24.1. All p-values were far above 0.05 and no outliers were found (Table 8).
Trial 1
Round
Table 1: Number of infested, dead, living participants in trial 1
2
Table 2: Number of infested, dead, living participants in trial 2
Table 3: Number of infested, dead, living participants in trial 3
4
Table 4: Number of infested, dead, living participants in trial 4
Table 5: Number of infested, dead, living participants in trial 5
Table 6: Morbidity rate of the total population
Table 7: Mortality rate of the total population
Table 8: Mortality rate of the infected people
Conclusion
The black death was the global epidemic disease caused by the bacterium called “Yersinia pestis”. The three types of plague, primary bubonic plague, septicemic plague, and pneumonic plague caused a high risk of being infected to the black death and death. Flea bites commonly lead to primary bubonic plague and septicemic plague is one of the three major infection ways. The experiment aimed to measure the morbidity rate and mortality rate of the black death from flea bites. It was hypothesized that the morbidity rate of the black death for the total population will be 70% and the mortality rate of the black death for the total population will be 60% in the experiment. In the experiment, the black death was transmitted through flea bites in each round. The infected participants determined survival or death for five trials with 2 rounds each and recorded numbers of people infected, and people died. Unfortunately, the result did not support the hypothesis.
Through five trials with two rounds, the morbidity rate was 50.0% (Table 6) and mortality rate of the total population was 37.5% (Table 7). This number weighs lower than expected. One reason was that this experiment just settled the infection way as flea bites, not also the other two ways. In real life, the ways to infection were flea bites, contact with contaminated fluid or tissues, and infectious droplets. Even the rate was still big, including other ways that make it a much higher risk for people to be infected and die. Also, all of the p-values exceeded 0.05 and were accepted and classified as not outliers, no outlier was found in this experiment (Tables 6-8).
References
Centers for Disease Control and Prevention [CDC]. (2019, November 26). Plague FAQ. CDC. https://www.cdc.gov/plague/faq/index.html#how
Centers for Disease Control and Prevention [CDC]. (2024, May 14). How Plague Spreads. CDC. https://www.cdc.gov/plague/transmission/index.html
Harvard Medical School. (2024, May 21). Plague (Yersinia Pestis). Harvard. https:// www.health.harvard.edu/a_to_z/plague-yersinia-pestis-a-to-z
History.com Editors. (2023, March 28). Black Death. History. https://www.history.com/topics/ middle-ages/black-death
Phillips, A. M. (2017). The Black Death: The Plague, 1331-1770. University of Iowa. https:// hosted.lib.uiowa.edu/histmed/plague/#:~:text=The%20bubonic%20plague%20was%20the
Bandolier (n.d.) Risk of death from plague today and in history. Bandolier. http:// www.bandolier.org.uk/booth/Risk/ plague.html#:~:text=Mortality%20depends%20on%20the%20type, %25%20fatal%2C%20regardless%20of%20treatment
World Health Organization [WHO]. (2022, July 7). Plague. WHO. https://www.who.int/newsroom/fact-sheets/detail/ plague#:~:text=Bubonic%20plague%20is%20the%20most%20common%20form%20of%20plag ue%20and,is%20called%20a%20'bubo'.
Abstract
Ebola virus transmission experiment
Takeaki Konishi Keio Academy of New York
The experiment was designed to study how the Ebola virus would spread in the Keio NY Community. Ebola is a virus that infects people through bodily fluids such as sweat and blood. The experiment was done with an exchange of water to simulate the fluids. 10 participants were involved in the experiment. 9 received test tubes contained only water, and 1 received test tube contained salt water. Participants exchanged the liquid based on the instruction card that was distributed (Figure 1). When all the exchanges were completed, silver nitrate was dropped into all the test tubes to see if they were “infected” (reacted). The number of people who had reactions was recorded for each trial. It was hypothesized that the number of exchanges is going to affect the infectious rate and was predicted that more exchanges would increase the infectious rate. From the result of the experiment, the hypothesis was opposed. The average infectious rate for 1 exchange was calculated to be 0%, 2 to be 50%, 3 to be 100%, and 4 to be 70%. The trend went up once, but at the maximum exchange number, it decreased. The R^2 value of the trend was calculated to be 0.638. This showed that the number of exchanges and infectious rates are not strongly associated. However, there is a chance that the number of trials was not enough, and the system of exchanging was incomplete which caused 3 exchanges to have an extremely high percentage.
Introduction
Ebola is a deadly disease caused by the Ebola virus. Ebola was first discovered and outbreak almost the same time in 1976 in two different central African countries, the Democratic Republic of the Congo and South Sudan (CDC, 2023). 4 types of Ebola virus, Zaire ebolavirus (EBOV), Sudan ebolavirus (SUDV), Tai Forest ebolavirus (TAFV), and Bundibugyo ebolavirus (BDBV) are known to cause illness in humans. The common ones are Zaire and Sudan. There was the largest outbreak of ebolavirus in 2014 in West and Central Africa which was caused by the Zaire strain. It was introduced to other countries such as the US, Spain, Italy, etc. Over 28,000 cases were reported, and over 11,000 people died during the outbreak (UK Health Security Agency, 2023). The virus has the shape of a thread and is twisted (Figure 1). The virus is sometimes branched which makes the length vary, but the diameter is typically around 80 nm (BCM, n.d.). Ebola can only be transmitted through bodily fluids including saliva, urine, sweat, feces, vomit, or semen. Additionally, the disease can only be transmitted when the patient has the symptoms. When the liquid is taken into the body through any mucous membrane or damaged skin, the person who got it would be infected. It cannot be transmitted through the air like having a conversation or walking past someone who has the virus (WHO, 2023). Some common symptoms of Ebola are headache, sudden high fever, extreme tiredness, and muscle pain, which eventually leads to vomiting, loss of appetite, diarrhea, and bleeding both internal and external. In some extreme cases, memory and hearing abilities could be lost (WHO, 2014). The mortality rate for Ebola ranges from 25%-90% depending on the strain of the virus. One deadliest strain,
the Zaire strain, has reached up to 90%. However, with the improvement of understanding and treatment, the average mortality rate has dropped to 50%. When the virus infects a human cell and increases its number, it will infiltrate a living cell by going through the passage of nutrients. After it gets in the cell, it will hijack the cell by releasing RNA of the virus in there, creating copies of itself through the lytic cycle.1 Finally, it will destroy and lead the cell to die or be unable to function. The copies created will use the cell membrane to create a capsule to protect itself to travel to other cells and make more copies safely (SITN, 2014). Preventing Ebola infection, washing hands frequently, and avoiding contact with someone with symptoms will be important. In addition, getting a vaccine shot is also effective in preventing the disease. There is no way to cure Ebola, but using some medicine and fluids can treat it and ease the symptoms for the patients (Cleveland Clinic, 2021).
The purposes of the project are to develop an understanding of microbial pathology, practice skills in experiment development, and explore the use of modeling in experimentation. The goal of this experiment is to gain an understanding of how the Ebola virus will spread in the Keio Academy of New York. It was hypothesized that the chance of infection is dependent on the activeness of the person. The results are predicted to be individuals with a higher level of activeness have a higher chance of infection because they are going to have more interaction with others and have more chance to exchange bodily fluids.
Method
A test tube that contained 30 ml of water (only one of all the tubes contained sodium chloride and was dissolved in water), one dropper, and a set of instruction cards (Table 1) were given to each person. 5 pairs were randomly made among the participants. An instruction card was randomly picked from the set by one person in each pair. A dropper was used to draw out water and dropped into the partners' tube when the card indicated exchanging. Other instructions were given and done by each pair that did not get instruction to exchange the liquid. New pairs were made after everyone completed the instruction in 2 minutes, the same steps were repeated 3 more times. A drop of silver nitrate was added to all the test tubes after all the exchanges were completed. The result of the experiment (either infected or not infected) was recorded (Table 2) depending on the reaction. Participants were considered infected when the liquid turned white (precipitation of silver chloride), and not infected when nothing happened. All the droppers were
Figure 1: Appearance of Ebola virus
disposed and new droppers and test tubes were given. The entire experiment was repeated 2 more times and recorded with the same process (Tables 3, and 4).
*Exchanging* (Shared juice from the same cup.)
*Exchanging*
(Hugged after the soccer game and touched sweat.)
*Exchanging*
(Helped a person who had a cut and touched their blood.)
*Safe* (Talk about your break.)
*Safe* (Play rock, paper, scissors.)
*Safe* (Play word chain game.)
Table 1: List of the instruction cards used for the experiment
Result
The number of people in each activeness and the infected number for each trial were recorded below.
For the first trial, the number of people who had 0 exchange was counted to be 0. The number of people who had 1 exchange was counted to be 1, and number of infected cases was 0. The infected percentage could be calculated to be 0%. The number of people who had 2 exchanges was counted to be 3, and the infected cases were 3. The infected percentage could be calculated to be 100%. The number of people who had 3 exchanges was counted to be 3, and the infected cases were 3. The infected percentage could be calculated to be 100%. The number of people who had 4 exchanges was counted to be 3, and the infected cases were 3. The infected percentage could be calculated to be 100% (Table 2).
Table 2: Number of people in each activeness and infected case for 1st trial
For the second trial, the number of people who had 0 exchange was counted to be 0. The number of people who had 1 exchange was counted to be 0. The number of people who had 2 exchanges was counted to be 4, and the infected cases were 1. The infected percentage could be calculated to be 25%. The number of people who had 3 exchanges was counted to be 2, and the infected
cases were 2. The infected percentage could be calculated to be 100%. The number of people who had 4 exchanges was counted to be 4, and the infected cases were 2. The infected percentage could be calculated to be 50% (Table 3).
For the third trial, the number of people who had 0 exchange was counted to be 0. The number of people who had 1 exchange was counted to be 1, and number of infected cases was 0. The infected percentage could be calculated to be 0%. The number of people who had 2 exchanges was counted to be 3, and the infected cases were 1. The infected percentage could be calculated to be 33.3%. The number of people who had 3 exchanges was counted to be 3, and the infected cases were 3. The infected percentage could be calculated to be 100%. The number of people who had 4 exchanges was counted as 3, and the infected cases were 2. The infected percentage could be calculated to be 66.7% (Table 4).
From the infected percentage of each activeness in each trial, the infection percentage for people who had 1 exchange could be calculated to be 0%. People had 2 exchanges to be 50%. People had 3 exchanges to be 100%. People had 4 exchanges to be 70% (Table 5). The line graph (Figure 2) was created from this data and shows a bent shape. The highest percentage of infection was 3, and it went down to 4. In addition, the R2 value was calculated to be 0.638.
Table 3: Number of people in each activeness and infected case for 2nd trial
Table 4: Number of people in each activeness and infected case for 3rd trial
Table 5: Total number of people in each activeness and infected case of the entire experiment
Figure 2: Activeness vs. Percentage of Infection
Conclusion
Ebola is an infectious disease mainly found in African countries and transmitted from person to person by bodily fluids such as saliva, blood, sweat, etc. (CDC, 2023). This experiment was designed to simulate and study how the virus will spread and infect people in the Keio Community based on the characteristics of Ebola virus. The water containing salt was exchanged by the instructions on the instruction cards, and silver nitrate was used to test if the person got the salt. The liquid turned white if the person had salt in the water. The reaction was used to define whether the person was infected or not. It was hypothesized that activeness (number of liquid exchanges) is going to affect the person’s infection rate and was predicted that people with higher activeness would have a greater chance of being infected than people with lower rates.
The infected number of people and the infectious rate were calculated and shown in the result section. From the result, it could be said that the hypothesis was opposed to the result of the experiment. The average infectious rate for each activeness was calculated (Table 5). 0% for 1 exchange, 50% for 2 exchanges, 100% for 3 exchanges, and 70% for 4 exchanges (maximum). The rate was increased from 1 to 3 exchanges but went down to 4 exchanges. This result opposes the common sense that more activeness would provide a greater chance of infection, however,
the randomness of the data would make those changes. The R2 value was calculated to be 0.638 (Figure 2). This shows that activeness does not necessarily affect the infectious rate. But because the 100% for 3 exchanges was extremely high, the R2 value without it was calculated. And the value jumped up to 0.9337. The R2 value in this case was high enough to say that activeness can affect the infectious rate.
Since the exchange and pair-up were randomly done depending on the probability, and the number of people in each activeness was not controlled, it has a chance that the 100% for 3 exchanges would decrease when those systems were more controlled. Also, the lack of trials (less data) and participants could be considered as other factors that might affect the result of the experiment. For the follow-up question, researching the immune system for the Ebola virus is going to help to improve the understanding of this topic, and designing the experiment that implements the immune system would be an effective method of learning. Which could lead to learning more about real-world cases.
References
Baylor College of Medicine [BCM]. (n.d.). Ebola virus. BCM. https://www.bcm.edu/ departments/molecular-virology-and-microbiology/emerging-infections-and-biodefense/specificagents/ebola-virus
Centers for Disease Control and Prevention [CDC]. (2024, April 23). Ebola Disease Basics. CDC. https://www.cdc.gov/ebola/about/?CDC_AAref_Val=https://www.cdc.gov/vhf/ebola/ index.html
Science in the News [SITN]. (2014, October 14). Ebola Virus: How it infects people, and how scientists are working to cure it. Harvard. https://sitn.hms.harvard.edu/flash/2014/ebola-virushow-it-infects-people-and-how-scientists-are-working-to-cure-it/
UK Health Security Agency. (2023, January 12). Ebola: overview, history, origins, and transmission. UK Government. https://www.gov.uk/government/publications/ebola-originsreservoirs-transmission-and-guidelines/ebola-overview-history-origins-and-transmission
World Health Organization [WHO]. (2014, November 19). WHO-EMRO: Animated video on Ebola [Video]. YouTube. https://www.youtube.com/watch?v=qnvlQHJkBBY
World Health Organization [WHO]. (2023, April 20). Ebola virus disease. WHO. https:// www.who.int/news-room/fact-sheets/detail/ebola-virus-disease
otes
1. A reproductive cycle for the virus. A virus will take over a cell, use the component to reproduce, and cause the host cell to die (Steward, 2023).
Abstract
Pathology Lab Report Werefox Game – Who got an infection of Echinococcus?
Miki Nakayama Keio Academy of New York 12th Honors Biology
Echinococcosis is a fatal zoonotic disease caused by Echinococcus granulosus sensu lato and Echinococcus multilocularis as pathogen. It is characterized as having a slow and asymptomatic incubation period for the first several years but later, given a highly damaged human body due to the development of cysts in organs which get spread. This study focused on the correlation between the number of people and morbidity/ mortality rate of echinococcosis. It was hypothesized that there is correlation between population and morbidity/mortality rate and was predicted that there was a proportional relationship between them. Three roles; mouse, fox, and human were provided. Experimenters chose one role card which didn't change till the end. A mouse played as the definitive host and a fox was the intermediate host to transmit contagious infection to humans. The infection route was tracked and recorded how contagious transmitted to others. The lab of eight, six teenagers, and twenty-four experimenters was conducted, and each lab was completed for a total of seven rounds. Experimenters changed the seats randomly every round based on the seating chart (Picture 2). In response to the increase in the number of experimenters, the number of each role was proportionally increased. As a result, it failed to detect any relationship between the population and the morbidity/mortality due to dispersion data. It was concluded that this study did not support the hypothesis mathematically. It had to do more rounds to get stronger evidence statistically. It could verify how the data would be affected if the seat changed under regular rules, not randomly next time.
Introduction
Echinococcosis is the fatal parasitic and zoonotic diseases caused by Echinococcus granulosus sensu lato and Echinococcus multilocularis as pathogens (Wen et al., 2019). This disease generally is seen in a wildlife cycle among carnivores such as foxes with small mammals such as mice (WHO, 2021). Human cases are rare but there are two main forms of human echinococcosis which are cystic echinococcosis (CE) and alveolar echinococcosis (AE) (CDC, 2024). CE appears in the growth of cysts in mainlylung and liver and is triggered by tapeworm found in livestock such as sheep, goats, and cattle (National Library of Medicine, 2022). AE is more complex because it includes wildlife as end and intermediate hosts (WHO, 2021). They both will gradually spread and multiply to other organs and give a bad impact to health in the human body. CE is globally distributed except for Antarctica. AE is restricted to the northern hemisphere, in particular to regions of China, the Russian Federation and countries in continental Europe and North America (WHO, 2021).
Humans are at risk of contracting echinococcosis in daily life. On assuming that echinococcosis will spread at Keio Academy, the possibility and factors are considered that experimenters touch
infected (having tapeworms causing echinococcosis) pets like dogs and cats (WHO, 2021) through interaction and then touch their mouth before washing hands, or shaking hands with people who have Echinococcus germs and then parasite eggs into the body, or eating vegetables and fruits attached Echinococcus eggs on them without cleaning, or the infected larvae enter the body when bitten by a mosquito carrying infected larvae. Therefore, humans are infected by ingesting parasite eggs by hand to mouth in contaminated food or by direct contact with animal hosts like foxes and dogs (WHO, 2021). The Echinococcus cannot be transmitted directly between humans unless only the eggs enter the mouth. However, it can be done to clean the environment all the time as a preventive measure to avoid infecting Echinococcus
Echinococcosis is characterized by a slow and long asymptomatic incubation term which might trigger critical morbidity (CDC, 2024). The symptoms will begin to appear when the cyst becomes large enough to cause malfunction (CDC, 2024). The rate at which symptoms develop usually depends on the location of the cyst (CDC, 2019). When humans take in Echinococcus eggs, they travel to the intestines and other parts of the organ in the human body and grow into cysts. These cysts are most commonly found in the liver and lungs. (CDC, 2019). Pulmonary cysts become bigger and rupture, causing anaphylaxis, cough, chest pain, and hemoptysis (NLM, 2022). As treatment for Echinococcus, it is required chemotherapy with benzimidazoles regardless of with or without surgery and monitor the condition after more than 10 years to prevent recurrence (CDC, 2024). By administering benzimidazoles continuously for two years, the progression of the disease is inhibited, and lesion size is reduced (CDC, 2024).
In this lab, it will be performed the following simple experiment to demonstrate the correlation among population and morbidity/mortality rate. Each experimenter will play one specific role which is a mouse, a fox or human. These roles function similarly to the real-life cycle of actual Echinococcus infections. It means a mouse will be a definitive host having the germ of Echinococcus, a fox will play as an intermediate to transfer the contagious to humans. Experimenters will change seats by picking chopsticks indicating the seats up every round randomly and the organizers will record who interacts with mice and a fox. Seven rounds will be conducted for eight, sixteen, and twenty-four experimenter’s labs. It will be assumed that the number of experimenters and final morbidity and mortality rate are in proportional relationship. It can be said population will affect the final data. Both mortality and morbidity rates will be increased if population increases while its rate will be decreased if population decreases.
Material & Methods
Eight Experimenter’s Lab
Eight paper cards written about the experimenter's role in this lab were prepared (Picture 1). Experimenters would see how that particular role worked in this lab written on the card. Three types of roles were given in total as follows: two mice, one fox and five humans. Each animal had a specific role under the proper rules of this lab. A mouse was the definitive host which meant a mouse played as the first animal who had the germ of Echinococcus and would give infection to a fox. A fox played as an intermediate host which meant receiving the germ of
Echinococcus from mice and was available to transfer infection to humans. Humans only got infections from a fox. It would not be contagious between humans.
Experimenters picked one paper card and told the organizers about their own role. Experimenters kept their own roles a secret and did not tell it to others. The role would not change from the beginning to the end. The organizers recorded who would play as mice and a fox in this lab on the record paper to track infection routes easily.
The eight chopsticks written in alphabet (A to H) were prepared. It indicated the seats where experimenters would sit. Experimenters picked one chopstick up randomly and sat in the seat that matched the letter of the alphabet on the seating chart (Picture 2).
After all experimenters sat and paired up two, then the organizers checked where a fox sat and who met a fox recorded it on record paper. In this case, "meet" indicated “sitting as pairs”.
Picture 1: Role cards (Mouse, Fox, and Human)
If a mouse met a fox, it meant a fox got an infection from the mouse and a fox had potential to transfer the germ of Echinococcus to humans from the next round. If a mouse did not meet a fox, it meant still safe, and nobody got infected yet. In the case of meeting up between an uninfected fox and a human, it was still safe, and no one was affected yet. The organizers recorded and collected the data (Table 1). Experimenters kept sitting and waiting until the organizers finished recording and signaled the end of the round, then the first round ended.
In the second round, Experimenters chose one chopstick randomly again and moved to a new seat that corresponds to the alphabet on the seating chart. If those who picked the exact same chopstick, they stayed in the same seat. The organizers recorded and tracked where mice and a fox sat and whether they interacted with each other or not or found humans who got infection from an infected fox having the germ of Echinococcus on record paper (Table 1). If an infected fox met with a human, which means a human got an infection from an infected fox, the spread of infection would start now. The germ of Echinococcus accumulated in the infected human body. In each round, the proportion of Echinococcus germ in the human body increased by 10%. If mice had not met with a fox yet, it meant it was still safe and nobody had got infected yet. In the case of meeting up between an uninfected fox and a human, it was still safe. The seven rounds would be conducted in total under the same procedure and the organizers would record on record paper each round (Table 1).
The general rule below was provided in this lab. If the humans directly met an infected fox twice, the human “dead” which meant the human “game over” and a fox won in this lab. Dead humans were not able to join the next round. If a human met a directly infected fox once but the germ of Echinococcus accumulated every round, so when the 50% of Echinococcus germ was accumulated in the human body, the human “dead.” In other words, the five rounds passed after getting infection from a mouse, was equal to human “game over” and a fox won. Humans who reached 50% of Echinococcus could not join the next round.
At the stage where humans got 30% above Echinococcus germ in the body, which meant three rounds passed after getting infection from a fox, humans were in a state of danger and getting closer to death. The organizers clarified and told experimenters the number of humans who got 30% or higher of the Echinococcus germ in the human body (in danger condition) with anonymity.
Mice and a fox would not die in this lab. This was because the purpose of this lab was to collect data of morbidity and mortality for humans. If mice did not meet with a fox or if infected fox did not meet with humans, or if humans did not meet with an infected fox twice then not reached 50%, which meant humans “win” and a fox “game over.”
Sixteen Experimenter’s Lab
The sixteen experimenter's lab was conducted under the same procedure as the eightexperimenter’s one. The number of roles varies corresponding to the number of experimenters.
After all data was collected, organizers calculated the morbidity rate, mortality rate among all experimenters, and mortality rate among infected humans. It was determined how the number of people affects the morbidity and mortality rate.
Results
Table 1 and Figure 1 were shown the data of eight experimenter’s version labs. The number of infected or dead humans in each round were recorded and the detailed information of getting infection from whom and how to transfer infection (Table 1). Nobody was infected nor died until round 3 (Figure 1). In round 4, the number of infected humans did not change and was still one (Figure 1). The number of dead humans was highlighted red. It brought the first dead human from round 5 (Table 1). In rounds 5 and 6, the number of dead humans did not change, and no new infected humans had been detected which meant 0 (Table 1). In the seventh round, another new human got infected (Table 1). As a result, one infected human and one dead human were detected. At the end, two infected humans, of which one dead humans were detected in total (Table 1).
Table 1: The number of infected or dead humans and information each round in eight experimenter's version
Figure 1: The number of infected or dead humans and information each round in eight experimenter's version
Table 2 and Figure 2 were shown the data of sixteen experimenter’s version lab. The number of dead humans was highlighted red similar to table 1 (Table 2). The first infected human was detected in the second round (Figure 2). The number of infected did not change and there was still one human in the third round (Figure 2). Another one new infected human was confirmed, and the number of infected humans became two now in the fourth round (Figure 2). In the fifth round, the number of infected humans turned out to be four in the total (Table 2). The first dead human was detected in the sixth round (Table 2). As a result, four humans were infected and two different humans died in total (Table 2). At the end, six infected humans, of which two dead humans were detected in total (Table 2).
Table 2: The number of infected or dead humans and information each round in sixteen experimenter's version
Figure 2: The number of infected or dead humans and information each round in sixteen experimenter's version
Table 3 and Figure 3 were shown the data of twenty-four experimenter’s version labs. The number of dead humans was highlighted red (Table 3). Nobody was infected until the third round so the number of infected and dead humans was zero in round 1 and 2 (Figure 3). Two humans were infected in round three (Figure 3). The number of infected humans increased and turned out to be three in the fourth round but there were still no dead humans yet (Table 3). One dead human was detected, and three humans were infected in total in the fifth round (Figure 3). The number of dead humans increased and became two, then the number of infected humans was four in the 6th round (Table 3). Four infected humans and three dead humans were detected after the seventh round was done (Table 3). At the end, seven infected humans, of which three dead humans were detected in total (Table 3).
Table 3: The number of infected or dead humans and information each round in twenty-four experimenter's version
Figure 3: The number of infected or dead humans and information each round in twenty-four experimenter's version
Calculation of Morbidity and Mortality Rate
Table 4 showed the infection morbidity and mortality rates in the version of eight experimenter’s labs. In total, two humans got infected, and one human died after seven rounds ended. The morbidity and mortality were calculated and got the percentage of them. Infection morbidity was 25.0%, and the mortality was found to be 12.5% (Table 4). The mortality rate only among infected humans was 50.0 % (Table 4).
Table 4: The infection morbidity and mortality in eight experimenter’s version
- Morbidity : 2/8 *100 = 25.0%
- Mortality among all experimenters : ⅛ * 100 = 12.5% 7 4
Table 5 showed the infection morbidity and mortality rate in the version of sixteen experimenter’s lab. Six humans got infected, and two humans died after seven rounds ended. Infection morbidity was 37.5%, and the mortality among all experimenters was found to be 12.5% (Table 5). Mortality rate only among infected humans was 33.3 % (Table 5).
Table 6 showed the infection morbidity and mortality rate in the version of twenty-four experimenter’s lab. Seven humans got infected, and three humans died after seven rounds ended. Infection morbidity was 29.2%, and the mortality was found to be 12.5% (Table 6). The mortality rate only among infected humans was 42.9% (Table 6).
Table 6: The infection morbidity and mortality in twenty-four experimenter’s version
- Morbidity : = 7/24 * 100 = 29.2%
- Mortality among all experimenters : * 100 = 3/24 *100 = 12.5%
- Mortality rate only among infected human: 3/7 *100 = 42.9%
According to the data of Tables 4-6, the mortality rate among all people could be mostly constant, which was 12.5% in each version of labs. When the mortality rate only among infected humans was also calculated, the percentage values were scattered and not relevant.
Table 7 showed the average and standard deviation of the number of infected humans in the statistics of population. The values were used from each lab, which was eight, sixteen, and twenty-four experimenter’s labs. By adding the data taken the number of infected humans in three labs, which are 2, 6, and 7 people, and dividing by 3, the average value of the number of infected people through the lab was found (Table 7). The average value was 5.0 (Table 7). The standard deviation was calculated as 2.645 (Figure 4) by using the value of its average (Table 7).
Table 8 showed the average and standard deviation of the number of dead humans in the statistics of population. The values were used from each lab, which was eight, sixteen, and twenty-four experimenter’s labs. By adding the data taken the number of infected humans in three labs, which are 1, 2, and 3 people, and dividing by 3, the average value of the number of dead people through the lab was found (Table 8). The average value was 2 (Table 8). The standard deviation was calculated as 1 (Figure 5) by using the value of its average (Table 8). Infected Average 5
Table 7: Average and standard deviation of the number of infected people (The statistics of data for eight, sixteen, and twenty-four people versions)
Average : (2+6+7)/3 = 5 infected humans
Figure 4: Calculation of standard deviation of infected people
Standard Deviation 2.645751311 Died
Average 2
Standard Deviation 1
Table 8: Average and standard deviation of the number of dead people (The statistics of data for eight, sixteen, and twenty-four people versions)
Average : (1+2+3)/3 = 2 dead humans
Figure 5: Calculation of standard deviation of dead people
Table 9 showed each value of z-score, z-table, and p-value by using the data of number of people who got infected (Table 1, Table 2, and Table 3) and standard deviation and average on Table 7 for all eight, sixteen, and twenty four experimenter's labs. z-score was found out -1.13,0.38, and 0.76 respectively (Table 9). Also, the value of the z-table was given by the table and identified as 0.12924, 0.64803, and 0.77637. Finally, three p-values were found out which were 0.12924, 0.35197, and 0.22363 (Table 9). This mathematical data showed that there was no data where the p-value was above 0.05 so there was no outlier in the data among the number of infected people (Table 9).
Table 10 showed each value of z-score, z-table, and p-value by using the data of number of people who died caused by infection of echinococcosis standard deviation and average on Table 8 for all eight, sixteen, and twenty four experimenter's labs. z-score was found out -1.00,0.00, and 1.00 respectively (Table 10). Also, the value of z-
table was given as 0.15866, 0.5, and 0.84134 Table 10). Each p-value was 0.1586, 0.5, and 0.15866 (Table 10). This showed that there were also no outliers at all.
Table 10: The data of z-score, z-table, and p-value for dead humans in each version of lab
Conclusion
Echinococcosis was known for zoonotic disease which could transmit the infection to humans from intermediate animals such as herbivores and omnivores (WHO, 2021). Humans might be infected by ingesting parasite eggs in contaminated food (WHO, 2021). Echinococcosis was characterized as asymptomatic for several years and later, the cysts in the human body gradually developed bigger, sometimes spread to other organs, and ruptured then humans would have a fatal effect (CDC, 2020).
The purpose of this lab was to demonstrate the correlation of how the number of experimenters affected data. It was hypothesized that the infection rate and mortality rate were in proportional relationship with number of experimenters and foxes. It was predicted that both infection rate and mortality rate would increase if the number of experimenters increased. Three roles were provided: fox, mouse, and human. The mouse played as the definitive host who was the first animal to have the germ of Echinococcus and there was a possibility to transform the contagious virus to a fox. The fox acted as an intermediate host who transferred the infection received from the mouse to the human. It was not contagious between humans which represented the characteristic of echinococcosis
Firstly, eight experimenters joined this lab. Two mice, one fox, and five humans were given as roles. Experimenters picked one card written the role at the beginning of this lab. Experimenters chose one chopstick indicating where to sit and move to the specific seat under the seating chart. Organizers recorded when mice and a fox interacted and after that, an infected mouse met with
humans on the record paper to track the infection route (Table 1). Secondly, sixteen experimenters joined this lab under the same procedures. The number of foxes and mice increased according to the number of experimenters. Four mice, two foxes, and ten humans were given as roles (Table 2). Lastly, twenty-four experimenters joined and six mice, three foxes, and fifteen humans were prepared as roles (Table 3). Seven rounds were tested in each of these three experiments with these different numbers of people.
If the percentage of people who died from all participants was calculated, the Mortality rate among all experimenters was constant which was 12.5 % whereas the mortality rate among only infected experimenters was seen as dispersion of the data. There were no outliers in the data (Table 9 and Table 10). It identified that there is no correlation between the number of experimenters and its rate. As factors of this dispersion data were that the seats that experimenters sat in were random, so the organizers could not control that.
Hence, it did not support the hypothesis that the number of experimenters was proportional to the infection rate and mortality rate. It suggested that more rounds would have to be conducted to collect more data and to take statistics of data which could have more opportunities to have interaction between a fox and a mouse, or a fox and a human. Next time, it could demonstrate how the data varies if the seat where experimenters sit would change under some regular rule, not randomly.
References
Centers for Disease Control and Prevention [CDC]. (2019, July 15). Echinococcosis. CDC. https://www.cdc.gov/dpdx/echinococcosis/index.html#:~:text=Echinococcus%20 granulosus%20in%20 tissue.,lung%20and%20 central%20 nervous%20system
Centers for Disease Control and Prevention [CDC]. (2024, May 11). Clinical Overview of Echinococcosis. CDC. https://www.cdc.gov/echinococcosis/hcp/clinical-overview/? CDC_AAref_Val=https://www.cdc.gov/parasites/echinococcosis/health_professionals/ index.html
National Library of Medicine [NLM]. (2022, July 28). Echinococcosis. MedlinePlus. https:// medlineplus.gov/ency/article/000676.htm
Wen, H., Vuitton, L., Tuxun, T.,Li, J., Vuitton, D. A., Zhang, W., & McManus D. P. (2019). Echinococcosis: Advances in the 21st Century. Clinical Microbiology Reviews, 32(2). https:// doi.org/10.1128/cmr.00075-18
World Health Organization [WHO]. (2021, May 17). Echinococcosis. WHO. https:// www.who.int/news-room/fact-sheets/detail/ echinococcosis#:~:text=A%20number%20of%20herbivorous%20and,larval%20status%20in %20the%20 viscera
The role of immunity, medical prevention, and their combination in protecting the Keio community from a flu outbreak
Abstract
Hitomi Kunihiro Keio Academy of New York
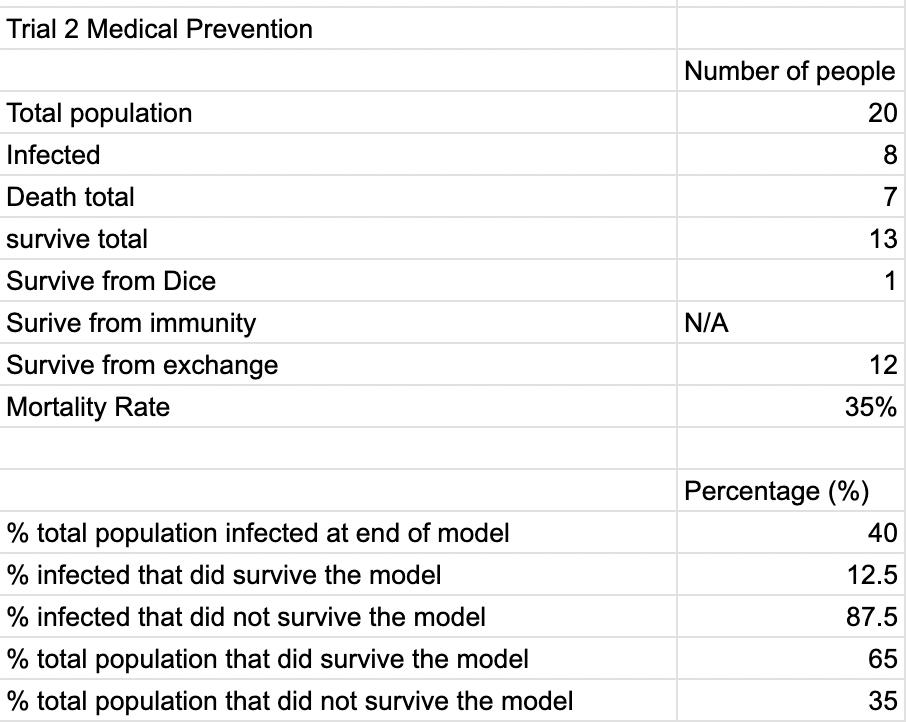
The experiment studied the effectiveness of immunity, medical prevention, and their combination in protecting the Keio Academy from a flu outbreak. It was predicted, morbidity rates of 50% with immunity, 40% with medical prevention, and 30% with both. Mortality rates with whole population and infected were expected to be 0% for all three experiments. Some participants were assigned roles of immunity, doctors, or patient zero, and asked to pair up. There were three trials per experiment consisting of four rounds each. The experiment was important because it simulated how the flu would spread in real life. It was found that average morbidity rates were 75±0.00% with immunity, 79.2±7.22% with medical prevention, and 54.2±26.02% with both. Mortality rates were 4.17±7.22% (whole population)and 5.56±9.62% (infected) with immunity alone, but 0% with medical prevention and combined. This did not support the hypothesis since the mortality rate (whole population and infected) was not zero in the immunity experiment and also because the morbidity rate of the medical prevention experiment was higher than the immunity experiment. Potential explanations included the role of immunity, without means to cure the infected in the immunity trial, and excessive rounds. This all brings out the new question of whether the change in the roles of immunity, doctors and the number of rounds have an effect on the mortality and morbidity rates.
Introduction
Influenza, more commonly known as the flu, is a highly contagious disease with its first reference dating all the way back to 412 BC (Flu.com, 2023). Influenza is caused by the flu virus as seen in Picture 1, (CDC, 2022) which is single stranded RNA (CDC, 2022). The flu virus has a circular shape with two different proteins on the outside. Hemagglutinin is one of the proteins that helps the flu virus attach to the host cell. The second protein, neuraminidase which helps the virus to find other cells to infect (FFF, 2020). There are four types of the flu virus, A, B, C, and D. Type A and B are most commonly seen in humans while type C, though also seen in humans, only causes mild infections and therefore is detected with less frequency. Type D is only seen in cattle (WHO, 2023). The influenza virus replicates itself through the process of transcription. First it transcribes the cRNA then uses that as a template to transcribe the new vRNA (Dou et al., 2018).
Influenza’s first epidemic was seen back in 1580 which primarily affected the Asian and African continent. The Spanish flu, which killed 20 to 50 million people in 1918 was also caused by the flu virus (Flu.com, 2023). According to the World Health Organization, the symptoms of flu include sudden onset fever, cough and headaches (WHO, 2023). From 2010 to 2023, 9,400,000 to 41,000,000 people were infected in the United States by the flu. Taking into account the
United States population, which is roughly 335 million (CBS News, 2023), the morbidity rate of the flu is from 2.83% to 12.35% (CDC, 2024a). The mortality rate of the flu is different depending on one’s age. It is 0% from 0 to 17 years old, 0.0001% for 18-49 years old, 0.0012% to 50-64 years old and 0.0074% for those over 64 years old ( Statista, 2023).
Preventative measures such as washing hands, covering your mouth while coughing or sneezing and getting vaccinated every year can all contribute to help prevent the spread of the flu (NCHPDP, 2023). Other than that, our body also contributes to fighting off the flu virus. Our innate immune system uses barrier defense such as the skin and chemical secretion such as mucus expelled through coughing and sneezing to fight the virus (Vicks Australia, n.d.).
Phagocytes such as macrophages, neutrophils and NK cells also play an important role. The adaptive immune system helps out using B and T cells. The production of effector cells to fight off the flu all contributes to fighting off the flu virus (Chen et al., 2018). However, when the immune system fails to fight the flu, antiviral drugs such as oseltamivir phosphate and zanamivir can give a helping hand (CDC, 2024b). There are many ways to support your immune system such as eating a balanced diet, getting enough sleep, and exercising regularly (Hinds, 2021).
The purpose of this experiment is to develop an understanding of preventative measures against disease while practicing skills in experiment development and modeling in experimentation. This experiment looks to answer the question of how the immune system and medically developed therapies such as medications will protect Keio Academy from an epidemic. It is hypothesized that the model with both immunity and medical prevention will have the lowest morbidity and mortality rate, followed by medical prevention then immunity. It is predicted that the morbidity rate with immunity to be 50%, with medical prevention to be 40% and with both, 30%. It is also predicted that the mortality rate for the whole population and the infected to be 0% throughout all three types of experiment.
Materials and Methods
Picture 1: The anatomy of a flu virus
Eight people participated in the experiment and two oversaw the operation. Three types of experiments were conducted, one measured the morbidity and mortality rate of influenza with immunity, the second with medical prevention and third with both immunity and medical prevention. Each of the experiments were conducted three times with each trial having four rounds. The general rule of the experiment was that once a participant comes in contact with an infected individual three times, they are dead. However, the participants were notified of their status once they have been infected two times.
In the immunity experiment, one participant was chosen as patient zero and two were chosen as people with immunity. In the event of patient zero being the same participant with immunity, the person with immunity was decided again to make sure they were different people. They were both decided using a random number generator (each participant had a number assigned to them). The person with immunity had the ability to infect other people once they had the virus, but they did not get infected themselves. To demonstrate that a body with immunity to a certain pathogen has the ability to recognize it, two people with immunity were given a vague clue as to who may be patient zero. Since none of the participants can be aware of who has immunity, all eight of them were given a clue, with six of them being fake. The participants were then asked to pair up with someone. They were not allowed to pair up with the same person twice in a row. The experimenters noted down the pairing. The same process was repeated three more times. The whole experiment was repeated two more times with the person with immunity and patient zero changing at the start of each trial.
In the medical experiment, patient zero and two doctors were chosen using a random number generator. When a participant pairs up with a doctor, they were considered cured of the flu. However, if the doctor was infected as well, the participant remained infected since the doctor would infect the patient while curing them. During the medical round, once a participant was notified of being in a dangerous state, which is being in contact with an infected individual two times, they were allowed to purposefully pair up with a doctor. Similar to the immunity round, the participants were asked to pair up four times per trial and the experiment was repeated two more times with the role of doctors and patient zero changing at the start of each trial.
In the last experiment with both medical prevention and immunity in play, the same rule applied. Patient zero, two with immunity and two doctors were decided with a random number generator. If patient zero also happened to be chosen for the one with immunity, the random number was used again to pick a different participant for the one with immunity. Similar to the last two experiments, the participants were asked to pair up with someone four times per trial and there were three trials in total with each role changing at the start of each trial.
At the end of each pairing, the experimenters noted down the pairs and kept track of the number of infected individuals as well as the number of times one had been infected. All of the data was then recorded on a data table in the result section (Data Tables 1-3).
Results
At the end of trial 1 of the immunity experiment, 6 were infected and one died (Table 1). At the end of trial 2 of the immunity experiment, 6 were infected and no one died (Table 1). At the end of trial 3 of the immunity experiment, 6 were infected and no one died (Table 1). At the end of trial 1 of the medical prevention experiment, 7 were infected and no one died (Table 2). At the end of trial 2 of the medical prevention experiment, 6 were infected and no one died (Table 2). At the end of trial 3 of the medical prevention experiment, 6 were infected and no one died (Table 2). At the end of trial 1 of the combined experiment, 2 were infected and no one died (Table 3). At the end of trial 2 of the combined experiment, 5 were infected and no one died (Table 3). At the end of trial 3 of the combined experiment, 6 were infected and no one died (Table 3).
Table 1. Number of infected, dead, morbidity and mortality rate in the Immunity experiment
Table 2. Number of infected, dead, morbidity and mortality rate in the medical prevention experiment
Table 3. Number of infected, dead, morbidity and mortality rate in the combined experiment
The average morbidity rate for the immunity experiment was 75.0±0.00% (Table 4). The average mortality rate of the whole population of the immunity experiment was 4.17±7.22% (Table 4). The average mortality rate for the infected of the immunity experiment was 5.56 ±9.62% (Table 4).
The average morbidity rate for the medical prevention experiment was 79.2±7.22% (Table 4). The average mortality rate of the whole population of the medical prevention experiment was 0.00±0.00% (Table 4). The average mortality rate of the infected of the medical prevention experiment was 0.00±0.00% (Table 4).
The average morbidity rate for the combined experiment was 54.2±26.02% (Table 4). The average mortality rate of the whole population of the combined experiment was 0.00±0.00% (Table 4). The average mortality rate of the infected of the combined experiment was 0.00±0.00% (Table 4).
Table 4. Average morbidity and mortality rate with standard deviation across all three experiment
Conclusion
Influenza, caused by the influenza virus (CDC, 2022), is a highly contagious infectious disease that leaves the infected with symptoms such as coughs, headache, and a sudden onset fever
(WHO, 2023). There are four types of influenza virus, type A, B, C, and D. However, only type A and B affects humans and in rare cases type C (WHO, 2023).
The experiment looked at how immunity, medical prevention, and their combination both would protect the Keio community against a flu outbreak. During the experiment, some participants were given the roles of patient zero, person with immunity and doctors. These roles were important to the experiment as it helped the experiment and simulate the real life situation. Patient zero was the person who had the influenza virus first. People with immunity were given clues as to who patient zero would be so that they could avoid them. This way the experiment was able to simulate the role of memory cells in a person’s immune system which can recognize pathogens that enter the body again. The people with immunity were also immune from getting infected with the flu themselves because their immune system would be able to fight off the virus more effectively. However, they still had the ability to infect others since the virus was still in their body. The role of doctors was created as a way to prevent the flu through medical means in the experiment. There were four rounds per trial and each trial was repeated two more times in each of the three experiments conducted.
It was hypothesized that the morbidity rate would be the lowest in the combined experiment and highest in the immunity experiment. It was predicted that the morbidity rate in immunity, medical prevention and the combined to be 50%, 40% and 30% respectively. The mortality rate for the whole population and the infected was predicted to be 0% across all three types of experiments. The hypothesis was tested by recording the number of participants who were infected and died in each round of the experiment.
The morbidity rate for all three trials of the immunity experiment was 75.0% (Table 1), making the average morbidity rate 75.0±0.00% (Table 4), not supporting the prediction of 50% morbidity rate. The average mortality rate for the whole population and infected population was 4.17±7.22% and 5.56±9.62% respectively (Table 4), not supporting the hypothesis of zero percent mortality rate.
The morbidity rate for medical prevention ranged from 75.0% to 85.0% (Table 2), with an average morbidity rate of 79.2±7.22% (Table 4), not supporting the prediction of 40% morbidity rate. In contrast to the immunity experiment the mortality rate for both the whole population and the infected population was both 0.00% (Table 2) with the average mortality rate for both populations (whole and infected) 0.00±0.00% (Table 4). The data for the medical prevention experiment supports the hypothesis on mortality rate since it is zero percent.
The morbidity rate for the combined experiment ranged from 25% to 75.0% (Table 3) with an average morbidity rate of 54.2±26.02% (Table 4), making it the lowest morbidity rate out of all three experiments, supporting the hypothesis but not reaching the predicted 30% morbidity rate. The mortality rate for both the whole population and the infected population was 0% across the three trials (Table 3) with the average mortality rate for both being 0.00±0.00% (Table 4), also supporting the hypothesis for the mortality rate.
It can be concluded that in terms of average morbidity rate, the combined experiment had the lowest result followed by the immunity than medical prevention experiment (Table 4). Though this result supported the hypothesis of the combined morbidity rate being the lowest, it did not support the hypothesis of immunity experiment morbidity rate being the highest. These results show that the combination of both medical prevention and immunity is the most effective way to protect the Keio community. It also shows that having people with doctors did not help in preventing the spread of the flu in a community as much as having someone with immunity in the community did. However, since the immunity experiment was the only experiment with a dead participant, it can be concluded that there must be someone with the ability to cure the infected for the mortality rate to be zero. This information shows that in the real world it is important to have doctors who can prevent the mortality rate of a disease by treating the patients as well as having someone with immunity (either through a vaccine or exposure) to lower the morbidity rate.
The medical prevention experiment having a higher morbidity rate than the immunity experiment as opposed to the hypothesis can be explained in the way the experiment was set up. Since the rules of the experiment were that the person with immunity could not get infected, even if they had the virus they were not counted as an infected person, bringing the morbidity rate down. Across all three experiments the morbidity rate was higher than the predicted numbers. This could be explained by the fact that eight people were made to pair up four times without being with the same person twice in a row, encouraging the virus to be spread around easily. It could also be because the experiment assumed that the flu would get passed on after one interaction where in reality it may take more than one time contact with an infected individual.
The average mortality rate for the medical prevention and the combined experiment were both zero but for the immunity experiment it was 4.17±7.22% for the whole population and 5.56±9.62% for the infected population (Table 4). The reason for the immunity experiment being the only one with a mortality rate higher than zero could be explained in the roles of doctors. Since in both the medical prevention round and the combined rounds, participants who were close to dying (infected two times) knew about their status and actively sought to be cured by the doctors, it brought down the mortality rate.
To support this conclusion, an experiment where the person with immunity’s only advantage is to have the ability to avoid patient zero and still be counted as an infected individual when infected. Another experiment in which the doctors cannot completely cure the patient could be conducted to support the conclusion that the role of doctors was the reason for the low mortality rate. To support that the number of rounds were the reason for the high morbidity rate, an experiment with fewer rounds would be needed. This all brings out the new question of whether the change in the roles of immunity, doctors and the number of rounds have an effect on the mortality and morbidity rates. References
Centers for Disease Control and Prevention [CDC]. (2022, December 2). Genetic Characterization. CDC. https://www.cdc.gov/flu/about/professionals/geneticcharacterization.htm#:~:text=All%20influenza%20viruses%20consist%20of,guanine%2C%20an d%20uracil%2C%20respectively
Centers for Disease Control and Prevention [CDC]. (2024a, February 28). Burden of Flu. CDC. https://www.cdc.gov/flu/about/burden/index.html
Centers for Disease Control and Prevention [CDC]. (2024b, March 20). What are Flu Antiviral Drugs. CDC. https://www.cdc.gov/flu/treatment/whatyoushould.htm
Chen, X., Liu, S., Goraya, M.U., Maarouf, M., Huang, S., & Chen, J. (2018). Host Immune Response to Influenza A Virus Infection. Frontiers in Immunology, 9. https://doi.org/10.3389/ fimmu.2018.00320
Dou, D., Revol, R., Östbye,H., Wang, H. & Daniels, R. (2018). Influenza A Virus Cell Entry, Replication, Virion Assembly and Movement. Frontiers in Immunology, 9. https://doi.org/ 10.3389/fimmu.2018.01581
Flu com.(2023, September). The History of Influenza. Flu.com https://www.flu.com/Articles/ 2022/The-History-ofInfluenza#:~:text=While%20the%20flu%20has%20most,reference%20of%20influenza%20(412 BC)
Hinds, M. (2021, October 17). 5 ways to boost your immune system for flu season. BSW Health. https://www.bswhealth.com/blog/5-ways-to-boost-your-immune-system-for-flu-season
National Center for Health Promotion and Disease Prevention [NCHPDP]. (2023, November 14). US Department of Veterans Affairs. https://www.prevention.va.gov/flu/prevention/index.asp
Vicks Australia. (n.d.). How Your Body Fights Off Cold and Flu. Proctor & Gamble. https:// vicks.com.au/en-au/science-of-healing/understanding-types-of-illness/how-your-body-fights-offcold-and-flu
World Health Organization [WHO]. (2023, October 3). Influenza (Seasonal). WHO. https:// www.who.int/news-room/fact-sheets/detail/influenza(seasonal)#:~:text=Seasonal%20influenza%20(the%20flu) %20is,way%20to%20prevent%20the%20disease
COVID-19 Immunology Lab Report: How Keio Academy
survived COVID-19
Haruto Izumi Keio Academy of New York
Abstract
Keio Academy conducted research on the immunology of coronaviruses, recognizing their high infectiousness and global spread. Efforts from the US, European countries, and China aimed to produce a vaccine, which was known to provide approximately six months of immunity. Interest arose in the vaccine's impact on infected individuals at Keio, particularly regarding symptom severity based on vaccination frequency. A questionnaire was distributed to Keio students to investigate this, revealing a correlation between vaccination status and symptom severity. Notably, a lower proportion of unvaccinated individuals reported mild symptoms, with the rate increasing as vaccination doses rose. Conversely, severe symptoms were more prevalent among the unvaccinated but decreased with higher vaccination doses, with those receiving six doses remaining unaffected. Specifically, 71.4% of the unvaccinated reported severity 4, and 0% of those who had received four or more doses of vaccine reported severity 4. Those who had received six doses of vaccine had never even been exposed to coronavirus. By employing a symptom severity scale of 0-5, variability was minimized, yielding more accurate data compared to the previous 0-10 scale. Despite this improvement, the survey noted a lower respondent turnout, suggesting the need for alternative survey distribution methods. Overall, the findings supported the hypothesis that vaccination reduces disease severity, providing evidence of the vaccine's effectiveness in immunizing against coronaviruses and countering speculations regarding vaccine safety.
Introduction
An infectious disease of unknown cause is spreading in Wuhan, Hubei Province, China, as of December 12, 2019 (CDC, 2023) (Picture 1). It is spreading within China and will gradually spread to the rest of the world. On January 13, 2020, the first confirmed cases of the virus outside of China were announced by the Thai Ministry of Public Health (CDC, 2023). Two days later, on January 15, 2020, a case of the virus was confirmed in Japan (CDC, 2023). The virus will spread to all continents in a few months, except Antarctica. This virus is called the new coronavirus (COVID-19) (Picture 2). COVID-19, which has been circulating worldwide since that time, is a member of the coronavirus family of the order Nidoviridae, and its pathogen is called SARS-Cov-2. Like SARS-CoV-1, SARS-CoV-2 belongs to the genus Betacoronavirus and subgenus Salvecovirus. These are the common coronavirus symptoms: fever or chills, cough, shortness of breath, feeling very tired, muscle or body aches, headache, loss of smell or taste, sore throat, congestion, runny nose, nausea, vomiting, and diarrhea (Benisek, 2023). Between two and fourteen days after coming into contact with the virus, these symptoms may appear (Benisek, 2023). Before visiting hospitals or doctors' offices, they should be called if any of these symptoms are present. This will safeguard other patients as well as medical personnel as they get ready to treat you. In Japan, 338,035,572 people were infected by May 9, 2023(⽇本放送協会,
n.d.) (Figure 1). Assuming that the population of Japan is 125.7 million, the infection rate in Japan is 26.89%. The number of deaths in Japan by May 9, 2023, will be 74694, with a mortality rate of 0.059% (⽇本放送協会, n.d.) (Figure 2). COVID-19 is highly contagious and initially causes a high mortality rate, so the elderly, other infected persons, and those with pre-existing medical conditions have to be especially careful. Due to its high infectivity, there are many cases in which healthcare workers become infected. The source of the virus is believed to be a seafood market in China, but there are many cases where people are infected without coming into contact with people there or people with respiratory symptoms. The most effective way to prevent the spread of this virus is vaccination, although wearing a mask and washing hands frequently are also effective (Chowdhury, & Oommen, 2020). No one is immune yet. Until collective immunity is formed through vaccination or infection, we will always be at risk of infection. When people are vaccinated or actually infected, herd immunity is formed and resistance to the virus begins to build up in the body (ECDC, 2023). COVID-19 is an infectious illness that presents a significant threat to global health and will likely take a long time to eradicate or develop herd immunity. In the absence of widespread access to effective vaccines, public health interventions, including social distancing, isolation, and quarantine, are necessary to stop the virus from spreading. To help stop the disease from spreading, precautions including frequent hand washing, avoiding touching the eyes, nose, or mouth, keeping a minimum of one meter between people, and adopting respiratory hygiene are advised by the WHO (Chowdhury, & Oommen, 2020). The hypothesis is that vaccination will reduce the severity of the disease. The prediction is that individuals who have been vaccinated will experience less severe disease symptoms compared to those who have not been vaccinated.
Picture 1. Location of Wuhan, China
Materials
and Methods
The anonymous COVID-19 Survey was distributed to the whole Keio Academy community by the Student Government Google Classroom for the purpose of conducting the experiment. In the survey, respondents were asked whether they were students or faculty members. They were then queried about their history of coronavirus infection and symptoms experienced prior to
Picture 2. COVID-19
Figure 1. Number of infected people in Japan
Figure 2. Number of deaths people in Japan
vaccination. Questions were posed regarding their vaccination history, spanning from the first to the sixth dose. Additionally, respondents were asked if they had experienced a coronavirus infection following each vaccination. Those who had been infected with coronavirus were asked to provide details, including the vaccine company's name, instances of coronavirus infection post-vaccination, positive results in PCR and antigen tests, and the severity of symptoms. Data collection occurred over one week, from 2/24/2024 to 3/3/2024. After the data was collected, it was pasted into a Google Spreadsheet to facilitate the creation of graphs.
Results
There were 147 respondents, of which 25 are faculty or staff and 122 are students (Figure 3). Also, of the 147 respondents, 139 said they had been vaccinated against coronavirus and 8 said they had not (Figure 4). There are 29 people with Moderna, 106 people with Pfizer, and 4 people with others for the first vaccination (Table 1). There are 27 people with Moderna, 105 people with Pfizer, and 1 person with others for a second vaccination (Table 1). There are 18 people with Moderna, 84 people with Pfizer, 1 person with Novavax, and 1 person with Astrazeneca for the third vaccination (Table 1). There are 15 people with Moderna and 37 people with Pfizer for the fourth vaccination (Table 1). There are 7 people with Moderna and 12 people with Pfizer for the fifth vaccination (Table 1). There are both 4 people with Moderna and Pfizer (Table 1). From now on, the story is going to be about the number of people who were infected. The number of people infected without a single dose of the coronavirus vaccine was 7 people: 1 person (14.3%) with severity 0, 1 person (14.3%) with severity 1, 0 people (0%) with severity 2 and 3, 5 people (71.4%) with severity 4, and 0 people (0%) with severity 5 (Tables 2&3). The number of people infected after one dose of coronavirus vaccine was 39 people: 1 person(2.6%) with severity 0, 7 people (17.9%) with severity 1, 6 people (15.4%) with severity 2, 13 people (33.3%) with severity 3, 9 people (23.1%) with severity 4, and 3 people (7.7%) with severity 5 (Tables 2&3). The number of people infected after two doses of the coronavirus vaccine was 45, with 2 people (4.4%) having severity 0, 6 people (13.3%) having severity 1, 13 people (28.9%) having severity 2, 15 people (33.3%) having severity 3, 8 people (17.8%) having severity 4, and 1 person (2.2%) having severity 5 (Tables 2&3). The number of people infected after three doses of the coronavirus vaccine was 30 people, with 3 people (10%) having severity 0, 2 people (6.7%) having severity 1, 8 people (26.7%) having severity 2, 5 people (16.7%) having severity 3, 10 people (33.3%) having severity 4, and 2 people (6.7%) having severity 5 (Tables 2&3). The number of people infected after four doses of the coronavirus vaccine was 8 people: 1 person (12.5%) with severity 0, 3 people (37.5%) with severity 1, 1 person (12.5%) with severity 2, 0 people (0%) with severity 3, 0 people (0%) with severity 4, and 3 people (37.5%) with severity 5 (Tables 2&3). The number of people infected after 5 doses of the coronavirus vaccine was 2 people , 0 people (0%) with severity 0, 0 people (0%) with severity 1, 1 person (50%) with severity 2, 1 person (50%) with severity 3, 0 people (0%) with severity 4, and 0 people (0%) with severity 5 (Tables 2&3). No one was infected after six doses of coronavirus vaccine (Tables 2&3).
Figure 3. The number of students and faculty/staff
Figure 4: The number of people who had vaccination
Table 1: The number of types of vaccine and people
Table 2: The times of vaccination and symptoms with number of people
Table 3: The times of vaccination and symptoms with percentage
Conclusion
The immunology of coronaviruses was studied at Keio. In general, coronaviruses were found to be highly infectious and spread throughout the world (Chowdhury, & Oommen, 2020). With the number of infected people increasing all over the world, efforts were being made by the United States, European countries, and China to produce a vaccine. What was known was that the vaccine lasted about six months and provided immunity (ECDC, 2023). In this context, interest was taken in the effect the vaccine was having among those infected at Keio. There were many things that wanted to be known, such as whether people who received many vaccines had milder symptoms than those who received vaccines less frequently. It was very important to know if the coronavirus vaccine was really effective. There was a lot of speculation (Picture 3) around the world that vaccines were killing people or were harmful to human health. This experiment was very important to prove that this was not the case and to actually prove that it was there to immunize people against coronaviruses. The prediction was that individuals who had been vaccinated would experience less severe disease symptoms compared to those who had not been vaccinated. The hypothesis was that vaccination would reduce the severity of the disease. This experiment was conducted in the form of a questionnaire. It was distributed to all students at Keio, and the results were compared before and after the vaccination. It was found that the experiment showed that those who were vaccinated had less symptoms than those who were not vaccinated.
It can be said that the hypothesis was correct based on the survey about corona immunity. First, 14.3% of those who responded with a symptom severity of 1 were not vaccinated against coronavirus. However, the rate increased the more people were vaccinated against coronavirus. Finally, 37.5% of those who had received four doses of vaccine responded 1. And among those who answered 4 for severity of symptoms, 71.4% had not been vaccinated. However, the more vaccines were given, the lower the rate dropped. Finally, 33.3% of those who had received three doses of the vaccine reported a symptom severity of 4. Also, those who had received six doses of the vaccine had not had a single case of coronavirus. These were the key pieces of evidence supporting our hypothesis. The results of this experiment of ours show how effective vaccines against coronaviruses can be. The vaccine has been effective in most people, reducing the severity of the disease. This is information that is needed in today's current society. As I wrote before, there is a prejudice against vaccines in today's society. This experiment is solid evidence to support these. I hope that the world will come to understand that vaccination is absolutely necessary to alleviate the symptoms of coronavirus.
The things that had to be improved in this experiment were that the Google Form was set up so that people who were not infected with coronavirus had to answer the severity question, so calculations had to be done by ourselves. If only those who were infected had been asked to answer from the beginning, a lot of time, more accurate information, and respondents' time would have been saved. Furthermore, what was actually heard was that people who said they did not have a vaccine card or other proof of vaccination history were unable to answer. It was possible that such people answered the survey at random. It is our regret that such advice was not given first. But there were some good points. The fact that the severity of the disease was set to 0-5 reduced the respondents' sense of severity and made the differences feel more uniform. And by making everything multiple-choice, unnecessary data was not obtained. This was important when conducting an experiment because the absence of errors meant that there was a large amount of information that could be used in the experiment. What was even more curious about this experiment was whether the vaccine company could make a difference in symptoms. The ingredients of the vaccine also differed from company to company, so it was thought that there would be differences among individuals. Since the effectiveness of the vaccine was confirmed through this experiment, it was wanted to find out the differences by company based on this next step.
References
Benisek, A. (2023, November 10). Symptoms of Coronavirus. WebMD. https:// www.webmd.com/covid/covid-19-symptoms
Centers for Disease Control and Prevention [CDC]. (2023, March 15). COVID-19 Timeline. https://www.cdc.gov/museum/timeline/covid19.html
Chowdhury, S.D., & Oommen, A.M. (2020). Epidemiology of COVID-19. Journal of Digestive Endoscopy, 11(1), 3-7. https://www.ncbi.nlm.nih.gov/pmc/articles/PMC7364648/
European Centre for Disease Prevention and Control [ECDC]. (2023, May 31). The pathogen SARS-COV-2. European Union. https://www.ecdc.europa.eu/en/infectious-disease-topics/zdisease-list/covid-19/facts/pathogen-sars-cov-2
⽇本放送協会. (n.d.). 新型コロナウイルス
タ|NHK特設サイト. NHK NEWS WEB. https://www3.nhk.or.jp/news/special/coronavirus/dataall/
Abstract
Immunology Project Lab
Yoshiaki Shimizu Keio Academy of New York
This paper provides an overview of Ebola disease, its transmission, symptoms, and current preventive measures. Despite relatively low global case numbers, the virus remains a draconian threat with an average mortality rate of around 50%. The experiment focuses on understanding preventive measures against Ebola and examining the correlation between immune response, medical interventions, and mortality rates. Experimental trials were conducted to simulate the spread and impact of Ebola under conditions of immunity and medical prevention. The results showed a 70% morbidity rate (percent total infected) for trial 1 and 40% for both trials 2 and 3. The percent infected population that survived and did not survive the model was 42.9% and 57.1% for trial 1, 12.5% and 87.5% for trial 2, 37.5% and 62.5% for trial 3. The percent total population that did survive and did not survive the model was 60% and 40% for trial 1, 65% and 35% for trial 2, 75% and 25% for trial 3. The results revealed that combining immunity and medical interventions led to the lowest mortality rates compared to scenarios with only one of the two factors. The findings support the hypothesis that the simultaneous presence of immunity and medical prevention offers the most effective protection against Ebola. Overall, this study emphasizes the importance of combining immune responses with medical interventions to reduce the impact of deadly diseases. Future research could further compare the effectiveness of immunity and medical prevention alone in larger-scale trials.
Introduction
Ebola, a dreadful microbial pathogen is known as the cause of the Ebola disease, which is mainly derived from four types, the Ebola virus, the Sudan virus, the Tai Forest virus, and the Bundibugyo virus. The Ebola virus is thought to have derived from the continent of Central Africa, during the 1970s when two outbreaks of fever occurred at separate locations, and researchers have discovered that the source of infection was most likely the African fruit bats (CDC, 2023). Symptoms of the disease include severe fever, muscle pain, headaches, and sore throats, and the disease can only be transmitted once individuals show signs of symptoms (WHO, 2023). The morbidity rate of Ebola still remains vague; however, studies have shown that the virus spreads through the exchange of blood, and body fluids, including feces, vomit, saliva, sweat, and semen. On the other hand, it is proven that the disease is not spread through the atmosphere (WHO, 2023). The possibility of transmission through both sexual and physical contact (fluids entering the body) has made healthcare workers extremely vulnerable and exposed to the disease which is ultimately contributing to the rapid spread. Another issue that is involved is the rigorousness in the diagnosis, as it is extremely difficult to differentiate between Ebola and other infectious diseases including Malaria and Meningitis (WHO, 2023). The Ebola Virus invades the body after entering through abrasions and injuries in the skin, enters the cells, and reproduces undergoing the mechanism of a lytic cycle. It begins by using glycoprotein to bind to the host cell's receptors and through macropinocytosis, the host cell consumes large
amounts of nutrients and fluids, taking the virus in with them. The virus then hijacks the host’s cell mechanism to transcribe and replicate itself while destroying the host cell’s DNA, ultimately reproducing exponentially. (Enrera, 2023). Although Ebola diseases have a relatively low number of cases on a global scale, the mortality rate remains extremely diverse, averaging around 50 percent (PAHO, n.d.).
Currently, there is no cure for the disease, however, an immune response against the Ebola virus does exist, but the high mortality rate results from the insufficiency of the immune response. Significant innate immunity response against the Ebola virus includes the production of interferons, which are essential proteins for fighting viral infections. The interferons help trigger the activation of Natural Killer Cells, which is recognized as a leading immune function in contributing to the recovery of infected individuals (Marcinkiewicz et al., 2014). Adaptive immunity is also thought to exist against the Ebola Virus, as a significant portion of the lymphocytes were activated, which are leukocytes that help fight pathogens and assist in memory of the immune system (McElroy et al., 2023).
Immunity is not the only way in which Ebola can be prevented. Basic medical prevention such as hand sanitizing, washing hands with soap on a daily basis, and avoiding physical contact with infected people are effective methods to prevent infection (VDH, 2022). In case the immune system does not work, there are also antibody treatments for the Ebola virus. In 2019, the Food and Drug Association (FDA) approved the first-ever vaccine for the Ebola virus which is proven to be effective against one of the strains of Zaire ebolavirus. This vaccine is recommended as a pre-exposure vaccine aimed to support adults, especially healthcare workers, who are at risk of exposure to the virus (VDH, 2022). Later on, the FDA approved two other drugs Inzameb and Emanga, for effectiveness against the Zaire ebolavirus (IDSA, 2024).
With that being said, the main purpose of this experiment is to build knowledge of potential preventative measures against pathogens, while developing various skills in experiment planning and exploring the field of modeling in experimentation. Students would be diving into the field of immunology of microbial pathology and experimenting to determine how immunity and medical prevention could protect the community of Keio Academy of New York from a particular pathogen. The experiment will specifically examine the relationship between immune response/medical interventions and the mortality rate of Ebola. It is hypothesized that having both immunity and performing medical interventions is the most effective way against Ebola. Specifically, it is predicted that having both an immune response and medical interventions will have the lowest mortality rate compared to only having an immune response and only medical interventions.
Materials and Procedures
In the first trial, a test tube with 30mL of water, and a dropper were prepared and given to each of the 20 participants with two test tubes that initially had sodium chloride in them as a representation of the Ebola virus. Students randomly paired themselves with someone else in the class to exchange their water from the test tube. The dropper was used to draw out water from the test tube and dropped into the partner’s test tube when exchanging. The process was repeated two more times, each time with a new partner. After a total of three rounds, a drop of silver nitrate was added to each student’s test tube to see who was infected with Ebola. A cloudy substance floating on the water was observed for students infected with Ebola as a precipitation reaction will occur when silver nitrate is added to a sodium chloride solution. Among the infected participants, students were divided into groups with immunity and without immunity by a ratio of 1:2 using a wheel. The infected participant’s name was included in the wheel and individuals who were chosen by the wheel were able to survive the round. The number of wheels spun was determined by the number of infected individuals by a ratio of 1:2, 1 being the number of times the wheel is spun. Students who were not chosen were required to roll a die to determine whether they would die or not. Participants who rolled a 1 survived the round, and participants who did not failed to survive the round. The number of infected individuals, individuals who survived from the dice, and individuals who survived from immunity were recorded (Table 1). The fluids were disposed of, and the test tubes were rinsed.
In the second trial, similar to the first trial, a test tube with 30mL of water, and a dropper were prepared and given to each of the 20 participants. Students randomly paired themselves with someone else in the class to exchange their fluid, but the process was repeated only two times this time as an individual performing medical preventions, will likely be cautious of their exchanging (body fluid) behaviors. After a total of two rounds, a drop of silver nitrate was added to each student’s test tube to see who was infected with Ebola. Students who were infected were
required to roll a die to determine whether they would die or not. Participants who rolled a 1 survived the round, and participants who did not failed to survive the round. The number of infected individuals and individuals who survived the dice was recorded (Table 2). The fluids were disposed of, and the test tubes were rinsed.
In the third trial, the first trial and the second trial were combined. A test tube with 30 mL of water and a dropper was prepared and given to each of the 20 participants. Students randomly paired themselves with someone else in the class to exchange their fluid, and the process was repeated two times. After a total of two rounds, a drop of silver nitrate was added to each student’s test tube to see who was infected with Ebola. Among the infected participants, students were distributed into individuals with immunity and without immunity by a ratio of 1:2 using a wheel. Students chosen by the wheel survived the round. Students who were not chosen were required to roll a die to determine whether they would die or not. Participants who rolled a 1 survived the round, and participants who did not failed to survive the round. The number of infected individuals, individuals who survived from the dice, and individuals who survived from immunity were recorded (Table 3). The fluids were disposed of, and the test tubes were rinsed.
Results
After completing the first and third trials, the data collected from each trial was sorted into a table showing the total population, total infected individuals, total deaths, total survived, and the number of people who survived from dice, immunity, and exchange shown in Table 1 and Table 3. For the second trial, the data table was similar to the first and third trials, but without the individuals that survived from immunity shown in Table 2. Using the table, the percent total population infected at the end of the model was calculated by dividing the number of infected by the total population (20), which came out to be 70% for trial 1 (Table 1), 40% for trial 2 (Table 2) and trial 3 (Table 3). In addition, the percent infected that did survive the model was evaluated by adding the number of people who survived from dice and immunity divided by the total infected for trials 1 and 3 which came out to be, 42.9% for trial 1 (Table 1), 37.5% for trial 3 (Table 3). For trial 2, it was determined by dividing the number of people who survived from dice and divided by the total infected, which came out to be 12.5% for trial 2 (Table 2). The percent infected that did not survive the model was identified by dividing the total death by the total infected which was determined to be 57.1 % for trial 1 (Table 1), 87.5% for trial 2 (Table 2), and 62.5% for trial 3 (Table 3). The percent total population that survived and did not survive the model was each determined by dividing the total survived/deaths by the total population which came out to be 60% for trial 1 (Table 1), 65% for trial 2 (Table 2), and 75% for trial 3 (Table 3) for survived. For the total population that did not survive the model, it was determined to be 40% for trial 1 (Table 1), 35% for trial 2 (Table 2), and 25% for trial 3 (Table 3). Using the total population that did not survive the model, a graph was created comparing the trial number and the mortality rate (Figure 1).
Table 1: Data Table of Trial 1 with Immunity
Table 2. Data Table of Trial 2 with Medical Prevention
Table 3: Data Table of Trial 3 with Both Immunity and Medical Prevention
Figure 1: Trial Number vs Mortality Rate
Conclusion
Ebola, a deadly microbial pathogen, is responsible for the Ebola disease, which comprises four main types: the Ebola virus, the Sudan virus, the Tai Forest virus, and the Bundibugyo virus. Emerging from Central Africa in the 1970s, likely from African fruit bats, Ebola manifests with
symptoms such as severe fever, muscle pain, and headaches, primarily transmitted through bodily fluids including blood, saliva, and semen. The Ebola virus invades the body through skin abrasions, replicating through a lytic cycle, resulting in a mortality rate averaging around 50%. Despite relatively low global case numbers, the virus remains a serious threat, encouraging research and preventive measures. While there is currently no cure for Ebola, the presence of immune responses offers some hope, although the mortality rate remains high due to their insufficiency. Innate immunity, including interferon production and activation of Natural Killer Cells, aids in recovery, alongside adaptive immunity involving activated lymphocytes. Beyond immunity, preventive measures such as hand sanitizing and avoiding contact with infected individuals are crucial. Additionally, antibody treatments are available, alongside the FDAapproved Ebola vaccine, targeting Zaire Ebolavirus strains, especially beneficial for at-risk populations like healthcare workers. Recent FDA approvals for drugs like Inzameb and Emanga further strengthen efforts against Ebola.
The experiment aimed to enhance the understanding of preventive measures against pathogens and develop skills in experiment planning and modeling. Focused on immunology and microbial pathology, students explored how immunity and medical prevention can safeguard against a specific pathogen, Ebola. The study investigated the correlation between immune response, medical interventions, and Ebola mortality rates. The hypothesis suggested that combining immunity and medical interventions offered the most effective protection against Ebola, predicting that the presence of both factors would result in the lowest mortality rates compared to scenarios with only immunity or medical interventions.
In a series of trials, students conducted experiments to simulate the spread and impact of Ebola under the conditions of immunity, and medical prevention. In the first trial, participants exchanged water samples using droppers, with a cloudy substance indicating infection, followed by a survival phase of wheel spinning as a representation of immunity, along with dice rolls to determine survival. The second trial mirrored the first but with only two exchange rounds and without the immunity aspect (wheel). The third trial combined aspects of both previous trials. Each trial involved recording the number of infected individuals, survival outcomes from immunity, and dice rolls. These experiments aimed to provide insights into the efficiency of different preventive measures and the relationship between Ebola transmission and survival in a controlled setting.
After conducting the first, second, and third trials, data from each trial were organized into tables detailing the total population, infected individuals, deaths, and survival outcomes from dice, immunity, and exchange. Percentages were calculated to represent the infection rate, survival rate, and mortality rate for each trial. Trial 1 showed a 70% infection rate, with 42.9% of infected individuals surviving and 57.1% not surviving (Table 1). Trial 2 exhibited a 40% infection rate, with 12.5% surviving and 87.5% not surviving (Table 2). Trial 3 displayed a 40% infection rate, with 37.5% surviving and 62.5% not surviving (Table 3). In addition, the data revealed that in Trial 1, 60% of the total population survived the model, while 40% did not survive (Table 1). In Trial 2, 65% of the total population survived, with 35% not surviving (Table 2). Finally, in Trial
3, 75% of the total population survived, leaving 25% who did not survive (Table 3). A graphical representation of the total population that did not survive in each trial (mortality rate) was created (Figure 1).
From the results, it can be interpreted that utilizing medical prevention will drastically decrease the infection rate, which went down from 70% to 40%, exhibiting the effectiveness of medical prevention. In addition, the total mortality rate declined as the trial progressed which can be seen from the negative slope, showing the highest mortality rate for immunity (40%), and the lowest mortality rate with both immunity and medical prevention (25%) displayed in Figure 1. The initial hypothesis, predicting the presence of both immunity and medical prevention will result in the lowest mortality rate was supported by this data, showing that the most effective method against Ebola is to both own immunity and perform medical prevention simultaneously. Another discovery made from the experiment is that medical prevention is a more effective combat method against Ebola compared to immunity as the data shows a higher mortality rate of immunity (40%) compared to medical prevention (35%). Considering that the trial was performed only once, a comparison between the effectiveness of immunity and medical prevention is something that can be looked into in the future. Reflecting on the experiment, more trials could have been done for a more accurate statistical analysis, and of course the experiment that was conducted could have been modified in various ways such as implementing other ways to spread the disease, other than using test tubes, which is also something interesting to look into in future experiments.
References
Centers for Disease Control and Prevention [CDC]. (2023, April 23). Ebola Disease Basics. CDC. https://www.cdc.gov/vhf/ebola/about.html
Enrera, R. (2023, November 21). Ebola Life Cycle. Study. https://study.com/learn/lesson/ebolalife-cycle-replication.html
Infectious Disease Society of America [IDSA]. (2024). Ebola Facts. IDSociety. https://www.idsociety.org/public-health/ebola/ebola-resources/ebola-facts/
McElroy, A. K., Akondy, R. S., Davis, C. W., Ellebedy, A. H., Mehta, A. K., Kraft, C. S., Lyon, G. M., Ribner, B. S., Varkey, J., Sidney, J., Sette, A., Campbell, S., Stroher, U., Damon, I., Nichol, S. T., Spriopoulou, C. F., Ahmed, R. (2015). Human Ebola virus infection results in substantial immune activation. PNAS, 112 (15), 4719-4724. https://doi.org/10.1073/ pnas.1502619112
Pan American Health Organization [PAHO]. (n.d.). Ebola Virus Disease. PAHO. https:// www.paho.org/en/topics/ebola-virus-disease
Virginia Department of Health [VDH]. (2022, October). Ebola (Ebola virus disease). Virginia. https://www.vdh.virginia.gov/epidemiology/epidemiology-fact-sheets/ebola-ebola-virus-disease
World Health Organization [WHO]. (2023, April 20). Ebola virus disease. WHO. https://who.int/news-room/fact-sheets/detail/ebola-virus-disease
Abstract
Immunology Lab Report
Echinococcus with Weredog Game
Mirai Nakai Keio Academy of New York
Scientists have not found the immune system for Echinococcus. But there is only one medication called Albendazole. There is a vaccine for sheep called EG95, but not for humans. Cystic echinococcosis is a type of Echinococcus, and people can get it. In most cases, dogs or wolves are the definitive hosts. Then, livestock gets Echinococcus, and humans get infected. The infection route was to eat food polluted by animals' fences, including eggs. If the number of ways doctors treat experimenters increased, then the mortality rate and morbidity rate would decrease, and the rate of a doctor saving experimenters would increase. There were five roles, dog, sheep, doctor, hunter, and human, in this experiment. The experimenters picked chopsticks and paired up each round. If the dog and sheep met together, the Echinococcus started to spread. The hypothesis was not proved in this experiment. There were three different types of experiments, and the number of ways a doctor cures experimenters increased. The mortality was 4.17%, 25%, and 29.2%. Morbidity rates were 0%, 12.5%, and 25% for all experimenters, 0%, 25%, and 83.3% for infected people. The mortality and morbidity increased even though the number of ways the doctor cured people increased. However, the rate of doctors curing infected people also increased to 16.7% and 27.8% with increasing the ways a doctor cured people. So, the hunter would work more late rounds in the following experiment to collect more precise data.
Introduction
When COVID-19 appeared, people were isolated from each other, and schools and stores were closed. The whole world was in chaos. Everyone wants to go to the supermarket without fake stories and wants to live as usual before COVID-19 appeared. But there were the savors from COVID-19 within a year since COVID-19 appeared. That was a vaccine. Vaccines are also called immunization, and these help the immune system. The immune system protects the body from pathogens such as bacteria, fungi, and parasites. The immune system has an innate immune system and an adaptive immune system. The medication helps the immune system as well. Echinococcus is also cured with a medication called Albendazole, which uses benzimidazoles. This is the most effective treatment for Echinococcus. If people get infected, they must take them twice daily for 1 to 6 months. With this treatment, one-third of patients are completely cured. In other patients, their cysts get smaller and smaller in the organs but do not fully recover (CDC, 2024). Echinococcus appeared over two thousand years ago in Europe, and people and animals who lived in the ancient period got Echinococcus granulosus at that time. In the middle of the 19th century, Echinococcus was admitted as a disease worldwide (Eckert & Thompson, 2017). Echinococcus is one of the pathogens, and they are categorized as parasites. There are two types of Echinococcus, which are cystic echinococcosis, led by Echinococcus granulosus, and alveolar echinococcosis, which is led by Echinococcus multilocularis. The first one is E. granulosus. If people get E. granulosus, the hydatid cysts will appear inside the organs, such as lungs and
livers. There would be an asymptomatic period, but most of the patients started to receive medical treatment within a few years. When people get cysts, people begin to feel vomiting and abdominal pain. E. granulosus appears in the carnivore host’s small intestine. In most cases, Echinococcus stays inside of dogs. Then, the dog’s feces include the eggs of Echinococcus and livestock such as sheep infected. These animals are called intermediate hosts and get Echinococcus eggs from food that grows with animal feces, which is already infected, or water, which is polluted by feces. However, E. granulosus prefers parasite sheep more than humans because humans do not relate to the life cycle. However, it is possible that humans get infected by intermediate hosts (Díaz, 2017). This way of spreading Echinococcus will be used in this time experiment. On the other hand, the asymptomatic period will be 5 to 15 years, and primary tumor-like lesions will appear in livers if people get Alveolor Echinococcosis. People will die if people who get Alveolor Echinococcosis do not get any medical treatment. The way of infection of E. multilocularis is similar to E. granulosus, but a host of Echinococcus is different. First, mice have Echinococcus, and then foxes eat infected mice. Then, the fox becomes infected and becomes the intermediate host of Echinococcus. Then, humans get infected with fox’s feces. In endemic areas, which are part of Africa and Eurasia continent, the rate of people getting infected with Echinococcosis is more than 50 per 100,000 people. In Argentina, East Africa, and Central Asia, the morbidity has reached 5% to 10 %. If people do not get any treatment of medical and leave it, they are going to die about 90%. The percentage of people who died after getting surgery with cystic echinococcosis was about 2.2%. And about 6.5 % of patients who get surgery relapse. Nineteen thousand three hundred die from Echinococcus annually (WHO, 2021).
Scientists are still searching for innate immunity and adaptive immunity for Echinococcus. So, which innate immune works for Echinococcus needs to be clarified. Because of this, many scientists are trying to develop vaccines, but many are failing. Only E. granulosus recombinant antigen, a.k.a. EG95, works for Echinococcus in livestock but not for humans (Bakhtiar et al., 2020). People could be prevented from infecting Echinococcus. People could prevent cystic echinococcosis by avoiding the invasion of Echinococcus larvae into their bodies. Usually, these Echinococcosis stay in the sheep. And sometimes, stray dogs bite or eat sheep that already have echinococcosis. Therefore, people should not touch stray dogs, and if people touch them, they have to wash their hands. People should not take food or water that is possibly polluted by dogs' excrement, so they must wash the food that they buy in the supermarket before eating. Also, EG95 is used to prevent the spread of Echinococcus around Argentina and China. On the other hand, preventing alveolar echinococcosis is more complex than preventing cystic echinococcosis. If most wild rodents are dewormed, the risk of infection to people would decrease. People must avoid touching foxes, coyotes, and dogs to prevent getting infected with Echinococcus. Also, after touching them, people must wash and clean their hands. In Europe and Japan, with the deworming of wild and stray animals, which are the hosts of Echinococcosis, the percentage of Echinococcosis prevalence decreased. So, people can avoid both types of Echinococcus (WHO, 2021). Humans have no immune system right now, so most Echinococcus patients get medication such as Albendazole. Otherwise, people get surgery if the cysts have already become bigger and medication cannot deal with them. This disease is not untreatable, but it is also not sure patients are cured 100 % (CDC, 2024).
In the experiment, there are five roles and eight experimenters. The mortality rate, morbidity rate, and the rate of a doctor saving infected people will be searched to determine whether these have any relationship or not with the number of ways that a doctor can help other experimenters. Then, the way a doctor cures the other experimenters relates to the mortality rate, morbidity rate, and the rate of a doctor's savings. The mortality rate and morbidity rate will be decreased by increasing the number of ways that the doctor is able to use to save other experimenters. And the rate of a doctor saving infected people will be increased.
Materials & Methods
The experiment was conducted by eight experimenters. The experimenters were given role cards by organizers, and there were five roles. There was one dog, two sheep, one doctor, one hunter, and three humans in each trial. The role would not change until the trial was over. Next, each experimenter picked one chopstick, which was written alphabet, and sat as what the alphabet said, as shown in the setting chart in Figure 2. Then, four pairs were made. The organizers wrote down who got which partner and who got infected. Then, repeat that the experimenters picked chopsticks and had partners until round 2 was over. From round 3, the doctor and Hunter started their work, so after the experimenters sat on the table and headed down, the organizers called Hunter and then the doctor. After that, the organizers took note and repeated that until the trial was over. After the trial was over, the organizers calculated the mortality, morbidity, and percentage of the number of people who were saved by the doctor.
Type of Experiment (Each experiment has three trials. And each trial has ten rounds)
- Experiment 1
There was no doctor in this type of experiment.
- Experiment 2
There was a doctor. A doctor could give only medication to experimenters.
- Experiment 3
There was a doctor. A doctor could give medication or vaccines to experimenters. A doctor should choose one of them at each round from the third round.
Each Role (Figure 1)
- Dog (One experimenter)
The dog was the definitive host of Echinococcus granulous and spread Echinococcus to the sheep. The experimenter who charged the role of dog already has the level of infection 5.
- Sheep (Two experimenters)
The seep was the intermediate host of E. granulous. If the experimenter who had the role of sheep was paired up with the experimenter who had the dog card, the sheep got infected with Echinococcus and started to spread Echinococcus to humans from the next round. When the sheep met with the dog, the sheep had infection level 5, but they did not die.
- Human (Three experimenters)
Humans would be infected when they met with sheep. If humans met with sheep, they started to have Echinococcus and increased their infection level by one in each round.
- Hunter (One experimenter)
The hunter killed the dog and sheep even though they were not infected. The hunter’s work was breaking a chain of infection. The hunter started their work from round 3 in every trial. The hunter is also human, so the hunter would die if the hunter got infected by Echinococcus
- Doctor (One experimenter)
The doctor works to cure the experimenters. They also started working from round 3 in trials with experiments type 2 and type 3. The hunter is human, so the human would be infected if the doctor met sheep.
How humans die
There were two ways that humans had died.
1. When humans reached infection level 5, people would have died.
2. If humans had met with sheep twice, people would have died. The humans who were infected with Echinococcus started to get weaker, so the people could not endure if the humans got infected twice.
From Round 3
- Hunter
The hunter chose the one experimenter without information about who played which roles in each round from round 3. If the hunter chose sheep or dog, they could not participate in the next round. If the hunter chose humans, nothing would happen.
- Doctor
The doctor chose one experimenter without information on who played which roles in each round from round 3. In experiment 2, the doctor only gave medication. However, in experimenter 3, the doctor also chose one of the medications or vaccines. The doctor would be given information about the number of infected animals, but the doctor could not know which animals were infected.
The way to cure experimenters by a doctor
- Medication
The medication worked only for humans. If people get infected with Echinococcus and get medication from the doctor, the infection level decreases by 1.5. But if humans did not get infected, nothing would happen. Nothing would happen if the doctor chose medication for the dog and sheep.
- Vaccine
The vaccine worked only for sheep. So, if the doctor picked a dog, sheep that did not infect, or people, nothing would happen. If the doctor gave the vaccine to the infected sheep, the sheep decreased infected level by 1. If the sheep reached infection level 3, they could not spread Echinococcus anymore.
Result
Trial 1
Trial 1-1
Table 1: The number of infections and deaths with each time of trial 1
Table 2: The mortality and morbidity with each time of trial 1
No one got infected at this time, so the morbidity rate was 0% from 0 people divided by eight people, which is the total number of experimenters. The mortality rate from the total number of experiments and the mortality rate from only infected people was also 0% because no one got infected, and no one died.
Trial 1-3
There was one infected person at round 7, so the morbidity rate was 12.5, with one divided by eight. There were no people dead, so the mortality rate was 0%.
Trial 2
Table 3: The number of infections, deaths, doctor saving with each time of trial 2
Table 4: The mortality and morbidity and the rate of a doctor saving infected people with each time of trial 2
Trial 2-1
There were no infected people, so morbidity and mortality from all experimenters and mortality from only infected people would be 0%. Also, the doctor always chose people who were not infected. Thus, he did not save anyone, so the rate of the doctor saving was 0%.
Trial 2-2
Two people got infected from sheep, so the morbidity rate was 25%, with two divided by eight. However, no one died in this trial, so the mortality rate was 0%. Also, the doctor chose a human who was not infected and a dog to give medication. So, nothing happened to the doctor, and the rate of doctor saving was 0%.
Trial 2-3
Four people got infected in this trial, so the morbidity rate was 50% from four divided by eight. And three people died at this trial. The mortality rate from all experimenters was 37.5%, with three divided by eight. The mortality rate from only infected people was 75%, with three divided by four. At this time, the doctor chose infected humans twice, so the rate of a doctor saving infected people was 50%, with two divided by four.
Trial 3
(infecte d)
(died)
Table 5: The number of infections, deaths, doctor saving with each time of trial 3
Table 6: The mortality, morbidity, and the rate of a doctor saving infected people with each time of trial 3
Trial 3-1
Two people got infected, and one person died in this trial. The morbidity rate was 25% from two divided by eight. The mortality rate with all experimenters was 12.5 % from one divided by eight. And the mortality rate with only infected people was 50%, from one divided by two. The rate of a doctor saving infected people was 0% because the doctor did not save anyone, and the doctor died at round 5.
Trial 3-2
There were three infected people, and all three were dead in this trial. So, the morbidity rate was three divided by eight and 37.5%. The mortality rate with a total number of experimenters was three divided by eight, which was 37.5%. The mortality rate with only infected people was 100% because all of them died. The rate of a doctor saving infected people was one divided by three and 33.3%. One infected person gets medicine from the doctor, but that person reaches level 5 of infection in the after-round.
Trial 3-3
There were two infected people, and both of them died. So, the morbidity rate was 25.0%, with two divided by eight. The mortality rate of all experimenters was 25.0%, with two divided by eight. The mortality rate with only infected people was 100% because both of them died. The rate of a doctor saving infected people was 50%, with one divided by two.
Average Trial 1 (Total) Trial 2 (Total) Trial 3 (All)
Table 7: The average mortality rate, morbidity rate, and rate of a doctor saving infected people in each trial
Conclusion
People have two types of immune systems which are innate and adaptive. However, there is no immunology of Echinococcus for humans yet. That means scientists have not yet found any immune system. Humans need medication if they get infected with Echinococcus, which is called Albendazole, which is used benzimidazole. The patients need to take Albendazole twice a day for 1 to 6 months (CDC, 2024). There are two types of diseases led by Echinococcus that is cystic echinococcosis, which is led by Echinococcus granulosus, and alveolar echinococcosis, led by Echinococcus multilocularis. At the beginning of spreading E. granulosus, dogs or wolves have eggs of Echinococcus in their body, livestock get them from dogs or wolves, and humans
have them. For E. multilocularis, mice have eggs of Echinococcus in their body, foxes get them from mice, and then humans get them from eating foods or water that is polluted by foxes’ fences. Echinococcus changed its parasite hosts. The way to infect Echinococcus is by eating food or water, which is polluted by the feces of animals that have Echinococcus (Díaz, 2017). There are vaccines to cure Echinococcus, but these are used for only sheep and goats. It could not be used for humans. The vaccine was named E. granulosus recombinant antigen, also called EG95 (Bakhtiar et al., 2020). There is no vaccine for E. multilocularis, so the way of spreading E. granulosus was used for this experiment. So, there were three types of situations. Each type had three trials, and each trial had ten rounds. One of them was there was no doctor. The second type was the doctor, who was able to give medicine to humans. The third type was that the doctor needed to choose to give medicine or give the vaccine. There were five roles which were the dog, the sheep, the doctor, the hunter, and the humans. The organizers gave the role of cards to experimenters. If the dog and sheep were paired up, the sheep would start to spread Echinococcus to humans. The hunter and the doctor chose one of the experimenters from round 3. In the third type of experiment, the doctor chose medicines or vaccines. The experimenter picked the chopsticks, which were written in the alphabet each round, and the organizers checked who got infected in each round.
If a doctor had more ways to prevent the spread of Echinococcus through different types of trials, then the mortality and morbidity would decrease, and the rate of a doctor saving infected people would increase. However, this expectation did not appear in this lab. The mortality rate of Trial 1 is 4.17%, 25.0% for Trial 2, and 29.2% for Trial 3. The morbidity rate of all experimenters was 0% for Trial 1, 12.5% for Trial 2, and 25% for Trial 3. The morbidity rate with only infected people was 0% for Trial 1, 25.0% for Trial 2, and 83.3% for Trial 3 (Table 7). As data shows, the mortality and morbidity rates increased a lot with increasing the way the doctor cures other experimenters. The rate of a doctor saving infected people was 16.7% for Trial 2 and 27.8% for Trial 3 (Table 7). The rate of a doctor saving infected people increased with the increasing the way the doctor cures other experimenters. Table 7 shows no relationship between the number of ways to help people, mortality, and morbidity (Table 7). This time, the hunter often killed the dog and sheep early round before they got infected and spread to humans. So, the hunter would work more late rounds at the next experiment and make clear the relationship between immunity and Echinococcus. The rate of a doctor saving infected people seemed to have some relationship with the increasing ways to prevent the spread of Echinococcus by the doctor. So, it remains the doctor’s role for the next lab.
References
Bakhtiar, N. M., Spotin, A., Mahami-Oskouei, M., Ahmadpour, E., & Rostami, A. (2020). Recent advances on innate immune pathways related to host–parasite cross-talk in cystic and alveolar echinococcosis. Parasites & Vectors, 13. https://doi.org/10.1186/s13071-020-04103-4
Centers for Disease Control and Prevention [CDC]. (2024, May 11). Clinical Overview of Echinococcosis. CDC. https://www.cdc.gov/echinococcosis/hcp/clinical-overview/? CDC_AAref_Val=https://www.cdc.gov/parasites/echinococcosis/health_professionals/index.html
Díaz, Á. (2017). Immunology of cystic echinococcosis (hydatid disease). British Medical Bulletin, 124(1), 121-133. https://academic.oup.com/bmb/article/124/1/121/4371597
Eckert, J., & Thompson, R. C. A. (2017). Chapter One - Historical Aspects of Echinococcosis. Advance in Parasitology, 95, 1-64. https://doi.org/10.1016/bs.apar.2016.07.003
World Health Organization [WHO]. (2021, May 17). Echinococcosis. WHO. https:// www.who.int/news-room/fact-sheets/detail/echinococcosis
Abstract
Gastric Cancer Inheritance Experiment
Koichiro Komoto Keio Academy of New York
Gastric cancer poses a significant global health threat, ranking among the deadliest cancers worldwide due to its high mortality rate. This experiment demonstrated the inheritance of gastric cancer across three new generations, aiming to discover whether a population within three generations could be 100% wild type or mutant type.
The experiment explored gastric cancer inheritance over three generations by utilizing Punnett squares to predict offspring genotypes. Different mating patterns and parental genotypes were manipulated to assess their impact on inheritance outcomes. The experiment depicted that a 100% mutant type within three generations was achievable in line with autosomal dominant inheritance patterns. However, attempts to achieve a 100% wild type were unsuccessful. Additionally, altering the genotype of the P generation or modifying mating patterns did not yield the desired outcome. These results underscore the challenges in completing a 100% wild-type population was impossible. In this pattern, if one parent carries the mutated gene, there's a 50% chance that each offspring will inherit the mutated gene and consequently express the disorder increasing the percentage of offspring getting mutant types.
Throughout the experiment, it led to curiosity about the limitations of the Punnett square model in predicting inheritance outcomes across multiple generations. While the study focuses on the inheritance probabilities within the three generations using autosomal dominant patterns, further research involving demonstrating additional generations could provide deeper insights into the inheritance of gastric cancer.
Introduction
Gastric cancer, also known as Stomach Cancer, poses a significant threat to our daily lives because of its deadly high mortality rate. It ranks fourth as the most common cancer among 200 types of cancer and the second leading cause of cancer death in the world (Topi et al., 2020). Stomach cancer has been frightening for our human lives since the history of Stomach cancer is old, yet the treatments were hidden until recent discoveries. This discovery made this cancer a curable cancer. Additionally, Stomach cancer is considered one of the rare cancers that can be inherited throughout the family members by genetics. This experiment is focused on the inheritance of stomach cancer throughout the three new generations and whether the new population can be 100% wild type or 100% mutant type.
Gastric cancer was originally written about in early 3000 BC in hieroglyphic inscriptions and papyri manuscripts from ancient Egypt (Chan & Wong, 2024). The initial significant statistical examination of cancer morbidity and mortality rate, based on data collected in Verona, Italy spanning from 1760 to 1839, revealed that stomach cancer was one of the most lethal diseases. Since then, it has persisted as a prominent malignancy, exhibiting notable variations in
prevalence across different geographical areas and regions. However, from the first gastric surgery done in 1879, the steps for making this deadly disease curable moved forward. Thus, in modern times, it is regarded as a more curable disease than it used to be in old times.
Gastric cancer initially starts to grow in the stomach. There are five layers of tissues and muscle in a stomach wall. The first layer which is located in the innermost is called mucosa. Mucosa is made of two cells called epithelial cells and glandular cells. The glandular cells produce mucus to protect the stomach lining and secrete digestive juices to aid in breaking down food. Most stomach cancers originate in the glandular cells. These cancers, which begin in glandular cells, are known as adenocarcinomas. The submucosa is the tissue that connects between the mucosa and the muscle layer. This tissue contains blood vessels, lymph vessels, and nerve cells. The third layer is called the muscle layer. This layer helps the stomach to mix food that was contained in the stomach with digestive juices and move it into the small intestine, where nutrients are consumed. The fourth layer is called the subserosa. It is a thin layer that connects tissue between the muscle layer and the serosa. The fifth layer is called serosa which is located in the outermost of the stomach wall. Between the first layer of mucosa and the fifth layer of serosa, gastric cancer grows and advances as the tumor spreads from the mucosa to the other layers.
There are five stages of gastric cancer. Stage 0, also called carcinoma in situ, is commonly found in the mucosa, the innermost layer. The advancement of gastric cancer starts from this stage throughout the mutant cells called CDH1 and TP53 become cancer and spread into the normal tissues nearby. Next, stage 1 is divided into two stages which are 1A and 1B. In stage 1A, cancer has already formed in the mucosa and spread to the submucosa. In stage 1B, gastric cancer has formed in the mucosa and may have spread to the submucosa and has spread to 1 or 2 nearby lymph nodes or gastric cancer has formed in the mucosa and has spread to the muscle layer. In stage 3, it is also divided into three parts which are 3A, 3B, and 3C. In stage 3A, the cancer has spread to the muscle layer and 7 to 15 nearby lymph nodes, or to the subserosa and 3 to 6 nearby lymph nodes, or to the serosa and 1 to 6 nearby lymph nodes, or to nearby organs such as the spleen, colon, liver, diaphragm, pancreas, abdominal wall, adrenal gland, kidney, small intestine, or the back of the abdomen. In stage 3B, the cancer may have spread to the submucosa or muscle layer and 16 or more nearby lymph nodes, or the subserosa or serosa and 7 to 15 nearby lymph nodes, or nearby organs with spread to 1 to 6 nearby lymph nodes. In stage 3C, the cancer has spread to the subserosa or serosa and 16 or more nearby lymph nodes, or to nearby organs with spread to 7 or more nearby lymph nodes. Finally, the last stage of gastric cancer is stage 4 also called metastatic cancer. In this stage, gastric cancer has spread to other parts of the body, such as the lungs, liver, distant lymph nodes, or the tissue that lines the abdomen wall. Additionally, cancer has already moved through the lymphatic system or blood and formed tumors in other parts of the body (Stages of Stomach Cancer, 2023).
Gastric cancer resulted in 1 million cases and 769,000 deaths in 2020. In 2023, the estimated number of new cases is estimated at 26,500, with 11,130 deaths in the United States (PDQ Cancer Genetics Editorial Board, 2023). The mortality rate of Gastric cancer varies with the stage of cancer. The overall mortality rate is 64% within 5 years. More specifically, 25% for
localized stomach cancer, when the cancer is only located in the stomach. Regional stomach cancer is 65%, which is when the cancer has spread beyond the stomach to nearby organs or lymph nodes. Metastatic stomach cancer is 93% (NIH, 2023a). Additionally, the chance of developing gastric cancer depends on gender. The lifetime risk of gastric cancer is higher in men, which is 1 in 101, than in women, which is about 1 in 155. However, each person’s chance of getting gastric cancer can be varied by many other factors, such as environmental factors (American Cancer Society, 2024).
Gastric Cancer manifests initially with symptoms such as poor appetite, weight loss, vague discomfort in the abdomen, swelling or fluids build up in the abdomen, black stool or vomiting blood, and feeling full even after eating a small meal or snack (American Cancer Society, 2021). However, these symptoms can be seen in other types of cancer or usual illnesses. It is recommended to go to see a provider to check if there is a person who has been infected with gastric cancer in the person’s family. In the US, screening for specific gastric cancer is rare. However, if the person has a condition that appears to be risky, five ways of diagnosing gastric cancer are conducted. These are an upper endoscopy, an endoscopic ultrasound, radiologic tests, blood tests, and a laparoscopy. Within these diagnoses, most gastric cancers are diagnosed by an upper endoscopy. It is commonly used because it is minimally invasive, and generally welltolerated by patients. It is conducted by inserting a thin tube with a small endoscope which allows visual examination of internal organs or cavities into the stomach and small surgical instruments can pass through the endoscope to remove a tissue sample. Later it is tested in a lab for cancer cells (Cleveland Clinic, 2022.).
The phenotype in gastric cancer differs in wild-type and mutant-type in its genes. While wild genes are generally stable without significant chromosomal alterations or mutations, mutant-type genes increase the frequency of chromosomal alterations and microsatellite instability (MSI), or alterations in DNA mismatch repair genes (CGARN, 2014).
In this experiment, it is hypothesized that having a population of 100% wild type while having no mutant type throughout the three new generations is impossible. Additionally, having a population of 100% mutant type while having no wild type throughout the three new generations is impossible. Because the person who gets disorders the autosomal dominant, the probability of being affected by the condition is 50%. In autosomal dominant inheritance, if one parent carries the mutated gene, there's a 50% chance that each offspring will inherit the mutated gene and consequently express the disorder increasing the percentage of offspring getting mutant types.
Genetics
Gastric cancer is determined to have the mode of inheritance of autosomal dominant (ASCO, 2020). Autosomal dominant inheritance refers to the transmission of a genetic trait or condition from parent to child. In this pattern, the presence of just one mutated gene copy from either parent can result in the expression of the genetic condition. As shown in Figure 1, offspring with a parent carrying the mutated gene have a 50% likelihood of inheriting it. The carriers of the mutant type have the genotype of dominant AA and Aa. On the other hand, wild types which are
not carriers have the genotype of aa. In the autosomal dominant, having only one capital A can present the phenotype of gastric cancer. These mutations occur with equal frequency in both genders, and there is an equal chance for sons and daughters to inherit them (NIH, n.d.a).
1. Sample pattern of Autosomal Dominant
Gastric cancer is originally caused by the genes called CDH1 and TP53. The CDH1 gene, named after the cadherin-1, is located on chromosome 16,16q22.1 (Photo 1). It contains the instructions for producing a protein known as epithelial cadherin, also referred to as E-cadherin, situated within the membrane enveloping epithelial cells. Those that coat bodily surfaces and cavities like the inner linings of eyelids and the mouth. E-cadherin plays a crucial role. It is part of the cadherin family of proteins, whose primary function is to facilitate cell adhesion, ensuring neighboring cells adhere to each other, thus forming structured tissues. TP53 is also the gene that causes gastric cancer. It was named after the molecular mass of its genes. Similar to the CDH1, the TP53 genes which are located on chromosome 17,17p13.1 (Photo 2) encode the instructions for producing a protein named tumor protein TP53. This protein functions as a tumor suppressor, playing a crucial role in regulating cell division by keeping cells from growing and dividing (proliferating) too fast or in an uncontrolled way (NLM, 2020).
Figure
The mutations that cause a change to HDGC from CDH1 are called germline mutations. HDGC is the mutated cell of CDH1. The mutation is present in all cells of the body and can be passed down from one generation to the next. Individuals with an inherited mutation in one copy of the CDH1 gene have a significantly increased risk of developing diffuse gastric cancer and certain
Photo 1. CDH1 gene localization
Photo 2. TP53 gene localization
other types of cancer. Unlike CDH1, the mutation of the TP53 occurs due to exposure to a carcinogen. It has been described extensively in the case of exposure to dietary aflatoxin B1(Rivlin et al., 2011).
The HDGC mutant genes dramatically increase the person’s lifetime risk of developing diffuse gastric cancer (ASCO, 2020). The TP53 gene mutations change single amino acids in TP53, which impair the protein's function. Without functioning TP53, cell proliferation is not regulated effectively, and DNA damage can accumulate in cells. Such cells may continue to divide in an uncontrolled way, leading to tumor growth (NLM, 2020).
Management
Gastric cancer can develop in a patient due to the effect of environmental factors. Although the environmental factors affect Gastric cancer from the aspects of water, soil, air, radiation, and geology, the factor that affects contagiously is infection by the bacteria called Helicobacter pylori in the stomach appears to be a major cause of gastric cancer (Yin et al., 2020) (Photo 3). As this bacteria stays in the patient's body, it leads to inflammation and precancer development (NIH, n.d.b).
Various types of medical care can manage the symptoms of Gastric cancer unless the cancer is advanced such as cancer has moved to other parts of the body. The symptoms such as stomach pain can be called the most well-known symptoms of Gastric cancer. In general, when patients feel stomach pain, the painkiller will manage the pain. Although painkillers are from daily medical care, the effect of relieving the pain is crucial to the patients physically as well as mentally.
Photo 3. Helicobacter pylori Bacteria
When treating symptoms from Gastric cancer, patients have four different types of medical care. The first treatment is Upper endoscopy (NIH, 2023b). In the early stages of Gastric cancer, when the cancer is limited to the patient's stomach’s superficial layers, the cancer can be removed through an upper endoscopy. In this process, tumors of the patient’s stomach are cut and removed through the patient's mouth. The second treatment is Gastrectomy. This is conducted when the patient’s cancer has advanced and the tumor spreads beyond the stomach’s superficial layers. Patients may undergo a procedure in which all or part of their stomach is removed and replaced with a stomach from a donor. The doctor will connect the esophagus to the small intestine, allowing patients to eat. The third treatment is Chemotherapy, which ucses drugs to shrink the cancer cells, making them easier to remove before surgery. The drugs are targeted at weaknesses in patient’s cancer cells, causing them to die. At last, radiation is used for treating Gastric cancer. It utilizes targeted energy beams like X-rays to destroy cancer cells. Radiation treatments are used with chemotherapy. The combination of these two treatments increases the percentage of destroying the cancer cells. Although there are many ways to treat Gastric cancer, it cannot be cured by medical care when Gastric cancer has already spread to the other parts of the body in the patients (Cleveland Clinic, 2022).
The organizations supporting people from Gastric cancer are the American Cancer Society (Cancer Survivors Network, 2024) and the Gastric Cancer Foundation (Gastric Cancer Foundation, 2024). Both of the two organizations allow patients to have an immense amount of information. Such as they provide discussion boards that are open to everyone which allows people who have Gastric cancer and people who are interested in researching Gastric cancer to share the information.
Inheritance
By utilizing autosomal dominant inheritance patterns, the first experiment was demonstrated to have a 100% mutant type within three generations. As shown in Figure 2, it was initially started with the P generation of mutant type (AA) and wild type (aa). Since the Punnett square calculates a 100% probability of producing Aa offspring, the percentage of inherited gastric cancer in children between these two in the F1 generation will be 100%. In the F2 generation, the percentage of children having dominant alleles is 75%. In the F3 generation, the percentage of children with dominant alleles is also 75%. This proves a 100% probability of getting gastric cancer by inheritance within three generations.
Figure 2. Pedigree chart of attempt 1 for 100% mutant type
The second attempt was aimed to have a 100% wild-type within three generations. As shown in Figure 3, it was initially started with the P generation of mutant type and wild type which is Aa and aa. The percentage of inherited gastric cancer in the F1 generation was 50% since the Punnett square depicts the inheritance probability to be 50% Aa and 50% aa. Next, the F1 generation found a spouse and produced offspring. The spouses were found from the possibility of the punnet square. The percentage of children who had dominant alleles in the F2 generation was 50%. Out of the eight total offspring in the F2 generation, only four children had a dominant allele (Aa). In the F3 generation, the percentage of the inheritance was 50%. Since the F2 generation had birthed a total of eight children, four children had a dominant allele of Aa. From these results, this attempt established that within three generations, the 100% wild type cannot be achieved.
Since the experiment of aiming for a 100% wild-type pedigree could not be achieved in the first attempt, another two alternative pedigrees were created. This attempt was demonstrated by changing the genotype of the P generation to expect a result close to the 100% wild type. As shown in Figure 4, the P generation was set to AA and aa. Between these two, they had birth, and children were born with the dominant Aa genotype. Since there are only dominant alleles shown in this generation, the recessive alleles of wild type are 0% in this generation. Later, the person in the F1 generation is found with a spouse who has Aa. They had four children: AA, Aa, Aa, and aa. In this generation, 60% of alleles are dominant and the recessive alleles of wild type are 40%. The F3 generation was born after each F2 generation found a spouse. The percentage of the dominant inheritance was recorded as 87.5% and recessive was 12.5%. Calculated by the total number of children was sixteen and only two children inherited gastric cancer. Therefore, this attempt could not complete the F3 generation with a 100% wild type.
The final attempt was demonstrated by changing the patterns of inheritance while leaving the same genotype of AA and aa in the P generation (Figure 5). The percentage of dominant alleles shown in the F1 generation was 100%. Later, the person in the F1 generation who has Aa found a spouse. They gave birth to four children: AA, Aa, Aa, and aa. The percentage of dominant alleles shown in the F2 generation is 75%. Thus, the wild type is 25% as the total number of children was four, and three had dominant alleles. Next, the person in the F2 generation found a spouse. The percentage of dominant alleles in the F3 generation was 62.5% as the wild types were 37.5% and the total number of children was sixteen and out of this number, ten children were considered to have a dominant allele. Thus, this attempt failed to make a 100% wild type within the three generations.
Figure 3. Pedigree chart of attempt 1 for 100% wild type
Figure 4. Pedigree chart of attempt 2 for 100% wild type
Conclusion
Throughout this experiment, the probability of getting gastric cancer within the three generations was studied. Gastric cancer, also known as stomach cancer, is a significant global health concern with a high mortality rate. Despite recent medical care and studies for treatment, it remains one of the deadliest types of cancer worldwide. This experiment was demonstrated to investigate the probability of the inheritance of gastric cancer throughout the three new generations and whether the new population could be 100% wild or 100% mutant. The initial hypothesis was that as the inheritance mode is autosomal dominant, it is possible to make 100% mutant type but not 100% wild type. Because the person who gets disorders the autosomal dominant, the probability of being affected by the condition is 50%. In autosomal dominant inheritance, if one parent carries the mutated gene, there's a 50% chance that each offspring will inherit the mutated gene and consequently express the disorder increasing the percentage of offspring getting mutant types.
The experiment was demonstrated by making a pedigree chart utilizing the Punnett square for each pair. The offspring's spouse has to be the same as the possibility of the Punnett square. In testing multiple possibilities of the pedigree chart, the change was done by altering one side of the genotype of P generation whether it is between AA or Aa. In addition, the spouse was altered between the possible genotypes from the punnet square.
In the first experiment, a pedigree chart was used to investigate the possibility of achieving a 100% mutant type in the first generation, which was indeed confirmed. However, in the second experiment, attempts to achieve a 100% wild type within three generations were unsuccessful, with only a 25% wild type observed. Additional pedigree charts were created in subsequent experiments. Changing the genotype of the P generation's father to AA in the third experiment resulted in a 12.5% wild type, contrary to the hypothesis. Similarly, altering the patterns of the spouse in the fourth experiment did not yield a 100% wild type, with a recorded percentage of 37.5%.
Figure 5. Pedigree chart of attempt 3 for 100% wild type
Looking at the result, proves that although making 100% mutant type is possible, making 100% wild type is impossible in three new generations because of the reproductive strategies. As the spouse must be from the possibilities from the punnet square, the chance of mating with a person who has a genotype of the recessive allele was hard to match. If the spouse could be controlled strictly so that the person can mate with recessive alleles could change the result drastically. However, changing the genotype of the P generation between AA and Aa does affect the percentage of mutant and wild type in the third generation. As creating the punnet square for each generation, each letter does affect the offspring of those generations. For example, when pedigree charts were aimed to create 100% wild type, a second experiment that used Aa as the P generation had a 50% high chance of getting wild types on the third generation. However, when compared to the third experiment that uses AA as the P generation which had 12.5% the percentage of the wild types decreased drastically.
Throughout the experiment, it led to curiosity about how results will alter if the pedigree chart continues after three generations. Within the three generations, the possibilities are limited to a certain number of generations. Thus, it is important to have more generations to gain knowledge of how gastric cancer is inherited in the autosomal dominant among relatives in more generations.
Ultimately, this experiment clarified how challenging it is to completely cut gastric cancer out of the bloodstream because of the inheritance pattern. If any of the relatives or people in the world suffer from gastric cancer in the future, applying the knowledge from this experiment could reduce the fear of stomach cancer in the world.
Reference
American Cancer Society. (2021, January 22) Signs and Symptoms of Stomach Cancer. American Cancer Society. https://www.cancer.org/cancer/types/stomach-cancer/detectiondiagnosis-staging/signs-symptoms.html
American Cancer Society. (2024, January 19). Key Statistics About Stomach Cancer. American Cancer Society. https://www.cancer.org/cancer/types/stomach-cancer/about/key-statistics.html
American Society of Clinical Oncology [ASCO]. (2020, January). Hereditary Diffuse Gastric Cancer. Cancer.Net. https://www.cancer.net/cancer-types/hereditary-diffuse-gastric-cancer
Cancer Survivors Network. (2024). Stomach Cancer. American Cancer Society. https:// csn.cancer.org/categories/stomach?
Chan, A.O.O., & Wong, B. (2024, April 10). Epidemiology of gastric cancer. UpToDate. https:// www.uptodate.com/contents/epidemiology-of-gastric-cancer/print
Gastric Cancer Foundation. (2024). https://gastriccancer.org/
National Institute of Health [NIH]. (2023a, May 31). Stomach cancer survival rates and prognosis. National Cancer Institute. https://www.cancer.gov/types/stomach/ survival#:~:text=Survival%20rates%20for%20stomach%20cancer&text=For%20example%2C% 20the%205%2Dyear,alive%205%20years%20after%20diagnosis
National Institute of Health [NIH]. (2023b, May 31). Stomach Cancer Treatment. National Cancer.Institute. https://www.cancer.gov/types/stomach/treatment
National Institute of Health [NIH]. (n.d.a). autosomal dominant inheritance. National Cancer Institute. https://www.cancer.gov/publications/dictionaries/genetics-dictionary/def/autosomaldominant-inheritance
National Institute of Health [NIH]. (n.d.b). Gastric Adenocarcinoma Study. National Cancer Institute. https://www.cancer.gov/ccg/research/genome-sequencing/tcga/studied-cancers/gastricadenocarcinoma-study#:~:text=Environmental%20risk%20factors%20for%20stomach, %2C%20salted%2C%20or%20pickled%20foods.&text=Another%20risk%20factor%20is%20ba cterial%20or%20viral%20infection
National Library of Medicine [NLM]. (2020, February 1). TP53 gene. MedlinePlus. https:// medlineplus.gov/genetics/gene/tp53/
PDQ Cancer Genetics Editorial Board. (2023, October 27). Genetics of Gastric Cancer (PDQ®)Health Professional Version. National Cancer Institute. https://www.cancer.gov/types/stomach/ hp/gastric-genetics-pdq
Rivlin, N., Brosh, R., Oren, M., & Rotter, V. (2011). Mutations in the p53 Tumor Suppressor Gene: Important Milestones at the Various Steps of Tumorigenesis. Genes & Cancer, 2(4), 466–474. https://doi.org/10.1177/1947601911408889
The Cancer Genome Atlas Research Network [CGARN]. (2014). Comprehensive molecular characterization of gastric adenocarcinoma. Nature, 513, 202–209. https://doi.org/10.1038/ nature13480
Topi, S., Santacroce, L., Bottalico, L., Ballini, A., Inchingolo, A. D., Dipalma, G., Charitos, I. A., & Inchingolo, F. (2020). Gastric Cancer in History: A Perspective Interdisciplinary Study. Cancers, 12(2), 264. https://doi.org/10.3390/cancers12020264
Yin, J., Wu, X., Li, S., Li, C., & Guo, Z. (2020). Impact of environmental factors on gastric cancer: A review of the scientific evidence, human prevention and adaptation. Journal of Environmental Sciences, 89, 65–79. https://doi.org/10.1016/j.jes.2019.09.025
The Untold Truth About Laughing Your @$$ Off: Humor In Language
Binh (Ben) Luu Keio Academy of New York
Introduction
Humor in language is often overlooked, but having language competency does not necessarily correlate to humor competency in a language. Similarly, comprehending the semantics but not the pragmatics of what is being conveyed is not enough for language competency. Humor has the ability to bring people together with joy and positive emotions thus strengthening a sense of inclusion and community like mutual languages. In this research paper I will discuss the basis of humor in communication, what makes something funny, and the idea of humor competency being different from language competency to shed light on the importance of humor in language.
How Communication Works
Paul Grice’s conversational implicature is a widely known pragmatic theory that theorizes how people communicate their thoughts and exchange their ideas in language. Cooperative Principles, also known as the Conversational Maxims, were proposed in order for effective and mutual understanding to be present in conversations between people (Amirsheibani, Ghazanfari, & Pishghadam, 2020). If the four maxims of quantity, quality, relevance, and manner are not addressed, comprehension can become very difficult without context. The maxim of quantity is to provide enough information; the maxim of quality is to be truthful and honest; the maxim of relevance is to be relevant and relate to the topic being presented; the maxim of manner is to be clear and avoid ambiguity (Amirsheibani, Ghazanfari, & Pishghadam, 2020). One common reason the maxims may be not be deliberately observed in the English language, is for the intention of creating humor.
Incongruity Theory
Kant brought prominence to Incongruity Theory, introduced by Aristotle, as the basis of laughter and humor in 1790. Schopenhauer’s version of the incongruity theory further expands on this by stating that humor derives from “…the incompatibility between one's sensory knowledge and ones abstract knowledge of things. While according to Kant, humor essence is located in the evaporation of an expectation” (Abbas & Ibrahim, 2016). Schopenhauer and Kant’s claims are consistent with the idea of what is expected and what is actually witnessed not being in line with each other. This collision of two incompatible concepts, having a considerable difference from our expectations and reality, can be thought of as a mental spark, which triggers us laughter (Abbas & Ibrahim, 2016). Recognition of this mismatch is humor. This connects to the idea of Grice’s conversational maxims not being observed or breached, which causes incongruity between what is presented and what follows in utterances and texts.
To articulate this concept, the question “Where was the Declaration of Independence signed?” will be used as an example. A famous joke answer to this question is “At the bottom.” This shows an incongruence between the question and answer: the answer being given is the literal physical location on the paper; the question being asked expects a geographic location as intended.
Humor Varying In Language and Culture
The idea of humor causing laughter may seem like a universal concept but what may be considered funny in one language may not necessarily translate in another. Prichard and Rucynski (2021) state “The timing, frequency, and purpose of humor greatly vary from culture to culture […] English language learners with a high level of humor competency have the ability to decode the message and to identify the true purpose of the humor (e.g., just making a joke, criticizing a person or situation)”. Being able to appreciate and recognize the intentions of the intended humor applies to everyone with high levels of humor competency in their respective languages and not limited solely to English language learners.
Those with high English proficiency levels often have high humor competency in English hence popular American comedy television shows are often met with laughter in typical Englishspeaking households in the United States. With this expectation and objective of filling the class with enthusiastic laughter, Rucynski played his favorite episode of The Simpsons for his English language class at a university in Japan he teaches. Ironically, Rucynski was left with silence in the classroom even during his favorite and highly anticipated jokes in the episode (Prichard & Rucynski, 2021).
Prichard and Rucynski (2021) witnessed their driver shout “No fighting over the seats!” in a straight voice during one of their long-distance bus rides that was visibly close to empty when they visited the United States. This sarcastic remark had a humorous intention by implying the extreme opposite from the obvious truth. Prichard and Rucynski (2021) visualized their Japanese university students understanding all the words but were still puzzled and not have a humorous reaction as sarcasm is rare in Japan.
An experiment was conducted at an English Institute in Tabas, Iran which comprised three hundred intermediate English language learners of native Persian speakers being tested on their ability to identify English humor based on non-observance of the Grice’s four maxims. The mean scores of correct answers were as follows: quality at 41%; manner at 52%; relevance at 57%; quantity at 75% (Amirsheibani, Ghazanfari, & Pishghadam, 2020). Although maxim of quantity scored the highest, we see a significant decrease in the other maxims. The inconsistency we see from the maxim of quantity to the remaining three maxims strongly indicates that the students’ overall humor competency may be lacking despite being intermediate English learners and proof of miscorrelation between linguistic competency and humor competency.
Discussion & Application
An example in which humor differs in language and culture I have personally experienced deals with the question “What does one plus one equal?” In English one would answer “window”
while in Japanese one would answer “rice field,” both as a joke answers. Coincidentally both languages have a joke answer to the same question even when translated to their respective languages, share the characteristic of incongruity, and flouts the maxim of relevance. However, the main difference lies in the interpretation of what the image resembles. In Japanese, the image resembles the character for rice field represented by “⽥” while the image resembles a window to those in English-speaking environments. One can only imagine Americans being confused and not laugh at the answer “rice field” while the same can be said for the Japanese at the answer “window.”
Conclusion
Despite understanding some components of humor in its language form whether it is the variance of jokes from one language to another, non-observance of Grice’s maxims, and the incongruity theory, it is important to realize that communication and language are not solely restricted to utterances, and texts as behavior and tone also play critical roles. This may present an additional hindrance in an individual’s comprehension or development of humor competence in a language especially with text. For example, sarcasm is difficult to convey through written words. Simultaneously, teaching humor for instructors may also be a challenge as most lessons rely heavily on textbook learning and content whereas humor competence in a target language requires a strong understanding of the culture and pragmatics. Nevertheless, once some degree of humor competency is achieved, this will allow individuals to appreciate humor in the target language. Laughing and understanding jokes with others, especially native speakers, leads to the potential of building stronger bonds and a sense of inclusion in the target language and culture that will only get easier over time.
References
Amirsheibani, M., Ghazanfari, M., & Pishghadam, R. (2020). Non-Observance of Grice’s Conversational Maxims in Discourse of Humor and its Role in EFL Learners’ Text Comprehension: A Mixed-Methods Study. MEXTESOL Journal, 44
Ibrahim, S., & Abbas, N. (2016). Pun and (Un)Intentional Humor. Journal of American Academic Research
Prichard, C., & Rucynski, J., Jr. (2021). Implementing Humor Instruction into English Language Teaching.
Acknowledgments
Thank you very much for your generous support during the past three years. These are the donors from July 1, 2022 to June 30, 2023 (in alphabetical order)