March, 2022 MTD
MARKET UPDATE March, 2022
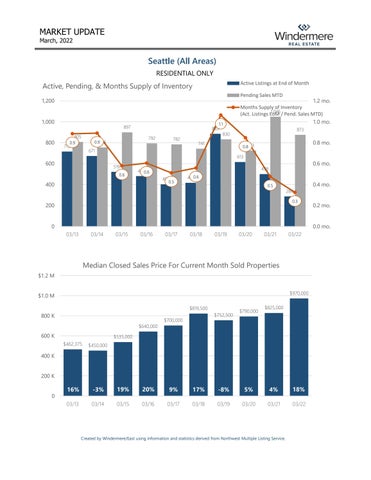
Seattle (All Areas) RESIDENTIAL ONLY
Active, Pending, & Months Supply of Inventory
Active Listings at End of Month Pending Sales MTD
1,200
1,000
800
1.1
897 805 0.9
713
883 792
0.9753
782
1.2 mo. Months Supply of Inventory 1,046 (Act. Listings EoM / Pend. Sales MTD) 1.0 mo. 873
830
741
0.8 mo.
0.8723
671
613
600
519 0.6
400
0.5
400
0.6 mo.
498
4790.6
4140.6 0.5
0.4 mo. 284 0.3
200
0
0.2 mo.
0.0 mo. 03/13
03/14
03/15
03/16
03/17
03/18
03/19
03/20
03/21
03/22
Median Closed Sales Price forCurrent CurrentMonth Month Closings Median Closed Sales Price For Sold Properties
20 $1.2 M
$970,000
$1.0 M $819,500
800 K $640,000
600 K
$752,500
$700,000
$790,000
$825,000
$535,000
$462,375
$450,000
16%
-3%
400 K 200 K
19%
20%
9%
Year Rank (Multiple Items) 0 Current Year Month Yes Year Month 03/13 03/14 Parell 03/15 03/16 Match? 03/17
17%
-8%
5%
4%
18%
03/18
03/19
03/20
03/21
03/22
Created by Windermere/East using information and statistics derived from Northwest Multiple Listing Service.