May, 2022 MTD
MARKET UPDATE May, 2022
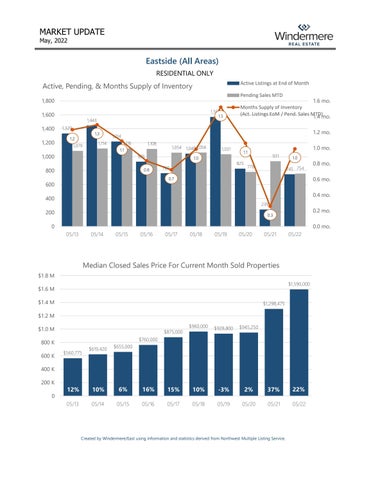
Eastside (All Areas) RESIDENTIAL ONLY
Active, Pending, & Months Supply of Inventory
Active Listings at End of Month Pending Sales MTD
1,800 1,567
1,600
1,400 1,200
1.5
1,443 1,329
1.3
1.2
1,079
1,114
1.6 mo. Months Supply of Inventory (Act. Listings EoM / Pend. Sales MTD) 1.4 mo. 1.2 mo.
1,214 1,116
1,108
1,054 1,040 1,056
1.1
1,000
925
800
0.8
1,031
1.0
825
760
1.0 mo.
1.1
931
778
1.0
745 754
0.6 mo.
0.7
600
0.4 mo.
400
239
200
0.2 mo.
0.3
0
0.0 mo. 05/13
05/14
05/15
05/16
05/17
05/18
05/19
05/20
05/21
05/22
Median Closed Sales Price forCurrent CurrentMonth Month Closings Median Closed Sales Price For Sold Properties
16 $1.8 M
$1,590,000
$1.6 M $1.4 M
$1,298,475
$1.2 M $1.0 M
$875,000
$960,000
$928,800
$945,250
10%
-3%
2%
37%
22%
05/18
05/19
05/20
05/21
05/22
$760,000
800 K 600 K
$560,775
$619,420
$655,000
10%
6%
400 K 200 K
0.8 mo.
12%
16%
15%
Year Rank (Multiple Items) 0 Current Year Month Yes Year Month 05/13 05/14 Parell 05/15 05/16 Match? 05/17
Created by Windermere/East using information and statistics derived from Northwest Multiple Listing Service.