February, 2022 MTD
MARKET UPDATE February, 2022
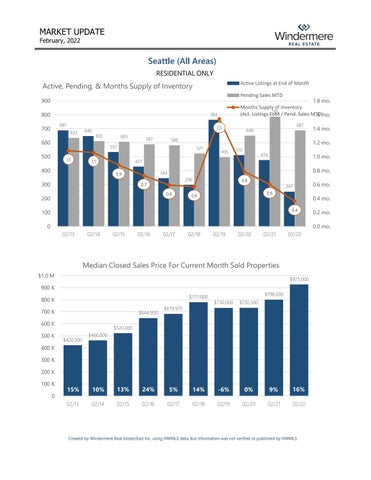
Seattle (All Areas) RESIDENTIAL ONLY
Active, Pending, & Months Supply of Inventory
Active Listings at End of Month Pending Sales MTD
900 800
1.8 mo. Months Supply of Inventory 785 (Act. Listings EoM / Pend. Sales MTD) 1.6 mo.
763 687
700
633
1.5
646
610
600
605
587
580
532
500
1.1
521
495
474
1.0 mo.
300
0.8 mo.
344
0.9
296
0.7
0.8
247 0.6
200
1.4 mo. 1.2 mo.
510
427
1.1
400
687
649
0.6
0.6
0.4 mo. 0.4
100
0.6 mo.
0
0.2 mo. 0.0 mo.
02/13
02/14
02/15
02/16
02/17
02/18
02/19
02/20
02/21
02/22
Median Closed Sales Price forCurrent CurrentMonth Month Closings Median Closed Sales Price For Sold Properties
24 $1.0 M
$925,000
900 K $777,000
800 K
700 K
$644,950
600 K 500 K
$798,000 $730,000
$730,500
14%
-6%
0%
9%
16%
02/18
02/19
02/20
02/21
02/22
$679,975
$520,000 $420,000
$460,000
400 K 300 K 200 K 100 K
15%
10%
13%
24%
5%
Year Rank (Multiple Items) 0 Current Year Month Yes Year Month 02/13 02/14 Parell 02/15 02/16 Match? 02/17
Created by Windermere Real Estate/East Inc. using NWMLS data, but information was not verified or published by NWMLS.