April, 2022 MTD
MARKET UPDATE April, 2022
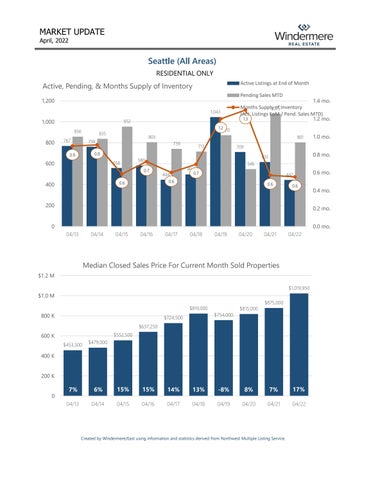
Seattle (All Areas) RESIDENTIAL ONLY
Active, Pending, & Months Supply of Inventory
Active Listings at End of Month Pending Sales MTD
1,200
1.4 mo. Months Supply of Inventory 1,075 (Act. Listings EoM / Pend. Sales MTD) 1.3 1.2 mo.
1,043
1,000
952 1.2
856
800
767
870
835
803
759
801 739
713
709
0.9
0.9
556
600
444
546
494
0.7
442
0.6
0.6
400
0.8 mo.
613
580 0.7
1.0 mo.
0.6
0.6
200
0.6 mo. 0.4 mo. 0.2 mo.
0
0.0 mo. 04/13
04/14
04/15
04/16
04/17
04/18
04/19
04/20
04/21
04/22
Median Closed Sales Price forCurrent CurrentMonth Month Closings Median Closed Sales Price For Sold Properties
15 $1.2 M
$1,019,950
$1.0 M $819,000
800 K
$754,000
$724,500
$815,000
$875,000
$637,250 $552,500
600 K $453,500
$479,000
400 K 200 K
7%
6%
15%
15%
14%
Year Rank (Multiple Items) 0 Current Year Month Yes Year Month 04/13 04/14 Parell 04/15 04/16 Match? 04/17
13%
-8%
8%
7%
17%
04/18
04/19
04/20
04/21
04/22
Created by Windermere/East using information and statistics derived from Northwest Multiple Listing Service.