January, 2022 MTD
MARKET UPDATE January, 2022
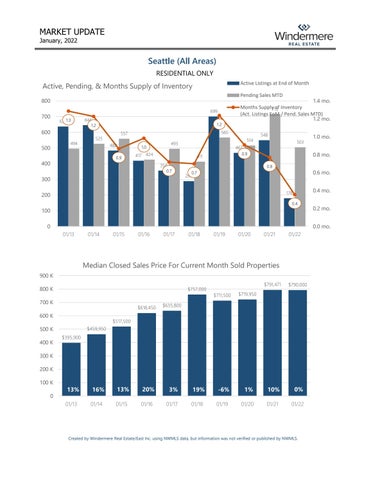
Seattle (All Areas) RESIDENTIAL ONLY
Active, Pending, & Months Supply of Inventory
Active Listings at End of Month Pending Sales MTD
800 700
699 6351.3
600 500
494
644
1.2
1.2
482
514
493
1.0
0.9
400
565
557
525
1.4 mo. Months Supply713 of Inventory (Act. Listings EoM / Pend. Sales MTD) 1.2 mo.
354
0.8
0.6 mo.
0.7
287
0.4 mo.
178
200
0.4
100 0 01/14
01/15
01/16
01/17
01/18
01/19
01/20
01/21
01/22
Median Closed Sales Price forCurrent CurrentMonth Month Closings Median Closed Sales Price For Sold Properties
20 900 K 800 K
$757,000
700 K
$618,450
600 K
$711,500
$791,471
$790,000
$719,950
$635,800
$517,500
500 K
$459,950 $395,900
300 K 200 K 100 K
0.2 mo. 0.0 mo.
01/13
400 K
1.0 mo. 0.8 mo.
0.9
411
300
503
467
417 424 0.7
548
13%
16%
13%
20%
3%
(Multiple Items) 0Year Rank Current Year Month Yes Year Month 01/13 01/14 Parell 01/15 01/16 Match? 01/17
19%
-6%
1%
10%
0%
01/18
01/19
01/20
01/21
01/22
Created by Windermere Real Estate/East Inc. using NWMLS data, but information was not verified or published by NWMLS.