January, 2022 MTD
MARKET UPDATE January, 2022
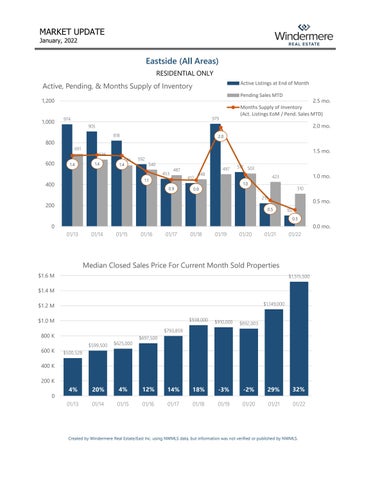
Eastside (All Areas) RESIDENTIAL ONLY
Active, Pending, & Months Supply of Inventory
Active Listings at End of Month Pending Sales MTD
1,200
1,000
979
974
2.0 mo.
905 818
800
600
2.5 mo. Months Supply of Inventory (Act. Listings EoM / Pend. Sales MTD)
691 1.4
636 1.4
2.0
1.5 mo. 581
1.4
592
540 453
487
1.1
400
0.9
412
448
497
517 503
1.0 mo.
423 1.0
0.9
310 219
200
0.5 mo.
0.5
102 0.3
0
0.0 mo. 01/13
01/14
01/15
01/16
01/17
01/18
01/19
01/20
01/21
01/22
Median Closed Sales Price forCurrent CurrentMonth Month Closings Median Closed Sales Price For Sold Properties
12 $1.6 M
$1,515,500
$1.4 M $1,149,000
$1.2 M $1.0 M
$910,000
$892,003
18%
-3%
-2%
29%
32%
01/18
01/19
01/20
01/21
01/22
$793,859
800 K 600 K
$938,000
$599,500
$625,000
20%
4%
$697,500
$500,528
400 K 200 K
4%
12%
14%
Year Rank (Multiple Items) 0 Current Year Month Yes Year Month 01/13 01/14 Parell 01/15 01/16 Match? 01/17
Created by Windermere Real Estate/East Inc. using NWMLS data, but information was not verified or published by NWMLS.