May, 2022 MTD
MARKET UPDATE May, 2022
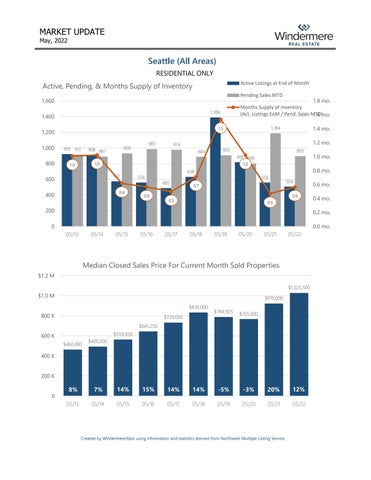
Seattle (All Areas) RESIDENTIAL ONLY
Active, Pending, & Months Supply of Inventory
Active Listings at End of Month Pending Sales MTD
1,600 1,386
1,400
800
1,184
1.5
1,200 1,000
1.8 mo. Months Supply of Inventory (Act. Listings EoM / Pend. Sales MTD) 1.6 mo.
919 912
908 887
1.0
1.0
0.6
400
1.2 mo.
974 884
903
893 816 799
1.0 mo.
1.0
572
600
983
928
1.4 mo.
556
0.6
0.8 mo.
628 485
556
0.7
504 0.6
0.5
0.5
200
0.6 mo. 0.4 mo. 0.2 mo.
0
0.0 mo. 05/13
05/14
05/15
05/16
05/17
05/18
05/19
05/20
05/21
05/22
Median Closed Sales Price forCurrent CurrentMonth Month Closings Median Closed Sales Price For Sold Properties
15 $1.2 M
$1,025,500
$1.0 M
$919,000 $830,000
800 K
$784,925
$765,000
14%
-5%
-3%
20%
12%
05/18
05/19
05/20
05/21
05/22
$729,000 $641,250 $559,950
600 K $460,000
$490,000
400 K 200 K
8%
7%
14%
15%
14%
Year Rank (Multiple Items) 0 Current Year Month Yes Year Month 05/13 05/14 Parell 05/15 05/16 Match? 05/17
Created by Windermere/East using information and statistics derived from Northwest Multiple Listing Service.