March, 2022 MTD
MARKET UPDATE March, 2022
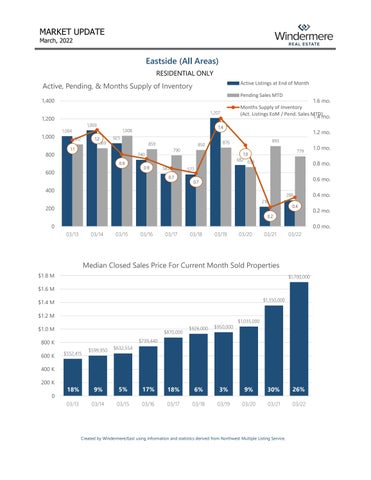
Eastside (All Areas) RESIDENTIAL ONLY
Active, Pending, & Months Supply of Inventory
Active Listings at End of Month Pending Sales MTD
1,400 1,207
1,200 1,000 800
1.6 mo. Months Supply of Inventory (Act. Listings EoM / Pend. Sales MTD) 1.4 mo.
1,069
1,004
1.2
912
1.4
1,008 869
925
1.1
859 740
0.9
600
0.9
850
790
1.2 mo. 893
876
779
1.0
682 659 585 0.7
0.8 mo.
577
0.6 mo.
0.7
400
288 216
200
0.4
0.2
0 03/14
03/15
03/16
03/17
03/18
03/19
03/20
03/21
03/22
Median Closed Sales Price forCurrent CurrentMonth Month Closings Median Closed Sales Price For Sold Properties
17 $1.8 M
$1,700,000
$1.6 M $1,350,000
$1.4 M $1.2 M $1.0 M
$870,000
$1,035,000
$926,000
$950,000
6%
3%
9%
30%
26%
03/18
03/19
03/20
03/21
03/22
$739,440
800 K $552,415
$599,950
$632,554
9%
5%
400 K 200 K
0.4 mo.
0.2 mo. 0.0 mo.
03/13
600 K
1.0 mo.
18%
17%
18%
Year Rank (Multiple Items) 0 Current Year Month Yes Year Month 03/13 03/14 Parell 03/15 03/16 Match? 03/17
Created by Windermere/East using information and statistics derived from Northwest Multiple Listing Service.