April, 2022 MTD
MARKET UPDATE April, 2022
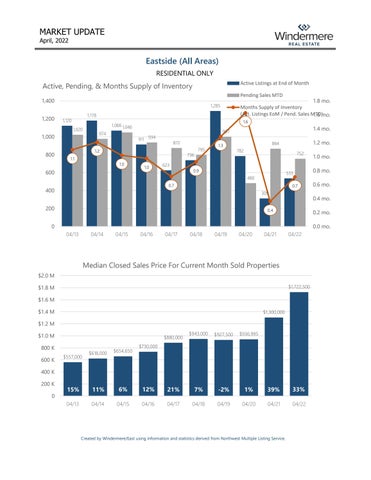
Eastside (All Areas) RESIDENTIAL ONLY
Active, Pending, & Months Supply of Inventory
Active Listings at End of Month Pending Sales MTD
1,400 1,200
1,178
1,120 1,020
1,000 800
1.8 mo. Months Supply of Inventory (Act. Listings EoM / Pend. Sales MTD) 1.6 mo.
1,285
1.6
1,066 1,046 974
911 934
872
1.2
736
1.1 1.0
600
1.0
1.4 mo.
997
795
1.3
752
623 0.9
533
480 0.7
400
1.2 mo.
864 782
0.7
309
200
0.4
0.6 mo.
0.2 mo. 0.0 mo.
04/13
04/14
04/15
04/16
04/17
04/18
04/19
04/20
04/21
04/22
Median Closed Sales Price forCurrent CurrentMonth Month Closings Median Closed Sales Price For Sold Properties
12 $2.0 M
$1,722,500
$1.8 M $1.6 M
$1.4 M
$1,300,000
$1.2 M $1.0 M
$880,000
800 K $557,000
$618,000
$654,650
11%
6%
$943,000
$927,500
$936,995
7%
-2%
1%
39%
33%
04/18
04/19
04/20
04/21
04/22
$730,000
400 K 200 K
0.8 mo.
0.4 mo.
0
600 K
1.0 mo.
15%
12%
21%
Year Rank (Multiple Items) 0 Current Year Month Yes Year Month 04/13 04/14 Parell 04/15 04/16 Match? 04/17
Created by Windermere/East using information and statistics derived from Northwest Multiple Listing Service.