International Research Journal of Engineering and Technology (IRJET) e-ISSN: 2395-0056

Volume: 09 Issue: 09 | Sep 2022 www.irjet.net p-ISSN: 2395-0072

International Research Journal of Engineering and Technology (IRJET) e-ISSN: 2395-0056
Volume: 09 Issue: 09 | Sep 2022 www.irjet.net p-ISSN: 2395-0072
1 Post Graduate Student, Civil Engineering Dept., Faculty of Engineering, Fayoum University, Egypt
2 Assistant Professor of Construction Management, Civil Engineering Dept., Faculty of Engineering, Fayoum University, Egypt
3 Professor of Highway Engineering, Civil Engineering Dept., Faculty of Engineering, Fayoum University, Egypt ***
Abstract - The Highwayconstructionacceptanceprocedure must be designed to encourage the control of Materials and Construction(M&C) variablesthatpresentmoststronglylongterm performance. Therefore, many highway agencies moved away from the oldest types of Specifications(Method-typeand End-result specifications) to develop Performance-Related Specifications (PRS). PRS considerthelong–termperformance and the Life Cycle Cost (LCC) of the pavement and relate them to the M&C variables. Reward or punishment assessed for the contractor is basedoncomparing LCC of as-constructedtoasdesigned pavements. In this research, the finite element method represents the behavior of the pavement materials andevaluate the pavement response (horizontaltensilestrain εt at the bottom of the asphalt layer and vertical compressive strains εc at the top of the subgrade soil) using the nonlinear elastic orthotropic axisymmetricfiniteelementmodelwiththe help of Ansys. The anticipated performance of as-constructed pavement depends mainly on the M&C variables that the contractor used. To ensure the quality of the as-constructed pavement, the M&C variables can be optimized using optimization methods to select the optimum values for M&C variables to achieve optimum performance. The aim of this research is selecting the optimum values of M&C to maximize the pavement performanceofas-constructedpavement.Acase study was developed to verify the optimization process. Genetic Algorithms (GA) methodis selectedas it can deal with multiple variables and can be applied to achieve any fitness function so the contractor can find the optimum solutions without performance loses. Also, a computer application structured into several subroutines and modules was developed to demonstrate the case study. V-model of verification and validation is applied to this computer application to investigate its capability of satisfying the required specification and standards.
Key Words: Flexible Pavements, Performance-Related Specifications, Long–Term Performance, Optimization, GeneticAlgorithms
In Method-Type Specifications, the contractor will be assured full bid price if the inspector verifies M&C prescribedbytheagency.
ThemajordeficienciesinMethod-TypeSpecificationsare thepenaltiesforthecontractor'snonconformancebasedon the inspector's judgment and statistical concepts are not used to evaluate the highway pavement and the payment schedule
End-ResultSpecificationsshiftedtheresponsibilityofthe constructions, and quality control from the agency to the contractor,andtheagencyaccepts,orrejectsbasedonthe acceptancetestresults.Limitationsoftestresults,percent defective limitations-specified for evaluating the highway pavement and considering the variability of the results to minimizetheriskstotheagencyandthecontractorusinga sound acceptance plan. The deficiency of End-Result Specificationsisthedependenceof paymentschedules on thepastabilityofthecontractortoperformandneglecting thelong-termperformance.Themainadvantageofthistype isthatpaymentprovidedtothecontractorisrelatedtothe expectedperformanceoftheas-constructedpavement[1]
InPRS,thepaymentisdeterminedbycomparingLCCof the as-constructed pavement with the as-designed pavement. The main advantage of PRS is that payment provided to the contractor is related to the expected performanceoftheas-constructedpavement[2]
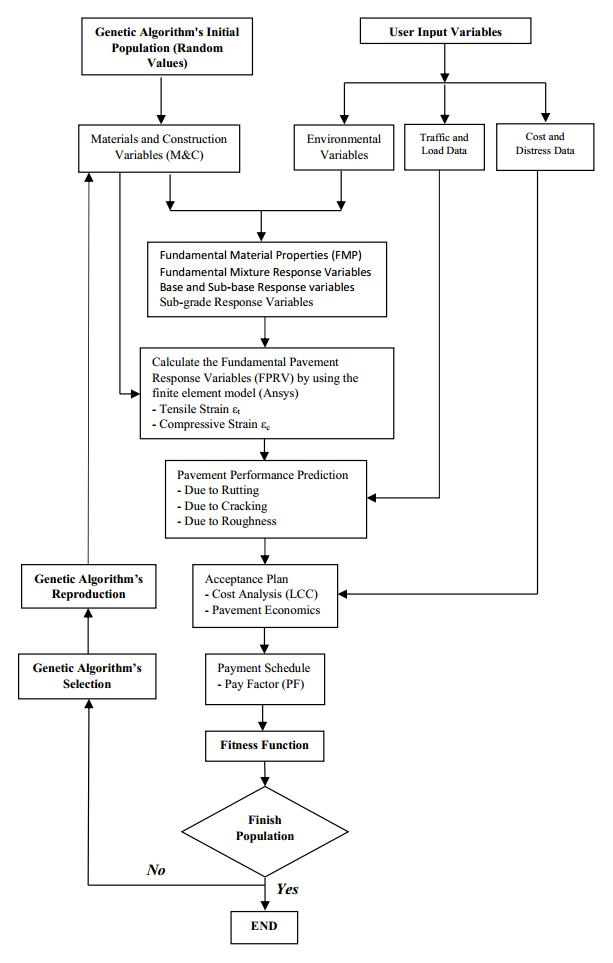
The aim and scope of this research are selecting the optimumvaluesofM&Cvariablestomaximizethepavement performance of as-constructed pavement to provide the contractor alternatives to achieve the as-designed performanceusingGA.Acomputerprogramwasdeveloped todemonstratetheprocessandshowthefinalresultsthat representtheoptimumsolutionsasalternativeswhichhelp thecontractortochoosefrom.Toachievetheobjectivesof thisresearch,mainstepsshouldbeconductedasfollows:
1. InputtingM&Cvariablesfortheas-designedpavement, environmental,trafficandload,costanddistressdata.
2. GA’s randomization of M&C variables for the asconstructedpavementbasedonspecificconstraints
3. CalculatingFundamentalMaterialProperties(FMP)and FundamentalPavementResponseVariable(FPRV).
4. Predictingpavementperformanceindicators
5. Acceptanceplan.
6. GA’scrossover,mutation,selection,andreproduction.
International Research Journal of Engineering and Technology (IRJET) e-ISSN: 2395-0056
Volume: 09 Issue: 09 | Sep 2022 www.irjet.net p-ISSN: 2395-0072
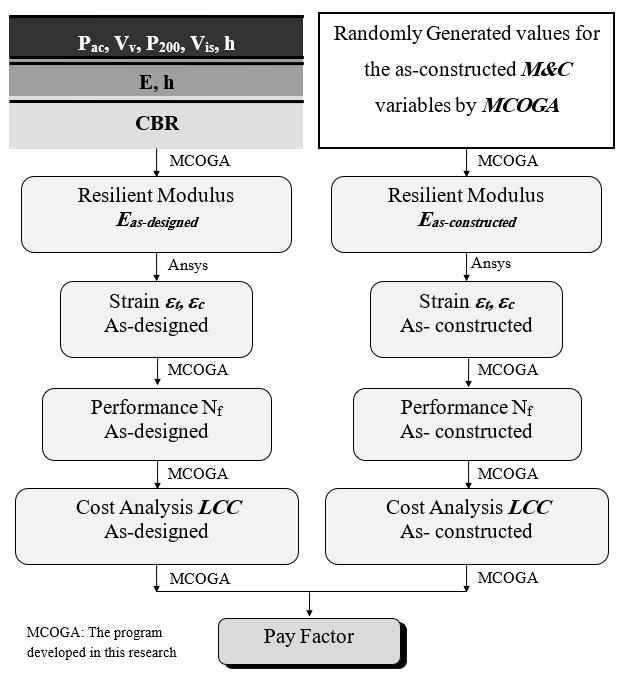
The main objective of this research is to simplify the previouslymentionedframeworkbyutilizingseveraluserfriendly models to select the optimum values for M&C variablesofPRSforflexiblepavementsusingGAtoprovide thecontractorwithdifferentalternativestoachievetheasdesigned performance. Fig-1 shows the conceptual framework,thatwasdevelopedtoachievetheseaims.The input variables used in this research are divided into four categories:
M&C variables as mentioned in Table-1, environmental variables,trafficandloaddata,andcostanddistressdata.
Table -1: M&Cselectedandcontrolledbythecontractor
Variable Symbol Unit
Thethicknessoftheasphaltlayer hasp Inch
Thethicknessofthebasecoarselayer hbase Inch
Absoluteviscosityofbitumenmeasuredat70 F Vis Poises
Percentagebyweightofpassing(No.200)sieve P200 %
Airvoidspercentagebyvolume Vv %
Asphaltpercentagebyweightofmix Pac %
CaliforniaBearingratioofBasecoarselayer CBRbase %
CaliforniaBearingratioofSubgrade CBRsoil %
Theonlyenvironmentalfactorappliedinthisresearchis thepavementtemperaturebecauseitaffectsthestiffnessof asphaltandconsequentlythedynamicmodulusoftheasphalt concretemixture.
TrafficdataincludeEquivalentSingleAxleLoad(ESAL),no. ofvehicles,wheelload,tirepressure,andgrowthfactor.
Cost and distress data can be summarized as distress failurelevelduetorutting,fatiguecracking,androughnessin additiontoagencyandusercostsforthesefailures,bidprice tothecontractor,andinterestrate.
Thesedataarecompiledtogetherinafiniteelementmodel tocomputeFPRVεc andεt.
The number of repetitions to failure (Nf) due to rutting, fatigue,and roughness is used asa performance indicator. Thereisapossibilitytochoosefrommanymodelstoget(Nf) suchasAnderson,1990.
Then cost analysis is derived from calculating the pay factor as shown in Fig-2, and the fitness function of the optimization process to maximize the difference between equivalentuniformannualcostAnfortheas-designedandthe as-constructedpavementsΔAn
Fig -1:Mainframeworkflowchart
Fig -2:Calculatingpayfactor
International Research Journal of Engineering and Technology (IRJET) e-ISSN: 2395-0056
Volume: 09 Issue: 09 | Sep 2022 www.irjet.net p-ISSN: 2395-0072
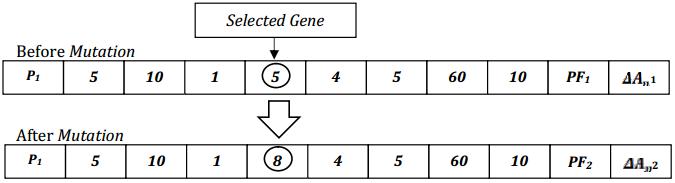
The algorithm is initialized with a finite set of potential solutions called the population. Each possible solution, referred to as a chromosome. However, for building a chromosome,itsgenesmustbeidentifiedfirst.Inthiscase, the eight variables for the as-constructed pavement as mentioned in Table-1 are the genes’ values. Moreover, chromosomeshaveanumberasanindexineachpopulation. Everychromosomehasavaluerepresentedbypayfactorand fitnessrepresentedbyΔAn.Eachchromosomeisdesignedto represent a solution for theproblem, and it does nothave repeatednodeindex.Italsoencodedinbitstringencoding. Hence,everychromosomeinthisresearchhaselevengenes intotalandcanberepresentedasshowninFig-3.
Each chromosome’s value is calculated from PRS procedures[3].Firstly,theinitialpopulationisconstructed, anditschromosomesarefirstrandomlygenerated within the specified limits for each M&C variable. Once the generation of the initial population's chromosomes is completed, each chromosome's fitness ΔAn is calculated. Afterestimatingthefitnessforallchromosomesinthefirst population,thechromosomesandtheirfitnessarestoredin the algorithm's database to avoid duplicated analysis for chromosomesthathavebeenevaluatedbeforeandmaythey appearinfuturegenerations.Thesesolutionsareevaluated byafitnessfunctionwhichismaximizeΔAn
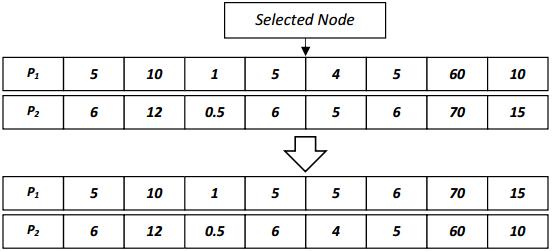
New populations’ generation is performed in two subsequent processes: selection and reproduction. The selection process is carried out to choose a pair of chromosomestoperformthe reproductionprocess [5]. In thisresearch,"roulettewheel"selectionandelitismareused. Chromosomeswithhigherfitnesshavemoreprobabilityof selection. Then these selected chromosomes sorted descendingduetoitsfitness ΔAn.Afterselectingapairof parentchromosomes,thecrossoverprocessiscarriedout andsuggestedinourresearchasshowninFig-4.
Afterperformingcrossover,Aonegenemutationprocess, issuggestedandcarriedout,basedonspecificconstraints,to allownewchromosomestobecreatedasshowninFig-5.
The fit chromosomesareassigneda high probability to "reproduce"inthenextgeneration.Thealgorithmproceeds to generate more good solutions in each iteration and eventuallyconvergestoapopulationwithadistributionof reasonablesolutionsafterseveralgenerations[6].Thelast generationrepresentstheoptimumsolutionsandthebestof the family tree and arranged from greatest to least as alternativesforthecontractortochoosefrom.
As each operator probability may vary through the generations, this research suggested that crossover probabilitytobe0.85and mutationprobabilitytobe0.01 howeverthedevelopedprogramlettheusertoinputthem.
AprogramiscreatedinVisualBasic6.0®environmentto demonstratethecasestudypresentedinthisresearchwitha friendly graphical user interface. This program named MCOGAthatstandsfor(MaterialandConstructionvariables OptimizationbyGeneticAlgorithms).
MCOGA is structured into several subroutines and involves2Modulesand7formsandrunthroughtwostages asshowninFigureFig-6.Thefirstmodule(ModulePRS.bas) isforPRSandthesecondmodule(modBitOps.bas)isforGA. The first stage is a frontend and contains three substages and the second stage is a backend and involves two substagesandcanbesummarizedasfollows:
International Research Journal of Engineering and Technology (IRJET) e-ISSN: 2395-0056
1.1 First stage
1. Thefirstsubstagerunsthrough3formsasfollows:
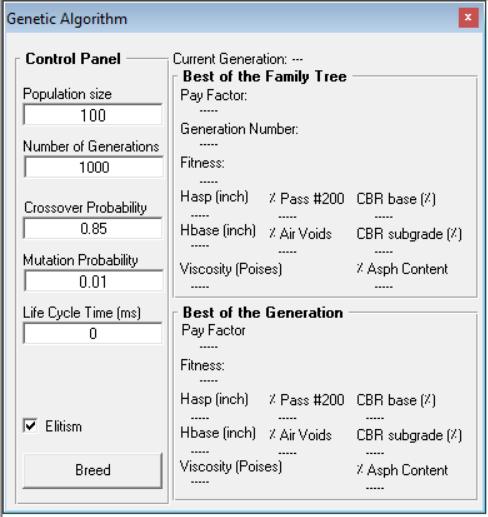
7. ThefirstformistoinputGAdatathattheuserchooses tocontroltheoptimizationprocessandrandomizingthe as-constructed M&C variables to form the first chromosomeintheinitialpopulationasshowninFig-7
Fig -6:Organizationofmodulesandsubroutines
Fig -7:Inputgeneticalgorithmsdata
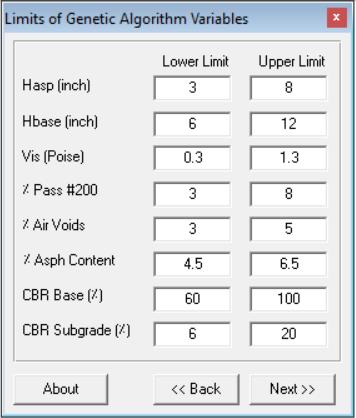
8. ThesecondformasshowninFig-8istoinputthelimits of M&C variables which can be determined from The AsphaltInstituteorAASHTO.
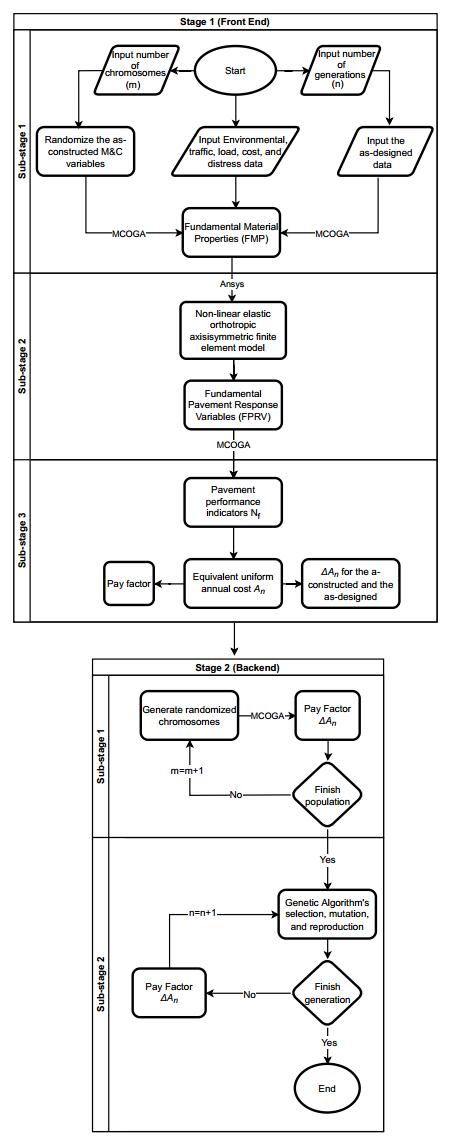
Fig -8:InputlimitsofM&Cvariables
Volume: 09 Issue: 09 | Sep 2022 www.irjet.net p-ISSN: 2395-0072 © 2022, IRJET | Impact Factor value: 7.529 | ISO 9001:2008 Certified Journal | Page1109
International Research Journal of Engineering and Technology (IRJET) e-ISSN: 2395-0056
Table-2 summarizes these values according to (Akhter, 1985)[4].
Table -2: GALimitsforM&Cvariables(AccordingtoAkhter)
Variable Upper Limit Lower Limit Unit hasp 3 8 Inch hbase 6 12 Inch Vis 1.3 4.3 Poises P200 0.4 10.6 % Vv 0 15.9 %
Pac 3 10.2 %
CBRbase 60 100 % CBRsubgrade 6 20 %
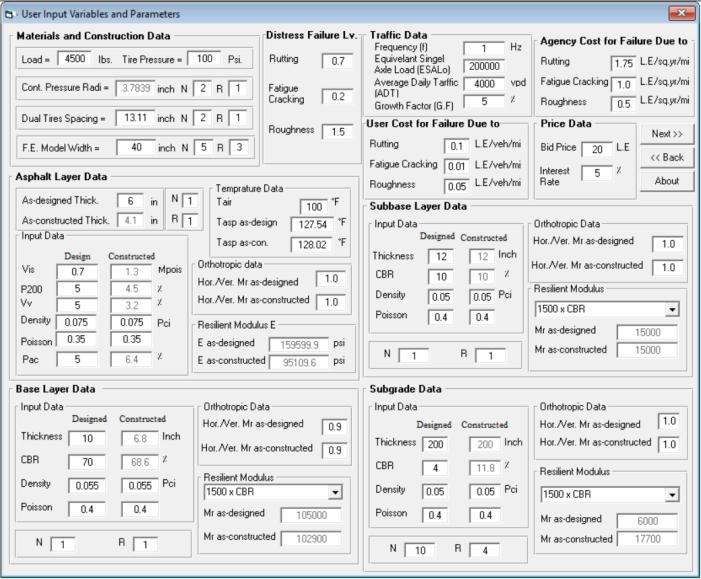
9. The third form is to input the as-designed M&C variables,traffic,load,environmental,cost,anddistress dataandcalculatingFMPforboththeas-designedand theas-constructedpavementsasshowninFig-9.
Fig -10:ThelinkwithAnsystocalculateFPRV
3. Thethirdsubstagerunsthrough3formsasfollows:
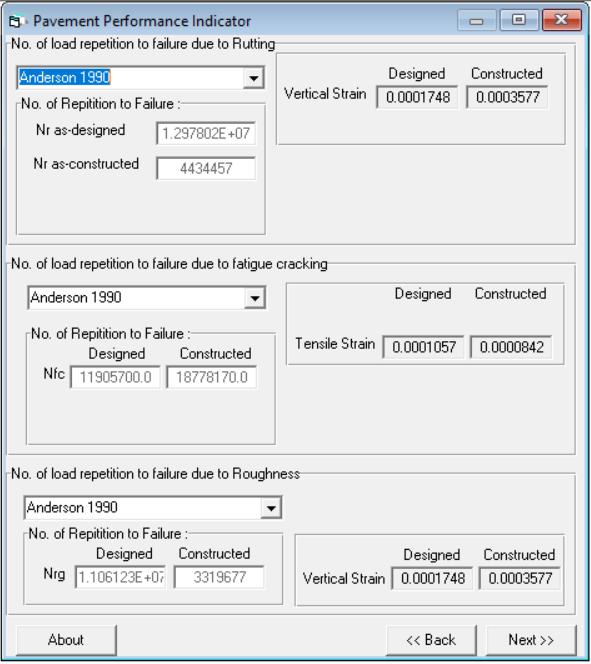
10. ThefirstformasshowninFig-11usestheoutputthat containsFPRVfromAnsysasinputstopredictpavement performanceintermsofnumberofrepetitionstofail Nf for rutting, fatigue cracking, roughness using several methods for both the as-designed and the asconstructedpavements.
Fig -9:inputallM&Candenvironmentalvariablesand traffic,load,distress,andcostdata
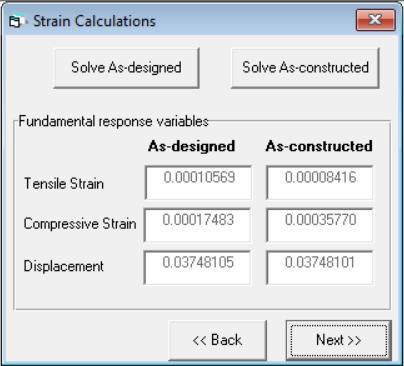
2. Thesecondsubstageisalinkprogramedtotransform thestoreddatafromVB6toAnsysandcalculateFMRV intermsofhorizontaltensilestrain εt atthebottomof theasphaltlayerandverticalcompressivestrains εc at the top of the subgrade soil using nonlinear elastic orthotropicaxisymmetricfiniteelementmodelwiththe aidofAnsys®thentransformtheoutputfromAnsysto VB6againasshowninFig-10.
Fig -11:Numberofloadrepetitiontofailuredueto differentdistresses
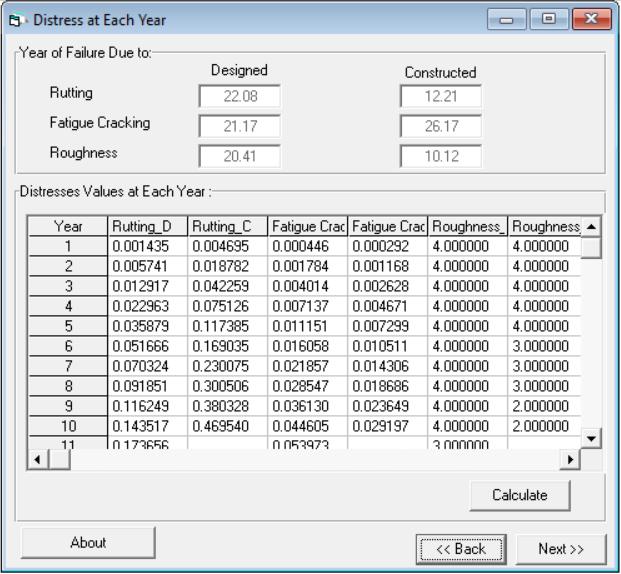
11. The second form calculates the distress level at each year and the year of failure due to rutting, fatigue cracking, and roughness for both the as-designed and theas-constructedpavementsasshowninFig-12.
Volume: 09 Issue: 09 | Sep 2022 www.irjet.net p-ISSN: 2395-0072 © 2022, IRJET | Impact Factor value: 7.529 | ISO 9001:2008 Certified Journal | Page1110
International Research Journal of Engineering and Technology (IRJET) e-ISSN: 2395-0056
Volume: 09 Issue: 09 | Sep 2022 www.irjet.net p-ISSN: 2395-0072
2. The second substage coded to run in background and executedtogeneratenewgenerationsusingselection, crossover, mutation, and reproduction techniques as mentionedbeforethenevaluatingtheobjective(fitness) function which is to maximize ΔAn by comparing the fitnessofallchromosomestotheirpredecessorinthis generation and sorting all the results fitness from the largest to the lowest and repeating the previous procedures to produce next generations till the last generation and representingall optimumsolutionsas alternativessortedfrombesttoleastwithoutlosingthe qualityorperformancedrop
A case study was presented to verify the optimization process.Theinputdatacanbesummarizedasmentionedin tablesfromTable-3toTable-9
Fig -12:Calculatingtheyearoffailureanddistresseachyear
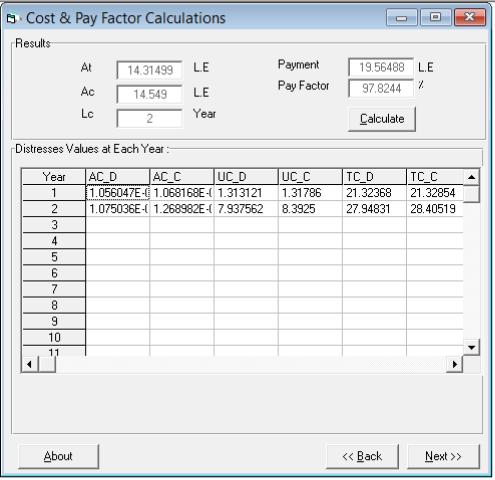
12. The third form is to calculate LCC represented by equivalent uniform annual cost An for both the asdesigned and the as-constructed pavements and paymentscheduletocalculatecontractor’spayfactoras the value for the first chromosome in the initial population.
Table-3containsgeneticalgorithmsdata,whichcontrols theoptimizationprocesswithoutusingelitism,asinputsof thefirstformasshowninFig-7.
Table -3: Casestudy'sgeneticalgorithmsdata
Parameter Value Units PopulationSize 100NumberofGenerations 1000CrossoverProbability 0.85 % MutationProbability 0.01 %
Table-4containsthelimitsofM&Cvariables,asinputsof thesecondformasshowninFig-8.
Table -4: Casestudy'sGALimitsforM&Cvariables
Parameter Unit Upper Limit Lower Limit hasp Inch 3 8 hbase Inch 6 12 Vis Poises 0.3 1.3 P200 % 3 8 Vv % 3 5 Pac % 4.5 6.5 CBRbase % 60 100 CBRsubgrade % 6 20
Fig -13:Cost,payments,LCC,andpayfactorcalculations
1. Thefirstsubstageinthesecondstagecoded torunin background which repeats the previous steps to randomly generate the rest of chromosomes in the initialpopulationandcalculatethevaluesandfitnessfor eachofthemtocompletetheinitialpopulation.
TablesfromTable-5toTable-9representstheinputsofthe third form as shown in Fig-9 in this case study FMRV is chosen to be (1500 x CBR). Table-4 summarizes M&C variablesfortheas-designedpavementandallparameters fortheas-designedandtheas-constructedpavements.Table6 contains traffic and load data. Table-7 represents environmentaldata.Table-8containsdistresslevelsandcost data. Table-9 represents the nonlinear elastic orthotropic axisymmetricfiniteelementmodeldata.
International Research Journal of Engineering and Technology (IRJET) e-ISSN: 2395-0056
Volume: 09 Issue: 09 | Sep 2022 www.irjet.net p-ISSN: 2395-0072
Table -5: Casestudy'sM&Cvariables.
Parameter Value Unit Material and Construction variables D1 6 Inch D2 10 Inch
VisD 0.7 Poises
P200D 5.3 % Vv D 3.67 % Pac D 5 %
CBRbaseD 80 % CBRsubgradeD 5.5 %
DensD1 andDensC1 0.075 Pci. DensD2 andDensC2 0.055 Pci. DensD3 andDensC3 0.05 Pci. ηD1 andηC1 0.35ηD1 andηC1 0.4ηD1 andηC1 0.4 -
Table -6: Casestudy'strafficandloaddata.
Parameter Value Unit Traffic and Load Data f 1 Hz ESAL 200000ADT 4000 Vehicle/Day G.F. 5 % P 4500 lbs. ρ 100 Psi a 3.7839 Inches
Table -7: Casestudy'senvironmentaldata.
Parameter Value Unit Environmental Data Tair 77 ºF Tasp D 98.91 ºF Tasp C 98.95 ºF
Table -8: Casestudy'sdistresslevelsandcostdata.
Parameter Value Unit Cost Data
RuttingdistressAgencyCost 1.75 LE/yard2/Mile
RuttingdistressUserCost 0.1 LE/vehicle/mile
FatiguedistressAgencyCost 1 LE/yard2/Mile
FatiguedistressUserCost 0.01 LE/vehicle/mile
RoughnessdistressAgencyCost 0.5 LE/yard2/Mile
RoughnessdistressUserCost 0.05 LE/vehicle/mile BidPrice 20 LE/yard2
InterestRate 5 %
Distress Failure Level
Rutting 0.75 -
FatigueCracking 0.2 -
Roughness 0.51 -
Table -9: Casestudy'sfiniteelementmodeldata.
Parameter Value Unit Finite Element Data
Na 1Ra 1 -
CC 13.11 Inches
Ncc 2Rcc 1W 40 Inches
Nw 5Rw 3D1 6 Inches
D2 10 Inches
D3 200 Inches N1 1N2 1N3 10R1 1R2 1R3 4 -
Asmentionedbeforetheprogramthengeneratesalink withAnsystocalculateFPRV(εcandεt),AsshowninFig-10, tocalculateNfforrutting,fatigue,androughnessforthefirst chromosome,asshowninFig-11andcalculatestheyearof failureandtheyearoffailureduetoeachdistress,asshown inFig-12
The program reactivates the first window while generating new generations and shows the optimum solutionofthecurrentgenerationandthebestoffamilytree, asshowninFig-7.
The V-model is applied to verify and validate the developedprogram.Verificationactivitiesweredonebefore codingtocheckthatthedevelopedprogrambuiltrightand runcorrectlywithoutanybugsorerrors.
However, validation was done by running MCOGA with casestudyparametersthen input thesameparametersin PRSprogramcreatedby(Galal,2003)[7]andapplytrialand error methodology to verify MCOGA outputs as shown in Table-10.
It is obvious that all variables are within the limits, reasonableandlogicalandtheresultsareapproximatelythe samefromPRSprogramandMCOGA.Also,thepayfactors (values)forallalternativesarewithintheinterval[95-105] and their fitness are approximately the same. So, the programgivesalternativesthatthecontractorcanrelyon withoutperformancedrop.
2022, IRJET | Impact Factor value: 7.529 | ISO 9001:2008 Certified Journal
International Research Journal of Engineering and Technology (IRJET) e-ISSN: 2395-0056 Volume: 09 Issue: 09 | Sep 2022 www.irjet.net p-ISSN: 2395-0072
1 7.4 11.6 1.1 4.2 4.6 5.3 74 6 99.02608 0.104755 99.02607 0.104754 2 5.3 11.3 1.3 3.4 3.5 4.8 89.9 6.6 99.03731 0.103548 99.0373 0.103547 3 6 10.9 1 3.2 4.5 4.8 93.9 6.7 99.06013 0.101092 99.06012 0.101091 4 5.1 11.6 0.4 3 3.7 5.1 90.1 8.4 99.08801 0.098094 99.088 0.098093 5 5.4 11.9 0.5 3.4 3.9 5.2 92.6 9.3 99.08827 0.098066 99.08826 0.098065
6 3.9 11.8 1.3 7 3.3 4.6 81 8.9 99.13288 0.093268 99.13287 0.093267
7 7.2 11.1 1.1 7.6 4.2 6 95.4 8.8 99.14372 0.092102 99.14371 0.092101
8 6.9 9.8 0.6 7.9 3 5.3 98.7 6.7 99.16409 0.089911 99.16408 0.08991
9 7.6 11.5 1.2 7.9 3.8 5.6 87.8 9.9 99.18497 0.087666 99.18496 0.087665
10 6.9 11.6 1.3 3.6 4.2 5.5 62 7.2 99.19266 0.086839 99.19265 0.086838
11 7.8 10.5 0.6 4.3 3.5 5 73.8 6.7 99.20609 0.085394 99.20608 0.085393
12 5 12 1.3 6 3.7 6.1 83.4 11.7 99.22809 0.083028 99.22808 0.083027 13 3.6 12 0.4 6.6 3.4 6.4 70 10.5 99.25475 0.080161 99.25474 0.08016
14 6 10.9 1 3.2 5 5.3 93.8 10.4 99.28508 0.076898 99.28507 0.076897
15 8 10.3 1.1 4.4 4.6 4.5 95.8 9.4 99.29855 0.075448 99.29854 0.075447
16 7.1 10.7 1 3 4.9 5.3 92.3 9.9 99.30296 0.074974 99.30295 0.074973 17 3.7 11.7 1.3 7.2 3.6 6.3 78.7 12 99.32702 0.072387 99.32701 0.072386 18 5.9 11.8 0.4 7.6 4 5.3 77.3 11.6 99.33526 0.0715 99.33525 0.071499 19 6.2 9.9 0.4 4.7 4.2 4.7 79.9 7.3 99.35362 0.069526 99.35361 0.069525 20 5.6 10.1 1.3 5.3 4.7 5.4 96.1 9.4 99.36502 0.068298 99.36501 0.068297 21 6.8 11.1 0.6 7.2 3.1 6.4 71.7 9.3 99.36627 0.068164 99.36626 0.068163 22 6.2 11.7 0.3 3.3 4.9 5.3 87.3 13.5 99.37138 0.067616 99.37137 0.067615 23 4.2 11 0.6 3.3 3.7 5.4 80.1 10.8 99.38956 0.06566 99.38955 0.065659 24 4.7 11.2 0.6 4.4 4.7 5.4 91.8 13.3 99.40913 0.063555 99.40912 0.063554 25 3.1 11.9 1.2 4 3.3 5.7 70.9 12.7 99.42554 0.061789 99.42553 0.061788 26 4.4 10.9 0.5 4 4.5 5.3 89.3 12.4 99.44438 0.059763 99.44437 0.059762 27 4.8 11.9 0.7 6.9 3.5 6.1 99.9 18.4 99.45922 0.058167 99.45921 0.058166 28 3 11 1 7.6 3.2 6.1 91 13.4 99.46516 0.057528 99.46515 0.057527 29 5.5 11.8 0.3 4.1 4.6 4.6 61.7 10.9 99.47919 0.056019 99.47918 0.056018 30 7.9 8.5 0.6 7.5 4.9 5.6 97.6 6.6 99.48454 0.055444 99.48453 0.055443 31 6.7 11.1 0.6 5.1 4.1 4.7 75.5 11.2 99.486 0.055286 99.48599 0.055285 32 7.1 12 0.7 4.7 4.9 6.4 82.9 15.7 99.48714 0.055164 99.48713 0.055163 33 7.1 12 0.7 4.7 4.9 6.4 82.9 15.7 99.48714 0.055164 99.48713 0.055163 34 7.9 10.7 0.9 7.4 3.1 6 89.1 12.7 99.56219 0.047091 99.56218 0.04709 35 6.8 11.6 0.7 4.4 4.7 6.3 80.4 14.9 99.57508 0.045705 99.57507 0.045704
International Research Journal of Engineering and Technology (IRJET) e-ISSN: 2395-0056
Volume: 09 Issue: 09 | Sep 2022 www.irjet.net p-ISSN: 2395-0072
A neat framework is developed to select the optimum valuesofM&CvariablesforPRSforflexiblepavementsthat maximizethedifferencebetweenequivalentuniformannual cost An for the as-designed and the as-constructed pavements ��� using GA with a computer program, to facilitatethesecomplicatedcalculationscodedinVB6,which isverifiedandvalidatedwithV-model.
A case study was developed to verify the optimization process and showed that GA is an effective and effortless method to select M&C variables and gave reasonable optimizationresults.ItalsoconfirmsthatwecanrelyonGA tooptimizeanyothervariables.
Basedonthisstudy,thefollowingrecommendationswere performed for further studies such as applying GA optimizationmethodologytoselectM&CvariablesforPRS forrigidpavements.Also,moreM&Cvariables,modelsfor calculatingFMRV,modelsforpredictingtemperatureprofile, environmental effects, models to predict rutting, fatigue cracking,roughnessdistressescanbeconsideredinfurther studies.
[1] M. I. Darter, M. Abdelrahman, and P. A. Okamoto, “Performance-Related Specifications A Cooperative EfforttoImprovePavementQuality,” Fed. Highw. Adm., vol.FHWA-SA-97,1992.
[2] D. A. (David A. . Anderson, D. R. Luhr, C. E. Antle, American Association of State Highway and Transportation Officials., and United States. Federal HighwayAdministration., Frameworkfordevelopmentof performance-related specifications for hot-mix asphaltic concrete, no. 332. Transportation Research Board, NationalResearchCouncil,1990.
[3] S. A. Galal, “A Framework for Development of Performance- Related Specifications for Flexible Pavements,”CairoUniversity,1999.
[4] G.F.AkhterandM.W.Witczak,“SensitivityofFlexible PavementPerformanceToBituminousMixProperties.,” Transp. Res. Rec.,pp.70–79,1985.
[5] T.F.Hamdy,“Optimizingsurfaceworkoperationsofroad construction using combined simulation and genetic algorithms,”CairoUniversity,2014.
[6] J. H. Holland, Adaptation in natural and artificial systems :anintroductoryanalysiswithapplicationsto biology,control,andartificialintelligence.1975.
[7] S. A. Galal, Y. R. Goda, and E. A. Sharaf, “Prediction of Flexible Pavement Performance Using Finite Element Procedure,” Ain Shams Eng. J.,vol.38,no.2,pp.87–105, 2003.
Hassan M. EL-Dash
Post Graduate Student, Civil Engineering Dept.
Faculty of Engineering, Fayoum University, Fayoum, Egypt
Tarek F. Hamdy
Assistant Professor of Construction Management, Civil Engineering Dept.
Faculty of Engineering, Fayoum University, Fayoum, Egypt
Sameh A. Galal


Professor of Highway Engineering, Civil Engineering Dept., Faculty of Engineering, Fayoum University, Egypt