

International Research Journal of Engineering and Technology (IRJET) e-ISSN: 2395-0056
Volume: 12 Issue: 01 | Jan 2025 www.irjet.net p-ISSN: 2395-0072


International Research Journal of Engineering and Technology (IRJET) e-ISSN: 2395-0056
Volume: 12 Issue: 01 | Jan 2025 www.irjet.net p-ISSN: 2395-0072
Hemangi Patil1 , Gaurav Acharya2
1Independent Researcher, Mumbai, India
2Department of master’s in computer science, IIT Chicago, Illinois***
Abstract - Chronic Kidney Disease (CKD) is a global health problem since it starts asymptomatically and progresses in an irreversible manner. Therefore, the earlier and accurate diagnosis plays a significant role in improving patient outcomes. This paper presents a machine learning (ML) framework that handles data problems such as missing values and evaluated different ML-models for addressing the problem of CKD diagnosis. K-Nearest Neighbors (KNN) data imputation and classifier evaluation on six classifiers show Random Forest (RF) out of all trained classifiers performs best with the accuracy of 99.75%. A new hybrid method with Logistic Regression (LOG) and RF gives an additional improvement in accuracy (99.83%). This approach is scalable and adaptable in a clinical environment.
Key Words: Chronic Kidney Disease, Machine Learning, Data Imputation, Random Forest, Logistic Regression, Predictive Modeling
1. INTRODUCTION
Chronic Kidney Disease (CKD) is a progressive condition characterized by the gradual decline of kidney function, often remaining undetected until it reaches advanced stages. Early detection is critical for preventing further complications and improving patient outcomes. However, traditional diagnostic methods are time-consuming and may not always be practical in clinical settings. In recent years, machine learning (ML) has emerged as a promising solution for automating CKD diagnosis, offering faster and more accurate predictions. Despite its potential, existing MLmodelsfacechallengessuchasincompletedatasetsand limited generalization. This paper proposes a novel MLbased framework for CKD diagnosis that addresses these challenges. Specifically, it utilizes K-Nearest Neighbors (KNN) imputation to handle missing data, making the model applicable even when diagnostic categories are unknown or incomplete. The study evaluates several ML algorithms, including Logistic Regression (LOG), Random Forest (RF), Support Vector Machine (SVM), K-Nearest Neighbor (KNN), Naive Bayes (NB), and Feedforward Neural Networks (FNN) to establish CKD diagnostic models. Furthermore, a hybrid model combining Logistic Regression and Random Forest is introduced to improve theaccuracyofthepredictions.Thishybridmodelachieves an impressive accuracy of 99.83%, highlighting its effectiveness and potential for clinical adoption in CKD diagnosis.
The main objective of this study is to develop an early diagnostic model for Chronic Kidney Disease (CKD) that minimizes testing and cost while achieving high accuracy. The study's objectives are to use K-Nearest Neighbors(KNN)imputationtomanagemissingdatain theCKDdatasetandfeatureselectionwithinformation gain to determine which features are most crucial for CKD identification. To find the best accurate model, a variety of machine learning methods will be used and compared, such as Feedforward Neural Networks, Random Forest, Support Vector Machine, K-Nearest Neighbor, Naive Bayes, and Logistic Regression. The objective is to use 24 important predictors to predict the presence of CKD and evaluate the accuracy and otherpertinentmetricsofvariousalgorithms.
Different papers and articles have been reviewed for this project. Also, their conclusions are summarized in this section. The section present documents that were studied prior and post project development. The mentionedarticlesprovidewithabetterunderstanding about structure of the system and how various algorithmscouldbecombinedtogethersoastobuilda systemwithhigherefficiency.
Table -1: PublicationsCited:
Title Year Author Summary
Diagnosis of patients with chronickidney disease by using two fuzzy classifiers
Diagnosis of chronickidney disease by usingrandom forest
2016 (Chemometr. Intell.Lab.)
2017 (Int. Conf. Medical and Biological Engineering)
Z. Chen et al. Used fuzzy classifiers to diagnose CKD, handling incomplete datasets for better accuracy.
A. Subasi, E. Alickovic,J. Kevric Applied Random ForestforCKD prediction, withemphasis on feature selection.

International Research Journal of Engineering and Technology (IRJET) e-ISSN: 2395-0056
Prevalence of chronickidney disease in China:Acrosssectional survey
Incorporating temporal EHR data in predictive models for risk stratification of renal function deterioration
Prevalence of chronickidney disease in an adult population
Diagnosis of chronickidney disease based on support vector machine by feature selection methods
A new machine learning approach for predicting the response to anemia treatment in end-stage renal disease patients
2012(Lancet) L.Zhanget al.
Explored CKD prevalence in China, underlining the need for early detection.
2015 (J. Biomed. Inform.)
A.Singhet al. Integrated temporal EHR data to improve CKD risk prediction.
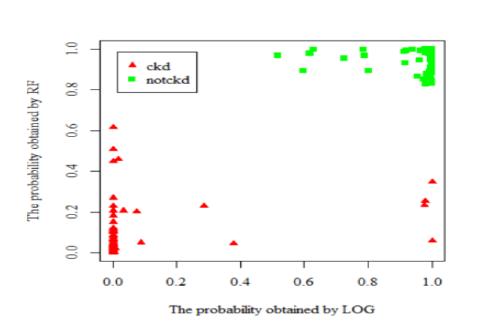
Fig.3.1-LogisticRegress
3.2 K-NEAREST NEIGHBOR:
2014 (Arch. Med.Res.)
A. M. CuetoManzano etal.
Focused on CKD prevalence, stressing the importance of early diagnosis.
2017 (J. Med. Syst.) H. Polat, H.D. Mehr, A.Cetin
UsedSVMwith feature selection for improvedCKD diagnosis.
2015 (Comput. Biol.Med.)
C. Barbieri etal.
AppliedMLto predictanemia treatment responses in end-stage renaldisease.
3.1 LOGISTIC REGRESSION
Logisticregressionisalsousedtoestimatetherelationship between a dependent variable and one or more independent variables, but it is used to make a prediction about a categorical variable versus a continuous one. A categoricalvariablecanbetrueorfalse,yesorno,1or0,et cetera. The unit of measure also differs from linear regression as it produces a probability, but the logit functiontransformstheS-curveintostraightline.
Volume: 12 Issue: 01 | Jan 2025 www.irjet.net p-ISSN: 2395-0072 © 2025, IRJET | Impact Factor value: 8.315 | ISO 9001:2008
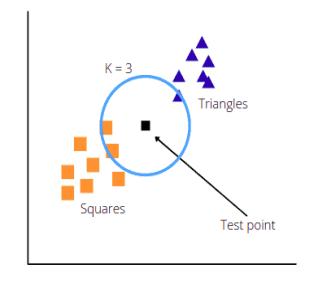
K-Nearest Neighbor is one of the simplest and most used supervised machine learning algorithms. Technically it does not train any dataset; instead, an observation is predicted to fall under those classes which have the largest proportion of k-nearest neighbors around it. Distance is considered to be a metrictodeterminesimilarity.Forinstance,theclosest data point around the point under observation can be considered most similar to the data point. There are a large variety of distance-metrics like Euclidean distance(d)
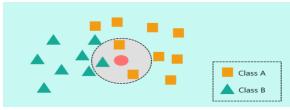
Fig.32K-NearestNeighbor.
Support Vector Machine is one of the most robust algorithmsbasedonthestatisticallearningframework which offers solutions for both regression and classificationproblems.Usingthekerneltrick,SVMcan classify both linear and non-linear datasets. The datasets are separated by a (n-1) hyper plane, where every data point is considered to be an n-dimensional vector. For a two-dimensional space, the hyperplane is alineseparatingaplaneintwoparts.
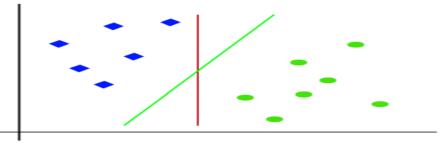
Fig.3.3-SupportVectorMachine.

International Research Journal of Engineering and Technology (IRJET) e-ISSN: 2395-0056
Volume: 12 Issue: 01 | Jan 2025 www.irjet.net p-ISSN: 2395-0072
Random Forest is a learning algorithm which operates by creating multiple decision trees at training time and providing an output class of individual trees. It is applicable for both regression and classification. This model does a small tweak that utilizes the de-correlated tree by building a multitude of decision trees on bootstrapped samples from training data; this process is known as bagging. During bootstrapping, it filters a few numbersoffeaturecolumnsoutofallfeaturecolumns.
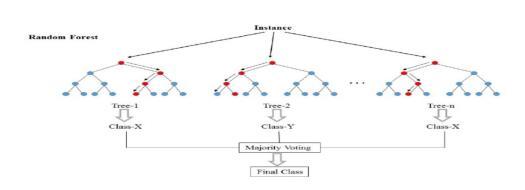
Fig.34–DecisionTree
3.5 NAÏVE BAYES (NB):
Naïve Bayes is a supervised algorithm which imposes independence of features while classifying data. This model is an effective tool for datasets which have a high number of input features. It considers all the features available including some of the features that have weak effectsonthefinalprediction
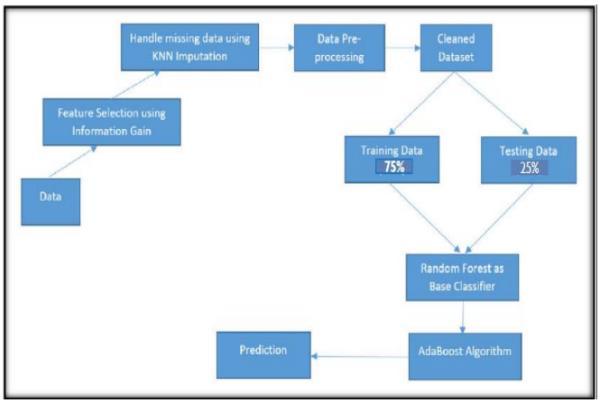
Fig.3.5-NaïveBayesclassifier
3.6 MULTILAYER PERCEPTRON:
A multilayer perceptron (MLP) is a feed-forward artificial neural network madeupof several layersof perceptron. It contains nodes of at least three layers named input node, hidden layer and the output node. This network uses a non-linearactivationfunctionwhichmapsweightedinputs to each neuron output. In this paper, we used sigmoid functionsastheactivationfunctions.
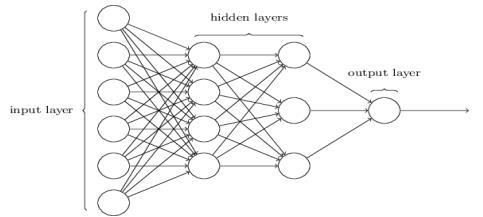
Fig.3.6-MultilayerPerceptron
4 PROPOSED SOLUTION
The proposed solution is intended to demonstrate the effectiveness of the Hybrid Machine Learning Models overtheindividualMachineLearningModelsproviding the remarkable efficiency and accuracy in the prediction of the Chronic Kidney Disease with the highestachievedaccuracyofthe99.83%.
4.1 REQUIREMENTS
4.1.1 HARDWARE REQUIREMENT
Laptop(RAM8GB)
Storage(500GB)
Monitor(15”LED)
Processor(Pentiumi3/i5Processor)
4.1.2 SOFTWARE REQUIREMENT
Windows10OperatingSystem.
JupyterNotebook
Python Libraries (Numpy, Pandas, Matplotlib, SKLearn,SeaBorn)
5. SYSTEM DESIGN
SYSTEM ARCHITECTURE
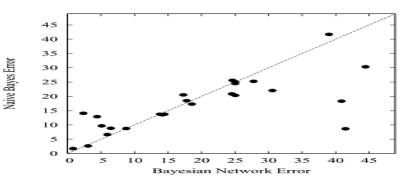
Fig.5.1SystemArchitecture

International Research Journal of Engineering and Technology (IRJET) e-ISSN: 2395-0056
Volume: 12 Issue: 01 | Jan 2025 www.irjet.net p-ISSN: 2395-0072
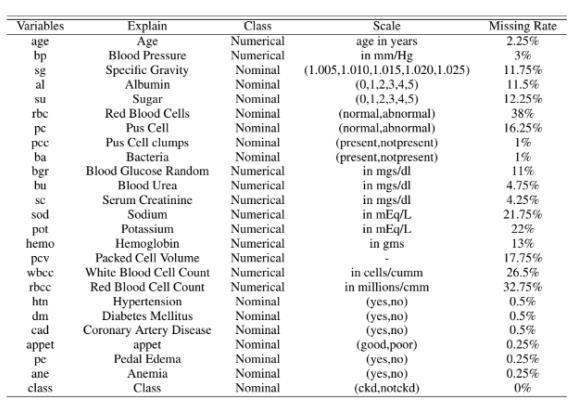
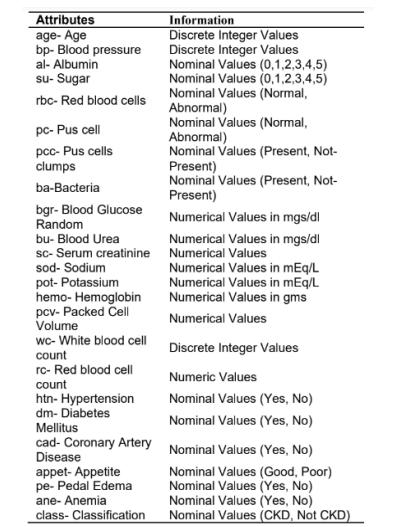
The dataset for predicting chronic kidney disease was taken from the UCI machine learning repository, a wellknown source of all machine learning datasets. The CKD dataset contains 400 patient records and 25 characteristics
These are either symptoms or other disease-related characteristics such as hypertension, blood pressure, specific gravity, albumin, and so on. Among the 400 patient records, 250 have the disease, whereas the remaining150donot.
To effectively execute data preprocessing in Python, it is imperativetoimportarangeofpredefinedlibraries,each tailored to fulfill specific roles within the realm of machine learning. In the present study, a selection of libraries, including NumPy, pandas, matplotlib, and scikit-learn (sklearn), has been utilized. Each library is designated for particular tasks that collectively contributetothedataprocessingandanalyticalphasesof theresearch.
5.3
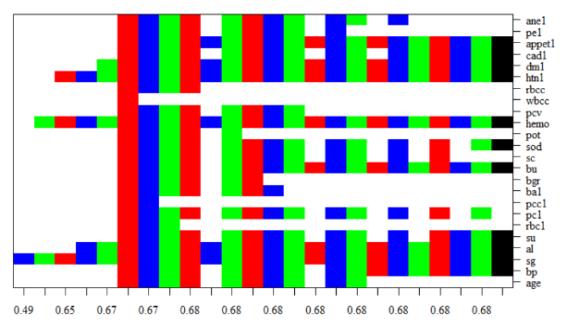
Next,it isvery essential to managethemissingvaluesin adatasetasitwillcauseahugeissuelaterwhileapplying the machine learning algorithms. Hence it is essential to handle missing values that are there in the dataset. The CKD dataset has various missing values as some of the patients might forget or miss to fill in certain values in real life. Hence, KNN imputation is going to be used to handle missing values as it has proven to be effective in experiments.Everymissingvaluecanthenbehandledby replacing them with the mean value of the k-nearest neighbors, to do so in general Euclidean distance metric isusedbydefault.
5.4. FEATURE SELECTION:
AMachineLearningmodel cansufferfromtheissueof overfitting if the number of features becomes identical orhuge.Topreventthisfromhappeningitisimportant to reduce the number of features in the dataset. Feature selection refers to reducing the number of featuresinadatasetwhenbuildingamachinelearning model.Anotheradvantageofdecreasingthenumberof input attributes is the decrease in the cost of building the ML model and in a few situations, it might even improvetheaccuracyofthemodel.
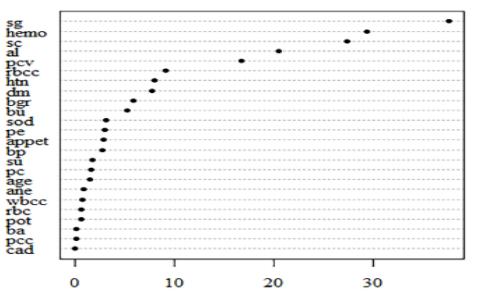
Fig.5.4-ResultsofImportantFeatureExtraction.
5.5. IDENTIFY AND MANAGE MISSING VALUES:
Next, it is very essential to manage the missing values in a dataset as it will cause a huge issue later while applying the machine learning algorithms. Hence it is essentialtohandlemissingvaluesthatarethereinthe dataset.TheCKDdatasethasvariousmissingvaluesas some of the patients might forget or miss to fill in certain values in real life. Hence, KNN imputation is going to be used to handle missing values as it has proven to be effective in experiments. Every missing value can then be handled by replacing them with the mean value of the k-nearest neighbors, to do so in generalEuclideandistancemetricisusedbydefault.

International Research Journal of Engineering and Technology (IRJET) e-ISSN: 2395-0056
5.5-CalculatingMissingValue
5.6.ENCODING THE CATEGORICAL DATA:
Categoricaldatainadatasetaretheonesthathavecertain categories like in this dataset there are categorical variables like packed cell volume, hypertension and classification. These categorical data might cause a huge challenge while building the model as machine learning only deals with numbers and mathematics. So, it is essential to convert these categorical variables into numbers. There are various techniques for this purpose andinthispaper,LabelEncodingoftheSKLearnlibraryis goingtobeused.
5.7.SPLITTING THE DATASET:
All the datasets must be split into the training subset and the testing subset to proceed with the prediction. The training subset is used to perform training whereas the testing subset is used to perform testing. One is aware of theresultsinthetrainingsubsetbutoneisnot13awareof the prediction result or output of the testing subset. The CKDdatasetisgoingtobesplitintheratioof75:25
Volume: 12 Issue: 01 | Jan 2025 www.irjet.net p-ISSN: 2395-0072 © 2025, IRJET | Impact Factor value: 8.315 | ISO 9001:2008 Certified Journal | Page224
5.8. MODEL DEVELOPMENT AND EVALUATION SCHEME:
Developing individual ML models and evaluating them the various machine learning algorithms applied for predictionare:
LogisticRegression
NaïveBayes
ArtificialNeuralNetwork RandomForest
The performance of these classifiers is analyzed based on various metrics such as Accuracy, Precision, Recall, F-measure and loss and the best classifier for diagnosingchronickidneydiseaseisfound.
6. SYSTEM FLOW DIAGRAM:
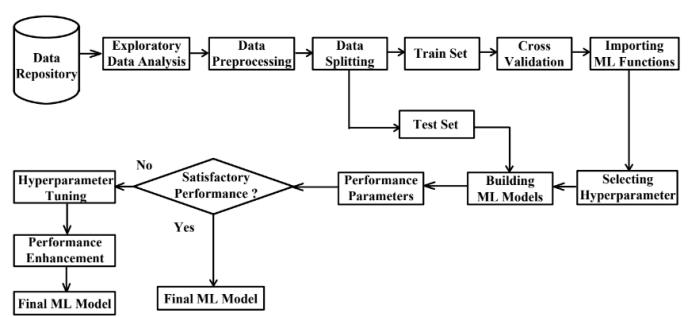
Fig.6-SystemFlowDiagram
7. METHODOLOGY:
7.1. DATASET BEFORE FEATURE SELECTION
The dataset after cleaning and preprocessing does not containanynullvaluesthusbeforefeatureselectionon the dataset the dataset is consistent and ready to be used.

International Research Journal of Engineering and Technology (IRJET) e-ISSN: 2395-0056
Volume: 12 Issue: 01 | Jan 2025 www.irjet.net p-ISSN: 2395-0072
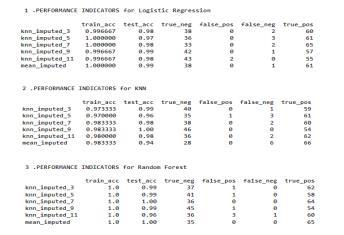
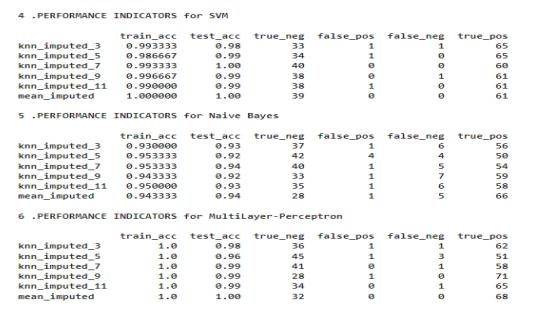
Fig.7.1.1-Dataset’sBeforefeatureselection.
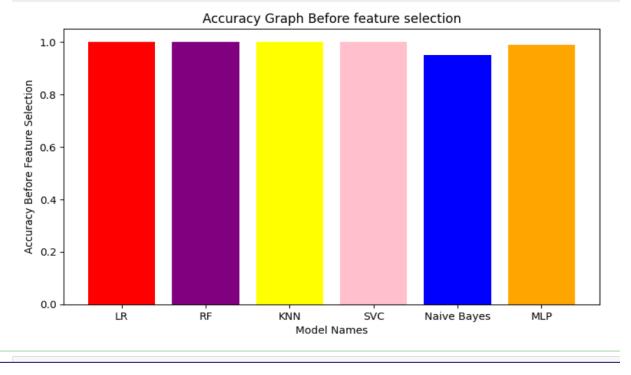
Fig.7.1.2-ModelsefficiencybeforeFeatureSelection
7.2 FEATURE SELECTION AND CORRELATION BETWEEN MODELS
Afterfeatureselectionandfindingthecorrelationbetween various prediction models the Heat-map is generated and isasfollows
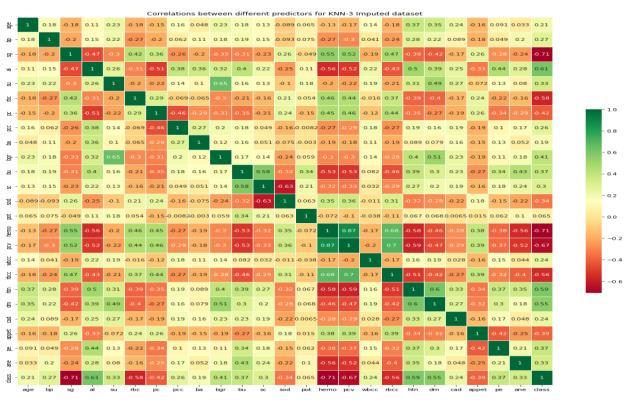
Fig.7.2-Heat-MapCorrelationbetweenPredictors
7.3 AFTER FEATURE SELECTION
The dataset after cleaning and preprocessing does not contain any null values thus after feature selection on thedataset,thedatasetisconsistentandreadytouse.
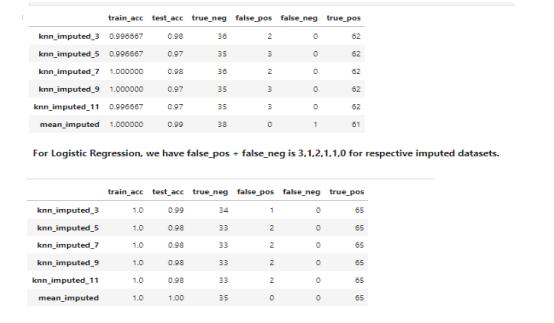
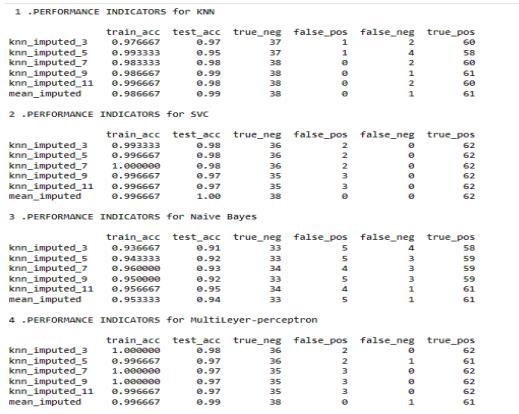
Fig7.3.1-Datasetsafterfeatureselection
© 2025, IRJET | Impact Factor value: 8.315 | ISO 9001:2008 Certified Journal | Page225

International Research Journal of Engineering and Technology (IRJET) e-ISSN: 2395-0056
Volume: 12 Issue: 01 | Jan 2025 www.irjet.net p-ISSN: 2395-0072
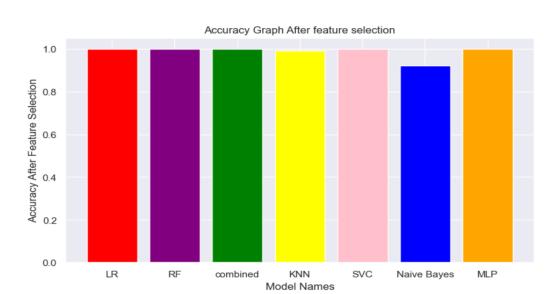
Fig7.3.2-Modelsefficiencyafterfeatureselection
7.4. ATTRIBUTE IMPORTANCE CALCULATION
Asthedatasethas24 attributesfor eachrecordand some of them are more dominant and some have negligible impact on the results so we keep calculating the importance of each attribute and discard the attribute having the least importance. We have the least important attribute having the calculated importance weight of 0.01 orless(age,su,pc,sod,pot,wbcc,pcc,ba,cad,ane).
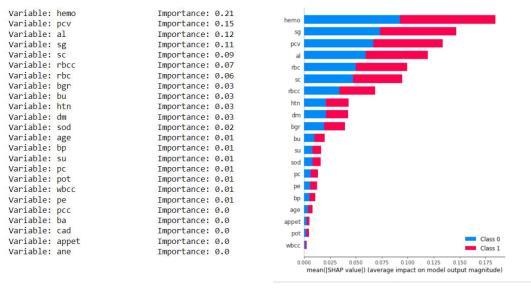
Fig7.4.1KNNimputationmeansStatisticsandGraph.
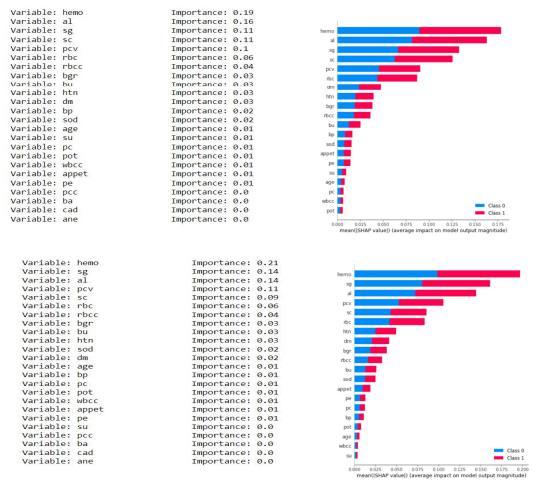
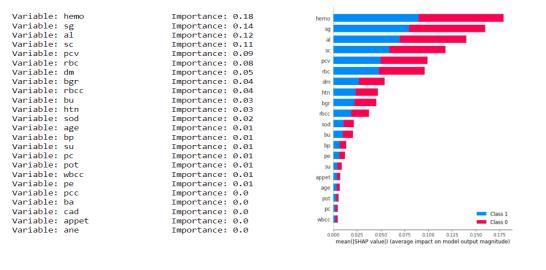
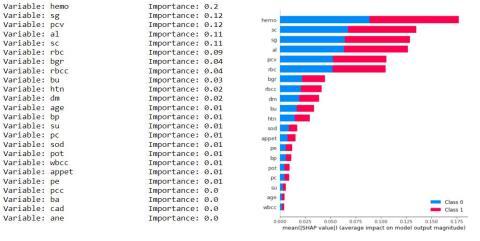
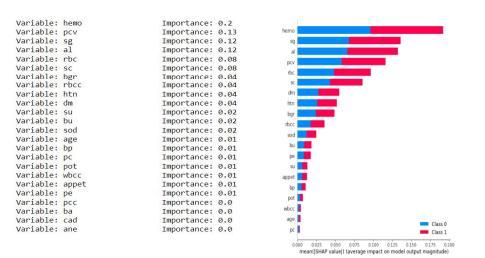
Fig.7.4.2-KNNUniformStatisticsandGrap
7.5. COMBINED MODELS LOGISTIC REGRESSION AND RANDOM FOREST
The combined approach of the Logistic Regression model and Random Forest model gives the result set withaccuracyandprecision99.83%
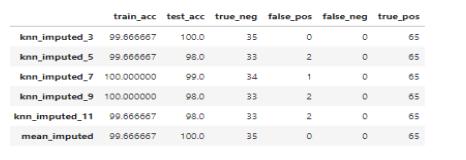
Fig.7.5-CombinedLogisticRegressionandRandom Forest

International Research Journal of Engineering and Technology (IRJET) e-ISSN: 2395-0056
Volume: 12 Issue: 01 | Jan 2025 www.irjet.net p-ISSN: 2395-0072
The suggested hybrid model for predicting chronic kidney disease (CKD) outperformed separate machine learning models in terms of efficiency and reliability. The hybrid technique,whichcombinestwoormoremodels, considerably improves forecast accuracy, obtaining an astounding 99.83%. This beats older techniques, which typically attain a maximum accuracy of 95.60% in their most well-known applications. The findings imply that model combinations can produce better outcomes, encouragingtheusageofhybridimplementationsinfuture diagnostic systems. This approach has the potential to significantly improve the accuracy and efficiency of CKD prediction, hence contributing to the growth of machine learningapplicationsinhealthcare.
Future enhancements to the underlying algorithms have the potential to increase the models' usefulness and performance.Withongoingdevelopment,itispossiblethat forecast accuracy may reach 100%, making these models evenmoredependable.
Advances in algorithmic design and structure could significantly improveaccuracyrates, ensuringthat models are better prepared to handle real-world data. This would increase their applicability and readiness for implementation in actual healthcare settings, ultimately benefiting humanity by delivering highly accurate and efficient instruments for early disease diagnosis and management.
10. REFRENCES:
[1]Z.Chenetal.,“Diagnosisofpatientswithchronickidney disease by using two fuzzy classifiers,” Chemometr. Intell. Lab.,vol.153,pp.140-145,Apr.2016.
[2] A. Subasi, E. Alickovic, J. Kevric, “Diagnosis of chronic kidney disease by using random forest,” in Proc. Int. Conf. Medical and Biological Engineering, Mar. 2017, pp. 589594.
[3] L. Zhang et al., “Prevalence of chronic kidney disease in china: a cross-sectional survey,” Lancet, vol. 379,pp.815-822,Aug.2012.
[4]A. Singh etal., “Incorporating temporal EHR data in predictive models for risk stratification of renal function deterioration,” J. Biomed. Inform., vol. 53, pp. 220-228,Feb.2015.
[5] A. M. Cueto-Manzano et al., “Prevalence of chronic kidneydiseaseinanadultpopulation,”Arch.Med.Res., vol.45,no.6,pp.507-513,Aug.2014.
[6] H. Polat, H.D. Mehr, A. Cetin, “Diagnosis of chronic kidney disease based on support vector machine by feature selection methods,” J. Med. Syst., vol. 41, no. 4, Apr.2017.
[7]C.Barbierietal.,“Anewmachinelearningapproach for predicting the response to anemia treatment in a large cohort of end stage renal disease patients undergoing dialysis,” Comput. Biol. Med., vol. 61, pp. 56-61,Jun.2015.
[8] V. Papademetriou et al., “Chronic kidney disease, basal insulin glargine, and health outcomes in people with dysglycemia: The origin study,” Am. J. Med., vol. 130,no.12,Dec.2017.
[9]N.R.Hilletal.,“Globalprevalenceofchronickidney disease– Asystematic reviewandmeta-analysis,”Plos One,vol.11,no.7,Jul.2016.
[10] M. M. Hossain et al., “Mechanical anisotropy assessment in kidney cortex using ARFI peak displacement: Preclinical validation and pilot in vivo clinicalresultsinkidneyallografts,”IEEETrans. Ultrason.Ferr.,vol.66,no.3,pp.551-562,Mar.2019.
[11] M. Alloghani et al., “Applications of machine learning techniques for software engineering learning andearlypredictionofstudents’performance,”inProc. Int.Conf.SoftComputinginDataScience,Dec.2018,pp. 246-258.
[12] D. Gupta, S. Khare, A. Aggarwal, “A method to predict diagnostic codes for chronic diseases using machine learning techniques,” in Proc. Int. Conf. Computing, Communication and Automation, Apr. 2016,pp.281-287.
[13]L.Duetal.,“Amachinelearningbasedapproachto identify protected health information in Chinese clinical text,” Int. J. Med. Inform., vol. 116, pp. 24-32, Aug.2018.
[14]R.Abbasetal.,“Classificationoffoetaldistressand hypoxia using machine learning approaches,” in Proc. Int.Conf.IntelligentComputing,Jul.2018,pp.767-776.
[15] M. Mahyoub, M. Randles, T. Baker and P. Yang, “Comparison analysis of machine learning algorithms to rank alzheimer’s disease risk factors by im-portance,” in Proc. 11th Int. Conf. Developments in eSystems Engineering,Sep.2018.
[16] E. Alickovic, A. Subasi, “Medical decision support system for diagnosis of heart arrhythmia using DWT and random forests classifier,” J. Med. Syst., vol. 40, no. 4, Apr. 2016.

International Research Journal of Engineering and Technology (IRJET) e-ISSN: 2395-0056
Volume: 12 Issue: 01 | Jan 2025 www.irjet.net p-ISSN: 2395-0072
[17] Z. Masetic, A. Subasi, “Congestive heart failure detection using random forest classifier,” Comput. Meth. Prog.Bio.,vol.130,pp.56-64,Jul.2016
[18] Q. Zou et al., “Predicting diabetes mellitus with machine learning tech-niques,” Front. Genet., vol. 9, Nov. 2018.