International Research Journal of Engineering and Technology (IRJET) e ISSN: 2395 0056

Volume: 09 Issue: 07 | July 2022 www.irjet.net p ISSN: 2395 0072

International Research Journal of Engineering and Technology (IRJET) e ISSN: 2395 0056
Volume: 09 Issue: 07 | July 2022 www.irjet.net p ISSN: 2395 0072
1,2,3,4 B.Tech Scholar, Dept. of Civil Engineering, Ilahia College of Engineering and Technology, Kerala, India 5 Assisstant Professor, Dept. of Civil Engineering, Ilahia College of Engineering and Technology, Kerala, India ***
Abstract Nowadays, due to the particular characteristics of hospitals, the hospital buildings are highly sensitive to environmental noise. In our comprehensive one month research project, traffic and community noise levels were measuredand monitoredat tensensitive areas ie;hospitals in its spatial temporal aspects, at the city of Ernakulam. Noise measurements were taken at different peak sessions from morning to evening. The project presents an analogy of obtained noise readings with the national CPCBstandards for silent zones. The main objective of our project is to aware the public about the noisy environment with which we livestoday, due to the increased traffic intensity. Using QGIS software, noise maps are generated to make the awareness more precisely. Hospitals are exposed to high volumes of environmental noise. Major source of noise pollution is from vehicles. It has detrimental effects onhumanhealth.Increased inpopulationincreases the trafficthatcausingnoisepollution.
Key Words: QGIS Software, Sensitive areas, Noise levels, MEXTECH SL 36 Sound level meter, Noise mapping, Vehicular traffic
Sound is the source of communication, received by transmittedwavesofpressureandreceptionofsuchwaves andtheirperceptionbythebrain.Atypeofenergycausedby vibration sound will sound like when it reaches the ear dependsonthemediumittravelsthroughandstrengthof theinitialvibration.Therearedirectrelationshipbetween noise and health. Issues related to noise include stress related illness, high blood pressure, speech interference, hearing loss, sleep disruption and cost productivity. The habitualproblemofnoisepollutionisnoiseinducedhearing loss,causesfurthermorehealthproblems.Thebeginningof noisepollutioncanbemainlyascribedtotheunrestricted growthofurbanpopulation.Thereaemanysourcesofnoise, generally grouped into stationary, mobile and collective sources.
The main source of noise near hospitals is traffic noise from automobiles. In addition, noise from increased population around hospital region is also a reason. Noise level depends on number of vehicles, population, climate, factoriesnearby,workshops,etc.
Todeterminepresenttrafficnoiselevelsatsensitive areas.
To analyse and compare noise levels in sensitive areas with respect to Central Pollution Control Board(CPCB)standards.
Mapping the Vehicular Noise pollution using QuantumGeographicalInformationSystem(QGIS).
Ithelpstocollectenvironmentaldatainrelationto road traffic noise by methods of monitoring and storingthemforfurtherretrieval
Editing, analysis and promoting their use for the bestpossiblepurpose.
A noise study of the future impact during constructionsensitivereceptors.
Noiseimpactsassociatedwithconstructionofthe powerlineonsensitivereceptors.
The methodology consist of 8 steps, from the selection of suitablesensitivezonestothenoisemappingofourdatas.In fig 1 shows the flow chart of the methodology. The main steps involved in our project is shown in the flow chart below.
International Research Journal of Engineering and Technology (IRJET) e ISSN: 2395 0056
Volume: 09 Issue: 07 | July 2022 www.irjet.net p ISSN: 2395 0072
Selectionofsite
Studyareaoftheselected location
ResultsandDiscussions
DataanalysisandDatastudy
Noisedatacollectionusing soundlevelmeter Datacollectionofnumberof vehicles
Basemappingofthedata collected
InterpolationusingQGIS
Fig 1 : FlowChart
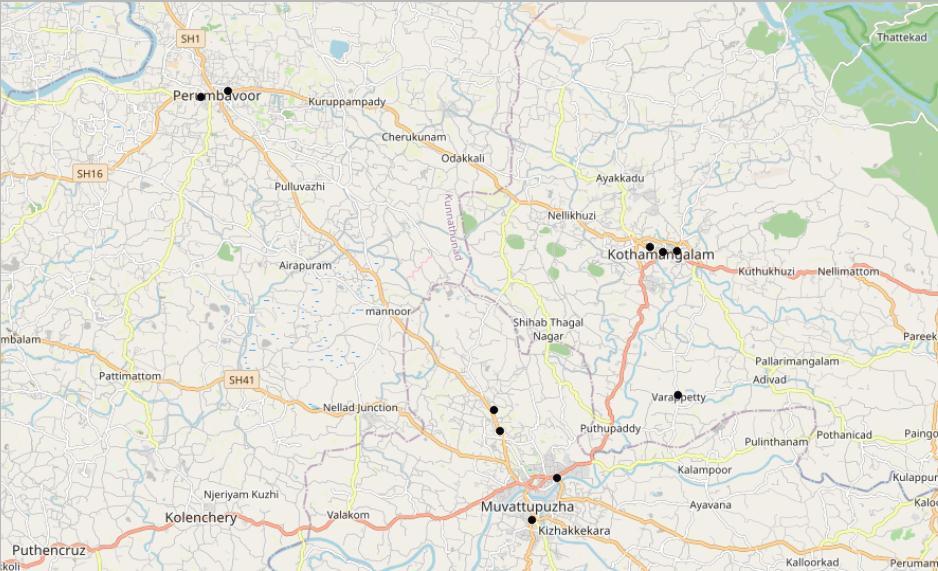
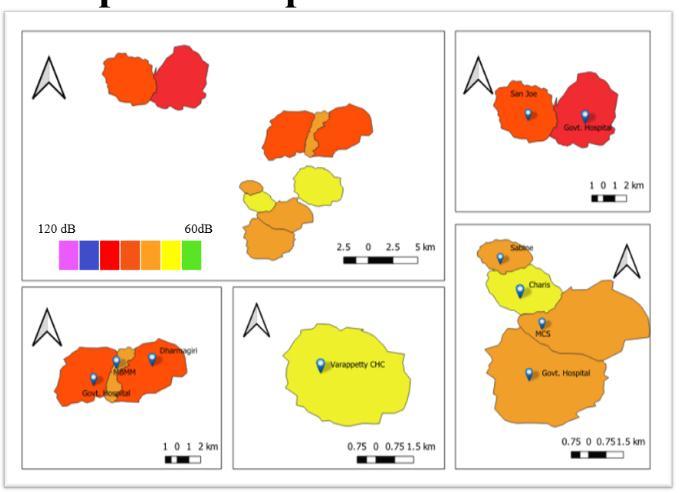
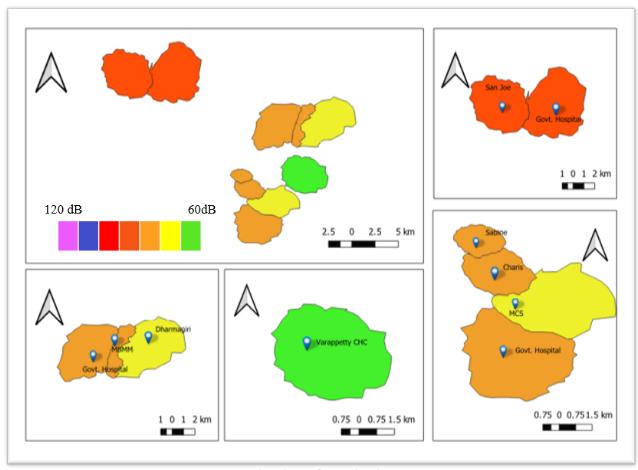
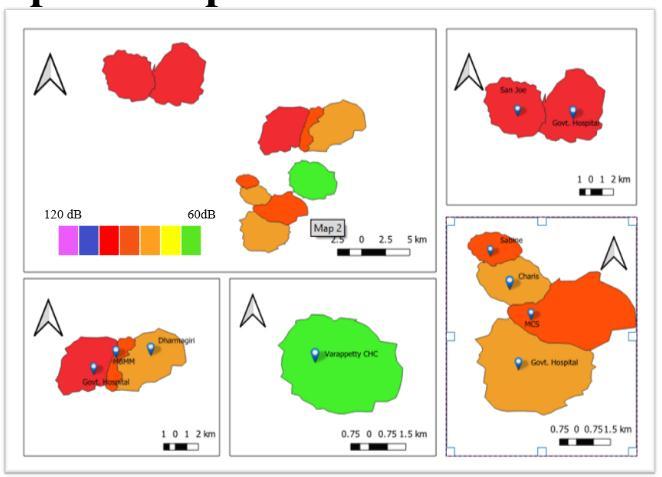
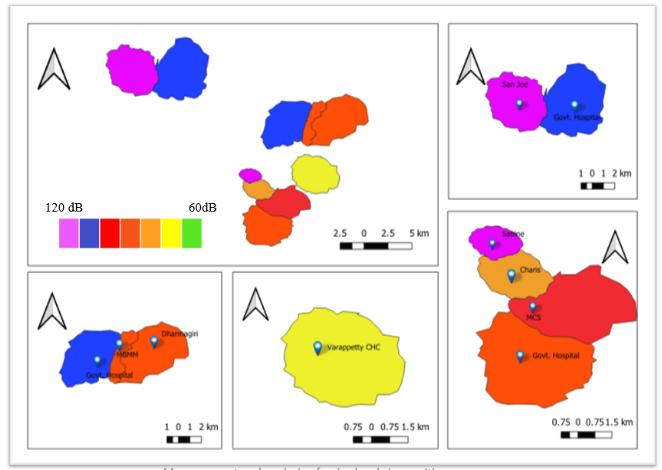
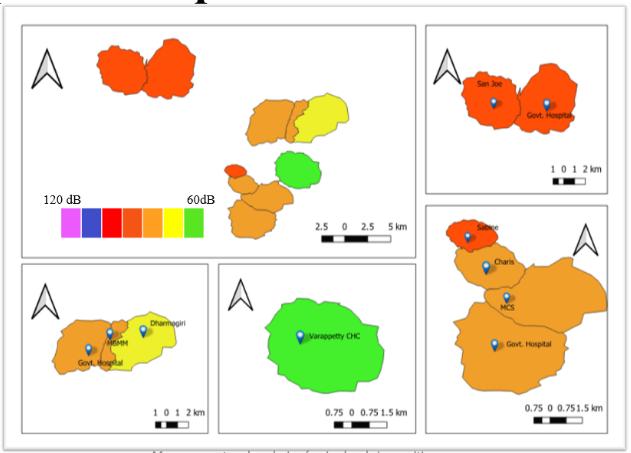
The noise level in Ernakulam city was observed during differenttimeintervalsatsensitiveareas.Thesilentzoneis incorporatedwithhospitals.ItincludesDharmagirihospital,
Governmenthospitals,MBMMhospital,MCShospital,Sabine hospital & research center, Charis hospital and San Joe hospitalwereselected,asshowninfig2
Fig 2:Locationofvarioushospitals
2022, IRJET | Impact Factor value: 7.529 | ISO 9001:2008 Certified Journal
International Research Journal of Engineering and Technology (IRJET) e ISSN: 2395 0056
Volume: 09 Issue: 07 | July 2022 www.irjet.net p ISSN: 2395 0072
Thesehospitalswereselectedonthebasisoftrafficvolume, demography and presence of residential and commercial buildingsinthesurrounding.Thecharacteristicsoftheten hospitallocationsthatwerechosenfornoiseassessment
Sl.no Hospital Name Location Location Characteristics
1 Govt.Hospital Kothamangalam Locatedinheartofthecity; incloseproximitytosurrounding public transits.
2 MBMMHospital Kothamangalam Locatedbyacrosswayjunctionleadingtothreedifferentroutes.
3 DharmagiriHospital Kothamangalam Mostlyconstitutingcommercialandeducationalestablishments.
4 SanJoeHospital Perumbavoor Locatedinheartofthecity;incloseproximitytobusstand,petrolpump andschool.
5 Govt.Hospital Perumbavoor Locatedbyacrosswayjunctionleadingtothreedifferentroutes;inclose proximitytoUnionbankandpublictransits.
6 Govt.Hospital Muvattupuzha Mostlyconstitutingcommercialandeducationalestablishments
7 Govt.Hospital Varappetty Developing area close proximity to village office and commercial establishment
8 CharisHospital Muvattupuzha Locatedinheartofcityandsoundduetopublictransits
9 MCSHospital Muvattupuzha Locatednearbybridge
10 SabineHospital Muvattupuzha Close proximity to substation nearby and noise mainly due to public transits
Theabovetable1showsthelocationcharacteristicsofthe hospitalzones,whicharechosenfortheassessmentofnoise pollution.Thetenselectedhospitalsandtheirlocationsare
Hospitals
alsomentionedindetailforeasyunderstandingaboutthe zonethatweselected.
Table 2 Comparison of noise pollution by device and vehicle traffic
Time NoisePollutionratiomeasuredby thedevice Percentage of total pollution resultingfromvehicletraffic Workingday Nonworkingday Workingday Nonworkingday
GOVTHOSPITAL KOTHAMANGALAM
8am 10am 94.4 94.4 82.63 83.32 10am 12pm 85.3 85.3 80.85 80.42
2pm 4pm 82.1 82.1 79.75 78.78 4pm 6pm 76.2 76.2 76.61 74.84
MBMMHOSPITAL KOTHAMANGALAM
DHARMAGIRIHOSPITAL KOTHAMANGALAM
8am 10am 83.7 83.7 80.79 76.7 10am 12pm 97.9 97.9 81.49 79.19
2pm 4pm 71.6 71.6 71.5 76.26 4pm 6pm 73.2 73.2 73.39 72.88
8am 10am 85.4 75.3 79.71 76.56 10am 12pm 82.9 80.4 79.24 76.20 2pm 4pm 80.6 76 77.25 74.20 4pm 6pm 68.2 69.8 67.97 66.49
MCSHOSPITAL MUVATTUPUZHA
8am 10am 76.2 84.9 68.39 77.3 10am 12pm 84.8 94.2 72.77 75.31 2pm 4pm 78.4 85.1 69.44 72.45 4pm 6pm 67.6 70.4 65.20 69.09
International Research Journal of Engineering and Technology (IRJET) e ISSN: 2395 0056
Volume: 09 Issue: 07 | July 2022 www.irjet.net p ISSN: 2395 0072
SANJOEHOSPITAL PERUMBAVOOR
8am 10am 89.7 90.4 82.92 83.42 10am 12pm 82.3 103.5 82.11 81 2pm 4pm 82.6 93.2 82.18 79.67 4pm 6pm 83.8 83.5 83.69 78.86
GOVTHOSPITAL PERUMBAVOOR
8am 10am 92.4 91.6 84.39 83.69 10am 12pm 85.1 112.4 82.86 81.81 2pm 4pm 91.5 95.2 82.60 79.90 4pm 6pm 88.4 86.7 89.97 75.79
GOVTHOSPITAL MUVATTUPUZHA
8am 10am 97.9 96.8 82.31 83.8 10am 12pm 81.2 80.9 77.55 80.57 2pm 4pm 78 76.1 73.81 76.04 4pm 6pm 79.3 74.8 77.68 73.77
CHARISHOSPITAL MUVATTUPUZHA
GOVTHOSPITALVARAPPETTY
8am 10am 71.5 73.8 80.73 79.88 10am 12pm 75.3 76.4 79.12 79.03 2pm 4pm 68.6 72.9 77.13 77.09 4pm 6pm 75.8 77.2 78.58 75.46
8am 10am 65.8 71.5 53.05 52.14 10am 12pm 71.4 76.9 49.53 48.98 2pm 4pm 51.3 54.3 39.82 44.46 4pm 6pm 61.5 57.6 50.52 43.24
SABINEHOSPITAL MUVATTUPUZHA
8am 10am 90.1 92.2 81.78 83.52 10am 12pm 85.8 103.5 79.90 78.56 2pm 4pm 71.7 84.7 78.69 80.70 4pm 6pm 76 87 79.24 77.33
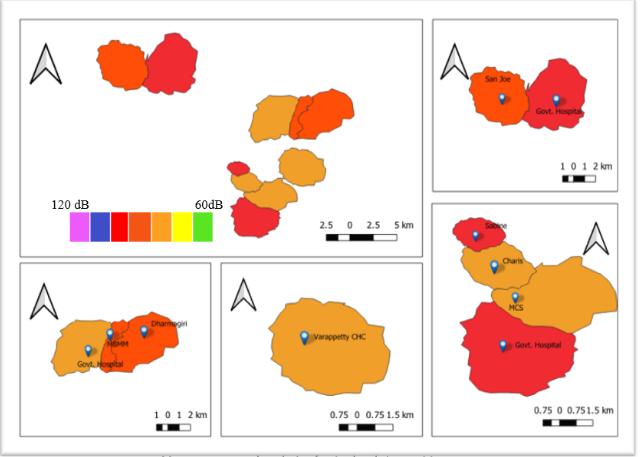
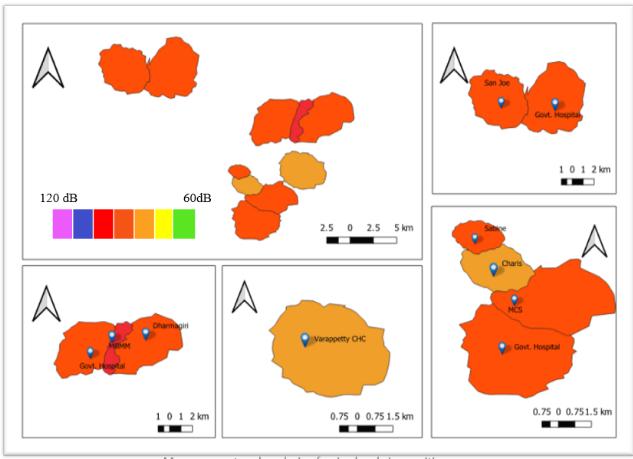
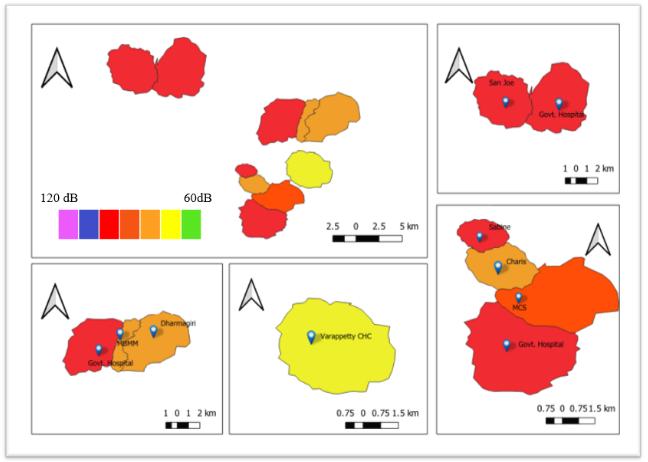
Fromthecollecteddatasonworkingandnonworkingdays inthesensitivezonesweplotedthefollowingnoisemaps. Foreasyunderstandingofthepeoplewecategoriesthemin todifferentzonesonthebasisoftheirreadingwithdifferent colours.Intable3showsthecolourthatweselectedforour noisemappingandtheirrangesarealsomentionedinthe table.
Table 3 Colour Chart of different noise level NoiseLevel Colours 50 60 Lightgreen 60 70 Lemonyellow 70 80 Chromeyellow 80 90 Orange 90 100 Red 100 110 Blue 110 120 Purple
Infig3,4,5,6,7,8,9,10showsthenoisemapof10hospitalson workingdaysandnonworkingintimeinterval8 10,10 12,2 4,4 6.Fromthemapitselfwecanunderstandthatthenoise levelthatwemeasuredatthesensitivezonearehigherthan theCPCBstandards.
Fig 3:8:00am 10:00amworkingday
International Research Journal of Engineering and Technology (IRJET) e ISSN: 2395 0056
Volume: 09 Issue: 07 | July 2022 www.irjet.net p ISSN: 2395 0072
Fig
Fig
Fig
Fig
International Research Journal of Engineering and Technology (IRJET) e ISSN: 2395 0056
Volume: 09 Issue: 07 | July 2022 www.irjet.net p ISSN: 2395 0072
enforcement of law and regulation is felt in this regard
Noisemonitoringstudy revealsthatnoise situations at all theselectedlocationsaregreaterthantheprescribedlimits set by CPCB standards in sensitive areas during day time. Thefollowingstrategiescanbeespousedtominimizetraffic noisepollutionintheabove saidlocations:
Soundproofdoorsandwindowscanbeinstalledto blockunwantednoisefromoutdoor
Fig 10: 4:00pm 6:00pmnonworkingday
Noise monitoring was done in the ten sensitive areas of ErnakulamCity.Theaveragenoiselevelsinalltenstations weretrulyadvancedthanthedaytimeCPCBspecifiednoise limits. Eight maps were produced for the Ernakulam city basedonthesoundleveldatacollectedfromthestudyarea. Theconclusionsfromourprojectarelistedbelow:
The noise assessment of the study area indicated thatthenoisesituationsintheareaareraisingata veritably fast rate with growing population and heavy business accumulation. Noise situations attained at different locales of the megacity are setup to be exceeding the noise position/ limits specified by the CPCB “The Noise Pollution (RegulationandControl)Rules,2000”.
Noise walls can be installed along the walls of hospitals, educational institution etc will gives an estheticappearanceandreducessoundpollution.
Strictlegislativemeasuresmustbeespousedalong thesensitivezoneslikebanninghorns,limitingthe numberofvehiclesetc.
Maintaining and improving the vegetation by plantingmoretreesalloverthesensitivezone.
Signal values should be duly synced as per the traffic.
The noise at source can be reduced by replacing noise producing machines with suitable modified technique.
Aninsulatingmaterialmaybeappliedonthenoise producing machinery and equipment’s which causessoundproofing.
Itwasalsoobservedthatinnumerousareasofthe city,thenoisepositionreachedmaximumintensity.
Datacollectedandresultsanatomizedindicatethat nearlyonallmajorroads,arealwaysadvancedthan thepermissiblenoisesituation/limitsspecifiedby CPCB“TheNoisePollution(RegulationandControl) Rules,2000”.
Theuseofentrapmentsorearmuffsorevencotton balls can protect them from dangerous effects of noisepollution.
Limitconstructioninnearbysurroundingstonight time,withtheuseofnoiseinsulators.
Makegirdingareasasno honkingzones.
In silence zones noise situations exceeded the admissiblemoralsof50dB(A).Itwasalsoobserved that advanced noise position in the city is due to rapidfireandunplannedurbanizationperforming ingreataffluenceofpeoplefromallcorridorofthe region, lack of sufficient parking spaces and exponentialgrowthofprivatevehiclesinthecity.
Produce detailed noise maps at silence zones to helpinstallrigidandthicknoisewallsinhospitals andothersimilarsensitivebuildings.
Design future hospitals away from high traffic densities, but in close vicinity to easily accessible roads.
Divertheavyvehiclestootherpathwaysifpossible orapplyspeedlimitforsuchvehicles.
It is felt that noise terrain of the study area may poseasagreattroubletothehealthofresidersof the study area in long term. Thus, a strict
International Research Journal of Engineering and Technology (IRJET) e ISSN: 2395 0056
The authors wish to express their gratitude to the department of civil engineering at Ilahia College of Engineering and Technology, Muvattupuzha, for their supportinthisresearch.
[1] Avnish Chauhan and Mayank Pawar (2010) “Assessment of Noise Level in Different Zones of HaridwarCity”. Journel of Researcher Pages:56 59
[2] Dev Pramendra and Singh Vartika (2011) “EnviromentalNoisePollutionMonitoringandImpacts OnHumanHealthinDehradunCity,Uttarakhand,India”. Journel ofCivil andEnvironmentalResearch Pages:2224 5790.
[3] Dr.SantoshRangnekar.,Dr.ManoranjanParidaand Rajeev Kumar Mishra (2008 09). “Survey on Noise PollutionanditsManagement”. JournaloftheInstituteof Health Promotion and Education Pages:30 33
[4] Jigna Patel, Mitali J. Shah (2015) “State of the Art Review on Road Traffic Noise Mapping using GIS”. International Journal for Scientific Research & Development Pages:565 568
[5] S.U.Bande, M.P.Nawathe, C.R.Patil (2013) “Road Tarffic Noise Assesment in India A Review”. International Journal for Engineering Applications and Technology Page82 87.
[6] Ashly. S, Anilkumar B (2016) “Assessment of Noise PollutionatEranakulambyGIS” International Journalof Advanced Information Science and Technology (IJAIST) Vol.5,No.10.
[7] K. Santhoshkumaar, N. Muralimohan, A. Sathiyaseelan, G. Santhosh, S. Sanjaikumar (2020) “Mapping of Vehicular Noise Pollution using GIS”. International Journal of Advanced Science and Technology Vol.29,No.05,pp.1114 1119.
[8] H.G.VivekPrasad,SachithKothari,B.ManojKumar, andSanjanaSuresh Measurement andAnalysisofNoise Levels inthe Sensitive Areas ofMysuru City, India. Trends inCivilEngineeringandChallengesforSustainability.
Volume: 09 Issue: 07 | July 2022 www.irjet.net p ISSN: 2395 0072 © 2022, IRJET | Impact Factor value: 7.529 | ISO 9001:2008 Certified Journal | Page220