International Research Journal of Engineering and Technology (IRJET) e ISSN: 2395 0056

Volume: 09 Issue: 06 | Jun 2022 www.irjet.net p ISSN: 2395 0072

International Research Journal of Engineering and Technology (IRJET) e ISSN: 2395 0056
Volume: 09 Issue: 06 | Jun 2022 www.irjet.net p ISSN: 2395 0072
1 4Student, Civil engineering Department, Sree Narayana Institute of Technology, Adoor, India 5Assistant Professor, Civil engineering Department, Sree Narayana Institute of Technology, Adoor, India ***
Abstract – A roundabout is a special type of at grade intersection. Introducing a roundabout at Stadium junction, Pathanamthitta will eliminate direct conflict at the junction. Moreover, a roundabout avoids frequent stopping and starting of vehicles, which is a major disadvantage of the existing traffic signal system for the design of roundabout traffic volume data are needed. Traffic volume study is conducted at the junction for a period of 7days. Roundabout is preferred when right turning traffic is more. The design of roundabout is done as per the guidelines of IRC 65:2017.
Key Words: Roundabout, At grade intersection, traffic volumestudy,signalsystem,weavingtraffic
An efficient transportation system is the backbone of a country’s economy. Therefore the regulation of traffic is essential for the smooth and safe movement of vehicles. Duetorapidurbanization,trafficisincreasingdaybyday, which leads to traffic congestion at the intersection. Poor performanceofthesignalizedintersectionultimatelyleads toenvironmentpollution
Pathanamthitta district is located at southern part of Kerala,withalatitude9.280680 and76.869670Elongitude and has an area of 2642 km2. Many pilgrim centres including the famous Hindu pilgrimage Sabarimala is situated in Pathanamthitta district and is known as the ‘PilgrimcapitalofKerala’.
Introducing a roundabout at stadium junction helps to reduce the traffic congestion, permits free flow ,allow uniformspeedandreduce conflictpoints.Atafourlegged intersection, a self regulating roundabout reduces the number of conflict points from 32 to 8. Traffic congestion at a conventional traffic signal system causes frequent starting and stopping of vehicles, idling and crawling causes loss of fuel and increase in emissions. This can be eliminatedbytheintroductionofaroundabout.
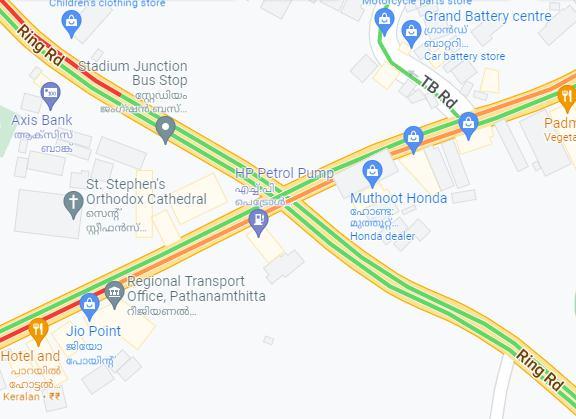
The study area is Stadium junction Pathanamthitta with a latitude 9.260N and longitude 76.780 E. The junction is an intersectionoffourroads;Pathanamthitta Pandalamroad, ring road, Thiruvalla Kozhencherry road, post office road.
Here a traffic light signal system is existing, but it causes frequent stopping and starting of vehicles. To avoid the frequent stopping and starting of vehicles a continuous flow system should be introduced. The roundabout designedatthisjunction.
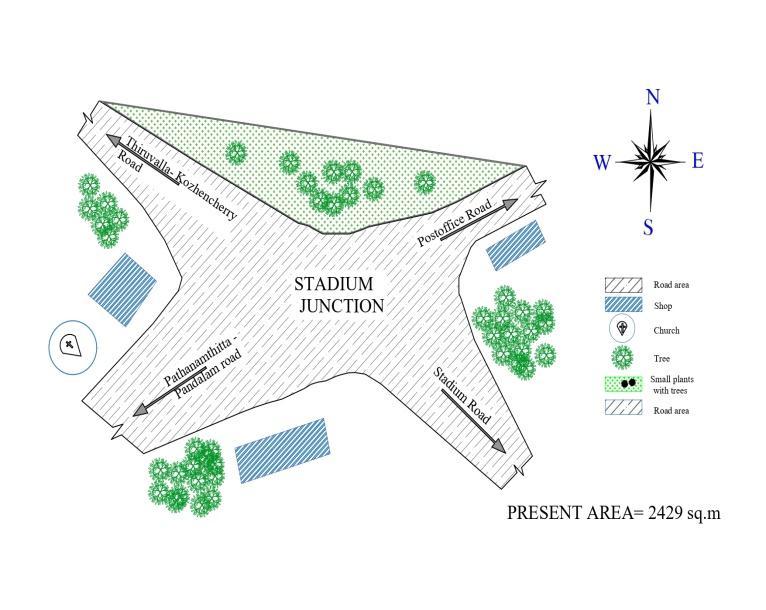
Fig 1:Presentlocationsketch
Fig 2 :MapofStadiumjunction,Pathanamthitta,Kerala, India(GoogleMap)
International Research Journal of Engineering and Technology (IRJET) e ISSN: 2395 0056
Volume: 09 Issue: 06 | Jun 2022 www.irjet.net p ISSN: 2395 0072
Toconducttrafficvolumestudyatthejunction
To determine the hourly volume of traffic in termsofequivalentpassengercarunits
To determine the vehicular composition of the stream
TodesignaroundaboutasperIRCguidelines
Table 2 TrafficvolumecountofPathanamthitta Pandalamroad
TIME CAR /JEE P
2 WHEEL ER
3 WHEEL ER
BUS LC V TR UC K
PCU/ hr
6:00 7:00 339 539 109 34 37 34 1211
Reduction in traffic congestion at Stadium junction
Reductionoftraveltimetoreachthedestination Reduction in environmental pollution and fuel consumption Reductioninnumberofaccidentsoccurringatthe junctionduetodirectconflict.
TrafficvolumesurveyisconductedatStadiumjunction.To know about the present volume of traffic at the junction. Traffic volume study was conducted for a continuous period of 7 days. Vehicles are classified as per IRC 106:1990 as two wheelers, Auto rickshaw, Car, light commercial vehicle (LCV), Bus and truck. The number of left turning, right turning and straight moving vehicles at each road at the intersection are counted in order to designtheroundabout.
Since the traffic is heterogeneous the number of vehicles areconvertedtoa standard unitcalledpassengercarunit (PCU).The varies PCU factors are shown in the following table
Table 1: PCUfactors
Vehicletype Equivalent PCU factor
Twowheelers 0.5
Passengercar 1.0 Auto rickshaw 1.2
Lightcommercialvehicle 1.4 Truck 2.2 Bus 2.2
Thefollowingtableshowstheaveragetrafficvolumedata of7daysof fourroads.
7:00 8:00 370 601 126 35 40 31 1023 8:00 9:00 604 846 205 34 39 29 1467 9:00 10:00 606 858 222 34 39 32 1502 10:00 11:00 625 846 244 36 42 37 1561 11:00 12:00 466 705 157 36 47 36 1232 12:00 1:00 473 728 166 33 39 37 1245 1:00 2:00 353 673 168 33 44 30 1092 2:00 3:00 544 757 180 32 44 35 1348 3:00 4:00 650 843 204 33 48 35 1534 4:00 5:00 658 896 215 37 52 40 1607 5:00 6:00 666 938 214 34 41 36 1604
TIME CAR /JEE P
2 WHEEL ER
3 WH EEL ER
BUS LC V TRU CK PCU/h r
6:00 7:00 249 301 108 21 23 26 710 7:00 8:00 289 457 109 24 20 26 787 8:00 9:00 337 435 120 24 20 26 830 9:00 10:00 365 576 145 32 20 28 987 10:00 11:00 384 604 162 28 21 23 1022 11:00 12:00 321 512 131 29 22 25 884 12:00 1:00 251 516 130 28 21 32 827 1:00 2:00 343 493 134 27 19 28 898 2:00 3:00 352 546 126 31 18 25 925 3:00 4:00 361 548 143 29 20 29 963 4:00 5:00 368 595 160 27 23 24 1002 5:00 6:00 366 540 155 29 22 24 970
International Research Journal of Engineering and Technology (IRJET)
e ISSN: 2395 0056
Table 4 TrafficvolumecountofThiruvalla Kozhencherry road
TIME CAR /JEE P
2 WHEEL ER
3 WHEEL ER
BU S LC V TRU CK PCU/ hr
6:00 7:00 373 373 89 19 21 22 686 7:00 8:00 304 416 99 21 23 27 769 8:00 9:00 332 453 122 25 24 24 847 9:00 10:00 333 483 127 26 25 26 877 10:00 11:00 318 462 129 27 20 23 842 11:00 12:00 310 441 107 23 23 25 797 12:00 1:00 301 431 107 27 20 25 788 1:00 2:00 318 420 111 27 26 27 817 2:00 3:00 315 459 124 26 22 25 837 3:00 4:00 337 482 125 32 23 29 895 4:00 5:00 360 496 125 31 20 24 907 5:00 6:00 360 511 137 33 22 26 941
Table 5 TrafficvolumeofStadium Ringroad
Chart -1
TIME CAR /JEE P
2 WHEEL ER
3 WHEEL ER
Volume: 09 Issue: 06 | Jun 2022 www.irjet.net p ISSN: 2395 0072 © 2022, IRJET | Impact Factor value: 7.529 | ISO 9001:2008 Certified Journal | Page2723
BU S LC V TRU CK PCU/h r 6:00 7:00 204 335 102 31 28 24 655 7:00 8:00 306 427 127 21 22 22 790 8:00 9:00 374 581 127 29 42 42 1035 9:00 10:00 404 652 139 28 49 49 1122 10:00 11:00 431 698 168 32 43 43 1207 11:00 12:00 329 508 130 28 35 35 934 12:00 1:00 307 498 124 29 30 30 868 1:00 2:00 306 458 122 30 29 29 863 2:00 3:00 377 516 133 34 31 31 981 3:00 4:00 433 600 123 30 33 33 1083 4:00 5:00 425 677 135 34 55 55 1181 5:00 6:00 494 630 143 89 44 34 1313
International Research Journal of Engineering and Technology (IRJET) e ISSN: 2395 0056
Volume: 09 Issue: 06 | Jun 2022 www.irjet.net p ISSN: 2395 0072
5.2. Traffic volume data for roundabout design
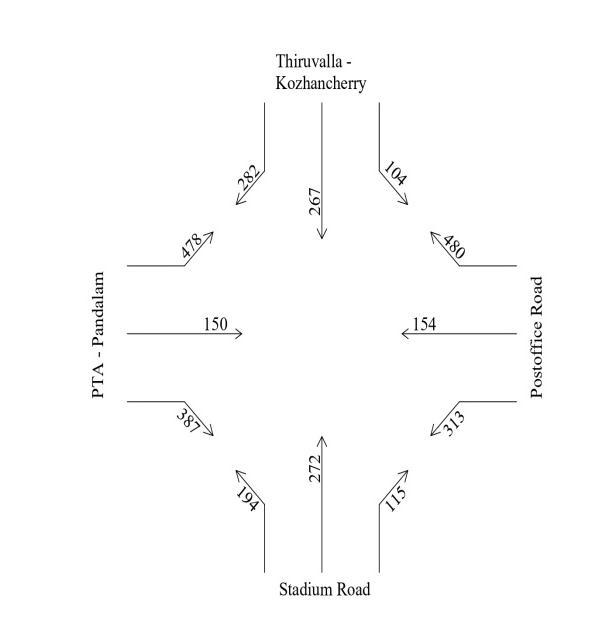
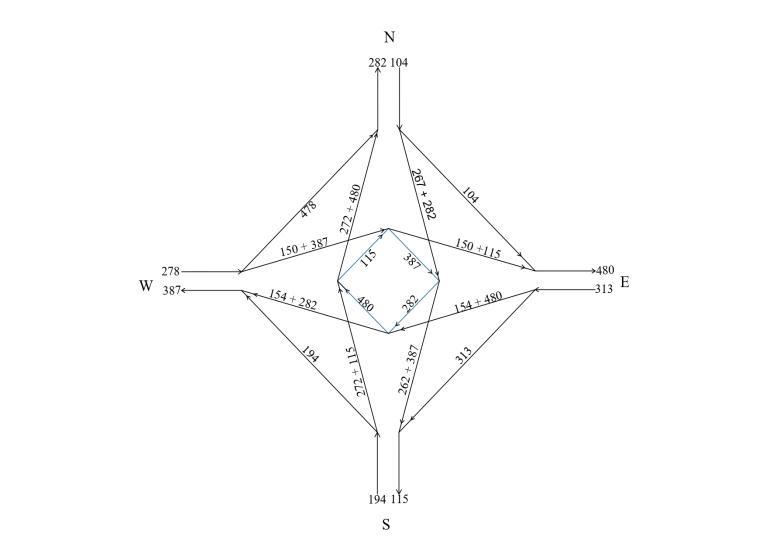
Thenumberofrightturning,leftturningandstraight movingtrafficisshowninthebelowtable.
Table 2: PCU VALUE
Right turning(PCU/hr) Straight (PCU/hr) Leftturning (PCU/hr) 115 272 194 480 154 313 282 267 104 387 150 478
Chart 4:Ringroad
0 200 400 600 800 1000 1200 1400 0 200 400 600 800 1000 1200 1400 1600 1800 PTAPANDALAM ROAD POST OFFICE ROAD KOZHENCHER RY ROAD STADIUM ROAD
Chart -5:Trafficvolumedata
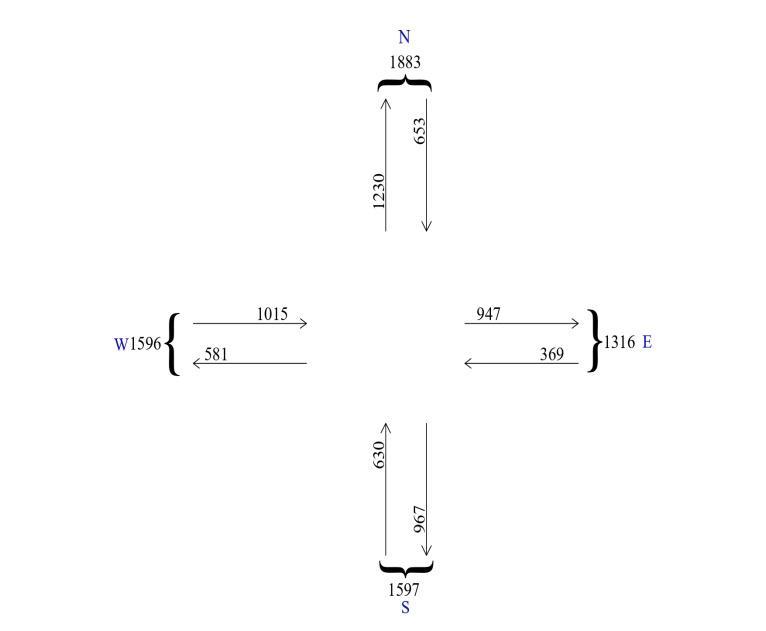
Chart 6:Vehicularcompositionoftraffic
Fig -3:Trafficapproachoftheroundabout
International Research Journal of Engineering and Technology (IRJET) e ISSN: 2395 0056
Volume: 09 Issue: 06 | Jun 2022 www.irjet.net p ISSN: 2395 0072
Totalrightturning traffic=115+480+282+387=1264pcu/hr
Totalleftturning traffic=194+313+104+478=1089pcu/hr
Totalstraightmoving traffic=272+154+267+150=843pcu/hr
In the case of roundabouts, the PCU of a vehicle is the function of vehicular dimensions and speed only. But the PCU value in dynamic nature depends upon the size of roundaboutsalso.
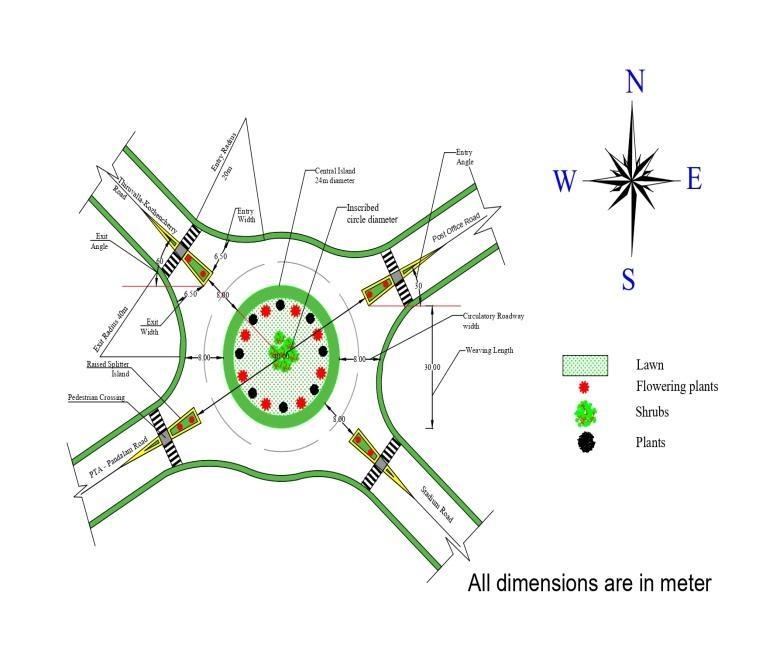
ThedesignofroundaboutisdoneasperguidelinesofIRC 65:2017.
As per IRC 65:2017 the design speed should not be more than30kmpharoundurbanroundabouts.Henceweadopt adesignspeedof30kmph.
Theinscribedcirclediameteris thebasicparameterused to define the size of a roundabout. It is the distance betweenouteredgesofthecirculatorypath.Theinscribed circle diameter for urban single lane roundabout as per IRC is in a range of 28 40mThe inscribed circle diameter adoptedhereis40m.
Thediameterofthecentralislandfor40minscribedcircle diameter as per IRC is 24m. The basic function of the central island is to convert direct conflict points into angularconflictpoints.
Theradiusofentrycurveshouldbebetween20to40mfor 2 lane road. Hence provide an entry curve of 20m. Exit radius should be greater than entry radius. Therefore, Radiusofexitcurve=40m.
Entrywidthis6.5mfor20mradiusentrycurve,asperIRC 65:2017.Theexitwidthof40mradiusexitcurveis6.5m.
As per IRC 65:2017, the entry angle is in a range of 200 600 Hence we provide as entry angle of 600. The entry angleshouldbelargerthanexitangle.
Exitangle=300
6.6.
Circulatorycarriageway istheclockwise pathfollowed by the vehicles to move around the central island. For 40m inscribedcirclediameter,widthofcarriageway=8m
Weavinglengthisthelengthatwhichweavingoccurs.The weaving length of 30 kmph design speed is 30m as per IRC.
Acamberof0.5% 1%canbeprovidedtodrainthesurface runoff away from central island. A camber of 0.5% adopted.
AsperIRC65 1976,thecapacityofroundaboutisgiven by,
Qp=280w(1+e/w)(1 p/3)/(1+w/l)
P=(b+c)/(a+b+c+d)
Thecrossingstreamsa,b,c,dcanbecalculatedfromthe figurebelow,
a=194 b=387 c=436 d=480
Qp=280*8(1+6.5/8)(1 0.55/3)/(1+8/30) =2617.63 =2620pcu/hr
© 2022, IRJET | Impact Factor value: 7.529 | ISO 9001:2008 Certified Journal | Page2725
International Research Journal of Engineering and Technology (IRJET) e ISSN: 2395 0056
Crossing can be compared to a signalized intersection.
From the traffic volume studies conducted at stadium junction Pathanamthitta it is seen that the right turning traffic is more at the junction. Hence roundabout can be adopted to control and guide the traffic flow at the intersection. The design of roundabout is done as per IRC 65:2017.Thegeometricdesignofroundaboutdependson designspeed.
Thedesigncapacityofroundaboutis2620 PCU/hr,which isgreaterthanthepresenttrafficvolume1883PCU/hr.
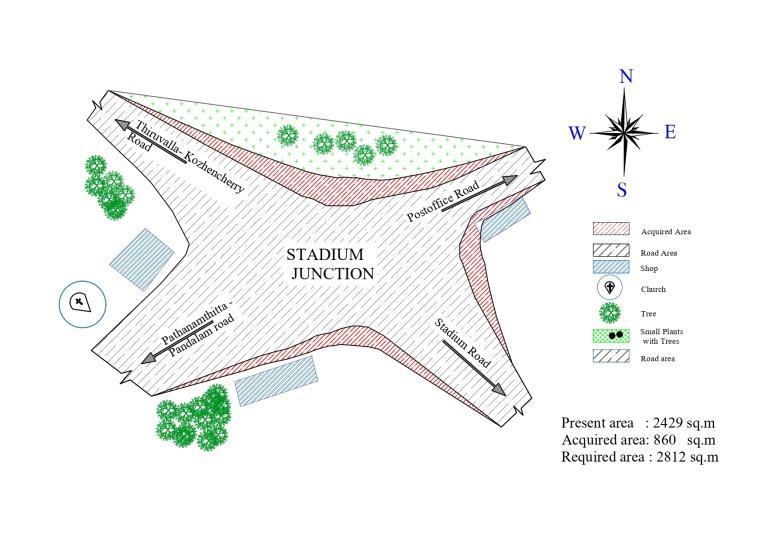
Fig-6: Proposedplanofroundabout
For the design of roundabout, the available carriageway width is not enough. Therefore area acquired for roundaboutdesignisshowninthefigure.
Thefollowingmeasurescanalsobeadoptedtoreducethe trafficcongestion
Developing byroads for reducing the traffic on majorroads.
Provideoff streetparkingfacilitiesforvehicles.
[1] S R Samal, P Gireesh Kumar, J Cyril Santhosh, M Santhakumar “Analysis Of Traffic Congestion Impacts Of UrbanRoadNetworkUnderIndianCondition”(2020)
[2] Maksym Diachuk, Said M Easa “Guidelines For Roundabout Circulatory And Entry Widths Based On VehicleDynamics”(2018)
[3]Peerzada MosirShah,Niharika Gupta “StudyOfTraffic Flow Characteristics On The National Highway(NH1) ConnectingJalandhar Phagwara”(2016)
Fig 6: Planshowingtheareaneededforroundabout
Thefollowingsaretheadvantagesofroundabout,
The direct conflict point at a junction is reduced from32to8.
Potentialrightanglecollisionwillbe convertedto angularcollisions.
Roundaboutspromoteacontinuousflowoftraffic.
Due to continuous flow of traffic, it avoids frequent starting and stopping of vehicles, therebyreduceemissions.
Splitter island refuse ensures the safety of pedestrians.
[4] Krutika M Gamit ,Aney K Patel,Ankit S Vasava, Viral N Patel, Rutvij J Maheta ,Rajan J Lad “Traffic Congestion OvercomeByRotaryDesign”(2019)
[5]Himanshu Bharadwaj “ Traffic Volume Study Of Sitapura,Jaipur”(2016)
[6] Indian Road Congress , New Delhi “ IRC 65:1976 RecommendedPracticeForTrafficRotaries”
[7] Indian Road Congress , New Delhi, “ IRC 65:2017 GuidelinesForPlanningAndDesignOfRoundabouts”
[8] Prof. Baswakumar Biradar “Traffic Volume Count And AnalysisForMadiwalJunction,Bidar(2019)
[9] Indian Road Congress , New Delhi, “IRC 106:1990, GuidelinesForCapacityOfUrbanRoads”
Volume: 09 Issue: 06 | Jun 2022 www.irjet.net p ISSN: 2395 0072 © 2022, IRJET | Impact Factor value: 7.529 | ISO 9001:2008 Certified Journal | Page2726