
International Research Journal of Engineering and Technology (IRJET) e-ISSN: 2395-0056
Volume: 12 Issue: 01 | Jan 2025 www.irjet.net p-ISSN: 2395-0072

International Research Journal of Engineering and Technology (IRJET) e-ISSN: 2395-0056
Volume: 12 Issue: 01 | Jan 2025 www.irjet.net p-ISSN: 2395-0072
Thoufeeq Ahmed
1
1Civil Engineer, Mahbubnagar District, Telangana State, India
Abstract - This study evaluates the embodied carbon emissions associated with residential construction in India, focusing on a single-story reinforced cement concrete (RCC) buildinginMahbubnagarDistrict,Telangana.UsingtheWhole Life Carbon Assessment (WLCA) framework developed by the Royal Institution of Chartered Surveyors (RICS), the study examines emissions across key life cycle stages- material productionstage(A1-A3),materialtransportationstage(A4), and construction stage (A5) for four primary building materials: cement (OPC), steel Fe 550D, aggregates (Fine & Coarse), and Solid Red bricks. Results reveal that the production stage (A1-A3) contributes the majority of emissions, followed by the transportation stage (A4) and construction stage (A5). Cement (OPC) is the largest contributor, accounting for 40.21% of total emissions. This study highlights the critical need for sustainable material sourcing and efficient construction practices to mitigate the environmental impact of India's rapidly growing housing sector. The findings serve as a basis for developing strategies to achieve low-carbon residential buildings.
Key Words: Embodied Carbon Emissions, Residential Construction, Reinforced Cement Concrete (RCC), Whole Life Carbon Assessment (WLCA), Royal Institution of Chartered Surveyors(RICS), Life Cycle Stages,MaterialProduction(A1A3), Material Transportation (A4), Construction Stage (A5), Cement (OPC), Steel Fe 550D, Aggregates, Solid Red Bricks, Sustainable Material Sourcing, Low-Carbon Buildings.
GHG Emissions
Anygasesthatcontributetothegreenhouseeffectthat causesglobalwarming.Theprimarygreenhousegasesinthe Earth's atmosphere are: carbon dioxide (CO₂), methane (CH4),nitrousoxide(NO2),ozone(O3),chlorofluorocarbons (CFCs),andwatervapor(H₂O)[1].
According to India's Biennial Update Report (BUR 3)2021, the iron and steel sector (1A2a), CO₂ contributed to 5%,whilethecementproduction(2A1),CO₂accountedfor 4% and electricity production (1A1a) CO₂ was the single largestsourceinthiscategory,accountingforabout40%of the national total GHG emissions in 2016 [2]. The other sectors, together contributed about 10% to energy sector emissionswithapproximately60%sharecomingfromthe residential sector (1A4b) CO₂ [2]. The manufacturing
industriesandconstructiontogetheremitted18.68%oftotal emissionsfromtheenergysector,whichaccountedforabout 75%ofthetotalGHGemissionsfortheyear2016[2].Refer Fig:1.
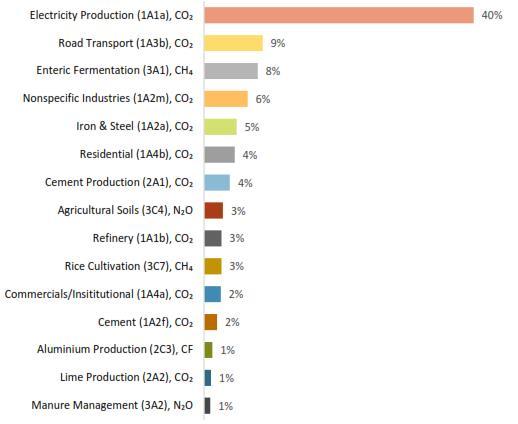
Fig-1: Greenhousegasemissionsbycategory,GgCO2e, 2016.SOURCE:[2]
Carbon Emissions during the Life Cycle of Buildings:
Carbon is generally classified into three categoriesEmbodied carbon, Operational carbon, and End-of-life carbon.
• Embodied carbon is the result of the supply chain (transport), extraction, processing, and manufacturing of building materials, before construction and during constructionorrenovationactivities.
• Operational carbon is from the use of energy, materials, and the generation of waste during building operationsandrenovations.
• End-of-life carbon shall also be considered which is pertinentduringthedemolitionofbuildingsandrecyclingof materials&technologies(resourcecircularity)[3].
International Research Journal of Engineering and Technology (IRJET) e-ISSN: 2395-0056
Volume: 12 Issue: 01 | Jan 2025 www.irjet.net p-ISSN: 2395-0072
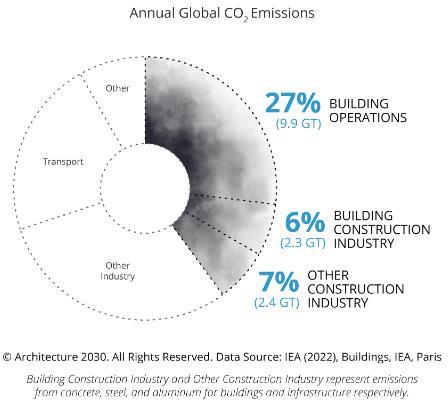
Embodied emissions represent the carbon emissions associated with building and infrastructure products and construction,fromrawmaterialextractiontomanufacturing, transportation, and end-of-life disposal or recycling. Embodied emissions represent a significant amount of annual global emissions [4]. Annually, embodied from the built environment (buildings, landscapes, and infrastructure) are responsible for 15% of global GHG emissionsand35%ofglobal builtenvironment emissions [4]. It is anticipated that embodied emissions will be responsibleforthemajorityoftheemissionsassociatedwith globalnewbuildingsandinfrastructurebetweennowand 2030[4]. The built environmentgenerates40%ofannual global CO₂ emissions. Of those total emissions, building operationsareresponsiblefor27%annually,whilebuilding and infrastructure materials and construction (typically referred to as embodied carbon) are responsible for an additional13%annually[5].ReferFig:2.
As the housing sector in India is experiencing rapid growth, it's also leading to a corresponding increase in carbonfootprint.Whilemegaconstructionprojectssuchas airports,metrorailways,andtunnelingprojectscontribute significantlytocarbon emissions.Residential buildings on theotherhand,collectivelyproducesubstantialamountsof carbonemissionsthroughoutthebuilding'slifecyclestages, namely, the Product stage (A1-A3), Construction process stage(A4&A5),Usestage(B1-B5)andEndofLifestage(C1C4)[6].ReferFig:3.
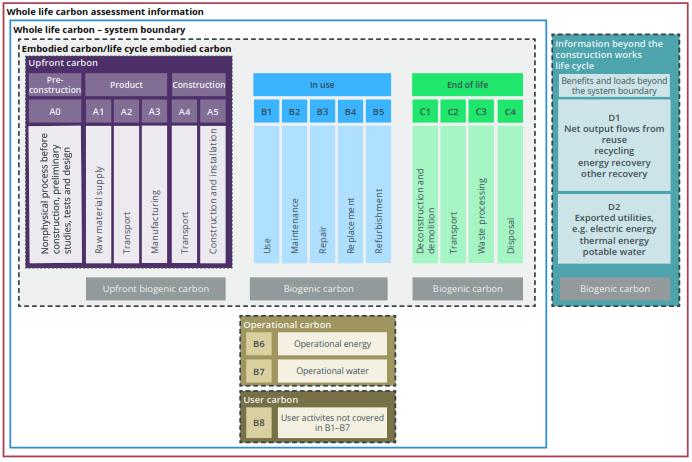
Fig-3: Buildingandinfrastructurelifecyclestagesand informationmodules(adaptedfromEN15978,EN17472 andEN15643,withadditionstoillustratebiogenic carbon);Source:RICSWLCA-2ndEdition[6].
InIndia,asignificantportionofthepopulationbelongsto the middle-class bracket. Within this demographic, the expectations for residential construction among average middle-incomehouseholdsprioritizemaximizingavailable space, minimizing construction expenses, procuring standard-qualitymaterialsataffordableprices,andensuring structuraldurabilitywithoutcompromise.However,thereis limited awareness regarding the substantial carbon emissions associated with various stages of a building's lifecycle.Unfortunately,thisaspecthasreceivedverylittle attention thus far. To address this knowledge gap and increase awareness, this study adopts a framework published bytheRoyal Institution ofChartered Surveyors (RICS) to assess the CO₂ emission (Embodied Carbon) of buildingfor4keymaterials-cement,steel,aggregates(fine and coarse) and solid red bricks from product stage to constructionprocessstageofthebuilding.
In this study, A WLCA framework is adopted to assess the embodiedcarbonofbuildingkeymaterials–cement(OPC), reinforcement steel bars, aggregates (Fine & Coarse), and SolidRedbricksforasingle-storyRCCresidentialbuilding locatedinTownregionofMahbubnagarDistrict,Telangana State,India.Thequantityofthesematerialswasderivedfrom theavailabletechnicaldrawingsofthebuilding.
International Research Journal of Engineering and Technology (IRJET) e-ISSN: 2395-0056
Volume: 12 Issue: 01 | Jan 2025 www.irjet.net p-ISSN: 2395-0072
Table -1: QuantityofBuildingMaterials
S.No
1
2
3
5
The assessment is carried out for Life Cycle Stage A, from module A1 (product stage) – to module A5 (construction stage).ModuleA0(pre-constructionstage)isneglectedasit covers non-physical pre-construction activities, such as surveysandactivitiesassociatedwiththedesignoftheasset. Thesecanbeasignificanteconomiccost,butbuildingsdonot normallyhaveasignificantenvironmentalimpact.ModuleA0 isthereforegenerallyassumedtobenegligibleforbuildings [6].ReferFig:3.
Theproductstagedealswiththecarbonimpactsattributable tocradle-to-gateprocesses(A1-A3):rawmaterialextraction andsupply(A1),transport(A2),andmanufacturing(A3)[6].
Theassessmentofcarbonemissionsstemmingfromcarbon compounds within raw materials and their extraction involves analyzing the material composition. Conversely, determiningemissionsresultingfromthemanufacturingof rawmaterialsnecessitatesacomprehensiveexaminationof themanufacturingandprocessingprocessesleadingtothe finalproductleavingthemanufacturer'ssite.Thethirdtype ofembodiedcarbon,arisingfrommachinerydepreciation,is frequentlyoverlooked.
Nevertheless,theembodiedcarboncoefficientsofmaterials exhibit considerable variation, contingent upon the manufacturing techniques employed, technological advancements, properties of raw material sources, and availabletransportationmethods,amongotherfactors.
Thecarbonimpactsattributabletotheproductstageofthe itemsincludedintheWLCAmustbecalculatedbyassigning suitableembodiedcarbonfactorstotheelementalmaterial quantities[6].
Forinstance,EmbodiedCarbon,fortheproductionstage,A1–A3 = material quantity × material embodied carbon factor/coefficient.TheembodiedcarbonisexpressedinKgCO₂e/Kg.
Forthisstudy,theembodiedcarbonfactors/coefficientswere taken from the IFC-India Construction Materials Database
MethodologyReport[7].InIndia,theconceptofembodied carbonisstillinitsinfancy.Areliabledatabasespecifictothe Indiancontext,containingcarbonemissioncoefficientsfor locally produced and available materials, has yet to be established.
Table-2: EmbodiedCarbonCoefficients-IFC-India ConstructionMaterialsDatabase[7].
No
Therefore,fortheproductionstage,A1–A3,onmultiplying the material quantity with their corresponding embodied carbon factor/coefficient, we have, 84.853 tonnes of EmbodiedCarbonemission.
Table 3: EmbodiedCarbonEmissioninProductionStage (A1-A3)
No
According to Table 3, in the production stage, cement emerges as the primary contributor to embodied carbon emissionsamongvariousbuildingmaterials.Specifically,out of37.5tonnesofcement,34.125tonnesofembodiedcarbon (40.21%)wereemittedduringstagesA1-A3.
International Research Journal of Engineering and Technology (IRJET) e-ISSN: 2395-0056
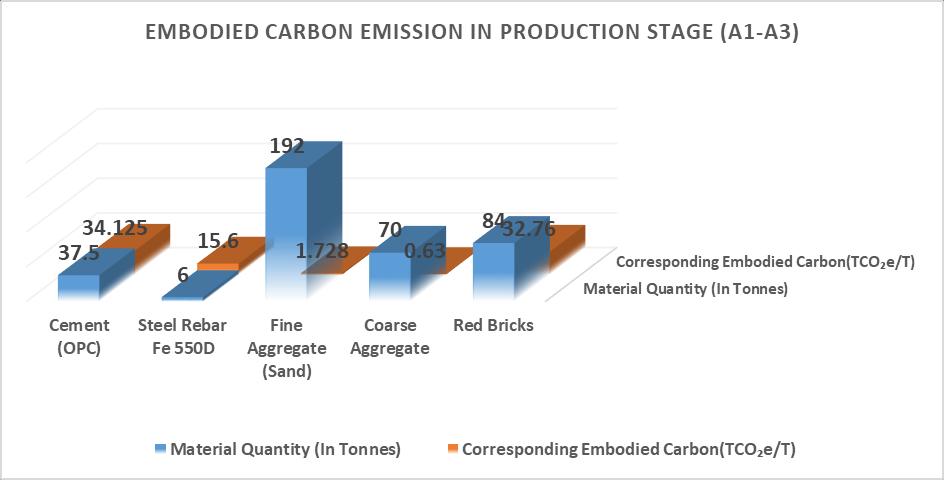
Chart 1: Thetotalembodiedcarbonemissionsduringthe ProductionStage(A1-A3).
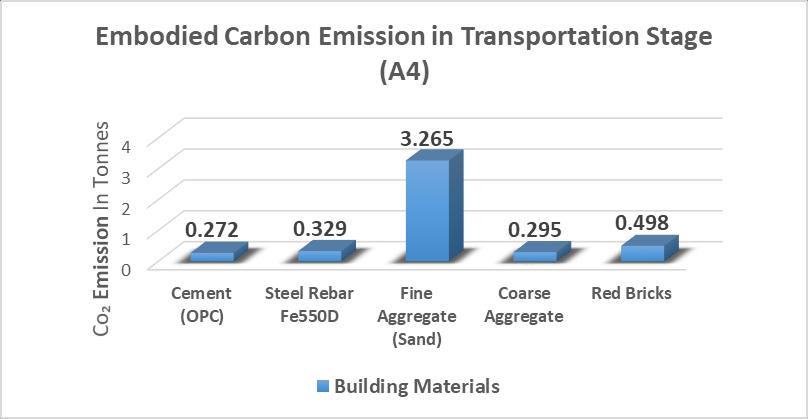
2.2 Transportation Stage (A4)
Thebuildingmaterialsrequiredforbuildingconstructionare transportedfromthemanufacturingandproductionplantto theconstructionsitebydifferentFreightVehicles(Lightand HeavyTrucks).
The average fuel efficiency considered for Medium Duty Vehicles (MDV) is 4.46 KMPL (Diesel) and the Emission factorforpetrol(Diesel)is2.6444Kg-CO₂/litre[8].
Dividingfuelemissionfactorbyfuelefficiency,wehave, 2.6444/4.46=0.5928kg-CO₂/Km
Therefore,MediumDutyVehicle(MDV)Emissionfactor,
iem (kg-CO₂/km)= 0.5928kg-CO₂/km(Diesel).
Similarly,wecanalsocalculateHeavyDutyVehicle(HDV) Emissionfactor,
iem (kg-CO₂/km)=0.7375kg-CO₂/km(Diesel).
Table 4: GHGEmissionsofMDVandHDVperKMasper IndiaGHGProgramdataavailable[8].
S.No VehicleType Kg-CO₂/Km
1 MDV(<12T)
2 HDV(>12T) 0.7375
From the available records of the construction site, the numberoftripsthatoccurredforthebuildingmaterialsto betransportedfromthemanufacturingandproductionplant totheconstructionsitebydifferentfreightvehiclescanbe evaluated.Fromthis,thedistanceofMDVs/HDVstraveledin kilometers and the corresponding CO₂ emission released fromthevehiclescanbecalculated.
Wehave,CO₂emissionreleasedintransportationstage(A4) ofbuildingmaterials,
Σ(nT x iem)
Here,
nT = Number of trips occurred from manufacturing and productionplanttotheconstructionsitebydifferentfreight vehicles.
iem = Emission factor for Heavy Duty Vehicle (HDV) and MediumDutyVehicle(MDV).
Therefore, the embodied carbon of the building materials generatedattheTransportationStagewascomputedtobe 4.661tonnes.
Table 5: EmbodiedCarbonEmissioninTransportation Stage(A4)
Volume: 12 Issue: 01 | Jan 2025 www.irjet.net p-ISSN: 2395-0072 © 2025, IRJET | Impact Factor value: 8.315 |
International Research Journal of Engineering and Technology (IRJET) e-ISSN: 2395-0056
Volume: 12 Issue: 01 | Jan 2025 www.irjet.net p-ISSN: 2395-0072
Theconstructionphaseofthesingle-storyRCCresidential buildingwascompletedin8.5months.Duringthisperiod, thepotentialsourcesofCO₂emissionswereidentified.The primarysourcesofCO₂emissionsduringtheconstruction phasewerefoundtobe:
Consumption of Electricity - Welding Machines, TemporarySiteLighting,PowerTools(Drills,Saws, Grinders), Water Pump, Vibrator (For Concrete Compaction).
Consumption of Fuel (Diesel) –Hand-fedPortable Concrete Mixer, Excavator, Generator (Backup PowerSupply).
Construction sites are a major sector and significant consumers of electricity. The required electricity for this constructionsiteissuppliedbyTGSPDCL(SouthernPower Distribution Company for Telangana Limited) [9]. Carbon emissionsduringtheproductionstageandtheTransmission & Distribution (T&D) stage are taken into account for the calculation.Theelectricityconsumptionforthefirstmonth wasrecordedas790kWh(0.79MWh).Assumingconstant electricityusage,i.e.,790kWhthroughouttheconstruction period, i.e., 8.5 months, and accounting for an 11.46% electricitylossduringthetransportanddistributionstage [10], Therefore, the electricity usage for the total constructionperiod(e.g.,8.5months)canbedeterminedby multiplyingthemonthlyusagebythenumberofmonths:
0.79MWh/month×8.5months=6.715MWh
Accountingfor11.46%ElectricityLoss:
Toaccountforthe11.46%electricitylossduringtransport anddistribution,wecalculatethetotalelectricityrequiredto meetthe6.715MWhofconsumption:
TotalElectricityConsumption, =Consumption/(1-LossFraction)
Substitutingthevalues:
TotalElectricityConsumption, =6.715/(1-0.1146)=7.58MWh.
AccordingtotheCentralElectricityAuthority(CEA)ofIndia -CO₂BaselineDatabasefortheIndianPowerSectorV19,the CO₂emissionfactorsforthenationalgridincludeTelangana as part of the Southern region. As per the latest data availableforthefiscalyear2022-2023,theweightedaverage emission factor for the Indian Grid is 0.823 tonnes of CO₂/megawatt-hour(tCO₂/MWh)[11].
Therefore, the total carbon emissions from electricity consumptionarecalculatedas:
7.58x0.823=6.24tonnesofCO₂
Petrochemical fuelssuchasdiesel, gasoline, andkerosene are used to operate machinery at construction sites. The amount of fuel consumed varies daily, depending on the machines'operatinghoursandfrequencyofuse.
Theaveragemonthlyfuelconsumptionwascalculatedtobe 200 liters of petrol and diesel combined. Most of this fuel was used for operating the Hand-fed Portable Concrete Mixer and excavator, which would be completed within 2 months.
Therefore,thetotalfuelconsumption=200x2=400litres.
Thecarbonemissionsproducedduringtherefiningprocess ofgasolineforpetroleummanufactureamountto0.3140KgCO₂e/literoffuel[12].
The total equivalent carbon emissions resulting from fuel consumptioncanbeexpressedasfollows.
400x0.3140=1.256tonnesofeCO₂
Asaresult,thetotalembodiedcarbonemissionsduringthe constructionstage(A5)
(6.24+1.256)=7.496tonnesofCO₂
International Research Journal of Engineering and Technology (IRJET) e-ISSN: 2395-0056
Volume: 12 Issue: 01 | Jan 2025 www.irjet.net p-ISSN: 2395-0072
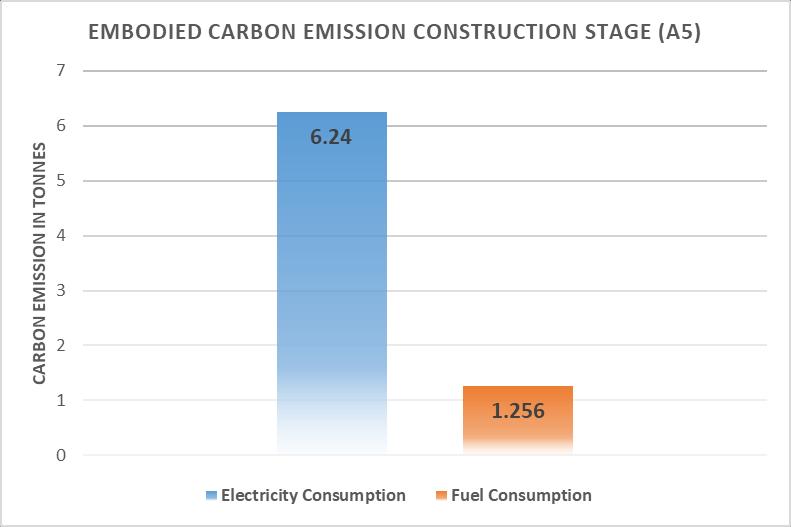
Chart 3: Thetotalembodiedcarbonemissionsduringthe constructionstage(A5)
Total Embodied Carbon of the Building
The total embodied carbon of the building, accounting for thematerialproductionphase(A1-A3),transportationphase (A4),andconstructionphase(A5),iscalculatedas: (84.853+4.661+7.496)=97.01tonnesofCO₂
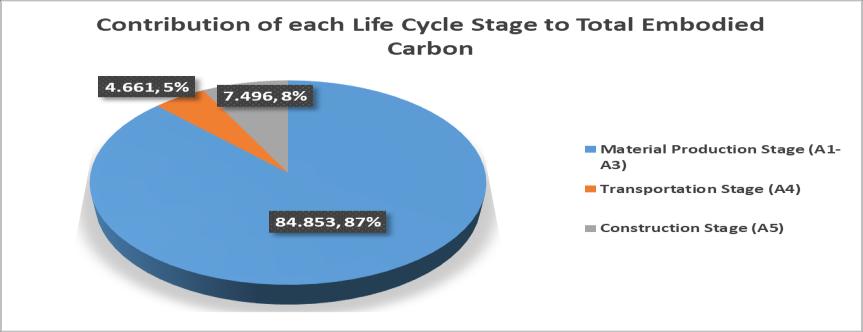
Chart 4: Thecontributionofeachlifecyclestagetototal embodiedcarbon
CONCLUSION
This study underscores the significant role of material production in the carbon footprint of residential construction. Cement dominates carbon emission, highlighting the need for innovations in low-carbon materialsandefficientconstructionmethods.Transportation and construction phases also offer opportunities for emission reductions through optimized logistics and renewable energy integration. Policymakers and stakeholders must prioritize these interventions to align withIndia'ssustainabledevelopmentgoals.
ACKNOWLEDGEMENT
I would like to acknowledge the valuable insights gained from the research paper “Assessment and Reduction of EmbodiedCarboninBuildings”byJeffyGeorge1 andJeevan
Jacob2, published in the International Research Journal of EngineeringandTechnology(IRJET),Volume5,Issue4,April 2018,whichprovidedaframeworkforevaluatingembodied carbonemissionsacrossvariouslifecyclestagesofbuilding construction.
Additionally,IextendmygratitudetotheRoyalInstitutionof CharteredSurveyors(RICS)fortheirpublication,'WholeLife CarbonAssessmentfortheBuiltEnvironment'(2ndedition, September 2023), which offered a comprehensive methodologyusedinthiscasestudy.
[1] GHG emissionshttps://www.epa.gov/ghgemissions/overviewgreenhouse-gases
[2] India Biennial update report (BUR3).https://unfccc.int/sites/default/files/resource/IND IA_%20BUR-3_20.02.2021_High.pdf
[3] IGBC's Guidance Framework for Net Zero Carbon buildings - https://igbc.in/frontendassets/html_pdfs/IGBC's%20Guidance%20Framew ork%20for%20Net%20Zero%20Carbon%20buildin gs.pdf
[4] The Carbon Smart Materials Palette®https://www.materialspalette.org/
[5] Architect 2030 https://www.architecture2030.org/old-why-thebuilt-environment/
[6] RICS Standards and Guidancehttps://www.rics.org/profession-standards/ricsstandards-and-guidance/sectorstandards/building-surveying-standards/wholelife-carbon-assessment-for-the-built-environment
[7] EDGE Buildings - https://edgebuildings.com/wpcontent/uploads/2022/04/IFC-India-ConstructionMaterials-Database-Methodology-Report.pdf
[8] IndiaGHGProgram-http://indiaghgp.org
[9] TGSPDCL-https://tgsouthernpower.org/about
[10] New Indian Expresshttps://www.newindianexpress.com/states/telang ana/2022/Mar/15/td-losses-reduced-to-1146-percent-per-capita-usage-up-energy-minister-jagdishreddy-2430151.html
[11] Central Electricity Authority (CEA)https://cea.nic.in/wpcontent/uploads/baseline/2024/01/User_Guide__V ersion_19.0.pdf
International Research Journal of Engineering and Technology (IRJET) e-ISSN: 2395-0056
Volume: 12 Issue: 01 | Jan 2025 www.irjet.net p-ISSN: 2395-0072
[12] CO₂ emissions for gasoline and dieselhttps://innovationorigins.com/en/producinggasoline-and-diesel-emits-more-co2-than-wethought
© 2025, IRJET | Impact Factor value: 8.315 | ISO 9001:2008 Certified Journal | Page168