
Bitcoin Price Prediction Using LSTM
Abstract Bitcoin is one of the most popularandvaluable cryptocurrency in the current financial market, attracting traders for investment and thereby opening new research opportunities for researchers. Countless research works have been performed on Bitcoin price prediction with different machine learning prediction algorithms. For the research: relevant features are taken from the dataset having strong correlation with Bitcoin prices and random data chunks are then selected to train and test the model. The random data which has been selected for model training, may cause unfitting outcomes thus reducing the price prediction accuracy. Here, a proper method to train a prediction model is being scrutinised. The proposed methodology is then applied to train a simple Long Short Term Memory (LSTM) model to predict the bitcoin price for the upcoming 5 days. When the LSTM model is trained with a suitable data chunk, thus identified, sustainable results are found for the prediction. In the end of this paper, the work culminates with future improvements.
Key Words: Bitcoin, Cryptocurrency, Machine Learning, Price Prediction, LSTM
1. INTRODUCTION
Insteadofanydirecthumaninvestments,generatingprofit with the help of algorithms is a common practice in the stock market. Many case studies have been performed to reach the conclusion that mathematical models warrant better results than humans. Bitcoins are an eye catching initiative in the fields of cryptography, economics, and computer sciences, as such currencies have a special characterwhichisgainedwhenintegratingcurrencyunits with cryptographic technology. Due to the fact that cryptocurrency has a minute history, when compared to thestockmarket,newandunexploredterritoriesarethus beingscouted.Structurally,boththestockmarketandthe cryptocurrency price data are having characteristics such astimeseries data,but high volatilityisroutinelypresent in the latter, with heavy wavering in the prices. A cryptocurrency market differs from a traditional stock market in the respect that the former has a lot of new features. It is required to apply new techniques for prediction suitable for the cryptocurrency market. Fewer studies have been conducted on cryptocurrency price prediction when compared to the stock market. In this
paper, we are predicting the Bitcoin price trend using a Long Short Term Memory (LSTM) model. Our model is aimedtopredictthenextfiveday’spriceofBitcoin.
2. REVIEW OF LITERATURE

Aliterature survey wascarried outtofindvarious papers published in international journals related to various Bitcoinpricepredictionalgorithms,and associatethebest algorithmforthesame.
2.1 Existing Systems
Numnoda et al. [1] have obtained highly accurate results on implementing their prediction Gated Recurrent Unit (GRU) model. However, their prototype has a large time complexity.Thus,complicatingtheexpectedresultsinthis ever changing environment. Additionally, the selected features aren’t enough to predict the Bitcoin prices; as various factors like social media, policies, and laws that eachcountryannounces to deal withdigital currency,can all play a major effect on the fluctuation of the Bitcoin
Manglaprices.
et al. [2] have compared four different price prediction models: Recurrent Neural Networks (RNN), Logistic Regression, Support Vector Machine, and Auto Regressive Integrated Moving Average (ARIMA). Their major findings are that ARIMA performs poorly for predictions extending beyond the next day. Their RNN model can accurately predict price fluctuations for up to six days. And the logistic regression model can give accurateresultsonlyifaseparablehyperplaneexists.
Guo et al. [3] have used a hybrid method consisting of multi scale residual blocks and an LSTM network to predict Bitcoin price. Although, their work does not include comprehensive metrics which measure the investor’s attention to more timely detection of bitcoin market volatility, therefore resulting in a less accurate Awokeprediction.et
al. [4] have considered basic deep learning modelslikeGRUandLSTM. However,theirresearchlacks further investigation to enhance the model accuracy by consideringdifferentparameters.
Ranaetal.[5],whileimplementingahighlyaccurateLSTM model,haveconductedtheirresearchonalargescale,thus makingtheirmethodologyabitcomplex.
3. PROBLEM STATEMENT AND PROJECT SCOPE
3.1 Problem Statement
To develop a model which can help us to predict the price of the crypto currency used (in this case: Bitcoin), with low error rate and a high precision of accuracy. The model will not tell the future, but it might forecast the general trend and the direction to expect the prices to move.
3.2 Project Scope
While using this model, first, the dataset of the crypto currency used needs to be uploaded. This, usually, contains the various features that the prediction model has to depend on. For e.g. average block size, total number of Bitcoins mined, day high & day low (highest and lowest values of different days), number of transactions, trade volume, etc. Then, secondly, the dataset will be applied on the regression model to obtain the predicted price.
What the model proposes to do is that, first the data on Bitcoin Price fluctuations is gathered, of the past couple of years, from the internet. Then, after the process of data acquisition, the database should be organised. The database is divided into various spreadsheet files, which are then uploaded to the software mainly used for data processing. The necessary calculations, like classification and regression, are then done. And finally the results are evaluated in terms of accuracy, error rates involved.
4. DESIGN DETAILS
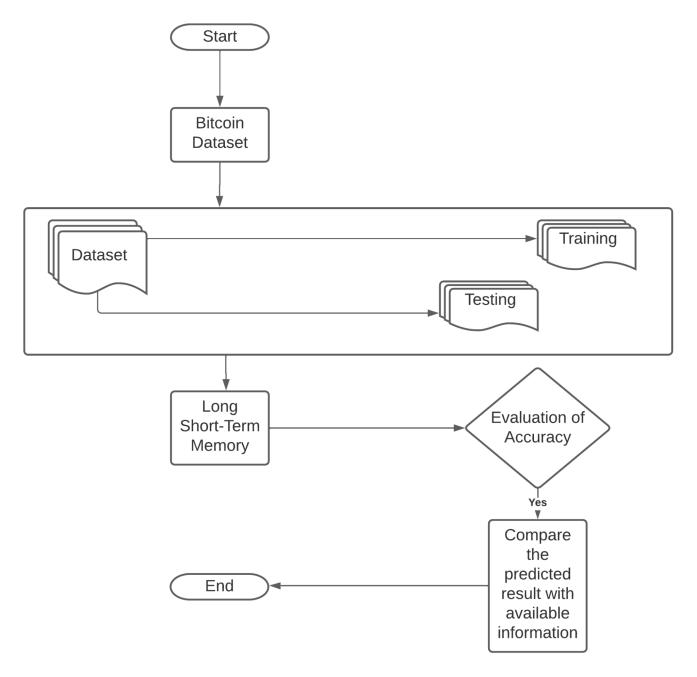
4.1 System Architecture
Firstly, we collect the data set from the online source: Kaggle.ThedatasetrepresentstheBitcoinpriceinUnited States Dollars (USD). The dataset includes all the informationabout bitcoinpricesfrom 27th October,2015 to30thOctober,2021.
Fig 1:BitcoinDataset
The second step involves filtering and cleaning the data set. This involves removing all the incomplete data from the rows. It also involves filtering out unnecessary features present in the data collected. For our model, we willonlyusethecolumnslabelled:Date,Price,Open,High, andLow,asshowninTable1below.
Table 1: FeaturesUsedIntheDataset

Features Used In The Dataset
Sr.No. VariableName VariableDescription DataType
1 Time Dateandtimeof observation Date
2 Volume Sumtotaloftrades takingplace.
3 Open Openingpriceonthe givenday.
4. High Highestpriceonthe givenday.
5. Low Lowestpriceonthe givenday. Number
6. Close Closingpriceonagiven day. Number
The next step is training, followed by testing the dataset. We train our model, using the algorithm and the features taken into account to assist our model, to predict the future price of the crypto currency. Moving on to the testing part, we test the data to measure the accuracy of the algorithm that our model is using to predict the price oftheBitcoin.
Finallyafter the processes oftraining with the help of the data set features and testing, we evaluate the accuracy of our model. We compare the predicted price of the crypto currency, at a given time period with the real world Bitcoinpriceatthatparticularperiodoftime,andevaluate theaccuracyandefficiencyofourmodel. 2

5.1 Lag Plots
Afterthedatasethasbeenfilteredandcleaned,weneedto generate a lag plot of the time series data. A lag in a time seriesdatadefineshowmuchadatapointisfallingbehind intimefromanotherdatapoint.Lagplotsareputintouse to analyse and find out whether the time series data follows any pattern. They are essential for searching patterns like trends, randomness, and seasonality. The plot can be brought about by the representation of time series data in x axis, and the lag of the time series data pointsinthey axis.Weare plottinglagplotsfora minute lag,anhourlylag,dailylag,weeklylag,andamonthlylag. ThelagplotsarerepresentedinFigure3.

Fig 3:LagPlots
We can seethat there isa positive correlation for minute, hour, and daily lag plots. Correlation decreases greatly with weekly lag, with almost no correlation for monthly lag plots. Thus, it makes sense to re sample the data at mostatdailylevel,therebypreservingtheautocorrelation aswell.
5.2 Train Test Split
Now,thenextstepthatisneededtobeperformedistrain test split. For our model, we will be considering sixty numbers of data samples for implementing the testing, andtherestofthere sampleddataasthetrainingsample. We will follow this by plotting a graph of the train test split. Figure 4 represents a simple train test plot of the closingprices.
Fig -4:GraphofTrain TestSplit
5.3 Scaling
Following this, we are going to scale the data, as we need the training and the test set to be scaled. One important pointthatneedstobementionedisthatthescalingshould beperformedafterthetrain testsplithasbeenperformed, becausescalingbeforethetrain testsplitwouldintroduce data leakage from the test set to the training set. Scaling before train testsplit would resultin the training process getting influenced by the test set, thus resulting in a bad predictionfromthemodel.
5.4 Data Generator
Post scaling, we will proceed with making the data generatorfunction,whichwillmakethedatareadyforthe LSTMmodelfeed.Weframeourmodel,usinga“lookback” period to take a window of the last five days of data to predict the data of the current day. A new function is defined, whichwill split the inputsequence into windows of data appropriate for fitting a LSTM model. We need to define a lookback period which tells us how many previous timesteps are used to predict the subsequent timestep.
5.5 Restructuring Input into a shape of 3D Tensor
For LSTM, we have to reshape the input data into the shapeofathreedimensionalTensorofsamples,timesteps, and features. Samples are the amount of data points that we are having. A sample consists of multiple timesteps, whichdefinethewidthoftheslidingwindow.Itshouldbe notedthat timestepsare differentfrom theslidingstep of the sliding window. Thus, timesteps is equivalent to the number of time steps we are to be running our RNN. Finally, features include the amount of features in every timestep.

5.6 Generating the epochs
From the callback module of the keras library we are importing the callbacks: ModelCheckpoint, and EarlyStopping.Thesecallbacksareusedasa bestpractice to save the model at various checkpoints or after each epoch. Also, EarlyStopping is used to stop the training when the best loss is reached, that is, when a monitored metrichasstoppedimproving.

5.7 LSTM Prediction using testX and plotting line graph against actual testY
DuetoscalingdoneearlierwiththehelpofMinMaxScaler, thepredictedscalewillbebetweenzeroandone.Wehave to transfer this scale to the original data scale. Thus, we are going to use inverse transformation to scale back the datatotheoriginalpresentation,asshowninFigure6.
Fig 6:Inversetransformationontestdata
Afterthat,wearegeneratingagraphplotoftheactualtest data (in blue) along with the predicted test data (in red), in Figure 7. Here, we can see that the predicted test data andactualtestdataaremovingintandem.

Fig 5:Codeforthegenerationofepoch
Fig -7:Plotofpredictedtestandactualtestdata
5.8 LSTM Prediction using trainX and plotting line graph against actual trainY
This step is similar to the previous step, except the fact that we are performing inverse transformations on the traindata.

Fig 8:Inversetransformationontraindata
Following that, we will generate the plot for predicted train data (in red) and the actual train data (in blue). In Figure9wecanseethatthegraph forpredictedtrainand actual train are quite synced as they are trained data points.
Fig
5.9 Root Mean Square Error

Finally, we will be generating the root mean square error (RMSE)for both the test and the train data. RMSE is the measure of how well a regression line will fit the data points.
samples,timesteps,andfeatures,sincetheLSTMneedsthe input to be fed into its model. We are using the last five elementsinthethreedimensionaltensor.
Thus, we are looping this process five times, with each iteration generating the predicted price for the upcoming fivedaysconsecutively.
Finally,wearegeneratinga graphoftheentireprediction of the test data (including the future five days) against actual testY, as shown in Figure 12. Up to 30th October, 2021, we book the predicted test data (in red) and the actualtestdata(inblue)ontheground,becausethisisthe time period for which we have the actual ground truth. Beyond the aforementioned date we are having only the forecastedpriceofBitcoin.

Fig -10:RMSEoftestdata

Following this, we also generate the RMSE of train data. The RMSE loss achieved for train data is much lesser compared to the RMSE loss for test data, because the whole training and fit function was run on the training dataset.
Fig 11:RMSEoftraindata
6. RESULTS
Now that we have a trained LSTM model on historical data, we are generating predictions on Bitcoin prices for the future five days. From the dataset that we use for the model, the Bitcoin price on 30th October, 2021 is the last historicalpricethatwearehaving.Thusnow,wearegoing beyond that date to predict the Bitcoin prices on the next five days. It should also be noted that we are again using thelookbackperiodtopredictthefuturepriceofthenext day. Here, the lookback period is set to five days, that is, using the information on the Bitcoin prices of the immediately preceding five days, we are predicting the Bitcoinpriceforthenextday.

Our model is implementing sixty numbers of data points for testing. It should be noted that the testX has been reshaped into a three dimensional array in the form of
7. CONCLUSIONS AND FUTURE WORK
TheLSTMmodel,implementedhere,isa basicmodelthat takesintoconsiderationonlyafewfeaturesthataffectthe Bitcoinprice.Ourmodelisfairlyaccuratewhenpredicting thefutureprices.However,toincreasetheefficiencyofthe model, more Bitcoin price features need to be taken into consideration. We recommendusing Kaggle as the source ofdatasets,sinceinformationpresentinthiswebsiteholds a high degree of authenticity. Our future work would include in depth scrutinisation on the topic of LSTM, and deep learning at large. Such fact findings would be beneficial for forecasting the prices of cryptocurrencies withthehelpofLSTMs,inthefuture.
ACKNOWLEDGEMENT
We take this opportunity to extend our deep and humble gratitude to our project guide: Prof. Hezal Lopes, and project organiser: Prof. Vishakha Shelke, for their continuous support & guidance to help us navigate through our Major Project work. It is on account of their expertise and tremendous knowledge that we have
Fig 12:Plotoftheentiretestdataprediction(including thefivefuturedays)andactualtestYInternational Research Journal of Engineering and Technology
e ISSN:2395 0056
accomplishedtheMajorProjectintheprescribedtime.We would also like to extend our thanks to Dr. Jitendra Saturwar, the Head of the Computer Engineering Department, for his steadfast guidance and support. Additionally, we would also like to extend our thanks to ourPrincipal:Dr.J.B.Patil,andthemanagementfacultyof Universal College of Engineering, Vasai, for providing us with all the necessary facilities and a work friendly environment. We tend to acknowledge with humble appreciation, the support provided by the division employees,libraryandtheresearchlabattendants.
REFERENCES
[1] T.Phaladisailoed,andT.Numnoda,“MachineLearning Models Comparison for Bitcoin Price Prediction,” 10th International Conference on Information Technology and ElectricalEngineering,2018.
[2] Neha Mangla, Akshay Bhat, Ganesh Avarbratha, and Narayana Bhat, “Bitcoin Price Prediction Using Machine Learning,” International Journal of Information and ComputerScience,Volume6,Issue5,May2019.
[3] Q. Guo, S. Lei, Q. Ye, Z. Fang “MRC LSTM: A Hybrid ApproachofMulti scaleResidualCNNandLSTMtoPredict BitcoinPrice,”MDPI,May2021.
[4] T.Awoke,M.Rout,L.Mohanty,S.C.Satapathy,“Bitcoin Price Prediction and Analysis Using Deep Learning Models,”ResearchGate.
[5] A. Rana, R. Kachchhi, J. Baradia, V. Shelke “Stock Market Prediction Using Deep Learning” International Research Journal of Engineering and Technology, Volume 8,Issue4,April2021.
p ISSN:2395 0072 2022, IRJET | Impact Factor value: 7.529 | ISO 9001:2008 Certified Journal | Page 128
Volume: 09 Issue: 04 | Apr 2022 www.irjet.net