International Research Journal of Engineering and Technology (IRJET) e-ISSN:2395-0056

Volume:09Issue: 11 |Nov2022 www.irjet.net p-ISSN:2395-0072

International Research Journal of Engineering and Technology (IRJET) e-ISSN:2395-0056
Volume:09Issue: 11 |Nov2022 www.irjet.net p-ISSN:2395-0072
1Graduate, University Superior Technician, Technological University of Tlaxcala, Tlaxcala, Mexico.
2Graduate, University Superior Technician, Technological University of Tlaxcala, Tlaxcala, Mexico.
3Professor, Department of Industrial Maintenance Engineering, Technological University of Tlaxcala, Tlaxcala, Mexico.
4Professor, Department of Industrial Maintenance Engineering, Technological University of Tlaxcala, Tlaxcala, Mexico.
***
Abstract - Inthisproject,aconveyorbeltwasmadetobe able to carry out an analysis of mechanical vibration frequencies,withwhichadatacomparisonwasmade,since themeasurementswill be madewithdifferent weights on theconveyorbelt,thefirstonewasmadewithaweightof1 Kg,whichistheweightwithwhichthebandnormallyworks, andthesecondmeasurementwasmadewithaweightof4 Kg,whichcausesaneffortfortheband.
In order to carry out the comparison of the frequency analysis,mechanicalvibrationmeasurementequipmentwas used,fromthereweobtaineddatatobeabletocarryoutthe calculations. The other data was obtained from some componentsoftheconveyorbelt,suchasbearingsandthe motor.Inordertocarryoutthisanalysis,weusegraphsand different mathematical formulas to obtain the results and thuscarryoutthecomparison.
The entire procedure of how all the mathematical calculationsweremadeandhowwearrivedattheresultsis shown.Thecalculationsaremadetakingthedataprovided ineachelementmeasured.
Finally, there are all the results that we obtained after performingthecalculations,theseareshowninatablewith thefinalcomparisonandtherearethecomparisonsofthe frequenciesofthebearingsandthemotoroftheconveyor belt that was where they were made measurements and comparedtheresultsofbothweightsontheconveyorbelt.
Key Words: Conveyor belt, geared motor, tape, rolling elements.
Theconveyorbeltisatransportsystemwithanimportant presence in the industry. The operation consists of the movementofdrivedrumsandrollersdistributedalongthe belt, which continuously moves the belt. The belt has the function of moving products or materials from point A to pointB,andensurestheintegrityoftheproducts.
The biggest problem with a conveyor belt is the vibration andnoisegeneratedbytherollingelementsthatshowsome damage.Thevibrationanalysisisappliedtoaconveyorbelt that has a capacity to transport a product of 1 kg, (in this case, it transports 1L water bottles) from which a comparison of the behavior of the rolling elements with differentweightsrangingbetween1and4kgismade.This belt transports the product with the help of a gearmotor, whichrotatesataspeedof70rpm.
The objective of this project is to determine the vibration frequenciesofthebearingsimplementedinaconveyorbelt, such as bearings and other rolling elements, as well as to determinethefundamentalfrequenciesandbeltfrequencies, and thus make a comparison. This comparison will be achieved thanks to the results obtained with the help of vibration measurement equipment. For this, the correspondingcalculationsmustbecarried,bycalculations ofthefrequency;ofdeteriorationoftheoutertrack(BPFO), frequency of deterioration of the inner track (BPFI), frequency of deterioration of the rolling elements (BSF), frequency of deterioration of the cage (FTF), in the same way,thefrequenciesofthebandarecalculated.Thisisdone in order to extend the useful life of each bearing and as result,reduceextramaintenancecosts.
The fundamental element for carrying out the vibration analysiswasvibrationmeasurementequipment,inthesame way,aconveyorbeltwasneededtomakethecorresponding measurementsonitsrollingelements.
Tostartperformingtheanalysis,itisimportanttoconfigure themeasurementequipmentaccordingtotheanalysistobe performed.(Inthiscase,itwasvibrationanalysis).
International Research Journal of Engineering and Technology (IRJET) e-ISSN:2395-0056
Volume:09Issue: 11 |Nov2022 www.irjet.net p-ISSN:2395-0072
adheresstrongly,inthesameway,itmustbeplacedinthe correctpositionsothatitdoesnotmoveandthatdoesnot interferewiththemeasurements.
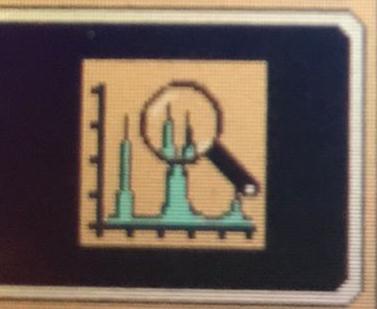
Figure 1. Analysistype:vibrationanalysis.Source:Own.
Oncetheanalysisisselected,wemustknowwhat frequencyisused,whetheritisloworhigh.

Figure 4. Accelerometerposition.Source:Sedisasac
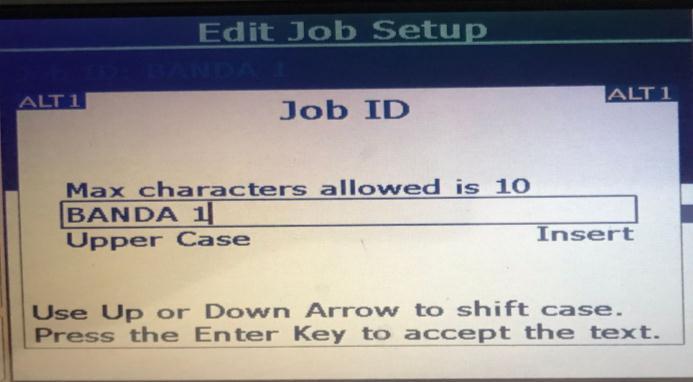
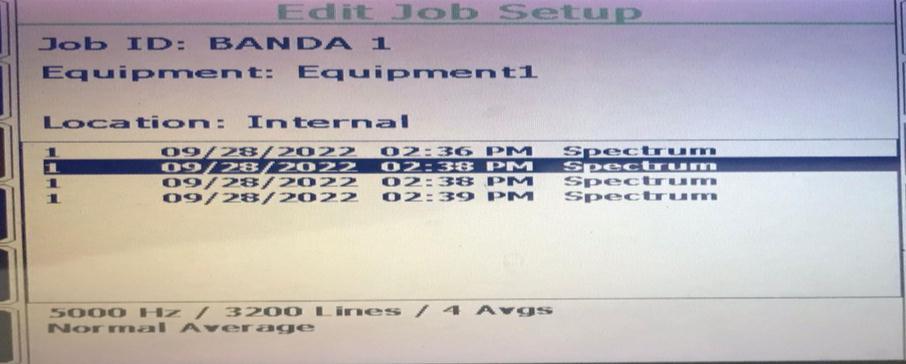
Before starting the analysis with the measurement equipment, we must give a name to our new analysis, rememberthatthismeasurementequipmenthasamemory thatwillsavealltheanalyzescarriedout.
Figure 2. Frequencyselection.Source:Own
It is necessary to locate the points to be measured since thesecanbetangential,axial,andradial.
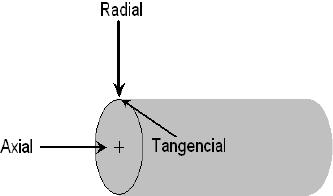
Figure 3. Typesofmeasures.Source:Azmadli
Let's remember that the accelerometer is a magnet, therefore, it must be placed on a metallic area so that it
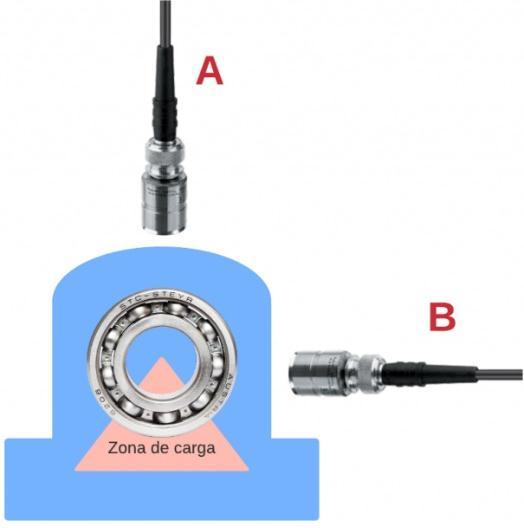
Figure 5.Nameofthejob.Source:Own.
Letusrememberthatwithinthevibrationanalysiswemust make measurements at different points of the machine (conveyorbelt)forwhichwemustmakesuretosaveeach one.
International Research Journal of Engineering and Technology (IRJET) e-ISSN:2395-0056
Volume:09Issue: 11 |Nov2022 www.irjet.net p-ISSN:2395-0072
N=turningspeed(rpm) n=numberofballsorrollers D=meanbearingdiameter(in) d=diameterofballsorrollers(in) Փ=contactangle(rad)
Where: D1=Pulleydiameter1(cm) D2=Pulleydiameter2(cm) C=Distancebetweenpulleys(cm)
Figure 6. Savemeasurements.Source:Own.
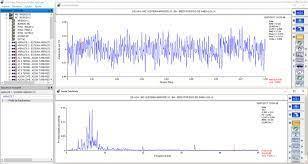
7. Connect to software
Once the analysis is done, it is important to export all the datatosoftwarethatworkstogetherwiththemeasurement equipment,inordertohavethedataandgraphsobtainedon ourPC.
Where: D1=Pulleydiameter1(cm) W= Revolutions LB= bandlength
Operations
Fundamentalfrequency 70/60=1.16Hz
Fanfrequency
Figure 7.Software.Source:Own
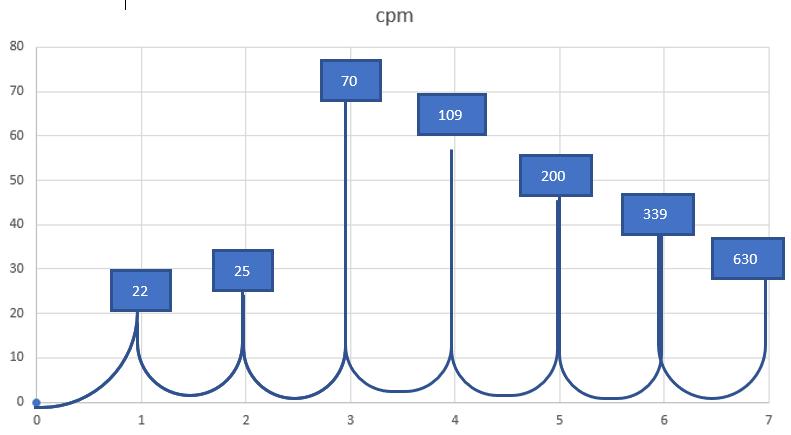
Belowaretheresultsobtainedthroughthecalculationsthat are made to obtain the corresponding comparison and determinetheappropriate useof weight fortheconveyor belt.
Data: revolutions=70rpm Fan=9blades Pulley1=4in Pulley2= 3 in Bearing= UC-201-8 Distancebetweenpulleys= 36.5cm.
Formulas touse:
Where:
Bandfrequency
Graph - 1. Data obtained through calculations.
Bearingfrequencies UC-201-8 n=9 N=1 d=12.7mm=0.5in D=49.3mm=1.94in 35°=0.61rad
Deterioration of the outer track
Frequency of deterioration of the inner track
Frequency of deterioration of the rolling elements
Factor value: 7.529 | ISO 9001:2008 Certified Journal
International Research Journal of Engineering and Technology (IRJET) e-ISSN:2395-0056
Volume:09Issue: 11 |Nov2022 www.irjet.net p-ISSN:2395-0072
Frequency of deterioration of the cage
Graph- 1.Dataobtainedthroughcalculations.
Graph1showstheresultsobtainedthroughthecalculations madebythepreviouslyseenformulas;wemustknowthat thesedataarewithoutaloadontheconveyorbelt.Likewise, thisgraphshowsthevaluesoftheanalysisthatwascarried out, the measured values are represented as the bearings andthefrequenciesofthegearedmotor.
MEASUREMENTS WITH A WEIGHT OF 1KG
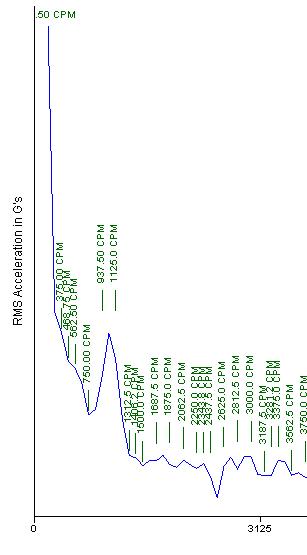
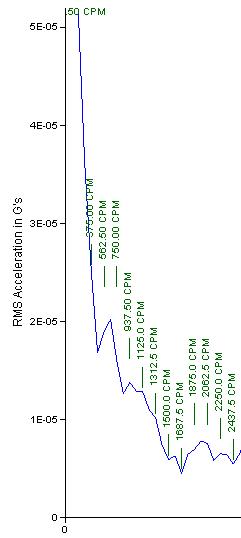
Graph - 2. Medicinesofbearingwithaweightof1kg
value:
Graph2showssomeofthevaluesthatwereobtainedwith the help of the mechanical vibration measurement equipment,valueswhichwill serveus for thecomparison thatwillbemadebelow.
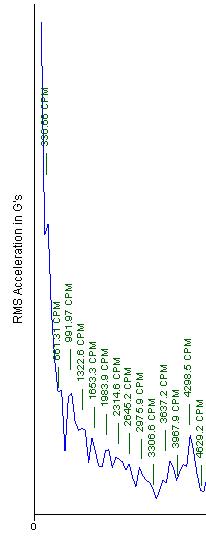
Graph – 3.Measurementsoftherearpartofthegeared motor
Graph3showsthevaluesobtainedinthemeasurements,but thistimefromtherearofthegearedmotor,whereitcanbe seenthattheyaredifferentresults.Similarly,thesedatawill betakenintoaccountforthecomparison.
Wemustrememberthatthemeasurementsaremadeonthe metal parts of the engine, since the accelerometer has a magnetandthushelpstoobtainmoreaccuratedata.
Graph-4.Frontmeasurementofgearedmotor.
International Research Journal of Engineering and Technology (IRJET) e-ISSN:2395-0056
Volume:09Issue: 11 |Nov2022 www.irjet.net p-ISSN:2395-0072
Graph4showsthespectrumobtainingthefrequenciesand thusobservingthebehaviorofthefrequenciesonthefront sideofthegearedmotor.Wecanseefromthegraphabove thatdespitebeingthesamegearedmotor,thevibrationsare different at different points. This can be verified with the comparisonofgraph3andgraph4.
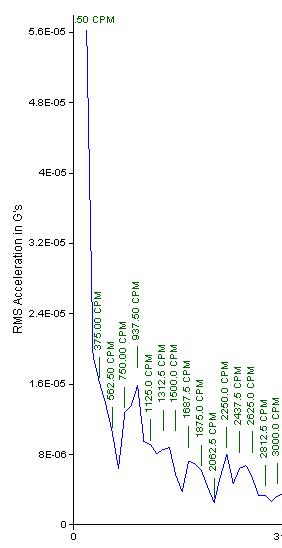
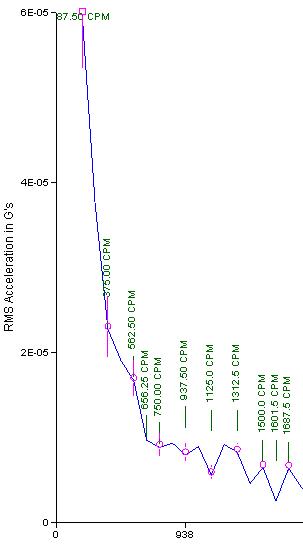
MEASUREMENTS WITH 4 KG OF WEIGHT
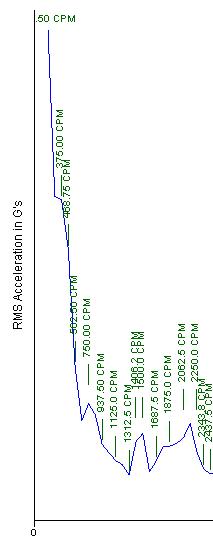
Graph – 5. BearingMeasurements1
Graph5showsthevaluesobtainedwiththeappliedanalysis, in this way you can see the values necessary to make the comparison.
Ingraph6youcanseeadifferencebothinthespectrumand inthevalues,whichhelpsalotwhenmakingthecomparison.
Graph – 6. Rearmeasurementofthegearedmotor.
Graph – 7. Frontmeasurementofgearedmotor
Ingraph7wecanseethatthespectrumcontainsmorepeaks withmorefrequencydata,whichwillbeabletobecompared withthedataofthepreviousgraphs.
Table 1.Comparisontable.
Table 1 shows the results obtained from the vibration analysis,whereadifferencebetweenthevaluesisobserved, thisindicatesthatthereisadifferenteffortwitheachofthe loads. Therefore, there is a greater effort when the belt transportsaproductweighing4kilograms.
International Research Journal of Engineering and Technology (IRJET) e-ISSN:2395-0056
Volume:09Issue: 11 |Nov2022 www.irjet.net p-ISSN:2395-0072
As a result, we identified that in order to have greater durabilityintherollingelements,itisrecommendedtouse thebeltwithaweightof1kilogram.
Whenmakingthecomparisonwiththedataobtainedduring the analysis, it is concluded that a greater effort is caused witha loadof4kg,despite thefactthattheconveyorbelt supportsandmovesthe4kgwithoutanyproblemwiththis analysis we determine that with this load the rolling elementsshowgreaterwear,whichshortenstheirusefullife. However,iftheconveyorbeltmovestheproductwiththe recommendedweight,whichis1kg,movesitwithoutany problem, only that with this weight the rolling elements showlesswear,whichlengthenstheusefullifeoftherolling element.Toexplaintheabovemoreclearly,thevalues630 rpm are taken as an example, which is a measurement without weight on the conveyor belt, 642 rpm is a measurementwithaweightof1kgontheconveyorbelt,and 658isameasurementwithaweightof4kgontheband,for which a greater alteration of the value is observed with a weightof4kgtakingasreferencethemeasurementwithout weightonthetape.Inthisway,itisobservedwhichrolling elementhasgreaterwearwiththedifferentweights.
[1] Sedisa,«Sedisa,»29Julio2020.[Enlínea].Available: https://www.sedisa.com.pe/servicios/blog/estasrealizando-una-correcta-medicion-de-vibraciones/.
[2] Preditec,«Grupoavala,»[Enlínea].Available: http://www.preditec.com/mantenimientopredictivo/analisis-de-vibraciones/.
[3] «Azmadli,»2018.[Enlínea].Available: http://www.azimadli.com/vibmanspanish/glennespanol-toc.htm.
[4] A.Fernandez,«Power-MI,»2022.[Enlínea].
[5] D.reservados,«gestiondelmantenimientocon tecnologiascontroladas,»29Enero2017.[Enlínea].
[6] Barza,«tecnoservicios,»2021.[Enlínea].
[7] d.reservados,«power-MI,»15Abril2022.[Enlínea].
[8] C.Varguez,«Erbessdinstruments,»Agosto2021.[En línea].
[9] d.reservados,«comofuncionaunacelerometro,» 2022.[Enlínea].
[10] P.R Vazquez,«Omega,»2022.[Enlínea].