
International Research Journal of Engineering and Technology (IRJET) e-ISSN: 2395-0056
Volume: 11 Issue: 02 | Feb 2024 www.irjet.net p-ISSN: 2395-0072

International Research Journal of Engineering and Technology (IRJET) e-ISSN: 2395-0056
Volume: 11 Issue: 02 | Feb 2024 www.irjet.net p-ISSN: 2395-0072
Nisha Dhital1
1Agricultural Engineer
Tribhuvan University, Institute of Engineering, Dharan
Abstract - Raisins are valuable and desired food product. The advancement in the field of artificial intelligence has modernized classification process significantly. Raisin classification is important as precise sorting is necessary to maintain quality and for trade purposes. Traditional way of classification using manpower is time consuming and tiring. In this study, machine learning techniques like LR, KNN, DT, RF, SVM and MLP were employed on raisin data consisting seven morphological features of 900 raisin sample, to distinguish two varieties of raisin; Besni and Kecimen. After preprocessing, a cross validation of 10 fold with 80%/20% training and testing split was used to ensure generalization. The classification achieved accuracy of 87.22% with LR, 83.89% with KNN, 82.22% with DT, 86.67 %with RF, SVM, and MLP with the highest being LR with accuracy of 87.22%. Performance of these classifiers underscores the success of study.
Key Words: Raisin, Classification Techniques, Machine Learning, Artificial Intelligence, Evaluation Metrics
Raisins are dried grapes mostly obtained from different cultivars of Vitis vinifera L. and are extensively consumed worldwide (1).A portion of 100 g of raisins has 299 kcal energy, 3.3 g protein, 0.25 g total lipid (fat), 79.3 g carbohydrate, 4.5 g total dietary fiber, 65.2 g total sugars, 62 mg calcium, 1.79 mg iron, 36 mg magnesium, 98 mg phosphorus and 744 mg potassium (2).Because of its low cost and high satiety value, raisin plays a crucial role in humandietsaroundtheworld(3)
In 2022/2023 the total raisin production worldwide was around 1.31 million metric tons (4). The expected raisin production from Turkey and USA for year 2023/2024 is 206,300 MT and 153,000 MT respectively (5). Raisins market size was valued at USD 2.2 Billion in 2022. The raisins market industryisprojected to growfrom USD2.3 Billion in 2023 to USD 3.4 Billion by 2032, exhibiting a compoundannualgrowthrate(CAGR)of4.81%duringthe forecastperiod(2023-2032)(6)
The development of automatic raisin sorting system usingmachinevisionisessentialtoaddressthedrawbacks of manual evaluation, such as high costs, drudgery and reliability issues. This technology can enhance product quality,eliminateinconsistencyandreducedependenceon labour.
Classificationofagriculturalproductiscrucialfortradeand marketability. It helps to maintain quality, plan logistics, plan resource allocation, set fair market value, meet food industry quality standards, and meet consumer preferences. To obtain high-quality end products, agricultural produces must be separated from the substandard ones at the initial stages. Sorting and grading are done to enhance the uniformity and commercial value oftheproducts(7)
Machine learning in agriculture has progressed dramatically over the past two decades, from laboratory curiosity to a practical technology in widespread commercial use. It can be far easier to train a system by showingitexamplesofdesiredinput-outputbehaviorthan to program it manually by anticipating the desired responseforallpossibleinputs(8).
The agricultural system must become more productive in output, efficient in operation, and sustainable for future generations. Artificial intelligence and machine vision are playing a key role in the world of food safety and quality assurance.AImakesitpossibleforcomputerstolearnfrom experience, and perform most human tasks with an enhanced degree of precision and efficiency. It offers sweeping transformation with advanced approaches that will redefine the traditional pattern and limits of agriculture(9)
Traditional methods for raisin grain classification are labor-intensive and prone to errors. Therefore artificial intelligence tools are desired in agricultural industry to develop efficient and automated techniques that can maintain product quality and align well with industry requirements. By using cameras, sensor and image processing, different features like size, morphology and color can be determined. Advanced algorithms applied to
International Research Journal of Engineering and Technology (IRJET) e-ISSN: 2395-0056
Volume: 11 Issue: 02 | Feb 2024 www.irjet.net p-ISSN: 2395-0072
these features can facilitate productivity by sorting accurately.
Theresearchareaofclassificationusingmachinevisionhas gained popularity along with advancements in machine learning.Severalresearchworksarebeingcarriedoutwith thehelpofmachinelearningalgorithms.
Leemans et al.(2002) were able to grade two varieties of apple into four classes on the basis of color parameters, geometricalspecificationsandpresenceofdefectsinthree steps; image acquisition, its segmentation, and classification of fruit (10). Correct classification rate was 78% for Golden Delicious variety and 72% for Jonagold variety. Results showed that healthy fruits were better graded.
A machine vision system by M.A. Shahin and S.I. Symons (2003) was used to identify the type of Canadian lentils (11). Fifteen input variables from seed size measurement combined with color attributes were used to classify five lentilvarietieswithaccuracyof99%.
Omid et al. (2010) combined length parameters, color valuesusingimageprocessingalgorithmandcalculationof center of gravity to grade raisins with overall accuracy of 96%(12)
A raisin sorter was designed and fabricated by M. Abbasgolipour et al. (2010) that graded raisins into two classes. System composed of conveyor belt, lighting box, controlling and processing unit along with sorting unit (13). Raisins were sorted by highly efficient algorithm developed and implemented in Visual Basic 6.0 Environment using suitable Hue, Saturation and Intensity color features andlength features. The overall accuracy of apparatusinsortingraisinswas93.3%.
Researchconducted by Kuo-Yi Huangin 2011usedneural networks and image processing techniques to classify arecanuts.Sixgeometricfeatures,threecolorfeaturesand defect area was used in classification procedure (14) Image processing, detection line algorithms and back propagationneuralnetworkclassifiersortedthequalityof arecanutswithanaccuracyof90.9%.
Mollazade et al. (2012) graded raisins into four different classes using image processing and data mining based classifier (15). 44 features including 36 color and 8 shape factors were extracted. MLP Network with 7-6-4 topology wasbestclassifierwithaccuracyof96.33%.
Sabanci et al. (2016) classified three different varieties of apple using K Nearest Neighbor and Multi Layer Perceptronalgorithms(16).Foursizepropertiesandthree color properties were extracted. MLP with five hidden layerswasbestclassifierwithaccuracyof98.89%.
M.Oliveiraetal.(2020)classified1800cocoabeansamples intofourgradesusingimagefeatures(17).Beanswerecut
lengthwise to expose cotyledon. Color and texture of exposed surface were then analyzed. Image analysis combinedwithrandomforestalgorithmprovidesaccuracy of93%.
900 samples of Kecimen and Besni variety of raisins were classified by I. Cinar et al. (2020) using image processing and artificial intelligence methods (18). Raisins were subjected to pre-processing steps and image processing techniques to extract seven morphological features. Three models were created with Logistic Regression, Support Vector Machine and Multi Layer Perceptron and highest accuracyobtainedwas86.44%withSVM.
I. Cinar and M. Koklu (2021) performed classification operations in 75,000 rice grains of five different varieties using morphological, shape and color features. Images were pre-processed using MATLAB software and 106 features were extracted (19). Different models were created using K Nearest Neighbor, Decision Tree, Logistic Regression, Multi Layer Perceptron and Support Vector Machine. Highest accuracy of 99.91% was obtained with MLP.
Hasanetal.(2021)performedclassificationusingdifferent machine learning techniques and deep neural networks. DBANN2traineddataprovidedhighestaccuracyof93.44% (20)
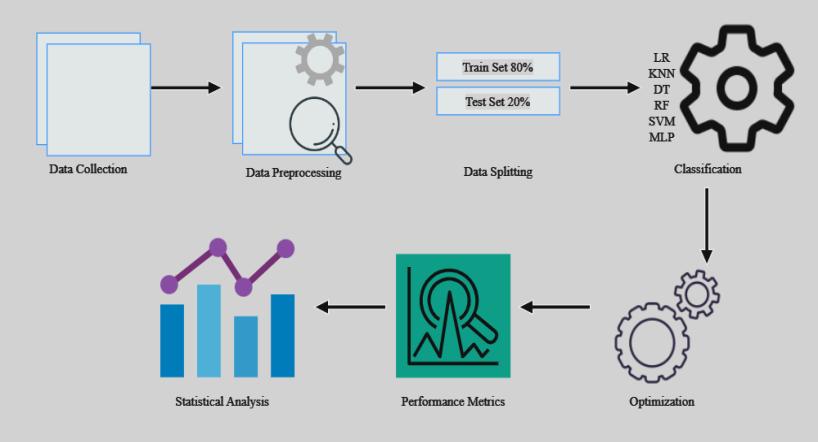
ResearchapproachinvolvedvariousstepsasshowninFig -1. First, data was acquired and pre-processed. Data were scaledandseparatedastestandtrainsets.Thendatawere classified using six different classifiers, optimized using grid search and by trial basis. In the final phase, performance of each classifier was evaluated using evaluationmetrics.
The ‘Raisin’ dataset was collected from University of California, Irvine Machine Learning Repository that was
International Research Journal of Engineering and Technology (IRJET) e-ISSN: 2395-0056
Volume: 11 Issue: 02 | Feb 2024 www.irjet.net p-ISSN: 2395-0072
extracted by I. Cinar et al. (2020) from raisin sample images for raisins classification using machine vision and artificial intelligence methods. The dataset is available at followinglink:
https://archive.ics.uci.edu/dataset/850/raisin
3.2
Thedatasetcontainstwodifferentraisinvarietiesgrownin Turkey. 900 samples of raisin grains were used, including 450samplesfromeachBesniandKecimenvariety.Images of these samples were subjected to image processing techniques and various pre-processing steps to extract 7 morphological features. There was no missing value in dataset. The morphological features and their description aregivenbelow.
Area: Gives the number of pixels within the boundaries of theraisin.
Perimeter:Itmeasurestheenvironmentbycalculatingthe distance between the boundaries of the raisin and the pixelsaroundit.
MajorAxisLength: Gives the length of the main axis, which isthelongestlinethatcanbedrawnontheraisin.
MinorAxisLength:Givesthelengthofthesmall axis,which istheshortestlinethatcanbedrawnontheraisin.
Eccentricity: It gives a measure of the eccentricity of the ellipse,whichhasthesamemomentsasraisins.
ConvexArea: Gives the number of pixels of the smallest convexshelloftheregionformedbytheraisin.
Extent:Givestheratiooftheregionformedbytheraisinto thetotalpixelsintheboundingbox.
Different preprocessing techniques were applied to raisin dataset. Firstly, raisin data was checked for any missing value. There was no missing value. Counts of both classes were same indicating dataset was balanced. Standardization was employed to uniformly distribute features. Furthermore, two classes with categorical value werelabelencodedtogetnumericalvalue.
3.4 Classification
Theclassificationprocessinvolvedutilizationofsixdistinct classifiers, applied to the raisin data. To ensure generalizationofthemodels,a10-foldcross-validationwas used. Optimization and tuning of parameters were carefullycarriedwiththehelpofgridsearchandonatrial basistoenhancethemodel’sperformance.
Raisin data was divided into 80% training set and 20% testing set. A 10 fold cross validation strategy was
employedondataforrobustevaluationandgeneralization of classifier performance. A higher cross validation score indicatesbettergeneralization.
Classification algorithm performance can be evaluated usingconfusionmatrixandroc-aucscore.Confusionmatrix is used to calculate different values such as accuracy, sensitivity,specificity,precisionandf1-score.Thesevalues areessentialtoevaluatehowwellaclassificationalgorithm performs. Confusion matrix helps to distinguish between correctandincorrectclassificationsusingfourparameters TruePositives(tp),TrueNegatives(tn),FalsePositives(fp) andFalseNegatives(fn).
Table -1: ConfusionMatrix
Matrix
Positive PredictedNegative
ActualPositive TruePositive FalseNegative
ActualNegative FalsePositive TrueNegative
The metrics that were used to evaluate classification modelsarelistedbelow:
Accuracy: Accuracy measures the ratio of correct predictionsovertotalpredictions.
Accuracy=(tp+tn)/(tp+fp+tn+fn)
Precision: Precision measures the positive patterns that arecorrectlypredictedfromthetotalpredictedpatternsin apositiveclass.
Precision=tp/(tp+fp)
Recall:Recallmeasuresthetruepositiverate.
Recall=tp/(tp+fn)
F1-Score: F1-Score is the harmonic mean of precision and recall.
F1-Score=2tp/(2tp+fp+fn) (21)
ROC AUC Score: The ROC AUC score is the area under the Receiver Operating Characteristic curve. It is used to evaluate overall performance of classification model. A higherscoreindicatesbetterclassifierperformance.
Logistic Regression (LR) is one of the most statistical and data mining techniques employed by statisticians and researchersfortheanalysisandclassificationofbinaryand proportional response data sets. Some of the main advantages of LR are that it can naturally provide probabilities and extend to multiclass classification problems. Another advantage is that most of the methods
International Research Journal of Engineering and Technology (IRJET) e-ISSN: 2395-0056
Volume: 11 Issue: 02 | Feb 2024 www.irjet.net p-ISSN: 2395-0072
usedinLRmodelanalysisfollowthesameprinciplesused inlinearregression(22).Thereisnoneedtocreatenormal distribution of variables in LR. Because the values envisagedintheLRareprobabilities,LRislimitedto0and 1. This is because LR predicts its probability, not itself, in theresults (19).Itiswell suitedfordescribingandtesting hypothesis about relationships between a categorical outcome and one or more categorical or continuous predictorvariables(23)
It is a non-parametric method used for classification and regression. Given N training samples, KNN algorithm identifies the k-nearest neighbors of an unknown data whoseclassistobeidentified (24).HowevertoapplyKNN weneedtochooseappropriatevaluefork,andthesuccess of classification is very much dependent on this value. Therearemanywaysofchoosingthekvalue,butasimple one is to run the algorithm many times with different k valuesandchoosetheonewiththebestperformance(25). Whendecisionaboutclassofnewdata isneeded,distance between query data and training samples is calculated. Based on the defined value of k, k samples with least distances are selected and the case with more samples inbound is the result (26). In this study, the number of nearestneighborswasselectedas5.
Decision Tree is a graph to represent choices and their resultsinformofa tree.Thenodesinthegraphrepresent aneventorchoiceandtheedgesofthegraphrepresentthe decision rules or conditions. Each tree consists of nodes and branches. Each node represents attributes in a group that is to be classified and each branch represents a value thatthenodecantake(27)
Classification of an instance starts at the root node called the decision node. Based on the value of node, the tree traverses down along the edge. The edge corresponds to the value of the output of feature test. This process continues in the sub-tree headed by the new node at the end of previous edge. Finally, the leaf node signifies the classificationcategoriesorthefinaldecision(24)
DT use an architecture of branching choices, beginning withthemainquestionforaspecificproblemwhichneeds to be answered to solve that problem, later a secondary questionmustbeansweredtocontinuedis-aggregatingthe dataandclassifytheoutcomes(28).Theclassificationrules are derived from the decision tree in the form of –if then else. These rules are used to classify the records with unknownvalueforclasslabel(29)
The decision tree comprises two parts. First, in growing phase, based on recursive process and local optimal criteria, the training set is split until all or most of the outcomes of each partition have the same class label. The
drawback of this method for building a tree is that over fittingmayhappen(30)
A random forest (RF) is an ensemble classifier which consistmanydecisiontreestoclassifynewinstancebythe majorityvote.Generally,theusersetsthenumberoftrees intrialanderrorbasis(31)
Significant improvements in classification accuracy have resulted from growing an ensemble of trees and letting them vote for the most popular class. In order to grow these ensembles, often random vectors are generated that governthegrowthofeachtreeinensemble(32).
RF algorithms have three main hyper parameters, which needtobesetbeforetraining.Theseincludenodesize,the number of trees, and the number of features sampled. Fromthere,RFclassifiercanbeusedtosolveforregression orclassificationproblems(33)
SVM has been employed widely in different classification and regression problems because of its effectiveness in workingwithlinearlynon-separableandhighdimensional datasets(34)
SVM training algorithm builds a model of data points in spacesothatthedatapointsoftheseparatecategoriesare dividedbyacleargapthatisaswideaspossible.Newdata arethenmappedintothatspaceandpredictedtobelongto categorybasedonwhichsideofthegaptheyfallon(35)
Maximizing the margin and thereby creating the largest possible distance between the separating hyper plane and theinstancesoneithersideofithasbeenproventoreduce anupperboundontheexpectedgeneralizationerror(36)
Byusingdifferentkernelfunctions,varyingdegreesofnonlinearity and flexibility can be included in the model (37) In this study, radial basis function (rbf) kernel was used with0.1regularizationparameter(c=0.1).
A Multi Layer Perceptron (MLP) is a feedforward network ofsimpleneuronsthatmapssetsofinputdataontoasetof outputs.ThefundamentalcomponentofMLPistheneuron. In MLP, a pair of neurons is connected in two adjacent layers,usingweightededges. MLPcomprisesatleastthree layers of neurons, including one input layer, one or more hiddenlayers,andoneoutputlayer(38).
On most occasions, the signals are transmitted within the networkinonedirection;frominputtooutput.Thereisno
International Research Journal of Engineering and Technology (IRJET)
Volume: 11 Issue: 02 | Feb 2024 www.irjet.net
loop;theoutputofeachneurondoesnotaffecttheneuron itself(39)
The number of input neurons depends on the dimensions of the input features. The number of output neurons is determined by the number of classes. The number of hidden layers and the number of neurons in each hidden layer depend on the type of problem being solved. Fewer neurons result in inefficient learning and a larger number of neurons result in inefficient generalization. MLP uses a supervised learning technique called backpropagation for trainingthenetwork(38)
First, the network is trained on a set of paired data to determine input-output mapping. The weights of connections between neurons are then fixed and the network is used to determine the classifications of a new setofdata(36).
The alteration of the standard linear perceptron, MLP is capable of distinguishing data which are not linearly separable(16).MLPparametersusedinstudyaregivenin Table2.
Table -2: ParametersusedinMLP
Table -4: EvaluationMetricsofAllClassifier
The bar graph showing accuracy of all six classifiers is giveninFigure1.
HiddenLayers 1with7neurons
Solver adam
Maxiterations 1000
After applying different machine learning algorithms, differentevaluationmetricswereused.Confusionmatrixof all classifiers was observed which is provided in Table 3. Precision, recall and F1 score were collected using classification report. Accuracy, precision, recall, F1 score andROCAUCscorearepresentedinTable4.
Table -3: ConfusionMatrixofAllClassifier
Fig -2:BargraphPlotforClassifiervs.Accuracy
Afterobservingallevaluationmetrics,thehighestaccuracy of 87.22% was achieved was by LR classifier, highest F1 score of 87% and also the highest ROC AUC score of 87.37%.ThecrossvalidationscoreforLRwasobservedto be85.67%.TheaccuracyofKNNclassifierwas83.89%and that of DT being lowest at 82.22%. The accuracy of RF, SVM, and MLP was equal at 86.67% with ROC AUC for RF and SVM being 87.21% while MLP being 86.98%. Looking atthesescoresintabularandgraphicalrepresentation,the highperformingmodelwasLR.
6. Discussion
Considering the sample size, the classifier accuracy achieved was satisfactory. Higher performance can be achieved by increasing database and by addition of color
International Research Journal of Engineering and Technology (IRJET) e-ISSN: 2395-0056
Volume: 11 Issue: 02 | Feb 2024 www.irjet.net p-ISSN: 2395-0072
and shape parameters. With same database, performance canbeimprovedbytuningofhyper-parameters.
This study is limited to use of six classification model, future studies could explore more by using hybrid models and deep neural network. There is scope of study using suitablefeaturesonly.Classificationwithselectivefeatures decreases time and memory requirement leading to efficientdesign.
Although the raisin samples were of Besni and Kecimen varietyfromTurkey,thismodelcouldbeadaptedforother varieties as well with addition of sample data from different varieties and different features. This could subsequently help in design of instant and efficient classificationapplication.
7. Conclusion
In this research study, classification of raisin was performed using six distinct machine learning techniques; LR, KNN, DT, RF, SVM, and MLP. Looking at all the data obtained from confusion matrix, classification report and ROC AUC and performance analysis, LR model was best performing classifier with accuracy of 87.22%. And ROC AUC score of 87.37% further emphasizes the algorithms effectivenessindistinguishingtwovarietiesofraisins.
[1] Is Eating Raisins Healthy? Alexandra Olmo-Cunillera, Danilo Escoba-Avello, Andy J. Perez, Maria Marhuenda-Munoz, Rosa M Lamuela-Raventos, Anna Vallverdu-Queralt. 2020, MDPI, p. 1. DOI: 10.3390/nu12010054.
[2] USDA. [Online] https://fdc.nal.usda.gov/fdcapp.html#/food-details/168165/nutrients.
[3] Prediction modeling using deep learning for the classification of grape type dried fruits. Md Nurul Raihen, Sultana Akter. 2023, p.1. DOI: 10.2478/ijmce2024-0001
[4] [Online] https://www.statista.com/statistics/205021/globalraisin-production/.
[5] [Online] https://inc.nutfruit.org/raisins-sultanas-andcurrants-global-statistical-review2/#:~:text=At%20the%20time%20of%20writing,130 %2C000%20MT%20and%20140%2C000%20MT..
[6] [Online] https://www.marketresearchfuture.com/reports/rais ins-market-6793.
[7] Sortingoperationsfortheclassificationofagricultural crops.SouravGarg,VenkatSaicharanKolli,Shivanand S.Shirkole.2022,p.1.(Abstarct).DOI:10.1016/B9780-12-818572-8.00011-5.
[8] Machine learning: Trends. M. I. Jordan, T. M. Mitchell. 2015.
[9] ArtificialIntelligence(AI)inAgriculture.Liu,SimonY. 2020,pp.14-15.DOI:10.1109/MITP.2020.2986121.
[10] On-line Fruit Grading according to their External Quality using Machine Vision. V. Leemans, H. Magein, M.-F.Destain.2002.DOI:10.1006/bioe.2002.0131.
[11] Lentil type identification using machine vision. M. A. Shahin,S.J.Symons.2003
[12] Implementation of an Efficient Image Processing Algorithm for Grading Raisins. M. Omid, M. Abbasgolipour,A.KeyhaniandS.S.Mohtasebi.2010.
[13] Sorting Raisins by Machine Vision System. Mahdi Abbasgolipour, Mahmoud Omid, Alireza Keyhani, Seyed Saeid Mohtasebi. 2010. DOI: 10.5539/mas.v4n2p49.
[14] Detection and classification of areca nuts with machine vision. Huang, Kuo-Yi. 2012. DOI: 10.1016/j.camwa.2011.11.041.
[15] Comparing data mining classifiers for grading raisins based on visual features. Kaveh Mollazade, Mahmoud Omid,ArmanAref.2011.
[16] DifferentAppleVarietiesClassificationUsingkNNand MLP Algorithms. Kadir Sabanci, Muhammed Fahri Ünlerşen. 2016, p. 167. DOI: 10.18201/ijisae.2016Special%20Issue-146967.
[17] Classification of fermented cocoa beans (cut test) usingcomputervision.MarcianoM.Oliveira,BrenoV. Cerqueira, Sylvio Barbon Jr., Douglas F. Barbin. 2021. DOI:10.1016/j.jfca.2020.103771.
[18] lassificationofRaisin rains sing achine ision and rtificialIntelligence ethodsIl a inar, urat Koklu,SakirTasdemir.2020.DOI:10.24432/C5660T.
[19] Identification of Rice Varieties Using Machine Learning Algorithms. Ilkay Cinar, Murat Koklu. p. 10. DOI:10.15832/ankutbd.862482.
[20] A Deep Neural Network for Multi-class Dry Beans Classification. Md. Mahadi Hasan, Muhammad Usama Islam, Muhammad Jafar Sadeq. 2021. DOI: 10.1109/ICCIT54785.2021.9689905.
[21] Dalianas,H.ClinicalTextMining.2018.pp.46-48.DOI: 10.1007/978-3-319-78503-5_6.
[22] Logistic regression in data analysis: An overview. Maalouf, Maher. 2011, p. 1. DOI: 10.1504/IJDATS.2011.041335.
[23] An Introduction to Logistic Regression. Chao-Ying JoannePengg,KukLidaLee,GaryM.Ingersoll.2002,p. 4.DOI:10.1080/00220670209598786.
[24] Machine Learning from Theory to Algorithms: An Overview. Jafar Alzubi, Anand Nayyar, Akshi Kumar. 2018, p. 11. DOI: 10.1088/17426596/1142/1/012012.
[25] KNN Model-Based Approach in Classification. Gongde Guo, Hui Wang, David Bell, Yaxin Bi, Kieran Greer. 2004.
[26] Comparisonoftwoclassifiers;K-nearestneighborand artificialneuralnetwork,forfaultdiagnosisonamain engine journal-bearing. A. Moosavian, H. Ahmadi, A. Tabatabaeefar and M. Khazaee. 2012, pp. 266-267. DOI10.3233/SAV-2012-00742.
[27] Machine Learning Algorithms-A Review. Mahesh, Batta.2019,p.382.DOI:10.21275/ART20203995.
[28] A review of Machine Learning (ML) algorithms used for modeling travel mode choice. Pineda-Jaramillo, Juan D. 2019, p. 5. DOI: 10.15446/dyna.v86n211.79743.
[29] Analysis of Feature Selection with classification: Breast Cancer Datasets. D.Lavanya, Dr.K.Usha Rani.
International Research Journal of Engineering and Technology (IRJET) e-ISSN: 2395-0056
Volume: 11 Issue: 02 | Feb 2024 www.irjet.net p-ISSN: 2395-0072
s.l.: Indian Journal of Computer Science and Engineering(IJCSE),2011,p.758.
[30] ComparativeAnalysisofClassificationApproachesfor BreastCancer.Asfaw,TemesgenAbera.2019,p.13.
[31] How Many Trees in a Random Forest? Thais Mayumi Oshiro, Pedro Santoro Perez, and Jos´e Augusto Baranauskas. s.l.: Springer, Berlin, Heidelberg, 2012, p.155.DOI:10.1007/978-3-642-31537-4_13.
[32] RandomForests.Breiman,Leo.2001,p.2.
[33] IBM. [Online] https://www.ibm.com/topics/randomforest#:~:text=Random%20forest%20is%20a%20co mmonly,both%20classification%20and%20regressio n%20problems..
[34] Assessmentoftheeffectsoftrainingdataselectionon the landslide susceptibility mapping: a comparison between support vector machine (SVM), logistic regression (LR) and artificial neural networks (ANN). Bahareh Kalantar, Biswajeet Pradhan, Seyed Amir Naghibi, Alireza Motevalli. 2017, p. 57. DOI: 10.1080/19475705.2017.1407368.
[35] Data classification using Support vector Machine (SVM), a simplified approach. S Amarappa, Dr. S V Sathyanarayana. International Journal of Electronics andComputerScienceEngineering,p.436.
[36] Supervised Machine Learning: A Review of Classification.Kotsiantis,S.B.2007,p.260.
[37] Logistic regression and artificial neural network classification models: a methodology review. Stephan Dreiseitl, Lucila Ohno-Machado. 2002, p. 353. DOI: 10.1016/S1532-0464(03)00034-0.
[38] Mariette Awad, Rahul Khanna. Efficient Learning Machines.pp.25-26.
[39] Multilayer Perceptron and Neural Networks. MariusConstantin Popescui, Valentina E. Balas, Liliana Perescu-Popescu,NikosMastorakis.2009,p.579.
2024, IRJET | Impact Factor value: 8.226 |