Live Twitter Sentiment Analysis and Interactive Visualizations with PyLDAvis using Streamlit
Sabbineni Lakshmi Gopi Koushik 1 , Chinthapatla Navyasri2 , Gurram Keerthana3 , Chunduru Jahnavi4Abstract - Sentiment analysis, often known as opinion mining, is a technique for determining the emotional tone or attitude indicated in a piece of text, such as a tweet, review, or news story. As Twitter has many influential users, it became an important tool for communication and information exchange on various platforms including politics, business, and entertainment. This paper provides a user-friendly online application for 'sentiment analysis of live Twitter data and interactive visualizations using pyLDAvis' built on Python's VADER module and the Streamlit framework. Our application asks users to enter a topic or phrase of interest and then uses the Twitter API to stream tweets in real-time. We use VADER to do sentiment analysis on incoming tweets and illustrate the results in real-time using various interactive charts and plots. Further, we implement PyLDAvis to do topic modeling on the tweets and display the topics and keywords connected with them. In a dynamic and interactive manner, our application allows users to explore the emotion and themes of Twitter conversations connectedto their areas of interest.
Key Words: Sentiment Analysis, pyLDAvis, Streamlit Framework,Vaderlibrary.

1.INTRODUCTION
Natural Language Processing (NLP) is a rapidly emerging computersciencetopicthathasgrowninsignificanceover the past few years. NLP is focused on teaching machines howtoreadandprocesshumanlanguageinthesameway that humans do. This entails creating algorithms and computer processes capable of analyzing, interpreting, and producing human language data such as text or speech. NLP offers a wide range of practical applications, includingtextclassificationandsentimentanalysis,aswell as machine translation and chatbots. Sentiment analysis, commonly referred to as opinion mining, is an important method for assessing and analyzing sentiment represented in text data. Sentiment analysis uses computer techniques and algorithms to recognize and classifytheemotionaltoneorattitudeindicatedinapiece of text, such as a tweet, review, or news story. Sentiment analysis is a tool that can analyze client feedback and evaluations, helping businesses in understanding the benefits and drawbacks of their products or services. It can also assist customer care personnel in promptly identifyingandresponding tobad feedback orcomplaints
posted by customers on social media. Amongst the most difficult things of sentiment analysis is appropriately recognizing the sentiment expressed in text, particularly trueforambiguoussentencesinwhichthesentimentmay be unclear. Researchers and practitioners in sentiment analysis are always attempting to increase the accuracy and reliability of sentiment analysis approaches by employing modern machine learning algorithms and natural language processing techniques. Irrespective of challenges,sentimentanalysishasgrowninimportancein theageofbigdata.
1.1 Problem in Existing System
The problem with the existing system is limited training data.Tolearnhowtoidentifysentimentintext,sentiment analysis systems rely significantly on training data. However, if the training data is inadequate or polarised, the system may be unable to identify sentiment in new material effectively. Another problem of not having a display of sentiment analysis results is that it can be difficult for users to quickly and readily understand the sentiment of the text. Without a visual representation, consumers may have to go through huge amounts of text ordatatounderstandtheoverallsentiment,whichcanbe time-consuming and ineffective. Patterns and trends in sentiment analysis data may not always be seen from the text alone, but visualization can help. A visualization, for example, may illustrate the frequency of good, negative, and neutral sentiments across time, allowing viewers to observechangesinsentimentovertime.
2. PROPOSED WORK
The proposed work provides an architecture for live Twitter sentiment analysis, which is based on a lexiconbased approach and includes classification issues in realtime. This model is entirely built on querying real-time tweets from the Snscrape and pre-processing them into a corpusofwordsusingaLexicon-basedmethod,wherethe termsarespecified.
3. PROPOSED METHOD
3.1 Data Collection
We must extract the data in order to comprehend emotionsandcarryoutsentimentanalysis.Twitterisused tocollectthedataasaconsequence.Theinformationfrom tweets,comments,andhashtagsonTwitterisextracted.
Tags used to extract the data,
Ourtaskinthisstudyistodealwithdatatagging. Users, tags, and resources are the three entities thattypicallycompriseasocialtaggingsystem.
Label:#,date,User,Tweet

Tags we used to extract the data: #Digitalindia, #DigitalPayments.
Libraries used to extract the data,
UsingtheTwitterAPIorTweepy,Twitterenables us to collect the data of any user. The user's tweetswillbeextractedasthedata.
Snscrape (SNS) is the acronym for social networkingservicescraper.Itretrievesthestuffit hasfoundbyscrapinginformationfromsearches, hashtags,anduserprofiles.
The number of tweets collected is lower while usingtweepytoextractthedata.So,weextracted hashtags, comments, and related posts using snscrape.
3.2 Data Cleaning
The extracted data is inconsistent. Noisy data requires morestorage and makessentimentanalysislessaccurate. Stop words, hashtags, mentions, and non-English words
can all be found in extracted tweets. Therefore, this data mustbecleanedbeforeperformingsentimentanalysisand topicmodeling.
3.2.1 Removing special symbols and emojis.
WeuseRegextoremovecharacterslike#,and@ ascollectedtweetsalsocontainmentions.
Specialcharacterspresentinthedatamakethem unsuitableforsentimentanalysis.

3.2.2 Removing stop words.
Stop words are some English words that are not helpful in sentiment analysis, such as "I," "am," "and" and "an." Instead, they result in more storageandinaccurateanalysis.
Stop words can be eliminated to provide more attentiontomeaningfulwords.
We use nltk (Natural LanguageToolKit)whichis a suite that contains libraries to process the textualdata.
3.2.3 Remove punctuations.
In English, punctuation marks are symbols that provide the sentence additional meaning and are helpful for grammar. For sentiment analysis, however,thesesymbolsareuseless.
'!"#$%&\'()*+,-./:;<=>?@[\\]^_`{|}~' • The above punctuations are removed using string. punctuationlibraryinnltk.
In English, the words ‘Digital’ and ‘digital’ are the same. But, in NLP models, these are treated differently.
Toavoidthisambiguity,weconverttheentirefile intothesamecaseeitherloweroruppercase.
Data[]=Data[].apply(lambdax:x.lower())
3.2.4 Tokenization
In Python, we use the split() function to divide the contents of an array or list. In NLP, we tokenize words similarly by taking into account whitespaces.
We can use either the .split() method or the wordpunkttokenizerlibraryofnltk.
3.2.5 Lemmatization
Lemmatizationistheprocessthatreducesaword to its simple forms. It is used to eliminate additionaltweetnoise.
For Example, the words like loving, and caring after lemmatization becomes love and care respectively.
By lemmatization, we can get the most possible accuratefrequencydistributions.
4. IMPLEMENTATION
4.1 Sentiment Analysis
Now, the data is cleansed from all stop words, and punctuations,and it isin its base form, the data is perfect for sentiment analysis. It gives accurate results as the noise is removed from the data. We used VADER as a modelingapproachforsentimentanalysiswhich isarulebased sentiment analysis tool designed for social media posts. It determines the sentiment of a piece of text by using a lexicon of words and emoticons that have been graded for their valence (positive, negative, or neutral) andintensity.VADERcanalsodetectcontextualcuessuch as capitalization and punctuation, which might influence thesentimentofatext.VADER'sabilitytohandlerejection andsarcasmisoneofitskeyadvantages.Eventhoughthe word "happy" is positive, VADER would correctly detect the sentence "I'm not happy with my new dress" as negative. The VADER lexicon is a collection of words and phrases that have been graded on two dimensions: valenceandintensity.
Valence scores range from -1 (extremely negative) to +1 (extremely positive), with 0 signifyingneutralsentiment.
The intensity score runs from 0 (least intense) to 2.(Mostintense).

4.2 Topic Modeling
The processof removing necessarypropertiesfroma Bag of words is called topic modeling. This is significant becauseNLPtreatseachwordinthecorpusasafeature.
4.2.1 Latent Semantic Analysis (LSA)
By developing a list of concepts that are statistically related to the documents and terms, distributional semantics, a subset of latent semantic analysis (LSA), is used in natural language processing to evaluate the relationships between a set of documents and the terms theycontain.LSAismostlyusedforconceptsearchingand automaticallyclassifyingdocuments.Inordertorepresent thetextdataintermsofthesetopicsorlatentqualities,the latentsemanticanalysismustbeperformed.
4.2.2 Latent Dirichlet Allocation (LDA)
Latent Dirichlet Allocation (LDA) is a topic model type usedtoclassifyadocument’stextintodifferentcategories based on a certain topic. It constructs a topic-perdocument model and a words-per-topic model using Dirichlet distributions as the modeling basis. Following pre-processing operations, the model was trained using (LSA,andLDA),andtheresultswerethenevaluatedusing thecoherencevalue.Theseoutcomesdemonstratethatthe LDAtechniqueperformedbetterthantheLSAtechnique.

4.2.3 PyLDAvis
A useful tool for visualizing topics from a topic model is the PyLDAvis module. Use the pyLDAvis cell in the notebooktoexecutetheinteractivedashboard
4.3 Streamlit Deployment
StreamlitisacommonlyrecognizedPythonframeworkfor creatingengagingonlineapplicationsfordata scienceand machinelearningevents.DeployingaStreamlitapplication entails hosting it on a server and making it accessible through the internet. Streamlit offers a free hosting platform called Streamlit Sharing, which allows you to quickly distribute your Streamlit app. Connecting your GitHubrepositorytoStreamlitSharinganddeliveringyour app with a few clicks makes it simple to deploy your project.
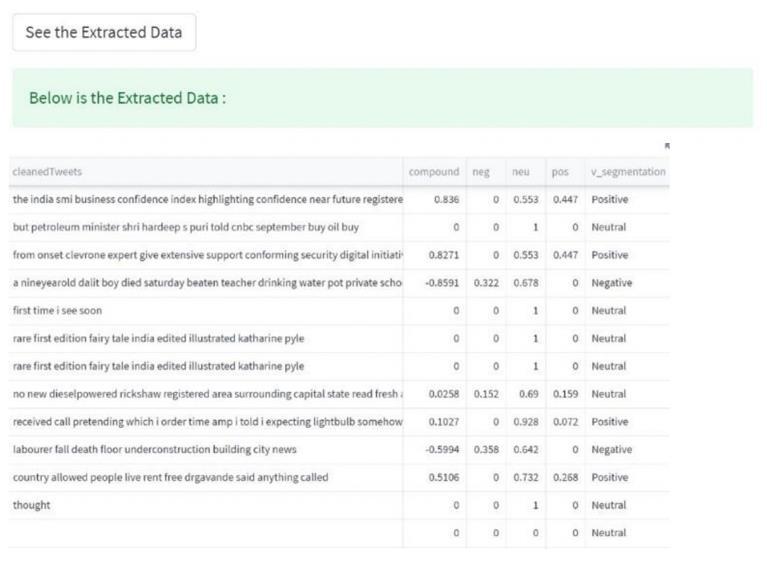
As you can see, the total number of tweets is divided into threecategories:positive,negative,andneutral.Theseare combined to form the public's concluding view on the subject. You may explore the extracted text, word cloud, pie chart, and interactive dashboard by selecting one of theoptionslistedbelow.
The deployed streamlit application receives the input topic/text and tweet count. If no tweet count is specified, the default tweet count is 50. It calculates the sentiment score for a given topic and categorizes it as negative or positive.Italsohasmanualbuttonsforproducingoutputs likewordclouds,piecharts,andinteractivedashboards.


5. RESULTS
Thisisillustratedbythepiechart,forDigitalIndia,where it is noticed that 59.57% of tweets are favorable, 17.02% are negative, and 23.40% are neutral. According to the research, the majority of the population is positive about thisinitiation.

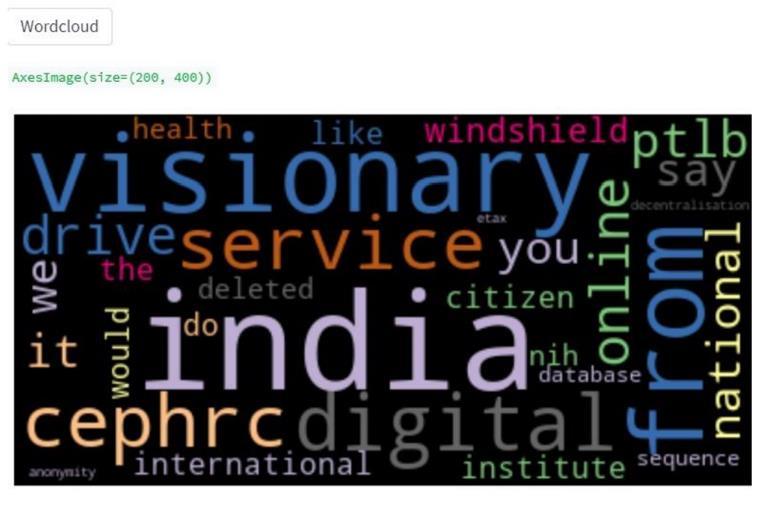
Presenting the word cloud, which represents the most repeated terms in a text, with the size of each word representingitsrelativefrequencyorimportance.
use interface for engaging with data, making it simple to explore and analyze. Overall, Live Twitter Sentiment Analysis and Interactive Visualizations with PyLDAvis Using Streamlit might be a useful resource for organizations and people interested in monitoring and analyzing social media sentiment. This tool can assist by offeringreal-timeinsightsintopublicsentiment.
REFERENCES
[1] Patil, Shilpa and Lokesha, V., Live Twitter Sentiment AnalysisUsingStreamlitFramework(May25,2022).
[2] Elbagir,S.,&Yang,J.[2019,March].Twittersentiment analysis using natural language toolkit and VADER sentiment. In Proceedings of the international multiconference of engineers and computer scientists (Vol.122,p.16).

[3] Jagdale, R. S., Shirsat, V.S., & Deshmukh, S. N. [2016]. SentimentanalysisofeventsfromTwitterusingopensourcetool.IJCSMC,5(4),475-485.
[4] Prabhakar Kaila, D. [2016]. An Empirical Text mining analysis of Fort Mcmurray wildfire disaster twitter communication using topic model. Disaster Advances, 9(7).
[5] Rai, S., S B, G., & Kumar, J. [2020]. Sentiment Analysis of Twitter Data. International Research Journal on AdvancedScienceHub,2,56-61.

InteractivedashboardsprovideRealtimesentimenttrend visualizationandcangiveinsightsintohowsentiment evolvesovertime.
6. CONCLUSIONS
Finally, Live Twitter Sentiment Analysis and Interactive VisualizationswithPyLDAvisUsingStreamlitisapowerful tool for real-time sentiment analysis on social media. The applicationanalysesthesentimentoftweetsusingnatural languageprocessingtechniquesandvisualizesthefindings viainteractivevisualizations.
Users do use PyLDAvis to investigate the subjects addressed in tweets and acquire insights into the most popular themes and attitudes. Streamlit offers an easy-to-

